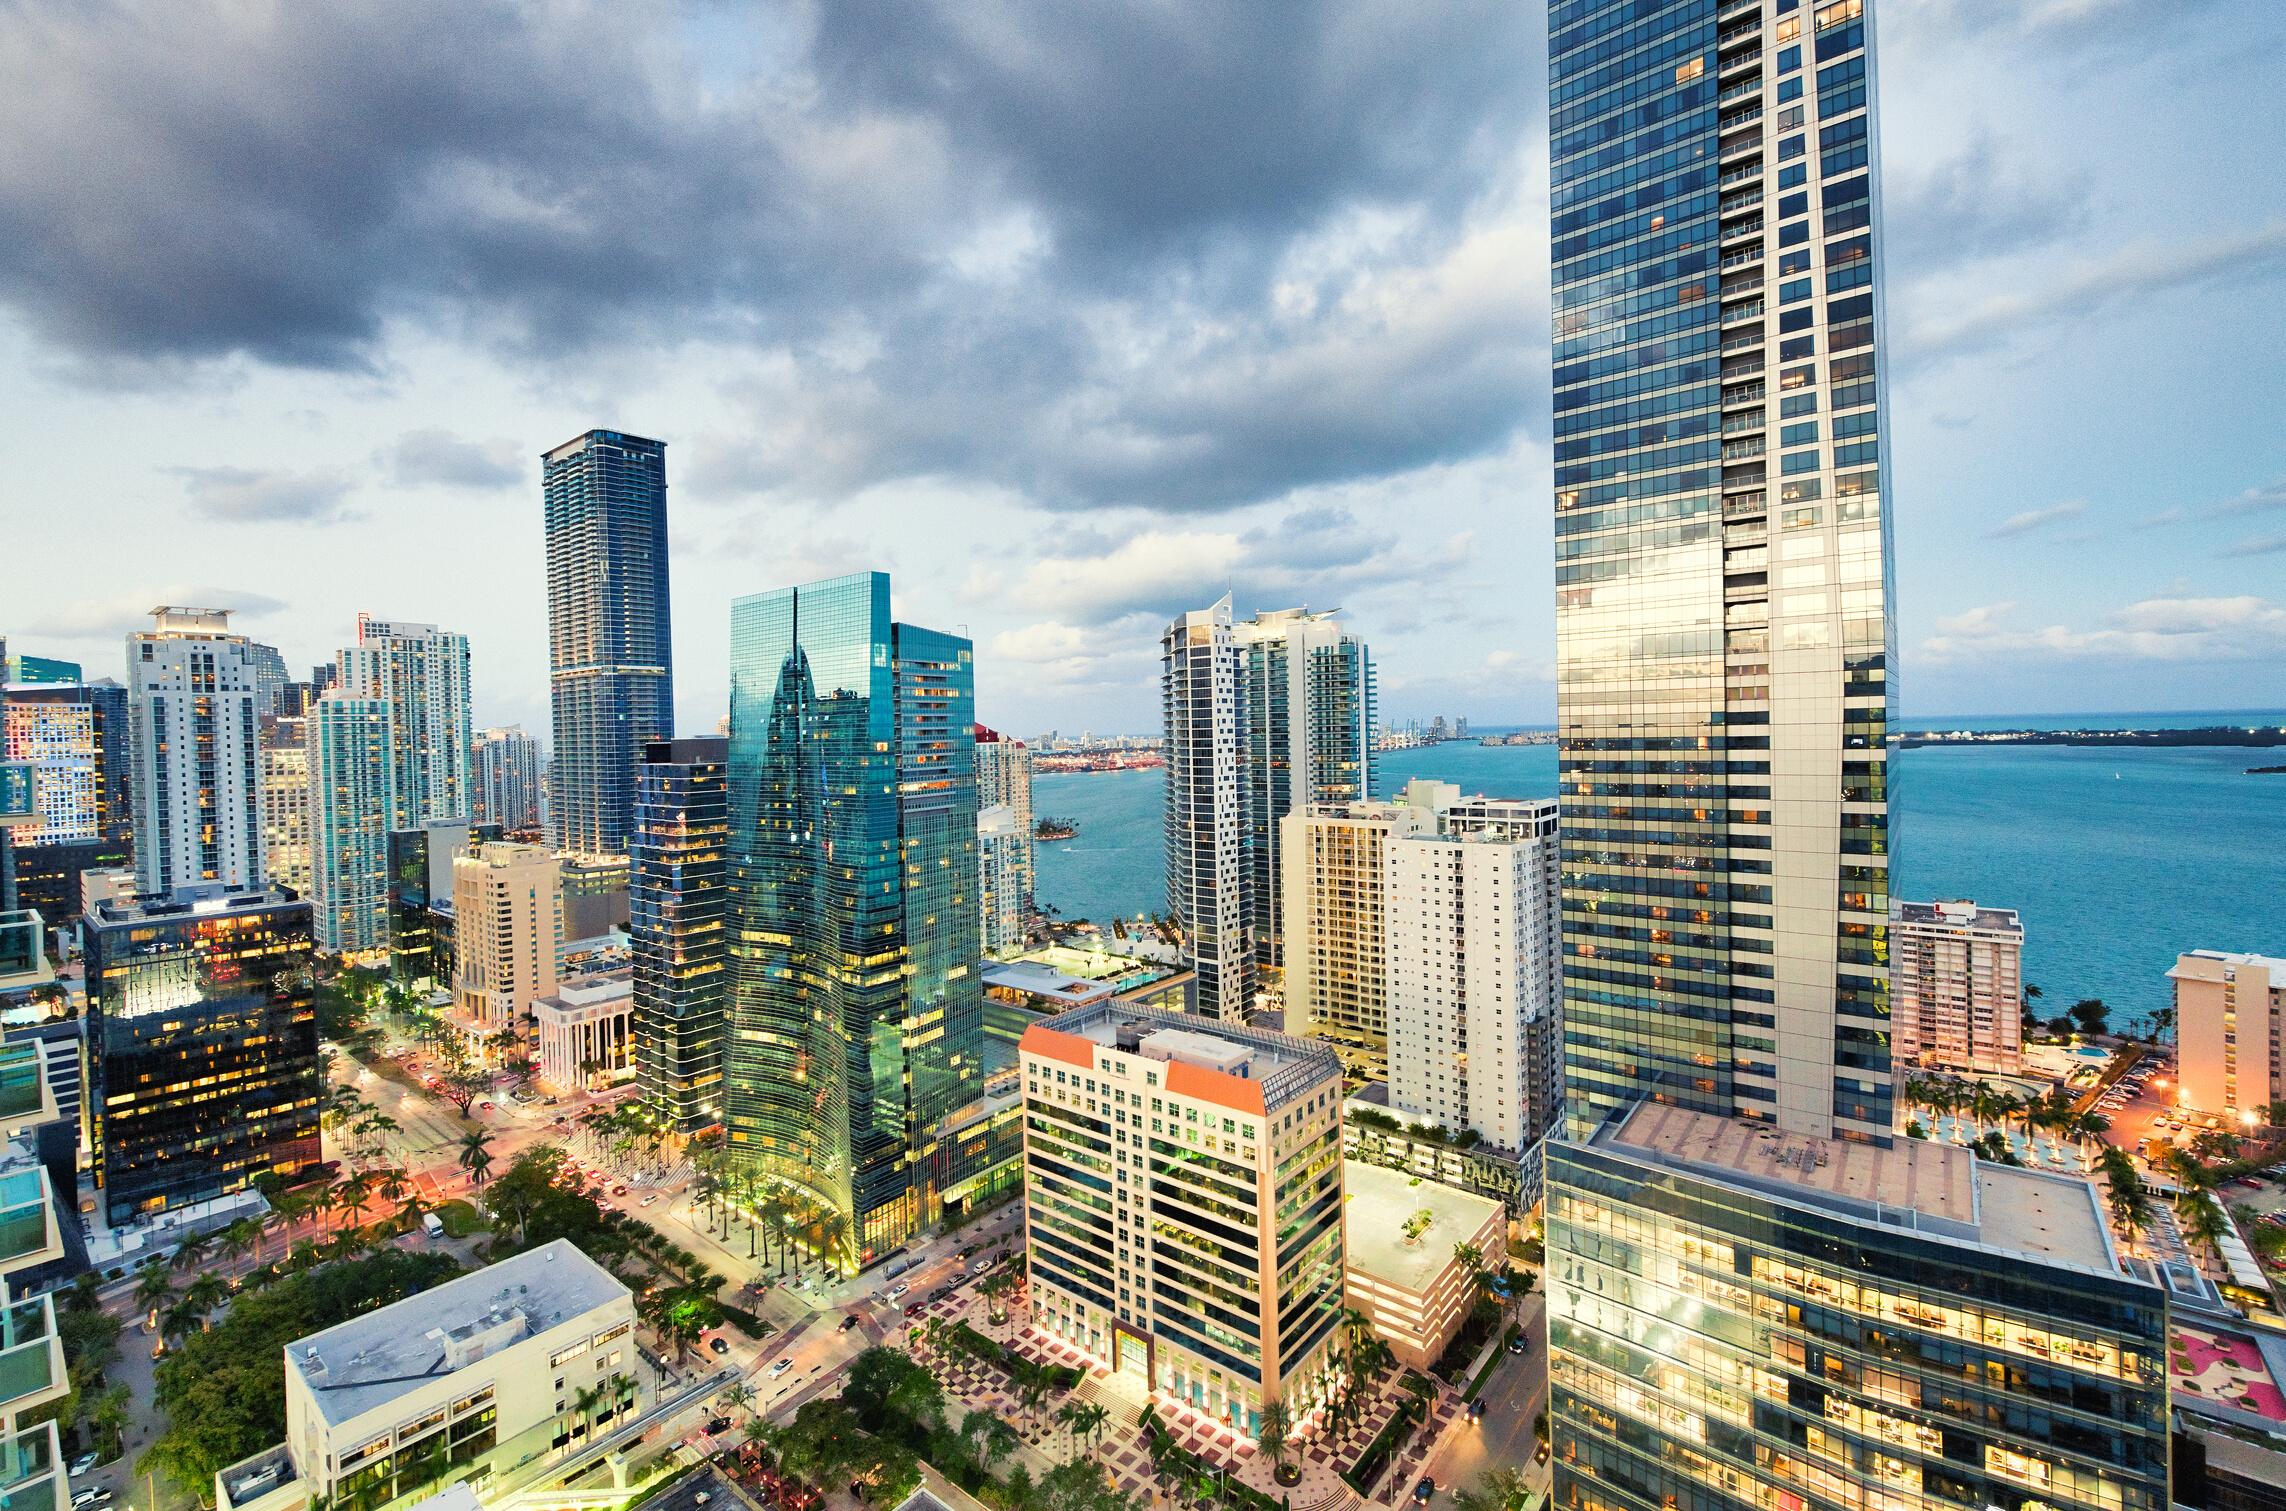
BRICKELL 2023 MIDYEAR MARKET REPORT
PREPARED BY THE APTTEAM AT DOUGLAS ELLIMAN © 2023 EQUAL HOUSING OPPORTUNITY THIS IS NOT AN INTENTION TO SOLICIT LISTING FROM OTHER BROKERS ALL MATERIALS PRESENTED HEREIN IS INTENDED IS INTENDED FOR INFORMATION PURPOSES ONLY WHILE THIS INFORMATION IS BELIEVED TO BE CORRECT, IT IS REPRESENTED SUBJECT TO ERRORS, OMISSIONS, CHANGES OR WITHDRAWAL WITHOUT NOTICE
CONTENT
Jan through June average sales price 2019-2023
Y-O-Y change for condos/townhomes
Jan through June sales price
by month
# of sales per month
Months Supply of inventory (MSI)
Average sales price for Flatiron
Flatiron price trend by bed count

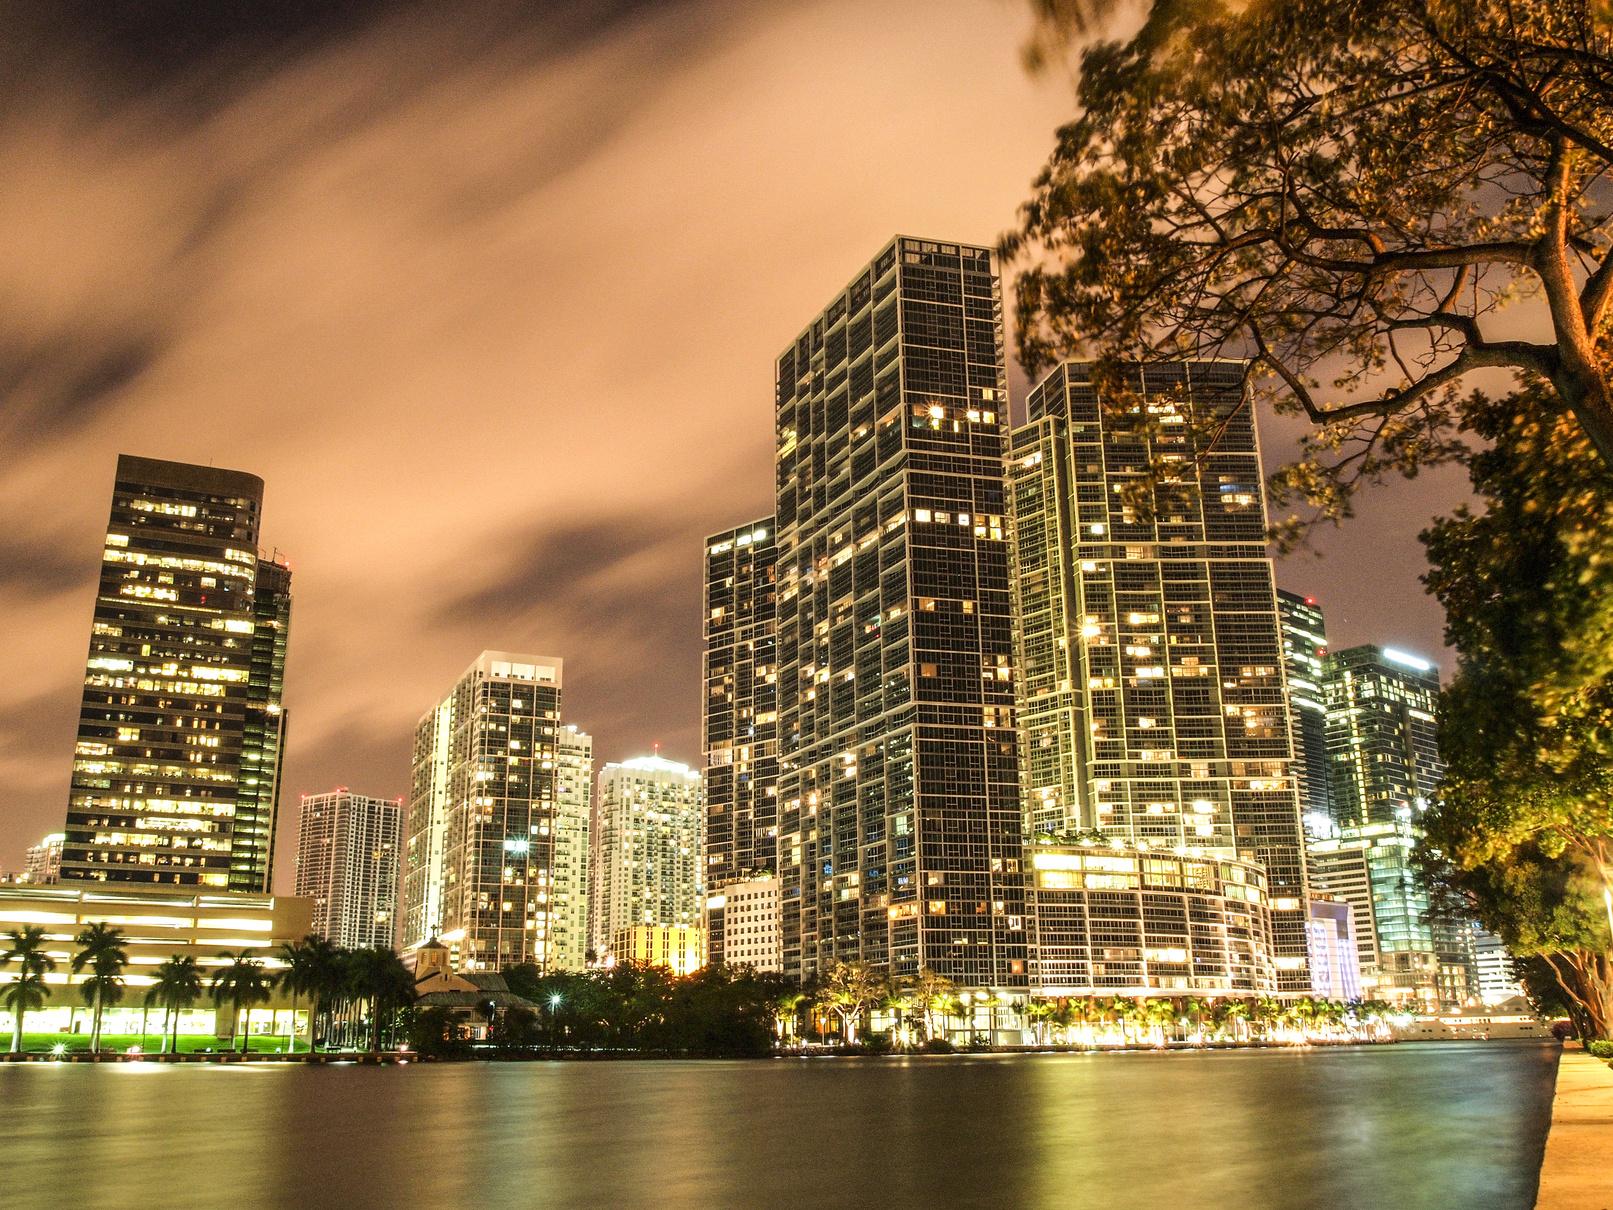
BRICKELL
The purpose of this study is to help you understand the dynamics of Miami's different markets and get an insight into Brickell's market performance and trends When considering an investment in Brickell's real estate, the best decision is always a result of the best information.
Our highest priority for our clients is to preserve and protect their legacy


For forecast or projections for Brickell for the remainder of the year or any other specific market, please contact us.
This APT Market study was compiled from data obtained from the MLS It was made with information of sales through June 30, 2023 While it pertains to the surveyed area’s sales, it doesn’t include any off market sales The information contained herein is deemed accurate, but can’t be relied upon We are not responsible or liable for input, calculation errors and/or errors of omissions and market changes We always advise those who wish to utilize this data to corroborate such information for themselves Equal Housing Opportunity This is not an intention to solicit listing from other brokers
PAGE | 02 786.493.1388 | 786.214.0099 adriana@theaptteam.con | tracy@theaptteam.com www theaptteam com Adriana Pinto-Torres & Tracy Ferrer Realtor Associates | Directors of Luxury Sales Cofounders of The APT TEAM ABOUT THIS STUDY JAN VS. JUNE PERIOD
PAGE | 02 MID YEAR HIGHLIGHTS
pre Ave 28,000 Ove The g the init
Condo/townhome transactions are starting to normalize following the
BRICKELL
BRICKELL
Average sales price per square foot expanded
The 2019 Num
The entory (MS
PAGE | 02 MID YEAR HIGHLIGHTS
The condo and townhome sector is recalibrating and yet is up from prepandemic year. The average sales price is now 61.7% higher compared to same period 2019. In the $1M+ condo/townhome sector, average sales price is nearly 7% more than during the first six months of 2019.

2019 2020 2021 2022 2023 $1,000,000 $750,000 $500,000 $250,000 $0 BRICKELL JAN VS. JUNE PERIOD AVG SALES PRICE 2019 2020 2021 2022 2023 $510,184 $503,793 $581,481 $815,810 $825,260 % 61 7%
CONDOS
2019 2020 2021 2022 2023 $2,000,000 $1,500,000 $1,000,000 $500,000 $0 $1M+ CONDOS & TOWNHOMES 2019 2020 2021 2022 2023 $1,637,767 $1,873,925 $1,747,122 $1,910,030 $1,743,187 % 6.4% 2 2 2 2 2 AVG # BEDS SOLD 2023 VS 2019 PRICES 2023 VS 2019 PRICES 3 3 3 3 3 AVG # BEDS SOLD
ALL
& TOWNHOMES
CURRENT ACTIVE:592
$1M+ CONDOS/TOWNHOMES
MONTHS SUPPLY OF INVENTORY based on closed sales: 5
CURRENT ACTIVE:235
MONTHS SUPPLY OF INVENTORY based on closed sales: 10
Average sales price per square foot increased for the general Brickell condo/townhome market as well as for those priced $1M and above, putting a downward pressure on overall prices for $1M+ condos/townhhomes and number of sales post heightened levels. Days on the market increased as a result.
BRICKELL 1,391 $815,617 $630 83 689 $825,260 $679 90 50.4% 7% 8.4% Jan-June 23 % Jan-June 22 AVG SALES PRICE AVG SPS/SF AVG DOM # CLOSED 1 1% 250 $1,910,030 $877 99 137 $1,743,187 $905 108 45.2% 3.1% 9% % AVG SALES PRICE AVG SPS/SF AVE DOM # CLOSED -8.7% ALL CONDOS/TOWNHOMES
Jan-June 23 Jan-June 22
In the Brickell condo/townhome market, the sales reached their highest marks in February, March and May. The $1M+ condo/townhomes had their highest average in March but its mid year dropped from 2022.
BRICKELL Jan Feb March April May June $1,000,000 $750,000 $500,000 $250,000 $0 2022 2023 AVG SALES PRICE BY MONTH
JUNE
JANUARY VS.
Jan Feb March April May June $645,727 $889,566 $863,945 $761,574 $863,773 $804,584 $767,486 $814,036 $807,513 $841,901 $856,307 $798,324 2023 2022 % -15.8% -9.2% -6.9% -9.5% 0.08% 0 07% 2023 MID YEAR AVG. 2022 MID YEAR AVG. $825,260 $815,810 Jan Feb March April May June $3,000,000 $2,000,000 $1,000,000 $0 2022 2023 Jan Feb March April May June $1,830,520 $2,223,588 $1,678,291 $2,023,125 $1,548,014 $1,583,668 $2,289,552 $1,880,550 $1,823,579 $1,997,148 $1,955,792 $1,619,784 2023 2022 % -20% 18.2% -7 9% -1 3% -20.8% -2.2% 2023 MID YEAR AVG. 2022 MID YEAR AVG. $1,743,187 $1,910,030 ALL CONDOS/TOWNHOMES $1M+ CONDOS/TOWNHOMES
BRICKELL AVE. # OF SALES BY MONTH 2023 TOTAL # OF SALES 417 AVE # OF SALES BY MONTH 2022 TOTAL # OF SALES 846 Jan 68 March April May June Jan 112 March April May 128 48 Feb 82 71 82 66 97 Feb 201 170 138 June ALL CONDOS/TOWNHOMES Jan 30 March May June Jan 40 April May 54 23 Feb 36 30 34 29 31 Feb 83 63 53 June March April AVE. # OF SALES BY MONTH 2023 TOTAL # OF SALES 182 AVE # OF SALES BY MONTH 2022 TOTAL # OF SALES 324 $1M+ CONDOS/TOWNHOMES
CURRENT ACTIVE:16
MONTHS SUPPLY OF INVENTORY based on closed sales: 4.17
Sales volumes for Flatiron are down from historic peak of the Covid-19 frenzy, as the number of condos sold has been reduced by half. Average sales price is up 19.5% from previous year. Days on market virtually remained unchanged.
BRICKELL
$943 93 23 $1,615,652 $1,023 95 50.4% 2.1 8.4% Jan-June 23 % Jan-June 22 AVG SALES PRICE AVG SPS/SF AVG DOM # CLOSED 19.5%
FLATIRON
4-5+ beds
BRICKELL FLATIRON
FLATIRON PRICE TRENDS BY BED COUNT
AVG. SALES PRICE : $4,650,000
AVG. $SP/SF : $1,412
AVG. DOM: 1,228
AVERAGE LIKES
2 beds
3 beds
AVG. SALES PRICE : $1,307,143
AVG. $SP/SF : $998
AVG. DOM: 247
1 bed
AVG. SALES PRICE : $2,328,000
AVG. $SP/SF : $998
AVG. DOM: 63
AVG. SALES PRICE : $785,556
AVG. $SP/SF : $843
AVG. DOM:104
1 Bed 9 2 Beds 7 3 Beds 5 4-5+ beds 2 # OF SALES PER BEDROOM COUNT
THANK YOU
