


The purpose of this study is to help you understand the dynamics of Miami’s different markets and get an insight into Miami’s market performance and trends. When considering an investment in Miami’s real estate, the best decision is always a result of the best information.
Our highest priority for our clients is to preserve and protect their legacy. No one does more research about the Miami market than us. For forecast or projections for Miami for the remainder of the year or any other specific market, please contact us.

www.theaptteam.com


This APT Market study was compiled from data obtained from the MLS. It was made with information of sales through June 30, 2023. While it pertains to the surveyed area’s sales, it doesn’t include any off market sales. The information contained herein is deemed accurate, but can’t be relied upon. We are not responsible or liable for input, calculation errors and/or errors of omissions and market changes. We always advise those who wish to utilize this data to corroborate such information for themselves. Equal Housing Opportunity. This is not an intention to solicit listing from other brokers.


4-5 PURPOSE OF STUDY
6-7 TABLE OF CONTENTS
8-19 COCONUT GROVE

20-21 ABOUT US
Pre and Post Covid pricing
Jan-June 2203 vs Jan-June 2022
% change
# of beds sold
# of sales per month

- Coconut Grove has experienced a staggering percentage change since 2019. This makes it one of the most highest-gaining areas
-Single-family homes are recalibrating following the extreme record levels, outperforming pre-pandemic 2019 by 121%
-$1M+ single-family homes average salesprice is up 68% from 2019
- Sales transactions fell short of the frenzied Covid levels due to inventory shortage
- Condos/townhomes are up by 156% from 2019 & $1M+ condos/townhomes are 83% above 2019


Single-family homes outperformed pre-pandemic 2019 levels by 121% while the $1M category surpassed it by 68%


Current active: 76 Months Supply


Inventory
6.8
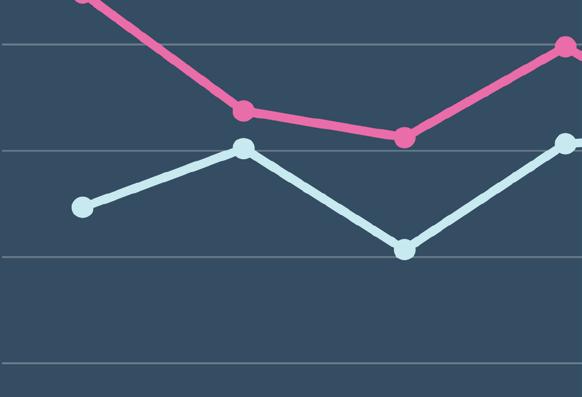
The average sales price per square foot for all homes in Coconut Grove has edged 2022 sales price by 6% to $932/SF and for $1M+ homes by 8.9%. Days on the market surged. Sales transactions are down from the historic levels due to increased prices due to inventory shortage.
(right) Market is readjusting from the elevated thresholds and yet, June 2023 prices are trending upwards for the overall single-family home and the $1M+ home sector.


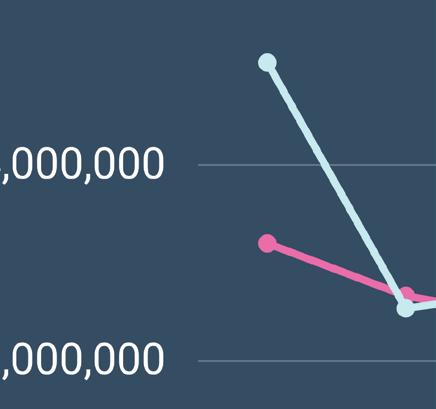
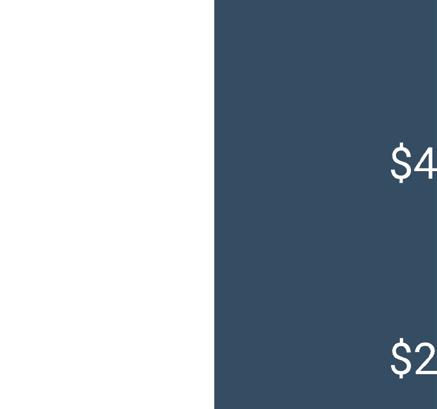


2023
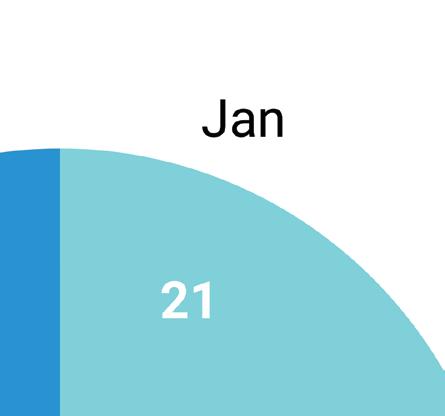
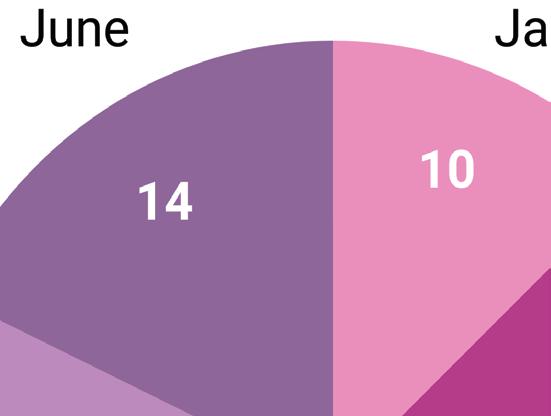
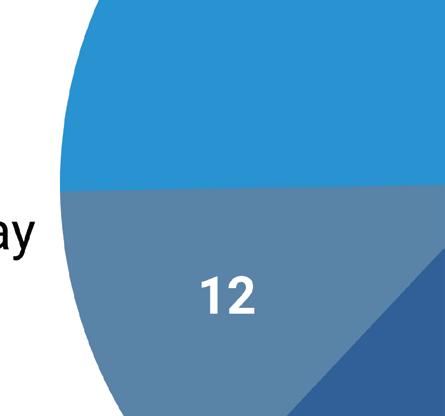
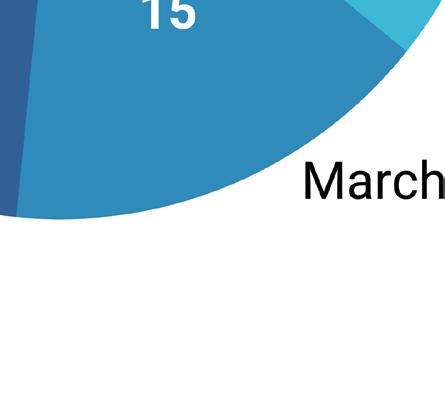
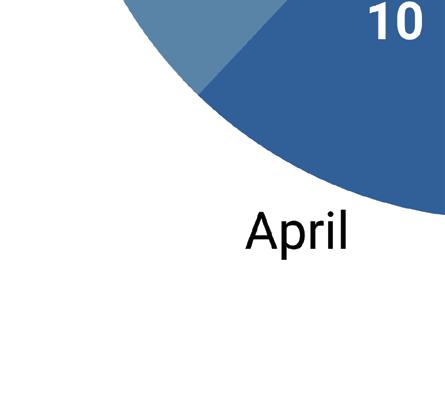
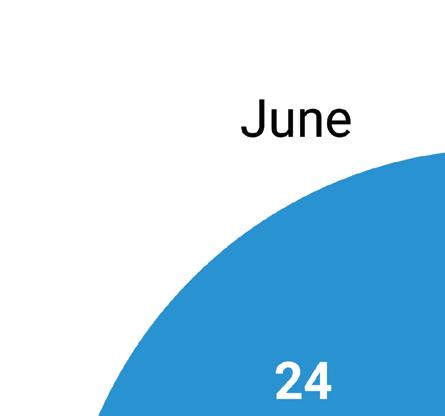
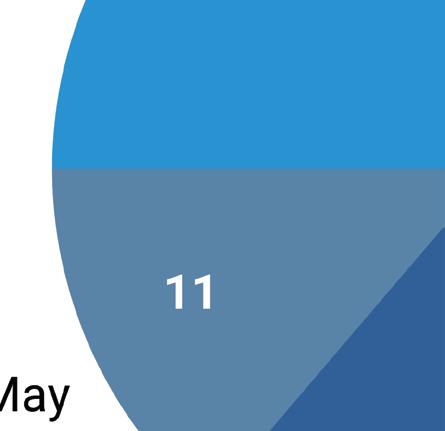
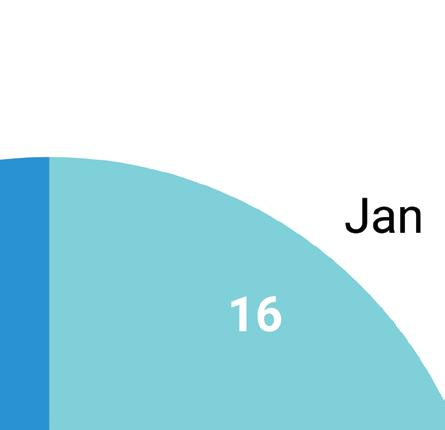
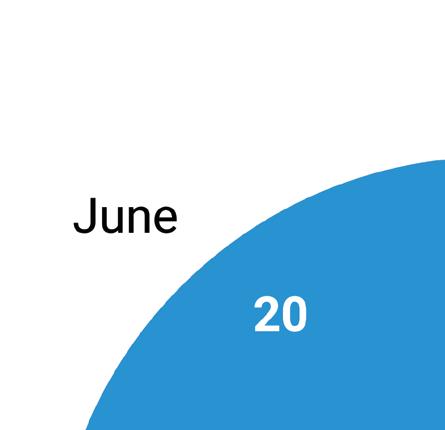
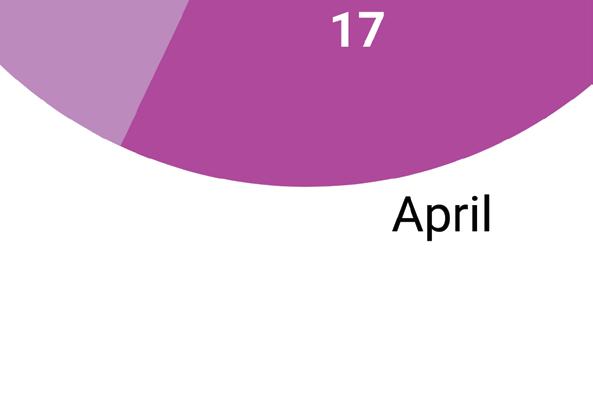
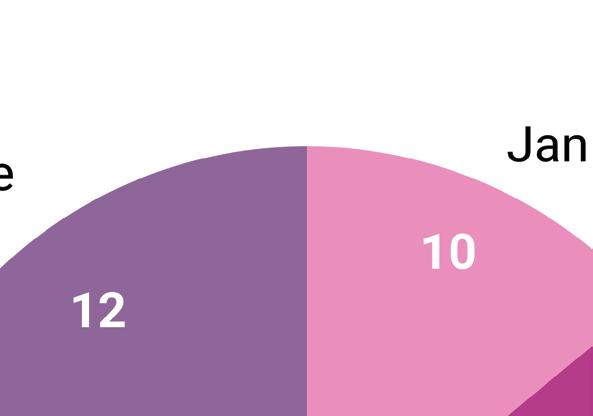
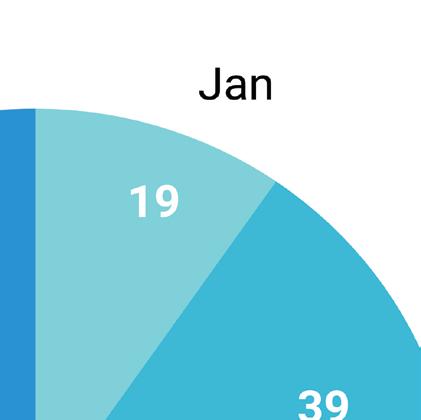
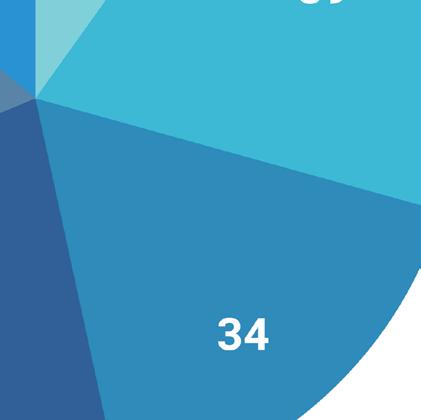
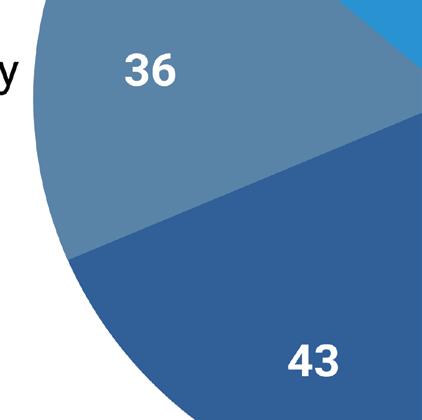
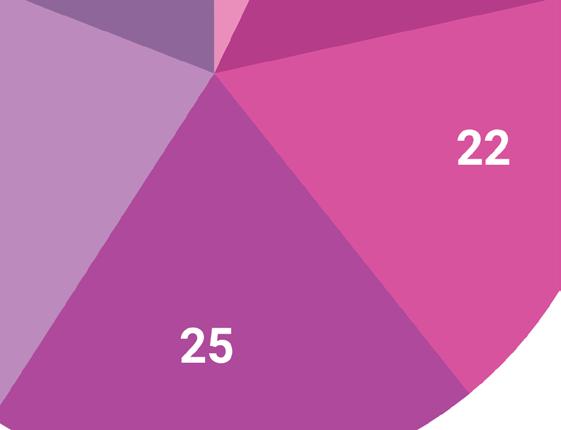
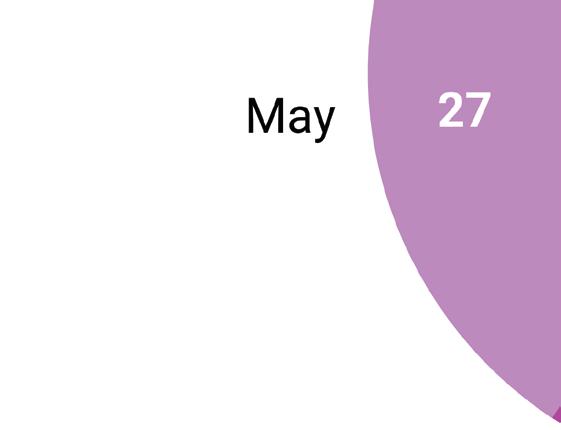
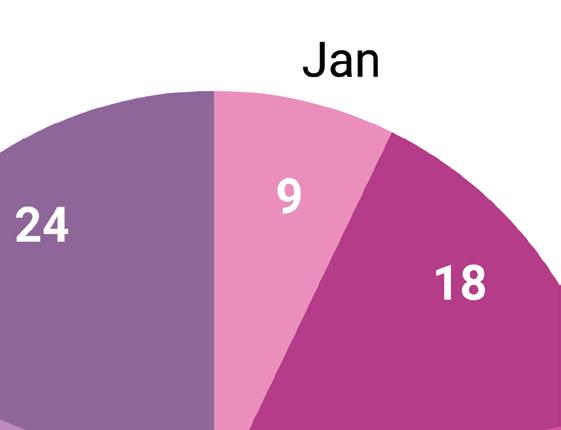
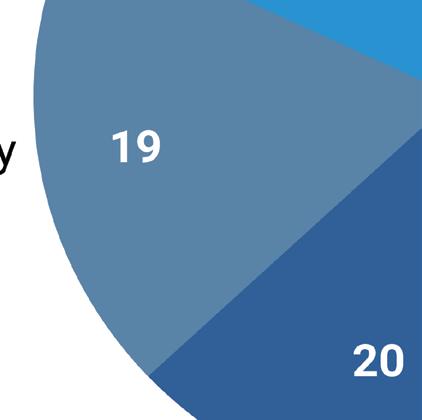
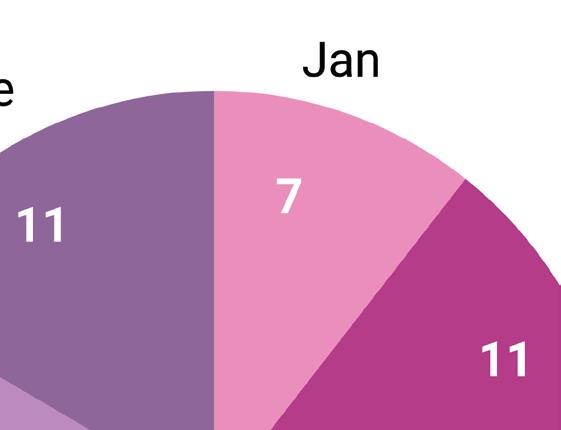
AVG. SALES BY MONTH
Total number of sales: 78


2022


AVG. SALES BY MONTH


Total number of sales: 95

2023
AVG. SALES BY MONTH
Total number of sales: 67


2022


AVG. SALES BY MONTH


Total number of sales: 80
active: 67 Months Supply


Price trend indicators has Coconut Grove performing at record levels. Pace of market for all condos has slowed from frenzied 2022. Average sales prices are up. The ongoing shortage of inventory continues to drive up prices per square footage.
(right) By in large, the average selling prices of condos/townhomes still manage to surpass previous limits month after month.


2023
AVG. SALES BY MONTH
Total number of sales: 125
2022

AVG. SALES BY MONTH

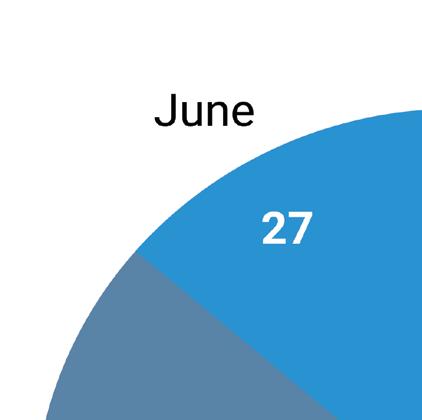

Total number of sales: 198


2023

AVG. SALES BY MONTH
Total number of sales: 66


2022
AVG. SALES BY MONTH


Total number of sales: 100
Working with The APT Team is more than just a transaction, it is a relationship built on trust and respect. We are obsessed with helping our clients achieve their real estate dreams and create a legacy that will last for generations. We believe in the power of a handshake, even in this digital age. With over $900M+ in sales and 5 languages spoken, we know that numbers are only part of the story. What matters most is you. After all, what you own is just as important as how and why you own it. The APT Team at Douglas Elliman, where your legacy is our obsession.


“WHERE YOUR LEGAGY IS OUR OBSESSION” THE APT TEAM
ABOUT US
© 2023. Equal housing opportunity. This is not an intention to solicit listing from other brokers. We cooperate with them fully. This advertisement does not constitute an offer in the states of NY or NJ or any jurisdiction where prior regulations or other qualifications are required