How fungicide use and N application can increase yield PG. 24
a profitable increase
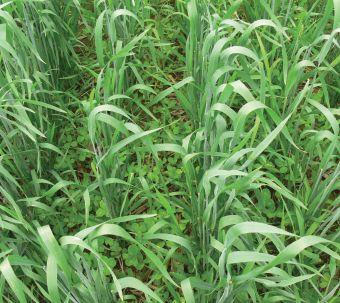
Spring wheat underseeded in red clover may be a beneficial strategy
PG. 28
GAIN CONTROL OF EARLY-SEASON NUTRITION
Rethink Your Phos
Providing your crop with an early supply of phosphorus is not as simple as applying a standard rate of P2O5 every year. Take control of the phosphorus, zinc and other nutrients that your crops need for a strong start with a new fertility tool, Nu-Trax™ P+.
The Challenge of Early-Season Phosphorus
Plants crave phosphorus early. Scientific research shows that plants have an insatiable appetite for phosphorus early in the season with rapid uptake occurring at this stage.
Satisfying your crops early phosphorus hunger sets the stage for a more fibrous root system that is better able to access the nutrition it needs later in the growth cycle. But two main challenges make it difficult for young plant roots to find and access that phosphorous:
1. Phosphorus is relatively immobile in soil, so plant roots need to grow to the P.
2. Phosphorus is easily tied up in soil. About 80% of traditional P fertilizers become unavailable to plants in the year of application.
“In cold and wet soil, which is common seeding conditions for Canadian farmers, root growth slows,” explains Mark Goodwin, director of research and product development for Compass Minerals. “This makes accessing P and other essential nutrients even more difficult for young seedlings.”
Provide the P Your Crops Need
Nu-Trax P+ is a new fertilizer that can help you deliver the phosphorus, zinc and other nutrients your crops need for optimal early-season growth. Nu-Trax P+ brings together three patented technologies.
1. With the CropStart™ Nutrient Package, young plants get the right, scientifically-derived ratio of nutrients needed for a healthy start: phosphorus, zinc, manganese and nitrogen.
“Piggy-backing the Nu-Trax P+ nutrients on every fertilizer granule creates a consistent blend, allows for blanketlike distribution in the field and provides more points of interception for your crop,” says Goodwin. “Now seedlings can access the nutrients they need sooner, especially in cool, wet soil conditions.”
3. The unique PlantActiv™ Formulation is chemically and physically designed for better micronutrient availability, so nutrients get into plants quickly. Formulated as a fine powder, Nu-Trax P+ particle size is ideal for plant uptake.
Rethink Your Phos
Take control of your crop’s early-season nutrition. Just 2 pounds per acre of Nu-Trax P+ fertilizer puts you in charge of delivering the nutrition your crops need for a strong start!
Field trials show the benefits of better early-season nutrition.
“Trial results show an increase in plant emergence and seedling size,” says Goodwin. “Plants are more vigorous with longer, more developed root systems. The early-season growth translated to higher yields in these wheat fields.”
Control
Location
Taber, AB Application
2 lb/ac Nu-Trax P+
Results
• 59% larger seedlings
• +7 bu/ac yield
Location Vauxhall, AB Application
2 lb/ac Nu-Trax P+
Results
• 12% larger seedlings
• +4 bu/ac yield
TOP CROP
Carolyn King
Amy Petherick
Amy Petherick
Stefanie Croley | aSSoCiate eDitor
SprAwliNg Supply
ANd demANd
Achallenging crop year has far-reaching impacts. To top off undesirable planting weather, ontario’s corn growers may see their farm revenue take a hit thanks to low prices and average yields, and a potential bumper corn crop in the United States could drive prices even lower.
In farming, some years are good and some are bad. economics, weather and supply and demand play a major role – it’s the nature of the business, and all producers feel the effects of these challenges from year to year.
But what happens when another factor, such as urban sprawl – no minor issue – is thrown into the mix?
Take, for example, the local farm that sells sweet corn to thousands of people in the county I live in. The family farm is a household name each summer; their Facebook page and roadside stands count down to the first day of the selling season and the demand is great. But this year, the supply hasn’t been there: poor weather has greatly impacted the crop, resulting in a delayed start and patchy yields. When I came across a study on urban agriculture, I immediately thought of the sweet corn farm. The study, conducted by a team of researchers at Mcgill University in Montreal, found that roughly one-third of the world’s urban space would need to be planted with vegetables to meet the global demand of city dwellers. How might such a scenario, on top of seasonal difficulties, affect the sweet corn farm’s business?
With a population of approximately 2,500 people, my town boasts one stoplight, two convenience stores and six restaurants (three of which are pizza joints). Thousands of acres of corn, wheat and soybean fields still surround the area, but new subdivisions are under development and the population is growing, so we may be seeing a grocery store soon. regardless, nearly all of the necessary amenities a family may need can be found in neighbouring larger towns a short drive away.
I make the 45-minute trip to the city to go to the mall or out for dinner a few times a month. each time I drive down the two-lane highway toward the metropolis of lights and people, I notice another new sign on a piece of land stating something new is in the works, with builders breaking ground on new commercial or residential developments. These signs are appearing closer and closer to my tiny town, and the vast fields are dwindling as new buildings pop up faster than corn tassels.
Statistics Canada calls this urban sprawl, and the idea of excessive urban expansion characterized by encroachment on agricultural land is usually understood as a negative phenomenon. In the 2011 census, 81 per cent of Canada’s population lived in urban areas. When developers run out of room in urban areas to accommodate Canada’s growing population, they turn to rural spaces, creeping in on small towns.
new developments are good for a town’s economy and the community’s residents most often welcome them. It’s hard, however, to look at urban sprawl from a positive light when you consider the eventual impact on the community’s agriculture.
The authors of the study suggest it is possible for urban farms to feed the urban dwellers. But if acres of farmland are continually turned into apartment buildings, restaurants or shopping malls – and poor growing seasons like we’ve experienced this year continue to impact supply – will crops be able to grow? and, more importantly, who is going to grow them?
P.O. Box 530, Simcoe, ON N3Y 4N5 e-mail: subscribe@topcropmanager.com Printed in Canada ISSN 1717-452X
Top Crop Manager West - 9 issues - February, March, Mid-March, April, June, September, October, November and December - 1 Year - $45.00 Cdn. plus tax
Top Crop Manager East - 7 issuesFebruary, March, April, September, October, November and December - 1 Year - $45.00 Cdn. plus tax
Potatoes in Canada - 4 issues - Spring, Summer, Fall and Winter 1 Year - $16 CDN plus tax All of the above - $80.00 Cdn. plus tax
protei N form AN d fu NctioN
Research on protein quality in Ontario wheats could help the whole value chain.
by Carolyn King
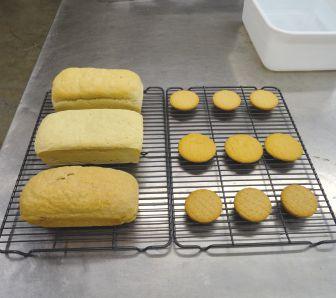
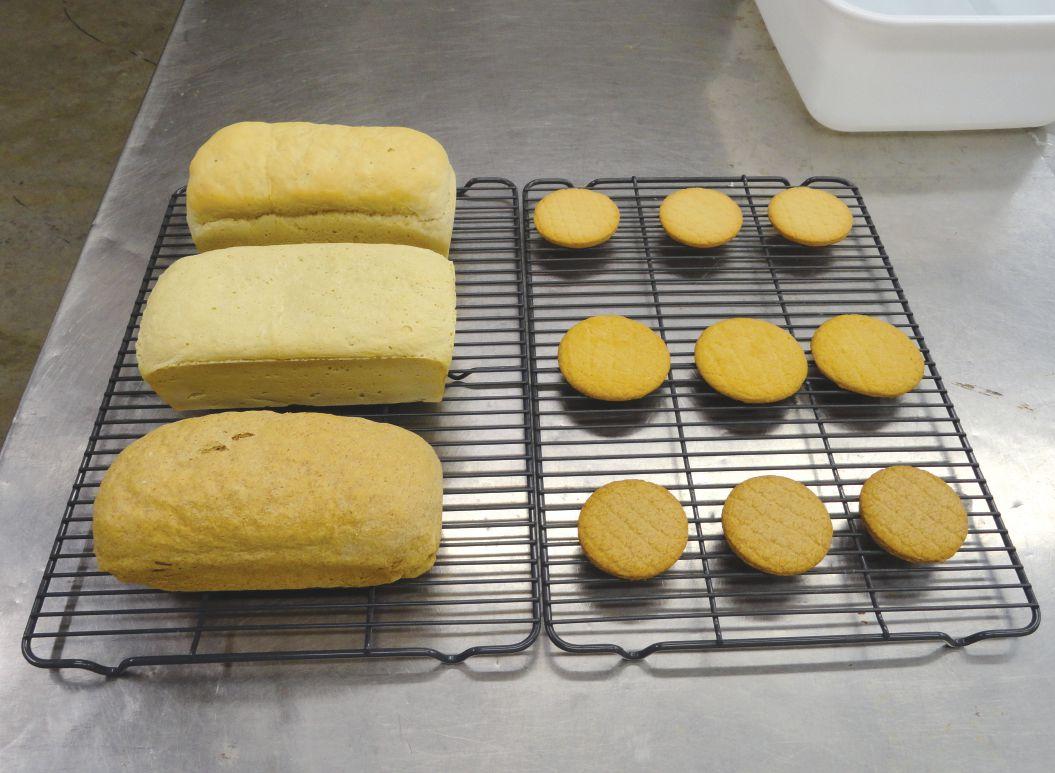
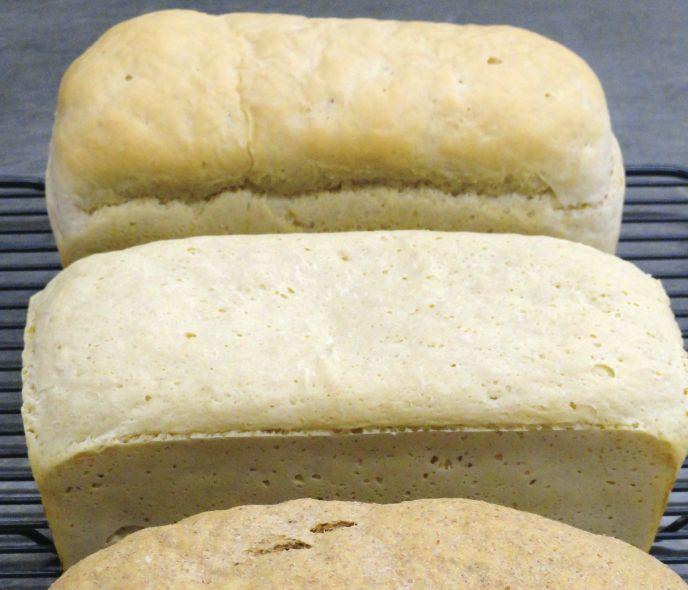
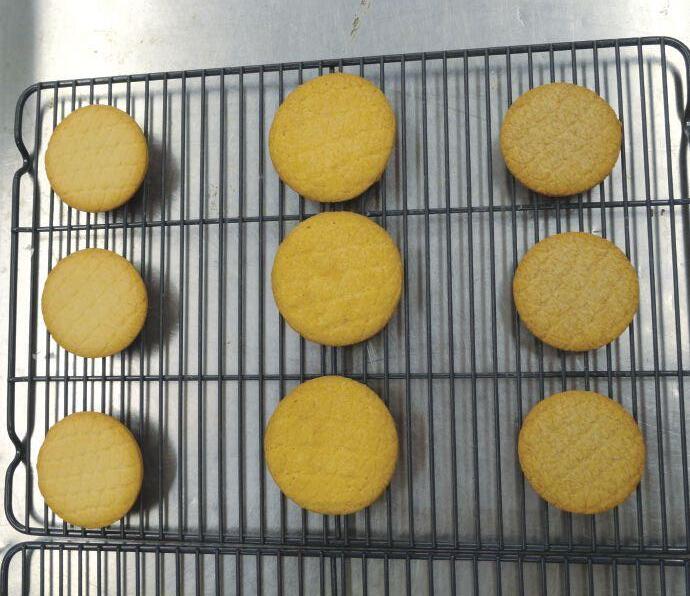
Function follows form, when it comes to proteins in wheat. The different structures of various protein molecules are an essential factor in a wheat flour’s ability to produce a specific end-product, whether that’s a cookie, cake, yeast bread, pastry or other product. So a new project is underway to get a deeper understanding of the proteins in ontario winter wheats. The resulting information will enable wheat breeders to develop varieties targeted to specific end products, meeting the needs of wheat processors and consumers, and providing ontario wheat growers with varieties that are in high demand.
The idea for the project emerged when Dr. Jayne Bock talked with several ontario cereal industry companies to get a sense of the industry’s biggest challenges and issues. “everything seemed to be coming back to wheat quality, especially the quality of the gluten proteins in the wheat,” says Bock, a food scientist at the University of guelph and the principal investigator for the project.
“We have been researching wheat quality and gluten proteins in wheat for more than 100 years. The problem is that we’ve primarily focused on hard [western spring] wheats and we have always used bread
for the model system. But in ontario, most of the wheat we produce is soft wheat, especially soft winter wheats. Soft winter wheats typically don’t go into bread products. They typically go into a broad range of products like cakes, crackers, cookies and pretzels,” explains Bock.
“I realized that, from a scientific standpoint, we really didn’t have a good understanding of the gluten proteins and wheat quality for soft wheats. We’ve never taken the time to research what gluten looks like in ontario hard winter wheats and ontario soft winter wheats.”
gluten protein is formed when water is added to wheat flour. as the water is mixed in, the two main types of protein in wheat flour –gliadins and glutenins – start to interact and form bonds, called crosslinks, with each other. The resulting cross-linked protein network is gluten. glutenin helps give gluten its elasticity, while gliadin helps give gluten its extensibility (stretchability). With more mixing or kneading of the dough, more cross-links form, which further changes the
aBOVE: a new study is examining protein diversity in Ontario winter wheats so breeders can develop varieties targeted to specific end-uses.
structure of the protein network and affects the dough’s behaviour when made into a food product.
“The goal of the project is to gain an understanding of the diversity in ontario winter wheats right now, and then to use that diversity to understand the protein conformation and gluten quality in ontario wheat,” notes Bock.
protein conformation refers to the threedimensional structure of the proteins. “Typically, proteins have a specific structure to them. For example, the protein structure of hemoglobin in humans is very consistent for the most part,” Bock says. “But wheat is a very heterogeneous biological system and the protein structures in wheat, especially in wheat gluten, can vary quite dramatically because the genetics are so diverse and the types of processing we use to manipulate that structure are quite different.”
Wheat types and varieties have differing protein characteristics. For instance, soft wheats tend to have a lower protein content, form weaker gluten, and have a higher proportion of gliadin, which allows cookie dough to spread. In comparison, hard wheats tend to have a higher protein content, form stronger gluten, and have a higher proportion of glutenin, so they have the elasticity needed for yeast breads.
Bock’s four-year project involves soft red and hard red winter wheats, the two most commonly grown winter wheats in ontario. It is being funded through the agriInnovation program under the growing Forward 2 platform, with funds from agriculture and agri-Food Canada and the ontario Cereal Industry research Council.
The project has four objectives. The first is to assess the diversity of proteins that exists in ontario wheats. Work on this objective is already under way.
The second objective is to examine how the commercial flours made from ontario wheats perform in various quality tests. Bock says, “Typically, research projects look at the flour from an individual variety of wheat. But from a commercial standpoint, multiple varieties are blended together before the wheat is milled into a flour. To keep this project as commercially relevant as possible, this objective is not to just look at the flour quality from a variety, but to look at the flour quality and behaviour during processing of commercial flour blends from these ontario wheats.”
The third objective is to develop a safer alternative to chlorination of cake flour.
“Chlorination has some significant personnel safety issues and some environmental safety issues associated with it. So chlorination is eventually going to be phased out,” explains Bock. “When that happens we need to be ready with a suitable alternative to give the same type of flour that we know and love for the cakes that we make.” according to Bock, chlorination interacts with the starch and the protein in flour and changes the way they behave. The result is a flour especially suited for making cakes. “Chlorination essentially oxidizes the starch granule and gives it some unique
Wheats with a higher protein content and a higher proportion of glutenin proteins tend to have the elasticity needed for yeast breads to rise.
Photos courtesy of Jayne Bock, u ni V ersity of Gue LP h.
Wheats with a lower protein content and a higher proportion of gliadin proteins tend to have the stretchability needed for cookie dough to spread.
properties. It’s the starch granule when it gelatinizes during baking that will give the cake its structure,” she says.
“and chlorination changes the gluten proteins in such a way that they can’t come together and form a network. people will often say ‘the proteins are rendered nonfunctional.’ But the proteins are still there, and they still provide thickening to a batter that keeps the starch granules from settling before you get it in the oven to bake it.”
In this objective, Bock will be trying to recreate these starch and protein changes in a non-chlorinated flour.
The project’s fourth objective is to examine wheat and flour aging. aging affects various characteristics of wheat grain and flour, including the gluten, so adequate aging is important for flour quality and baking performance. This objective will focus on predicting and controlling aging so wheat processors will be able to more reliably get the quality they need.
Bock says, “When wheat is harvested, it doesn’t stop changing – that’s really only the beginning of changes in the wheat grain and then the milled flour over time. That is not always very well understood and can cause some problems for processors.”
Wheat needs to be stored for a time before milling, but the exact length of time can vary. “We call this period the sweating period. The wheat is changing substantially during that time. If you try to mill it during those weeks, it’s very difficult and you don’t get the same quality of flour out of it. The wheat grain has to mature to a certain extent to give consistent milling properties,” she notes.
“Then, once you mill a grain, it is exposed to oxygen and the atmosphere, and the oxygen reacts with the proteins, causing changes in the protein fraction.”
She adds, “eventually the grain before milling and the flour after milling each reach a point where further changes are very minimal and the b ehaviour and the quality remain consistent for quite some time. However, [the flour] eventually drops out of that equilibrium phase. You reach a point when the flour’s behaviour is not consistent anymore. So you can’t reliably use it and expect to see the same product after it has aged for too long.”
Value chain benefits
Bock aims to tie together all the information resulting from the project’s four components to develop “a rough working model of what the gluten network and gluten behaviour
looks like in ontario winter wheats. We can use that model to guide our decisions about aiming specific varieties for specific types of processes and products.”
“By looking at the diversity that is already in ontario wheats and then coupling that with all the other activities, we aim to give wheat breeders an opportunity to see where is the diversity and how can you use that in a more targeted breeding strategy. Because ultimately, you want to breed wheat varieties with good disease resistance, good insect pest resistance, and
Top Crop Manager Column: AMI #1—Business Planning
good yields – and that end-users are going to value and use,” explains Bock.
“We’re hoping that eventually certain varieties can be targeted for certain types of products. It’s not necessarily an identitypreserved type of system, but the end-users will see added value in those varieties that are most suitable for their product. With ontario being one of the major soft wheat producing regions in north america, this will provide benefit and value to the entire market value chain from the breeders all the way through to the end-users.”
Planning for Profit
For many farm operators business planning is considered a chore that’s often relegated to the bottom of the priority list. But planning for business means planning for profit.
“Having a business plan is essential to becoming a more proactive versus reactive farmer,” says Rob Hannam, president of Synthesis Agri-Food Network in Guelph, Ont. “It doesn’t have to be long, provided that it’s clear and concise while including the three most important factors for farm business success—vision, risk assessment and financial management.”
Vision is about picturing how the farm will look in the next five to ten years. It means determining whether the operation will expand, shrink, diversify or specialize. Making the right choices, such as the need for more on-farm storage or equipment, will easily fall into place if a clear vision is expressed.
Risk assessment is essential to maintaining a thriving and prosperous farm. Weather is an obvious risk mitigated through insurance and land management practices. Others include fluctuating commodity prices, rising interest rates and illness or injury. Assessing and mitigating these risks helps to ensure that money is not being lost or left on the table.
Financial management means keeping a score card that lists financial goals such as reducing cost of production or equipment maintenance, improving own versus owe ratios, and establishing target market prices. Established goals are more likely to stay top of mind.
To get a quick start on your farm business plan, take a new approach with these tips from Rob Hannam:
Ask business partners or family members to describe how the farm will look in five – 10 yrs. Include questions such as the type of farm, produce, size, number of staff, and what it feels like to be part of the operation. Compare responses and look at the similarities and differences. This helps to develop a shared vision for the future.
Have a formal owners meeting at least twice a year. Use the meeting to review budgets, financial statements and plans for the upcoming year. While farm families talk about crops, livestock, and weather on a daily basis, reviewing financial statements doesn’t often happen. Formal meetings help owners to think beyond daily operations. Select one non-production related item and take care of it this year. Choose something that often drops down the to-do list, set goals and a timeline and make it a priority. Examples include creating a commodity marketing plan or succession plan or writing job descriptions for staff. Or, a course to upgrade skills such as the Advanced Farm Management Program offered by the Agri-food Management Institute.
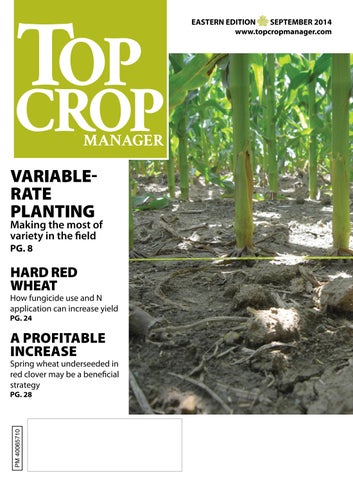
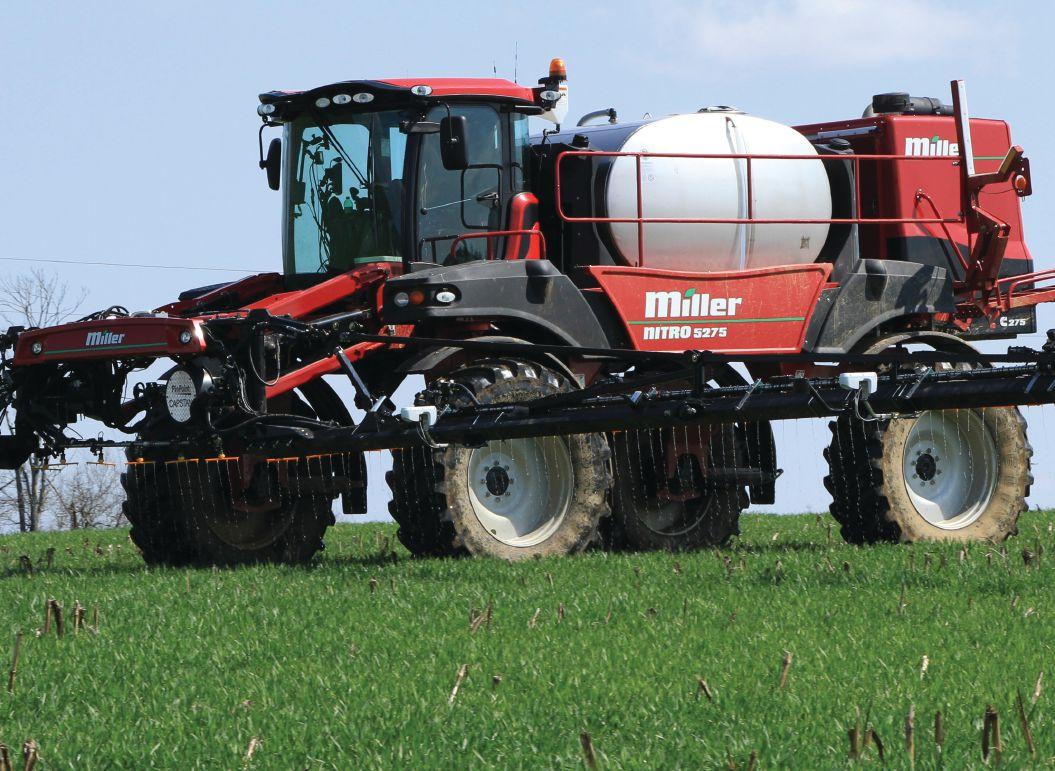
VA riA ble-r Ate
pl AN ti Ng
Making the most of variety in the field with this precision ag strategy.
by Blair andrews
As corn hybrids are being developed to respond better to higher seed populations, interest is growing in variable-rate seeding as a way to take advantage of the yield potential and boost profits.
a aron Breimer, sales agronomist with Veritas Farm Management, says variable-rate is no longer limited to the “early adapters” of precision ag technology. “I’ve got growers doing significant acres with the variable-rate,” says Breimer.
Variable-rate seeding matches the seed population to the various management zones of the field. Soil zones with higher productivity would have a different seeding rate than those with lower productivity.
“It takes a little bit of understanding of what is affecting the management zone to decide on what population you want to work with and you have to take into consideration which varieties you’re working with,” says Breimer.
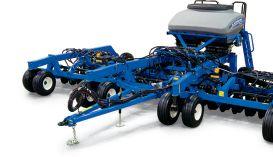
With the introduction of hydraulic-driven planters, farmers can change the seeding rate from inside the cab, altering the rate or the hybrid from one field to the next if they knew the
fields had different levels of productivity. Breimer says variablerate seeding now allows farmers to manage the variability that exists within a field.
according to Breimer, there’s been a change in mindset about precision agriculture since it first came out 20 years ago. The initial approach was to minimize the variability by changing the fertility to make the field more uniform. “We’ve come to the conclusion that’s impossible,” says Breimer.
precision ag, including variable-rate seeding, is now about making the most of the variability in the field. “Variable-rate seeding is not an attempt to minimize variability within your field,” he says. “It’s actually the opposite. We are attempting to take maximum advantage of that variability.”
For Breimer, the first key step is to collect good data, whether it’s from satellite imagery or layers of data from previous crop years to establish the zones. He’ll then talk to the
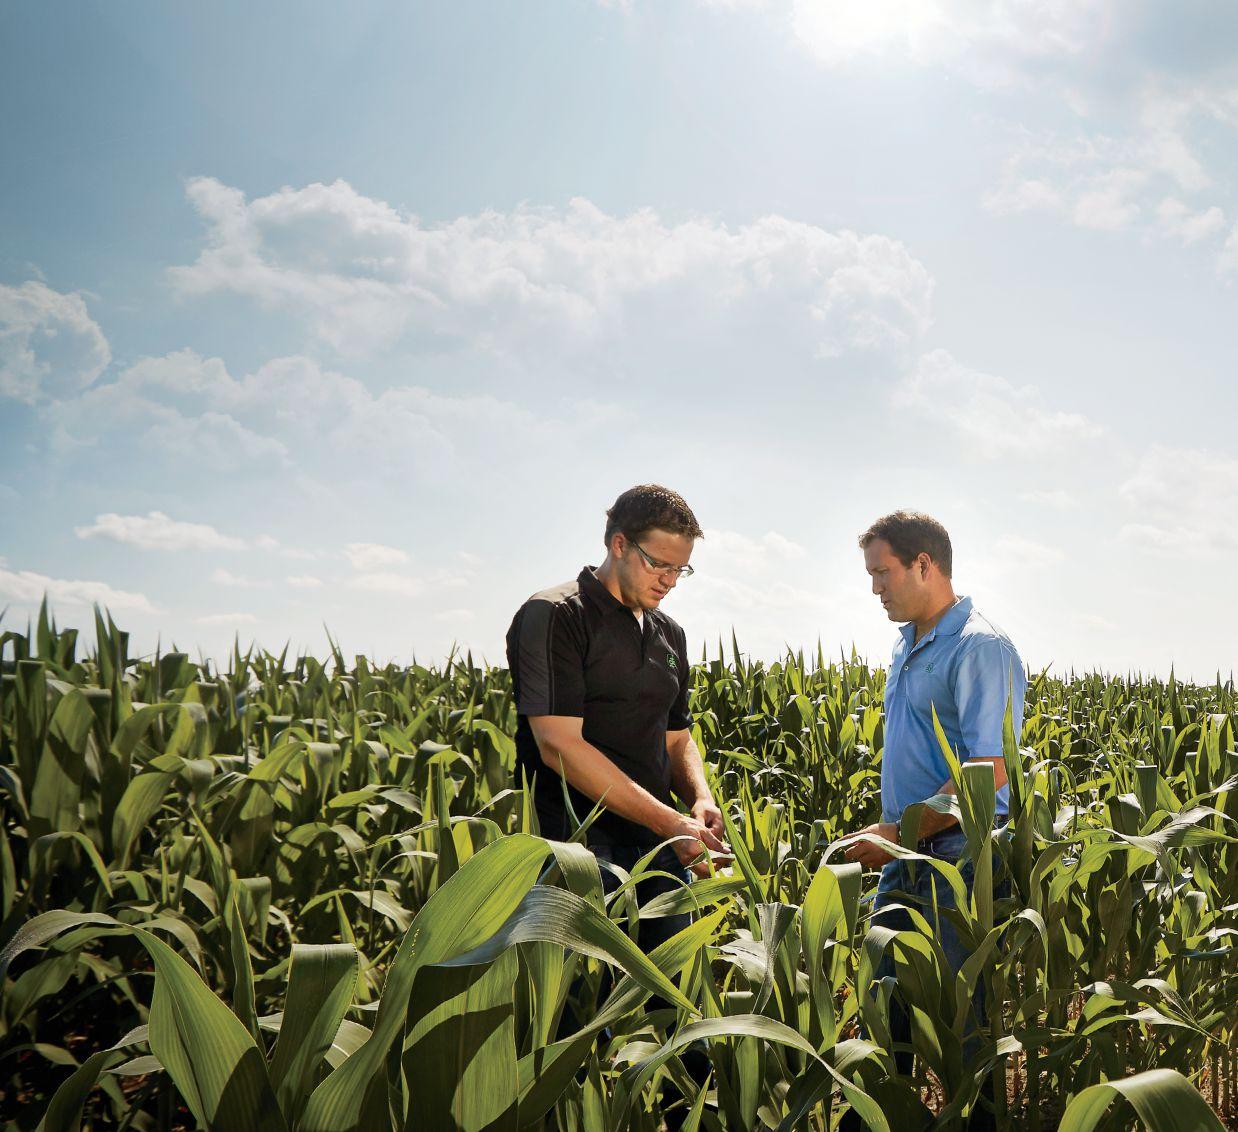
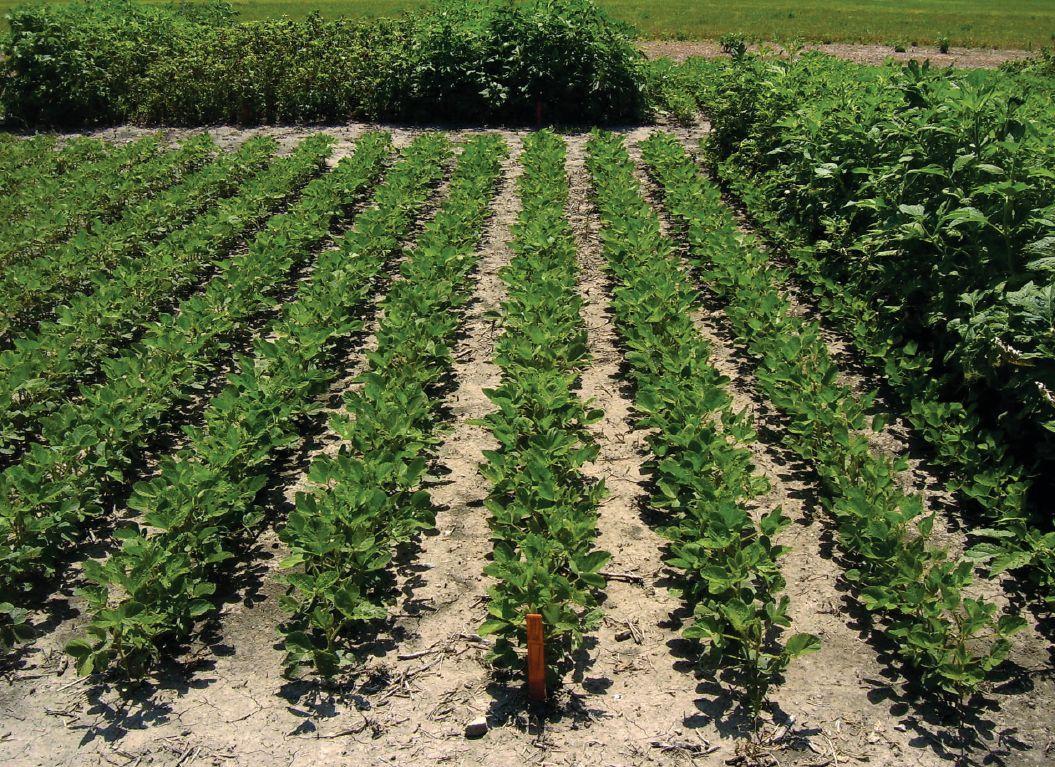
aBOVE: Variable-rate seeding may prove to be advantageous when it comes to yield potential and a profit increase.
Photo courtesy of a aron Breimer.
You’ll never find a Pioneer sales rep with their feet up in an office somewhere. More often than not they’re the person standing right next to you discussing the weather, your soil conditions and your challenges – because, after all, they’re living with them too. This dedication and unique level of expertise helps our reps recommend the right product for each of your acres every year. Talk to your local Pioneer sales rep or visit pioneer.com for more information.
farmer because the most important layer of information is the grower’s knowledge of the farm. “I can utilize all those layers and I can create a zone map. But, ultimately, the grower can tell me where there is a sandy knoll, where there’s a clay ridge and where there is a low area that has poor drainage,” notes Breimer. “That allows me to move things a little bit further. I don’t believe in letting the computer do all of the work.”
The next step is to help the farmer understand how certain varieties will respond to different populations. In most cases, the growers bought their varieties in o ctober, november and December, and Breimer will write the prescriptions for variable-rate seeding in February, March or april.
“Quite often you’re trying to say, ‘o K, this is the variety that you’ve got, how am I going to get the most out of it on your farm?’”
o nce everyone agrees on the zones and the variety information, and the populations have been determined, Breimer assigns the populations to the various zones to create a script file, which is loaded into the planter.
“o nce the planting is done, we pull the as-applied maps and see how well the planter pulled what it was supposed to do from the script,” says Breimer. “Then we set up to prepare for harvest to pull in that data and start analyzing to see how things actually responded.”
according to Breimer’s numbers, variable-rate seeding has netted an increase of $35 per acre under relatively good weather conditions. Some of the results were limited because there were a few farmers who were willing to push the envelope too far.
“o n their best soil, they want to push populations to between 40,000 and 42,000 [seeds per acre],” says Breimer. “We would have had higher than a $35/ acre benefit if I’d been able to convince a few guys not to plant 40,000 in certain areas. They would have been further ahead at 37,000 or 38,000. But they still made money. o n their worst ground where they had been historically putting down 30,000 or 35,000, it was down to 28,000.”
g reg Stewart, corn specialist with the o ntario Ministry of a griculture and Food and Ministry of rural affairs, concurs that there is growing interest
in variable-rate seeding. noting that his work is limited on the practice, he can neither dispute nor support its economic potential.
“I haven’t done enough research to try to counter what the general trend has been – that variable-rate seeding makes you money,” he says.
o n the future of variable-rate seeding, Stewart raises a key question: How do you know if you’re planting the correct rates in the first place? He suggests an automated system is needed that can test the validity of the prescription maps.
“You need some ground-checking to see whether or not those rates are the
right rates,” says Stewart. “If you have a huge area of the field that you’ve coloured pink, the map tells you to plant 38,000, and that’s about all you do. How do you know if the 38,000 was the right thing to do?”
Breimer says such a system was implemented in the scripts for this year. While he can’t share many details for proprietary reasons, Breimer says a check population is dropped in a zone and the software will show how the test strip is performing in the different zones. The product is designed to allow the user to see if the prescription that was delivered is profitable and to learn
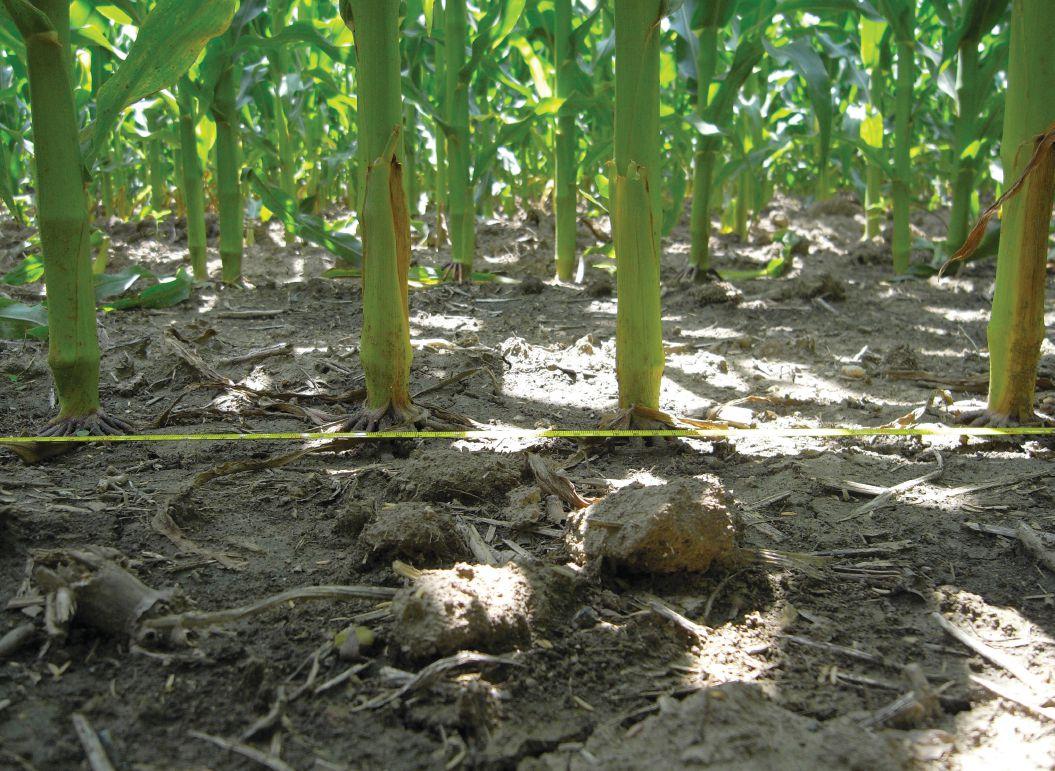
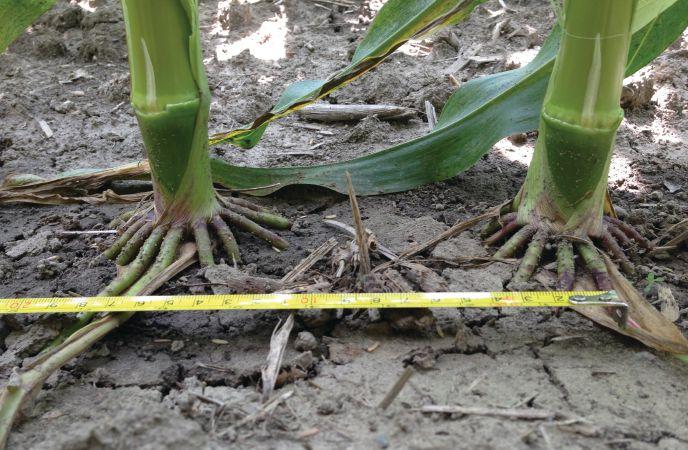
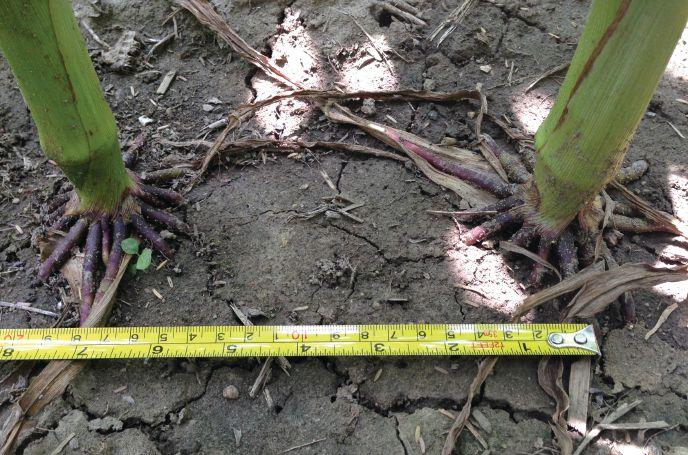
With hydraulic-driven planters, farmers can change the seeding rate from inside the cab, altering the rate or the hybrid from one field to the next if they know the fields have different levels of productivity.
In this field, 34,000 plants/ac is spaced at roughly 6.25 inches apart (top) and 30,000 plants/ac are spaced at closer to seven inches apart (above).
Photos courtesy of a aron Breimer.
from the results.
In addition to varying the rate of populations within the field, there’s keen interest in varying the types of hybrids and planting densities on a zone-by-zone basis.
The idea is to plant the high-performing “racehorse” hybrids in the areas of high productivity while planting the “workhorse” hybrids to stabilize yields in other areas. Stewart sees it as the next level in the discussion about planting higher seed populations. It’s not a question of merely planting more seeds per acre across a field or certain zones, but planting certain hybrids at a higher rate.
How willing farmers are to adopt such a specific approach remains to be seen, but Breimer says farm machinery companies are building equipment to adapt.
“With the multi-hybrid planters coming in the near future, we also will be looking at changing not only population, but also varieties, probably in the next three to five years,” he says.
Besides corn, Breimer also expects to see more interest in variable-rate seeding for other crops. “We’re heavily involved in variable-rate soybeans and variable-rate edible beans, and then tying in variable-rate fertility to match what you’re planning on putting down for populations,” he says.
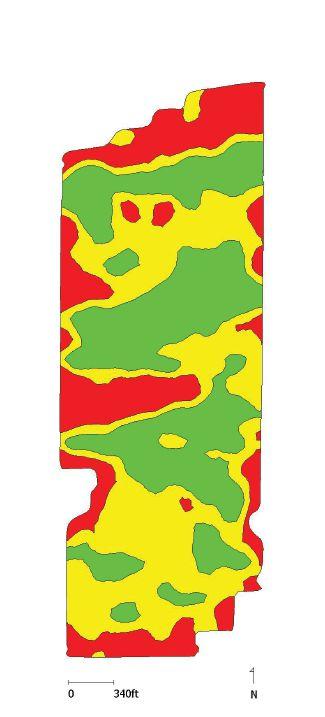
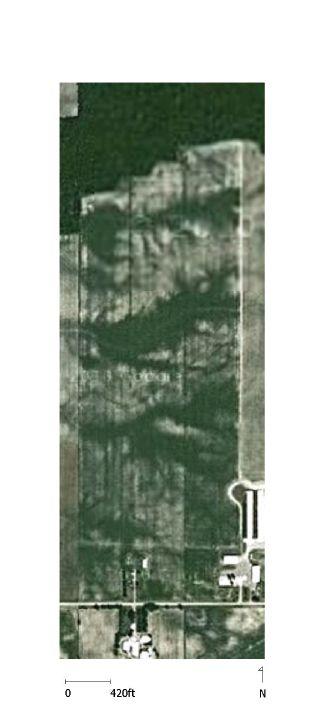
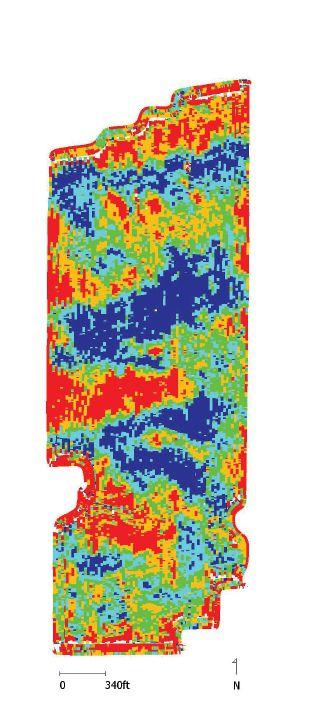
Taken from the same field, these images show the correlation between satellite imagery, the yield data and the prescription for variable-rate seeding, which is created and loaded into the monitor.
dic A mbA-toler AN t
S oybe AN moV i Ng forwA rd
Stacked glyphosate and dicamba tolerant trait may be ready in 2015.
by Bruce Barker
Soybean growers will have to wait another year before they have the option of using a soybean cultivar that is resistant to both glyphosate and dicamba. While Monsanto Canada has received full regulatory approval in Canada for the commercial use of roundup ready 2 Xtend soybeans, the industry’s first biotech product with herbicide tolerance to both glyphosate and dicamba, more global approvals are required before the new cultivars can be commercialized.
“We are making very good progress on completing our final regulatory approvals for commercial use in the United States and for export to China,” says Mark Lawton, technology development lead with Monsanto Canada in guelph, ont.
Lawton says Monsanto has historically sought all necessary export approvals prior to commercializing a product. He says this approach isn’t any different for any technology, chemistry or biotech innovation, and that the last thing the company would want to do is cause marketing issues for Canadian farmers. The company is anticipating all approvals will be ready for the 2016
growing season. “We expect to have a broad maturity range of soybean varieties available for farmers in the launch year,” Lawton says.
The stacked technology will offer soybean growers additional weed control options and the potential to better manage glyphosate resistant weeds. Dicamba is a group 4 herbicide, and this group has not been previously available to soybean growers as an in-crop application.
Dicamba controls over 95 annual and biennial broadleaf weed species and provides suppression of over 100 perennial broadleaf and woody species worldwide. Combining both dicamba and glyphosate tolerance in soybean would give farmers the option of applying roundup WeatherMaX herbicide and low-volatility formulations of dicamba, separately or as a tank mix.
aBOVE: The dicamba/soybean tank mix provided very good control of glyphosate-resistant giant ragweed and Canada fleabane in Roundup Ready 2 Xtend soybean.
Photo
of special interest for ontario soybean growers is the ability to control glyphosate resistant giant ragweed, common ragweed and Canada fleabane. peter Sikkema, a professor and weed scientist at the University of guelph, conducted several years of trials on the Xtend system and found it very effective for the control of glyphosate-resistant giant ragweed, common ragweed and Canada fleabane. glyphosate applied alone as a postemergent treatment in the Xtend system provided less than 50 per cent control of the giant ragweed populations, indicating a significant proportion of glyphosateresistant biotypes were present in the plots. With the addition of dicamba to glyphosate, giant ragweed control increased to 87 to 94 per cent. Similarly, glyphosate alone provided only 32 per cent control of glyphosate-resistant Canada fleabane, while the tankmix of glyphosate plus dicamba applied preplant provided 87 to 97 per cent. The sequential application of glyphosate plus dicamba applied preplant and postemergence provided 95 to 99 per cent control of glyphosate resistant Canada fleabane.
“In our trials, glyphosate plus dicamba provided very good control of glyphosateresistant giant ragweed, common ragweed and Canada fleabane in roundup ready 2 Xtend soybean,” says Sikkema. “I would say the system is a strong performer but I really think it has to be used in an integrated program to maintain the benefits of the technology.”
The Xtend system could also provide soybean growers with the option of applying dicamba in a pre-seed burndown with glyphosate, prior to an in-crop application of glyphosate. This approach would provide residual control to help keep a field cleaner early in the season.
stewardship will be important as with any new technology, prudent use will help preserve the long-term sustainability of the system. rotating herbicide groups and applying multiple modes of action are two components of resistance management.
In Western Canada, this new dicamba option in soybeans will also help growers manage herbicide resistance. glyphosateresistant kochia, which is also resistant to group 2 herbicides, has been identified in southern alberta and Saskatchewan.
fleabane.
With glyphosate-resistant kochia recently confirmed in some areas of Manitoba and Saskatchewan, the option of applying multiple modes-of-action with the Xtend system may help manage glyphosate resistance in these new soybean growing areas, Lawton says.
In an ideal world, Sikkema would like a weed control system in soybean where a soil-applied, pre-plant herbicide other than a group 4 was applied to control grass and broadleaf weeds. a postemergent application of glyphosate and dicamba in the Xtend system would control later emerging weeds.
“There would be excellent weed control early in the season and the number of weeds exposed to the dicamba/glyphosate tank mix would be greatly reduced, which would reduce the selection intensity for glyphosate resistant biotypes,” says Sikkema. “With our crop rotations, this approach would have three or four different modes of action on every acre in every year.”
Sikkema cautions that soil residual herbicides would have to be properly planned in the rotation so that residues wouldn’t hurt subsequent sensitive crops. He says there isn’t a one size fits all, but that the Xtend system could help manage herbicide resistance if planned properly.
Monsanto is also working on stewardship initiatives to help ensure offtarget dicamba drift is minimized during application. The company is developing next-generation glyphosate and lowervolatility dicamba formulations to complement the new crop system. They will provide specific recommendations on nozzle types and application guidelines. Tank cleanout to prevent cross contamination when moving from crop to crop will also be an important message coming from Monsanto.
“What the Xtend system can bring farmers – delivering higher yields with better weed control and expanded weed resistance management strategies – is pretty exciting, but we also understand that we need to communicate how to use the technology in a sustainable manner,” says Lawton.
glyphosate alone did not control resistant biotypes of giant ragweed and Canada
KELDIN GALLUS
‘Soft Red Winter’
112 Yield Index & Great Standability It’s Short, It Stands and It Yields!
Red Winter’ C&M Seeds, RR#3 Palmerston ON N0G 2P0
No Longer Needs a Contract - ‘Opt-In’
111 Yield Index in Area 1 (2013)
Best Winter Survival - Great on Clay!
113 Yield Index in Area 3 (2013)
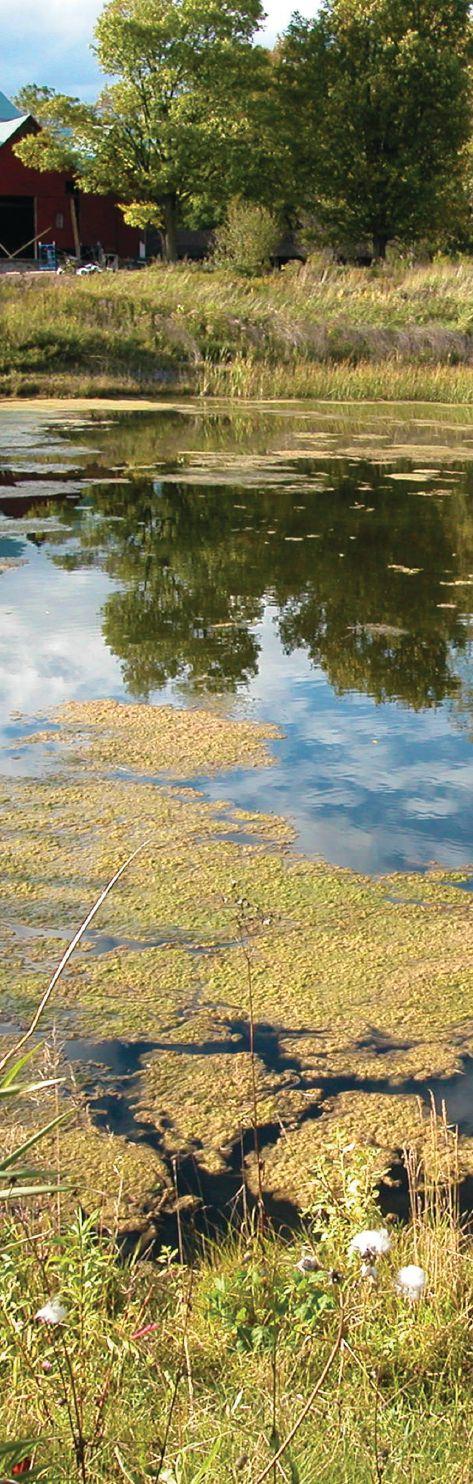
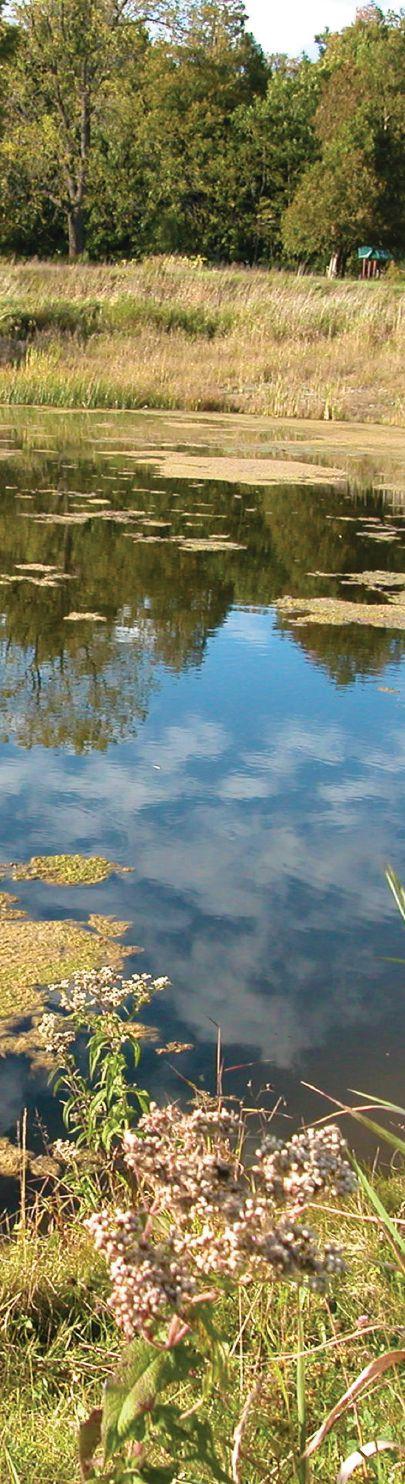
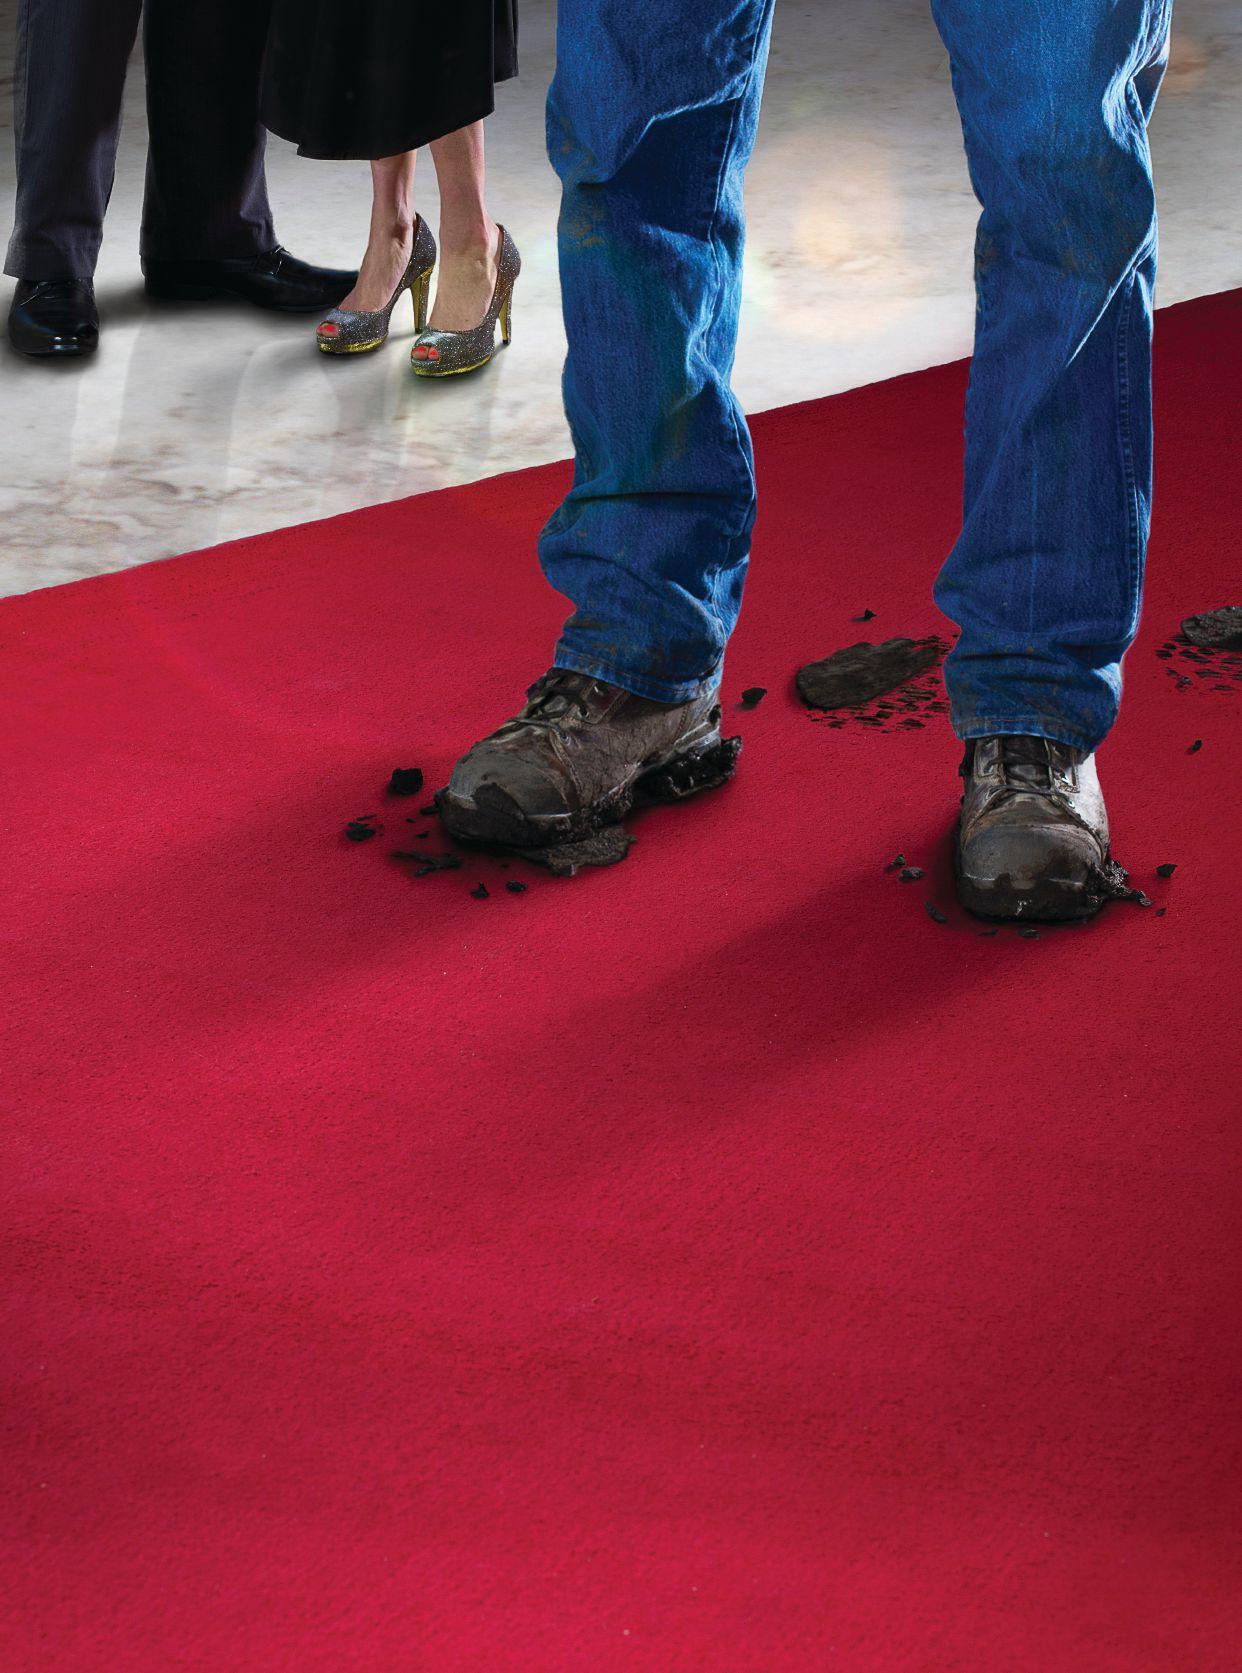
pho Sphoru S : oN the l AN d, Not i N the wAter
A
field-scale tool is in the works to enhance phosphorus management.
by Carolyn King
On a farm field, phosphorus is an essential crop nutrient. But in water bodies, too much phosphorus can cause serious problems, including increased algae growth. algae blooms can result in oxygen depletion, leading to fish kills, and blue-green algae can release toxins into the water. So a project is underway to develop a field-scale tool to help farmers keep phosphorus on the land.
“There has been a lot of talk in the news recently about more algae blooms in Lake e rie. after it had been cleaned up in the 1990s, it’s getting worse again. Lake Winnipeg is having a lot of algae bloom problems. Lake Champlain’s Missisquoi Bay has blue-green algae problems. The culprit is excess phosphorus. and agriculture is in the crosshairs to some extent as being blamed for part of that excess phosphorus,” says Keith reid, a soil scientist with a griculture and a gri-Food Canada ( aa FC) who is leading the project.
He adds, “ e xcess phosphorus in the water doesn’t translate into a terribly large loss from land, but we want to try to reduce that loss to do agriculture’s part in keeping our lakes swimmable and fishable.”
Called project p, this research is funded by aa FC. The tool is being designed for conditions in eastern Canada, and reid is working with several other aa FC research scientists in eastern Canada, as well as provincial government and university researchers in o ntario and Quebec.
The tool aims to predict fields, or parts of fields, at high risk of phosphorus ( p ) loss. reid explains, “If you’re going to ask a farmer to do something, let’s do it where it’s going to be effective, where it’s actually going to make a difference. This tool should identify where the high-risk areas are so farmers can focus their attention on those areas.”
a next-generation phosphorus index
“ e ssentially, we’re looking to improve the phosphorus index,” notes reid. “The p index was developed as a tool to try to identify hot spots – areas with the greatest risk of phosphorus losses from agricultural land. an example would be a livestock operation that has a small land base with fields near a stream, and they’ve been putting their manure on those fields continually and building up the soil test phosphorus. So those fields have a lot of phosphorus that’s
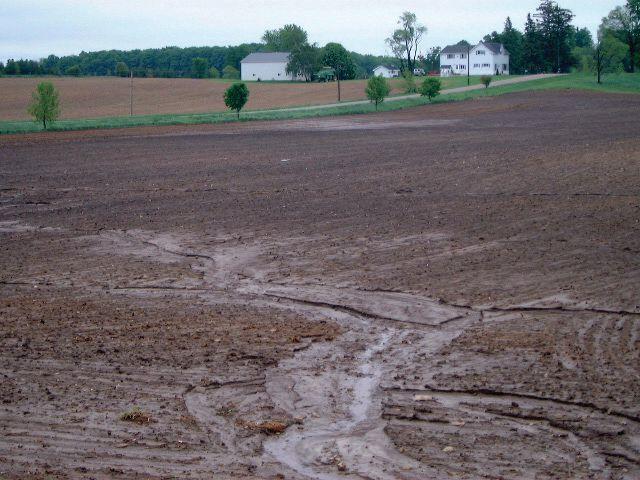
<lEFT: soil erosion is one way phosphorus can move from the land into the water.
<lEFT: High levels of phosphorus in ponds and lakes can lead to algae blooms.
available for loss and easy transport into the water.”
The idea of a phosphorus index was first proposed about two decades ago. Since then, various american states and several provinces, including o ntario, have adopted a p index and adapted it to their own conditions and needs.
“[ o ntario’s] current p index, on a large scale, accounts for most of the risk factors. But no one has taken the time to determine if the index’s predictions compare well with what is actually showing up in the water. The current index also misses some of the factors that are a big part of agriculture in o ntario, including tile drains,” says reid. He stresses that project p is not about creating a new index to replace p indexes that o ntario, Quebec or the atlantic provinces already have. “o ur aim is to provide the scientific background that the provinces can use when they adapt their p indexes.” reid and his research team will be filling some of the information gaps in the current index to develop an improved model. Then they’ll test the prototype model in the field to make sure it works as expected.
Developing and testing the prototype
The researchers are already working on the prototype. “We have been gathering all the information we can out of the scientific literature, from studies in o ntario and in regions with similar climates, soils and cropping systems. We’re examining what those studies are finding, and we’re putting that together in a model,” reid says.
predicting phosphorus loss from agricultural land is challenging because it is influenced by many factors, such as nutrient application rate, placement and timing, soil test p, erodibility of the soil surface, rainfall and snowmelt amounts and surface runoff and subsurface flow patterns, including connectivity with nearby water bodies.
Some practices to reduce the risk of phosphorus loss are already clear. reid notes, “For instance, we know we can reduce the risk by just getting a phosphorus application worked into the soil or subsurface placed, rather than leaving it on the surface. and we know we can reduce the risk by waiting until the ground is dried up in the spring before applying phosphorus.”
But the effect of tile drainage on phosphorus loss is not so clear. “I’ve done comparisons of phosphorus indexes across U.S. states in particular, which have most of the information [on tile drainage considerations], and they treat tile drains as either all good or all bad,” says reid.
Photo courtesy of k eith r eid, aafc
Photo courtesy of k eith r eid, aafc
“The one mindset is: tile drains divert what would be surface runoff into the tiles so you reduce soil erosion. Therefore, tile drains reduce the risk of phosphorus loss. The other mindset is: tile drains have more connectivity between the field and the water, so it is easier for phosphorus applied in the field to move off the field and into the water. Therefore, tile drainage increases the risk of phosphorus loss. But, in reality, both of those are happening simultaneously.”
a s well, he says phosphorus loss in tile
]the water quality is being measured at the mouth of the large river like the g rand river, it won’t be very useful for our purposes; there’s just way too much going on in that watershed. So the field sites need to be up in smaller sub-watersheds,” explains reid.
“and then we have to combine [those criteria] with being able to get the information about the agricultural practices on the land. That will enable us to run the model and compare the results with the water quality data.”
“How can we farm a little bit better to both keep the phosphorus on the land and keep the water clean, and also have a profitable cropping system?”
drains varies with soil type and with the size of the area drained by the tiles.
The researchers hope to have their prototype ready for field testing by the spring of 2015 and to finalize the tool in 2016.
“[In our tool,] we’re trying to simplify many factors so the tool can be used on the farm. We don’t want a tool that requires a whole lot of very complex measurements and inputs before you can run it,” explains reid.
But those simplifications mean the model is being designed to predict general trends, not how many grams of phosphorus will be lost from a field.
“So, in our field testing, if the model identifies an area as a high risk for phosphorus loss, then we would expect to see higher levels of phosphorus in the downstream water. and if it identifies a low-risk area, we would expect to see lower concentrations of phosphorus.”
The researchers are in the process of looking for field sites where they can compare the model’s predictions with what is actually happening. The sites have to meet several criteria.
“We need sites with water quality measurements at a fine-enough timescale that they give a good picture of what is showing up in the water. and the measurements have to be for a smallenough area that we can make some conclusions about what the water quality data mean relative to the land area draining into that stream. For instance, if
]Turning the tool’s results into practical action according to reid, the main users of the tool will likely be nutrient management planners. “We would expect to see the tool incorporated into, for example, [ontario’s] nMan software, once we’re happy with the way the model is working.”
He adds, “I would also hope the model is transparent enough that a farmer could use it, recognizing that some farmers will have an interest and some won’t because they’ve got a lot of other things on their minds.”
reid expects the results generated by the tool will be provided to users in a way that indicates why a certain area is identified as having a high risk of phosphorus loss; for example, whether the risk is mainly due to soil erosion or to phosphorus application factors. That type of information would point the user towards which types of best-management practices would be most effective in reducing phosphorus loss.
He notes, “This project is working in the context of: how can we farm a little bit better to both keep the phosphorus on the land and keep the water clean, and also have a profitable cropping system?”
Sulphur Str Ategie S
Evaluating sulphur on winter and spring wheat in Ontario.
by Treena Hein
Whether or not to apply sulphur on a field has been a topic of hot debate in recent years in ontario –when to add it, how much, in what regions and on what crops are all factors for consideration. Canola is the crop most responsive to sulphur; soybeans are unlikely to respond to extra-added sulphur in ontario soils.
Two centuries ago, when industry started to boom in southern ontario and the neighbouring areas of the United States, sulphur was deposited on the soil through acid rain, so much so that the practice of adding sulphur to fields was stopped during the 1850s. However, sulphate deposition from acid rain and snow has decreased significantly in the past 15 years, says Scott Banks, emerging crop specialist with the ontario Ministry of agriculture and Food and Ministry of rural affairs (oMaF and Mra). This is because of antipollution legislation being passed, the availability of better air quality technology, and the recession – which some say is the biggest factor in decreasing the amount of sulphur coming down from the skies.
Sulphur (S) application also needs a close look these days because
fertilizers, insecticides and fungicides are cleaner, and contain less incidental S. There have also been some long-term decreases in livestock farming in ontario, which means fewer fields are receiving S through manure applications, and ever-increasing crop yields means more S and other nutrients are being removed from the soil.
Whether S needs to be added to particular soils is dependent on a few factors. Soil tests are not terribly helpful, however, in determining what to do, because S cycles from soil organic matter into the soil solution and back again. In other words, part of the time it’s unavailable. In soils with a lot of calcium, sulphur combines with the calcium atoms, goes back into solution and back to binding with calcium again, depending on how much calcium is present, the type of soil, and whether or not the sulphur is exposed to the open air.
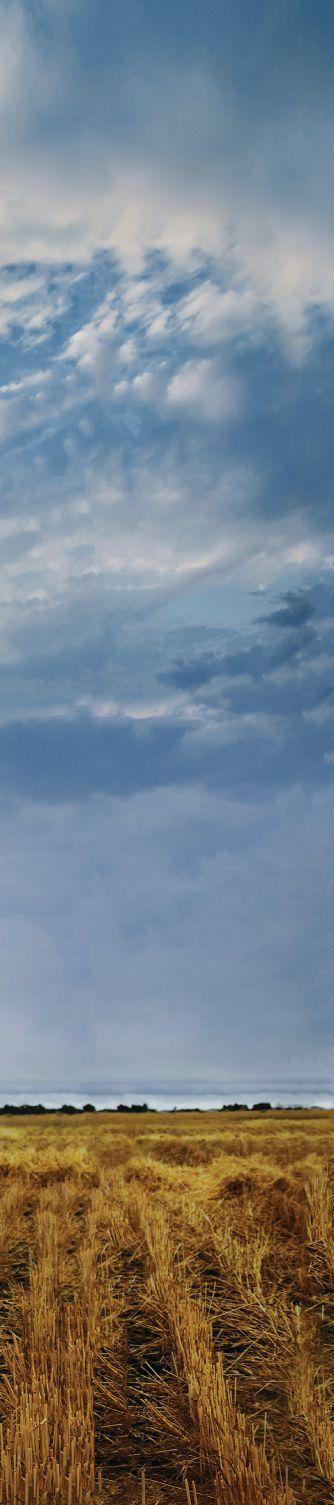
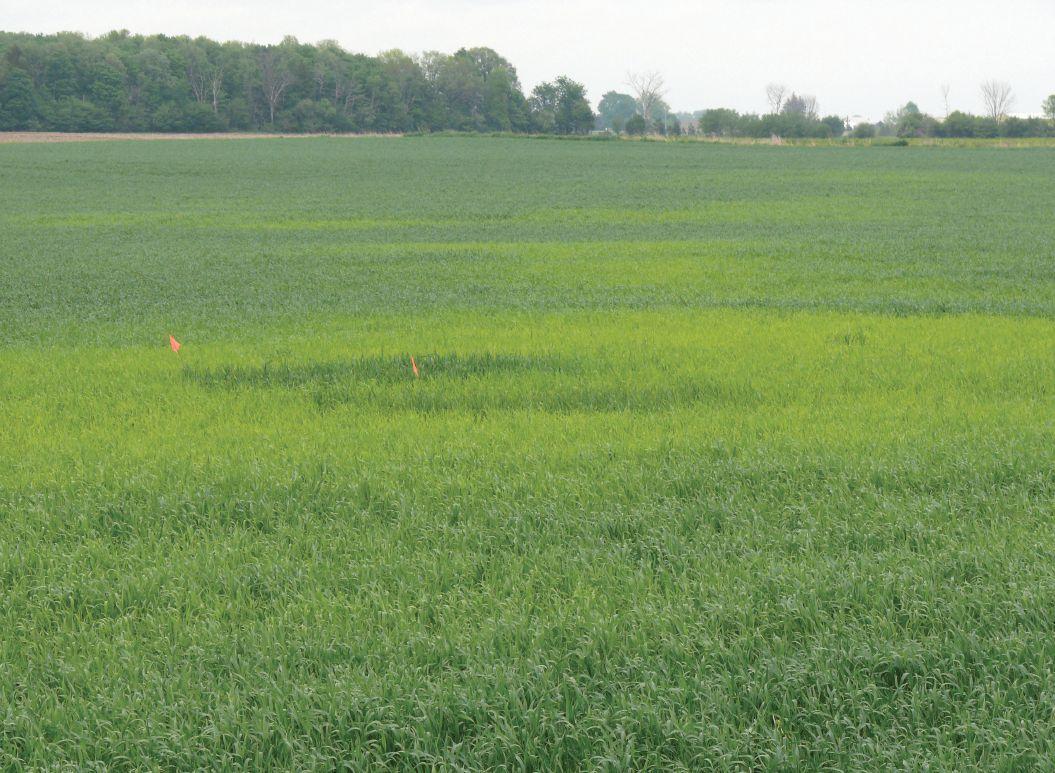
aBOVE: sulphur was applied in this demonstration field to evaluate the yield benefit and economics of the practice.
Photo courtesy of Peter Johnson, omaf
m ySteriou S mycotoxi NS
Grain storage management is critical to control.
by amy petherick
As a child, the scariest thing about the Boogeyman was that he was hiding so close by that he could attack at any minute but couldn’t be seen. Until recent discoveries by researchers, some mycotoxins had escalated to the same mythical proportions for almost the exact same reasons.
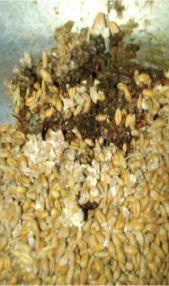
playing the role of the monster-under-the-bed in this case is a mycotoxin known as ochratoxin a, and any farm with grain storage could be producing it, according to Dr. art Schaafsma, a researcher at the University of guelph’s ridgetown Campus. Schaafsma is working with Victor Limay-rios to complete a four-year study of the known carcinogen in ontario grain storage, which has had him analyzing 30 to 40 grain bins a year in the province. He says that when he started looking for spores, indicating the presence of the penicillin relative that produces the toxin, he found spoilage fungus in abundance.
“You can find that inoculum everywhere, but originally, it came from the soil so there are places where we find more of it,” Schaafsma explains. “Manholes, doors, openings where there are air leaks and water getting in – that’s where the spore load is higher.” He says they also found that grain that has not touched the soil and was standing at harvest did not the have inoculum on it. “We did find a lot more inoculum on grain coming from heads in lodged crops or when the wheat field had been sprayed during heading and crop was tramped,” he adds. Basically, any wheat that has touched the ground will be loaded with spores.
Fortunately, Schaafsma has also found out that although spores can be present, the fungus will never generate without the right conditions. “oddly enough, we’ve found ochratoxin in two of the many bins we’ve looked in, in the last three years,” he says. “So we’ve had six hits in three years . . . out of a whole pile of bins.”
With such sparse results, a budget-conscious researcher like Schaafsma ought to have concluded his study years ago. To
understand why the study is still ongoing, he says, consider what instigated the research in the first place.
The ochratoxin hazard
In December 2009, Heinz Canada voluntarily recalled a baby cereal product after the Canadian Food Inspection agency found elevated levels of ochratoxin a. parents were simultaneously urged to inspect their pantry carefully, discard product lots immediately, and not worry if the cereal had already been fed to their child. as confusing as that may have been for consumers, it was downright bewildering to the food processing industry. “raw cereal grains in ontario were fingered,” Schaafsma recalls, “but most of the grain in this infant food production is coming from the west.” Wheat suppliers faced accusations but Schaafsma says that made little sense when oats posed the biggest ochratoxin concerns, by far.
academics and international regulators, like Dr. David Miller, couldn’t find much common ground amongst themselves either, Schaafsma adds. Miller is a toxicologist who works at Carleton University in ottawa and is one of those individuals that world health associations call on for expertise when it comes to mycotoxins. He says the problem with ochratoxin, unlike a mycotoxin like deoxynivalenol (Don), is twofold. “ergot, vomitoxin, aflatoxin and zeralanone were all discovered because they made humans sick,” he says. “But ochratoxin suffers from the fact that we don’t know as much about it as we would like.”
Currently, risk assessment evidence can only suggest the toxin has carcinogenic potential rather than confirm whether it is a known or even probable cancer-causing agent. Some
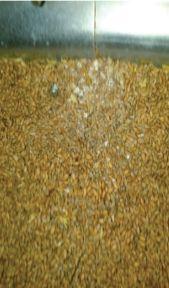
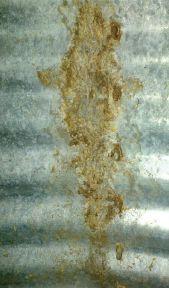
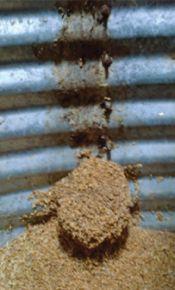
aBOVE: spores can be present in storage bins, but the fungus will never generate without the right conditions, so best management practices are key.
Photos courtesy of Victor Limayr ios.
countries, particularly those in europe, have decided to treat the mycotoxin with extreme caution anyway and have established import restrictions Schaafsma says can get as low as 0.5-1 part per billion (ppb). Following the Heinz recall, Health Canada made the unpopular decision to venture into discussions about implementing similar regulations. “The european approach to regulating ochratoxin is not universally accepted,” he says. “This would be the first time a toxin is regulated that we don’t have any sure link to human disease.”
Miller adds that the logistics of finding it present the other side of the ochratoxin hazard. “It’s a one-in-5,000-kernel problem,” he says – not to mention the fact that one kernel is visibly undetectable. But he says the good news, as Schaafsma is confirming, is that all surveillance efforts across the country have been proving that Canada produces really great grain on the whole. Which has put an end to regulation discussions for now. “The question is though, are there little failures here and there that really need to be prevented on the farm? The answer is yes,” says Miller, “and that’s what art’s work is about.”
Establishing best management practices
Miller believes the great opportunity that has emerged from Schaafsma’s research is a much better understanding of the
Sulphur StrAtegieS
CONTINuED FROM pagE 21
However, soil testing for S at the same time every year may provide a sense of any long-term trend. Soil pH is not a factor that affects sulphur availability to crops, and results of studies looking at S and soil type have been inconsistent. plant tissue sampling looks to be better at determining S deficiency. Banks has been conducting trials to help with decisions relating to the application of sulphur for winter and spring wheat.
“We are evaluating the yield benefit and the economics,” he says.
“The project farm co-operators include Mark McFaul, Henry nyman and John nanne, the ontario Soil and Crop Improvement association (oSCIa), and oMaF field crop technician Victory Yuill.” Local agri-business suppliers have provided other support. at each field location in ameliasburg, Wellington and pakenham, two treatments were employed – no S and S (20 kg/ha of available S), with equal amounts of total nitrogen (urea) applied as per the normal field recommendation. Soil samples were taken and harvest was conducted on adjacent strips. plant tissue samples were collected for analysis from the ameliasburg and Wellington sites at last-two leaves emergence (Zadok’s Stage 37 to 39) in early June 2013. at the Wellington site, there was a 4.5 bu/ac increase in average in grain yield in the winter wheat with S application, the only site to show a yield gain. grain yield in ameliasburg showed a lower average yield of 2.3 bu/ac with the S application compared to no S. “This lower yield is most likely due to field variability,” Banks explains. “The pakenham site was hard red spring wheat and resulted in no yield difference. The addition of S did not result in any significant difference in either grain test weight or protein content.” Soil samples were taken in ameliasburg to compare S and organic matter levels at zero to six-inch depths.
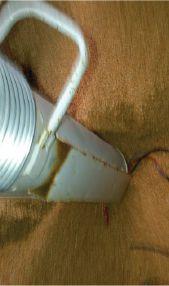
details farmers can take care of in their storage that will improve the already extremely good quality of the grain that exists in Canada. Schaafsma says this is because they’ve been able to correlate physical indicators directly with the presence of the toxin. “Basically we’re very confident it has to do with moisture during storage,” he says. “It doesn’t have to be in a warm period, most often it’s a freeze-thaw thing.”
During a cold snap of -10 C temperatures over several days, for example, a farmer will ventilate like crazy to cool a grain pile down. Since the pile cools from the bottom up, this creates warm, moist air that has to get out somewhere. Schaafsma says he has found bin downspouts act like a chimney at the top of the bin, and the wet grain he’s finding toxin in is coming from where water condenses then drips down into the centre of the pile. alternatively, if there’s a bolt missing in the bin where a lot of snow and ice can get in, these can form hot spots too. Schaafsma says if farmers eliminate these hot spots, they eliminate the chances ochratoxin ever forms in the first place.
“Sampling and analysis is already bad enough for vomitoxin, which you’re trying to manage at a one parts per million,” he says, adding that much like the Boogeyman, once rational thinking, best management practices and good science shed light on this situation, the worry becomes manageable.
The plant tissue analysis was inconclusive. “We currently don’t have an established critical value for S in plant tissue in ontario,” notes Banks. “There is some research from australia that shows the critical value for wheat plant tissue collected at the stage we collected is 0.3 per cent. We got that 0.31 at the ameliasburg site where we did not apply S, and 0.35 where S was applied. as both treatments were above 0.3 per cent and there was no yield advantage at this site to applied sulphur, the critical value of 0.3 per cent may be a good indicator.”
However, at the Wellington site, the no-S-applied plots had a sulphur tissue level of 0.26 per cent, and 0.27 where S was applied. “That both of these are below the 0.3 per cent level indicates that insufficient S was present, even with the additional 20 lbs/ac of sulphur,” Banks says. “More tissue sampling needs to be done to validate what the critical value is for sulphur in this region of Canada.”
Banks notes that the Wellington site features a stony loam soil type whereas the ameliasburg site is a stone-free, loam to clayloam and the pakenham site is a clay-loam soil type. “Because S is a soluble nutrient similar to nitrogen, the courser-textured soils such as that found at the Wellington site may be more prone to S loss due to leaching. Both the ameliasburg and pakenham sites have a history of manure and high soil organic matter levels of four per cent or greater. This may explain why there was no response to added S at the ameliasburg and pakenham sites. The greatest response to sulphur seems to be at sites that have not had a history of manure and are low in organic matter.”
The project is being repeated again this season. “We have also expanded the number of sites and the number of tissue samples in order to gain further insight into the critical value for S,” Banks says.
hA rd red
whe At
Understanding how fungicide use and N application lead to increased yields.
by Treena Hein
Many ontario wheat farmers already know about recent research showing increased wheat yield resulting from the combined use of fungicides and nitrogen, but more results are now available.
“previous research had focused on soft winter wheat,” says peter Johnson, provincial cereal specialist with the ontario Ministry of agriculture and Food and Ministry of rural affairs (oMaF and Mra). “It was unknown if hard red winter wheat (HrW), which is generally lower-yielding but higher in protein, will respond in the same manner.”
To find out, Johnson and his colleagues conducted trials from 2011 to 2013 to determine the yield, protein potential and economics of growing HrW under a nitrogen-by-fungicide management regime. The team included ontario Soil and Crop Improvement association staff Shane McClure (technician), Marian Desjardine (administrator), and Ken Janovicek (statistician), as well as oMaF summer assistants. Financial support was provided by agriculture and agri-Food Canada through the Canadvance and Farm Innovation programs, grain Farmers of ontario, many provincial soil and crop improvement associations and private companies.
Seven sites across southwestern ontario were used in 2011, with six in 2012 and five in 2013. There were four treatments in the study: 90 lbs n with no fungicide, 90 lbs n with two fungicides, 150 lbs n with two fungicides and 180 lbs n with two fungicides. In 2012 and 2014, 120 lbs n treatments were added or replaced the 90 lbs n treatments to better represent grower practices. The first fungicide was applied at weed control timing (T1) and the second fungicide was applied at anthesis (T3, two to five days after heading). a plant growth regulator was applied at six sites to prevent lodging. “We took leaf disease ratings at both T1 and T3, head disease ratings at late grain fill, and lodging score prior to harvest,” Johnson explains. “at harvest, we measured yield, moisture, test weight, thousand kernel weights, lodging and protein.”
It turned out that almost 80 per cent of trial locations had a profitable yield response from applying fungicide, replicating previous soft wheat study results. “That’s without considering the benefit of Fusarium protection and potential quality impacts,” Johnson explains. “The yield data from 2013 shows just how massive yield response to fungicide can be in a year with high Fusarium pressure. Three of the four sites that year (the fifth site had no treatment without fungicide) had a yield response of over 13 bu/ac.”
The average bushel advantage of fungicide use over the entire study was 8.3 bu/ac. “The cost of applying two fungicides is approximately $30 per acre,” Johnson notes. “at a HrW price of $7 per bushel, only a 4.3 bu/ac gain is required to cover costs.”
With regard to n cost return, the addition of 60 units of n (150 lbs instead of 90 lbs) coupled with fungicide increased yields 5.2 bu/ac, and if n costs $0.49/lb ($500/t urea), that’s an additional cost of $29.58 per acre for an additional 60 lbs n. “Current wheat prices require 4.9 bushels to pay for this extra n,” Johnson explains. “But this calculation ignores the impact of increased protein levels, and that the yield response from increased n was variable across locations. The average outcome is break-even solely from a yield perspective, but is better in some locations.”
almost all sites had an economic advantage when n was increased from 120 lbs to 150 lbs with fungicide applied. There was little benefit found in increasing n from 150 lbs to 180 lbs. “We achieved maximum economic yield at 150 lbs n, requiring only 2.4 bu/ac to cover the added cost,” Johnson notes. “Most sites had an increased economic return with 150 lbs n, while the remainder broke even.”
In Johnson’s view, the most important impact of this trial could well be the increase in protein levels. a limited data set from the study shows that HrW approaches maximum yield with 150 lbs n, but protein levels continue to rise with n applied above that rate. an additional 60 lbs n/ac to 180 lbs n increased protein level by a full one per cent over the 120 n plus fungicide treatment on average (variable across locations). protein levels increased 0.6 per cent from 120 lbs n to 150 lbs n, again making 150 lbs n appear to be the “sweet spot.”
The economics of this increased protein can significantly change the profitability picture, Johnson points out. “Using average protein values from the trials, 120 lbs n would not achieve any protein premium. at 11 per cent protein, many purchasers add an additional $5/t price premium (with an extra $15/t for greater than 12 per cent protein). Using this value would add another $20 per acre income from the additional n. as increased yield was at the break-even level, this protein premium would be all profit, making the increased management inputs significantly more viable. about two-thirds of the locations had an economic advantage by increasing from 120 lbs n to 180 lbs n when additional revenue from both yield and protein are considered.”
Johnson encourages growers who have not had lodging concerns in the past to try increasing n on HrW to 150 lbs/ac on a couple of strips to see what the response will be on their farms. “Standability has been extremely good at almost all locations considering that the majority of the sites did not use a growth regulator,” he says, “but just remember to always use caution when increasing n rate.”
This year, Johnson and the team are studying split nitrogen applications on HrW in conjunction with Dr. David Hooker and the team from the University of guelph’s ridgetown Campus. The hope is that split applications will have even more protein boost for HrW, he says –the “achilles heel” of this crop over the last few years.
The next generation of Canadian agricultural leaders is growing, and CABEF is proud to support them. Congratulations to these six exceptional students who have won $2,500 CABEF scholarships. Based on their applications, the future of the agriculture industry is in great hands.
Six more $2,500 scholarships will be awarded to grade 12 students in April 2015.
Donald Bertagnolli Rocky Mountain House, Alberta
Danean Edgar Wolseley, Saskatchewan
Michelle Ross Grenfell, Saskatchewan
Colleen Crunican Denfield, Ontario
Stephanie Dousselaere Cartwright, Manitoba
Mario Roy St-Jules-de-Beauce, Québec
Se A rchi Ng for S olutioNS
Tweaking the Greenseeker for Ontario wheat.
by Blair andrews
Ontario crop researchers are putting the greenseeker technology under the microscope to see if it can work for the wheat crop.
They’re testing its ability to analyze the nitrogen (n) needs of the crop, which would help farmers apply the right amount of fertilizer.
peter Johnson, provincial cereal specialist with the ontario Ministry of agriculture and Food and Ministry of rural affairs, along with Dr. David Hooker of the University of guelph, ridgetown Campus, is leading trials to adapt the system to ontario’s conditions.
Johnson’s goal is to increase profits for farmers by applying higher n rates to areas where the crop will respond while reducing the rates where there’s a lower response.
“at the end of the day, we’re trying to figure out how to have better-targeted nitrogen applications, more yield where possible, less environmental impact where the yield doesn’t have that potential, and more dollars in the grower’s pocket,” says Johnson.
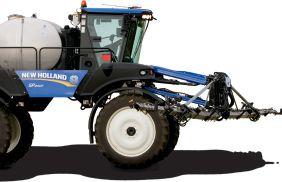
The greenseeker system from Trimble agriculture uses optical sensors with an integrated application system to measure crop status
and variably apply the crop’s nitrogen requirements. The technology works in real time, allowing the operators to make variable rate applications on the go. The sensor uses light-emitting diodes to generate red and near-infrared (nIr) light. The light is reflected off of the crop and measured by a photodiode at the front of the sensor head. red light is absorbed by plant chlorophyll and healthy plants absorb more red light and reflect larger amounts of nIr than those that are unhealthy.
The reflectance values are used to calculate the normalized Difference Vegetation Index (nDVI), which is an indirect measurement of the crop’s above-ground growth. By comparing the nDVI of the crop being evaluated to that of an n-rich strip in the field, the technology can be used to respond to field variability.
as the applicator moves across the field, a built-in microprocessor
aBOVE: a 120-foot boom equipped with six greenseeker sensors moves through a wheat field. The system senses the colour and biomass of the crop and sends a signal to a rate controller to adjust product rates up or down.
Photo courtesy of Phi L n eedham.
analyzes the nDVI readings and determines the n requirements that are needed to meet full yield potential. pre-determined algorithms calculate the amount of n required. The information is relayed to the rate controller to provide variable rate n application in real time as the applicator moves across the field.
ontario researchers are working with an algorithm that was created at the University of Kentucky for soft red winter wheat. Johnson says the trials have been designed to evaluate the algorithm and adapt it to ontario field conditions.
according to previous research in ontario’s fixed rate trials, the wheat crop shows a response to 150 pounds of nitrogen 60 per cent of the time. With the greenseeker’s ability to vary the application rate, Johnson is hoping to apply less nitrogen but still match the yield response of a 150-pound application.
In the first year of the trials in 2013, the system didn’t produce a positive economic response. Johnson suspects that they didn’t set the target rate high enough.
“In many fields, a fixed rate with a higher rate than what a greenseeker applied was our most economical rate,” he says.
The target was set at a higher rate in 2014, but Johnson was not comfortable with the much higher amount of nitrogen that was applied, which reached 200 pounds in some areas.
While it didn’t achieve the desired results, Johnson is still intrigued by the system.
“I would look at the field, walk it and see a nice uniform field, and then you get the nDVI map and there were all kinds of differences,” says Johnson. “How real are those differences? We don’t know that.”
Dr. Lloyd Murdock, a soil specialist at the University of Kentucky, had a similar experience when writing the algorithm. Murdock received a grant to run experiments with the greenseeker, which was developed at oklahoma State University.
Murdock says farmers were generally doing a good job of estimating the amount of n needed for the crop by counting the tillers and looking at the colour.
The method, however, is highly subjective and doesn’t address the variability in the field. “You have an instrument that could actually look at the crop and see what it is doing and make that assumption, not on a subjective factor, but on the factor on how it has grown and what it’s done,” says Murdock.
He evaluated the technology using algorithms developed in Virginia and oklahoma. Calling the initial results “oK,” he notes that they couldn’t beat the results of the old system.
The researchers applied less n using the two algorithms, but the yields were lower. “When we did the economics, we were getting less money. So it became apparent to us that the algorithm has to be a regional thing,” says Murdock.
In a process to regionalize the system for Kentucky (which took approximately four years), the researchers conducted several small plot trials with different rates of n applied at different times around the jointing stages of the crop. They used hand-held greenseeker units to record the readings that were then used to develop the algorithm and realize the technology’s potential of applying n more effectively. The algorithm was then tested on farmers’ fields and was found to be better than the old method by raising the yields and economic returns.
“Two years ago, when we had a lot of n carryover from a poor corn crop and lodging of the wheat plant . . . that year was terrible,” recalls Murdock. “But if you used the greenseeker, it picked up that difference and didn’t put much n on. It’s based on the fact the technology
is better than our eyes.”
With a yield gain of about five to seven bushels per acre, Murdock notes that the $20,000 greenseeker system isn’t for everyone. Farmers who have 1,000 or more acres and who plant wheat every year would be more likely to see a quick return on the investment.
Johnson’s team is also seeking ways to regionalize the algorithm for ontario. They’re using hand-held units to record nDVI readings from sites that have received various amounts of n, a method similar to the Kentucky algorithm. The results would then be correlated with the yields.
“If we get enough of these sites, maybe we can actually find out what that curve should look like under ontario conditions,” adds Johnson.
another important factor is to ensure that nutrients such as sulphur and manganese aren’t deficient. The ontario researchers learned that the greenseeker will read them as a nitrogen deficiency and apply n where it won’t help at all. “We need to make sure that we solve those issues before the greenseeker technology is going to do what we want it to do,” says Johnson.
In addition to the greenseeker technology, they’re also flying unmanned aviation vehicles with multi-spectral cameras to see if that might be a more effective way of gauging the variability in the fields.
“putting a prescription map into an applicator might be just as effective, or even more effective than trying to read it on the go because there is always the challenge of the lag time between the sensor readings and when we change the rate,” says Johnson. “It’s quick, but is it quick enough? There are lots of questions we’re still trying to address.”
Trait Stewardship Responsibilities Notice to Farmers
Monsanto Company is a member of Excellence Through Stewardship® (ETS). Monsanto products are commercialized in accordance with ETS Product Launch Stewardship Guidance, and in compliance with Monsanto’s Policy for Commercialization of Biotechnology-Derived Plant Products in Commodity Crops. Commercialized products have been approved for import into key export markets with functioning regulatory systems. Any crop or material produced from this product can only be exported to, or used, processed or sold in countries where all necessary regulatory approvals have been granted. It is a violation of national and international law to move material containing biotech traits across boundaries into nations where import is not permitted. Growers should talk to their grain handler or product purchaser to confirm their buying position for this product. Excellence Through Stewardship® is a registered trademark of Excellence Through Stewardship.
ALWAYS READ AND FOLLOW PESTICIDE LABEL DIRECTIONS. Roundup Ready® crops contain genes that confer tolerance to glyphosate, the active ingredient in Roundup® brand agricultural herbicides. Roundup® brand agricultural herbicides will kill crops that are not tolerant to glyphosate. Acceleron® seed treatment technology for canola contains the active ingredients difenoconazole, metalaxyl (M and S isomers), fludioxonil, and thiamethoxam. Acceleron® seed treatment technology for soybeans (fungicides only) is a combination of three separate individually registered products, which together contain the active ingredients fluxapyroxad, pyraclostrobin and metalaxyl. Acceleron® seed treatment technology for soybeans (fungicides and insecticide) is a combination of four separate individually registered products, which together contain the active ingredients fluxapyroxad, pyraclostrobin, metalaxyl and imidacloprid. Acceleron® seed treatment technology for corn (fungicides only) is a combination of three separate individually-registered products, which together contain the active ingredients metalaxyl, trifloxystrobin and ipconazole. Acceleron® seed treatment technology for corn (fungicides and insecticide) is a combination of four separate individually-registered products, which together contain the active ingredients metalaxyl, trifloxystrobin, ipconazole, and clothianidin. Acceleron® seed treatment technology for corn with Poncho®/VoTivo™ (fungicides, insecticide and nematicide) is a combination of five separate individually-registered products, which together contain the active ingredients metalaxyl, trifloxystrobin, ipconazole, clothianidin and Bacillus firmus strain I-5821. Acceleron®, Acceleron and Design®, DEKALB and Design®, DEKALB®, Genuity and Design®, Genuity®, RIB Complete and Design®, RIB Complete®, Roundup Ready 2 Technology and Design®, Roundup Ready 2 Yield®, Roundup Ready®, Roundup Transorb®, Roundup WeatherMAX®, Roundup®, SmartStax and Design®, SmartStax®, Transorb®, VT Double PRO® and VT Triple PRO® are trademarks of Monsanto Technology LLC. Used under license. LibertyLink® and the Water Droplet Design are trademarks of Bayer. Used under license. Herculex® is a registered trademark of Dow AgroSciences LLC. Used under license. Poncho® and Votivo™ are trademarks of Bayer. Used under license. All other trademarks are the property of their respective owners.
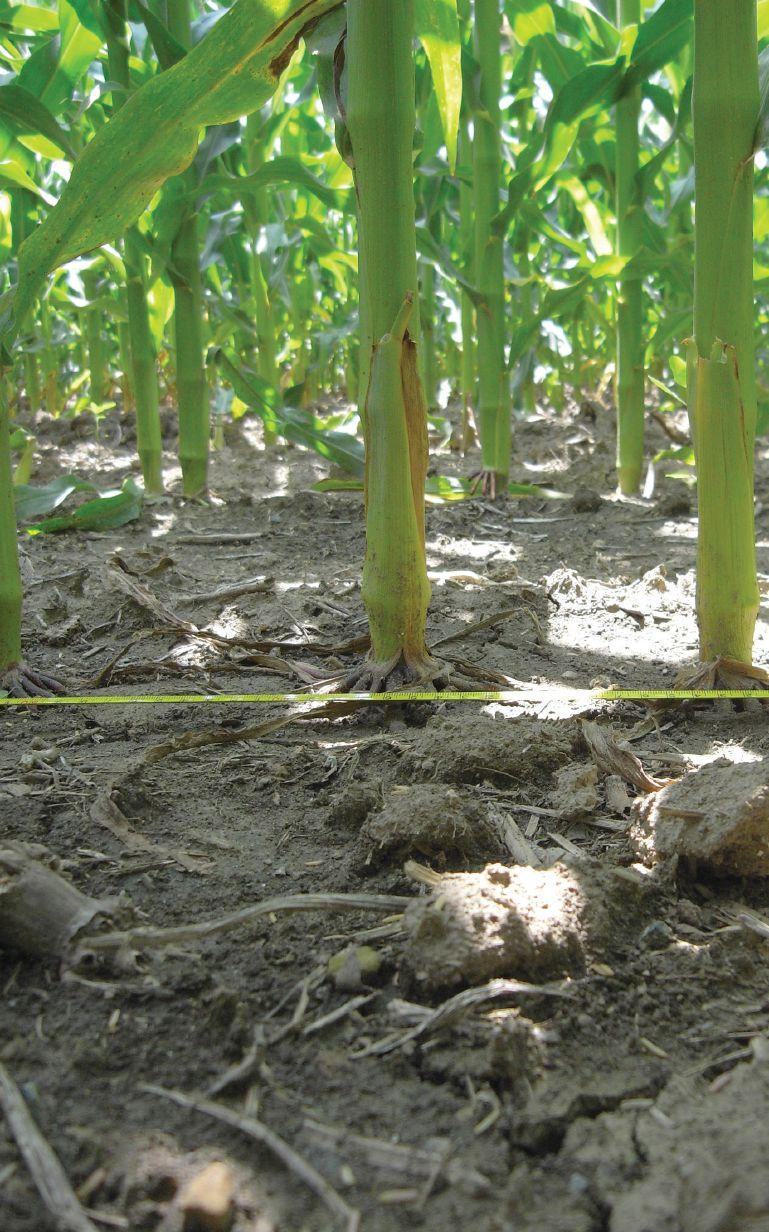
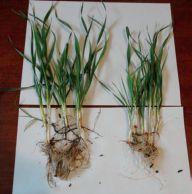
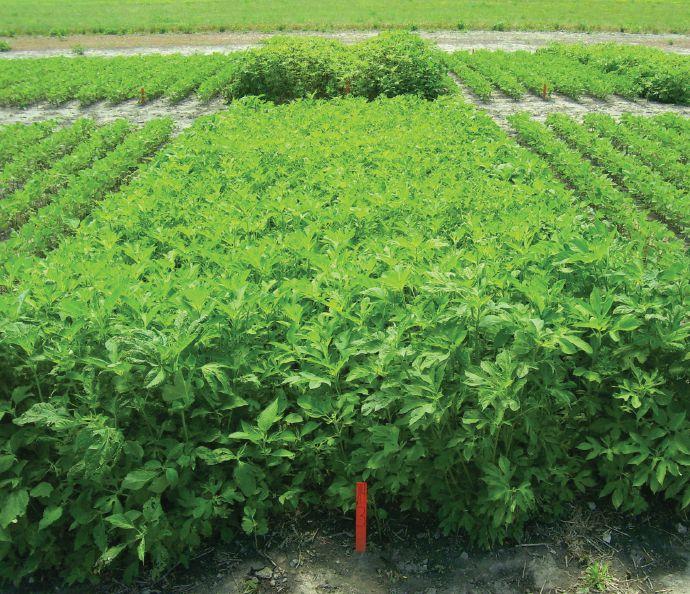
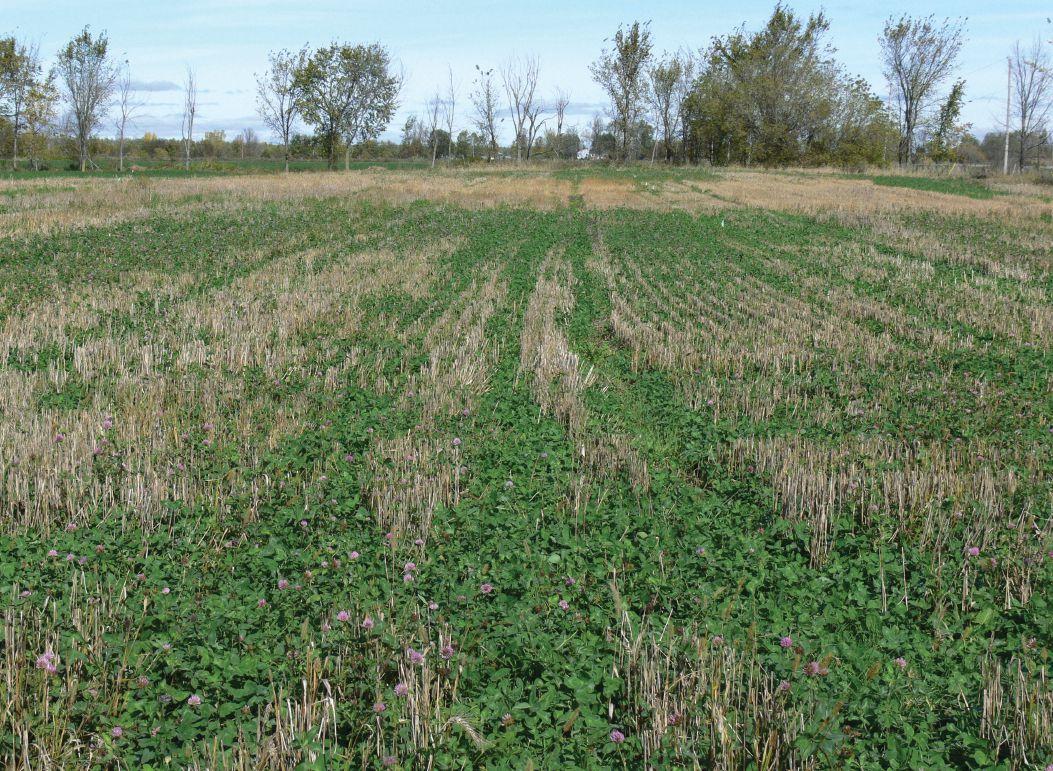
A profitA ble i Ncre ASe
Spring wheat underseeded in red clover proves to be a beneficial strategy.
by amy petherick
Too many variables often make it difficult to recreate the same effective strategy year after year in agriculture. But researchers and farmers are persevering in their efforts to find reliable tactics that work, and have managed to do so again with a study that indicates underseeding red clover in spring wheat can add up to an extra $100 per acre advantage for the following year’s corn crop.
The findings were produced by Scott Banks, the emerging crop specialist based with the ontario Ministry of agriculture and Food and Ministry of rural affairs office in Kemptville, ont. The project was started at the Winchester research Farm back in 2009 – at first as a regionally significant trial – but now offers implications for farmers across the province, he says. although spring wheat accounts for a much smaller portion of wheat production in ontario (just 80,000 acres were harvested in 2013 compared to more than one million acres of winter wheat), the eastern part of the province traditionally grows more spring
wheat than winter wheat. of all the acres grown in ontario last year, 37,000 acres of spring wheat was produced in eastern counties, while winter wheat production only accounted for 25,000 acres. growers say winters, especially in far eastern ontario, are too hard for winter wheat production to be consistently reliable. Most of the growers that are still growing spring wheat are yielding 60 to 80 bu/ac. There is a strong straw market in this area, in addition to the rotational advantages. red clover has the added advantage of improving soil health and fixing nitrogen for the next year’s corn crop. But Banks says spring wheat growers have become reluctant about the practice.
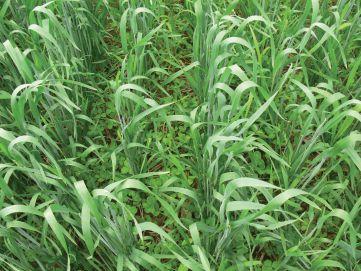
“one of the bigger complaints growers had about red clover is TOp: underseeding red clover in spring wheat may be a beneficial strategy, as OMaF’s scott Banks has found.
INsET: at harvest, Banks and his team were surprised to find that red clover treatment had actually slightly increased spring wheat yields.
Photo s courtesy of s cott Banks.
that it will compete with the spring wheat crop, suppressing grain yield,” Banks says. “That becomes an issue for combining and can become a bit of a challenge for straw too, particularly for guys who are selling it.”
In an attempt to determine the best red clover seeding date to minimize competition with spring wheat, Banks says they began by broadcasting seed at four spring wheat growth stages, which included during planting, at herbicide application (typically Zadok stage 26-30), at flag leaf emergence or after harvest. Single-cut and double-cut red clover were assessed, both being broadcast at a rate of seven pounds per acre. The wheat crop received 90 lbs/ ac of actual nitrogen in all cases and herbicide was applied on an as-needed basis per year.
“as you would expect, the red clover that was seeded early in the spring, at planting or even at herbicide timing, established better,” says Banks. “There was more volume of red clover going into the fall, which contributed more nitrogen and organic matter to the field, and so there was more advantage to earlier planting.”
at harvest, Banks says they were surprised to see that the red clover treatment had not suppressed spring wheat yields but had actually slightly increased yield.
spring wheat yield average (2009-2012) with red clover underseeded
importantly, he says, was the impact on the corn crop the following year. “as we’ve seen in winter wheat, the red clover’s impact on the corn showed up as a fair contribution to yield.”
With nothing more than 100 lbs/ac of actual nitrogen applied to the following year’s corn crop, Banks says they saw anywhere from a five to 22 bu/ac yield boost from the red clover. The red clover treatment that performed the best was the single-cut clover that was seeded at planting for a gain of $99.57/ac, based on a corn value of $4.50/bu.
grain corn yield average (2009-2012) following spring wheat with red clover
“When we looked at it over the four years, for most years there was a two- to three-bushel increase in spring wheat by having red clover there,” says Banks. “Statistically, that may not be valid, but we didn’t see a reduction in the spring wheat yield.” More
“overall, single cut maybe looks like it contributed a little bit more to the yield but it was hard to say; statistically, there’s a difference,” Banks notes. “Single cut sometimes looks more lush, but it’s hard to say it was any more than a visual thing and I don’t think there’s a big enough difference to go one way or another.”