TOP CROP MANAGER

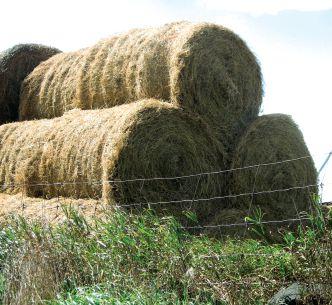
6 | Reduce forage frustrations with fertility growers are taking a hard look at their forage production strategies. By
Jeanine Moyer
10 The future of crop insect control? By Treena Hein
By Karen Daynard and Dave Cussons
Melanie Epp
Amy Petherick
by Melanie Epp
Melanie Epp


Sara avoledo | editor
Although ontario is generally thought of as a water-abundant province, this past summer, the summer of 2007, and even the summers of 1998 through 2002, left ontario with some of the worst drought conditions in its history. That has the environmental Commissioner of ontario, gord Miller, concerned; he feels that farmers need more warning in order to deal with dry spells and drought.
In May 2012, Hamilton joined 12 other conservation authorities across southern ontario in declaring the first stage of drought conditions in its area, a “Level one Low Water Condition” warning seeks an immediate 10 percent reduction in water withdrawals, and this warning came right after a cold snap had devastated local fruit farmers. only a month or so later, the Upper Thames river authority was the first to sound a Level Two warning, which asks that all permit to Take Water applicants and the general public voluntarily reduce water consumption by 20 percent. This was the earliest in the year that such a warning had been given.
In part 2 of his 2011/2012 annual report to the Legislature, Losing our Touch, Miller says, “This summer, several parts of ontario saw exceptionally dry conditions, creating challenges for farmers, businesses and communities, and placing stress on the natural environment. The government can’t control the weather, but it does have a duty to ensure that water-takings are being managed carefully, and not making dry conditions worse.” The report also noted that removals of water by municipalities, industries, farmers and golf courses may be partially to blame as they can actually exacerbate low water conditions. (His full report is available at www.eco.on.ca).
Modelling work, published by the Ministry of natural resources (Mnr) in 2007, predicts that by mid-century much of southern ontario will receive 10 to 20 percent less precipitation and will experience considerable warming (of 2º C or more) during the summer.
These changes indicate that the risk of summer droughts will increase over the coming years, which has the Commissioner “concerned that the province will not respond swiftly and appropriately when the next severe drought hits ontario.” He also states that “it is even more pressing that the province fix the drought warning systems and programs to deal with low water conditions quickly.”
The writing is on the wall. Farmers must continue to be mindful of reducing their water consumption and of conservation, as they have been in the past. Secondary reports and recommendations from the Commission will be released in the near future, so keep an eye out for their ideas and any new rules or regulations that may stem from this. and in the long run, do you think that drier summers in ontario will lead to a change in farming practices and crops grown? That is a topic for another article in another issue. But be sure to read Melanie epp’s story in this issue, on page 16, that discusses why some crops did poorly while others did well or even excelled amid the drought. Her findings seem to point to farm management practices and soil conditions being the real root of the resulting yields. Until next time, I look forward to continuing our conversation online.

November 2012, vol. 38, No. 15
eDITor Sara Avoledo • 226.979.9094 savoledo@annexweb.com
eASTerN SAleS mANAGer Steve McCabe • 519.400.0332 smccabe@annexweb.com
WeSTerN SAleS mANAGer Kevin Yaworsky • 403.304.9822 kyaworsky@annexweb.com
AccouNT coorDINATor Alice Chen • 905-713-4369 achen@annexweb.com
meDIA DeSIGNer Katerina maevska
GrouP PublISHer Diane Kleer dkleer@annexweb.com
PreSIDeNT michael Fredericks mfredericks@annexweb.com
PUBLICATION MAIL AGREEMENT #40065710 reTurN uNDelIverAble cANADIAN ADDreSSeS To cIrculATIoN DePT. P.O. Box 530, Simcoe, ON N3Y 4N5 e-mail: mweiler@annexweb.com
Printed in canada ISSN 1717-452X
cIrculATIoN e-mail: mweiler@annexweb.com Tel.: 866.790.6070 ext. 211 Fax: 877.624.1940 Mail: P.O. Box 530, Simcoe, ON N3Y 4N5
SubScrIPTIoN rATeS
Top Crop Manager West - 8 issuesFebruary, March, Mid-March, April, June, October, November and December - 1 Year - $44.25 Cdn. plus tax
Top Crop Manager East - 7 issuesFebruary, March, April, August, October, November and December - 1 Year - $44.25 Cdn. plus tax
Specialty Edition - Potatoes in Canada - February1 Year - $8.57 Cdn. plus tax
All of the above - $76.19 Cdn. plus tax
Top Crop Manager will mail information on behalf of industry-
“We’re optimistic. We’re producing more and better products and seeing a positive result.
I think the future is going to be great.”
– Sabrina Caron, Quebec

Canadian agriculture is a modern, vibrant and diverse industry, filled with forward-thinking people who love what they do. But for our industry to reach its full potential this needs to be better understood by the general public and, most importantly, by our industry itself.
The story of Canadian agriculture is one of success, promise, challenge and determination. And the greatest storytellers are the 2.2 million Canadians who live it every day.
Be proud. Champion our industry
Forages AND FEED
Taking a hard look at forage production strategies.
by Jeanine Moyer
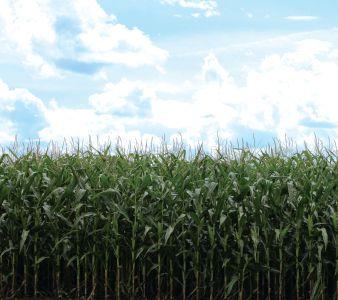
Hay fertility and the ability to produce profitable forages are becoming increasingly important to o ntario growers. High land values, rising land rental rates and increasing profits from corn and soybeans are pushing growers to maintain their competitiveness and take a hard look at their forage production strategies.
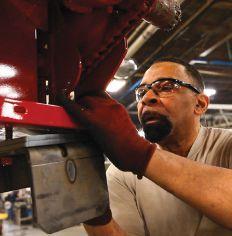
“g ood management is the most important factor in profitable, productive forages,” says Joel Bagg, forage specialist with the o ntario Ministry of a griculture, Food and rural affairs, “because without good management, we pay for it in years like this one, where growers have been hit with a challenging growing season.” according to Bagg, good fertility is essential to both yields and the persistence of forage crops.
One of the most important areas of forage fertility is (P) phosphorus and (K) potassium management, an area often overlooked by growers.
Know your soil nutrient needs
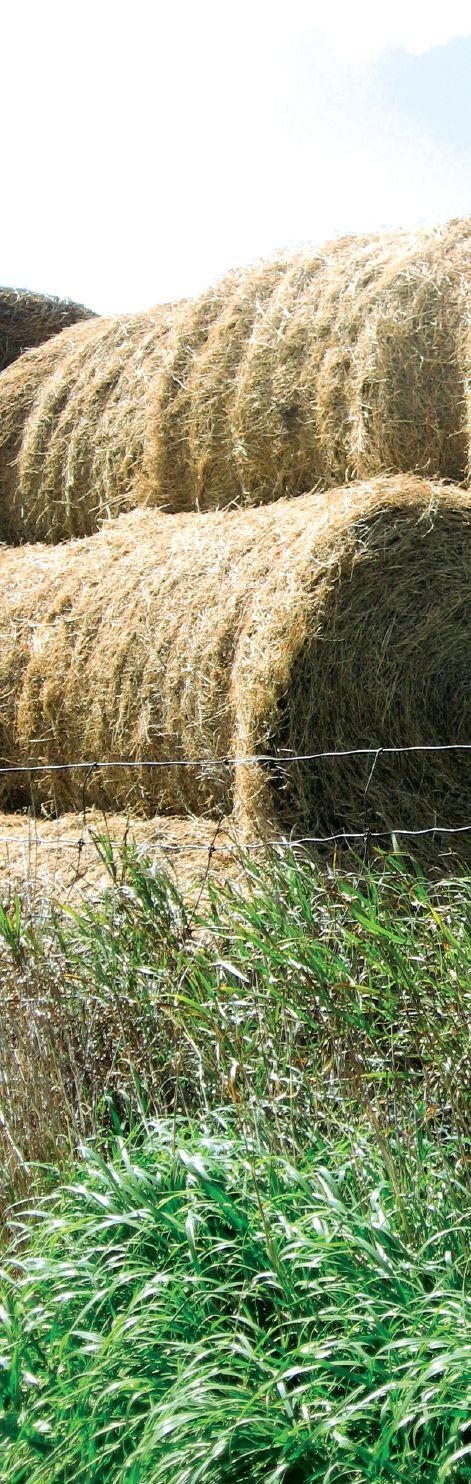
Forage crops remove a lot of nutrients; therefore, they have a high nutrient requirement. o ne of the most important areas of forage fertility is phosphorus ( p ) and potassium (K) management, an area often overlooked by growers. “ p and K are fundamental to producing enough forage to feed livestock and stay competitive in today’s market,” says Bagg, who illustrates the importance of p and K with an example of nutrient value loss in an alfalfa-grass mixture. a typical amount of p and K removed per tonne of hay harvested in an alfalfa-grass mixture is equivalent to 13.5 lb., or 6.1 kg of phosphate ( p 2o 5) and 64 lb., or 24.6 kg of potash (K 2o ), the nutrient value of the removal is currently close 2¢ per lb., or $44 per tonne of dry hay harvested.
The key to making informed management decisions is determining what soil nutrients are needed, and Bagg says soil testing is a fundamental part of
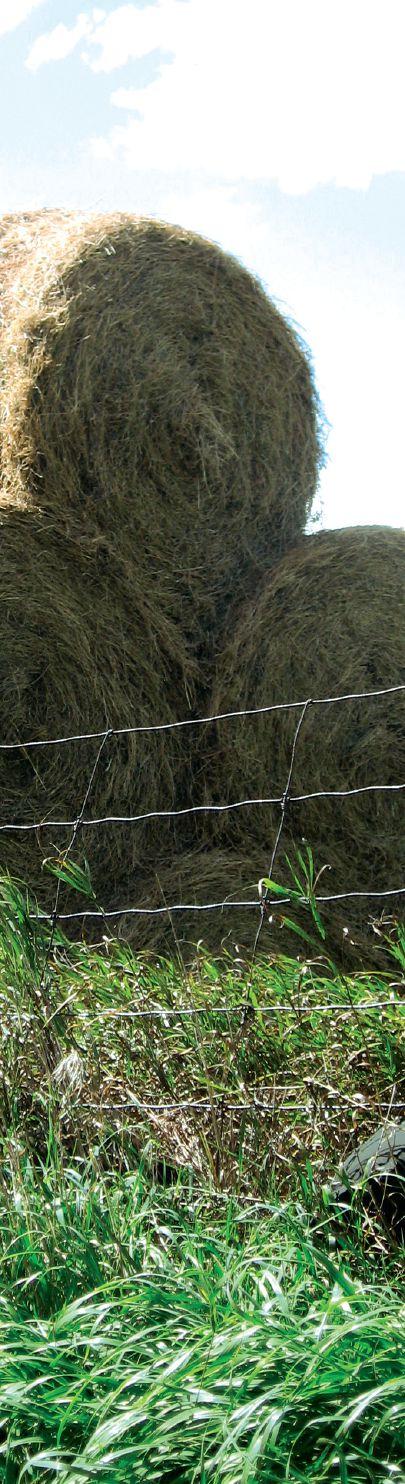
<LEFT: Good management is the most important factor in profitable, productive forages.
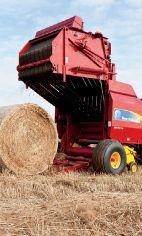
<LEFT: Hay fertility and the ability to produce profitable forages are becoming increasingly important.
forage management. “Knowing how much p and K are available in the soil to start with is critical,” explains Bagg who recommends soil samples be taken at least every three years. g rowers should use the results of a representative soil sample to determine optimum fertilizer rates. and with higher fertilizer prices, targeting your fertilizer applications more strategically will benefit not only your hay, but your bottom line too. Bagg also notes that, with the increasing cost of commercial fertilizers, the time and effort it takes to take a soil sample can easily be offset by the potential yield return.
“Unlike nitrogen, forages cannot generate p or K,” says Bagg. “and without replacing these important nutrients with manure or commercial fertilizer, soil tests will drop quickly.” Interpreting the soil test is just as important as the test itself, he notes. g rowers should check the p and K levels, because if soil tests drop below optimum levels, forage yields can be significantly reduced. research has shown significant yield losses in alfalfa when p soil test levels fall below 12 ppm and K levels fall below 120 ppm. Bagg says yield curves at low soil test levels are steep and a positive yield response from applying fertilizer will be seen when tests are below these optimum levels. “But don’t expect any extra yield from applying fertilizer once the soil tests have been built up to higher levels,” he says, pointing out that, in these cases, you can choose to apply fertilizer to replace the nutrients removed to prevent future nutrient deficiencies, “but don’t expect extra yield from any maintenance applications.”
“Livestock producers have an advantage in maintaining soil fertility where manure is available to apply during the rotation,” says Bagg, who notes that while dairy farms that apply a lot of manure typically have high p and K levels, K deficiency has become more common. For livestock farmers applying manure, he also recommends manure sampling to determine nutrient levels. Commercial fertilizer applications should be reduced according to the amount of p and K within manure sampling results. Bagg highlights potential advantages of applying liquid manure to forage crops, including yield and quality benefits, spreading of the workload, reduced manure storage requirements, prevention of soil compaction and reduction of environmental risk.
a s a forage specialist, Bagg has seen a wide range of soil fertility levels in hayfields across o ntario. and it’s no surprise that some hayfields with very low soil fertility and yield are typically those that are infrequently or never rotated, or seldom receive
manure or commercial fertilizer. at lower soil test levels, “soil mining” can occur. This should not be acceptable in a properly managed field rotation, yet, Bagg says, it goes on in many hayfields every year. He reminds growers that the short- and long-term costs of poor fertility are much higher than the cost of the fertilizer.
The optimum rotation length of forages depends on a number of factors, including land value and other crops within the rotation. “With high forage prices and land costs, forage yields and returns have never been more important,” says Bagg.
While the ideal maximum age of an alfalfa stand will vary, Bagg recommends a three-year forage rotation. Hayfields are often left for too long in rotations, resulting in significant yield losses. It’s also important to maximize establishment year forage yields because alfalfa yields are typically at their highest the year following establishment, and gradually decline with stand age due to diseases, loss of vigour and plant thinning. Yields can often decline to approximately 75 percent of the maximum yield by the fourth year following establishment. The decline can be even more rapid and significant with aggressive cutting schedules or soil fertility loss. “This yield
Increase forage yield with these recommendations from Joel Bagg, OMAFRA forage specialist:
• Use a recent soil test to guide fertilizer applications.
• P and K are fundamental to forage yield and quality.
• Shorten forage stand rotation.
loss wouldn’t be tolerated in any other crop without doing something about it, so neither should it be accepted with forages,” says Bagg.
g rowers should consider shortening the number of years of forage in rotations and using legume nitrogen credits when rotating into corn. Forage stands with greater than 50 percent legume content enable growers to deduct 100 lb. per acre of nitrogen ( n ) from the n requirements in the corn crop the following year. Stands with one-third to one-half legume content get an n credit of approximately 50 lb. per acre. r esearch shows that, in addition to the n credit, there is a significant rotational benefit of approximately 10 to 15 percent increase in corn yields when corn follows alfalfa. That can be equivalent to more than $125 per acre of additional corn. Bagg points out that the additional forage establishment costs incurred by shortening the rotation are more than offset by the n credit and corn yield benefits.
Forage fertility is made up of a number of tools and management decisions, and fertility is just one piece of the larger management puzzle. a fter all, forage yield and profitability is determined in part by management, and if forages are given the same level of management that is given to other crops, they can certainly boost a grower’s bottom line.
• Test manure to determine nutrient values and provide any additional nutrients needed by adding commercial fertilizer.
• Apply manure when soils are fit: consider summer application of liquid manure.
by Jeanine

Biological control of field crop pests may be an option sooner than you think.
by Treena Hein
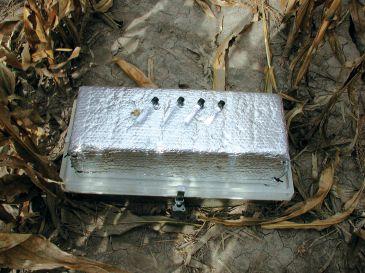
Picture this – futuristic metal posts dotting your fields, each one supporting a state-of-the-art biopesticide station. Sensors on each station monitor for insects, and when the presence of pests is detected, mating disruption pheromones are automatically released. These biopesticides, tailored to the type of pest and the population levels that are present, disrupt the life cycle of the pest in a safe and measured manner.
Does it seem like something from a science-fiction movie? It may, but such biological control of field crop insect pests may be an option sooner than you think. “We are currently testing our system in orchard, vineyard and vegetable crops, and it will ultimately see use in all types of field crops,” says Michael g ilbert, C eo of Vancouver-based SemiosBI o. “With some potential changes to trap shape and colour, testing of these traps for key field crop pests will occur next season.”
Mating disruption pheromones in a field crop scenario would work like this. e ach station, upon receiving the signal that the pest population is critical, emits pheromones, which are typically mixed with a solvent such as ethanol and a propellant. This strongly attracts male insects, and they travel to and remain at the station instead of seeking out females, which drastically reduces or completely eliminates mating. “The goal of our system is to keep insect populations at levels below a threshold that is acceptable to growers,” g ilbert says. “o ur system, like any other pest control method, never eliminates a pest forever. It’s about sound ongoing management.”
SemiosBI o is one of the leading north american companies working to expand the use of pheromones to control insect pests. The use of pheromones follows in the footsteps of field crop biopesticides such as Bt Bacillus thuringiensis bacteria), which kills insect larvae. “However, where the application of Bt is comparatively easy – field spraying – commercial use of pheromone mating disruption pheromones has been limited to orchard, tree nut and vineyard crops,” g ilbert says. “This is in part because pheromone products have been applied passively using hand-tied tags or ‘ropes,’ or through relatively short-lived spray applications that are not able to provide continuous mat-
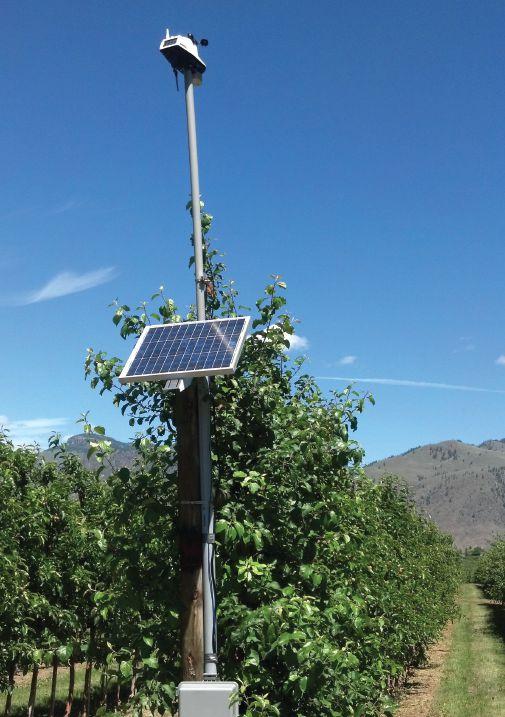
A state-of-the-art biopesticide station in a field.
ing disruption over the pest mating season.”
That is where the “semios ne T” application system offers a unique solution. “It provides active and on-demand application of mating pheromone in a manner that is effective and costefficient,” says g ilbert. “Utilizing extensive labour resources to deploy passive dispensers is not financially feasible, and the system provides the ability to deploy product at one or fewer stations per acre, with the output of pheromones dependent on weather conditions and pest population levels.”

There is daily remote monitoring of pheromone traps without the need to physically scout at the trap location. “Trapped pests can be viewed online in real time, but we are developing pest identification and counting functions that will fully automate the system,” g ilbert explains. “all of the monitoring data will be integrated with a satellite map of the farm, with current pest population information, up-to-date spray records, historical spray data and live weather reporting (including historical pest pressure and degree day analysis).”
In moving forward with new mating disruption products for field crops, it’s a matter of choosing a pest and then working out how to synthesize the pheromone, which is identical to the natural version. “Some pests are easier to manage using pheromones than others, however,” adds g ilbert, “so it’s a case-by-case basis in that respect. The process of synthesizing each pheromone is basically the same, but some may involve procedures that take longer than others to develop.” He says if the active ingredients are already commercially available, a company such as his could have a product ready within about six months for field testing; registration of the product would take an additional year.
SemiosBI o says that in 2009, the global pesticide market was $43 billion, of which biopesticides represented three percent ($1.3 billion). However, the biopesticide market is expected to grow 15 percent to over $3.3 billion by 2014. “This is because biopesticides are preferred to pesticides due to health concerns,” g ilbert says, “and many dangerous pesticides are be -
ing phased out.” For example, g ilbert says that in 2000, organophosphate chemicals accounted for 72 percent of all insecticide active ingredients, but as of 2007, they were found in only 35 per cent of all insecticides used in the United States. He adds that manufacturers of mating disruption pheromones are making efforts to ensure their products are certified for organic use.
Besides being environmentally friendly, mating disruption pheromone biopesticides don’t involve resistance. “It hasn’t been observed in over 20 years of use,” g ilbert explains. “This is because of the two factors. First, resistance occurs when most pests are killed by a pesticide, but a few survive and mate. Mating disruption pheromones do not kill the pest but alter behaviour. Secondly, the genes of any insect that somehow becomes non-responsive or resistant to sex pheromone would be quickly eliminated from the population because these insects would be much less likely to successfully mate.”
However, not all field crop insect pests can be controlled using mating disruption pheromones. “The e uropean corn borer is a good candidate for mating disruption, but corn rootworm, for example, is not,” says g ary Judd, a research scientist at a griculture and a gri-food Canada’s pacific a griculture research Centre in Summerland, British Columbia. (Judd says other field crop pests, including vegetables, in Canada that may be suitable for control by mating disruption in addition to e uropean corn borer, are diamondback moth, red clover case bearer moth, orange wheat blossom midge, leek moth, and various cutworm moths.) “Corn rootworm is a beetle as an adult and has differ-
CONTINuED ON PAGE 15
Identifying what management options farmers can implement to see more improvements.
by
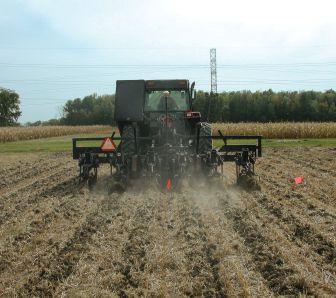
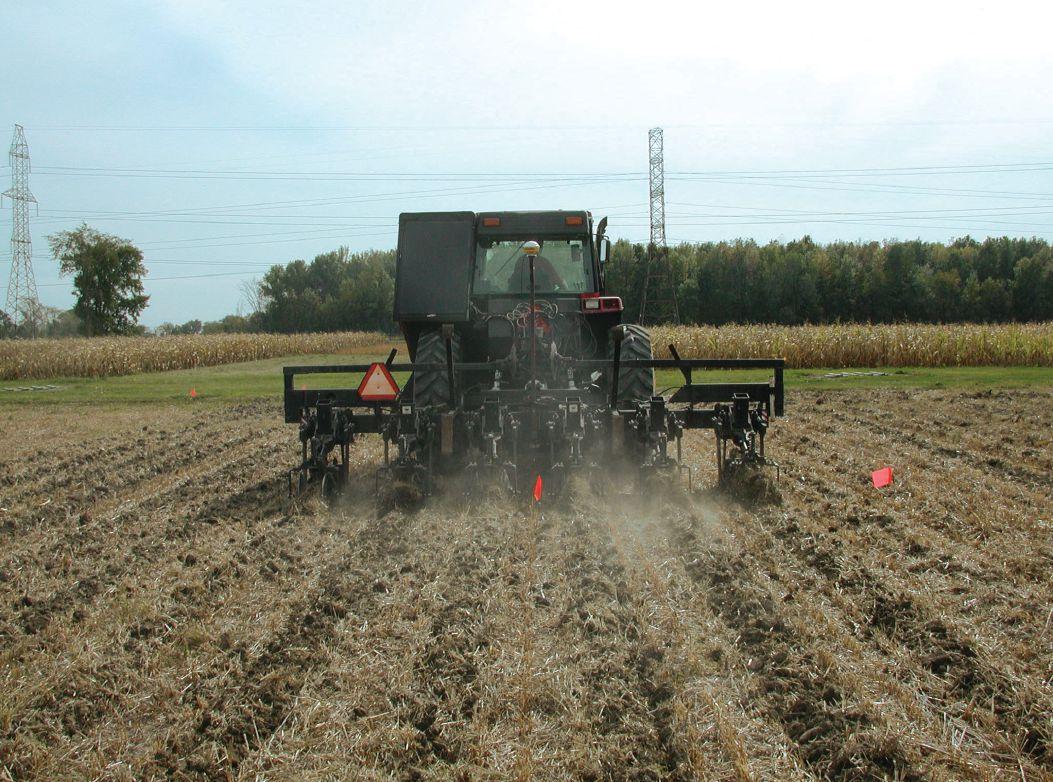
For years, farmers have heard about the advantages of no tillage, but don’t find it to be the ultimate solution everywhere. now, new research suggests zone tillage could excel on land less suited to no till.
no till has been widely adopted for many reasons. The practice has been shown to decrease soil erosion, surface runoff, production costs, and improve soil porosity and organic matter. But reduced corn yields, caused by no till’s increased crop residues, surplus soil water and lower soil temperatures, deter farmers from no tilling in some clay textured soils. Zone tillage is the compromise between no till and conventional tillage that these farmers need, according to Dr. Craig Drury, a soil management and biochemistry researcher with agriculture and agri-food Canada (aaFC).
“no till does work extremely well in some of the loam and sandier textured soils,” says Drury. “For heavier textured soils, zone till has some of the benefits of no till but also some of the benefits of conventional till.”
Drury and his colleagues have been studying the effects of dif-
ferent tillage systems for 20 years. Using a mouldboard plow at a depth of 15 to 18 centimetres starkly contrasts with the no-till system but Drury says zone till combines the two nicely, leaving 72 percent of the field untouched as they only cultivate 21-centimetrewide strips. on a Brookston clay-loam soil, which is fairly typical soil in southwestern ontario and many corn-growing areas in the northern states, this offers a warmer and drier seed bed plus all the benefits of no-till carbon management. recently, Drury teamed up with Dr. Xueming Yang, Dr. Dan reynolds, and Dr. neil McLaughlin, all of aaFC, to determine exactly how each system compares when it comes to production and environmental quality.
“I am very fortunate because I am working with colleagues who really add their own strengths and expertise to make these studies multidisciplinary,” says Drury.
To assess the full benefits of all three tillage systems, Drury and his colleagues first reviewed the impact to carbon sequestration. They found that no till produced very high carbon contents in the soil’s surface, but that the concentration of carbon dropped deeper in the soil profile. When they compared these results with conventional till, they saw a completely opposite effect as a result since more carbon is mixed into deeper depths and some is lost to mineralization or Co<sb>2</sb> emissions in the process.
“Conventional till tends to have lower carbon content in the surface soil but tends to have higher carbon content at lower depths,” explains Drury. “So when we try to do a balance and look at the whole profile, we find very little difference in terms of carbon storage.”
Drury points out that this is very different from what they would find in western provinces or in some situations where you have a different soil texture. But for farmers in ontario or the northern United States on heavy soils, these results suggested it really didn’t matter which tillage system they chose because the carbon storage was similar with both no till and conventional tillage, until they consider zone tillage.
“The amount of carbon associated with the zone till treatment in the surface soil was fairly similar to what we find in the no-till system, but the carbon levels at the lower depth are similar to conventional till,” says Drury. “When you add up the carbon stored in the entire profile, we found 11 to 12 percent more carbon storage with zone till than with either no till or conventional tillage.”
Drury says they looked at other physical quality and agronomic data to explain these carbon results. one observation to note was that zone till offered the lowest penetration resistance values, requiring less effort for plants to send their roots down into the soil. another important consideration is the fact that there is less mixing of soil and residues in zone tillage. Drury says conventional plowing mixes residue so thoroughly that it accelerates the decomposition of organic matter, but zone till isn’t this aggressive. even though both systems produce similar crop yields, the overall carbon balance is higher in zone tillage because the carbon sources break down more slowly.
“So our carbon inputs are the same (plant residues), our carbon dioxide losses tend to be lower, and as a result we are gradually building up the carbon in soils with the zone-till system.”
best at retaining nitrogen not only does zone tillage produce good conditions for plant growth on heavy soils, but also the researchers have established it reduces nitrous oxide emissions. an earlier study showed that zone till has the lower losses of n2o, a greenhouse gas, than conventional till and no till. But in their more recent study, Drury and his colleagues wanted to compare different nitrogen sources and application timing combinations to see if they could find more ways to save nitrogen.
“Fertilizer is becoming extremely expensive, especially for high nitrogen demanding crops,” says Drury. “When you start losing it to through gaseous n2o emissions (biological denitrification) or by nitrate leaching, it is both an economic loss as well as an environmental problem.”
Drury says they did observe some effects of different nitrogen sources. Coated urea appeared to reduce n2o emissions more
than regular urea, which produced 2.7 times more emissions than its coated counterpart in wet conditions. Unfortunately, coated urea couldn’t repeat this performance in the drier planting seasons that followed. application timing offered some more consistent results.
“When nitrogen was applied at planting alone, it had 33 percent greater n2o emissions than when it was added as a sidedress application, especially with conventional till,” says Drury. “It illustrated that there were benefits in applying your nitrogen a little later in the season than all at planting.”
But most striking of all their observations was that nitrogen, of any source, consistently emitted less n2o when used in zonetilled fields than when used with conventional or no till. Drury says that zone till averaged 44 percent fewer n2o emissions than conventional till, which more than doubled the reduction achieved by no till over conventional till. Ultimately, nitrogen losses can be reduced either by side dressing on conventional soil or by simply switching to zone tillage.
aside from the benefits offered through improved carbon and nitrogen management, Drury says that zone tillage is a good alternative to conventional tillage because it reduces operating costs. Using a tractor modified back in the 1980s to measure the energy outputs of farming operations, Dr. neil McLaughlin was able to show zone till offers a 67 percent reduction in fuel consumption compared to conventional tillage. Drury points out that zone tillage also reduces labour costs compared to conventional tillage. “It doesn’t take as much force and energy to run zone tillage through your fields as opposed to having to turn over every acre of your land,” says Drury. “You’re able to cover a lot more acres, in a faster time, compared to conventional till.”
Drury also points out that, with the right rotation, no till can still play a role where it provides comparable yields, and says he would never suggest that farmers should abandon the practice of no till. In this study, a winter wheat/corn/soybean rotation was implemented with zone tillage applied in the fall following winter wheat and before corn. Corn is then planted into the centre of the zones the following spring. Drury says this rotation and tillage combination (one year of zone tillage before corn and two years of no till before soybean and wheat) works in this case because soybeans and winter wheat aren’t plagued by the same problems corn is in cool, wet soils.
“[Zone tillage] is very soil specific,” Drury says. “I think there are opportunities with some of these conventionally tilled clay and clay-loam soils and there would be substantial benefits by switching to zone till.”
after working with these different tillage systems for several years, Drury says, his work has become a fine-tuning process, trying to identify what management options farmers can implement to see more improvements. He hopes to continue his work by identifying ways farmers can reduce potential ammonium volatilization losses, and is particularly keen to reduce nitrogen losses in the cereals part of a crop rotation as well as in side-dress corn.
“I firmly believe that zone tillage is a viable practice,” says Drury. “now I am trying to look at what we can do to make it a more efficient system, a system where more of the nutrients go into the crops, environmental losses are reduced, and farming practices make more efficient use of inputs.”
Continued from page 12
ent pheromone chemistry than e uropean corn borer, which is a moth as an adult. So if you want to control something like rootworm with pheromones, you’d have to use something like attract-and-trap stations or attract-and-kill stations (attract the pest with pheromone and kill it at the station as they crawl on a surface with a small amount of pesticide). However, resistance comes into play with this, and labour costs as well.”
g ilbert says the SemiosBI o precision pest management system is provided as a service at a price point that saves farmers money. “The system is designed to remain in the fields for several years with only the batteries and pheromone canisters requiring replacement every one to two years,” he explains. “Unlike tree fruit orchards where the system is shaded by the foliage,
open field applications will be more amenable to solar power.” Judd is excited and supportive of using mating disruption pheromone control of field crop pests, but he says it’s going to take concerted effort to get it into common usage. “ e uropean corn borer and others are great candidates for this type of control, but growers may say it’s not cost-effective to have stations for just one or a few pests when they are spraying anyway for disease and weed control,” he says. “Yes, we can just as easily spray for corn borer, but do we always want to do what’s easiest and reach for pesticides? It’s not an excuse. and resistance and pesticides are becoming more and more of an issue each year. and the value of remote monitoring and release of pheromone is not to be ignored. automation is very efficient.”

InVigor growers are just like other growers. Every day, they’re up before sunrise and work until everything gets done. Because when you love something this much, it’s not just a job. It’s everything.
InVigor growers might be just like every other grower, but the same can’t be said about their canola. InVigor consistently delivers early season vigor, high stress tolerance and superior yield. This year, grow with confidence. This year, grow InVigor. Learn
Why did some crops do better than others this year?
by Melanie epp
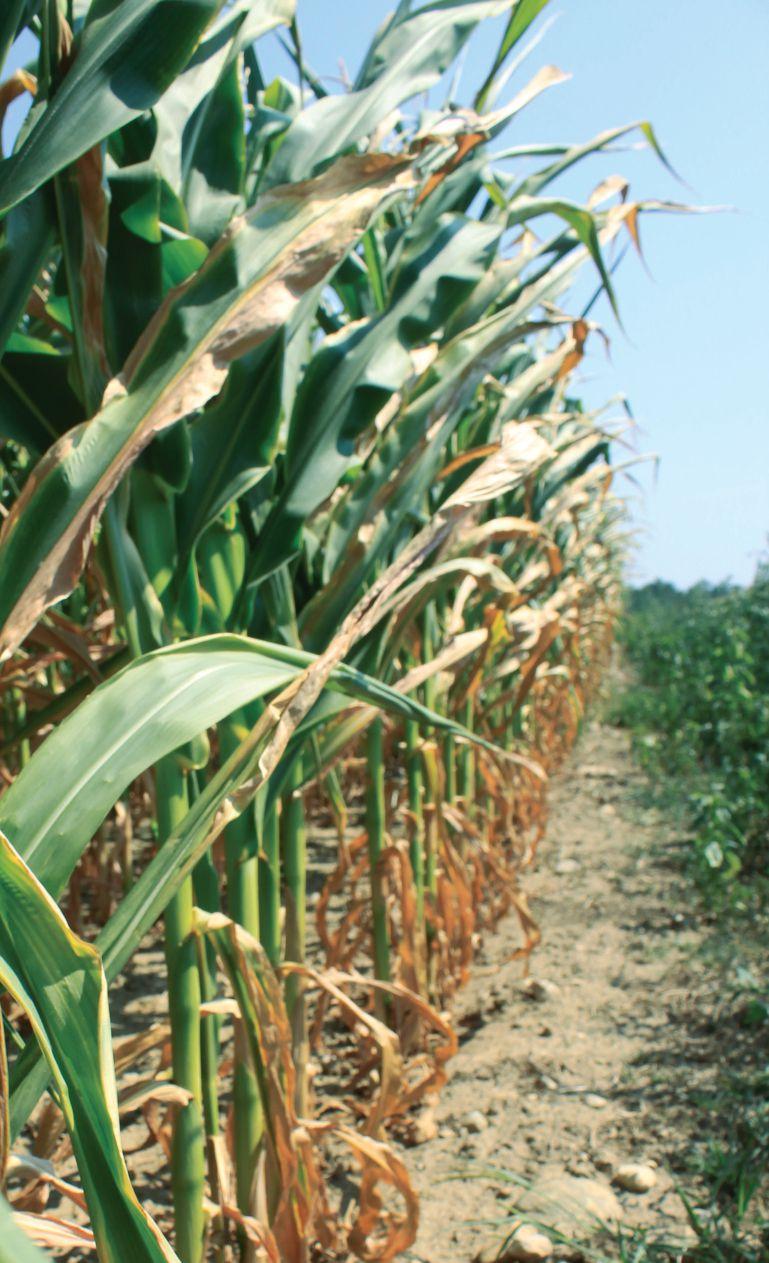
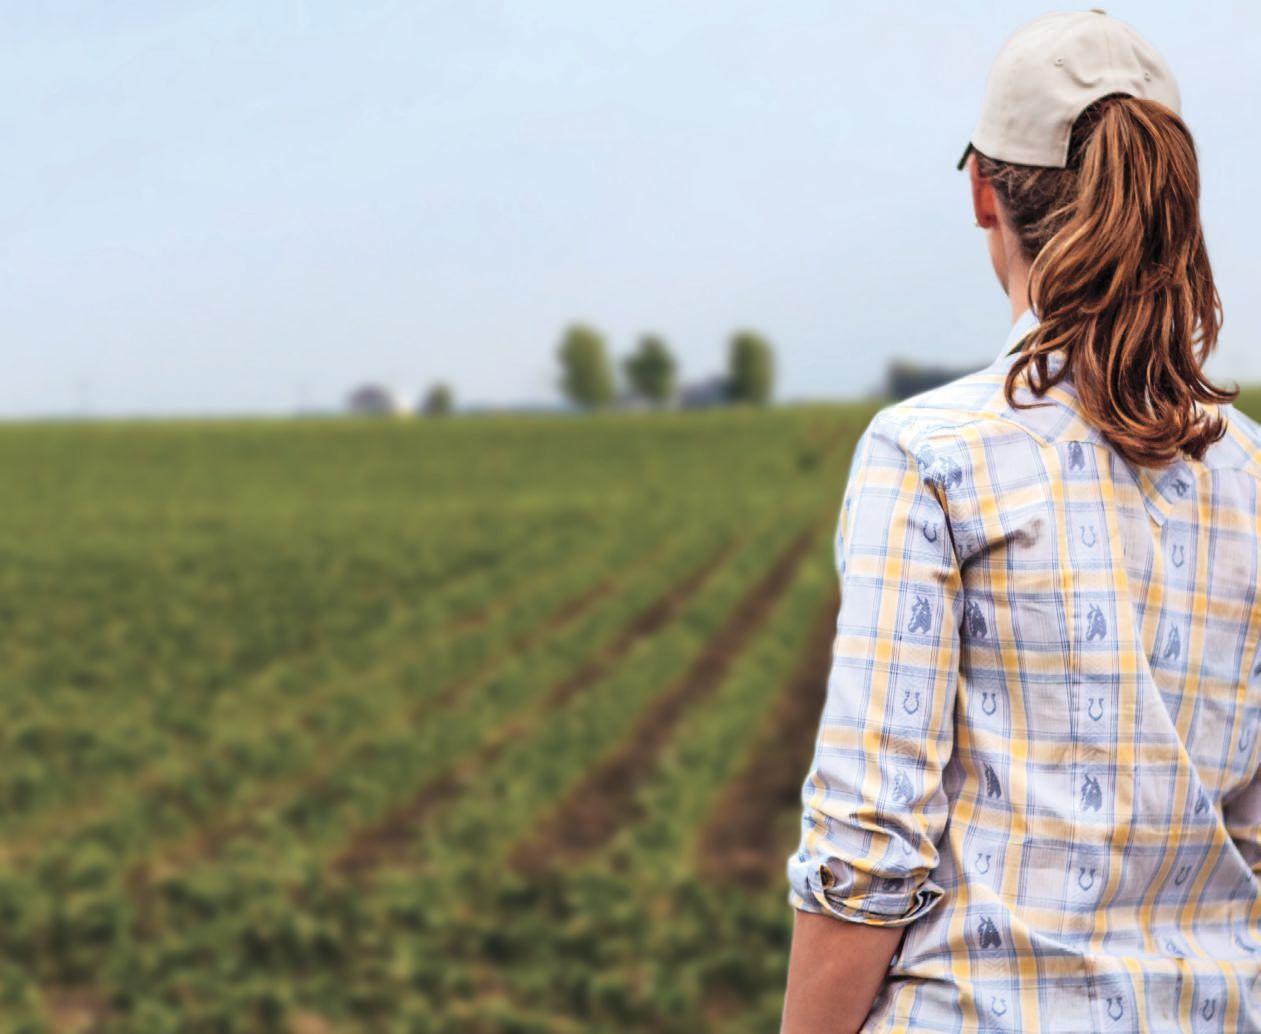
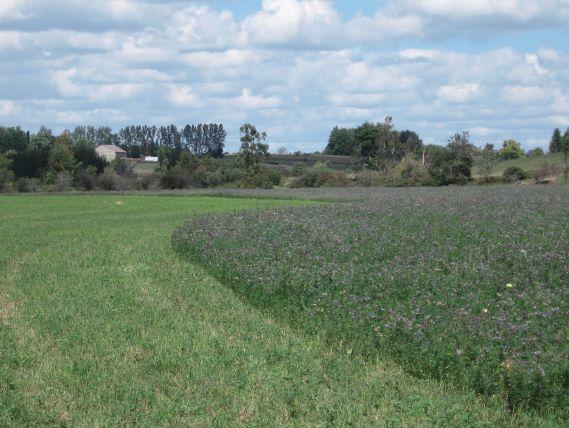
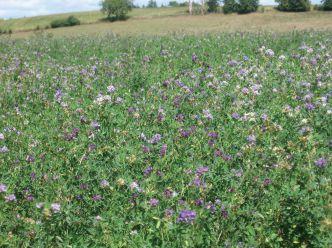
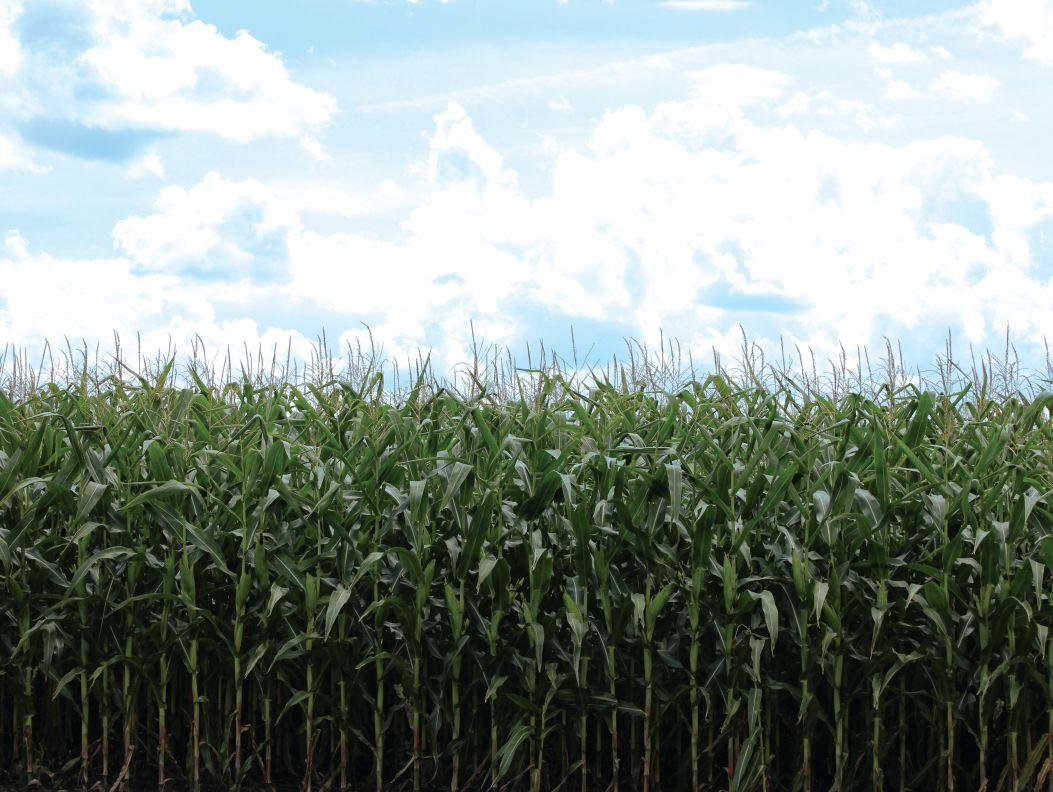
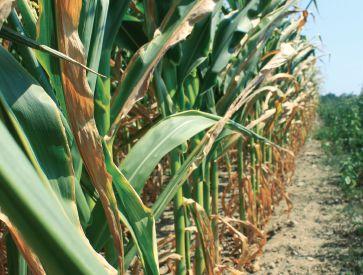
As farmers looked out over their fields this summer, praying for rain, it became apparent that some fields were suffering more than others. The variations had nothing to do with the amount of rainfall they were receiving – they had all received exactly the same amount – but were related to the soil itself. o M a F ra soil management and fertility specialists Keith reid and anne Verhallen note the key differences between drought-stressed fields and those that seemed to be doing just fine.
reid says there are a number of reasons some crops did better than others in this year’s drought. For one, some soils were simply better equipped to handle the drier weather. although it’s one of the few uncontrollable factors, soil texture plays a big role in a crop’s success.
“The very sandy soils just don’t hold a lot of water, so the crops suck the water out that was there very quickly,” says reid. “The clay soils have a much bigger reserve. The trouble is
that the clay soils hold a lot of water that the plants can’t get.” Medium-textured soils, on the other hand, have some of the most available stores of water.
Beyond that, what soil specialists are seeing is that management makes a big difference in the ability of the soil to provide water to plants. Both specialists mention rooting depth, soil structure and organic matter as major factors.
“o ne [issue] is the rooting depth, or the volume of soil that the plants have available. So if you had soil that the crops could put roots down deep into, they can get a lot more water because they’re pulling that water from the top three feet of soil instead of the top six inches,” says reid. “So you have six times more potential water that the plants can get at.”
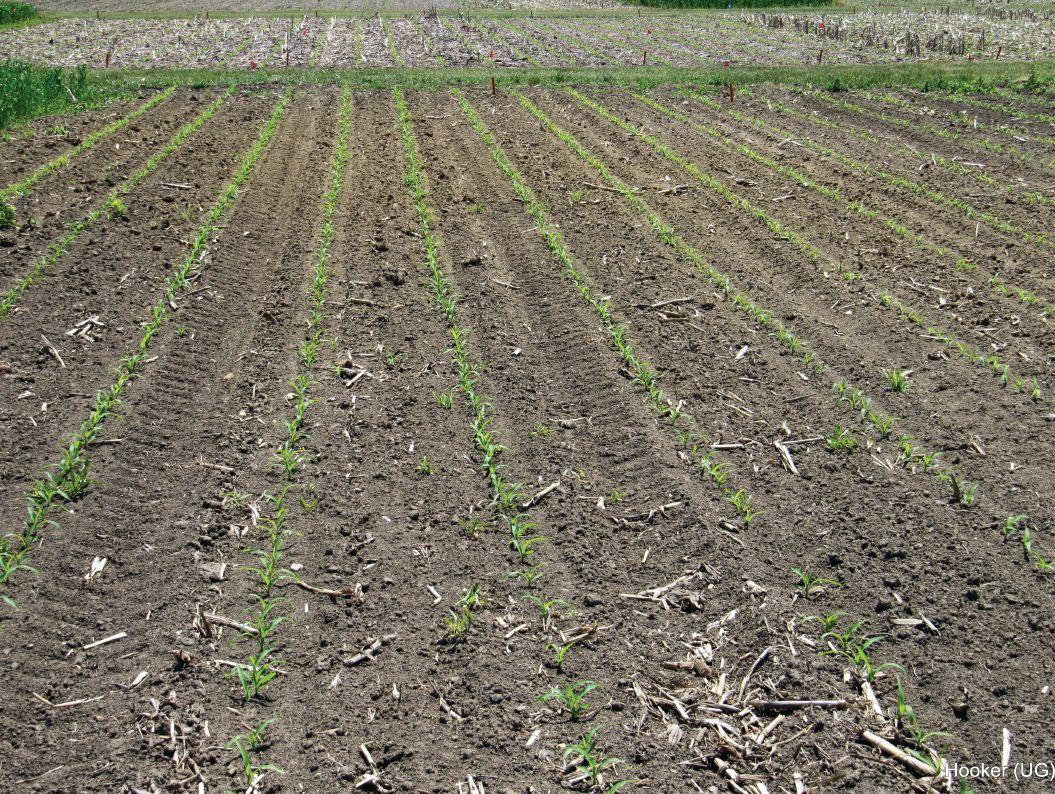
Crops that struggle are those with restricted root zones. In
TOP: A healthy non-stressed corn field.
INSET: A drought stressed corn field.
some fields, roots are restricted due to poor crop rotation and compaction. o thers are struggling because they are simply too wet. Keep in mind that when rain did come, it often came in torrents, pouring inches at a time onto parched fields.
“Ironically, soils that are too wet would have less available water because those roots cannot grow down into the areas that are saturated, so soils that were poorly drained would suffer from dry weather later on in the summer more than a soil that’s well drained or has artificial drainage underneath,” says reid.
For those fields that were poorly drained to begin with, but implemented a tile drainage system, they, too, were seeing better results. “Taking excess water away will make fields more able to tolerate dry conditions,” says reid. “That’s the part that a lot of people have a hard time with because it seems so backwards. You take water away so there’s more water available, but that’s where tile drainage really comes in.”
The second reason some fields did better is that their soil had good structure. Structure affects how easily the roots can
get through the soil, how densely they can populate the soil and how easily water can move through that soil. “So you need to have small enough pores that they’ll hold water, but large enough that water will flow through,” says reid. “If you’ve got pores that are too small, you’ve got poor soil structure. There might be water there, but it can’t get to the plant fast enough to meet the needs of the crop.”
“a lot of the fields almost gave you a good diagnostic this year because you could see where the textural differences and the structural differences were,” says anne Verhallen. “Those are the places that either did radically better than the rest of the field, or very, very poorly.”
Third, organic matter in the soil will act as a sponge that absorbs water when it does rain, and then release it back to plants, as needed. “Building organic matter is a matter of having a history of organic amendments, like manure or compost,
CONTINuED ON PAGE 24
“In this business, you deal with a lot of uncertainty –weather, soil, timing. You can plan all you want but you never really know how things will turn out.
“InVigor is the one thing on my farm I know I can trust. Year in and year out, it delivers early season vigor, incredible stress tolerance, and some of the highest yields I’ve ever seen.
“Why do I plant InVigor? Drop by at harvest and see for yourself.”
Using grower entered data to help growers make management decisions.
by Melanie epp
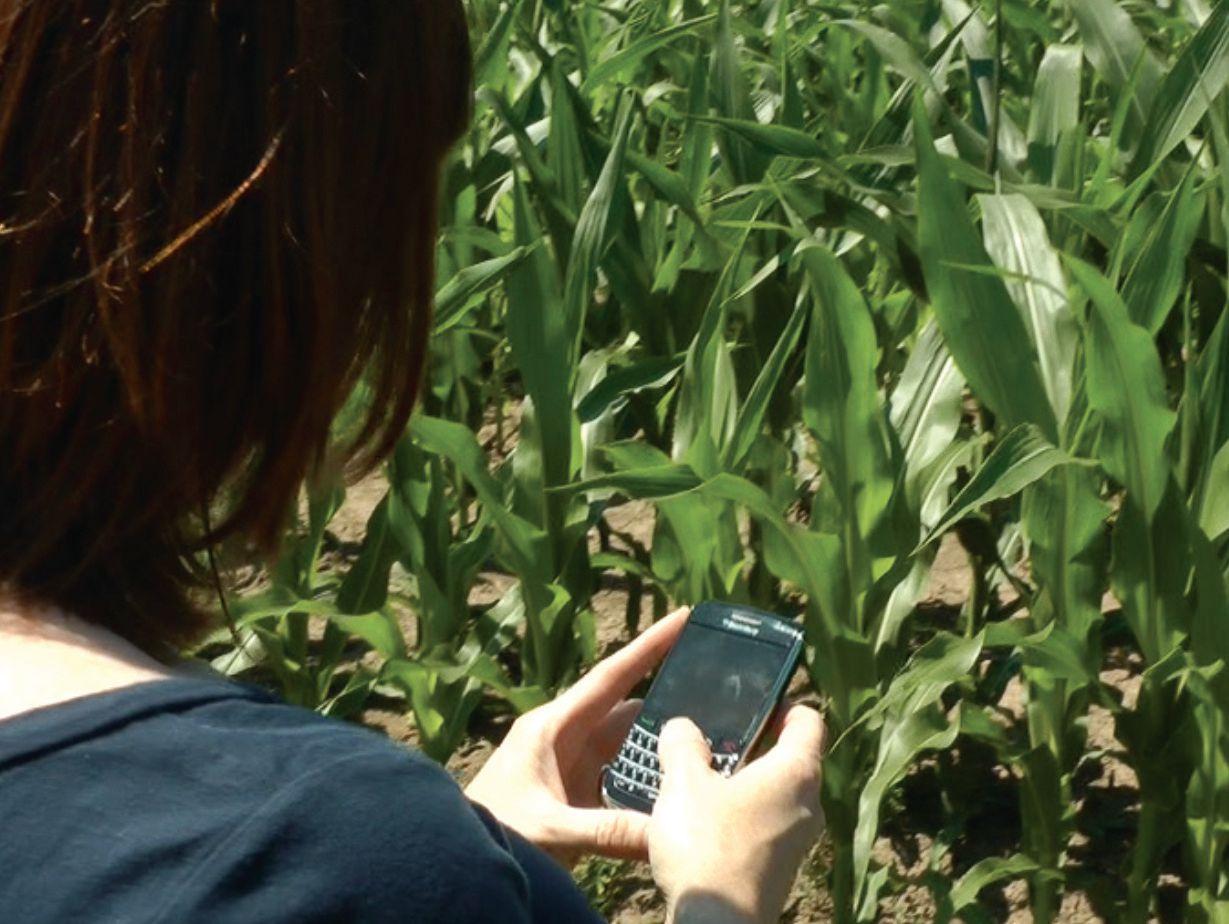
Ahandy smartphone application is helping farmers to determine when they should and shouldn’t spray for aphids, thereby reducing management costs, as well as helping to prevent the unnecessary eradication of helpful insect enemies.
With aphids, as most farmers know, the threshold will vary depending on the number of natural enemies present in a field. If aphid counts are below 250 per plant, it’s usually a good indication that natural enemies are doing their jobs. at this point, the use of an insecticide not only would lead to unnecessary costs, but could be harmful to the natural predator populations as well. The eradication of natural enemies could have the adverse effect of enabling aphid populations to increase above threshold – the exact scenario that insecticides are supposed to prevent. So how does it work?
By entering a number of variables, including temperature, aphid pressure and the presence of natural enemies, the tool will determine whether or not there’s a need to spray. First, the app will
ask you to assess a field. You’ll notice that when you click on the “assess a Field” function, a growth stage alert will appear.
“This app is only useful between the r1 and r5 growth stages,” says Tom Cowan, an entomologist with oMaFra. “after the r5 stage, the number of aphids doesn’t seem to affect yields all that much.” Cowan introduced the app to farmers at this year’s Farm Smart expo at the elora research Station in July.
Using the gpS function on your phone, you’ll then be asked to enter your location, followed by the average maximum and minimum temperature for the week. This information will help predict what aphid populations will do in the next seven days. If you choose to skip this part, the app will put in default numbers. Cowan cautions that the more accurate you are, the more accurate your numbers will be.
“Insect numbers can increase or decrease depending on tem-
TOP: Tracy baute uses the Aphid Advisor app in the field.


perature. So if it’s going to be a hotter than average week coming up, you may find that that’ll drive insect numbers up a little faster,” says Cowan. “The computer can then put that into the mix of variables to determine what the aphid populations will do.”
next, you’ll be asked to determine aphid pressure. You can do this by counting the number of aphids on 10 plants that are located at least five metres apart. Be sure to move around when you’re scouting; it will help determine the average aphid pressure of the entire field. The app makes determinations for the entire field; if you come across high-pressure areas, you’ll have to decide whether or not to spot-spray on your own.
When assessing a field, Cowan says, you need to get as close to accurate counts as possible. While it is impossible to count every single aphid on a plant, there is a way to train yourself to get a good estimation of what’s in your field. First, do a proper count to get an idea of what that number looks like, and then move forward using that estimation.
“The aphid advisor is a tool,” says Cowan. “good data in equals good data out. If you give it poor data, you’ll get a poor answer.”
Be sure to do a self-check halfway through to make sure that you’re on target. For those who prefer a visual tool, aphid scouting cards are available in pDF format online: http://www.ontariosoilcrop.org/docs/V4Soy7.pdf. Images are provided for 20, 50 and 250 aphids.
It’s important to do a follow-up assessment after seven days, says Cowan. “aphid numbers could change, especially in the middle of the season when things start to heat up,” he says. “The more you scout your field, the more information you’ll have on it.”
“WFinally, the app will ask you to enter the number of natural enemies present in the field. You should, if possible, count the natural enemies at the same time as the aphids, from the same location, and then input the data. Consult the Soybean aphid Scouting Card for images of common natural enemies. Keep in mind that there are also images available in the app itself.
after all of the data has been entered, one of three results will appear:
1. Spray – Based on the data you’ve entered, there are not enough natural enemies to control the aphid population. Scout again in seven days.
2. Wait – Based on the data provided, the app has determined that you are on the cusp and may not need to spray. Scout again in seven days.
3. Don’t spray – There are enough natural enemies in the right amount, of the proper type. Based on the data provided, you do not need to spray. Scout again in seven days.
once you’ve completed testing and received a recommendation, you can upload your data to a central database. The database can both store and track information, which can be used to make broader determinations in the future. Due to privacy protection, exact locations cannot be provided, but the information is available by county.
Cowan is careful to reiterate that the aphid advisor is a tool created to help growers make management decisions, and the success of the tool depends heavily on the accuracy of the data entered. The aphid advisor app is free and available for both iphone and BlackBerry.
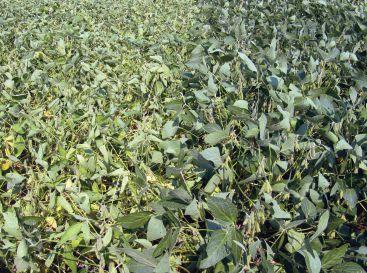
hen soybean aphid populations are not actively increasing above 250 aphids per plant, this is an indication that natural enemies are keeping up with the aphid population,” according to the Soybean Aphid Scouting Card. “Do not use an insecticide in this case as it will kill the natural enemies and enable the aphid population to increase above threshold.”
The natural enemies of soybean aphids include lady beetles, or ladybugs (various species are listed below); parasitic wasps; minute pirate bugs, adult and nymph; and syrphid larvae.
Lady beetle larvae vary in colour. They can be black or greyishpurple with orange or yellow markings. They look somewhat like small alligators.
Both the larvae and the adults feed on aphids. Species include:
• multi-coloured Asian
• Coleomegilla maculata
• seven-spotted
• fourteen-spotted
• lady beetle larvae
Just two to five millimetres long, adult minute pirate bugs are quite small. They are oval in shape with a triangular head, and they are black to purple with white markings. The nymphs,
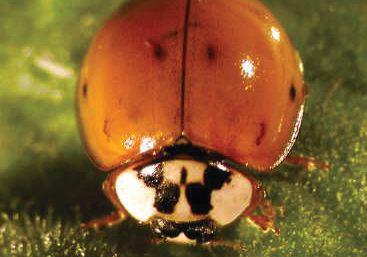
The multi-coloured Asian lady beetle is an introduced species that has developed a bad reputation because of its establishment and development of huge populations in the outdoor environment.
on the other hand, are yellowish and reddish brown. They are pear-shaped and have red eyes. Minute pirate bugs, both adult and nymph, are common in soybean crops. They feed on insect eggs and small insects such as aphids and mites.
Parasitic wasps
Syrphid fly larvae are blind, legless and maggot-shaped. They vary in colour and markings, but most syrphid larvae have a long yellow stripe running down their backs. Unlike caterpillar larvae, syrphid larvae have tapered heads. Depending on their stage of development, they can range in size from one to 13 millimetres.
The larvae can be found anywhere there are aphids. Larvae crawl on soybean leaves and feed heartily on aphids. Holding them aloft and quickly draining them, Syrphid larvae can devour up to one aphid per minute.
Because of you, Pioneer® brand seed is planted on twice as many farms and twice as many corn and soybean acres as any other seed brand in Canada. But we don’t take our leadership role for granted. We take it personally.
We know serving growers is a privilege, not a job. We believe that leadership comes with a responsibility to work smarter and try harder. So we don’t stop at good enough. Or better than last year. And neither do you. That’s why together, we’re breaking barriers in yield, knowledge and success on your farm.
Because of you, Pioneer is here.
University of Guelph research provides answers to questions about rotations and tillage systems.
by Melanie epp
This year’s Farm Smart e xpo saw a number of interesting speakers offering growers the results of their years of research. The University of g uelph’s Dave Hooker, assistant professor in the Department of p lant a griculture ( ridgetown Campus), and Bill Deen, associate professor in the Department of p lant a griculture ( g uelph Campus) were on hand to talk about the economic and agronomic implications of long-term crop rotation decisions.
While many growers have no problems conducting their own on-farm, short-term research, it’s the long-term research that can pose a problem. That’s where researchers come in. Using five test locations, University of g uelph researchers collect long-term data that can be used to help speed up result times, eliminating the need to play sometimes-risky guessing games.
Short-term research and long-term research answers two different sets of questions. g rowers can compare the success of one seed variety to another, analyze the results from a fertil-
ized plot to a non-fertilized plot, and observe the outcome of fungicide-treated plots versus non-fungicide treated plots. all of these questions can be answered using short-term research; long-term research is reserved for some of the tougher questions.
“Basically, the answers to long-term questions tend to evolve over a long period of time,” says Hooker. “For example, organic matter changes in the soil when using different crop management systems – or crop rotation or a tillage system.”
“a grower would find long-term research extremely beneficial if they adopt a management system, and in 10 years’ time they reflect on their management system after doing an evaluation on the organic matter content of their soil,” he continues.
after that 10-year period, they’ll need to decide whether
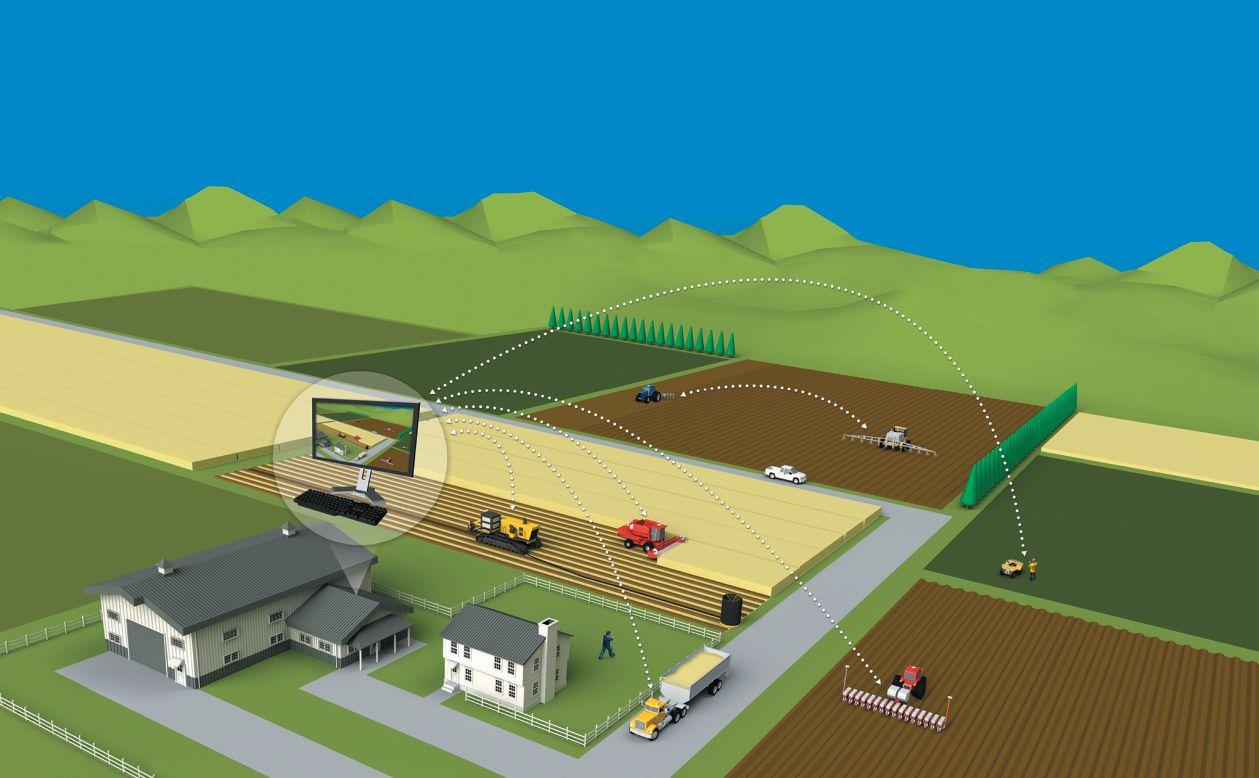

• Share guidance lines and coverage maps from vehicle to vehicle.
• Exchange prescription maps, guidance lines, coverage maps, drainage designs, soil sampling/scouting jobs, and yield data between the office and field.
• Access real-time movement of your vehicles, engine performance data, vehicle alerts, and vehicle breadcrumb trails.
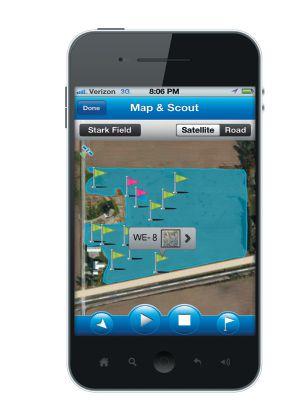
• FREE! Use the Connected Farm™ app on your smartphone to map field boundaries, flag points of interest, and enter scouting information.
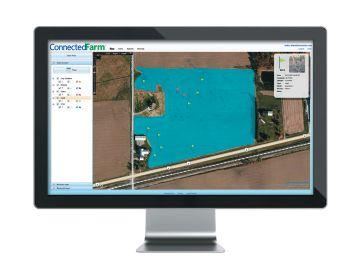
• FREE! View and analyze your collected mapping and scouting data from the online viewer.


or not the system actually worked. The problem is, if it didn’t work, then they’ve essentially wasted 10 years of management. realistically, many growers can’t spare 10 years. They need results now, he says.
“So the real benefit of these long-term trials is that we can do these trials, explore different treatments, and answer the longterm questions so growers can implement the best management practices using the long-term data that we have instead of discussing or speculating how management might affect crop productivity or sustainability in the future,” says Hooker.
Together, both researchers presented their findings at the elora research Station. Deen presented data from elora, while Hooker supplemented Deen’s findings with data from ridgetown.
Both e lora and ridgetown have five crop rotations involving up to three crops, and two tillage systems. The five crop rotation systems include continuous corn, continuous soybeans, soybean-wheat, corn-soybean-wheat and corn-soybean. The two tillage systems include conventional and no-till.
“The ridgetown plot has something different that the e lora plot does not have,” says Hooker. “and that is a nitrogen rate split of the plots. at ridgetown, in the corn plots we have 0:60:120:180 kilograms per hectare of nitrogen. In the wheat plots, we have all of those rotations and tillage combinations, but we also have another split and that’s 0:50:100:150 kilograms per hectare. The wheat plots are further divided up into with and without under-seeded red clover.”
although the two stations operate similar test plots, they are on two very different types of soil, which can affect long-term results. ridgetown is on a Brookston clay loam, a fine-textured soil that is heavier than the silt loam found in e lora.
“If I was a grower and I had loam or silt loam, I would probably be looking at the e lora rotation more closely than the ridgetown one,” says Hooker. “But if I had a fine-textured soil
CONTINuED FROM PAGE 17
and having a good crop rotation, especially crop rotation that includes forages,” says reid.
There is also a relationship between crop nutrition and the ability to tolerate dry weather. That’s not to say that crops need more fertilizer in a dry year; what it means is that a field that is short on nutrients will suffer a lot more in a dry year.
“We’re not just seeing differences from field to field. We’re also seeing differences from crop to crop,” says Verhallen. While extremes in weather hurt most crops, some thrive under extreme conditions, including feed corn and tomatoes, which do better under drier conditions rather than wet conditions.
The importance of good soil management practices became more apparent when Verhallen’s soil team visited the farm of Dean g lenney near Dunnville this summer. Last
like a clay or a clay loam, I would be looking at the results from the ridgetown trials more closely.”
The results
1. The corn-soybean rotation did not produce good soil quality with high organic matter, good soil tilth and aggregate stability.
2. When wheat is included in the rotation – as in, corn-soybean-wheat – corn yields increased by as much as 30 bushels per acre. Soybean yields were four to six bushels per acre more when wheat was included in the rotation.
3. When you include nitrogen in the system, it increases the amount of carbon or biomass return to the soil. In that corn-soybean-wheat rotation soil quality was superior through higher organic matter, greater aggregate stability and better soil structure.
g iven that there are only four to five research facilities with test plots like this, farmers will have to take the information at hand and experiment with rotations on their own farms to see how they work.
“at least this gives a first-line answer to some of the questions that they have on which rotations are better than the other or which tillage systems are better,” says Hooker.
Look for more information online at www.ontariosoilcrop.org.
Know. Grow. www.topcropmanager.com
year, g lenney won an award for producing over 300 bushels of corn. although g lenney’s farm is located in one of the drier areas, his yields are consistent.
“He gives credit to his approach to no-till farming… he limits the traffic and basically is building structure in a no-till system. You’ve got the residue left on the surface, and you’ve got the buildup of organic matter, so there’s better moisture-holding capacity, residue helping to hold the moisture in and it provides some cooling to the soil,” says Verhallen. “and then he’s got areas within that field that haven’t seen a wheel in 15-17 years because of the way he works through the field.”
Interestingly, she adds, g lenney’s crops should be experiencing unevenness, given his location, but they aren’t. His yields are consistent. “That tells you that management can play a huge part,” says Verhallen.
Australian grain grower travels the world looking for efficiencies.
by Karen Daynard and Dave Cussons
Australian grain grower and nuffield Scholar paul adam spent 16 weeks last year travelling the world and looking at ways to improve cost efficiencies in his no-till cropping system.
adam, along with his wife Meggan, run a no-till, continuous cropping enterprise on controlled traffic near Tottenham, in Central-West new South Wales, planting 2000 hectares of mainly cereals over two properties, “Dysart” and “Lansdale.”
The farm switched to no tillage about eight years ago. adam says, “We haven’t seen any great yield increases, but it’s the cost efficiencies associated with the system that pushed our operation along and we’ve . . . rationalized our machinery fleet.”
“In the last eight years, we’ve halved our fuel consumption and doubled our area of acreage.”
He says no till has generally proven to be very efficient when compared to conventional systems, generally not resulting in any great yield increases, but giving major savings and benefits in sustainability.
adam would like to focus on machinery cost efficiencies, including machinery requirements, fuel efficiency, hectares to hour of operation, ability to multi-task and the minimum amount of capital outlay needed to operate a broad-acre no-till farm business. He says, “This gives the potential to decrease fixed and variable expenses, without sacrificing your capability to still do the task in a timely manner. I believe this area alone could provide some major leaps forward in overall farm profitability.”
Cropping in a marginal environment as he does means always striving for cost efficiencies, but in being awarded a nuffield Scholarship last year, he took it one step further.
“I guess the reason I had such a focus on cost efficiencies was due to our risk profile for farming in such a marginal environment, and so reducing our costs was a way of reducing our exposure to poorer seasons and just taking a bit of the risk out of it.”
“o n my personal study, I went back to Canada, the US, then on to the UK, then across through western e urope before returning back to australia.”
“In particular, the western areas of north america are probably very similar to our area of farming, and most of the machinery we use is manufactured in that area. I also had a keen
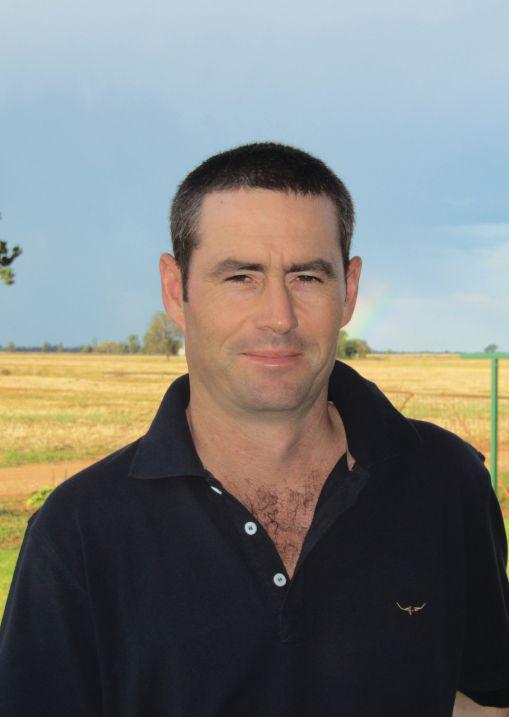
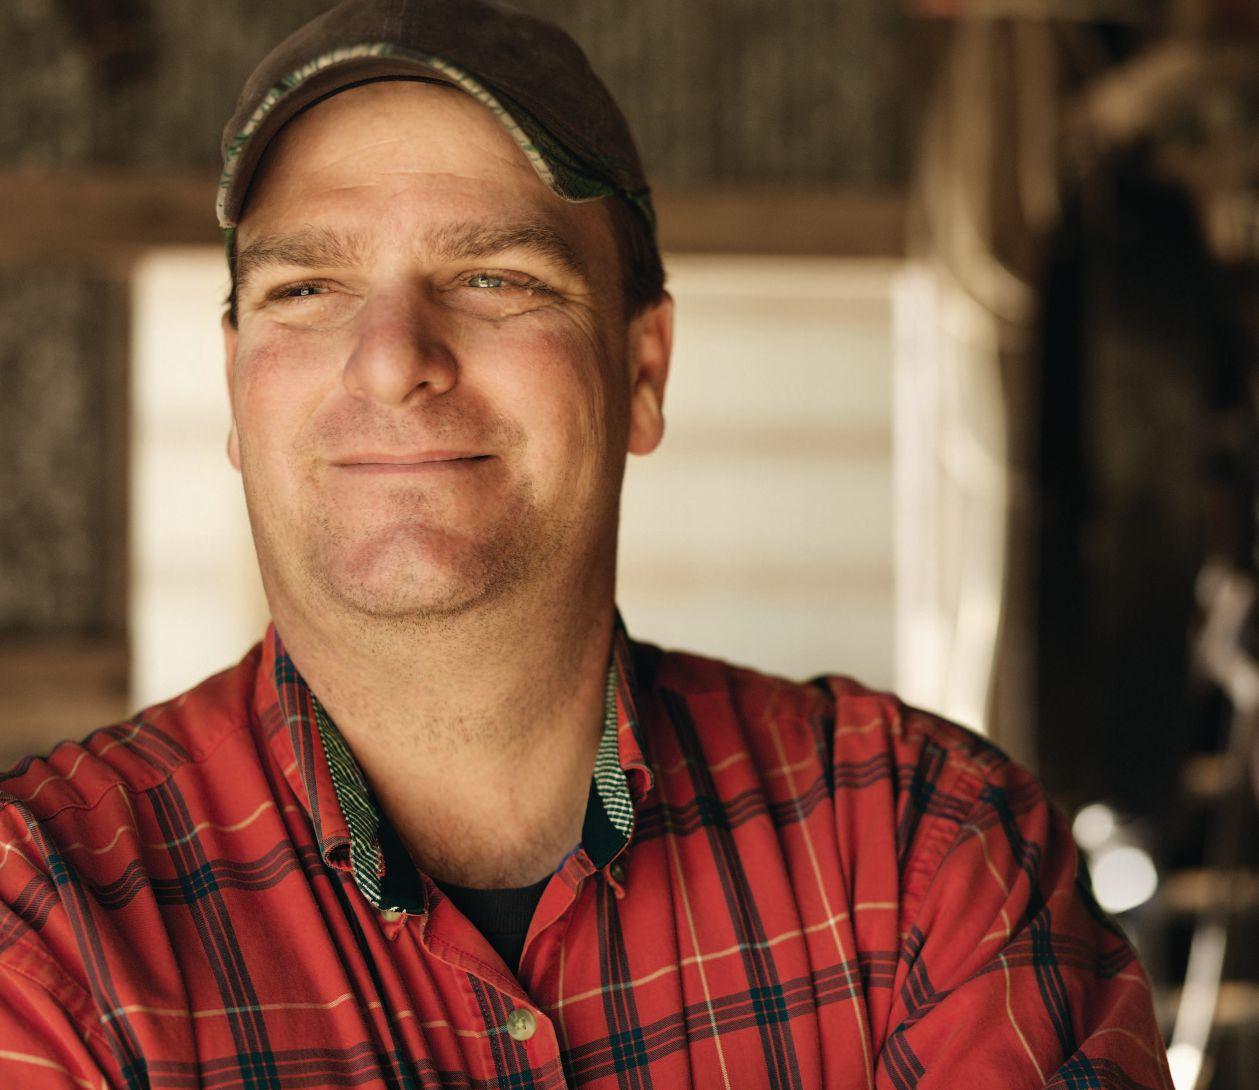
Paul Adam, Nuffield Scholar, Australia.
interest in going to e urope as just about every other industry within e urope is highly efficient, so I guess I wanted to pursue that and see where it would take me.”
However, adam quickly came to the realization that he wasn’t going to learn as much about cost efficiencies as he had hoped.
“The most startling point I realized early on was that everyone really informed me that the australian system was amongst the most efficient in the world.”

How your insect traits performed this summer can be measured right here this fall. Important:
Put more grain in the bin with Agrisure Viptera® 3111, the most complete, season-long protection of 14 above- and below-ground insect pests. Ask your seed retailer or dealer which Agrisure Viptera trait stack is right for your farm.
Instead adam decided to look at what was driving the high levels of capitalism in machinery in other countries. What was different about their systems as compared to australia?
Throughout the many months of his travel, he realized there were really six forces driving machinery expenditures in different countries:
1. Timeliness of application
In countries where there are likely to be adverse weather conditions, such as Canada, everyone needs to be running equipment at the same time. With so few growing days, the yield impact of missing even a few days can be dramatic. Thus there are fewer opportunities to share equipment or to use older equipment.
2. Labour market
The availability of low-cost labour is a major factor. In adam’s travels through countries such as Brazil and China, there much is less need for machinery efficiency as there are people willing to do manual work. In the Canadian, US and australian systems, however, labour is in short supply and costly, leading farmers to spend more on highly efficient and larger equipment.
3. Crop rotations
rotations that include more specialized crops sometimes require specialized equipment and therefore more expenditures and less efficiency as equipment might only be needed for a short time once a year. adam believes that sometimes revising a cropping system can
paul’s presentation can be viewed at: http://www.youtube.com/watch?v=P9JaQKFemmg
His full paper is available at: http://www.nuffieldinternational.org/ rep_pdf/1346393954Paul_Adam_2011_FINAL_Nuffield_Report.pdf
Monsanto Company is a member of Excellence Through StewardshipSM (ETS). Monsanto products are commercialized in accordance with ETS Product Launch Stewardship Guidance, and in compliance with Monsanto’s Policy for Commercialization of Biotechnology-Derived Plant Products in Commodity Crops. This product has been approved for import into key export markets with functioning regulatory systems. Any crop or material produced from this product can only be exported to, or used, processed or sold in countries where all necessary regulatory approvals have been granted. It is a violation of national and international law to move material containing biotech traits across boundaries into nations where import is not permitted. Growers should talk to their grain handler or product purchaser to confirm their buying position for this product. Excellence Through StewardshipSM is a service mark of Excellence Through Stewardship. ALWAYS READ AND FOLLOW PESTICIDE LABEL DIRECTIONS. Roundup Ready® crops contain genes that confer tolerance to glyphosate, the active ingredient in Roundup® agricultural herbicides. Roundup® agricultural herbicides will kill crops that are not tolerant to glyphosate. Acceleron® seed treatment technology for corn is a combination of four separate individually-registered products, which together contain the active ingredients metalaxyl, trifloxystrobin, ipconazole, and clothianidin. Acceleron®, Acceleron and Design®, DEKALB®, DEKALB and Design®, Genuity®, Genuity and Design®, Genuity Icons, Roundup®, Roundup Ready®, Roundup Ready 2 Technology and Design®, Roundup Ready 2 Yield®, RIB Complete and Design™, RIB Complete™, SmartStax®, SmartStax and Design®, VT Double PRO™, VT Triple PRO™ and YieldGard VT Triple® are trademarks of Monsanto Technology LLC, Monsanto Canada, Inc. licensee. LibertyLink® and the Water Droplet Design are trademarks of Bayer. Used under license. Herculex® is a registered trademark of Dow AgroSciences LLC. Used under license. Respect the Refuge and Design is a registered trademark of the Canadian Seed Trade Association. Used under license. (3701-MON-E-12)
simplify the need for so many types of equipment and thus increase profits and efficiency.
4. Soil constraints
In his travels around the world, adam was introduced to many different types of soil and, especially in the UK, saw major issues with soil compaction. again, poor soil requires more specialized equipment, increased fuel costs, increased labour costs and more.
5. Marginal production
Farming in an area of marginal production also is a driver for efficiency. In such areas, farmers operate on a larger scale, with greater risk, and a correlation was noted that the more marginal the land, the bigger the equipment.
6. Competition
adam noted that sometimes equipment purchases are not made due to any efficiency gain, but rather as an expensive form of consumerism.
But when it all came down to summarizing what he learned, the answer he came up with was really about risk. all over the world, minimizing exposure to risk is what drives farmers – whether the risk is climatic, financial or of another type. and for adam, on his farm, he will continue to look for opportunities to do just that.
The nuffield Farming Scholarship program operates in nine countries around the world including Canada. Scholarships are awarded to enthusiastic individuals, between the ages of 25 and 45, who wish to explore topics of their choice in agriculture, land management, horticulture or the food chain.
Three scholarships of $15,000 each are available for 2014. applications must be received by april 30 of each year. application forms are available from the nuffield website www.nuffield.ca

– Vern Schaab


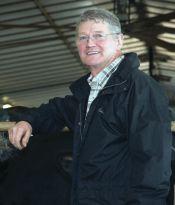
Chair and PreSident of ontraCe agri-food inC. | BruCe SaunderS
Farmers have to deal with the good and the bad.
Implementing traceability on grain farms may not yet be mandatory, but it can help maintain access to markets and improve efficiencies if done right. While common among livestock and fruit and vegetable growers, the concept is relatively new to most crop farmers. Traceability has three components to it: premise identification, product identification and tracking of the movement of the item in question.
Both the provincial and federal governments are promoting the advancement of traceability within Canada. The prime driver for government is concern about food safety. The ability, in the case of an infectious disease outbreak or foodborne illness, to quickly locate any product in order to reduce any further infection within the country is imperative. Canadian Food Inspection agency staff will want to locate every product that came in contact with the source throughout its product life on farm, in transit and right up to the consumer’s plate. While this may not be a huge concern for crops farmers, other than perhaps in the feed supply chain, there are still advantages to traceability programs that are worth looking into. So where do we stand?
For most commodities, and most provinces, we have a ways to go. In ontario, the government provided funding to create a premises registry with each property in the province having a unique premises Identification number (pID). The government has made it a requirement that a farmer seeking funding from some government programs must have a pID for the property in question. With the co-operation of commodity organizations and individual registrations, the number of validated premises that have been assigned a pID in ontario is approaching 20,000, of which 5,000 are grain sector related farms. as a matter of comparison, there are 220,000 premises in ontario that are deemed to be agricultural in use.
The second part of traceability, identification, is much further along in ontario for the livestock sector in general. a number of years ago it became mandatory that all beef and dairy cattle have radio frequency identification (rFID) tags applied to their ears at birth. The problem is that there is no reporting of that tag when applied. There is also no reporting of the animal as it moves around the province, either to another farm or through an auction barn.
The rFID tags would be integral to the third part of traceability, movement of an item from place to place. Two sectors that are most advanced towards having a traceability system in place at a national level are the pork and poultry industries.
The biggest driver to an effective traceability system for a crops farmer would be access to a domestic or export market, or, in some cases, continued access to that market. It could be required by ei-
ther the retailer or processor or put in place at the farm level voluntarily. Many would argue that another driver is efficiency, and this is because a traceability system would allow information to be returned to the producer about quality and yield of the product once sold into the market.
traceability will be proven to be a smart investment at the farm level.
If you look at the fruit and vegetable industry, both field and greenhouse, for example, there are already significant traceability programs in place. Using bar codes the producer can designate the farm, the field – perhaps even the part of the field where that particular fruit or vegetable or batch of each was grown. That bar code can move through to the processor and ultimately on to the consumer.
In the grains sector as well, there are examples of traceability already existing. If you grow seed crops each field is identified. each variety is separated at harvest and kept that way through the cleaning plant and into the seed bag or tote. non- gMo soybeans are grown in fields that are identified. Those beans are kept separate from other regular soybeans in order to maintain the integrity of the designation as non- gMo organic crops are treated in the same manner with the added feature that an inspector validates the designation of organic. These precautions can be vital to securing an export market.
In these examples, the driver is the end market that requires integrity of the commodity be maintained through the production chain.
any crop that is grown for direct human consumption or sold directly to a food processing plant will be or already is required to have a traceability system in place. possibly milling wheat will move towards requiring a traceability system in the future because of food safety concerns.
For the majority of the bulk commodities grown in ontario –wheat, corn, soybeans or canola – traceability will be difficult but not impossible. The number of times that a kernel of grain is mixed with other kernels is numerous on its way to livestock feed or international markets. as a result, traceability in this sector must take into account a batch or lot of product rather than the specific kernel.
However, in the grains market farmers can also benefit from having traceability on farm and, in some cases, can even profit by doing so. In the end, traceability will not be limited to those seeking to maintain a unique identification or characteristic for their crop, but instead will be proven to be a smart investment at the farm level.

Case IH Advanced Farming Systems is dedicated to helping producers be ready. AFS delivers an integrated, less complex precision farming solution, built right in to our equipment using a single display across machines. Built on open architecture, AFS can interface with your existing equipment, no matter what color it is. And our specialists in the field, AFS Support Center engineers and AFS Academy trainers, are there to help you maximize your operation’s potential and keep you rolling 24/7/365. Visit an AFS Certified Dealer or go to caseih.com/AFS to learn more.
A5725G8 RIB 2725 CHU
A6030G8 RIB 2850 CHU
A6757G8 RIB 2925 CHU
A7188G8 RIB 3075 CHU
A7270G8 RIB 3100 CHU
A7880G8 RIB 3200 CHU

A4631G2 RIB 2400 CHU
A4881G2 RIB 2450 CHU
A4914G2 RIB 2450 CHU
A5623G2 RIB 2675 CHU
A5909G2 RIB 2775 CHU
A6060G2 RIB 2825 CHU
A6509G2 RIB 2850 CHU