TOP CROP MANAGER
FERTILIZER
Keeping
Managing gibberella ear rot
Taking precision ag to new heights
PG. 16
Keeping
Managing gibberella ear rot
Taking precision ag to new heights
PG. 16
PHANTOM™ puts an affordable end to broadleaf weeds.
Control weeds on contact and in soil residual with the takeout power of imazethapyr, the same active ingredient found in Pursuit®. Support fair pricing and protect your soybean, dry bean and other broadleaf crops with Phantom herbicide. Available at leading retailers. Ask for Phantom by name.
Blair Andrews
Melanie Epp
optimum plant populations for soybeans
little, too much or just right. By Donna
Fleury
John Dietz
Treena Hein


Janet Kanters | Western editor
Weather has always been in the forefront of human consciousness – man is aware of the surrounding climate at every minute of every day. We arise in the morning and one of the first things we do is look outside to “see what it’s doing” weather-wise. We check the weather reports before we dress and before we leave the house to go to work. We look at the long-term forecast to determine the weather for that evening and the rest of the week.
our obsession with the weather certainly isn’t modern-day thinking – neanderthals and more modern Homo sapiens surely checked the weather from their caves to determine how the day’s hunting would go, and what grasses and vegetables would be ready for cooking and eating (new research in 2012 shows evidence that neanderthals – previously thought of as solely carnivorous – not only ate a range of cooked plant foods, but also understood their nutritional and medicinal qualities). Indeed, early man knew the seasons then as well as we do now – after all, weather affects animal breeding, migration and hibernation patterns, as well as plant growth and development.
overall, man has learned to work with the weather in most circumstances. We know we can’t do anything about the rain that’s falling that day, or the frost that came in the night. But weather forecasting has helped us plan for some of these contingencies and we get along pretty well.
Yet throughout all of man’s years on this earth, we have had to contend with extreme weather conditions that have resulted in a drastic change of what we know and how we act. We’re all familiar with the Dirty Thirties – drought and dust storms during these years caused major ecological and agricultural damage to the Canadian prairies. an excellent documentary entitled The Dust Bowl was released in november, chronicling the Dirty Thirties on the american great plains. Lesser known but as fascinating is digital footage covering the Canadian prairie experience during the Dirty Thirties on the CBC website, http://www.cbc.ca/archives/categories/environment/extreme-weather/drought-on-the-prairies.html. In some of the footage, Western Canadian farmers were interviewed in 1961, a year in which another drought occurred that was, according to some, worse than the drought of the 1930s in terms of crop yields.
Whether or not you believe in “global warming,” we can all agree there’s been a change in the weather. During the past decade we’ve seen “once-in-a-millennium occurrences” of rainfall/flooding events. We’ve seen severe droughts in places like Texas, australia and russia, as well as in east africa, where tens of thousands have taken refuge in camps. Deadly heat waves have hit europe, and record numbers of tornadoes have ripped across the United States. Most recently, we’re experiencing a north american drought that began in the southern United States in 2010 and has since expanded to most of the U.S., to central and eastern Canada, and to parts of Mexico.
So what’s going on? are these extreme events signals of a dangerous, human-made shift in earth’s climate? or are we just going through a natural stretch of bad luck? The debate is everywhere, from offices in our nation’s capital, to coffee shops on the prairies. no one will agree on the exact reasons. In agriculture, what can be agreed upon is that we need to develop a smart approach to extreme weather occurrences by attacking all the risk factors, including designing crops that can survive drought or resist attack from pests; designing buildings that can resist floods and high winds; and developing policies that discourage people from building in dangerous places. only then can we be prepared for whatever the weather throws at us.
March 2013, vol. 39, no. 5
GroUP PUBlIShEr Diane Kleer • 519-429-5177 dkleer@annexweb.com
EaSTErn SalES ManaGEr Steve McCabe • 519.400.0332 smccabe@annexweb.com
WESTErn SalES ManaGEr Kevin Yaworsky • 250-317-1992 kyaworsky@annexweb.com
accoUnT coordInaTor Alice Chen • 905-713-4369 achen@annexweb.com
MEdIa dESIGnEr Katerina Maevska
PrESIdEnT Michael Fredericks mfredericks@annexweb.com
PUBLICATION MAIL AGREEMENT #40065710 rETUrn UndElIvEraBlE canadIan addrESSES To cIrcUlaTIon dEPT. P.O. Box 530, Simcoe, ON N3Y 4N5 e-mail: subscribe@topcropmanager.com
Printed in canada ISSN 1717-452X
cIrcUlaTIon e-mail:subscribe@topcropmanager.com Tel.: 866.790.6070 ext. 202 Fax: 877.624.1940 Mail: P.O. Box 530, Simcoe, ON N3Y 4N5
SUBScrIPTIon raTES
Top Crop Manager West - 8 issuesFebruary, March, Mid-March, April, June, October, November and December - 1 Year - $45.00 cdn plus tax
Top Crop Manager East - 7 issuesFebruary, March, April, August, October, November and December - 1 Year - $45.00 CDN plus tax
Specialty Edition - Potatoes in Canada - February1 Year - $16 CDN plus tax
All of the above - $80 CDN plus tax
Occasionally, Top Crop Manager will mail information on behalf of industryrelated groups whose products and services we believe may be of interest to you. If you prefer not to receive this information, please contact our circulation department in any of the four ways listed above.
No part of the editorial content of this publication may be reprinted without the publisher’s written permission © 2013 Annex Publishing and Printing Inc. All rights reserved. Opinions expressed in this magazine are not necessarily those of the editor or the publisher. No liability is assumed for errors or omissions.
All advertising is subject to the publisher’s approval. Such approval does not imply any endorsement of the products or services advertised. Publisher reserves the right to refuse advertising that does not meet the standards of the publication. www.topcropmanager.com
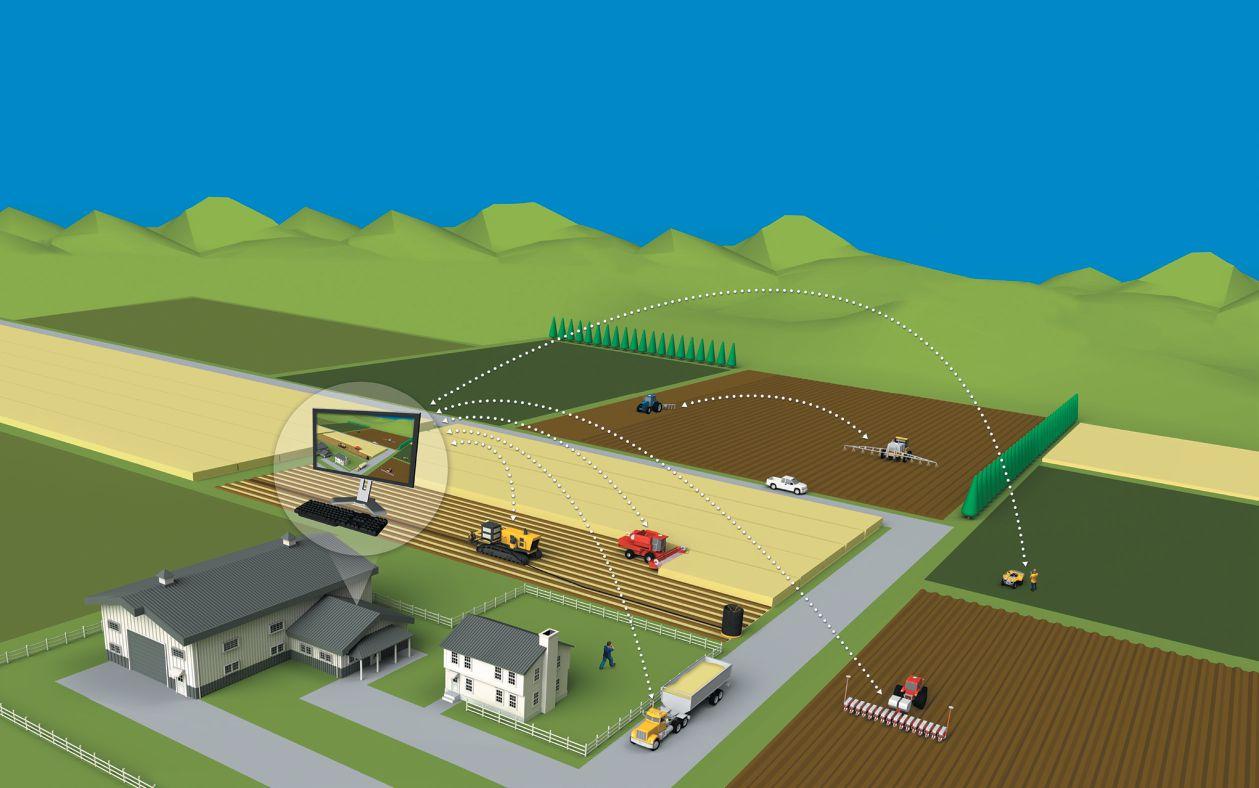

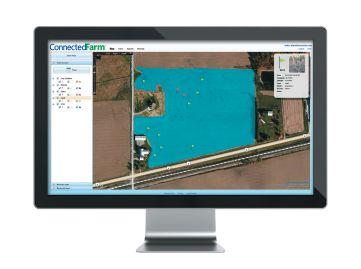
• Share guidance lines and coverage maps from vehicle to vehicle.
• Exchange prescription maps, guidance lines, coverage maps, drainage designs, soil sampling/scouting jobs, and yield data between the office and field.
• Access real-time movement of your vehicles, engine performance data, vehicle alerts, and fleet productivity.
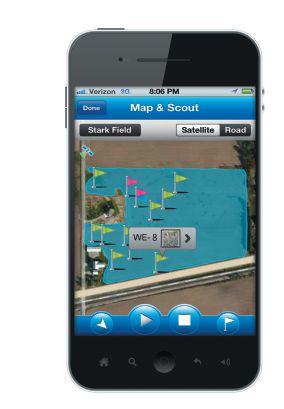
• Use the Connected Farm™ app on your smartphone or tablet to map field boundaries, enter scouting information, and calculate nitrogen rates using the GreenSeeker handheld crop sensor.
• NEW! Utilize Remote Assistant to diagnose a problem in the field by remotely accessing Trimble’s FmX® integrated display in real time.


by Steve phillips and rob norton
Global production of the major cereal crops of wheat, corn, and rice is 647 million tonnes (M t), 814 M t, and 441 M t, respectively (FaoStat, 2012). However, a large proportion of the corn crop is used for feed and fuel, while 93 percent of rice is consumed in the country where it is produced. Wheat is one of the most important food crops in the world, providing 20 percent of humanity’s dietary energy supply and serving as the main source of protein in developing nations. There was around 135 M t traded annually from 2006 to 2010, 71 percent of which was sourced from the United States, France, Canada, australia, russia and argentina.
The demand for wheat follows rapidly growing populations and is expected to increase by 60 percent in the third world by 2050. o ver the past 20 years, the average growth in wheat production has been around 1.0 percent per year (Figure 1), but that is considerably less than the 3.3 percent annual increase between 1960 and 1990, the time of the g reen revolution. This production increase has come from a constant production area of around 215 M ha. So production increases have been largely
due to higher grain yields (Figure 1). To satisfy the growing demand for wheat, annual production increases need to be closer to the rates observed following the g reen revolution (Figure 1). While some of this increase in production will be achieved using improved genetics, the rest will need to come from better agronomic practices, so that the gap between potential and actual yields becomes smaller.
Since the period 1961-65, annual global wheat production increased 2.6-fold until 2010. From 1961 to 1980, the Soviet Union produced around 24 percent of the global wheat supply averaging just over 80 M t per year (Figure 2). The United States was the second largest wheat producer during that period, averaging 13 percent world production share (44 M t per year). In the 1980s, China gained, and has continued to hold, the greatest
ABOVE: Gains in global wheat production have been linked to increased fertilizer use.


Table 1. Production, area, export, yield, and fertilizer use for the top 20 wheat-producing countries in the world (Faostat, 2012; heffer 2009, iFadaTa 2012).
* Fertilizer use in wheat for each EU27 country was estimated from mean fertilizer use by crop (heffer, 2009) and the total fertilizer used in each country.
** No data available.
share of world wheat production, averaging 112 M t from 2006 to 2010 (Figure 2). o ther significant increases in production share over the last half century occurred in India and pakistan, while the dissolution of the Soviet Union still left russia as the largest wheat producer among the former Soviet Union countries. The greatest single-country decreases occurred in north america with the United States and Canada shares dropping 32 percent and 38 percent, respectively (Figure 2). o ut of 123 wheat-producing countries, approximately 70 percent of world wheat production is currently located in the top 10 countries represented in Figure 2 and 85 percent is in the top 20 countries.
The top 10 wheat-producing countries also contain nearly 70 percent of the wheat area (144 M ha) in the world. This
Figure 2. Wheat production trends (1961 to 2010) for the top 10 producing countries. (FaoStat, 2012). Values graphed are the means for each 5-year period.
percentage has been consistent since the end of the USS r in the early 1990s. Since 1995, wheat area has increased most in russia (2.7 M ha), australia (1.6 M ha), and India (1.2 M ha) although there can be quite large changes in area planted between years due to seasonal and financial conditions. The increase in total wheat area in russia since 1996 corresponds to an increase in the percentage of total crop area planted to wheat over the same time period, suggesting this increase is likely a result of wheat substituting for other crops. australia also shows a slight increase in the percentage of crop area in wheat. Total crop area there increased by 2.2 M ha between 1996 and 2010, mainly as land that was previously either in permanent pasture or in rotation with crops brought into wheat production, with a consequent significant decline in sheep numbers. The additional 1.2 M ha of wheat in India is also likely a result of new land being cropped, as the percentage of total crop area allocated to wheat has not changed in the past 15 years. g ermany added 400,000 ha of wheat over the past 15 years, which is small relative to
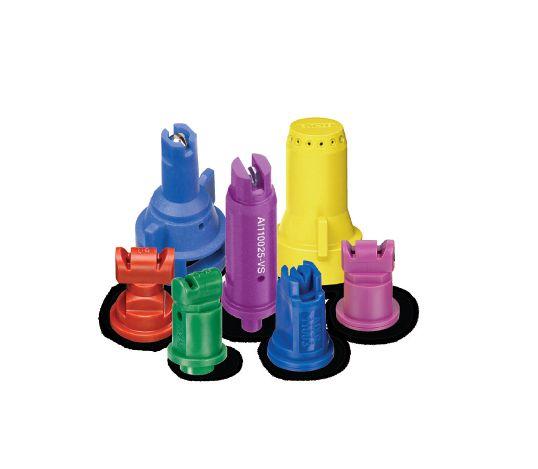
Thorough spray coverage is critical when trying to control herbicide resistant weeds like pigweed or waterhemp and TeeJet spray tips provide the superior coverage and drift control you need. After you’ve chosen your herbicide, consider these options:
• Turbo TeeJet® (TT) and Turbo TwinJet® (TTJ60) tips produce medium to coarse droplets for thorough coverage when spraying contact herbicides like glufosinate
• AIXR, Turbo TeeJet Induction (TTI) and Air Induction Turbo TwinJet (AITTJ60) tips produce larger droplets for improved drift control and are ideal for systemic herbicides like glyphosate, 2, 4-D and dicamba
Download the SpraySelect tip Selection Mobile app for apple and android today!

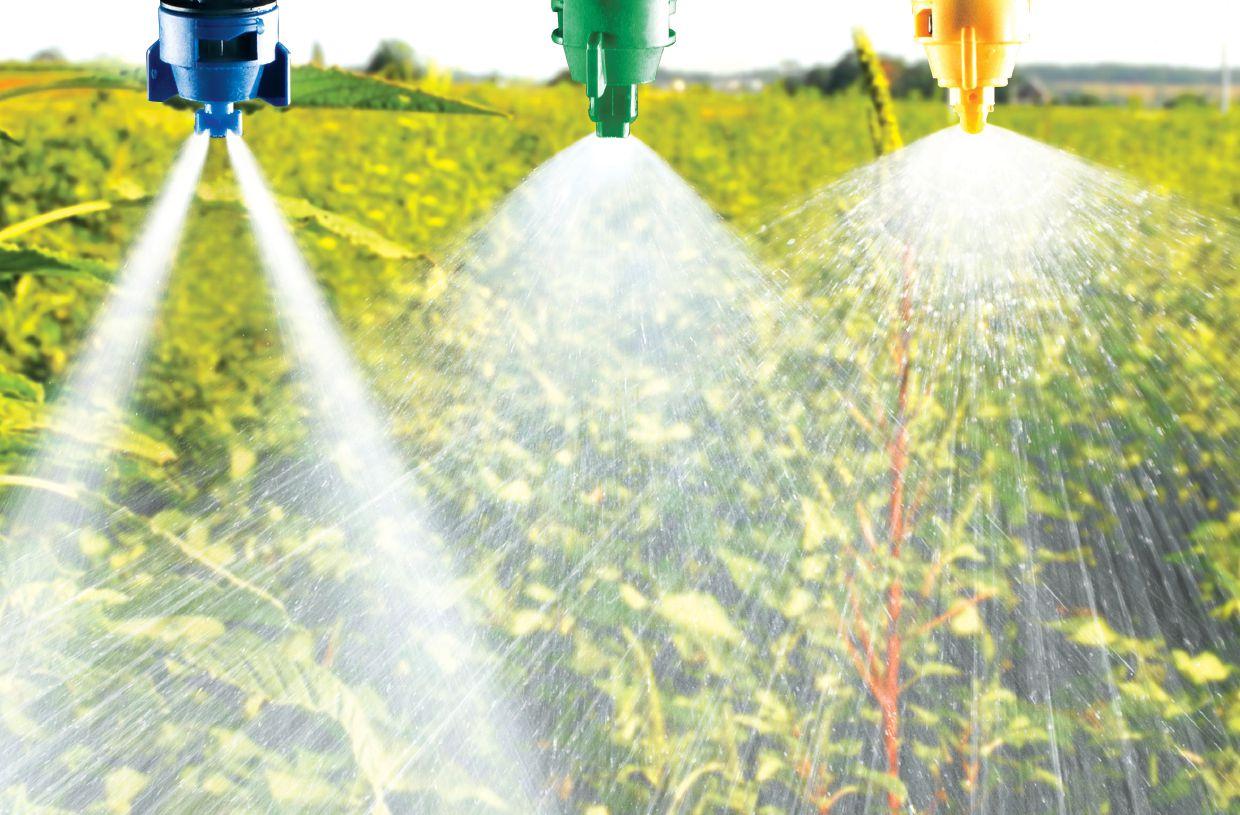
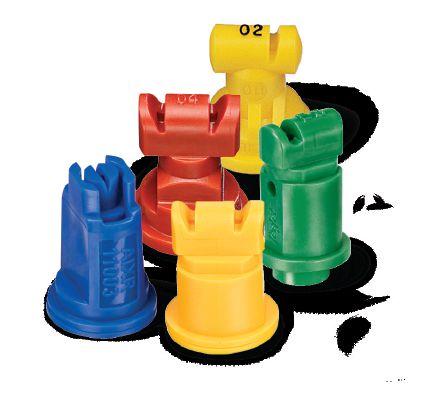

Figure 3. Trends in harvested wheat area (1961 to 2010) for the top 10 producing countries. (FaoStat, 2012). Values graphed are the means for each 5-year period.
Figure 4. Wheat grain yield trends (1961 To 2010) for the top 10 producing countries. (FaoSTaT, 2012). Values graphed are the means for each 5-year period.
total wheat area, but represents a 15 percent increase in wheat area in the country.
The largest decreases in wheat area during the same time period occurred in China (-5.1 M ha), United States (-3.3 M ha), Canada (-1.9 M ha) and Turkey (-1.2 M ha) (Figure 3). China, United States and Canada all had corresponding drops in wheat area percentages indicating crop shifts, while in Turkey the percentage of total crop area growing wheat did not change, reflecting a reduction in total crop area.
These changes in wheat area can explain, at least in part, the increases observed in overall production in India, russia and g ermany, and the decreases seen in the United States and Canada.
Changes in total wheat production over time, not related to changes in area, are likely a result of changes in grain yield. g lobal wheat yield doubled from 1.2 t/ha in 1961 to 2.4 t/ha in 1990 (Figure 1). Yield has continued to increase but at a slower rate, moving from 2.4 t/ha in 1990 to 3.0 t/ha in 2010 (Figure 1). The progress in wheat yields for the 10 top-producing countries is shown in Figure 4. The countries with the highest wheat yields among the top 10 producers have always been g ermany and France. However, in the last decade, yield gains in g ermany have slowed considerably and yield has declined slightly in France. Yields in China have increased at approximately the same rate as those in e urope over the past several decades and have continued to increase over the last 10 years. These large and consistent yield gains explain how Chinese production has continued to increase despite a significant reduction in wheatproducing area over the past 15 years.
The average grain yield in Canada has also increased rapidly in the last decade; but of the top 10 wheat producers, only g ermany, France and China have grain yields above the global average (Table 1). g rain yields in pakistan, russia, and Turkey are
rising to at or near the global average of one percent annually, but are still at least 0.5 t/ha below the global average. nonetheless, these yield gains have been enough to contribute to overall production increases in pakistan and russia, and kept production stable in Turkey despite reductions in the wheat growing area. Yields in India and the United States are near the global average of 3.0 t/ha, but growth rates are well below one percent per year. Due to a 10-year drought in australia, yields have fallen to around 2.2 percent per year since 1996 to 2000. This fall helps to explain the drop in overall production in australia despite recent increases in wheat area.
The quantity of fertilizer (total n, p 2o 5, K 2o ) used in wheat by the top 10 producing countries is approximately 18 M t (Table 1). Total annual fertilizer use for all crops has risen from 37 M t of n + p 2o 5 +K 2o in 1961-65 to 161 M t in 2005-09 (Figure 1). Since 1990 the consumption of fertilizer has risen for all crops and this is also likely to be the case for wheat, although the only data on fertilizer use by crop were released in 2009. Wheatgrowing consumes around 15 percent of the total nutrients used, and 83 percent of the fertilizer used on wheat is applied in the top 10 wheat-producing countries.
In the period between 1991 and 1995, France and g ermany began reducing fertilizer use and currently apply 34 percent and 23 percent less, respectively, than amounts used in the early 1990s (Figure 5). australia has also reduced fertilizer use in wheat by 18 percent since 2000. The greatest increases in fertilizer use have occurred in India, pakistan, russia and China – all of which have increased use between 40 and 46 percent in the past 15 years (Figure 5). Fertilizer use in Canada and Turkey has been fairly stable for the past several years, and use in the United States has declined by six percent since the period 1996 to 2000. Without knowing use patterns in each crop it is not possible to define which crops have had use rates lowered.
Figure 5. annual total fertilizer use trends (1961 to 2010) for the top 10 wheat-producing countries. (iFadaTa, 2012). Values graphed are the means for each 5-year period.
2 5
2 In the cases of China, pakistan and russia, the timing of the yield increases compared with the timing of increases in total fertilizer use coincide, indicating the significant role good nutrition plays in sustaining wheat yields. However, a relationship between increasing fertilizer use and subsequent increases in wheat grain yield is no indication that the current fertilizer management in these countries is at an optimum. Fertilizer rate is only one component of 4 r nutrient Stewardship, which is applying the right nutrient source, at the right rate, at the right time and in the right place. The 4 r’s are interdependent and if one is wrong, none of the others can be right.
Conclusion
Increased yields rather than increased area sown has been the main factor behind the increase in wheat production. a range of interventions including the increased use of fertilizers has supported this trend. Increase in fertilizer use mirrors the gains in productivity, although to maintain production it will require continual review of nutrient inputs. The challenge will be to ensure that future growth in food production is met by careful and targeted use of fertilizers.
Dr. Phillips is Director, IPNI Southeast US; Dr. Norton is Director, IPNI Australia and New Zealand. Reprinted from Better Crops with Plant Food, with permission of International Plant Nutrition Institute (IPNI).
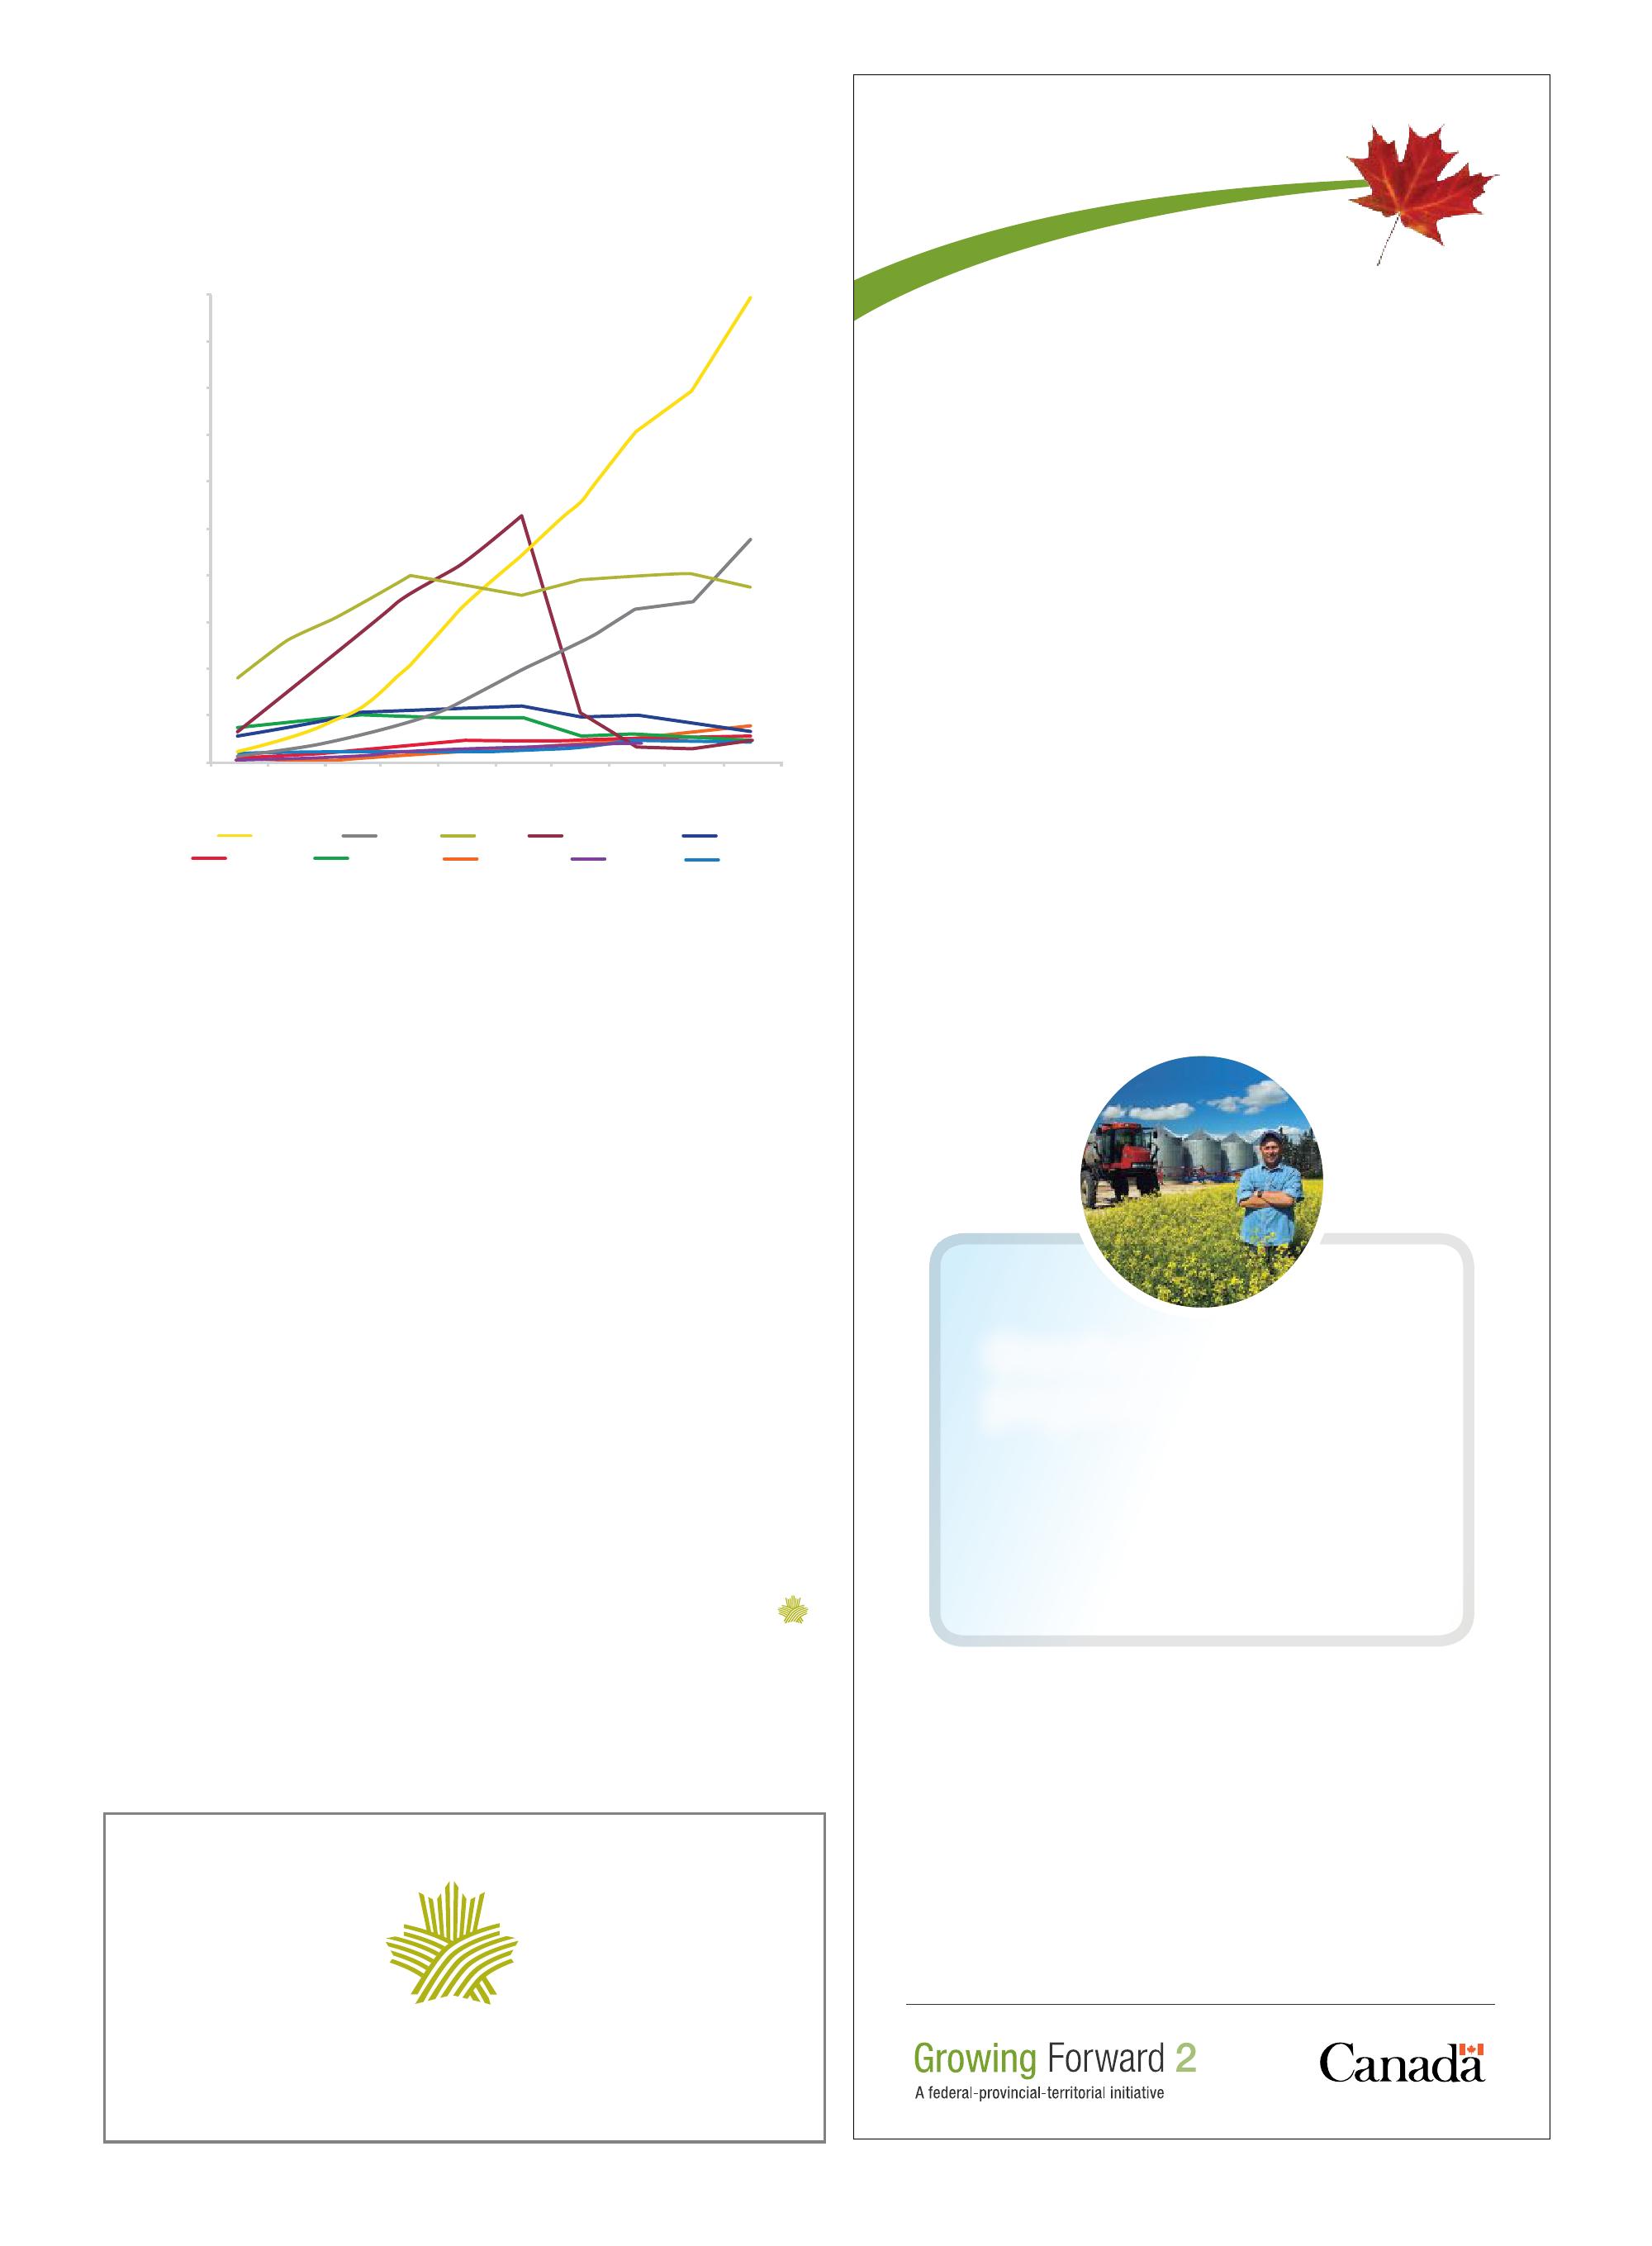
Growing Forward 2 is an investment of $3 billion in strategic initiatives to assist farmers like you find innovative ways to expand markets and stay competitive.
Learn more about these and other federal, provincial and territorial programs that can help you manage your business risks.
To find out more about federal programs and application deadlines, visit www.agr.gc.ca/growingforward2 or call 1-877-246-4682 today!
by Treena Hein
Managed permanent pastures are something that many crop farmers have – and the productivity of these pastures is closely associated with what species mixtures are planted and how many species are present. “ecological theory suggests that increasing the diversity of plant species in an area will provide higher productivity, resilience and resistance to invasive species, and we wanted to investigate this concept with mixed-grass forage species,” explains Yousef papadopoulos, a crop scientist at agriculture and agri-Food Canada (aaFC) and an instructor at the nova Scotia agricultural College in Truro, nova Scotia.
according to the 1996 census, there are 15.4 million hectares of pasture in Canada. “More than half of the pastures in the atlantic provinces consist mainly of permanent pastures,” says papadopoulos. “In my estimation, there are approximately 4000 beef and sheep farms in the three Maritime provinces and on average, each of these farms will have 40 to 50 acres of permanent pasture. Therefore, I believe the total acreage of permanent pasture in the Maritime provinces exceeds 160,000 acres.”
Productivity factors
although all the mechanisms aren’t yet understood behind the fact that plant communities with more species and more diversity of species are generally more high-yielding and stable than those with fewer species, the difference is significant. “natural grasslands are more resilient, for example, to stresses like drought than cultivated stands of lower species diversity,” notes papadopoulos. “It’s known that highly complex pasture swards have higher shoot and root biomass, as well as higher photosynthetic rates compared to simple ones.”
This is good news for farmers. papadopoulos notes that pasture production is one of the few agro-ecosystems where the level of plant diversity can be managed, and it’s therefore unique in that the benefits of biodiversity can be used to create a stable ecosystem capable of delivering forage consistently over the season. “However, in order to accurately assess the importance of species diversity,” he explains, “the effects of individual species must be singled out, and studies done so far have not measured combined benefits of species mixture and number of species.” For example, some pasture studies show that the positive effects of diversity are the result of the presence of a single species, such as the presence of n-fixing clovers in an n-limited pasture.
This is why papadopoulos (with colleagues Michel Mcelroy and
alan Fredeen at the nova Scotia agricultural College, Sherry Fillmore and K.B. Mcrae at aaFC’s atlantic Food and Horticulture research Centre in Kentville, nova Scotia, and John Duyinsveld at aaFC’s atlantic Food and Horticulture research Centre in nappan, nova Scotia) has investigated the effects of pasture species mixture – as well as the number of species within the mixture on pasture productivity. “We varied the number of perennial grasses in small plots that were then grazed for five years,” he notes, “and we also sought to identify specific mixtures that retained high productivity after stand establishment.”
The team seeded mixtures of four common pasture grass species – timothy, Kentucky bluegrass, reed canarygrass and meadow fescue in 2004 in Truro, nova Scotia, in two-grass, three-grass and four-grass combinations with white clover. “plots were rotationally grazed for five years, with dry matter yield (DMY) determined in the first post-establishment year (2005) and in three subsequent production years (2007, 2008, and 2009),” explains papadopoulos.
“Increasing the diversity of plant species in an area will provide higher productivity, resilience and resistance to invasive species”
The team found that the number of seasons – and both the mixture and number of species – have important effects on the productivity of rotationally grazed pasture systems. The average DMY for two-grass plots was significantly lower than for all others pastures, papadopoulos explains, because only two plant species cannot efficiently utilize available soil and light resources. With regard to seasonal results, the team found yields in the post-establishment year were much lower than in subsequent production years, but this is not unusual for a perennial pasture. over the latter production years, the four-grass plots produced significantly higher seasonal DMY compared with all other plots. “our results showed that it may take up to three years before a newly seeded pasture reaches full potential,” papadopoulos says, “meaning the compatibility of the stand becomes fully developed, maximizing the use of available soil and resources while maximizing sunlight interception.”
aside from the single four-grass mixture being a significantly
better performer, no other specific mixture of any of the grasses was better than any other. “However, timothy- and bluegrass-containing plots over production years did do a little better in terms of seeded grass growth and DMY,” papadopoulos notes. “We also found that the growth of unseeded grasses and forbs increased in mixtures with large proportions of timothy and reed canarygrass.”
However, in spite of the fact that mixtures containing timothy and bluegrass were shown to produce high DMY, the aggressiveness of bluegrass appeared to suppress the yield potential of timothy. “White clover yields and unseeded grasses/forbs were also both significantly lower in mixtures containing bluegrass,” he says. “We also found a favourable compatibility between meadow fescue and white clover growth, while bluegrass appears to suppress meadow fescue growth.”
“From this study, it seems that the positive effects of biodiversity on yield are in large part due to whether or not timothy and bluegrass were present in more complex mixtures, but the more species, the
better the yield as well,” says papadopoulos. “So, in recommending what farmers should do to achieve long-term, low-input productive pastures, I would say from this study that they should plant all four grass species with white clover.”
He notes that creating a forage stand that will remain productive for many years depends on selecting a compatible and welladapted mix and managing these species to make best use of their attributes. “Furthermore, a sward comprised of several adapted species will make efficient use of available resources throughout the growing season, slows encroachment by invasive species, and is more likely to perform well under a wide range of environmental conditions.” This study confirmed the benefits of complex mixtures in pastures, but papadopoulos says he and his colleagues have yet to identify which species now recommended in Canada should be included in those complex mixtures for the very diverse climatic conditions of eastern Canada and for the different grazing management strategies. “our research team is currently studying several complex mixtures in five locations in nova Scotia, Quebec, ontario and Manitoba, he says. ”

InVigor growers are just like other growers. Every day, they’re up before sunrise and work until everything gets done. Because when you love something this much, it’s not just a job. It’s everything.
InVigor growers might be just like every other grower, but the same can’t be said about their canola. InVigor consistently delivers early season vigor, high stress tolerance and superior yield. This year, grow with confidence.
This year, grow InVigor.
Learn more at BayerCropScience.ca/InVigor
by Blair andrews
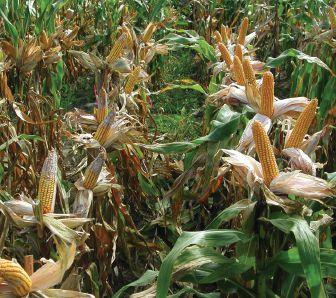
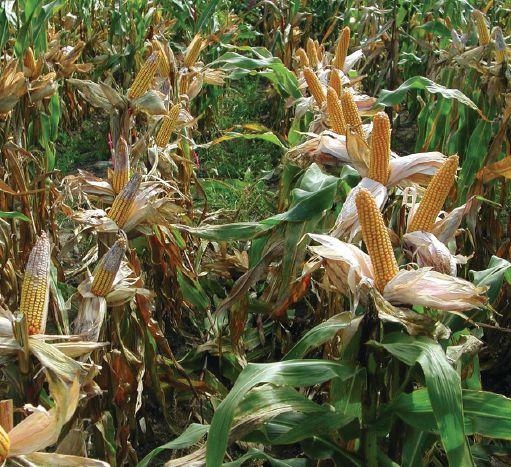
Finding corn hybrids that are resistant to gibberella ear rot has proven to be an elusive goal for ontario’s grain industry. Crosby Devitt, manager of market development and research for the grain Farmers of ontario, says funding research for disease resistance has been a key priority for the group, dating back to the inception of the former ontario Corn producers’ association in the 1980s.
He mentioned the challenge during a presentation of the gFo’s research priorities during a meeting of the ontario Corn Committee in august 2012.
“You would probably think that within the 25-year horizon, we’ll have this problem solved and we’ll be on to something else,” says Devitt of his remarks. “as it has turned out, it continues to be an issue today, and there are a few reasons why that is.”
Considered the most common and important ear mould in ontario, Gibberella zeae is the sexual reproductive stage of Fusarium graminearum.
Besides the economic impact due to yield loss, gibberella ear rot, also known as gib ear rot, is also important because Gibberella zeae and Fusarium graminearum produce two mycotoxins – deoxynivalenol (vomitoxin or Don) and zearalenone.
These mycotoxins are especially important to swine and other livestock producers because they have a detrimental effect on the animals.
For example, feed containing low levels of vomitoxin (1 ppm) can result in poor weight gain and feed refusal in swine.
While it may not be disastrous every growing season, Devitt says it shows up every year and has the potential to cause problems for farmers, especially for those who feed hogs or who sell into markets with low vomitoxin limits.
He says the industry is approaching the issue on several fronts including attempts to develop hybrids with genetic resistance.
“It’s not that we haven’t made research progress, I think what we’ve found is Fusarium is very complex, adaptable and genetically diverse itself. But corn genetics are complex too,” notes Devitt.
albert Tenuta, field crops pathologist with the ontario Ministry of agriculture, Food and rural affairs, agrees the industry is making progress but says the bar is moving up slowly.
In addition to weather conditions, he says, there are some agricultural practices that can also create a greater potential for gibberella and Fusarium ear moulds. These include higher plant populations, increased frequency of corn in the rotation, and higher residue levels of 30 to 50 percent.
“The more factors that are more favourable towards ear moulds and gibberella development, the greater likelihood that you will see
some degree of development,” adds Tenuta. as for hybrids, Tenuta says, the bar is also inching higher as companies are weeding out the more susceptible varieties and identifying more hybrids with better tolerance.
at Dupont pioneer, Dave Harwood, technical services manager, says there has been a concerted effort to raise the level of tolerance to gibberella ear rot since 2006, widely considered as the worst year for mycotoxin development so far.
“There were materials in the market in 2006 that had a level of gib ear rot resistance that was lower than the lowest materials that exist in the market today,” says Harwood.
In addition, he says, the company gives growers easy access to information related to its hybrids’ reaction to gib ear rot.
“We issue scores in our catalogues, on a one-to-nine scale, and those scores are very carefully determined, based on as much field experience as we can assemble,” says Harwood.
Tim Welbanks, agronomy lead for Maizex Seeds, says the company looks for hybrids that can open their husks early and can dry-down quickly. These characteristics are aimed at reducing the spread of a potential disease.
“If you can get that grain dry, then that starts to slow the spread of
the disease and you tend to get a little better grain quality,” says Welbanks.
recalling the problems of 2006, Welbanks says there were some hybrids that had tight husk covers that encased the ears in a moist environment, producing ideal conditions for ear mould growth.
as seed companies and farmers make adjustments in the wake of 2006, researchers continue to make progress on improving resistance for future varieties.
Dr. Lana reid, corn breeder with agriculture and agri-Food Canada in ottawa, says nine inbreds with improved resistance have been released from the program.
These ear rot inbreds have allowed aaFC researchers and others in many different countries to make scientific advances in studying ear rot in corn. The work also continues to develop resistant hybrids with high yields.
“part of the problem has always been breaking that resistance/yield barrier, and the two latest (inbreds) have quite good yield in combination with another inbred to produce a decent hybrid,” says reid.
“Some of the inbreds we have released have become the resistance check inbreds around the world now. So we’ve got higher levels of re-
sistance than what we’ve ever had before.”
reid says it’s an extremely difficult process to develop resistance because the interaction between the pathogens and the host is complicated.
There are also many genes involved. What’s more, environmental conditions are adding further complications.
“With the changes we’re seeing in longer, hotter summers, we’re also seeing a change in the dynamics of what Fusarium species are out there,” says reid. as a result, material that may have shown good resistance in recent years may not be suitable for future conditions.
While a quick and easy fix for gib ear rot is lacking, farmers do have some management strategies to help minimize the risk.
Both Welbanks and Harwood recommend planting a mix of hybrids. Welbanks says growing an earlier maturing hybrid or planting different maturities can help spread out the important flowering times of the crop.
“If there are disease spores during a certain week in July, when pollination occurs, if you have an early hybrid you might miss it,”
CONTINUED ON PAGE 23
“In this business, you deal with a lot of uncertainty –weather, soil, timing. You can plan all you want but you never really know how things will turn out.
“InVigor is the one thing on my farm I know I can trust. Year in and year out, it delivers early season vigor, incredible stress tolerance, and some of the highest yields I’ve ever seen.
“Why do I plant InVigor? Drop by at harvest and see for yourself.”
Learn more at BayerCropScience.ca/InVigor
S
Taking precision ag to new heights.
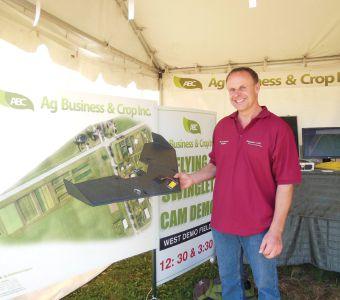
by Melanie epp
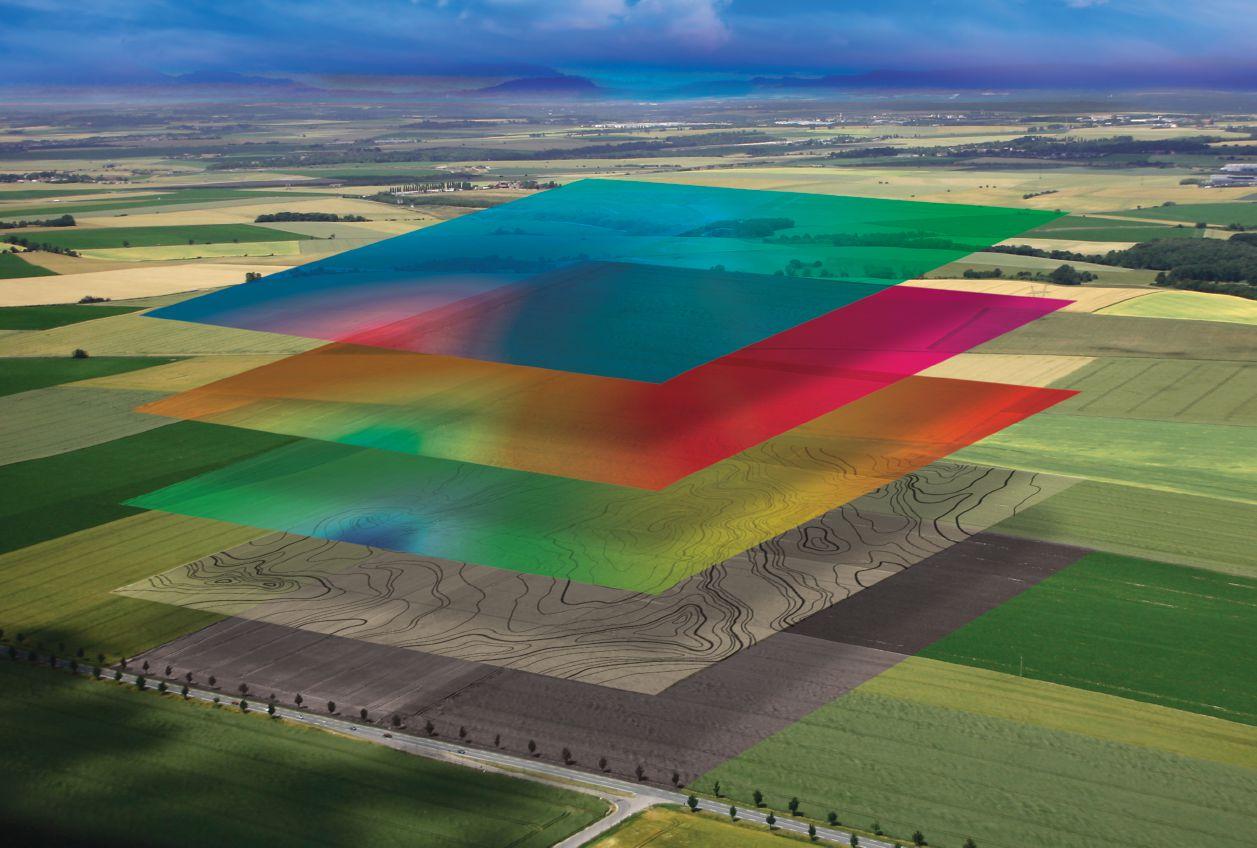
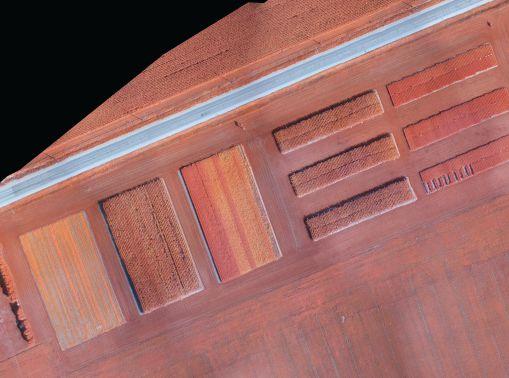
Technology is revolutionizing precision agriculture through the creation of exciting, innovative systems, and farmers have been quick to adopt these new technologies, particularly anything that reduces crop loss and maximizes returns. The Swinglet Cam is cutting-edge technology that takes precision agriculture to new heights, providing farmers with a tool that enables them to get a better idea of what’s going on in their fields.
as a farmer of 20 years and a technical agrologist, Felix Weber knows that there are variations throughout his fields. For years, he’s been using technology to learn more about those variations, their causes and how best to manage them. In 1992, for example, he was one of the first to adopt yield monitor technology. Using the data he collected over four years, he created yield maps, comparing the differences he saw throughout his fields to data he already had, for example, soil samples.
“That told me a lot, but really it didn’t tell me the whole story,” Weber says. He believes that those lower-yielding areas aren’t something you have to accept; you just have to manage them differently. You can only do so, though, if you know what you’re managing for. Drainage is probably the best example, but there are many types of losses that
farmers can experience that are likely very easy to correct. Until recently, though, technology hasn’t been sophisticated enough to allow for this type of micromanagement.
enter the Swinglet Cam, created by SenseFly in Switzerland.
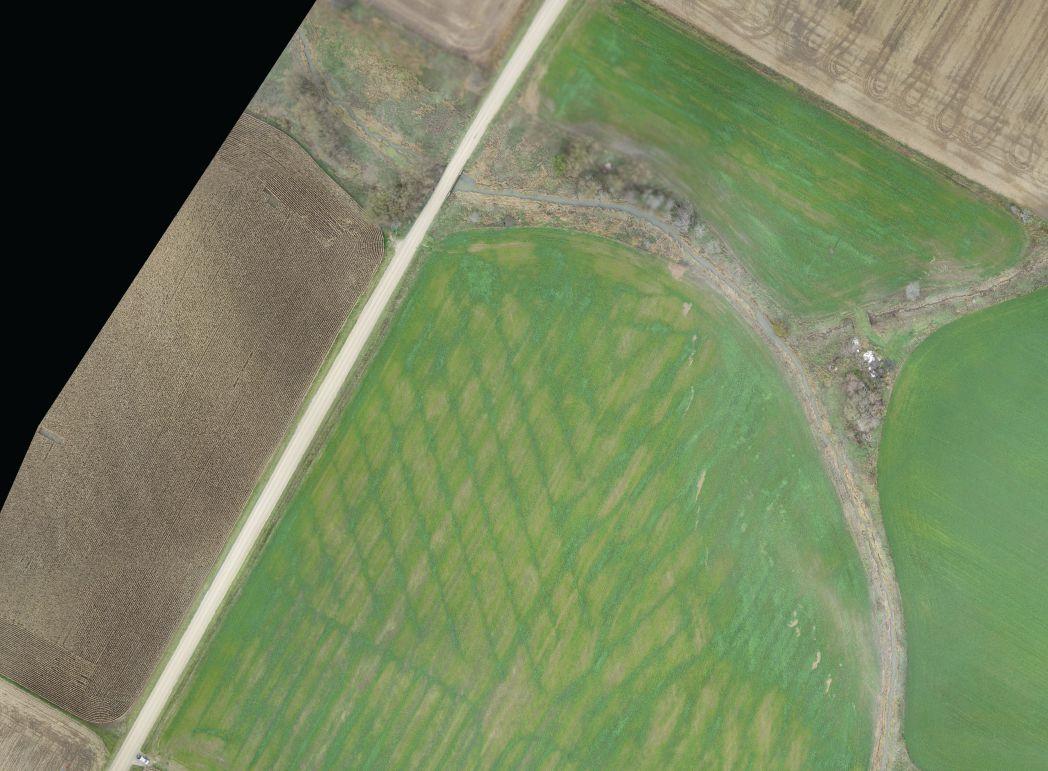
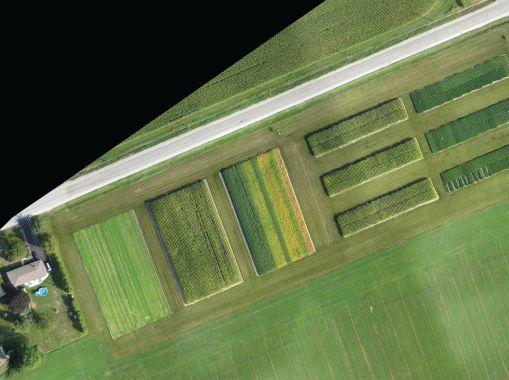
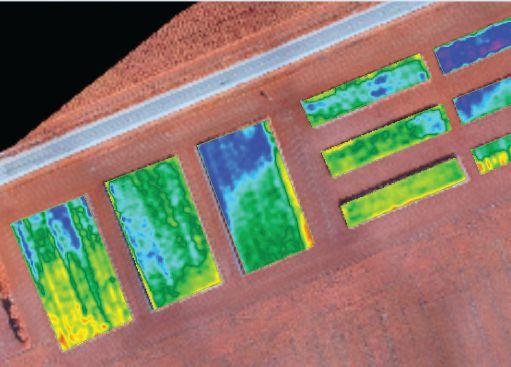
The Swinglet Cam is a flying camera that takes aerial digital images, which are later geo-referenced and stitched into 2D or 3D maps. The digital maps help farmers to locate trouble spots quickly, enabling them to act on pest problems or nutrient deficiencies better because you are able to see the good zones and stressed zones. as well it an easier process because you know where to look.
So how does it work?
once released, the landing speed is about three metres per second but the climb speed and cruise speed is more. although it has the ability to fly as high as 1,000 metres, in Canada, it can only be flown as high as 400 feet, and only with permission from Transport Canada. From above, the
TOP: The drainage map is geo referenced.
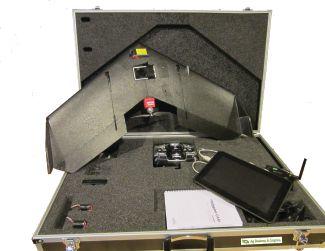
INSET: A Swinglet CAM and carrying case photo taken at the Woodstock Outdoor Farm Show.
camera takes digital images of crops and in just 30 minutes, it can create images for up to 150 - 200 acres. at lower altitudes, the area covered is reduced, but resolution increases. Images are stored on an SD card; once the unit lands, the images are easily transferred to a computer where the software orthomosaiced it together, creating profile maps.
The camera itself sits in a hard Styrofoam shell that weighs about 500 grams and has a wingspan of 80 centimetres. The device is sophisticated enough to take off and land on its own, returning to within 20 metres of its original takeoff position. operating in winds of up to 25 km/h, its light weight means that it can land on its own without any damage.
Weber uses two different cameras on his plane. He uses a “normal camera” – a Canon Ixus 12 megapixel camera – and an nIr (near Infra red) camera. In the near future, he hopes to use an upgraded 16-megapixel camera. Weber shows a preference for the nIr camera because the images it produces reveal potential problems before they even occur, but both types of cameras work quite well.
In the past, Weber says, he used satellite imagery on his farm, but felt that it just wasn’t good enough. He didn’t like having to depend on someone else to collect the data, a process that is highly dependent on weather conditions. If, for example, there is cloud coverage, satellite images cannot be collected. on top of that, Weber didn’t like that he had no control over timing and felt that as a result response times were too slow, sometimes as long as two weeks.
“Within that time period, the weather changed,” he says. “Whatever I saw on the satellite image was not reflected when I walked the field after, so to me that was useless.” The response time using the Swinglet Cam, however, is very short. Depending on the quality you want, it can be as short as an hour or as long as a day. “Because my response time is so short, I may be able to do a treatment right off the bat,” says Weber. although the Swinglet Cam wasn’t created with the agricultural industry in mind, it has become an invaluable tool to farmers like Weber. Its ideal users are farmers with over 1,000 acres or farm consultants who may want to support field walks.
often, he says, the Swinglet Cam will pick up on a problem before farmers do on foot. “By the time the crop shows us there’s a problem,” he says, “That crop is sick. That crop is stressed.” If there is a fungus stress in the crop, for example, by the time you see if with your eyes, it’s probably quite advanced. Fungicides can’t reverse the process, but knowing there’s a problem earlier can help to avoid it altogether. at a starting cost of less than $13,000, the Swinglet Cam can pay for itself, especially on larger operations. Weber knows a farmer who’s flying over his fields every two weeks to look for changes in his crops. Weber himself uses it to see patterns. The Swinglet Cam can be used to scout fields for variances from the air, to reveal bare soil differences, and to look for drainage problems. It can also be used to improve things like your spring nitrogen application. While Weber’s focus is mainly on looking for stress in a growing crop, others could use the Swinglet Cam to make better management decisions that could save money in the long run.
“I could see this being used as a tool to calculate crop loss due to spray drift,” says Weber. It can help to determine the right time for doing an application, and to decide whether or not the crop is worth keeping.
“From the ground it looks different than it does from the air,” says Weber. From the air, he can see what percentage of the crop is good, and what percentage is not so good.
as with all new technology, only time will tell how it will be used. For now, Weber says, its uses are endless. “We’re really barely scratching the surface of what this can do,” he says, “as every new tool comes out, we have to learn how to use it – find out what’s useful, and what’s not going to work.”
Too little, too much or just right.
by Donna Fleury
Finding the “goldilocks” moment depends on many variables. Seeding rates and optimum plant populations for soybeans are a factor of equipment, timing, soil temperature and weather conditions.
“There is always lots of discussion about what optimum row spacing and plant populations should be used for growing soybeans,” says Dennis Lange, farm production advisor, crops, with Manitoba agriculture, Food and rural Initiatives (MaFrI). “The typical seeding rate recommendation is 180,000 to 210,000 plants per acre, depending on the row spacing. For an eight-inch row spacing, 210,000 plants per acre is recommended, while a 22- or 30-inch row spacing should be 170,000 to 180,000 plants per acre.”
In 2010, a three-year study was initiated by the Manitoba pulse growers association (Mpga) to compare multiple seeding rates using different seeding implements with different row spacing in a full field-scale environment.
“one of the objectives was to determine if there were any significant yield differences between the different row spacings,” says Lange. “although overall there were little differences in yield, growers should still be cautious when reducing plant populations to try and save seed costs. [It] raises risks particularly if there are poor weather conditions or the potential for frost damage like we saw in 2012, increased weeds and diseases and other concerns. If you drop the plant populations too low, there will be limits to optimizing yield potential.”
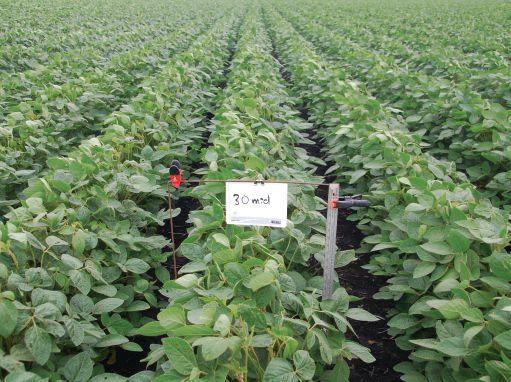
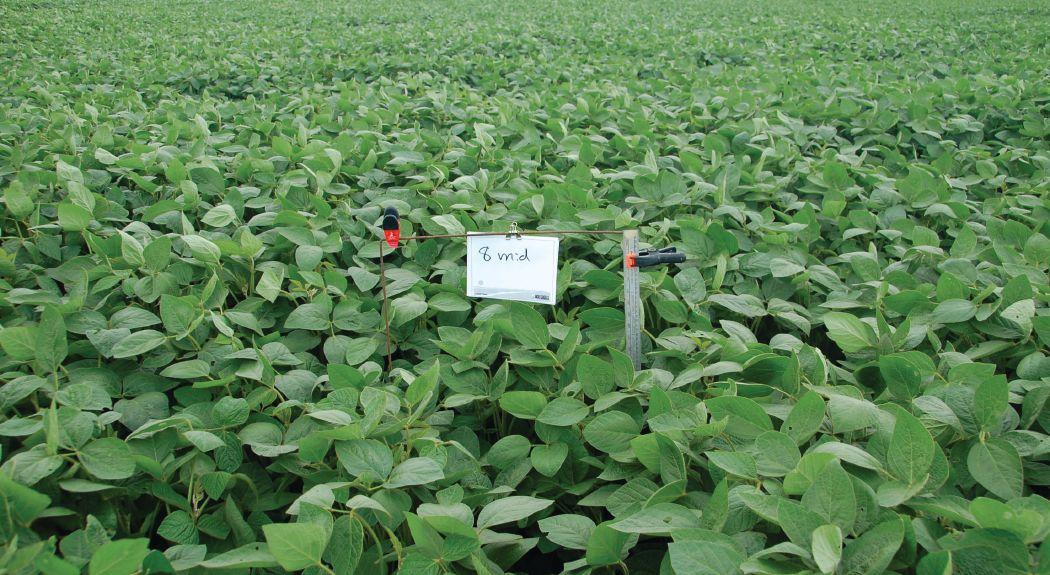
Brent VanKoughnet of agri Skills Inc. of Carman, Manitoba, conducted the three-year study for Mpga. “In 2010, we compared eight-, 10- and 15-inch row spacings at three different seeding rates of low, medium and high, using a vacuum planter and two different air drills,” says VanKoughnet. “In the next two seasons we compared eight-, 15- and 30-inch row spacings. In 2012, we also com-

pared two different varieties: pekko, a more upright architecture variety, and DK 2510, a bushier variety.”
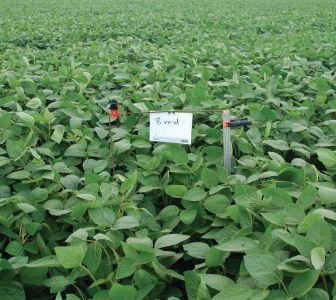
overall, the planter provided the best placement and emergence results under a broader range of conditions over the three years. However, the differences did not always translate into yield differences. In 2010, seeding conditions were very poor and the planter had better results and higher yields than the air drills, but in 2011 and 2012 the yields were very similar.
“The planter performed better in some cases because the machine places all of the seeds in a single row, resulting in a single crack down the entire row in the field and every seed comes up in that crack,” says VanKoughnet. “every plant that survived was within five percent of each other in height, resulting in an evenmaturing stand. In comparison, the air drills may have had good plant survival rates but still resulted in more variability and more distressed or less vigorous plants. This may be due to depth control, lumps and crusting, and/or surges in the air tube that can leave gaps in placement.” at mid-season, some plants were 50 per-
cent of the height of the most mature ones, which can potentially create problems at harvest in areas where frost may be a problem.
The difference in optimum seeding rates has a lot to do with plant survivability, adds VanKoughnet. “overall with a planter, the study showed that using a seeding rate of 140,000 to 150,000 seeds per acre to end up with 125,000 plants that survive yielded as well as higher seeding rates. If conditions are poorer, then 150,000 to 160,000 seeds per acre may be required to achieve that final stand,” he notes. “of course, you can’t always predict what conditions will be. With an air drill and usually lower seed survivability, increasing the seeding rate by at least 25,000 seeds per acre is typically recommended.”
Seed size also matters, so be sure to calculate the appropriate rate. plant by seeds per acre not pounds per acre. growers may get away with lowering seeding rates, but that is only if 95 percent of the seeds survive. In a poorer year where only 65 percent of the plants survive and a very tight seeding rate was used, then yield losses can result.

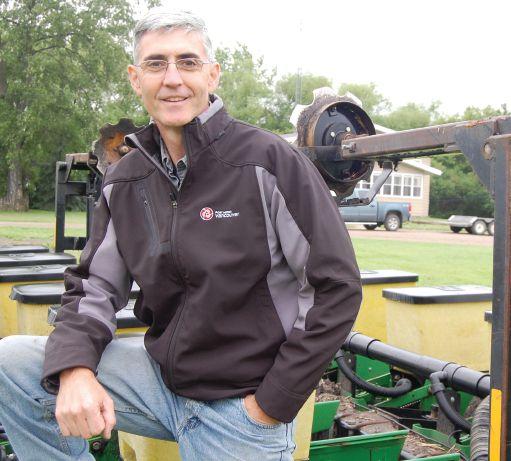
Brent VanKoughnet of Agri Skills Inc. says that during a threeyear study, the vacuum planter (shown) provided the best placement and emergence results under a broader range of conditions over the three years. However, the differences did not always translate into yield differences.
In terms of row spacing, there was little difference between the narrow and wider row spacing in all trials, except in 2012 when the 30-inch spacing showed some disadvantages on the early maturing upright variety only. “We are still not sure what the reason was, but in the 30-inch row spacing with the more upright variety we did see a slight yield penalty,” says VanKoughnet. “The 30-inch rows in this variety matured about four or five days earlier than the narrower rows and potentially weren’t able to take advantage of the last rain we got at the beginning of august. So we aren’t sure if it was because of the moisture timing or if it was because the 30-inch spacing took longer to fill in the rows and was subject to more heat and wind evaporation. This was not observed with the bushier variety.”
Timing of seeding is also critical and soybeans should be seeded into soils that are 10 C or warmer. as a general rule, the faster the seeds come out of the ground, the more uniform they are and the better they grow.
VanKoughnet also conducted another project in 2012 in which they compared five different seeding dates replicated seven times in the same field starting at the end of april and seeding for five weeks until the end of May. at the end of the season, the latest seeded crop yield was virtually the same as earliest one.
“That means that seeding early provided no premium, but did introduce some risk and it’s probably better to wait until the soil is warmer in mid-May, unless wet weather is forecast,” notes VanK-
oughnet. “However, waiting to the end of May is not recommended either, as that could be too late in some years and in marginal heat unit areas.”
The study also showed that the blacker the soil, the better, because where there was an early frost, the small plants were much more susceptible where there was trash in the rows. For growers direct seeding, heavy trash fields could make the crop much more vulnerable to frosts.
“Ultimately, whether you choose to use a planter or an air drill will depend on how big your farm is and what equipment you already have,” says VanKoughnet. “If you have a good air drill and grow maybe less than a half section of soybeans, consider just spend-

CONTINUED FROM PAGE 15
says Welbanks.
“If you have a 200- to 300-split in heat units in your maturities, then you know the germplasm is going to be a little bit different and your flowering dates are going to be different.”
In addition to a mix of hybrids, Harwood says insect protection is another consideration. Western bean cutworm, a relatively new pest to ontario, has been observed in pockets where gibberella ear rots have occurred. “The insect damages the ear and forms an entry point, but as well those insects create a moist, microclimate where they’re feeding, and it just allows an environment for the pathogen to reproduce,” adds Harwood.
Tenuta agrees, saying growers concerned about gib ear rot need to look at other factors besides high yields when selecting corn hybrids.
Depending on the end market or agronomic practices, he suggests choosing a hybrid with a high rating for gib ear rot. “If you’re a livestock producer, a hog producer, somebody who is growing corn on corn, has higher residue levels or plants higher populations, narrower rows… all of those factors could increase your risk to ear moulds,” he says.
The use of fungicides is another area that is showing signs of progress.
Tenuta says research at the University of guelph, ridgetown Campus, is focused on applying fungicides on the ears during silking to reduce the development of gibberella and Fusarium ear moulds.
“There has been promising research that shows that it is a potential tool that could be used,” says Tenuta.
as with other potential crop threats, identification is a key piece of the strategy to manage gib ear rot.
Tenuta also says that Diplodia, which produces a white, mouldy growth on the ear – but does not produce a toxin – could potentially be confused for gibberella ear rot.
He says a hybrid with a high rating for gibberella may not protect the crop from some of these other diseases.
ing the extra money on higher seeding rates. However, if you are seeding more than a half section, then start thinking about a planter.”
There are some reasonably priced secondhand planters available, mostly 30inch, which might give more flexibility. In 2011, with the short seeding window, some growers were relieved to be able to finish seeding canola and wheat at the same time they were seeding soybeans because they had both an air drill and a planter.
Van Koughnet is planning to continue the project another year, and hopes to be
able to compare different air drills as well. “Some of the newer air drills with individual run depth control and on-row packing may be able to provide more precise placement similar to a planter, depending on conditions,” he says. “although so far we didn’t really see huge differences in yields, growers should be using recommended seeding rates to manage risk, which provides insurance in years where conditions are less than ideal and yields aren’t compromised by using too low seeding rates.”
Farmers are taking advantage of new communication technologies.
by John Dietz
The boys and their toys are changing down on the farm, for good reason, according to ontario dairy farmer and social media consultant andrew Campbell.
When they were coming on the market a decade ago, a lot of farmers thought they’d never need cellphones. now, some can’t be found without the cellphone or its successor, the smartphone. This year, Campbell thinks it’s likely that Twitter on the farm will be even hotter.
The smartphone was new two years ago, and “almost nobody” had it when Campbell asked who was using it a few years ago. “Most were thinking, I have zero use for this. It’s another expensive piece of technology that I don’t need,” he says.
During Manitoba ag Days in Brandon this past January, about a third of the audience raised their hands to the question. “at least a third of farmers have smartphones today and that’s expected to be half by the end of 2012,” adds Campbell. “at meetings already, at least half have smartphones now.”
Smartphone benefits for farming have ramped up very fast. The first BlackBerry units offered e-mail with a cellular phone. now, it’s much more – and there are three major “platforms” competing for the market. The three platforms do very similar things, but they don’t necessarily work together very well.
The platforms are BlackBerry, iphone and android. The android smartphone is generic in that it is open for companies to develop their own versions. It includes makers like Samsung, Motorola and HTC. BlackBerry was first, and has more users in the farm market, but that’s also changing.
any one of these features can more than pay for the investment: instant weather updates; live market prices for grains; instant ability for video and photography; gpS mapping services; ability to download information from the Internet; ability to upload information with e-mail.
“You have a full keyboard now to be sending messages to partners and employees,” says Campbell. “You can pull up the price of grain on your phone in the middle of the day, and probably pay for that device for the entire year. now you carry an HD video camera in your pocket; it’s almost unbelievable what you can do with this. That’s why this has come so quickly. Before long, every farmer will have one.”
Like an equipment dealer, the service provider is more important than the phone. Before buying one, be sure the phone will
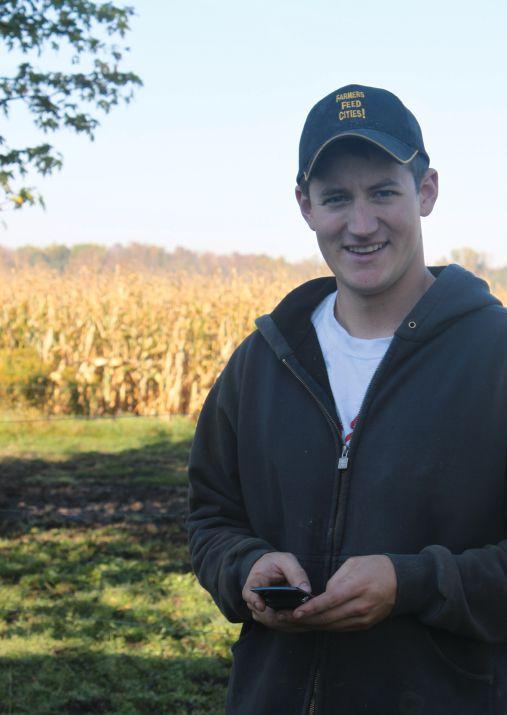
Andrew Campbell has 2,500 Twitter followers.
have service where you need it. High-speed cellular service is expanding as fast as the smartphone market, but it isn’t everywhere for every company and every phone.
Campbell describes the smartphone as an electronic farming tool, like a knife, pliers or a wrench. It’s important, highly useful and replaceable. “They don’t last long; they become outdated, mine don’t live that long,” he says. “When you get a smartphone, assume that in two or three years you’re going to change it. Service providers subsidize that phone pretty heavily so, if you break a contract after they
give you a $400 phone, the most you stand to lose probably is $400.” one good thing to do before signing a contract is to consult with any partners, family or friends involved in the farming operation. It’s easier to share information if the group is using one type of platform. as dairy farmers, Campbell and his three partners decided to use an android platform. It was a tough decision. For them, the right choice turned out to be android when they heard about a dairy application that was being released for the android platform.
“I wish there was an applications store for farming,” he says. “Industry has been blindsided by the rate of adoption, to this point. I think the next big step will be in applications that farmers are going to use every single day to run their farms.”
among the major social networking platforms, Campbell discusses Twitter, Facebook and YouTube. all three can be a source of information and a way to share, or upload, information.
YouTube is the home for video, including video that is directly useful for farming. For the skeptic, he suggests trying a couple of searches on YouTube.
“Type ‘how to…’ and then whatever you have a problem with. You’d be amazed by the results that come up,” says Campbell. “I’ve seen a lot of videos from equipment dealers, showing how to fix a piece of equipment, or set it up, or doing a demo. You don’t need to fly to georgia to see something you may want for the farm.”
YouTube is a two-way street in that if you have HD video on a smartphone, it also can be uploaded easily to YouTube to share with others. “post your video so other producers can see the pros
and cons of that piece of equipment. You can help other producers make more informed decisions. Videos have a pretty important role to play in farming.”
Facebook is less useful but can be very helpful as a tool for farmers who are trying to connect with consumers. It’s estimated that half of the 800 million Facebook members check in every day. “If you’re trying to sell to consumers, or just want to raise awareness about your product or about an issue, Facebook is a critical tool today,” notes Campbell.
However, Facebook can also be overwhelming by providing too much information, and too much advertising. probably it’s less effective for a farm business than either YouTube or Twitter.
The power of Twitter is that messages are limited to 140 characters, making them too short for advertising. It’s easy to scroll through dozens of new messages in a couple minutes, getting quick updates on anything from train wrecks to rain that’s falling a few miles west. often, the messages contain a link to more information.
Campbell once posted a question, asking for experience about using bagged silage. “I got dozens of responses about things to keep in mind,” he says. “They were very positive, but a couple said it’s critical to put it on a cement foundation and critical to check it every couple weeks to tape over any holes you find. So now if we do go that route, we’ll be about two years ahead on the learning curve.”
It takes about two minutes to set up a Twitter account, by going to www.twitter.com. You enter a user name, personal name and e-mail address. after that, the new member decides which other members’ tweets to follow, and Twitter helps with that by making suggestions.
choose any of the spray tips in our extensive line to replace your non-teeJet nozzles.
Only TeeJet offers:
• The broadest selection in the industry – more types, sizes and materials than any other supplier
• Spray tips designed, manufactured and tested by us in the USA

Why risk your big investment in chemicals?
Make sure you’re using the best spray tips available. act by may 31, 2013 to trade up to teeJet.
Specialization in spray tips. Our focus is on spraying – and has been for more than 75 years


CommuniCations manager Farm & Food Care
ontario
| Kelly daynard
Farmers need to take a more active role in communicating about farming to the Canadian public.
In ontario, it’s been more than 20 years since an alliance of ontario’s field crop and horticultural farmers came together to form agCare (agricultural groups Concerned with resources and the environment) and simultaneously, leaders of livestock organizations did the same thing to create our sister group, the ontario Farm animal Council (oFaC). earlier this year, the two coalitions amalgamated to become Farm & Food Care ontario.
This coalition approach is now something that Canadian farmers take for granted and it works.
For almost a decade, Farm & Food Care has been taking the pulse of Canadians on a regular basis through nation-wide focus group testing. In the last study, commissioned this past summer, a whopping 93 per cent of Canadians surveyed indicated they knew little or nothing about farming, yet almost two-thirds said that they’d like to know more. This represents a great opportunity for farmers to share their stories with the consuming public.
o f course these numbers also represent a challenge, as most consumers don’t know where to go for information on food and farming, and struggle to understand that which they do. activist groups capitalize on this lack of understanding to create fear and uncertainty about the safety of conventional farming methods. Terms like “Frankenfoods” and campaigns like “The Dirty Dozen List” were coined by activists to create fears about biotechnology and pesticide use – and they work.
The same studies also confirmed that farmers are credible spokespeople – most Canadians maintain a positive impression of farming and are predisposed to thinking that farmers are both hard working and good people.
But, farmers have to do their part to communicate about their livelihoods.
Firstly, farmers need to ensure that their own farms are in order, so to speak. You should never have anything on your farm or in your barns that you wouldn’t easily be able to defend if it appeared on the front page of your local daily newspaper.
Farmers also need to speak up, correct misinformation and invest in the collective efforts of the industry. By speaking up for food and farming, like joining in on a conversation at church, talking to a stranger about locally grown food or correcting erroneous information being cited as fact at a dinner party, can make a significant difference. You could also send a quick email or letter to an editor to correct information in a paper or calling a radio show if it’s a topic that you can help to explain.
Farmers have to do their part to communicate about their livelihoods.
o n the animal side, all too frequently pictures and videos of undercover farm animal cruelty make the headlines when activist groups release them. animal cruelty is always unacceptable and these pictures are disturbing for anyone who cares for animals, especially farmers who know too clearly that these videos do not represent the norm.
Unfortunately, it is a sad reality that every industry is judged by its lowest common denominator. Farmers must work extra hard to defend the reputation of their industry when videos and campaigns are aired that raise questions about the health and safety of our crops and livestock.
Decades ago, there wasn’t a need for groups like Farm & Food Care. In 1931, one in three Canadians lived on a farm, but today is only one in 46. and unfortunately, while the number of farmers continues to dwindle, the number of activist groups is on the rise.
But farmers have a strong voice too. In that same consumer attitudes study, the majority of non-farming Canadians felt that farmers are part of Canadian culture, are an important contributor to Canada’s economy and do a good job of providing food at reasonable prices.
In the last couple of years we’re also seeing farmers turn to forms of social media like Twitter or Facebook to tell their stories. While we realize that this isn’t for everyone, an increasing number of farmers are seeing social media as a way to connect with consumers, promote their products or share their thoughts with the 98 per cent of Canadians who aren’t directly involved with food production. We think this is an exciting concept and the best part is that social media is free.
Your commitment to sharing your food and farming story doesn’t have to be big, but every little bit will help. Consider this: if 50 farmers each spent only 10 minutes a day for five days every week talking about what they do, that adds up to an impressive 2,500 minutes. The average employee working a seven and a half hour day, five days a week racks up only 2,250 minutes. This could mean 2,500 minutes of communicating from 50 credible sources speaking out about how they grow and produce our food. It’s certainly something to think about.
If you’re interested in learning more about how to be a good spokesperson for agriculture, visit Farm & Food Care’s website at www.farmfoodcare.org and click on the button promoting our library of Farm & Food resources.
At Case IH, we design equipment with a producer’s agronomic needs in mind. Our Quadtrac® technology, soil management and planting systems are designed to foster a better growing environment that maximizes yield potential. We’ve developed equipment that gets you in and out of the field effectively to make the most of short weather windows. And our deep understanding of agriculture helps producers when they need it most. Case IH agronomic design keeps producers ahead of today’s increasing demand. Will you be ready? For more information, go to caseih.com/agronomicdesign.