TOP CROP MANAGER


Welcome to Top Crop Manager Focus On: Soil Management and Sustainability! If the name sounds familiar to you, well . . . it should! This exclusive digital edition, the first in our summer digital series, comprises presentation recaps, photos and video coverage from the 2019 Soil Management and Sustainability Summit.
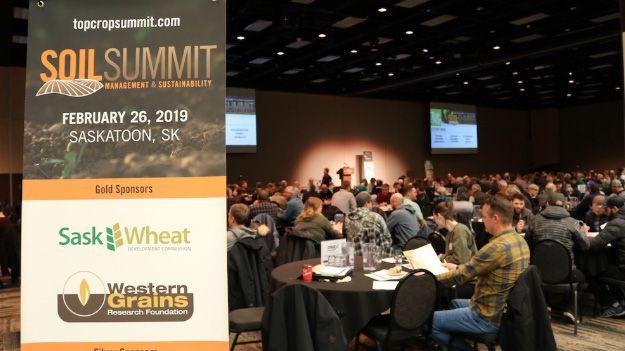
The Summit, held this past February in Saskatoon, was our biggest event yet. The sold-out crowd of nearly 400 producers, agronomists, scientists and industry representatives took in presentations from some of the top experts in soil health and wellness. If you were there, you’ll remember the great discussions, audience engagement and networking that took place. And, if you missed it, you’ve got the next best thing right here.
In this issue, you’ll read about soil fertility, intercropping tricks, manure strategies, soil, water and topography maps, and much more. If you see a photo with a “play” button on it, like the one below, go ahead and click it – that will bring you to an exclusive video from the event.
Stay tuned for the next edition of our summer Focus On series, where we’ll bring you results and highlights from our 2019 Ag Succession Planning survey.

Editor: Stefanie Croley
Associate Editor: Stephanie Gordon
Western Field Editor: Bruce Barker
Associate Publisher: Michelle Allison
Group Publisher: Diane Kleer
Media Designer: Brooke Shaw
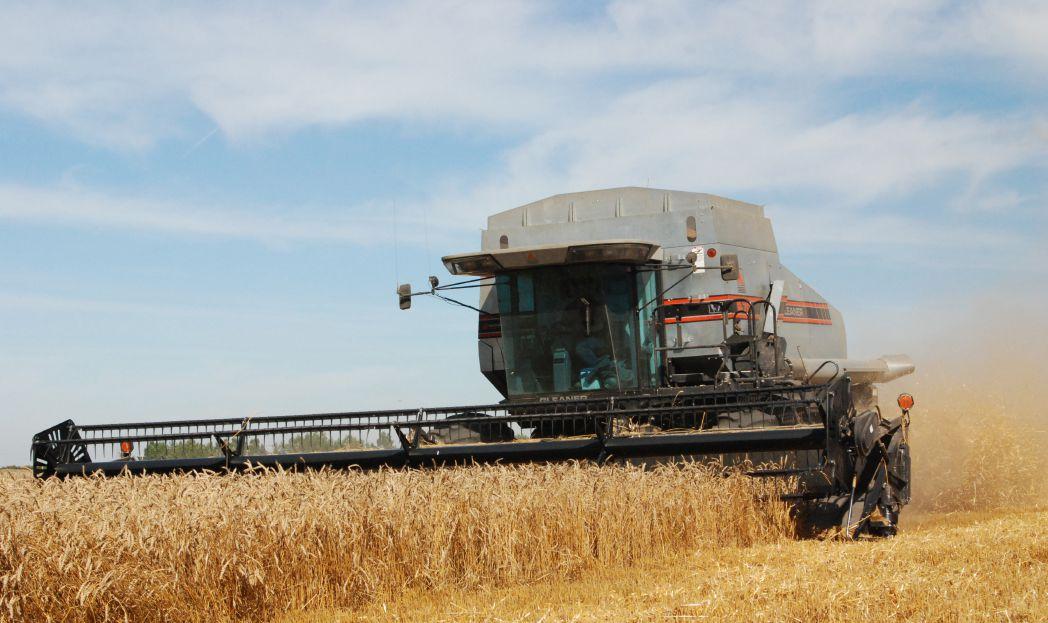
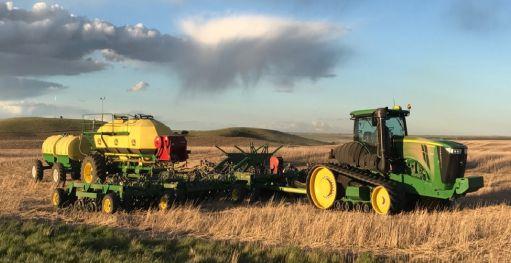
What’s your plan for soil sustainability? Derek Axten, of Axten Farms, and others, provided insight at the 2019 Soil Management and Sustainability Summit.
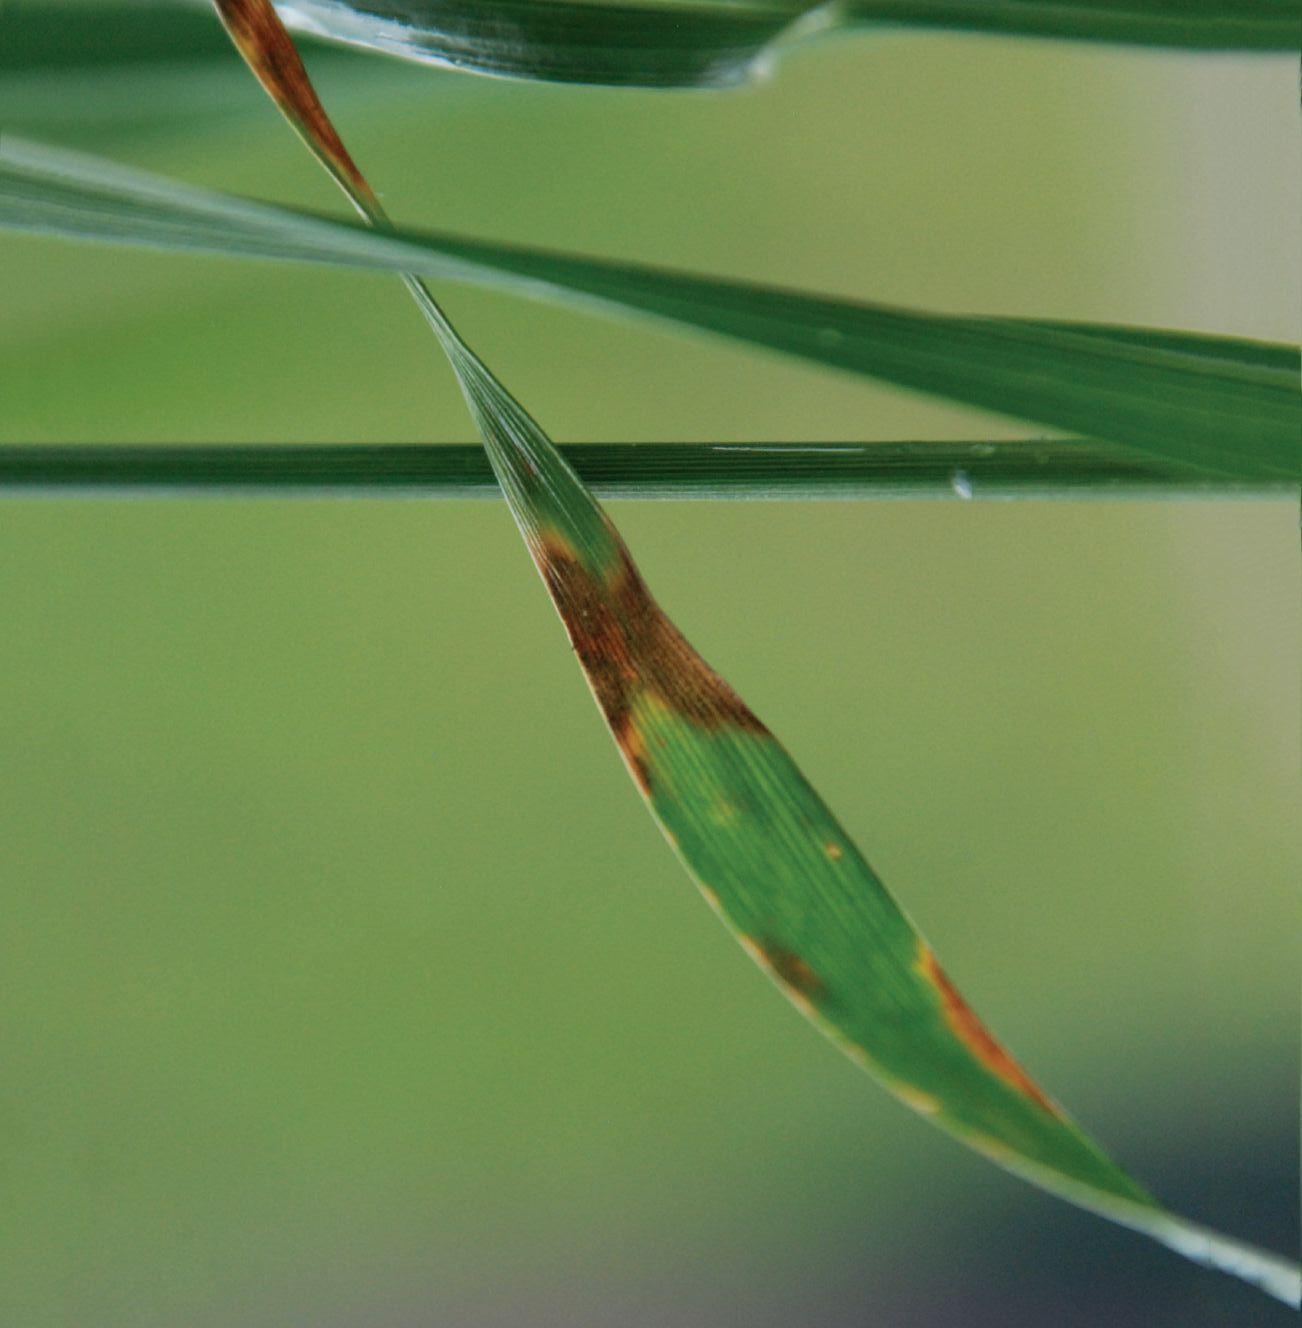
Relevant recommendations for today’s yield potential.
Presented by Don Flaten and Amy Mangin, University of Manitoba, at the Soil Management and Sustainability Summit, Feb. 26, 2019, Saskatoon.
Where did this project come from? The current provincial guidelines for crop fertilization in Manitoba do not address the high yield potential of the current varieties of spring wheat that can exceed yields of 90 or 100 bushels an acre. The existing recommendation of 2.5 to three pounds of total N (soil reserves plus fertilizer) per bushel of hard red spring wheat means you would need a total of 200 to 300 pounds of N for 100 bushels of spring wheat. That means a very large financial, agronomic, and environmental risk.
Let’s look at our so-called “current” information in Manitoba. With CWRS Neepawa wheat in the early 1970s, we had a potential of maybe 45 to 50 bushels per acre maximum yield in Manitoba studies. That’s not the same as the yield potential we have now with current varieties. To come up with recommendations that are relevant to today’s yield potential, we had to revisit something as basic as nitrogen fertilization.
The research questions that we attempted to answer in this project:
• How much N do our current spring wheat varieties require to reach economic optimum?
• Can we increase our nutrient use efficiency (NUE) by altering our N source and timing of application?
• Can we estimate the amount of organic soil N that will be released to the crop by mineralization during the growing season?
• Can we predict N sufficiency for yield and protein during the growing season?
• Can post-harvest soil NO3-N tests taken after the wheat crop is harvested be used to “audit” the accuracy of N budgets?
ABOVE: Two pounds of N per bushel measured as the total of soil test nitrogen plus applied N fertilizer applied was a pretty good rule of thumb for maximum economic yield.
We set up our experiment in southern Manitoba. Eight siteyears of field trials were conducted with two high yielding wheat varieties: AAC Brandon (Canadian Western Red Spring class, CWRS) and Prosper (Canadian Northern Hard Red class, CNHR). High intensity “Gold-level” experiments were conducted at Carman and Brunkild during both seasons (four site-years) and managed by the University of Manitoba (U of M). Less intensive “Silver-level” experiments were conducted at Melita in both seasons, Carberry in 2016 and Grosse Isle in 2017 (four site-years) and were contracted out to provincial and independent research stations.
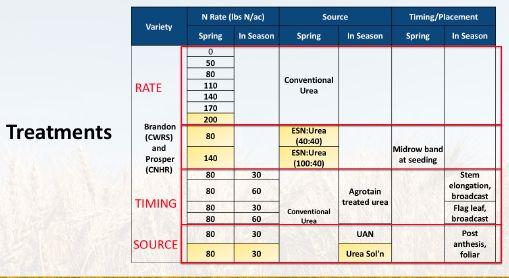
The gold-coloured cells represent the additional treatments at Goldlevel sites.
How much N do high-yielding spring wheat varieties really need?
The first question was do our new varieties really need two-and-ahalf or three pounds of N per bushel?
The Gold-level sites all had between 40 and 50 pounds of residual soil test nitrate-nitrogen to start off the growing season. The optimum economic fertilizer rate at each of our four Gold-level sites was 140 pounds of N on top of the 40 to 50 pounds of residual soil N. The total N for the soil plus the fertilizer was anywhere between 180 and 187 pounds of N per acre. Our optimum yields were quite variable, anywhere between 62 and 110 bushels per acre, with the lowest yielding site impacted by a midsummer hailstorm. The typical total amounts of nitrogen (soil plus fertilizer) for the crops that were not damaged by hail were about two pounds of N per bushel of yield at the optimum N rate.
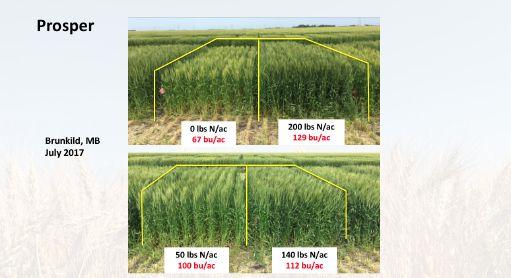
At the highest yielding site, Brunkild Gold 2017, the treatment without any nitrogen fertilizer still grew 67 bushels per acre. That’s about three times the provincial average yield in 1970. A lot of farmers might say, “Well, 67 bushels per acre, why don’t you just stop there?” The answer is that if you put on an additional 140 pounds of N, you could get 112 bushels per acre. That’s a 45-bushel yield increase for about $65 worth of fertilizer – a very profitable investment.
The Silver-level sites had spring nitrate soil levels ranging from 11 to 89 pounds of residual nitrate-N. At Carberry for example, because of the high residual nitrogen of 89 pounds per acre, and a large amount of mineralization at that site, it only took 50 pounds of fertilizer N to reach our optimum economic yield. We achieved 95 bushels of wheat per acre with only 50 pounds of additional N applied per acre.
Across all sites, two pounds of N per bushel measured as the total combination of soil test nitrogen at the beginning of the growing season plus the amount of fertilizer applied was a pretty good rule of thumb to estimate what was needed to reach optimum economic yield.
The Gold-level sites had a comparison between an ESN blend and urea applied at planting. We measured no differences in NUE, but 2016 and 2017 in Manitoba were a little drier than average. If we didn’t have losses because of leaching or denitrification, we didn’t really need an enhanced-efficiency fertilizer. Banded urea is pretty stable and secure in a relatively dry growing season. The ESN blend didn’t benefit protein content either, but once again we wouldn’t have expected much difference given the relatively dry growing seasons.
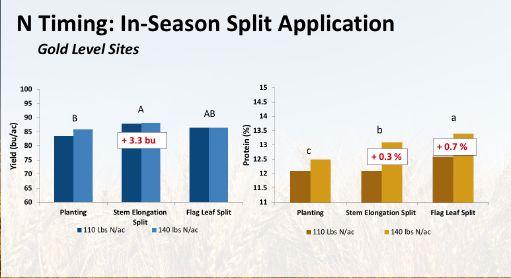
Looking at application timing, split rates were applied with 80 pounds N at planting plus 30 or 60 pounds at stem elongation or flag leaf. These were compared to equivalent rates of 110 or 140 pounds applied entirely at planting. At the Gold-level sites under a moister growing environment, there was a 3.3 bushel yield per acre advantage with a split application at the stem elongation stage. Deferring part of the N application until stem elongation increased protein by 0.3 per cent and deferring part until flag leaf resulted in 0.7 per cent higher protein.
At Silver-level sites, the split application didn’t produce any significant differences in yield, compared to applying all the N at planting. And that’s actually good news, because if you can delay your timing of application until you have a better idea of growing conditions and yield potential, that’s a good way of managing risk.
With protein content at the Silver sites, delaying the application of nitrogen till flag leaf resulted in a significant increase in protein of 0.4 per cent for the same amount of nitrogen that would have been applied either all at planting or a combination of planting and stem elongation.
However, the success of our mid-season applications needs to be interpreted in the context of our plots receiving timely rainfall, shortly after application. For example, in our trials at Brunkild in 2016 and 2017, our stem elongation applications were followed
within a few days with a decent amount of rainfall. We had the same type of precipitation with our flag leaf applications. If you don’t get rainfall after a mid-season application, you can get stranding of your nitrogen fertilizer and it can be completely useless. Guy Lafond and Chris Holzapfel have found that on occasion at Indian Head, Sask. Rigas Karamanos also found that with some spring wheat fertilization trials in Alberta and Saskatchewan.
We also applied N fertilizer after flowering (anthesis), which generally has been used as a method to increase protein content only. At this point in the growing season we wouldn’t expect there to be much influence of the fertilizer on yield. Therefore, we compared 80 pounds at planting plus 30 pounds N at post-anthesis to the base rates of either 80 or 110 pounds of N applied all at planting.
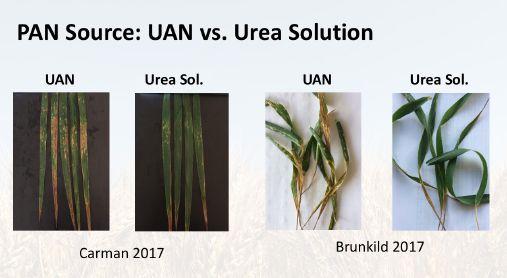
Post-anthesis application, spraying nitrogen on plant leaves, is a dangerous business because you can burn your crop. The source of N was diluted UAN solution (28-0-0 diluted 50:50 with water to 14 per cent N solution) and a urea solution (dissolved in water to 9 per cent N solution). With these dilute rates and applications in the late evening, at our Silver sites, even with all those precautionary measures, we ended up with a yield depression with the postanthesis nitrogen as UAN. The split application with 30 pounds of post-anthesis knocked down the yield by 3.3 to 7.1 bushels per acre. The post-anthesis applications at the Silver sites increased protein content by about four per cent, but burning your crop and decreasing the yield to get a protein increase is a pretty extreme measure.
In the post-anthesis application at the Gold-level sites, yield with a split application at post-anthesis was equal to all of the N applied at seeding. However, in terms of protein content, there was a significant increase of 1.7 to 1.8 per cent absolute protein content, so there is some potential for the post-anthesis application to improve protein content.
The dissolved urea was less harsh on the leaves and had a yield advantage of about 4 bushels per acre compared to the diluted
UAN. Protein content was also increased with a dilute solution of urea by 0.6 per cent compared to UAN. We saw less leaf burn and more effective uptake for both yield and protein with the dilute urea solution.
Can we estimate the amount of organic N coming out through mineralization?
A question that we wanted to address was to predict mineralization of the soil’s organic nitrogen during the growing season. Mineralization potential and the amount of mineralization that actually occurs vary a lot depending on the management history, soil type, and all sorts of other factors. We wanted to see if we could find some tools that would help us to predict how much nitrogen would come out of that soil organic matter.
Our field trials were all in the Black soil zone in the warmer, moister part of Manitoba. Even with that similarity across sites, when we looked at the estimated N mineralization during the growing season, there was quite a bit of variability, all the way from 35 pounds of mineralized N during the growing season for Brunkild in 2016 to the Carberry 2016 site with 130 pounds of N mineralized during the growing season.
A lot of people use per cent organic matter in the soil as a means of predicting the amount of nitrogen that would be released as mineralized N. Across our eight site-years we didn’t find any relationship between soil organic matter and the amount of nitrogen that came out of the soil in our check plots. That’s probably because total soil organic matter includes a lot of relatively stable, inert organic matter that’s not going to decompose very quickly.
We wondered if the spring residual nitrate level like we saw at Carberry, which had a lot of soil test N at the beginning of the growing season, might be an indication of a high rate of mineralization, too. However, that site was an oddball. When we examined the dataset across all eight site-years, there was no relationship between residual soil test nitrogen at the beginning of the growing season and the N mineralized from soil organic matter during the growing season.
Professor Emeritus Les Henry at the University of Saskatchewan has suggested that we could use an incubation test, basically just leave a soil sample to sit for about a month at room temperature and see how much nitrogen comes out of that sample, just in its natural condition before sending it into the soil test lab. We’ve done some work with that and it worked super well in the growth chamber, but as soon as we go out to the field, the variability in moisture and temperature conditions over a whole growing season causes that relationship to break down.
There’s a soil test extraction procedure using sodium bicarbonate (baking soda) to get some of the more active organic matter fraction out. Even though it has worked in some research in Nova Scotia and it worked very well in some of our growth chamber tests, too, it didn’t work in our field trials during the growing season.
The Solvita test with carbon dioxide burst is commercially available and measures the response of the microorganisms to being rewetted after the soil has been dried. That’s an indication of microbial activity. But we found no relationship between that test and the amount of N mineralized, and if there was a weak trend for any relationship, it was negative.
The bottom line on soil nitrogen mineralization is that it varies substantially from one field to the next and one year to the next. Current tools for predicting mineralization are not very reliable.
So what other tools might we be able to use, especially considering the variability within the growing season? We evaluated midseason measurements. These were only rudimentary studies, but we wanted to see the relationship between these measurements and yield in the nitrogen rate trial portion of our experiment. We used GreenSeeker for measuring the normalized difference vegetation index (NDVI) in the crop canopy and a SPAD meter for leaf chlorophyll content at various points in the growing season – stem elongation, flag leaf, and anthesis. We also measured flag leaf N content, using a laboratory chemical analysis.
When we pooled all site-years for the GreenSeeker measurements at flag leaf or anthesis, the flag leaf measurement of NDVI had a pretty decent relationship with grain yield. This NDVI measurement also coincided with a period of time when we could apply nitrogen and get good yield and protein responses. But when we tried to use NDVI to predict protein content, the relationship between NDVI and protein content was very poor.
When measuring chlorophyll with the SPAD meter, there was a
fairly strong relationship at some sites, but when we combined all site-years, the yield relationship wasn’t that strong and the protein relationship disappeared completely. So if you just walked out onto a field, you wouldn’t have a very useful tool to measure protein content using the SPAD meter either.
When we looked at actual flag leaf nitrogen content at an individual site, it seemed to be strongly related to yield potential and protein content, but the relationships broke down as soon as we combined the eight site-years. We had very poor results in terms of predictability of yield and even poorer predictability of protein.
A final tool that we looked at was measuring post-harvest soil nitrate-N levels right after harvest to see how much nitrogen was left over, after growing the wheat crop. At the Gold-level sites residual nitrate-N levels varied from 22 to 53 pounds of N per acre, for the treatments with the optimum rate of 140 pounds of N per acre. The Silver sites were tighter-grouped and ranged from 29 to 45 pounds of leftover nitrate-N at the optimum economic yield. So, if a wheat grower has over 60 pounds of leftover nitrogen, they probably had more nitrogen than the crop required for optimum yield and protein in that particular year.
Something as simple as a post-harvest soil nitrate test may be useful in terms of identifying whether you hit your target nitrogen rates reasonably well, or whether that field or management zone may need some adjustments. Monitoring post-harvest residual-N over the longer term could be a way to help fine-tune N fertility practices.
This research project was supported primarily by the Manitoba Wheat and Barley Growers Association and Manitoba Agriculture through the Growing Forward 2 (GF2) Growing Innovation –Agri-Food Research and Development (GI-ARDI) program. Additional material support and funding was provided by John Heard (Manitoba Agriculture), Westman Agricultural Diversification Organization (WADO), Canada-Manitoba Crop Diversification Centre (CMCDC Carberry), U of M Ian Morrison Research Station (Carman), Agrium, Koch Fertilizer, David Laudin, Antara Agronomy, AGVISE Laboratories, Vantage Manitoba/Trimble, Matt Gervais (U of M), Paul Bullock (U of M), and Francis Zvomuya (U of M).
Presented by Jeff Schoenau, University of Saskatchewan, at the Soil Management and Sustainability Summit, Feb. 26, 2019, Saskatoon.
Manure is an important resource as a fertilizer. It contains macronutrients and micronutrients.
Sometimes we forget about the contributions that manures can make to micronutrient fertility, like copper and zinc for example. And manure is very important as a soil builder, especially solid manures that add a lot of organic matter to the soil.
One of the challenges is that manure is dilute. Liquid hog manure contains anywhere from 0.1 per cent to 0.5 per cent nitrogen by weight; cattle penning manure, 0.5 per cent nitrogen to 1.5 per cent nitrogen by weight. You literally have to apply a few thousand gallons per acre of a liquid effluent or a few tons per acre of solid manure in order to supply an agronomic rate of a nutrient.
Manure is also variable in nature. It tends to be rather heterogeneous and variable in its composition. You need to test it to know what nutrients are in it.
Manure is also a bit restrictive. It typically doesn’t have the optimal balance or ratio of nutrients that crops need. Usually, we hear about too much phosphorus relative to nitrogen compared to the relative amounts that most crops need. Indeed, when manure is applied to meet a nitrogen requirement, we often end up adding more phosphorus than what the crop needs and can take up. But there are also some other balance relationships that are important – carbon-to-nitrogen ratio in solid manures; nitrogento-sulphur ratios in liquid manures – that we also need to pay attention to get the best benefit out of those manure nutrients.
I would be remiss if I didn’t also talk about the effects of manure on soil organic matter, structure, and soil tilth. Organic matter in manure helps to bind the particles together, producing stable aggregates and good structure. However, remember that manures contain salts, and sodium salts in particular can have a negative effect on the structure of the soil due to particle dispersion. So adding manure, especially liquid manure that has a high sodium salt content to a poorly drained soil or a soil that already has some salinity issues to begin with isn’t a very good idea. Adding organic matter to the soil, especially solid manures, will decrease the density of the soil, and increase porosity, water and air permeability. Those are all good for air and water exchange, and root exploration in the soil.
Injecting manure meets 4R objectives.
versus liquid manure
We need to look at manure as a fertilizer rather than a waste material. To manage it properly we need to know what’s in it. We need to know how it behaves. And indeed, all manures are not created equal.
Liquid effluents like liquid swine effluent or liquid dairy effluent tend to have high proportions of their nutrient in immediately plant available inorganic forms, contributing to high nutrient availability in the year of application. There’s not a lot of organic matter in liquid manure compared to solid manures. It’s made up mostly of water and inorganic nutrient ions, so it tends to have the biggest benefit in the year of application.
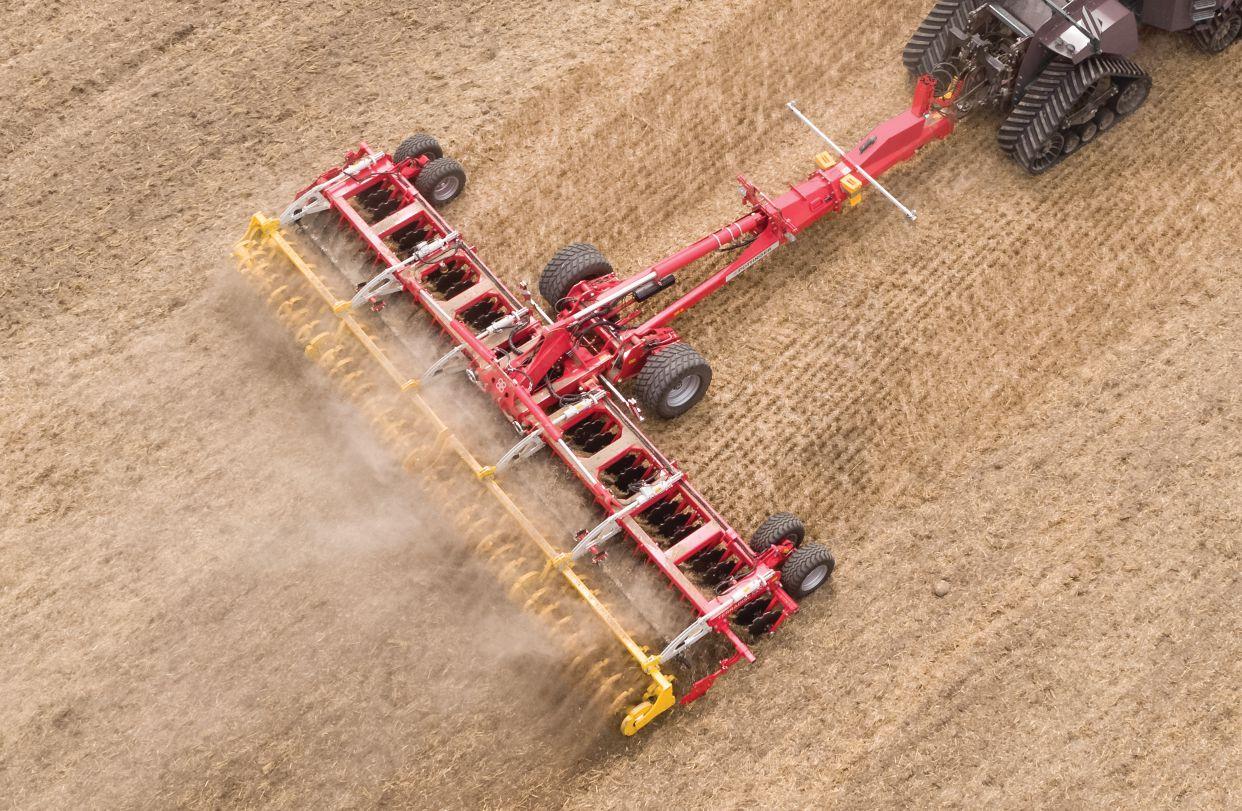
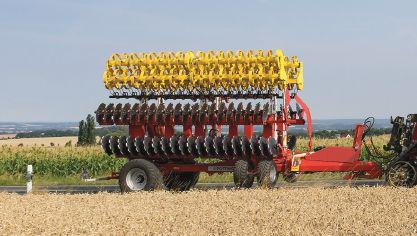
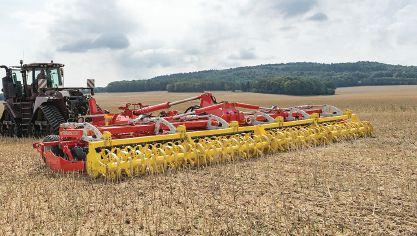
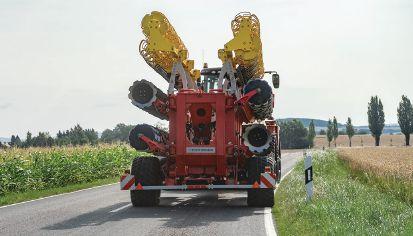
TERRADISC 8001 T / 10001 T disc harrows with working widths of 8 and 10 meters
Perfect incorporation and intensive mixing even in hard and dry conditions thanks to the solid TWIN ARM system.
High output - speeds of up to 11 mph are possible.
Straightforward operation without leaving the cab - folding, adjusting working depth and ground tracking.
Perfect ground tracking up and down - thanks to jockey wheels and adaptable frame sections.
Ideal utilization of the tractor's pulling power – saves fuel by correcting lateral forces.
For more information, please call 888-943-3009.
For liquid effluents, we have pretty good models to estimate the release and availability of nutrients. We measure the ammonium ion content and assign that availability as 100 per cent in the year of application. We then estimate that 20 per cent to 30 per cent of the organic N in the liquid manure will be mineralized in the year of application. Combined, liquid manure generally has 50 to 70 per cent available nitrogen compared to commercial urea fertilizer in the year of application.
However, we have observed in our research trials that some liquid manure, particularly liquid swine manure, often doesn’t contain enough available sulphur relative to available nitrogen to meet the sulphur demands of a high-sulphur-demanding crop like canola when grown on a S deficient soil. We have seen significant canola yield response from application of supplemental commercial sulphur fertilizer when liquid swine manure with an available-N-toavailable-S ratio of 12:1 or 14:1 was applied to a field with low soil supplies of available S.
In contrast, solid manures have lots of organic matter, but also tend to have slower availability of nutrients because the nutrients that predominate in the organic form have to be released through microbial decomposition, a process termed mineralization. Solid manures are more important as a soil builder over the longer term by improving tilth and slowly increasing the nutrient supplying power of the soil by adding organic matter and increasing mineralization potential. Just like liquid manure, solid manure is also a very important source of phosphorus, potassium, and micronutrients.
The rate of conversion of manure organic nitrogen into the plantavailable forms of ammonium and nitrate can be slow, especially for penning manure that contains a lot of straw or wood chips. If we have a high carbon-to-nitrogen ratio, say above 17- or 18-to-1, in the first couple of years after application the release of available inorganic N from penning manures may be only 10 to 20 per cent of the total nitrogen added in the manure. To get the best response out of those other nutrients in cattle manure, you want to consider supplementing with commercial nitrogen fertilizer in the first couple of years.
Both types of manures are effective sources of potassium.
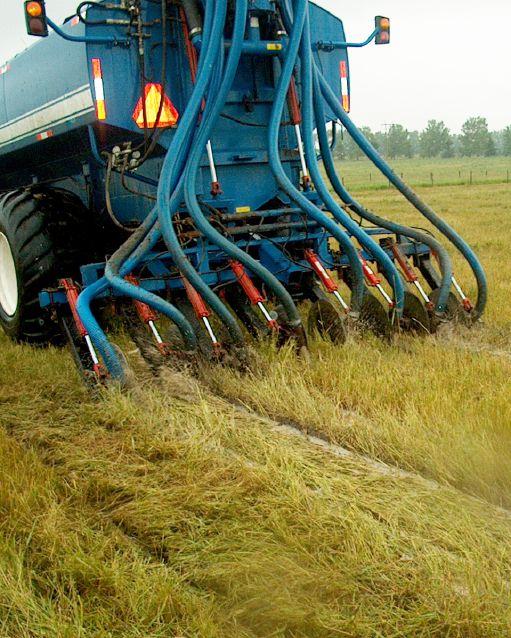
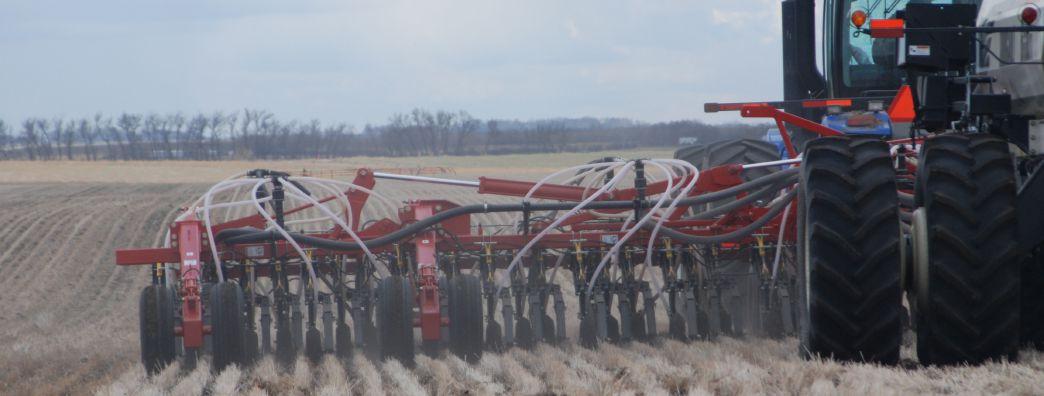
It is desirable to put liquid manures into the ground in order to reduce odour, reduce nutrient loss, and increase recovery. The majority of the liquid manures on the Prairies are injected into the soil. Lowdisturbance liquid manure injectors allow us to inject liquid manure into annual crop land or forage stands without a lot of disturbance, compatible with no-till farming systems.
In some of our earlier work on a very nutrient-deficient soil, we injected 5,000 gallons per acre of liquid swine manure. That equated to about 200 pounds of N per acre. In this trial, canola yield went from eight bushels per acre to 38 bushels per acre. Of course the genetic potential of canola has increased greatly, so if we did the same trial today, we might be looking at 60 or 70 bushels per acre. Highnutrient-requiring crops like hybrid canola can make very good use of the nutrients that are being applied as manure to the soil.
An important goal is to use 4R strategies in manure management that will maximize crop utilization of nutrients. Looking at the cumulative recovery of nitrogen by the crop over four years, in this case over a four-year rotational phase with a cereal and an oilseed in rotation, when swine manure was applied at an agronomic rate of 100 pounds of N per acre, which was about three to four thousand gallons per acre per year, recover was 43 per cent.
That recovery rate was just about as good as the urea at 50 per cent recovery of applied N at the same agronomic rate.
However when swine manure was applied at an excessive rate of 13,000 gallons per acre per year for four years (400 pounds of N per acre per year for four years), this was much more N than the crop could use and the proportion of added N recovered by the crop fell to 29 per cent. Some of the unused nitrogen remained as nitratenitrogen in the soil profile. We followed post harvest soil nitrate in this trial with the high rate of manure added each year for 12 years and during some very wet years at that site, a lot of the nitrate-nitrogen disappeared. Some of it moved down deeper in the soil profile below the root zone, and a lot of it we could not account for and it likely ended up being denitrified and lost. Over-application certainly leads to inefficient use of that nutrient.
In the case of injection of hog manure into grassland, some of our work with PAMI and the Saskatchewan Forage Council showed some very impressive forage growth responses to injection of liquid swine manure. Two rates of 3,300 and 6,600 gallons per acre were applied to a nutrient-deficient crested wheat grass stand. The 3,300-gallon rate had 100 pounds of N, 15 pounds P2O5 and 50 pounds K2O –double it for the 6,600-gallon rate.
With 3,300 gallons per acre of injected liquid swine manure, biomass doubled, and the biomass quadrupled with 6,600 gallons per acre. In the case of the seed yield, there was a tenfold increase in the seed yield. Additionally, those old grass stands were like a nutrient sponge. They sucked up the available nutrients that were applied so there was very little residual inorganic nutrient hanging around in the soil at any time that would be susceptible to loss.
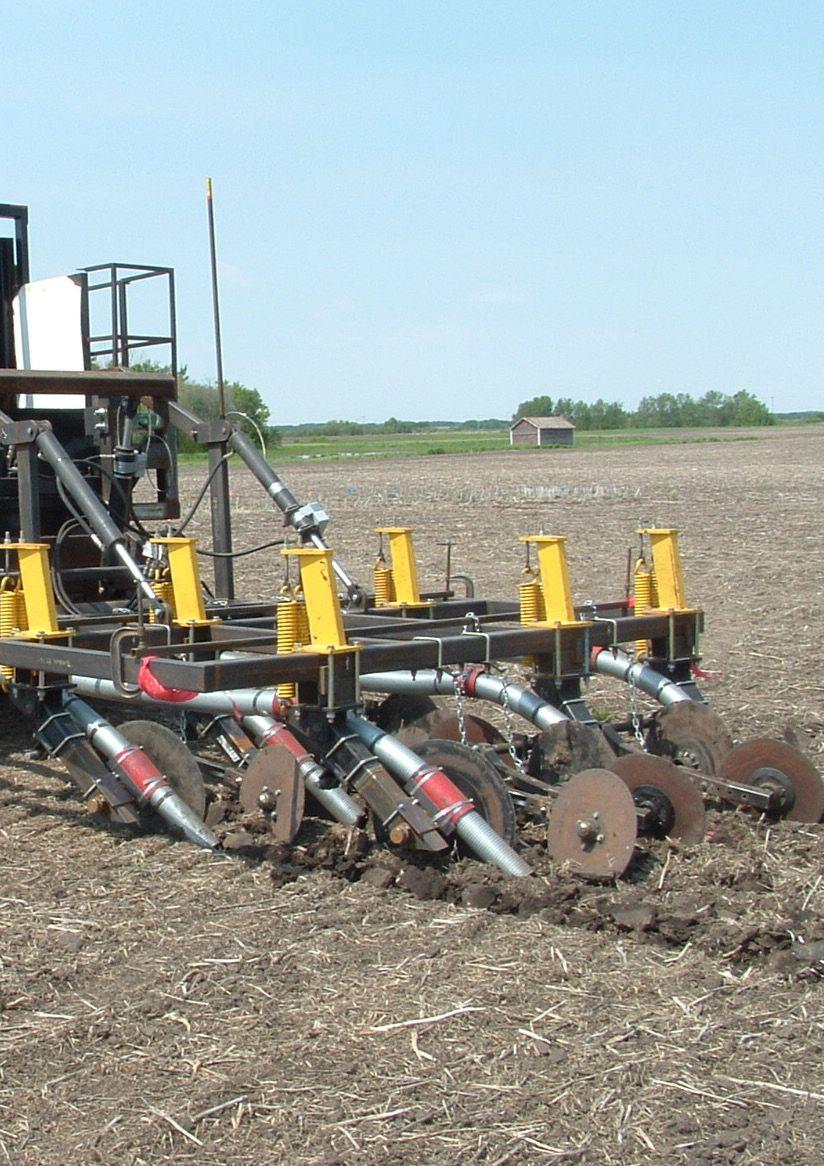
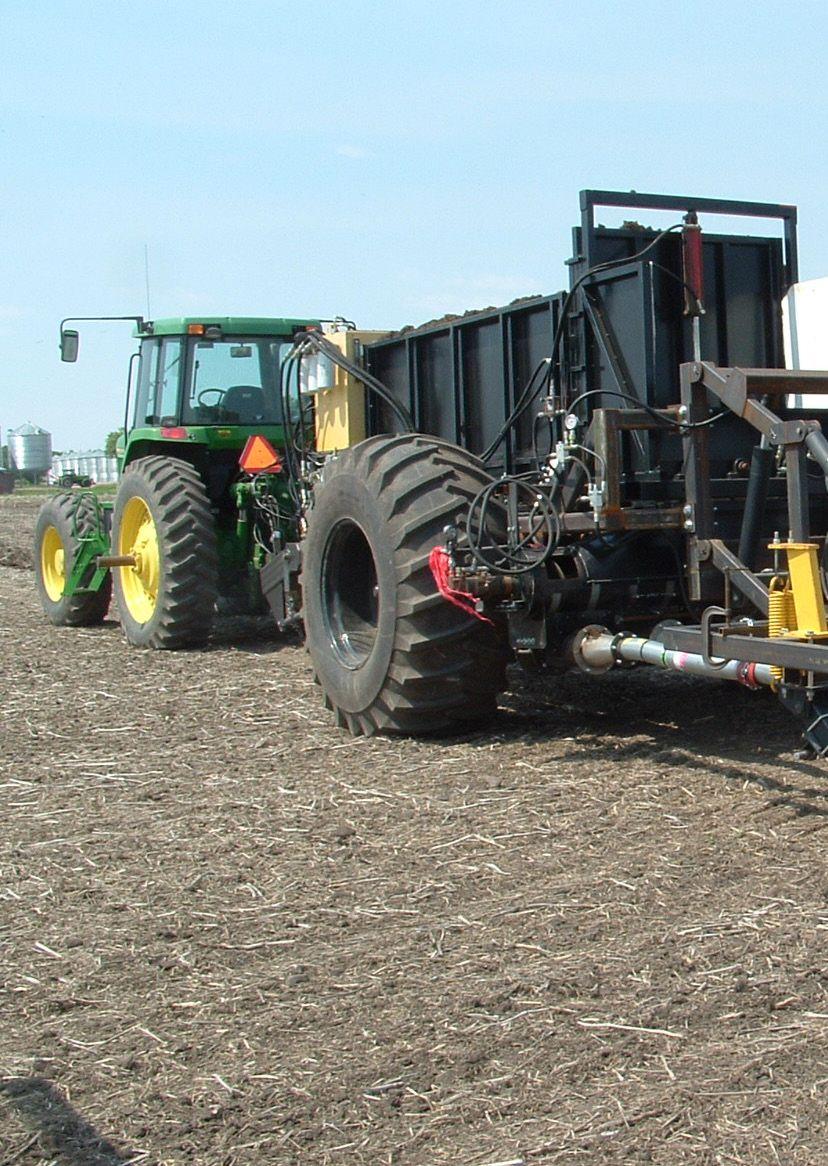
Solid cattle manure can be rather more challenging to get into the ground. We were involved in a project with the University of Saskatchewan College of Engineering and the Prairie Agricultural Machinery Institute (PAMI) to look at the potential for injecting solid manure into the soil in bands. We were able to use a prototype unit in some plot work to evaluate the agronomic and environmental performance of subsurface solid manure injection. The front end of the unit that moves manure to the injector tubes worked very well, but it was sometimes challenging to get the solid manure moving uniformly through injector tubes all the way to the disc openers. I would say it’s still got a ways to go in terms of optimizing performance of the technology, but we were able to do some evaluations of its agronomic effects.
When it comes to using cattle manure for fertilizing forage lands where incorporation is not possible, rather than hauling manure out of a pen and surface-applying, I think a much better approach that a lot of farmers are doing these days is in-field feeding and overwintering.
From the standpoint of a nutrient cycling, a 1,400-pound hay bale might have 30 pounds of N, five pounds of P, 25 pounds of K, three pounds of S. When you feed cows out in the field, those four-legged fertilizer factories consume those bales and cycle a lot of the nutrients back into the soil in the field through the urine and the fecal material they excrete. The animal only retains a small proportion of the nutrient that it consumes, with the rest going out the other end onto and into the soil with an improved opportunity to recycle back into the forage crop. When that nutrient deposition occurs in the field, you get a lot better recycling than when that nutrient is deposited in a pen in the yard, because a lot of that nutrient, particularly nitrogen, gets lost
Injecting
in the pen before it gets to the field.
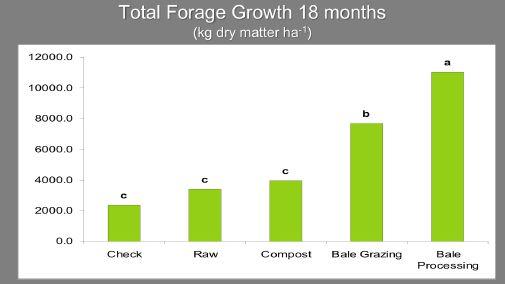
A study was conducted by graduate student, Paul Jungnitsch, working with myself and Bart Lardner out at the Western Beef Development Centre near Lanigan, Sask. that looked at traditional pen feeding versus in-field winter feeding on an old nutrient-deficient Russian wild rye grass pasture. One treatment was hauling manure out of the pen in the yard and applying to the pasture at a rate of 67 tonnes per hectare with a manure spreader. We also had a treatment with applied composted manure at a lower rate (22 tons per ha) to reflect the higher nitrogen content in that compost. Our two in-field feeding treatments were a bale-grazing system where we fed the cattle in the pasture one bale of hay and one bale of straw every three to four days, and a bale-processing system where we fed the processed bales in long rows every three to four days.
In that old Russian wild rye grass pasture, we got a small positive forage yield response from the spread raw and composted manure, but it wasn’t statistically significantly higher than our control. The bale grazing and bale processing treatments gave significantly higher forage growth. Those types of benefits tended to persist beyond the year of treatment. We could still see those areas where the cattle had been fed out in the field two or three years after.
In his work Paul Jungnitsch calculated the nutrient recovery in the forage. This was the capture of nutrients that were added in the feed and bedding and cycled through the animal into manure and taken up by the forage. The in-field systems had fairly impressive recoveries of added nitrogen of 30 to 45 per cent and 21 to 32 per cent P. This compared to only five to nine per cent N, and three to five per cent P when manure was hauled out of the pens and spread onto the pasture. In-field feeding of the cattle had more efficient conservation and recycling of those feed nutrients.
It is very important to choose the in-field overwintering sites carefully to avoid any runoff water entering into sensitive surface water bodies like streams or lakes. In our research work, we found that the concentrations of phosphate and nitrogen are elevated in runoff water moving through that manure pack in the spring. So you want to have that water running into a contained area where you can manage it. There are tools out there that can be used by growers to help effectively select an in-field feeding site to avoid issues. An example is the Wintering Site Assessment and Design Tool: Guide to Selecting and Managing Wintering Sites in Western Canada.
Manure addition using 4R principles – the right source, right time, right place, and right rate – contributes to a positive effect on plant
growth and soil quality over the years. Certainly some fine-tuning can improve those responses and economic return. An important finding from our trials is that when you do it right, nutrient loading and escape issues do not appear to be a concern. For example, losses are minimized when manure is applied at ‘agronomic right rates.’ These are rates at which the nutrient that you’re putting in is balanced or matched off by the amount of nutrient that’s leaving the system in crop harvest over the years.
The 4R system applies to both manure and commercial fertilizer. The “right place” is very important for manure. Liquid hog manure injection technology was developed by PAMI back in the early 1990s, and the agronomic advantages of direct injection of liquid hog manure are very well documented.
Our long-term trials with liquid hog manure showed that cumulative nitrogen recovery by the crop over a number of years where the manure was injected into the soil in bands was 43 per cent versus 31 per cent when it’s broadcasted/incorporated. We didn’t even measure efficiencies of broadcast alone in our trials, but you could expect it to be even lower than 30 per cent. The bottom line is with liquid manure, get it in the ground to get maximum nutrient recovery efficiency as well as obtain other benefits like reduction in odour.
The microbial transformations that applied manure nitrogen undergoes in the soil, including nitrification and denitrification, can result in production of nitrous oxide. Work by graduate student Grace Dauk found that application of urea or injected liquid manure at an agronomic rate didn’t result in a big nitrous oxide flux, but when the rate of manure was doubled, there were higher nitrous oxide emissions.
One of my graduate students, Chadrick Carley, looked at the effect of nitrification inhibitors added to liquid manure. We found that the inhibitor was effective in keeping nitrogen in the ammonium form, and preventing nitrification and subsequent denitrification over the first three or four weeks of the season. Ultimately, because we had unusually dry conditions in the two years the trial was conducted, we didn’t see a significant end effect of that inhibitor on increasing yield or nitrogen recovery. I would anticipate the inhibitor would be much more effective under wet conditions which are much more conducive to losses of nitrogen through the denitrification and leaching processes.
Our research on injecting solid cattle manure in bands measured agronomic responses. We monitored agronomic performance over three years and saw slightly better yield and nutrient recovery when manure was placed in the soil versus surface broadcast. But in all fairness, the cattle manure we used wasn’t conducive to high volatile ammonia losses to begin with because it had a lot of straw in it along with low ammonium content. I think that if we used another manure source that maybe had more urea and ammonium in it, we may have seen more benefit from injection than what we did.
Interestingly in this work with solid manure, injection didn’t reduce the loss of phosphorus in surface runoff compared to surface placement. We think that subsurface injection was creating some channels below the surface in which water moved more readily. As well, by putting that manure below the surface, decomposition and release of soluble forms of nutrient that move more easily in snowmelt runoff may have been enhanced.
Uniformity of application across the spread area is also important. Old, worn-out manure application equipment can contribute
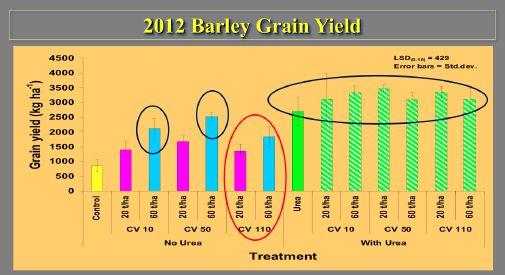
to rather uneven manure application and distribution across the field. A study led by PAMI, Dr. King and myself, looked at the effect of differences in uniformity of solid cattle manure application on yield and soil nutrients at two rates: 20 and 60 tonnes per ha. We created different degrees of variability in manure distribution across the applicator width by combining manure from different outlet tubes. Treatments included relatively uniform distribution with a 10 per cent coefficient of variation, a second treatment with less uniform distribution with 50 per cent coefficient of variation and a third nonuniform treatment with 110 per cent coefficient of variation.
The first year oat crop in 2011 didn’t have a huge response to manure nutrients in general. In 2012, we grew barley and had a good response to manure application at 20 and 60 tonne per hectare. But with the highly variable 110 percent coefficient of variation application, we didn’t get nearly as good a yield response. When we added urea nitrogen along with that manure in those plots, the fertilizer tended to compensate for some of the negative effects of poor manure distribution on yield. The manure we used had a high carbon-to-nitrogen ratio, so not a lot of available N was released from the manure in the year of application.
The new manure spreading equipment with vertical beaters does a really nice job of spreading manure uniformly across the application width. We have one of these applicators for our new manure research that is variable-rate-equipped so that the rate of manure application can be varied across the landscape.
We need to be thinking more about how we can more “precisely” manage manure. Certainly I think we’ve come a long ways from simply dealing with manure as a disposal issue to considering how we can get the most benefit out of the nutrients and organic matter it contains. And, just like with commercial fertilizer, we can get more benefit if we precisely manage it.

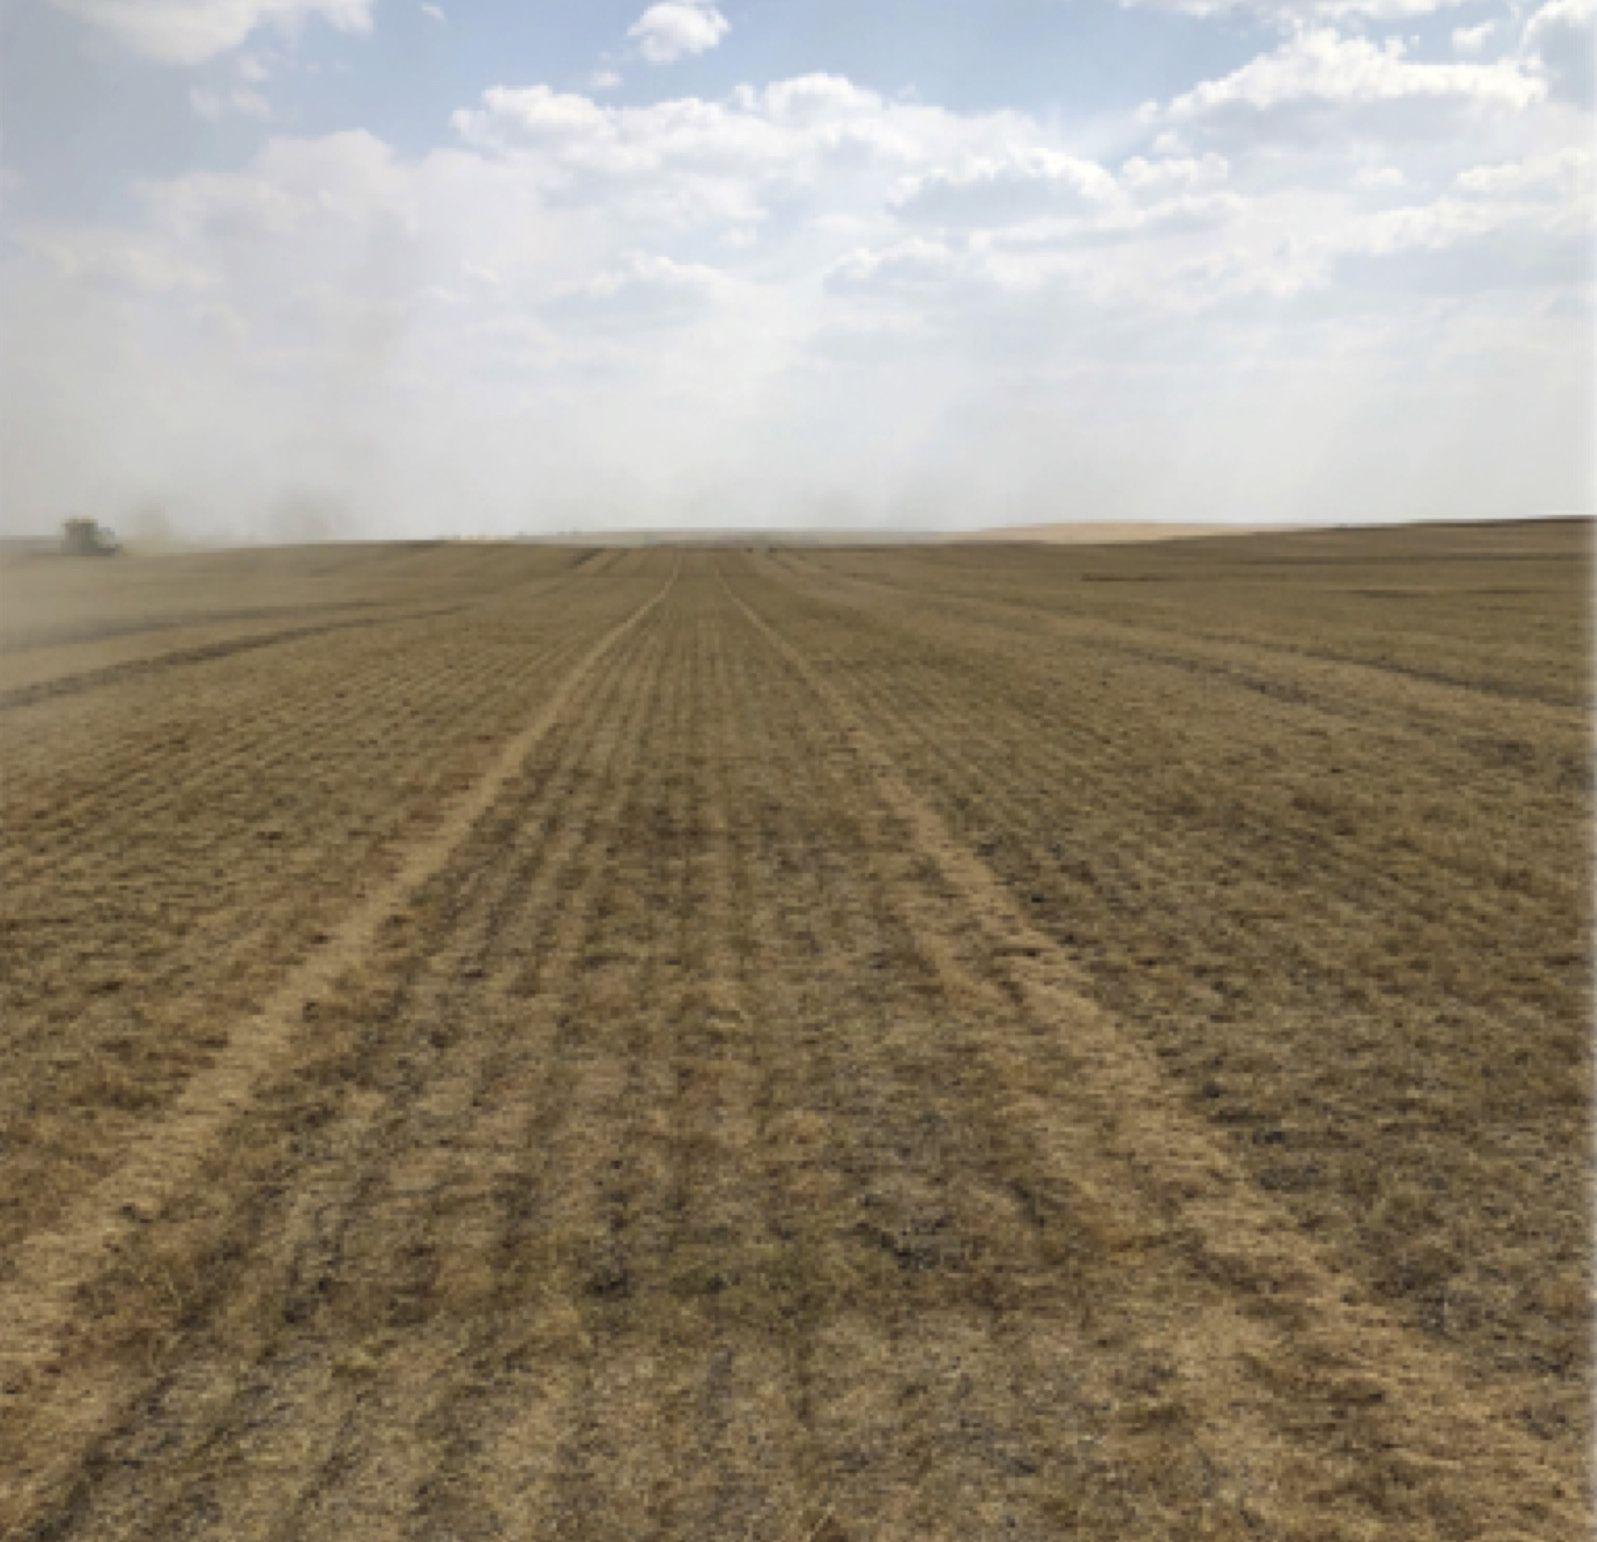
Presented by David Lobb, University of Manitoba, at the Soil Management and Sustainability Summit, Feb. 26, 2019, Saskatoon.
Ihave five points to make about the slogan, ‘Make Soil Great Again.’
First, soil should be considered great. The soil is a thin layer of unconsolidated material at the surface capable of supporting plant life. That’s a standard definition. Soil supports a multi-billion dollar agriculture industry in Canada and, as such, it’s a precious resource for agriculture in this country. Soil is also a limited, non-renewal resource that must be well managed to ensure it’s continued use for many generations.
Second, soil was great in the past. Prior to clearing the forests and breaking the prairie for crop production, each soil would have been in a state that we would consider to be great. That was before Europeans moved here. There are many different soils found across the country, and they would have varied greatly in all their properties reflecting their unique environments. There is tremendous variability in soil, and their ability to support a healthy ecosystem would have been optimized for their respective environments.
Crop production over the last 100 to 200 years in Canada has resulted in significant degradation of soil. There are two notable periods in which weather extremes and intensification of cultivation have caused severe soil erosion. The first, the Dust Bowl, or “Dirty Thirties” in which a combination of the success of dry years and intensive cultivation of crops resulted in severe wind erosion. The second was the intensification of crop production in the 60s and 70s, which resulted in severe wind, water, and tillage erosion.
By the early 1980s, there were great concerns raised about the costs of soil degradation in Canada. There are two reports of note. Anyone who has been in soil conservation for a few years has probably seen or heard of the Senate of Canada Standing Committee on Agriculture’s
1984 report Soil at Risk: Canada’s Eroding Future.
The second one is the Science Council of Canada’s 1986 report, A Growing Concern: Soil Degradation in Canada. In this report, there is data from Dr. Don Rennie, who estimated the annual cost of soil erosion to be about half a billion dollars a year. In 2016 dollars, it’s roughly double that, about a billion dollars a year. These values were alarming at the time and, certainly, that alarm was a major impetus for the development and enhancement of soil conservation technologies and practices that are very common place in the prairies now, and for increased awareness and adoption of soil conservation technologies and practices throughout the agriculture industry across the country. In particular, conservation tillage practices were promoted and conservation tillage was widely adopted. Back in the 1970s, there probably was what we would consider zero per cent of conservation tillage, or no-till or zero till. Now, in some areas, like Saskatchewan, it’s well over 80 per cent.
A lot has changed since the 1980s. With respect to public awareness to government support through policies, programs and research, and to industry action, there has been steady decline in interest in soil conservation. There’s a pervasive belief amongst all the stakeholders that we know all there is to know about soil erosion and soil conservation, and that the job is done, and we need to move on. A sense of fatigue has set in, and it’s fairly common throughout the country.
After almost 40 years, I believe there’s a need to revisit the economic figures generated by Dr. Rennie, and to improve upon them and update them to assess the status of our soil resources and our progress in conserving soil. A lot has changed since then. There’s a lot of scientific development, better computing, and better databases for our soils information, and there’s a lot that we can improve upon.
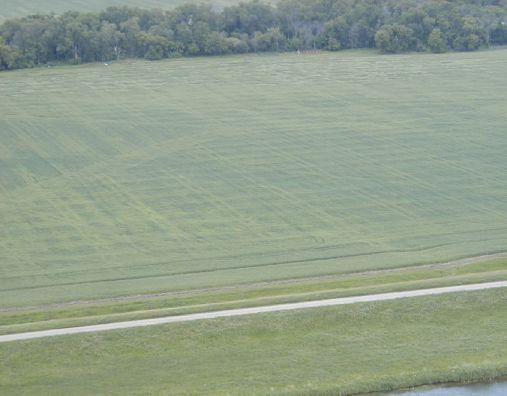
ABOVE: The risk of water erosion has been reduced across Canada as conservation tillage practices have grown in popularity.
A couple of years ago, I initiated a study at the request of the Soil Council of Canada and, with the collaboration of Agriculture and AgriFood Canada. The focus of this assessment was simply the direct impacts of soil loss on crop productivity and the market values over a long history of crop production. It does not capture the indirect impacts of the inefficiencies and input use associated with erosion or the purchase of equipment. It doesn’t consider the offsite impacts either and the things that do get the public concerned. Siltation of ditches is an example, or harbours, and things that cost municipalities and governments lots of money. The indirect costs are considered in most studies to be equal to, if not much greater than, the cost of crop production.
Our assessment was built on the ongoing work of Agriculture and Agri-Food Canada, and it’s Agri-Environmental Indicators, which began about 1993. They have continued under a number of programs, such as the Agri-Environmental Indicators Project, then the National Agri-Environmental Health Analysis and Reporting Program and, most recently, the Sustainability Metrics Program. These findings have been reported by the Government of Canada in 2000, 2005, 2010, 2016, and the most recent analysis is ongoing now.
There are different types of analysis and methodology we use for assessing soil erosion. For each soil map unit across the country, we have varieties of landform types, and for each landform type we can characterize it in terms of the slope gradients and the slope length of each one of the segments of each landform. We also have soils information that overlays on top of that landform information, and then we use information from the census looking at tillage systems and cropping systems across the country on each one of those map units. With climate data, we can come up with some fairly detailed and fairly accurate analysis of environmental indicators, in this case, soil erosion.
We have a few models we use to assess soil erosion. There are wind and water erosion risk indicators, which are based on fairly common erosion models. There is also a tillage erosion model, which I developed, and then there’s one that rolls all of those processes up into one number, and that’s the soil erosion risk indicator.
There are different erosion classes ranging from extremely low/ negligible to moderate to very high erosion that is not sustainable. The ones that are of concern, particularly for this analysis looking at crop production and crop yield loss, are the moderate to severe classes.
When we look at the results for water erosion in 1971 and 2011, water erosion doesn’t really show up at a mapping scale in the prairies but it certainly does in Eastern Canada. There’s been a dramatic reduction in the water erosion risk across, particularly, Eastern Canada as we have adopted conservation tillage practices.
If you look at wind erosion, there’s no wind erosion risk in Eastern Canada, but there certainly is in Western Canada. If you look back at 1971, there are certainly areas where you have significant levels of wind erosion and, in some cases, moderate to severe levels of wind erosion.
If you look at tillage erosion, because tillage isn’t based on climate, and it’s based simply on how much tillage you do, across the country it was a problem back in the 70s, and continues to be a moderate to severe problem in certain areas and certain crop production systems across the country. Again, with the reduction of tillage over the 70s, 80s and 90s, and with the reduction of summer fallow in particular, the risk of tillage erosion has dramatically reduced, as well.
When you add wind, water and tillage erosion together, while there has been a significant improvement between 1971 and 2011, there are significant concerns in many parts of the country.
If you look at the national data, about 37 per cent of the land and crop production in Canada in 1971 was either moderately to severely
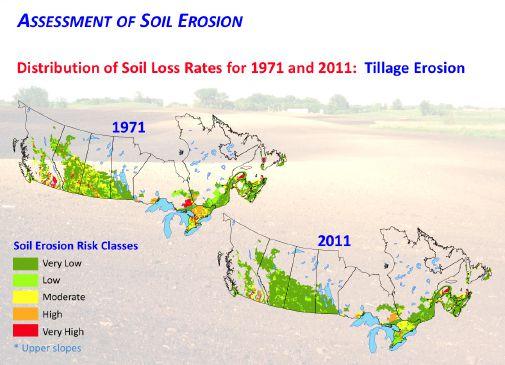
eroded each year, but by the time you get to 2011, that’s dropped to just under 10 per cent. That is a dramatic improvement in the levels of soil erosion that’s occurring on our cropland. I will point out that in Saskatchewan, it dropped down to about 1.2 per cent by our estimates, so there’s very little land, at this point, which is now experiencing moderate to severe levels of soil erosion in this province.
The key thing though is relating that soil loss to crop yield. If you lose a little bit of organic carbon and a little bit of top soil, crop yield isn’t significantly impacted, but there does become a point where you’ve lost so much soil organic matter, that the crop yields start to drop, and start to drop dramatically. That non-linear relationship becomes quite critical in understanding the economic behaviour of crop production to soil loss.
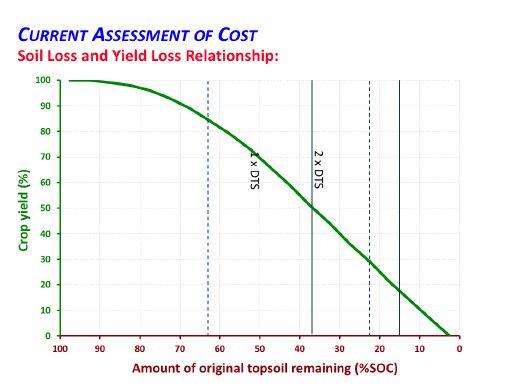
The crop yield loss on high eroding cropland back in 1971 may have been about 17 per cent, but after an additional 30 years or 40 years of erosion, you’re now losing 60 per cent of your crop yield. But comparing 1971 with 37 per cent of the land with 17 per cent crop yield loss to 2011 with only 9.5 per cent of the area but 60 per cent crop yield loss on average, you really haven’t improved the situation much in terms of overall crop production.
That shows up in the economic analysis. For 1971, the market value of that yield loss was about $1 billion. But if you look forward it’s now up to $3 billion a year in 2011 even though the amount of high-eroding soil had dropped to 9.5 per cent of cropland. We also tracked the cumulative economic loss between 1971 and 2011 and it was about $40 to $60 billion of loss.
The costs have gone up for a variety of reasons and, although soil
conservation efforts have reduced the amount of cropland that is moderately to severely eroded, still more needs to be done if you’re worried about growing profitable crops in Canada.
We need to think more broadly about what tillage is and what conservation tillage is. When you think about tillage erosion, as well as wind and water erosion, you have to keep in mind that there are some practices that leave more crop residue, which makes them effective at combating wind and water erosion. Tillage erosion, in many cases, is more of a problem than wind and water erosion.
When you start thinking about moving soil, there is a trend for higher speed equipment, and that means you’re throwing more soil further, and probably with greater variability, and I’m thinking of vertical tillage, in particular. Those practices are, probably, much more erosive than a mouldboard plough, and should be of great concern to everyone who’s interested in soil conservation.
We did an experiment in Manitoba and Saskatchewan where I looked at how much soil is moved by seeding operations. High disturbance seeders don’t move much soil, but they move with a tremendous amount of variability and they can be as erosive as a mouldboard plough. Also, when we’re looking at conservation tillage, remember that it simply reduces the amount of soil erosion and the loss of soil organic carbon.
Conservation tillage, again, is that first step. We need to focus on the second step with things like growing perennial crops or adding manure. There are some farmers that would put all of their manure on those eroded hilltops. And you can even more creative than that.
There is a practice that I’m going to spend a couple of minutes on: soil landscape restoration. A typical soil in the hilly lands of the prairie today has thin topsoil on the hilltops and thicker slopes where top soil has been moved by tillage to the bottom of the slope.
When I started to get in this business in the 1990s, it would not be surprising to see one or two feet of topsoil lost on the hilltops, and about the same amount of accumulation at the bottom of the slopes. Because it’s caused by tillage erosion, we have the opportunity were you can take that topsoil and put it back on the eroded hilltops. That’s the practice of landscape restoration.
We did a small study in Manitoba with four sites where we moved soil from the bottom of slopes back onto the hilltops. We scraped about 10 centimeters of soil from the bottom of the slope, applied it to the hilltops. The yields on the hilltops bounced up quite dramatically, and it didn’t create any significant yield losses on the bottom of the slope from removing soil. In the wet years, we saw about a 10 to 33 per cent
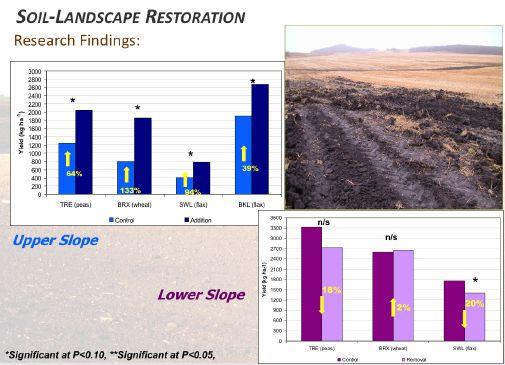
yield increase on those hilltops, and about a 40 to 130 per cent yield increase in dry years.
There’s a net improvement of crop yield throughout the landscape, so much so that if you looked at the economic improvement of the whole landscape, that practice was paid for within about three to five years. The return on investment was very rapid from a land improvement standpoint. So, it’s quite a significant change in how we could deal with those eroded landscapes in this region.
There is a need for or desire to have great soil
I believe there is a desire to have great soil. There’s certainly a need to produce food in Canada, and to do so sustainably and competitively. If we want to do that, and to succeed in this endeavor, we must ensure healthy soil resource and we must protect those healthy soils, and we certainly must look at the degraded soils and restore those degraded soils somehow.
There is a cost of doing nothing. The increase in variability in climate and the increase in severity and frequency of weather extremes can only amplify the types of crop yield losses we are seeing on those eroded landscapes, and they threaten our profitability and food security.
The degradation of landscape has increased over time. Once the topsoil is gone on the hilltops, the productive sub-soil that’s exposed now gets dragged down slope and it degrades the ability of the whole field to produce productive and profitable crops. You start to see carbonate-rich sub-soils burying, or capping off, that nice topsoil at the bottom of the slope. We’ve seen this in Saskatchewan, Manitoba, Wisconsin, Minnesota, South Dakota, and Ontario.
Lastly, as public agencies, we must provide the means to protect and restore the soil, and we’re certainly looking at science and technology and the awareness and education policy and programs. One of the biggest threats in our ability to do what need to do with respect to soils and soil resources and our management of it is to make sure we have the ability to characterize soils and have databases that we can use to do these types of analysis -- and the federal government has largely abandoned that. There has been a loss of soil surveyors. There’s almost no capacity left to characterize soil or to characterize the changes in soils that I’m taking about. It’s astounding to me. As an educator in soil science, it is very troubling that the government has just walked away from this. There is talk about doing other things federally and, hopefully, some of those move forward and make some progress in the next few years before it’s completely impossible to move back towards having a good soils database.
WATCH MORE BELOW

Compaction, salinity and what needs to be done.
Presented by Marla Riekman, Manitoba Agriculture, at the Soil Management and Sustainability Summit, Feb. 26, 2019, Saskatoon.
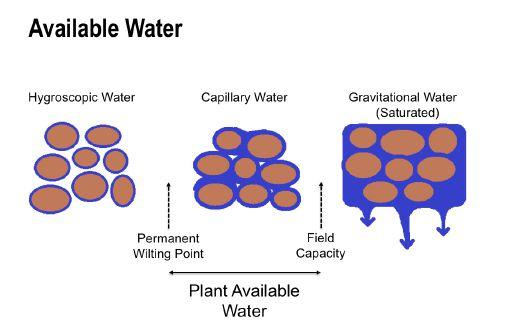
Before I get into this concept of wet and dry soil problems, I want to make a couple of definitions clear regarding available water. With very, very dry soil below permanent wilting point, the water attaches tightly to soil particles and is called hygroscopic water. Plants can’t get to this water.
Between the permanent wilting point and field capacity there is capillary waterized pores. This capillary water is held more loosely and plants can access capillary water. Above field capacity the soil is saturated and water is moving down through the profile through those larger pores. This is important because capillary water is plant available water; soil’s water holding capacity is that between field capacity and permanent wilting point.
Field capacity depends on soil texture. The amount of available water increases with clay content because as you have more and more of those smaller pores in clay soils, it’s easier for soil to hang onto water. Sandy soils have very low field capacity because it’s really easy for water to drain through them.
Why do soil texture and available water matter when we’re talking about things like compaction and salinity? They matter because water content is going to affect the risk of things like compaction. It’s going to affect how water moves through the soil, which then influences salinity. If you have wet conditions, during wet years, you have the water table rising towards the surface. This can bring salts up to the surface.
When you see wheel tracks across the field, you start seeing things like crop growth issues. Maybe not just this past harvest but years previous, you can start seeing that impact showing up in the crop. You can also look at the root.
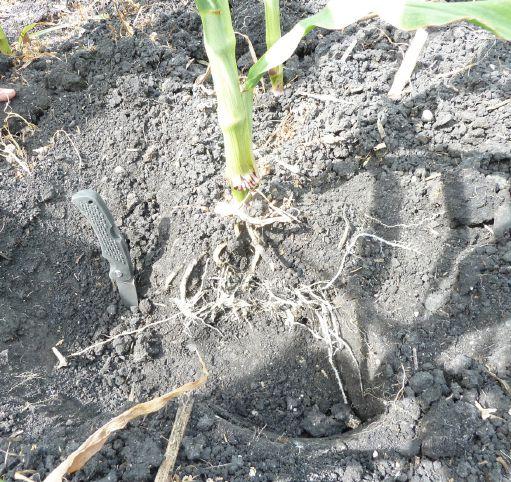
I have a penetrometer, which is something that we use to test for resistance or the amount of compaction in the soil. I don’t use it that often because it takes some skill to use it properly.
My favourite tool is called a shovel. I go out, dig around, and take a look at these roots. The roots will tell you what’s going on with the field. So, if you think you have a compaction problem, go dig up some roots. Roots are a little lazy though. They are going to grow into the space they can easily access, and then they’ll start working away within those spaces.
Soil moisture is important when we talk about compaction because if soil is dry, we’re really not at a risk of compacting anything. If the soil is dry, the soil has enough sheer strength, to carry equipment and not slide around. When our soil is really wet, when you’re at that saturation end, we rut the heck out of the field with equipment, but we don’t compact the soil below it because the
water is helping to hold the soil in place. It’s helping to hold those pores, but we smear around and mess up the soil structure at the surface, causing ruts.
The problem is when our soils are moist or near field capacity –that point where the big pores have been allowed to drain and that water has moved down, and the small pores are held with water, the big pores have that air, and it’s easier to compact those ones.
Preventing compaction
One of the simple things you can do is to watch your tire pressure.
A few years ago, I participated in a University of Minnesota Soil Compaction Day. One of the things they looked at was proper inflation of tires. In the demonstration, a properly inflated tractor tire pushed down about two inches in the soil, but it pushed down 3.5 inches when it was overinflated.
When you check tire pressure, park the tractor on a concrete pad and see if you can get your finger underneath the edge of that on the base of the tire. If you can get even a fingernail under there, you haven’t actually lowered your tire pressure enough. That tire should be contacting as much of that pad as possible. When it gets overinflated, it gets very round. It doesn’t actually impact as wide an area of the soil.
How many of you have heard that tracks are better than tires for compaction? It all depends on your tire inflation. If you have
proper tire inflation, there actually isn’t a difference, or much of a difference, between your tracks versus tires. The tracks can have other benefits, like less slippage wetter conditions, but in terms of actual compaction, it’s not as big a difference as we often think as long as those tires are at their rated pressure. Talk to your tire guy, and they’ll be able to tell you what the tire pressure should be set on for your tractor.
The axle load, the weight of equipment, is more difficult to manage. The weight of the equipment is what takes compaction and drives it three to four feet into the ground. When they’ve looked at axle loads for field equipment, they obviously vary, but the load from grain carts is the one that nobody wants to look at. A 1,200 bushel grain cart with one axle carries 35 to 40 tons on one axle. But going with a double axle 1,200 bushel grain cart cuts the load in half. So, more axles are beneficial in this case because you’re really lessening some of that overall impact.
Have you also heard that 80 per cent of compaction happens in the first pass? When this was studied, the researchers drove over the same tracks four times in a row. On the fourth pass, they called that 100 per cent of compaction. Eighty per cent of that total compaction happened the very first pass that they went across the field. So, during harvest, if you’re dealing with compaction, you might want to head on to the field with the grain cart on the same track and then veer off where you need to in order to catch up with the combine.
All that compaction happening in the first pass is also the reason why we start talking about things like controlled traffic farming, or at least being more deliberate and planning where you’re going to travel on the field.
If your soil is already compacted, what am I going to do? Can deep tillage break it up? We have research in Manitoba that looked at decreasing compaction over time using a subsoiler. The subsoiler was able to alleviate deep compaction to a certain extent, but over time, when they tested again, one year and then two years after the subsoiling had been done, the soil re-compacted. Subsoiling isn’t a long-
term fix if we continue to add compaction back into to the mix.
Subsoiling is not a cheap thing to do. It takes a lot of horsepower and a lot of fuel to pull those deep shanks up and down the field. In Iowa, where they do this a bit more commonly, they looked at a farm trial where they split the field in half. One-half of the field was subsoiled, and the other half of the field wasn’t. They often did get a yield benefit, but they didn’t make enough money off of that little bump in yield to have paid for the cost of subsoiling. Half of the time they made it; half of the time they lost money on doing it. From this trial, they concluded that maybe subsoiling should just going to stick to the bad stuff, stick to the headlands, stick to the soils that really need the work, and leave the rest of it alone.
If you’re going to subsoil, there are a couple considerations. The first is going about an inch underneath the compacted zone. You also want to time the subsoiling operation when the soil is quite dry. A lot of research shows that subsoiling at permanent wilting point is when you get the best kind of fracturing and shattering of the soil. If the soil is wet you just kind of slime through it, and you just leave the slot open. It doesn’t do anything when it’s really wet. A lot of the problem that we’ve been seeing in Manitoba is people want to subsoil, but it’s never dry enough in the fall to effectively subsoil. So, you can cause issues if you’re actually running it through wet soil.
On a lot of the clays that we have in our soils, especially in the Red River Valley, and these clay soils have this shrinking/swelling capability. They open up with dry conditions, and then they seal closed again when it’s wet. When you get down to permanent wilting point, most likely the soil has actually cracked open on its own, and then the question is, “Why do I need to subsoil if the soil already did it for me?” This is alleviating compaction, breaking it up over time. So, wetting and drying is really important in this case.
Cover crops have the potential to alleviate compaction. But I have seen tillage radish grow down and then sideways on heavily compacted soils. Cover crops can, however, reduce susceptibility to compaction, by drying out the soil. The success depends on the species. It depends on the root type. By using cover crops, we’re adding different roots into our crop rotation, potentially creating bio-pores, creating spaces left behind by those decaying roots for new roots to actually move through and grow into. All of that works over a long period of time to help break up compaction. However, if we add tillage on top of cover crops, we can mess up all of those bio-pores that were left behind by the roots.
Controlled traffic farming is another approach to compaction. It creates permanent tramlines in the field. So instead of randomly trafficking across the field you are creating a roadway in your field every 40 feet, or whatever the multiple width is for the equipment that you own. You’re creating that roadway that will be quite compacted, but that’s okay because you’re not compacting the rest of the field.
When we talk about salt, salinity is not a salt problem. It’s actually a water problem. If you remember nothing else, remember that salinity is all about where water is moving in the soil. Is it moving up? Is it moving down?
Downward water movement means you should not have salinity because downward water movement means salts are going down. Upward water movement is a problem because it can bring salts to the rooting zone.
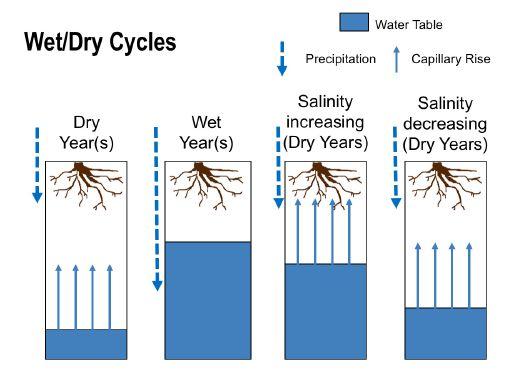
So, when you’re dealing with conditions that are going to cause you salinity there are three main points. High water table that can be within six feet of the surface that carries soluble salts in to the root zone by capillary rise is the first point. Then you need high evaporation rates that exceed infiltration. And the third thing is a plant that is susceptible.
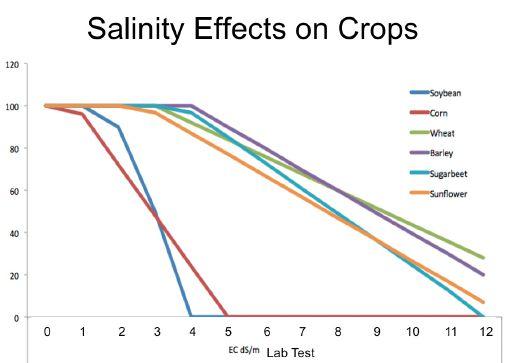
I’ve mentioned that soybeans and corn are weaklings when it comes to salinity. A lot of our small grains and oilseeds can tolerate a lot more salinity before they start seeing yield loss. Then when you do start seeing yield loss, it tapers off a lot longer.
There are a number of different places where salinity shows up. Basically, what’s happening is where your water table is coming closer to the soil surface and that capillary rise takes over, then that’s where those salts are coming up. Bathtub ring salinity becomes really common in areas where there are wetlands or sloughs. You can see this ring of salt or salinity all the way around.
There were some wetlands, however, that do not have any salinity at all. Those places, those wetlands, are the ones that still have willows growing around them because the willows were sucking up the water. They were intercepting the water that was moving out and drawing the salts with them.
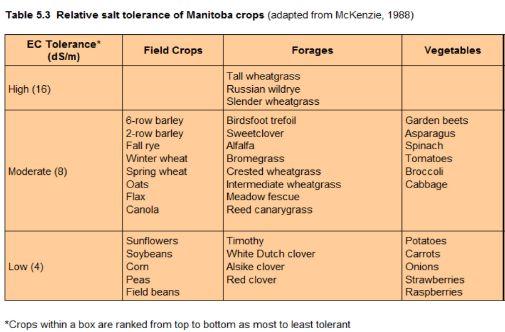
To diagnose salinity, you want to look at your electrical conductivity (EC). Soil tests at zero to six-inch and six to 24-inch depths will measure EC. You can also map fields with EM38 or a Veris or some other technology that measures EC. Electrical conductivity is an indirect
measure of salt. Electrical conductivity will also change with things like moisture content, clay content, and when soils are frozen. So, if you’re using a mapping unit for electrical conductivity, you have to still calibrate it with soil samples.
This is probably the most frustrating thing that I have to deal with when we talk about things like salinity is that the units. Measurements can be expressed as deciSiemens per metre, milliSiemens per centimetre, and millimhos per centimetre. The unit doesn’t matter because the number is the same.
There are two different methods of analysis for salinity that can be done in the lab. The one that you get done at a commercial lab is called a 1:1 mix of water and soil. It’s easy. The labs love it and it is cheap.
The saturated paste test is used by researchers and the Soil Survey Lab. They take the soil and mix just enough water in to get a paste consistency. They put it in a filter and draw the water off, and then they test that water. It takes longer and costs $20 more. The result is double the number that you get from the 1:1 test. So, if you’re looking at research data telling you what the crop tolerance is, you have to take that number and divide it by two in order to compare it to what you have for a soil test. It’s the only reason I bring it up. It is the most confusing thing about this.
You can’t fix salinity but you can manage it. You’re going to manage the water table to the best of your ability because it’s a water problem, not a salt problem.
The first thing to do is look at your yield map. You’ll know exactly where your saline patches are, usually in the lower lying areas of the landscape. Stop spending money on them. It’s the simplest thing you can do. If you’re going to seed through them every year turn off the fertilizer tank. You’re not growing a crop.
Second thing I want you to do is consider investing in those saline spots. This is where the planning comes in. Soil sample those areas and see how bad to decide what kind of forage or crop you can actually grow in those spaces.
If you have a high water table that allows those salts to come up, then a solution might be to lower the water table. You can use crops that suck up a lot of water. Use that to your advantage. You can look at something like tile drainage. If you have a high water table and have the ability to tile, then that potentially can lower salts in the soil.
Keep the soil covered. Tillage is probably one of the worst things you can do in those saline patches because it just causes more evaporation and brings water to the surface.
Choose crops strategically. Plant a high water-using crop in the non-saline areas and a saline-tolerant crop in those areas that have a lot of salinity in them. This, I get, is not an easy thing to do because a lot of times those saline patches are in the middle of the field.
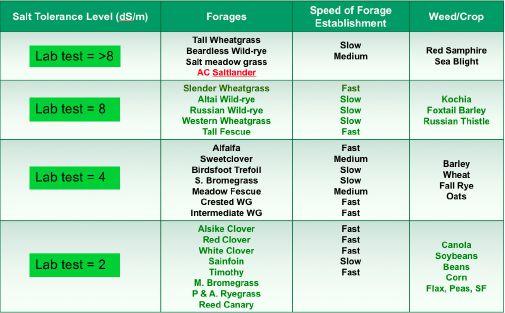
You can get your weeds working for you. What weeds do you normally have growing in your saline patches? Kochia? Foxtail barley? I have farmers who have said they have started mowing their weeds because they don’t want them to go to seed. Don’t till the area. Don’t spray it out. Something is actively growing and taking up water, and they’re transpiring water, and it is helping to lower the water table in that area. It’s kind of like the low-hanging fruit, the easiest thing. You can use weeds to your advantage.
The other thing you might want to do is plant a buffer crop. If you’re dealing with something like roadside salinity, what about planting a deep rooted alfalfa right on the edge of the field that
taps down and starts using up that water and decreases the level of saline creep that moves into the rest of the field?
Plant saline-tolerant crops. We have things like AC Saltlander that has a very high level of salt tolerance, and what I understand, it is more palatable. So, if you’re looking at feeding some of these forages, some of them, the salt-tolerant ones, don’t have as good feed quality, but Saltlander apparently is a little bit better.
Planting saline-tolerant crops or forages can help manage salinity.
When managing something like salinity, I want you to be sceptical of quick fixes. There is no special product out there that you can spray on the soil that’s going to fix your salt because salt problems are water problems. Managing salinity is all about managing water.
WATCH MORE BELOW

soil diverse, covered and alive.
Presented by Derek Axten, Axten Farms, Minton, Sask., at the Soil Management and Sustainability Summit, Feb. 26, 2019, Saskatoon.
I’m just a farmer. I’m not a soil microbiologist or a soil scientist. I’m going to walk through what we do on our farm and the results that we’ve seen. Intercropping is the theme of my presentation, but it’s more about how intercropping fits in almost all the crops that we grow.
Our goals include the five pillars of soil health. The main one we really focus on is diversity, because that’s been the big thing for our farm. We try to keep our soil covered. We try to do as little disturbance as possible. Keeping a live root in the soil is getting to be a bigger part of our operation all the time. We don’t have cows but we have an agreement with a local cattleman who brings us groups of about 600 that we graze cover crops in the fall.
A thing that really changed our direction and how we wound up on this path, was winding up on Dr. Dwayne Beck’s research farm at Pierre, South Dakota 12 or 14 years ago. He showed me the value of rotation and things that we had never talked about – adding warmseason crops and worm holes and stuff that wasn’t in normal conversation back home.
From Beck’s, we wound up at Gabe Brown’s farm in North Dakota and it was also a turning point. When we went to Gabe’s and looked at his soils and he shows us this black cottage cheese soil, and it was awesome. But the eye-opening thing for me was when we walked across the grid road and stuck the shovel in the soil; it was exactly what it was like at home – not very good. And the only difference between those two farms was management. So, we just sort of started adding more diversity. That was probably where it all started, and that’s where intercrops is going to fit into this.
We eventually felt our progress had plateaued because we had diverse crop rotations, had a stripper header, and are no-tillers, but we weren’t happy with our infiltration or yields. We saw a presentation by Dr. Elaine Ingham in Montana about the whole biological portion in soils and it just made sense, so my wife Tannis took her online courses. Dr Ingham opened our eyes to the biology side of the whole operation.
The other interesting course we took was from Dr. Wendy Taheri, a microbiologist and mycorrhizal fungi specialist. So Tannis took a three-day course from her, because it was really interesting not only to learn about the importance of mycorrhizal fungi and why we want that in our soils, but how to identify it. Luckily we do have those fungi in our soils, so we don’t need to go buy some of those inoculants that are on the market.
Around the same time we started intercropping and I realized that we don’t want to be growing these non-mycorrhizal crops like canola on their own. So that was sort of where intercropping started – “Let’s bridge that mycorrhizal through the year.”
What are the outcomes of having good biology in the soil? Moisture
infiltration is one of them. Last spring we had an inch of rain during seeding, so we went out and did some infiltration tests after the rain. We pound a 12-inch diameter steel ring into the soil and pour water into it. On the lentil and flax intercrop stubble, on inch of water infiltrated into the soil in 29 seconds. We poured a second inch of water on and it took 10 minutes. That’s the equivalent of six inches per hour.
So now when we get these big rainfalls, it seems like the rain in Minton is always angry rain, we can grow a better crop because we can store it instead of having it run away.
How do we maintain the residue? We like to disturb as little as possible. We owned just about every kind of single-disc drill there is and we wound up back with a single-disc John Deere.
Something we learned early on with the disc drill was residue management. In 2007, we had John Deere 9600 combines with 36-foot MacDon headers and brutal choppers. We went to seed into that with our disc drill and we had all sorts of problems. That’s when we got into stripper headers because it leaves the straw standing instead of chopping it into a mat that a disc can’t cut through.
We’ve used stripper headers ever since for other reasons, too. Combine efficiency is huge. We burn quite a bit less fuel, and we can drive fast. One of the things I noticed early on was the uniform snow catch.
This fall we intentionally put all of our winter cereals into strip stubble because we were concerned that we were going to have a problem with overwintering. So we’ve got a really nice blanket of snow, so they should be fine. Our number one problem on our farm right now other than lack of water is lack of residue and lack of surface cover. We just can’t seem to keep cover on so stripper headers help.
We are a controlled traffic farm. We’re going into our fifth year. We have a 30-foot (nine-metre) system. We tried a 12-metre or a 40-foot system early on, and I think it’s a better fit if you’re flat. For me a big benefit is the ability to inter-row seed and possibly relay seed cover crops. Once we have this set of trams, we can go in and do all these things.
We’ve grown a lot of different intercrops. We started in 2011. Pea-canola was the easy one; with Clearfield canola the herbicides line up. I really, really wanted fababeans to work, but they do not like the drought.
We have a lot of diversity on the farm. I’d honestly say too many. In 2016 we had 14 different crops and intercrops. It adds a lot of complexity. But it was sort of a means to an end because we wanted to figure out what are the intercrops that are working the best for us? We’ve narrowed it down for 2018 and we’ll be down to hopefully under 10 different crops.
• Durum (3)
• Hybrid Rye
• Rye
• Chickling Vetch/Y Mustard
• Red Lentil
• Red Lentil/Y Mustard
• Red Lentil/Mustard/4010
• Oats (2)
• Flax/Desi (2)
• Flax/Kabuli (2)
• Faba Bean/Alfalfa
• Canola/Maple Pea/RedClover
• Buckwheat
• Proso Millet
• Durum
• Oats/Faba Bean
• Barley/Faba Bean
• Spelt
• Rye
• Durum/Faba Bean
• Yellow Mustard/Forage Pea
• Golden Flax/Large Green Lentil
• Golden Flax/ Desi&Kabuli Chickpea
• Golden Flax/Faba Bean
• Buckwheat/Yellow Sweet Clover
• Full Season Mixed Cover Crop
The most consistent one we’ve used hands down has been flax and chickpeas. We quit growing chickpeas in the early 2000s because of disease. When I heard that Lana Shaw at the South East Research Farm at Redvers, Saskatchewan was growing chickpeas with basically no fungicide, I thought I should try it again. We seeded 1,500 acres of flax and chickpeas the next year and had really good success.
We do an alternate-row flax-chickpea, because back in the day when Lana first started the research, she was doing that. I think maybe the alternate-row gives us a little bit disease suppression. Since we’ve started doing this, we’ve only had to use two fungicide applications.
Our yields are slightly less with the flax-chickpea intercrop, but generally when you do the math, we’re still usually money and risk management ahead. And something else we’ve noticed about the flax and chickpeas is we used to always have this chickpea hangover that we used to blame on soil moisture. And, from what I’ve seen now, we’re actually getting better crops after the inter-crop and I don’t what it is, if it’s just less fungicide or if it’s some kind of interaction that we’re seeing between the flax and chickpeas. But we always use to dread the crops behind chickpeas and now they’re actually some of our better ones.
You have to plan ahead for alternate-row seeding. We intentionally ordered our John Deere 1890, with double shoot openers and cart. We can move the hoses from one tower – they’re numbered –to the other tower, and we just flip the double shoot. We put plugs in the empty holes.
What I do like about it is years like 2017 when it was super dry, we were able to actually put the flax in shallow, and the chickpeas we put them as far down as that thing would go to get them in the moisture. That’s one of the thing I did like the alternate-row, where chickpeas
sometimes need a little more moisture than flax to get going, so that I thought was a benefit of the alternate-row.
This is our third year with flax and lentils. We’d always been growing our lentils with mustard, and I always felt that the mustard towering over the lentils was interrupting sun and was outcompeting, because we never could get monocrop lentil yields with a mustard-lentil. So we tried flax and lentils and it actually worked out pretty well. The lentils seem to get as tall as the flax and we’re fairly confident we’ve been hitting monocrop lentil yields plus we’re getting flax on top of it.
But the nice thing about flax-lentil beside the decent yields is the harvestability. The lentils basically trellis up the flax. It seems like they even get longer internodal lengths than they normally do. And the other big thing that we’ve noticed is surface residue. It changes the carbon-nitrogen ratio, so instead of your lentil fields being black by November, we actually are maintaining surface residue.
We only grew canola on our farm back in 2011. We just found mustard is a better fit. I like yellow mustard. We grow mustard with forage peas. Forage peas are normally a low lying-down disaster, but when we put them with mustard, they stand up well.
For combine settings, we run a small-wire and two large-wire concaves in these John Deere rotaries, and we find that works pretty well. We just add and subtract cover plates as necessary. The odd time we have to have all cover plates on, but usually two or three are enough so we can get a clean sample. We set it for the lentils or the chickpeas or whatever, and then we just slow the fans down until we get a mess, and then we speed them back up and then we start doing pan drops. And that’s pretty much how we set them.
We started off with the rotary screen. They work great. We’ve tried quick-cleans. They work good. McDougall Acres at Moose Jaw is buying mixed flax-chickpeas now and will give you the flax back.
We just got a mobile seed plant. It uses air, screen, indents and then a gravity table. The lentils go into the tandem truck, and the flax screenings go to the super-Bs, and the old brown TopKick truck gets the refuse like pods and stems. The refuse goes into a pile to compost.
We’re in our fifth year with the mobile but we are building a regular indoor seed plant, because we finally have enough confidence in the system that we’re going to invest in an actual seed plant.
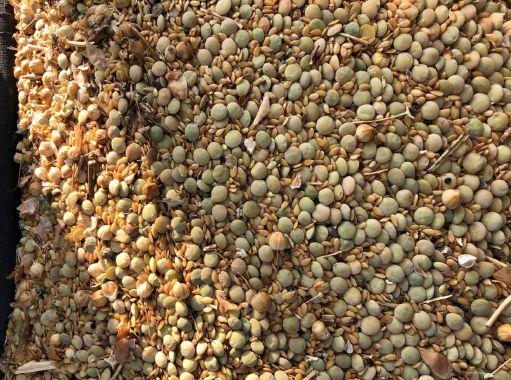
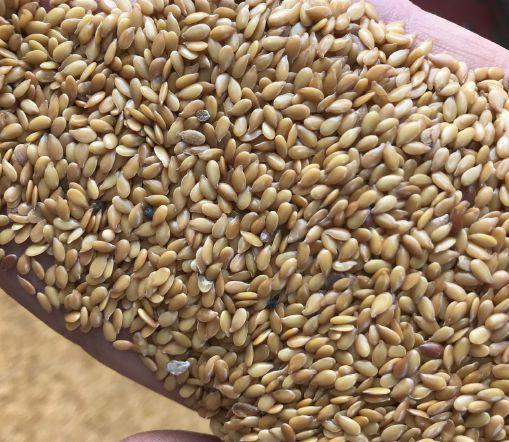
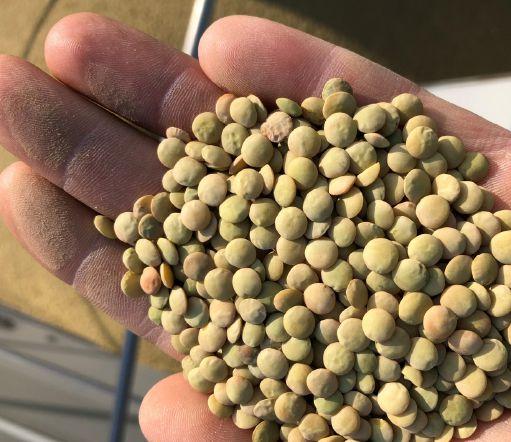
For companion crops, we take like a short-lived perennial or an annual forage crop like clover and we’ll add that in the row with an intercrop or maybe a monocrop. We put three pounds of red clover down the pipe with our pea-canola. The idea behind this is we’re trying to capture as much carbon by trying to have a live root growing as much as possible. At harvest, instead of seeding cover crop, you already have a crop established that is big and fixing nitrogen. The disclaimer on this is clover has been super hit-and-miss for me. I think it’s soil moisture at seeding time.
We’ve tried alfalfa as a companion crop seeding it fababean. After harvest, we seeding fall rye right in behind the combine with inter-row seeding. So now we have rye and alfalfa growing. We tried to spray out the alfalfa in the spring with two and a half ounces of 2,4-D and the alfalfa was laughing at it. By the time we got back with six ounces I wasn’t sure if I should be spraying the alfalfa out of the rye or the other way around. This was in 2017, so it was brutal with 35 millimetres of rain. We combined 25 bushels of rye. It absolutely blew my mind. I didn’t think we were going to get our seed back. I know 25 bushels of rye is not super cash-flow awesome, but considering the situation, I just thought it wasn’t a complete loss. But the alfalfa is still there.
So we are continuing to try to provide some diversity with cover crops. One of the big things about this for me was keeping the temperature of the soil down. At 100 degrees F, we’re only using 15 per cent of our moisture for growth, and 85 per cent is lost to evaporation. But at 70 degrees F, we’re using it all for growth. For us, if I have bare soil, I want to put something out there, even something small that’s growing that’s keeping it covered.
One of the big benefits of cover crops is increasing organic matter. A one per cent increase in soil organic matter, which is about what we’ve seen since we’ve started, is an increase of water holding capacity of about 25,000 gallons per acre, which is an acre-inch. I know for me there’s always a time that I could use one more inch rain. So if we can get that stored in the soil, I think that’s a win.
We’ve had lots of cover crop mistakes. I could do an entire hour talk just on this. But mostly, have a plan. Know what you want to do. Don’t just go blindly. Talk to somebody who’s got some experience. I’m sure there are neighbours and guys selling seed. Most of them know
what they’re doing to a certain degree. All of my mistakes were lack of planning.
We built our own little planter because we wanted to try out wider rows. The idea was to find out what yield penalty we have with wideenough rows to make our cover crops work. This turned into the world of unexpected circumstances and unexpected results. Right off the bat, we knew we had something different. We compared our 1890 on 10 inch row spacing and the small planter on 15 inch row spacing. Right away we could see there was a difference and the planter did a far better job of crop establishment.
We inter-row seeded clover in late June between the planter rows and had good establishment. On Aug. 3, the furnace turned on and it starts getting hot and dry. We could see the colour differences. The wider rows were much darker green and taller.
The cover crops were still there and eventually went dormant. The thing that still got me – we replicated this 12 times to be sure – we had 15 per cent more yield on our 15-inch spacing. It was same seeding date, same fertility, same everything other than it was a little bit different opener and wider rows. I was expecting how much less and we actually got a little bit more. So that’ll be “to be continued” next year.

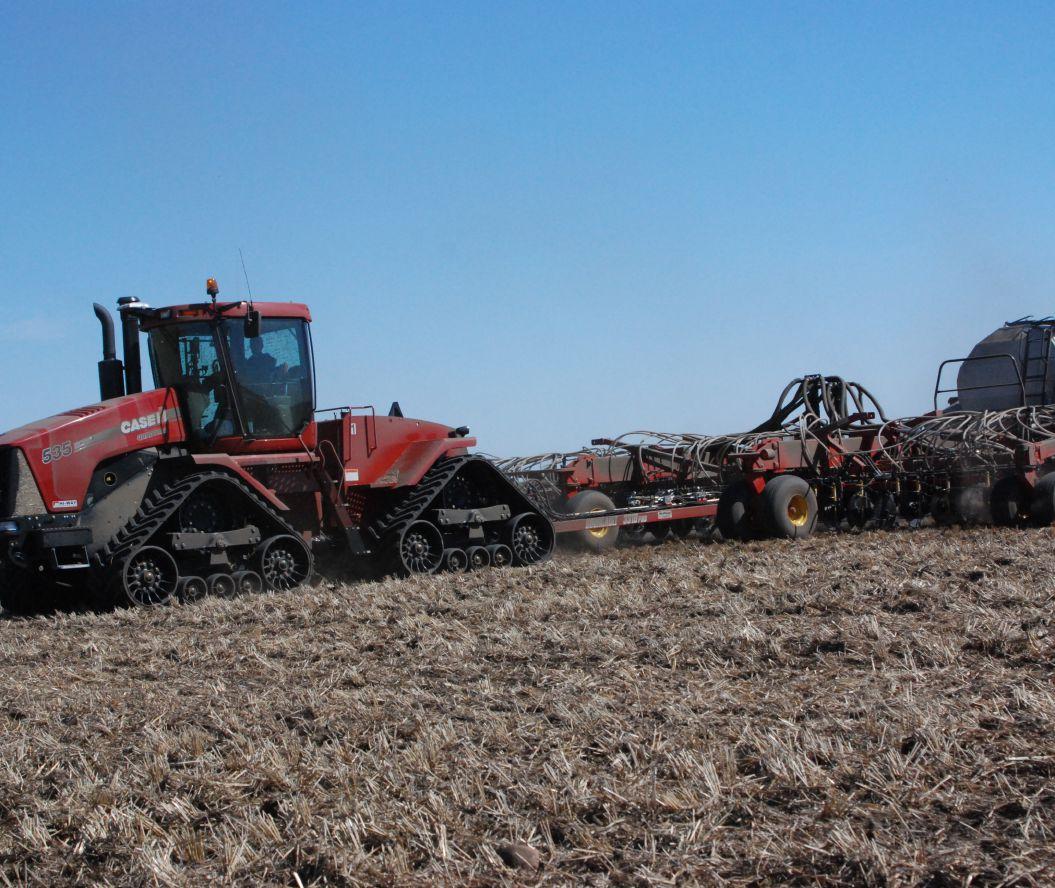
Management practices to support soil microbial communities.
Healthy soils are alive. Up to one quarter of the Earth’s species live in soil if you include plants and their roots, mammals, small and large invertebrates, and my area of research focus, which is microorganisms. In terms of soil microbes, in one teaspoon of soil there are more microbes than there are human beings on the Earth, and in that same teaspoon of soil there are tens of thousands of different kinds of microbes.
The microbial biomass in a typical arable soil is 0.0025 grams
per gram of soil. It doesn’t seem like very much, but if you scale it up, it’s equivalent to about a hundred sheep per hectare or 40 sheep per acre in terms of actual living biomass. Different than sheep, soil microorganisms have a remarkable genetic diversity, and that means that they can perform a remarkable diversity of functions. What are some of the practices that we can use to support soil microbial communities?
ABOVE: No-till encourages mycorrhizal fungi.
Some of these beneficial practices are continuous cropping, reduced physical disturbance, balanced nutrient management, organic amendment application, diverse crop rotation, cover cropping and use of inoculants. All of them have the commonality that they build soil organic matter.
Think of the size of the microbial community in soil like a biological engine that’s driving numerous important processes. The bigger the engine, the more capacity you have to drive those processes when and where the time comes that they’re needed.
The importance of microbial diversity in soil can be a little trickier to understand. We have this definition that we call “functional redundancy.” What that means is, at any one time in the soil, a diverse community will have more than one population capable of performing a critical function under different conditions. Let’s take nitrogen mineralization as an example. We need nitrogen mineralization to be occurring early in the spring when the soil is cold. We need it to be occurring during growing season when soil conditions are warm and perhaps drier. We need nitrogen mineralization occurring in the fall when there are no living plants there. It’s the functional redundancy aspect of microbial diversity that ensures that there’s a population there that can perform that function of nitrogen mineralization under all of those different conditions. When the conditions prevent one species or population from performing the function you need, there is another that can take over.
So it’s kind of like insurance. You have critical soil functions that are performed by soil microorganisms and a highly diverse community gives you the insurance that that process will occur under a variety of environmental conditions that may or may not be under your control.
Why do healthy microbial communities matter? Healthy soil microbiomes nurture healthy plant microbiomes. The microbiome is just the totality of all microorganisms that inhabit a particular environment. Every single time we plant a crop, we’re planting it into a soil that is full of microbial life. If we’ve got a healthy soil, we’re optimizing the opportunity for that plant to capitalize on that microbial life. If we’re planting our crop into an unhealthy soil, we have an immediate disadvantage.
The answer to many of our problems is soil organic matter in one way or another. That’s because soil organic matter improves soil physical properties. It’ll improve the infiltration of water. Soil organic matter provides food, water, shelter, and aeration for microorganisms. When we think about carbon in soil and soil organic matter, the idea of building soil carbon is actually pretty simple – carbon in minus carbon out equals storage. So if we want to increase soil organic carbon levels, we can either increase the amount of incoming carbon, for example by increasing plant carbon inputs, or we can decrease the amount of carbon leaving the systems by decreasing the amount of loss, unwanted loss due to microbial activity.
What are soil biota and those soil microbes doing? They provide ecosystem services. They’re controlling plant growth. They produce hormones. They directly associate with plants in symbioses. They also suppress pests and disease, so a healthy microbial community will be more competitive against pathogens that might try to take over. Other ecosystem services include the maintenance of soil structure and hydrology, gas exchange and
carbon storage, as well as soil detoxification or the breakdown of unwanted contaminants in soil.
The first example of how soil microbial communities are facilitating all of these different ecosystem services is a simple experiment that’s been running for a really long time that shows how putting in more carbon into the soil increases microbial abundance. The Rotation ABC historical experiment in Lethbridge, Alta., began in 1910 when the research station was established and the native prairie was broken. At that time, researchers wanted to understand what the effect of fallow/wheat/wheat versus continuous wheat would be on soil productivity.
This is a comparison of a long-term continuous wheat experiment, “long-term” being a hundred years. In the 1960s when the use of nitrogen fertilizer became common, these plots were divided and they started applying nitrogen at a rate of 45 kilograms per hectare. About five years later, they split the plots again and applied phosphorus. So we have wheat grown continuously for a hundred years and a wheat-wheat-fallow rotation with no fertilizer whatsoever. Even under a really drastic N and P imbalance, there is still higher microbial carbon where there is a crop every year (in continuous wheat). And the same holds true for all of the other fertilizer treatments. The bottom line here is if you feed the bugs, you will support their abundance. Even in the absence of balanced fertility, more carbon input is very likely to build more microbial biomass. However, this is not what I would call a healthy soil.
One of the tools that I use a lot in my research program is the Carbon-13 (13C) stable isotope tracer. We can tell which organisms generally or sometimes very specifically have utilized carbon. And then we can also tell what’s left behind in the soil as well as the proportion of our tracer that’s lost during respiration. We use it in order to follow carbon that we’ve added to see which microorganisms use it, what’s left behind, and how much is lost.
As part of a trial looking at how fungal nitrogen cycling affected nitrous oxide emissions, I looked at how reduced physical disturbance, in this case no-till seeding, affected the microbial biomass. We looked at four different long-term research trials of about 25 years at Swift Current and Scott, Sask., and Ellerslie and Breton, Alta. – representing four different climates and soil types.
The first thing that we saw was that indeed no-till increases the amount of microbial biomass in the soil, particularly right in the zero- to five-centimetre range where the crop residues are left, but also deeper in the soil profile. Conversion to no-till decreases the amount of carbon out of the soil, thereby increasing the amount of storage and in this case, also the amount of microbial biomass.
I looked at community composition and the ratio of fungi to bacteria. In all four of these systems, although microbial biomass increased under no-till, there was no difference in the ratio of fungi to bacteria whatsoever. That was a real surprise, because it was very commonly accepted that decreased physical disturbance would promote fungal dominance within a soil system.
One thing that we did see was that no-till promoted
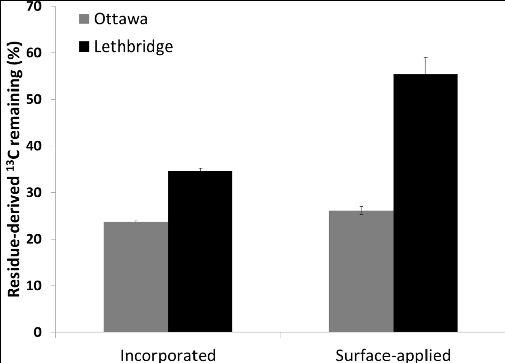
In Lethbridge, less residue remains when incorporated, whereas in Ottawa, incorporation makes less of an impact on the decomposition of residue.
mycorrhizal fungi. Mycorrhiza is an obligate symbiont. It uses carbon from the plant and then it in return provides nutrients and water back to that plant. So in the absence of a host, its fungal hyphal network is really kind of stranded in the soil. When you till mycorrhizal networks, it sort of kicks those Arbuscular mycorrhizal fungi (AMF) in the teeth.
Crop rotation diversity improves microbial diversity
More recently we had a Carbon-13 tracer study set up at 10 different sites across the country. One site is in Lethbridge, Alta., and another in Ottawa. We compared these two sites because one was a semiarid prairie system versus a more humid, wetter system in the east; the rules that govern microbial communities in wetter and drier soils aren’t always the same. We grew out barley in a chamber with 13C labelled gas, so now we have barley residues with 13C tracer in them. That enables us to follow it as it gets incorporated into the soil, used by microorganisms, and lost as CO2 in the end. We either incorporated those residues in the top 10 centimetres or we left them on the surface to mimic no-till.
An important thing about this study is that we added the residues with the tracer in 2007. Every year since, we’ve gone back and added barley residues without the tracer. That allows us to follow those carbon molecules that we added in 2007 through to today and beyond without starving the system for carbon in the meantime.
For the microbial work, we looked at six months, 12 months, and 24 months after residue addition. If you compare incorporated to surface-applied at Ottawa, there actually isn’t that much difference – approximately 25 per cent of that residue remains after two years in the more humid climate. But if you compare no-till to tilled in the prairie conditions, a lot more residue 13C remains two years later under no-till when it’s drier.
We looked at the microbial community composition in this experiment. For the Ottawa site, there seemed to be a bit of a community difference when we surface-applied or incorporated the residues but no differences in community in the depth of residue incorporation.
Conversely, in the Lethbridge soils, microbial communities
were strongly differentiated by both depth and whether or not we incorporated the residues. This tells us different microorganisms were actively chomping on that 13C residue whether we incorporated it or surface-applied it.
The next question then becomes what does this mean for the actual composition of the soil organic matter? This leads to the observation that often in no-till, more soil carbon doesn’t necessarily mean that we have increased nitrogen mineralization capacity because perhaps the quantity of soil organic matter might be higher but not as high quality, for example.
Another beneficial practice for promoting health soil microbiomes is the use of diverse crop rotations. Two long-term studies, one in Swift Current, Sask., and the second in Harrow, Ont. looked at crop rotation diversity. At Harrow, continuous corn was compared to a corn-soybean-wheat rotation. At Swift Current, continuous wheat was compared to wheat-canola-wheatpea rotation. Dr. Jennifer Town, who’s a postdoctoral researcher that works with me, is conducting this work. We looked at various aspects of microbial abundance, microbial community structure, and most importantly microbial community function in these systems.
You would expect that with higher above-ground diversity you might see higher below-ground diversity. Surprisingly we found that there was no difference in bacterial diversity in the soil whatsoever as a result of improving the rotation diversity.
However, we did see that there was a difference in the community structure and function. In the diverse corn rotation in southern Ontario we saw more mineralizable carbon. At another sampling time point we saw more amino sugars, which is a readily available carbon source that comes from the microbial biomass itself once it dies; as well as beta-glucosidase activity, and that’s another carbon-cycling enzyme. So definitely we saw accelerated carbon cycling in the diverse rotation compared to the continuous corn.
I mentioned that mineralizable carbon seems to be positively associated with crop rotation diversity. That’s a good thing, we think. One of the reasons for this is that we also measured the lignin content in soils. Lignin is a structural component of plant tissue. But, it has a really high C-to-N ratio and it’s not that palatable to microbes, so it takes longer to break down. In both the wheat and corn systems, we’re seeing really quite a significant accumulation of lignin, and all different types of lignin derivatives. So not only have we changed how the system is functioning but actually this is a very clear indicator that we’ve changed the composition and the quality of the soil organic matter, and that likely has to do with that yield boost that we saw in the diverse rotation.
The last example of beneficial practices that I’m going to talk about is balanced nutrient management. It is a long-term cropping system at AAFC Scott, and compares long-term organic versus conventional management. It’s not a good-news story for the organic system, but I want to make it clear that I certainly do not want to pick on organic management with this example.
The defining criteria of the organic system is that there are no synthetic inputs and there’s a high amount of tillage in order
ORG Annual (ANN)
Perennial (PER)
CON Annual (ANN)
Perennial (PER)
GM lentil-wheat-pea-barley-GM sweet clover-mustard
Mustard-wheat-barley-alfalfaalfalfa-alfalfa
Canola-fall rye-pea-barley-flaxwheat
Canola-wheat-barley-alfalfaalfalfa-alfalfa
nual rotation had the highest microbial biomass, not surprisingly, and that microbial biomass was significantly reduced in the other three soils, and lowest in the organic annual soil. This was also reflected in soil microbial function. We saw reduced turnover of phosphorus, nitrogen, and carbon – reduced microbial biomass and impaired microbial function.
We looked at microbial community structure of those organisms that were actively munching on added 13C barley residues, and we tracked them through time over about a hundred days as the residue decomposed. By the end of our experiment the conventional annual system had the most abundant and robust microbial community and highest fertility while the community composition really didn’t change that much over the course of the hundred days.
The take-home message from this particular experiment is that, because in the organic system we weren’t using any organic amendments – there was no manure application – managing crop residues is a critical aspect of restoring fertility. We have to get more nitrogen and phosphorus into the system certainly, but even if we can manage to do that, it’s going to take a long time to get our soil carbon back in check by the time we get yields up and residue returns coming back into the system.
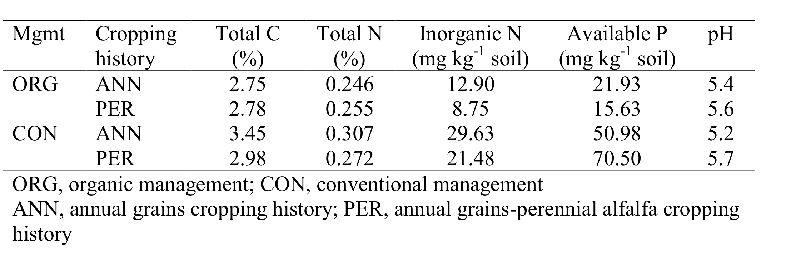
to combat weeds. The reduced input conventional system uses very judicious use of fertilizers and pesticides and no-till. In both systems, we have diversified crop rotations with either an annual grains-based-rotation or a second rotation that has three years of perennial alfalfa in it.
Throughout the course of the 18-year study – three full sixyear rotations – yields in the organic system were declining. There was a phosphorus problem – Scott soils inherently are quite low in phosphorus – and the researchers also knew that they weren’t getting enough nitrogen into the system.
After 18 years, soil tests showed nearly 3.5 per cent total carbon in the annual grains conventional system, compared to 2.75 per cent in the organic system. Available nutrients were also drastically different. If you look at the available phosphorus column, you can see that that conventional annual treatment is far, far higher than all of the other three treatments. It also had more available nitrogen.
We also wanted to understand how microbial communities were functioning in these soils. Postdoc Melissa Arcand, who is now professor in the soil science department at the University of Saskatchewan, did this work. The high-fertility conventional an-
We need to remember that carbon just isn’t carbon. It carries the energy that fuels all of these microbial processes. I think of carbon as this molecule that carries energy around our ecosystem. That’s why building soil carbon can be so impactful if you have an imbalance in your soil. By improving practices, as example no-till or diverse crop rotations or using perennials in rotation, we can improve soil organic carbon content, but it takes a long time. It is important to remember that storing carbon in the soil in and of itself doesn’t realize its capacity to function in the ecosystem. It actually has to be utilized to be doing its job. Yes, we want to store more carbon in the soil, but we also want to improve the use of that carbon by biota in the soil, including plants, through the actions of a healthy soil microbial community.
WATCH MORE BELOW
Looking at the bigger picture with soil, water and topography maps.
When talking about variable rates, start with the end in sight. You have to have a picture in your mind of what the zone maps are going to look like before you even make them. I’m going to build that picture for you today. Put the right rate in the right zone.
Point one, you must get the zone maps right. I’m going to spend probably 90 per cent of my time on that one right there. If you don’t get your zone maps right, you’re done. I’ll spend maybe just 10 per cent of the time on getting the fertilizer rates right. Normally, I would spend a lot more, but I think, in the interest of time, I’m just going to spend times on zone maps today.
What causes variability? Everything, right? There are tons of things that cause variability. Fertility is just one little part of all the variability that’s going on out on the field.
The best way to get a map of all of the variability together, typically, is some type of an image of your field, whether that’s satellite image, yield maps or other ways. The point is these are tools that, a given point in time, if you take a shot of your crop in June, it’ll show you everything that affected your crop in June. Cutworms ate the hills. The hills didn’t come up that good because it was dry. You mudded in the depressions. Too much residue in some spots. That’s what it’s going to show. Everything.
So, this is just a drone image that Greg flew for us for a particular field at Wadena I’m going to spend a lot of time on today. Wadena is about three hours east of Saskatoon here in the Quill Lakes Watershed. We’ve got eight years of correlated imagery here. We built a yield potential map, and I’m just going to show this to you in 3D because it’s much easier to understand.
If you look at this picture, you can see the high yielding areas are all typically midslopes in this field and are the most consistent land in that area. It’s not the first thing to flood. It’s not the first thing to dry out. It doesn’t have salinity. It’s guaranteed crop country in that area. The tops of the hills are medium yield potential. You look at some of these depressions and they are medium yield potential. Some areas are saline spots with medium yield potential. So, it’s putting a whole bunch of factors together that, yes, they’re medium yield potential, but they’re not all the same thing, right? These maps are a good representation of historical yield.
Now, having said that, 50 per cent of the time when we make those yield potential maps, whether it’s long-term historic yields
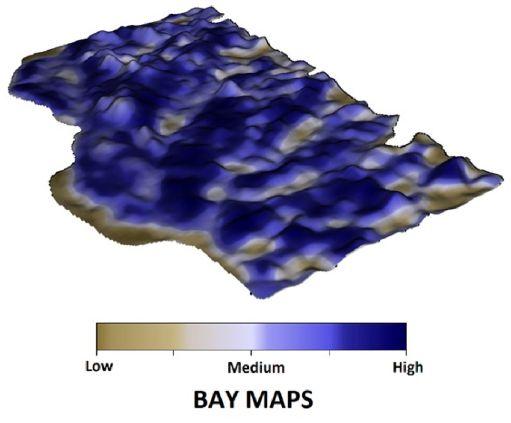
or long-term historic images, there’s no correlation between the years. In other words, there’s so much variability from the high and low areas of yield from year to year that you can’t even relate one year to the other. This is an accurate yield potential map, but, now, is that a zone map? It’s just not the starting point. It isn’t the foundation for zones.
So, how do we get focused in on zones then? We’ve got all of this variability. In my opinion, these are the three primary things that you need to get a picture of in the field, to understand what your fertilizer response variability is going to be. Those are soil, water and topography. Notice that they’re all interrelated, right? Topsoil depth and organic matter levels, are related to topography. Different soil properties, like texture, influence how much water can be stored, and are also at different spots in the landscape. Water, is number one. Water drives everything. The water map is the most important map for variable rate fertilizer. If I could only pick one thing, if I had an accurate water map of a field, that would be what it is.
We’ve heard about nitrogen mineralization. There are eroded hilltops with low organic matter. Hilltop topsoil was moved to the depression where the topsoil is two feet thick and has high organic matter. What’s the difference in nitrogen release going to do in
these areas? Do we need research on it? I don’t think so. This has been researched for 40 years, but we just don’t apply it.
Sulphur is very similar to nitrogen and mineralization coming out of organic matter is primarily an organic-driven process. So, mineralization, sulphur coming out of organic matter is the same thing as nitrogen. So, you’ll get that same trend of higher organic matter releasing more mineralized N. We see this trend in sulphur 99 per cent of the time.
Phosphorous, I would say this is maybe 70 per cent of the time, that this would be the trend with low P fertility on the eroded knolls, and high fertility in the depressions.
Where’s the water? We all know this, right? Water run off areas have less snow, and low organic matter that stores less water. Water ends runs off into depressions.
So, how do we get a map of spatial fertility-based response characteristics? Well, this is how we develop them – soil, water, and topography maps. I’m going to show you how we built these. I’m going to start with thinking in cross-sections. I’m going to add something to the soil horizon discussion. The important thing is you have all these different types of soils and soil horizons in your field. So, when you go out and look at your field, here’s the picture I want you to get: take a slice through it. What do you have? You have eroded thin organic matter topsoils. You have thick organic matter topsoils down in the depressions.
Now, the last cross-section you need to think of is the soil landscape and how water moves in it? We started mapping EC in 2008 with Veris EC machines. We switched from Veris because we felt that for measuring electrical conductivity, they had some challenges with very dry soils, heavy trash, frozen soils, etc. We switched to EM38s sleds, which presented their own challenges. But since day one, every acre we’ve mapped, we’ve had RTK GPS on it for accurate water maps. The last two years now, we’ve built an autonomous electrical conductivity unit. Now, we’ve had several farms that have mapped their whole farms, just attaching the electrical conductivity unit to equipment like an air drill. You just plug it in, and it measures electrical conductivity on the go. There’s no controllers. There’s no cables. Just maps it all on its own.
Our SWAT MAPS have ten Zones. Zone 1 is at the top– eroded knolls, sandier soils. As you go down, you get to your midslopes, and as you get to Zones 9 and 10, these will be depressions, high organic matter areas.

Typically, this is what you would see with an electrical con -
ductivity map. Because it is in 3D, you can see all the water shedding areas throughout this field are low EC. This is what I would call fairly typical – areas that shed water -they’re typically coarser textured. Areas that are starting to collect water a little bit, these are midslope soils, so they have a slightly higher electrical conductivity, but it’s not a bad thing. Areas that are blue and purple on this map are areas of salinity. So, one challenge with salinity that we find is it’s nice to say you’re going to seed it down to grass and you’re going to tile it and all these things, but when they’re all spread, the little patches all throughout the field like this, it’s basically impossible, right? You’re farming through them. You’ve got to deal with them.
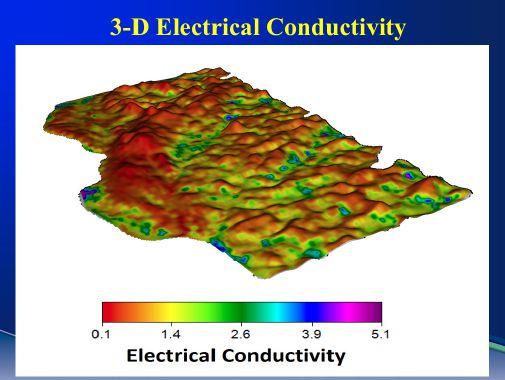
It is important to understand that you can never use EC as a layer on its own. You can get high EC on the tops of the hills and high EC and salinity in the low spots – two totally different things.
RTK elevation is a tremendously valuable piece of data but is useless as a zone map. You can have a depression at a high elevation that holds water while a knoll lower down sheds water. Elevation doesn’t know if it collects water or doesn’t collect water. It doesn’t know if it’s wet or dry. It doesn’t know if it’s a hill or a depression. You need a topography model.
We use 3D topography models as part of our SWAT Maps. Topography and elevation are not the same thing, but topography models themselves are still useless on their own. Why is that? Well, because all depressions are not the same. A depression can drain. A depression can flood, and a depression can be saline. Those aren’t all the same things. I don’t want to put those all into one zone.
We model where the water sits in this field. You can see the flow paths, where water is held in depressions. I don’t talk about it much, but if people are doing tile drainage or surface drainage, you need this type of modelling. You need RTK elevation. You need to map where all your depressions and flow accumulations are. You need to know where your salinity is because those are all things you want to fix.
You can also collect soil organic matter maps. The hills are low organic matter, and the places where water and erosion are accumulated is high organic matter. This isn’t rocket science, but it’s another map. Now, organic matter is useless on its own, too. So, there’s still all these problems using single-layer maps.
All of those layers are just base layers to build the model. So,
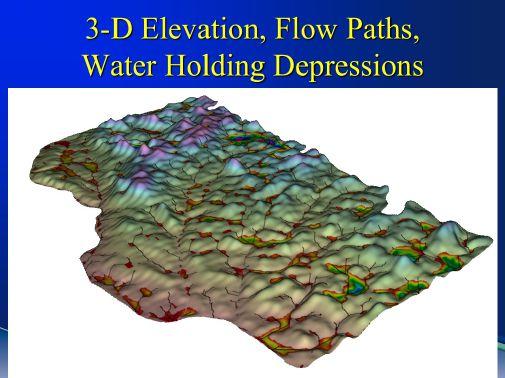
here’s a final SWAT map where we have combined soil, water and topography layers together. We’ll make several different maps, and then the agronomist goes to the field and ground truths them. You soil test. You do expensive ground truthing to make sure you’re picking the right map for the field.
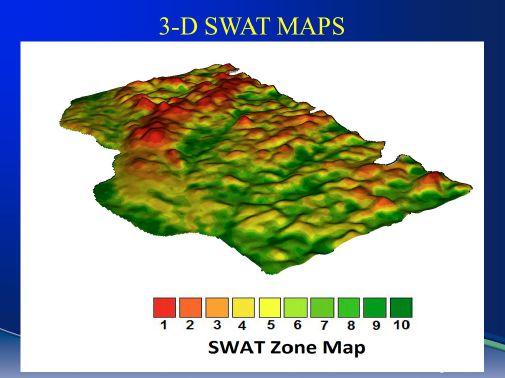
The most extreme hills are all in the Zone 1 – the lowest organic matter. Some of the smaller water shedding areas are Zone 3. All the midslopes are Zone 5 and 6. So, these are areas that are never too wet or too dry. You start collecting water as you go into 6 and 7. You have light salinity in Zone 9, and severe salinity is in the Zone 10. So, that’s all those layers together.
We treat soil potential maps or SWAT MAPS 100 per cent separate from biomass and yield maps. These are two totally different ways of collecting data and building the maps. The layers of maps we develop are for applying inputs in the soil. I don’t know how else you can go out there and apply inputs in the soil without having all those layers.
The second part of the equation is to get the fertilizer rates right using the SWAT maps. The goal is to get the fertilizer rates right for each area to provide the optimum return. We soil test these fields. We always make a ten-zone map because we love the resolution it gives us on the map, but it’s too expensive and too time-consuming to soil sample ten zones so we sample five zones. We lump Zones 1+2, 3+4, 5+6, 7+8 and 9+10 together. Our trucks have two

different soil samplers in them, so we can do 24” cores at any depth. You’re zone sampling, based on soil, water, and topography.
Soil tests can be variable. In 2017, one of our agronomists kept five samples from each zone separate, and had them analyzed separately for P. Some zones were fairly uniform but others were very variable. Over all the zones, probably 30 per cent of the acres are extremely low in P, but as you get into Zones 9 and 10 it’s loaded with P, and there is salinity there, too.
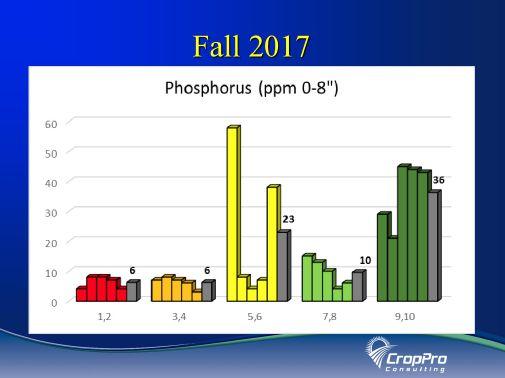
The farmers are always, constantly beating us up, “Well, prove to me that it pays. I want to see some research.” I say there’s a simple solution. Take all this phosphorous in Zone 9 and 10 where there’s no crop growing, put it up and gamble in all the higher more productive ground that is low on P. Put it back into your good ground.
So, here’s just a prescription for this field: PK blend, very high phosphorous rates in all the Zone 1 to 4. Still very high rates, 80 lbs., in the midslopes and then cranked it right off to next to nothing down in the depressions Zones 9 and 10. Urea, even though we have ten different zones, we’re putting on high rates of urea in all the Zones 1 to 6, and cutting it right back in the depressions.
About 95 per cent of what we do is variable rate fertilizer rates and seed rates. What do you do with variable rate seed? I’m going to use an example of wheat. We want to target thick plant stands in the Fusarium regions of western Canada -- the Black soil zones and heavier moisture areas. We target plant stands of 30 plants per square foot. We’re trying to get more main stems for Fusarium and wheat midge control. We want uniform growth so we can target the correct timing for fungicide application.
So, what was the strategy? We put on the target seed rate in all the midslopes because it’s the most consistently established in this field. We put more seed on the hills, and quite a bit more in the
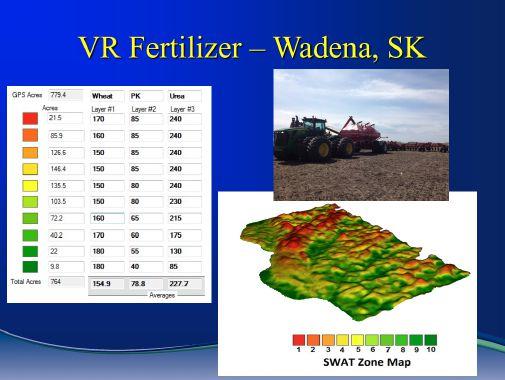
depressions and salinity areas. This might be different for different fields or different areas.
We always do plant stand counts in the field. Basically we were able to achieve 30 plants per square foot in all the Zones except in the salinity where stands were 22 plants.
At the end of the year, this farmer is spraying all of his crops for Fusarium. When he goes to spray for Fusarium, he wants to see the hills and the depressions coming into maturity at the same time. At 30 plants per square foot the field is all main stems, and the whole field is consistent from hills to depressions. If it’s that consistent at fungicide staging, what do you think it’s like at harvest time, right? It’s more consistent. Seed growers, the conversation isn’t even yield. Most often, it’s about maturity and keeping the fields as even as possible because as soon as it’s ready to go, they want to get out there and get on that stuff and get it in the bin as soon as possible. So, everyone’s goals are slightly different.

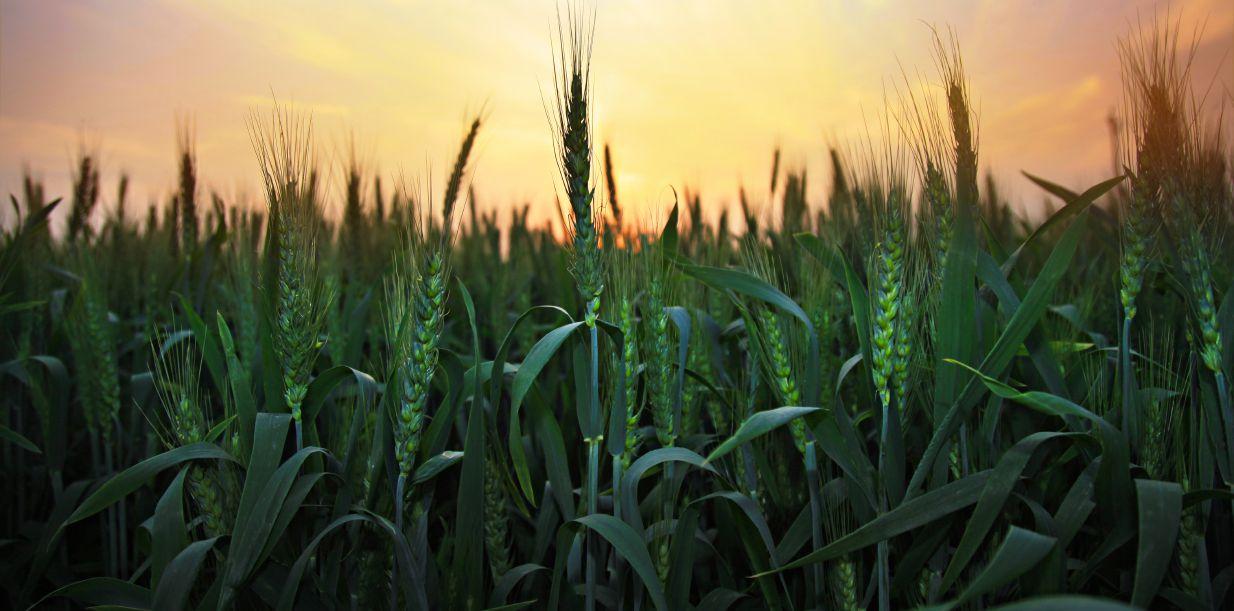

Top Crop Manager thanks the speakers of the 2019 Soil Management and Sustainability Summit for sharing their presentations, images and videos with us. Without their assistance, this digital edition wouldn’t be possible.