TOP CROP MANAGER

TO OUR ATTENDEES, PRESENTERS, SPONSORS AND EXHIBITORS
GOLD SPONSORS

SPONSORS


SILVER

TO OUR ATTENDEES, PRESENTERS, SPONSORS AND EXHIBITORS
GOLD SPONSORS
SPONSORS
4 Evaluating root rot in pulses
Presented by Syama Chatterton
8 Investigating PGRs
Presented by Sheri Strydhorst
12 PGRs on spring wheat
Presented by Amy Mangin
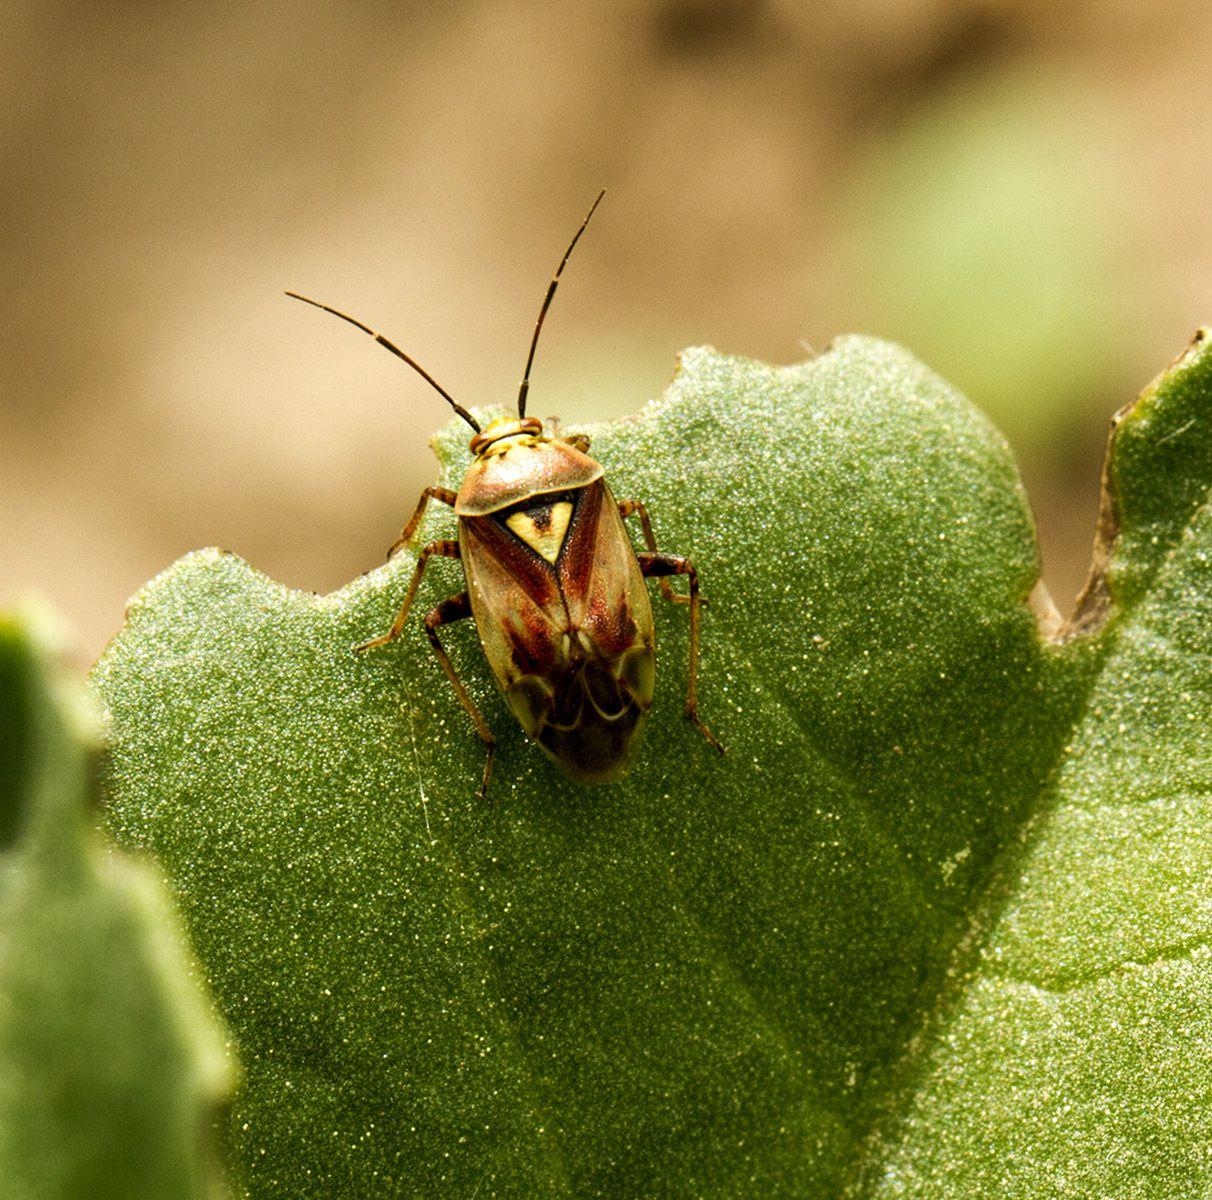
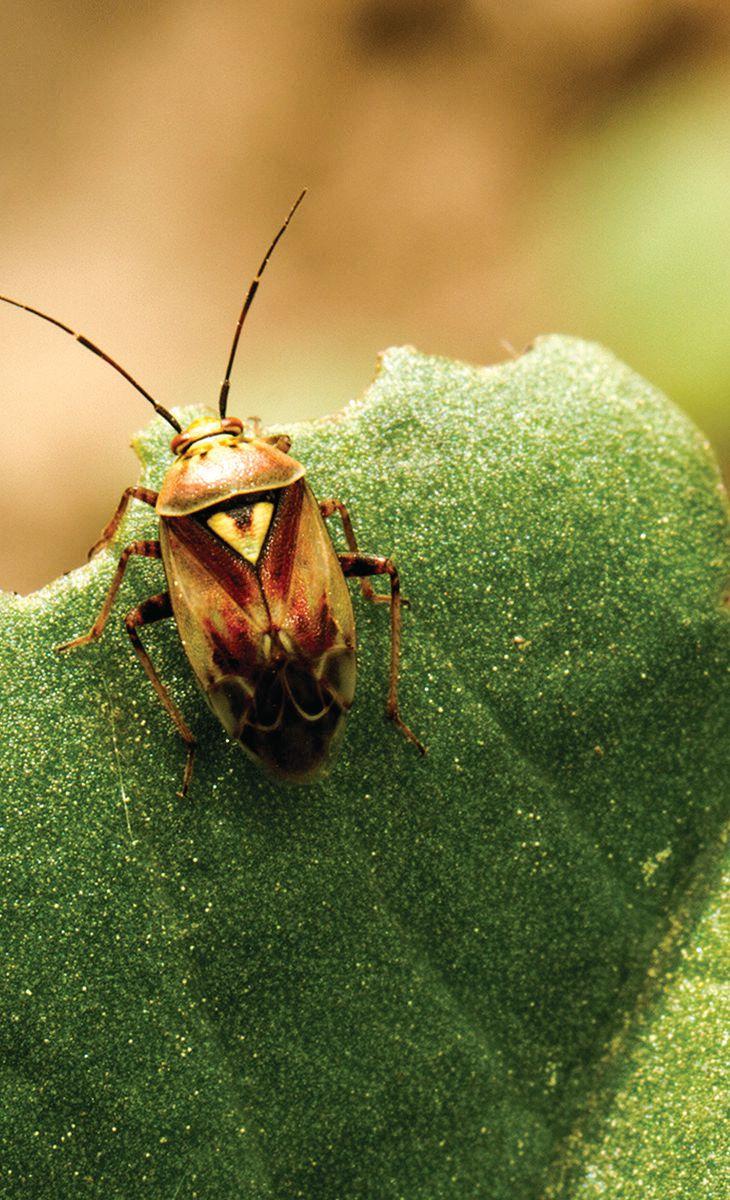
14 New (old?) insect threats and the “old guard” of beneficial insects
Presented by Tyler Wist
18 Fertilization to improve crop quality and health
Presented by Jeff Schoenau
21 Tackling clubroot
Presented by Dan Orchard and Curtis Henkelmann
25 The future of neonics
Presented by John Gavloski
29 Smart farming and glimpses into the future
Presented by Joy Agnew
33 Next-generation technologies for tomorrow’s crops
Presented by Leon Kochian
35 Maximizing fungicide use
Presented by Tom Wolf
as part of Top Crop Manager, May 2020, by Annex Publishing & Printing
PO Box 530, 105 Donly Drive South, Simcoe, ON N3Y 4N5 Canada Tel: (519) 429-3966 Fax: (519) 429-3094
Editorial Director, Agriculture: Stefanie Croley
Associate Editor: Alex Barnard
Western Field Editor: Bruce Barker
National Account Manager: Quinton Moorehead
Publisher: Michelle Allison
Group Publisher: Diane Kleer
Media Designer: Curtis Martin

STEFANIE CROLEY EDITORIAL DIRECTOR
Welcome to Top Crop Manager Focus On: Plant Health. This is the first of our summer digital series, comprising the presentations and reference materials used at the 2020 Plant Health Summit, hosted this past February in Saskatoon. Our fifth annual research summit brought together nearly 300 producers, agronomists and crop science consultants, scientists and industry representatives over a day-and-a-half of discussions, audience engagement, networking and knowledge sharing. If you were lucky enough to be there, perhaps these proceedings will jog your memory. And, if you missed it, you’ve got the next best thing right here.
This year, instead of our typical video interviews with the speakers, we’ve taken a different spin on coverage with a series of podcast episodes featuring exclusive speaker interviews and snippets of their presentations. Your first access to the podcast episodes are at the links below, and you can find all of our previous episodes of Inputs – the Podcast by Top Crop Manager on Apple Podcasts, Google Podcasts, Spotify, or wherever you listen to podcasts. You can also check out a video highlight reel of the event here. Thanks to our esteemed presenters for sharing their knowledge and studies with us.
Happy reading – and listening.

@TopCropMag
/topcropmanager

Did you miss the Plant Health Summit? Our podcast episodes linked below feature exclusive speaker interviews and presentation snippets. Visit agannex.com or tune in below.
Fertilization to improve crop quality with Jeff Schoenau
Smart Ag with Joy Agnew
PGRs with Sheri Strydhorst and Amy Mangin
Beneficial insects and neonics with Tyler Wist and John Gavloski
Stubborn diseases and management strategies with Syama Chatterton, Dan Orchard and Curtis Henkelmann
Getting to the root of global food security with Leon Kochian
Fungicides and spray technologies with Tom Wolf
Exploring Aphanomyces research and the role its accomplices play in driving disease.
Presented by Syama Chatterton, Agriculture and Agri-Food Canada, at the Top Crop Manager Plant Health Summit, Feb 25-26, 2020.
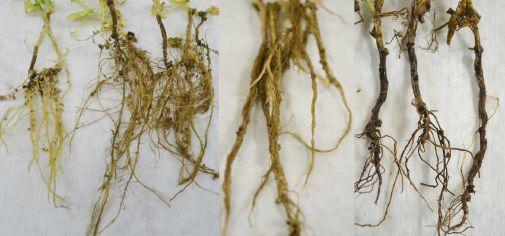
The root rot problem really exploded in about 2011-2012. Most pathologists were under the assumption that it was Fusarium root rot. But we saw that a lot of things didn’t add up, particularly with the symptomology.
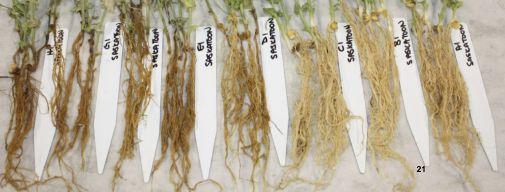
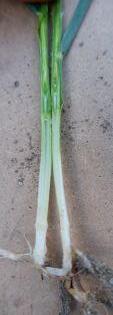
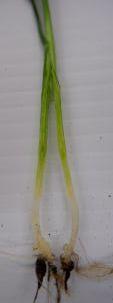
Fusarium root rot tends to cause blackening of the tap root and it doesn’t usually extend into the lateral roots. Instead, in the field, we were seeing roots that were totally decayed, often with complete loss of the lateral roots along with honey-brown and black discolouration.
We were also seeing widespread damage in some fields. Generally, Fusarium root rot doesn’t do this, so we knew that there was something else going on. What we found was an unexpected surprise – the pathogen Aphanomyces euteiches. It causes very distinct symptoms on roots and a honey-brown discolouration. The most telltale symptom is pinching of the epicotyl, and then often what happens is Fusarium comes in afterwards, really making symptoms difficult to diagnose.
Aphanomyces was reported for the first time in Saskatchewan in 2012 and in Alberta in 2013. Large-scale surveys across Alberta, Saskatchewan, and Manitoba were conducted to look at the prevalence of Aphanomyces root rot, and to also look at what other pathogens were involved. The surveys from 2014 to 2017 found that Aphanomyces was widespread across the Prairies. The hypothesis is that it is a native pathogen; it’s in the soil. After extensive production of pea and lentils – fields with a history of 20 to 25 years, even with a pea or lentil once every five years – the inoculum increases above threshold causing these pulse crops to get the disease.
In Alberta over the past five years, prevalence of Aphanomyces was between 40 to 50 per cent of the fields surveyed. The survey period had really wet years and really dry years, and for the most part, prevalence and incidence went up and down with moisture. In Alberta over the last few dry years, about 30 to 40 per cent of fields were positive. Unfortunately in Saskatchewan, there were peaks in 2015 and 2016 around 65 to 70 per cent
Aphanomyces prevalence, down a little bit in 2017 and 2018 at about 40 per cent prevalence, and then, for some reason, in 2019 it was the worst that we have seen yet with about 90 per cent of fields showing positive symptoms. Precipitation in 2019 was a weird year. The average precipitation wasn’t really reflective of what happened in the season, because it was dry in the spring, and plants were stressed. Then with rain later in the spring, it got so wet that Aphanomyces was able to infect in July. Because the plants were already stressed, the disease really took off.
Root rot is a complex. Aphanomyces is our A-list pathogen, but there are some other pathogens that are also contributing to the problem. There are Pythium species and Rhizoctonia species, and many different Fusarium species. For Alberta, between 10 and 90 per cent of the fields are positive for these pathogens. Saskatchewan and Manitoba are virtually the same story.
The other issue is that Fusarium is also a problem on its own. Some fields only have Fusarium root rot, some fields have Aphanomyces plus Fusarium root rot, and a few fields have only Aphanomyces. In Alberta, Aphanomyces is almost always occurring with Fusarium. In Saskatchewan there is more of a balance of 50/50 Fusarium and Aphanomyces.
We tested pea and lentil in the greenhouse and found they are equally susceptible to Aphanomyces. The symptoms on lentils are virtually the same as they are on peas. But in the field, particularly in dry years, lentils seem to be less impacted.
My lab research is conducted in the context of current management recommendations. A big portion of my research that I started four or five years ago is trying to come up with a risk quantification system so we can build some sort of decision support system based on soil testing.
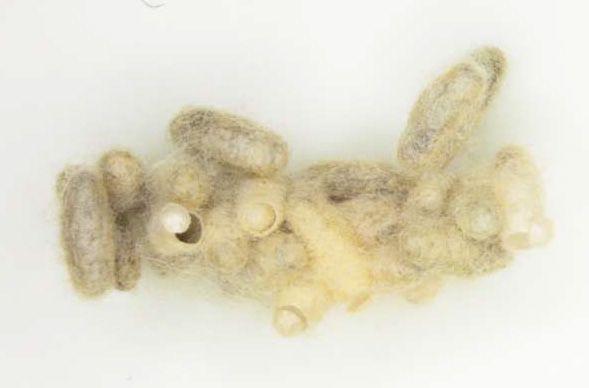
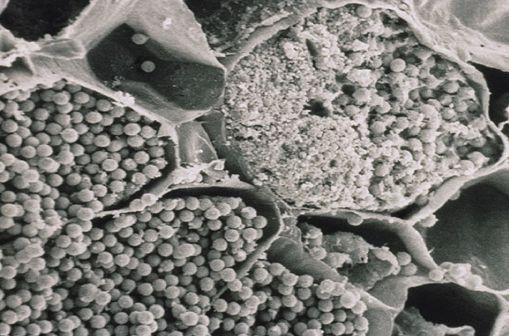
The amount of inoculum that is required to cause disease is the foundation of any sort of risk quantification system. In order to do that, we are trying to measure the oospores in soil, which are the thick-walled resting spores. This is where we’ve run into some challenges. The thick cell walls means they don’t like to be cracked open so that we can test how much DNA is present.
In our research, we looked at the number of oospores per gram (oospores/g) of soil. At low levels, the pea plants were pretty healthy, but at 100 the plants looked very diseased. One hundred oospores isn’t good news because that’s a very low threshold level.
We also found different threshold levels for different soil types. Clay loam had the highest threshold level at 275 +/– 36.5 oospores/g, which is not what we were expecting, because we often see that disease is worse in these heavy clay fields. I think it has something to do with the water-holding capacity of the clay: it holds more water, so even though the threshold dose is higher, it tends to stay wetter for longer. Loam (98.8 +/– 42.9), Sandy Loam (81.3 +/– 76.7) and Silty Loam (44.3 +/– 38.3) had lower threshold levels.
The other research we are working on is using DNA tests to quantify the pathogen level and determine what the risk is. We compared measured oospores using DNA testing versus actual oospores/g of soil. The correlation was pretty good for sandy loam soils, less so for silty loam, but not very good for clay loam soils. For example, for clay loam, the DNA test is telling us there are about 10 oospores but the actual number of oospores is 100. This makes it difficult to test soils that are just at or below that threshold.
We took this comparison to the field and compared the same soils in the greenhouse with DNA testing. In the field soils, we find an average percent incidence of Aphanomyces of about 80 per cent. Our average disease severity is 4.2, and estimated about 1,000 oospores per gram of soil. In the greenhouse, we had very similar results.
But when we look at two different types of DNA testing methods, the DNA measurements were only detecting about 50 per cent of soils positive for Aphanomyces. The two DNA methods estimated 281 to 313 oospores/g of soil, but there was a huge range from 7.6 to 2,300 oospores/g. It’s the number of false negatives that are coming back from the DNA tests that is a challenge, and we’re working really hard on trying to improve that.
The other problem is that we’re underestimating the amount of Aphanomyces with DNA testing because of those multiple pathogens that are interacting together. So, we are also working on trying to make a multiple pathogen detection system, both for Aphanomyces and Fusarium, and that gets a little bit complicated, although I think we’re making progress.
We’re doing field trials to assess our current recommendations to growers. The first is to consider using a seed treatment that targets
the root rot complex. It wasn’t really clear which ones would be effective against Aphanomyces or whether there are any that are effective.
We tried a number of different seed treatments – some of them confidential – so I can’t the share the trade names. We also tried trifluralin pre-seed because there had been some reports of literature in the early ’90s that it had some effect on Aphanomyces root rot. The problem is that we couldn’t incorporate trifluralin in no-till fields so we were just applying it to a heavy crop residue. We also tried Phostrol as a foliar spray to the seedlings. There had been some previous research out of Washington that had shown this might be effective. Long story short, there was no effect of most treatments over four years at four locations.
The other recommendation we are looking at is whether a six-toeight-year rotation away from peas and lentils is necessary because it is a bit of a guess based on what is in the literature. We wanted to see if that recommendation was different under Prairie conditions. And, are there other pulses that you can grow in these infested fields without increasing your risk?
We looked at infected fields to see how long the rotation has to be out of peas before they can be rotated back into the field. One of those fields was at Red Deer in the Black soil zone. The last time peas were grown on this field was in 2011. In 2015 and 2016, there were still fairly high disease severities of around 6 on a scale of 0 to 7. Disease severity starts to come down in 2017, and then was quite low in 2018 at just above 2. By 2017 and 2018 there were some fantastic yields at this site around 95 bushels per acre (6,408 kg/ha). As disease severity was going down, yield was coming up. This indicates that maybe the six to eight year rotation recommendation is correct.
Contrast that to a site in southern Alberta at Taber. The last pea crop was in 2014, but over the past five years there hasn’t been a reduction in the disease severity – still between 4 and 6. The last three years have been very dry, but we haven’t seen the disease severity go down. The yields are much lower than what we saw up at that Red Deer site, as well.
The other thing that we looked at in Taber is how the pathogen composition is changing over time. Particularly we wanted to see what was happening with Aphanomyces and Fusarium. We took root samples in June, and the Aphanomyces levels were quite high on the roots, but the Fusarium levels were quite low. In July, the Aphanomyces levels on the roots were quite low, and the Fusarium levels went up. This shows part of the issue with surveying is that a lot of surveys
are done around flowering in mid-July and we’re missing Aphanomyces. I think that’s another reason why we saw Aphanomyces explode over the Prairies. A good survey time for Aphanomyces is in June about six weeks after planting if you’ve had a good rainfall.
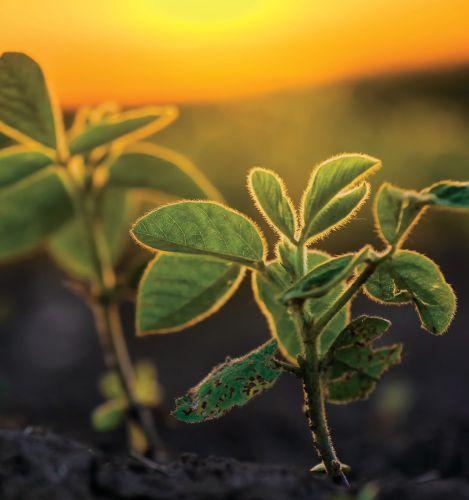
A new rotation study was started in 2018. Each site has a different break of one to five years since the last pea crop depending on when the producer last grew peas. In these rotation trials, cereal and canola were included as standard rotational crops. The trial gives us one- to eight-year breaks between a pea crop, with or without an alternate pulse crop in the rotation. The alternate pulse crop at Swift Current and Lethbridge was chickpea, fababean at Saskatoon and Lacombe, and soybean at Redvers, Brooks, and Morden.
The roots of peas and the alternate pulse crops were assessed for their pathogen levels. We also wanted to see how the soil inoculum potential changes with the different rotation lengths and different pulse crops. Soybean tells the best story with no Aphanomyces and even very, very low Fusarium levels on roots. But peas had very high levels of Aphanomyces, so, I think soybean can be a very good alternate crop to pea. With fababean the picture becomes a little less clear because at the Lacombe site, the disease levels had really come down in 2019. In 2020 we’re going to add peas back into the rotation and see how quickly the inoculum builds up. At the Saskatoon fababean site, the Aphanomyces root rot levels were fairly low on pea, but there were higher levels of Fusarium colonization on the roots. On fababean, Aphanomyces colonization was very low, and it isn’t as favourable of a host to Fusarium species either.
For chickpea, we saw very low root rot at Taber and Swift Current with Aphanomyces or Fusarium. At Taber, Aphanomyces colonization is higher on pea than chickpea, but Fusarium levels are much higher on pea. At this stage in the research, it appears that soybean and fababean could be good pulse crop options for managing Aphanomyces, and we’re still waiting to see if chickpeas might be a good option as well.
Differences in crop and variety reaction to Fusarium spp.
We also did some pathogenicity tests with F. solani and F. avenaceum on soybeans, fababeans, chickpea, red lentils, and Meadow pea. The first thing to note is that soybean, CDC Consul chickpea, and red lentil HAD pretty good emergence, even in the presence of F. solani. The disease severities for these were also all fairly low. The other chickpea varieties, Cory and Leader, and Snowbird fababean had lower emergence levels. Interestingly, CDC Orion did not even emerge when F. solani was present. Clearly, with chickpeas and fababean, a seed treatment should be used.
With F. avenaceum, there was a similar story. The soybeans had very good emergence with very little disease severity. The fababeans had poor emergence and fairly high disease severity, but it’s interesting that we see this in the greenhouse, but not out in the field. Chickpeas and red lentils also had poorer emergence but the green lentil variety Impower had good emergence and low disease severity. This shows the complications of all these different pathogens and how they work together and the importance of seed treatments for targeting Fusarium species.
Brassica cover crops have been shown to have great biofumigation potential in the greenhouse, except for canola because the biofumigants have been bred out. Biofumigation is not like a seed treatment where it only works for four weeks. The cover crop could reduce oo-
spore levels and bring that threshold down. In our field trials, we are looking at mustards and some other Brassica crops. Originally we tried two years of shoulder season cover crops planted after harvest in late summer/early fall. But the weather was either very dry or it snowed in September so we didn’t achieve a very competitive cover crop. As a result, the whole project was revamped and we’re looking at a full season cover crop to see if it works, and then we’ll figure out how to fit it into a cropping system. The cover crops being investigated are oats, rye, two mustards, fababean, clover and five different blends of Brassica crops that include mustards, tillage radish, Dwarf Essex rape, forage collards, forage rape, turnip rape and forage kale.
The cover crops are terminated as green manure with a flail mower. The biomass is removed, weighed and put back on the field, where one-half of the plot is tilled. Pea will be seeded into this cover crop footprint in 2020 and differences in root disease will be assessed. We are also trying to quantify the oospore numbers in the soil before and after cover crops, with and without tillage. Then we’ll repeat it so we have two years of data.
Another research project is looking at using legumes in a cover crop mix since this is becoming more popular with farmers. We planted vetches, clovers, lupins and peas in the field, and tested them for presence of Aphanomyces and disease severity. The vetches were very susceptible to Aphanomyces. Some clovers (Crimson, Yellow blossom, Persian) didn’t get a lot of disease, but they can support Aphanomyces. Other clovers (White Dutch, Red, Subterranean, Berseem) didn’t get the disease at all, and they didn’t support Aphanomyces colonization. Lupins didn’t support Aphanomyces either.
Liming is a potential tool because calcium is very important in preventing oospores from germinating into zoospores. It’s very widely used in the U.S. in sugar beets to manage Aphanomyces root rot. Here, it might have potential for sugar beets or in systems where tillage can incorporate the lime. Liming may also have an impact for about five years, and it can help prevent clubroot of canola.
We did a greenhouse trial with soil from our Taber site and mixed different lime products at four different rates. Hydrated lime reduced disease severity with decreasing severity as the rate increased. Quick lime and ZeroG lime weren’t as effective, so there may be differences in the calcium availability of the products.
There was also an increase in root weight as the hydrated lime rate increased. Quick lime had some increase in root weight with increasing lime rates, but ZeroG did not have a significant increase. Our next step is to try and take this out into field trials and see if we have the same results as in the greenhouse.


Multiple modes, multiple rates and multiple species. Which combination is a winner?
Presented by Sheri Strydhorst, Alberta Agriculture and Forestry, at the Top Crop Manager Plant Health Summit, Feb 25-26, 2020, Saskatoon.
I’m going to focus my information on plant growth regulator (PGR) options, and mostly on gibberellin biosynthesis inhibitors. Gibberellin is a type of plant hormone that makes plants taller and skinnier. Gibberellin biosynthesis inhibitors prevent this taller growth. The only gibberellin biosynthesis inhibitor registered in Canada has the active ingredient chlormequat chloride (CCC) with the tradename Manipulator, and at this point, only on wheat. It was registered for use by PMRA in 2015, but it wasn’t until April 2018 that the EPA in the U.S. approved a maximum residue level (MRL) for CCC. Manipulator is registered in all of Europe, Australia and most wheat-producing countries.
Another gibberellin biosynthesis inhibitor is trinexepac-ethyl (TXP) under the trade name Moddus from Syngenta. It’s registered for use in many countries, and there are MRLs in place in the European Union, the U.S., and Japan. It was submitted to PMRA for registration in 2017, but it is not yet registered in Canada. A registration decision may be provided later in 2020 for hopeful product use in 2021.
Another PGR with a very different mode of action, Ethrel, is registered in Canada. It increases ethylene production and staging is incredibly particular or crop losses can occur. Bayer makes you sign a waiver before you use it. Application timing is when most of the tillers are between early flag leaf emergence to swollen-boot stage (Zadoks stage 37 to 45).
Growth stage 37 is when the flag leaf is fully emerged but really tightly rolled. Growth stage 39 is when the flag leaf has unfolded, and is when you want to target application. At growth stage 45, which is late boot, you can see the swollen sheath where the head is pushing out of side of the sheath. Growth stage 49 has the first awns visible. The label on Ethrel says, “Do not apply Ethrel after 10 per cent of the awns have emerged.” If you count 10 plants and two of them have awns emerged, this window is closed. The label of Ethrel also states that “Correct timing is critical for successful results and to ensure crop safety.” If this product is new to you, be scared of it.
Research has documented some of the risks of PGRs. PGRs will not eliminate lodging in highly susceptible crops but may delay the onset of lodging. If lodging was originally going to happen at the end of July, you might delay it until mid-August, which could be beneficial.
When to apply GA inhibitors? Best is a single application at GS 30-32
The label of Manipulator states that you can apply Manipulator anywhere between growth stage 12 and 39. So, that’s the two-leaf to the flag leaf stage, but if you want to be really effective with Manipulator, you want a single application between growth stages 30 to 32. Growth stage 30 is the beginning of stem elongation. To determine these growth stages, you need to pull out plants, and split the base of the stem open. What you’re looking for is one centimetre (cm) of growth between the basal node and the first node. That’s the sweet spot for spraying Manipulator or Moddus. The end of the sweet spot is growth stage 32, defined when node two is at least two cm above node one.
In the absence of lodging, research has found variable effects on yield – sometimes a yield increase, sometimes a yield decrease, and sometimes no impact.
PGRs can also affect other hormones in the plant, and result in developmental and physiological changes. Green colour of the foliage can be intensified, and this can result in slower maturity.
The optimum temperature for gibberellin biosynthesis inhibitors is around 5 C, but it’s very possible to have a 3 C morning in early June when you’re out there spraying. That is not the optimum temperature for PGR application.
Height reductions may also be only short-term. Two weeks after a PGR application, we can see beautiful height reductions, but by the end of the season, it can be surprising that it is the same height. Sometimes the crop is taller and sometimes it’s only a centimetre shorter. We’ve seen a lot of inconsistency.
PGRs can also result in the production of late, unproductive tillers. Those may not make it to maturity and are going to cause harvest headaches. Reduced grain weight has also been very frequently documented.
PGRs should also be used with caution under environmental stresses. The label for Ethrel states, “Do not use under drought,
excessive moisture, or excessive heat.” The Manipulator label says, “Don’t use under waterlogging, drought, or nutrient deficiencies. In hot, dry weather a better result may be obtained from application in the early morning or evening.”
We’ve done a number of field trials, and have seen yield reductions, mainly when soil moisture content is 10 per cent or less, or when the humidity is quite low at less than 50 per cent. I think in these situations where you have hot, dry conditions at the beginning of June, Mother Nature is going to be your PGR because if you have drought, you don’t need a PGR.
I really like this quote by Wilhelm Rademacher in regards to his research on PGRs that, “The risk of lodging is strongly affected by variety and husbandry factors including sowing date, seed rate, drilling depth and rate of nitrogen application.”
A fairly old study in Indiana in 1988 looked at PGR application
improve standability.
Conversely, AAC Redwater lodged 67 per cent of the time but Manipulator did not significantly improve standability. Based on this data set, I wouldn’t necessarily recommend applying a PGR on AAC Redwater.
We looked at six different CPS varieties. AAC Crossfield, AAC Foray VB and SY Rowyn lodged fairly frequently and PGRs helped with standability. With AAC Crossfield though, the PGR only helped out 50 per cent of the time. AAC Penhold though did not lodge at all. It’s a variety that has some really good genetic standability, so we didn’t need a PGR on that variety, based on our research trials.
In terms of the take-home message for the interaction between cultivars and PGR response, for CWRS we’re fairly confident that AAC Brandon, AAC Elie, and Thorsby would be a good choice for varieties to use Manipulator on. These are the most responsive varieties but you won’t see a benefit 100 per cent of the time.
In the CPS class, AAC Foray and SY Rowyn would be the variet-ability, and AAC Crossfield, in the Alberta environment at least, we get fairly severe lodging but only a 50-50 chance that a PGR would actually help. I do want to put the caveat out there that not all cultivars have been tested, and different cultivars will respond differently in different environments in Western Canada. So, it is


stood beautifully with or without PGRs. The message is that nothing is textbook with lodging and PGRs. We can’t necessarily have a nice set of rules and just apply them directly.
In the Alberta research, we looked at 11 different CWRS wheat variety responses to Manipulator over one to two years. Three varieties, AAC Brandon, AAC Elie and Thorsby tended to lodge frequently, but also responded to PGRs. AAC Brandon lodged 83 per cent of the time, and Manipulator made it stand better 80 per cent of the time. AAC Elie lodged 100 per cent of the time, and 100 per cent of the time Manipulator made it stand better. Thorsby lodged 100 per cent of the time, and 100 per cent of the time a PGR did
Barley certainly is a crop that has standability issues, but at present, no PGRs are registered on barley. [Editor’s note: Manipulator was approved for use on barley in May 2020.] Ethrel was registered but

Our research on CDC Meredith barley showed a little bit of heightcation produced a beautiful height reduction, and it carried on quite nicely throughout the growing season. Manipulator doesn’t seem to be the right product on barley. Moddus looks good, but a higher rate than what is recommended in wheat is required on barley.
Cultivar-specific responses also complicate PGR use in barley. A 1977 study in Ontario looked at the response of 53 different barley cultivars to chlormequat chloride (the active ingredient in Manipulator). Thirty-three had a height reduction, five had no height reduction, and 15 varieties were taller. What works on one cultivar isn’t necessarily going to apply to others.
Research by Laurel Thompson at Lakeland College looked at how CDC Austenson feed barley, and CDC Copeland, AAC Synergy, and CDC Bow malt barleys responded to Moddus application.
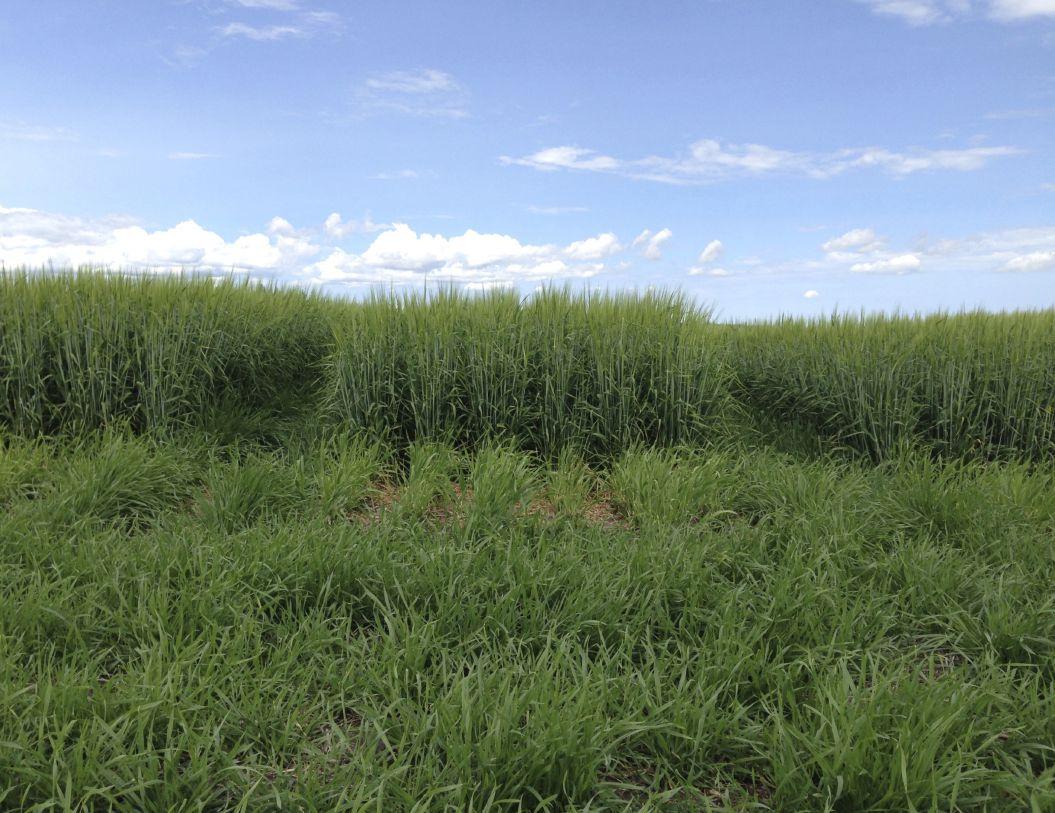
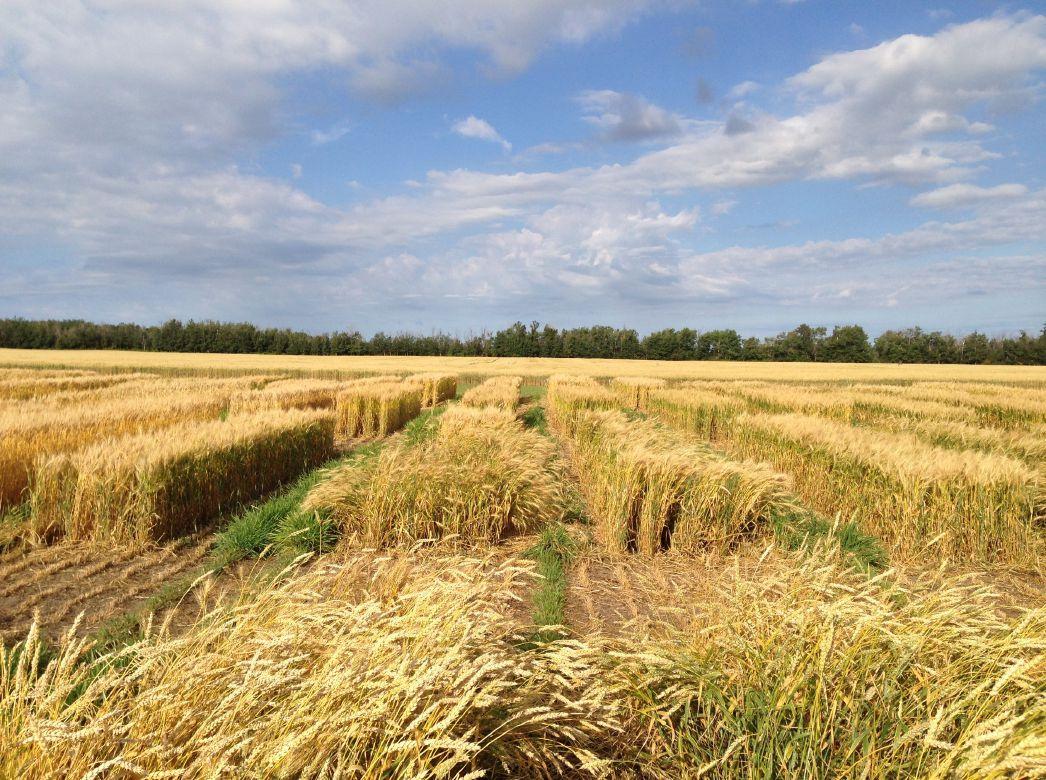
Trinexapac-ethyl (left), Manipulator (centre) and no PGR (right), on CDC Meredith barley at Barrhead, July 5, 2016 – 22 days after PGR application. PGR was applied June 13 at BBCH 31-32.
With CDC Austenson (good lodging resistance) at Barrhead in 2019, lodging was just as bad with or without a PGR. This is a great example where a PGR will not prevent lodging in all conditions when you have that perfect storm for lodging with high fertility, a cultivar that tends to fall over, and favourable growing conditions.
On barley, the take-home messages are that to date, no PGRs are registered and a higher rate of Moddus will be required. I want to highlight that when you have a variety like Amisk barley with really good standability, you don’t need a PGR. The magic bullet to prevent lodging is to use cultivars that have great genetic standability rather than depending upon a PGR.
Oat and PGRs
We’ve done a little bit of work on oats, although PGRs are not currently registered. [Editor’s note: Manipulator was approved for use on oats in May 2020.] With Manipulator, we saw an eight per cent height reduction, a 13 per cent height reduction with Moddus, and when we tank mix the two actives we get a 25 per cent height reduction. We did a little bit of work on different oat cultivars: AC Morgan, CDC Norseman, ORe5342M, OT3085, Summit, and Triactor. Five cultivars had height reductions, four cultivars had improved standability, four had reduced bushel weight, and three had improved yield. Again, this cross-species trend of “not all cultivars respond the same” is an important message.
On field pea, we looked at Ethrel, Manipulator, and Moddus. There
were very small, very inconsistent results. We also found that under dry conditions and peas under stress, our pea yields were cut in half.
A very common trend in Europe is to tank mix Manipulator and Moddus for improved performance. Manipulator works earlier in the gibberellin biosynthesis pathway and Moddus later. A tank mix can improve performance and consistency, however this option is not registered in Canada. In our research on wheat, the frequency of height reduction with Manipulator alone was 67 per cent, Moddus alone was 22 per cent, and tank-mixed together was 78 per cent of the time.
We also tended to get larger height reductions with the tank mix. Again, there were differences in standability response between cultivars where Manipulator worked quite well by itself on AAC Viewfield, AAC Wheatland VB, CDC Landmark VB, and Stettler, and the tank-mix (which is not yet registered) worked better on AAC Brandon, CDC Plentiful, AAC Foray VB, and AAC Goodwin.
In summary, we need to remember that PGRs will not eliminate lodging in highly susceptible crops. For wheat, Manipulator seems like the best options and is the only product currently registered. It works fairly well on AAC Brandon, AAC Elie, Thorsby, AAC Foray VB, and SY Rowyn. In other crops, no PGR is currently registered. Our barley research found Moddus is the PGR of choice, but we need to use a higher rate than the wheat rate. On oats, Moddus or Manipulator may be good choices. On peas, just don’t spray PGRs on them because there’s more risk than gain.

Evaluating different varieties, nitrogen rates, sources and timing.
Presented
by
Amy Mangin,
University of Manitoba, at the Top Crop Manager Plant Health Summit, Feb 25-26, 2020, Saskatoon.
My overall project is called “Agronomic Strategies to Minimize Lodging Risk While Maximizing Yield and Protein Content in Spring Wheat” and it was done for my PhD thesis. I looked at different varieties, different nitrogen rates, sources, and timings, as well as seeding rates and plant growth regulator applications. Today, I’m going to focus on the plant growth regulator treatments that were within these trials, which ran in 2018 and 2019 at Carman and Manitou, Man. In these trials, Manipulator was applied at the single application rate of 0.7 litres per hectare and compared to an untreated control. Application was at growth stage 31-32, and this typically fell around the second week in June.
The overall project looked at three main objectives: how agronomic management treatments affected yield components, nitrogen dynamics, and lodging risk of spring wheat. Over the two years, our sites fell well below the long-term average growing season precipitation from May 1 to September 1. The 2019 site years had the lowest growing season precipitation of the two years, and also came off of a dry fall from 2018. That led to lower than normal yield potential at those sites and also low lodging pressure.
Overall, we saw significant yield increases with Manipulator in two of four site years at Carman and Manitou in 2018 at around two to five bushels per acre. Yield at Carman 2018 with Manipulator was about 85 bushels per acre and about 75 bushels per acre at Manitou 2018.
the four sites – the two 2018 sites, as well as Manitou in 2019. The increase was likely a combination of increased spikes per acre and also increased kernels per spike (decreased floret abortion). We probably saw resources being reallocated and repartitioned from stem growth towards the developing head at that time.
We saw a decrease in kernel weight at every one of our sites, regardless of the yield response to Manipulator. The decrease in kernel weight was likely due to the increase in demand for resources across more kernels in these dry years. The grain fill period was shorter and with more kernels to fill, the plants actually didn’t have time to fill the kernels – resulting in lower grain weight.
When I say “nitrogen dynamics,” I mean dynamics within the plant –when is the nitrogen taken up, where the nitrogen is within the plant, and how it is moving to form final grain nitrogen (protein) content. In spring wheat, about 60 to 90 per cent of nitrogen is taken up by anthesis and stored as vegetative tissue of stems, leaves and chaff. After anthesis during the grain fill period, some of that nitrogen is remobilized and moved into the head, to make up grain protein content. Looking more in depth at stem tissue, research has classified that 60 per cent of the nitrogen in stem tissue was from reserve pool nitrogen. It didn’t actually serve other functions in the plant, such as structural, metabolic, or transportation functions.
We looked at how some of our agronomic management practices influenced this relationship of when the plant took up nitrogen and how it moved within the plant. We separated the plants into stems, heads, and leaves, analyzed them for nitrogen content, and assessed the movement from anthesis to maturity.
Overall, grain protein content was high across these four sites because of the dry growing seasons, ranging from about 13.9 per cent to about 14.2 per cent in the untreated plots. With Manipulator application we saw a decrease in grain protein content regardless of a yield increase. That decrease couldn’t just be attributed a dilution effect from nitrogen being spread over more yield. We saw some of the largest protein decreases at sites that we didn’t have a yield increase.
Spring wheat yield is typically made up of three main components: spikes (plants and tillers) per acre, kernels per spike (spikelets per spike and kernels per spikelet) and kernel weight. Looking at the three main yield components helps to unwrap why or how these yield increases came about. Spike density was counted around flowering time to soft dough. There was a spike density increase only at the Carman 2018 site with Manipulator. This increase in spike density was likely due to increased tiller survival rather than an increase in tiller production. There was an increase in kernel number per acre at three out of
In the untreated plots, we found about 70 per cent of the nitrogen was taken up by anthesis, which is similar to some of the background literature. But the Manipulator application significantly decreased the amount of nitrogen that was taken up in that pre-anthesis period. But by maturity, nitrogen uptake was similar between untreated and treated, so the total nitrogen uptake for the entire season was very similar.
There was a significant reduction in stem nitrogen content. As you would expect, shorter stems mean there is less stem tissue to store nitrogen. There was a similar trend in the leaves and the heads, but it wasn’t significant. At maturity, the majority of the nitrogen had moved to the head tissue, and there were no differences between nitrogen content in any of the plant parts at maturity between treated and untreated plots.
There was a significant decrease in the amount of nitrogen remobilized from stem tissue to the head with a Manipulator application. This could potentially explain some of the differences in protein content, because there is less nitrogen being moved up into the grain. There was a similar trend with leaf tissue, but it wasn’t significant. Overall, around 70 per cent of the stem tissue nitrogen was remobilized across treatments, and around 80 per cent of leaf tissue nitrogen was remobilized.
The two field seasons weren’t great years for lodging because of the dry conditions but I did get lodging ratings for Manitou in 2019. There were a couple heavy rainfall events later in the season when lodging occurred. When lodging occurred, there was an interaction with nitrogen management as well as plant density. When over 140 pounds of nitrogen per acre was applied, there was a decrease in lodging with Manipulator application. And with medium (25 plants per square foot) to high (35 plants per square foot) plant densities, lodging was occurring, and Manipulator was reducing that lodging.
When I tested at anthesis – right after the plant has gone through that rapid stem elongation phase – there was an increase in stalk strength when Manipulator was applied. But when I tested at maturity, there was no difference in terms of stalk strength. So, depending on when you have high lodging pressure conditions, the increase in stalk strength with Manipulator might have been beneficial.
There was a reduced canopy height with Manipulator application at all sites across all varieties. I did see a magnitude interaction between site year and PGR, and cultivar and PGR. This means that the degree of the height reduction was different across the different sites and across the different varieties. For example, AAC Cameron had a greater height reduction than Prosper. Overall the height reduction was about two inches (five centimetres) when measured at soft dough stage. If I had measured at anthesis, I probably would’ve seen a little bit bigger height decreases.
We looked at internode length measured from the second basal internode two weeks after application. We chose that internode because that’s likely one of the internodes where you’re going to see breaking that causes stem lodging. Manipulator did decrease the length of that internode. We also measured the diameter of the stem thinking that if the internode was smaller, we might have thicker stems. There was no difference between treated and untreated in terms of stem diameter with Manipulator.
We also looked at structural root plate – the area of the root core that has thickened, lignified roots. Research has indicated that the area with those thick, lignified roots is really what is providing anchored strength in your wheat crop. It’s not necessarily the amount of total roots, but the spread as well as the depth of that structural root plate.
We dug up, washed and measured a whole lot of roots. At Carman 2018, there was a significant increase in root plate spread with Manipulator, which is something that hadn’t been documented before so we weren’t expecting that. We also saw that root plate depth was increased at three out of the four site years with Manipulator application. Potentially, the resources that were used previously for stem elongation are now being reallocated to root growth and increasing that structural root plate. This means there may be increased anchored strength as well as stem strength with some of these Manipulator applications.
We also look at stem composition by measuring lignin and cellulose, which are thought to have a really good relationship with lodging potential. For lignin, there were no differences between treated and untreated. There was a significant decrease in cellulose content with Manipulator application. We’re still kind of looking into more reasons why we might have been seeing this.
We also looked at stalk strength as a proxy for lodging because in small plots, it’s not always likely that you’re going to have lodging or differential lodging within each treatment. We used a tool to measure stalk strength. Resistance force was measured as the crop was pushed from vertical to 45 degrees from vertical. This was done at anthesis and maturity to see if we could see differences between our treatments.
In summary, grain yield increase happened 50 per cent of the time at two of four sites, but it was at the higher yield potential sites, and the yield increase was only three to five bushels an acre averaged across all of my treatments. That yield increase occurred from increased kernels per acre because we did actually see a decrease in the kernel weight across all sites. So, we saw more kernels, but they were lighter. Grain protein content was decreased at all sites with the treated plots. Stem nitrogen content at anthesis was reduced with the Manipulator application, and that led to reduced stem remobilization of nitrogen. There was a reduced lodging risk with Manipulator application in the high-risk situation of high nitrogen fertility and high seeding rates. Decreased canopy height reduced our plant and stem leverage. We had increased anchored strength at three out of four sites, and we didn’t actually see any differences in structural composition with Manipulator application.
Breaking down the big players in the world of beneficial insects.
Presented by Tyler Wist, Agriculture and Agri-Food Canada, at the Top Crop Manager Plant Health Summit, Feb 25-26, 2020, Saskatoon.
First, let’s define what a “beneficial” is. If it’s an insect helping me, it’s a “beneficial insect.” The beneficials that I’ll discuss here provide biological control, and are further defined as predators and parasitoids.
Western Grains Research Foundation has funded the Field Heroes project. This is a campaign championing beneficial insects. What I’m going to do today is teach you guys what a beneficial insect looks like and what they’re doing in your field, and maybe that will make you more apt to protect them. What Field Heroes is trying to do is to take away that “nothing to lose by spraying” mindset. If you are on Twitter, you can follow Field Heroes, @FieldHeroes and you can find it on the web at www.fieldheroes.ca.
No talk on beneficial insects is complete without talking about – I call it “#AAFCbugbook,” because this name is super-long to say – “Field Crop and Forage Pests and their Natural Enemies in Western Canada.” It’s available in print or you can download it from the Prairie Pest Network Monitoring Blog.
The Prairie Pest Monitoring Blog is a great way to get information on insect pests and beneficials and you should all sign up to receive emails. It’s run out of Agriculture and Agri-Food Canada and includes input from the provincial ministries of ag, but it’s been funded for the last 20 years by pretty much all the grower groups through checkoffs, and so thank you to them for funding this service to agriculture.
I’m working on wheat midge, and this is one of the “big bads” in wheat. It’s been kind of suppressed for the last little while, but if you get $130 million in yield losses like we did in the 1990s, that’s why you know it’s a “big bad.”
Ag Canada has thrown a lot of research at it. Back when the wheat midge first reared its ugly orange head, they had six or seven full-time research scientists working on this problem. At the same time, we had over 500,000 acres sprayed and we still got crop losses. Ian Wise and Marge Smith, two of the scientists who were working on this, called this “the most serious insect pest of spring wheat in Western Canada.”
Let’s define what is a parasitoid. This is a parasite that kills its host. A good parasite doesn’t kill its host, but a parasitoid does. Wheat midge has a parasitoid, Macroglenes penetrans. It is little, it
is black, and it goes after eggs and first-instar larvae of the wheat midge. This one stays inside the wheat midge larva and it doesn’t kill the wheat midge until the following year. Wheat midge overwinters as a third instar in a cocoon and when it is time to emerge in the late spring, instead of getting a wheat midge you’ll get one of these Macroglenes penetrans wasps coming out of the soil. They can reduce about 40 per cent of your overwintering population of wheat midge.
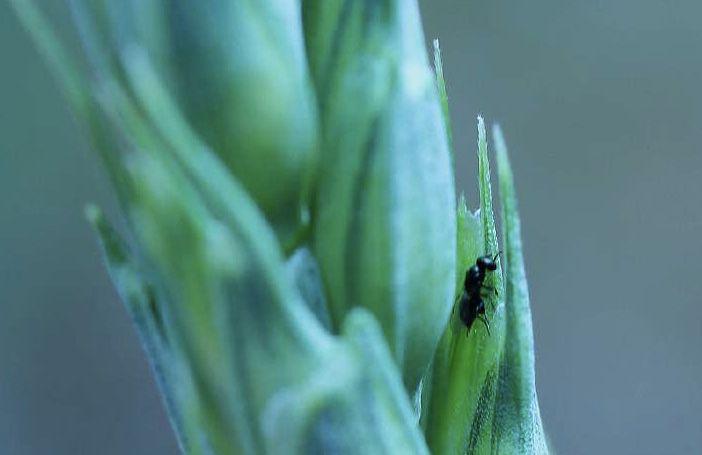
Macroglenes penetrans is why you don’t want to spray about a week after wheat midge has come out. If you’re a little bit late, go to your field, take a sweep net, and you can find these little black specks running around against the white background of the net– during the daytime you’ll see them searching on wheat heads as well. And remember that last year’s wheat field is probably this year’s canola field, so it’s another reason to stay out of flowering canola with your sprayer full of insecticide – because you might be wiping out Macroglenes as you’re spraying your canola. They will come out in last year’s wheat field, nectar in the canola, and then will move into wheat to go after wheat midge for you. Up in the Peace River Region, we started studying this, and we actually had fields with pretty much 100 per cent parasitism by this parasitoid on wheat midge.
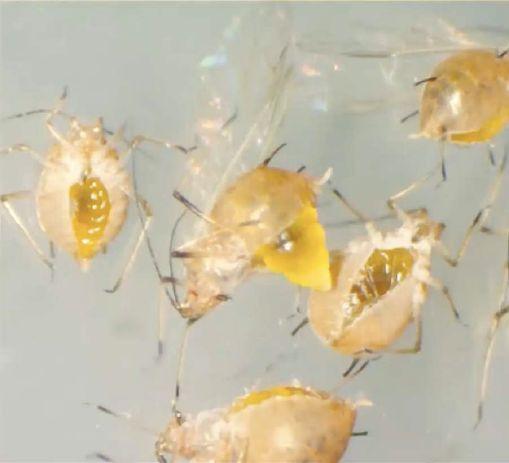
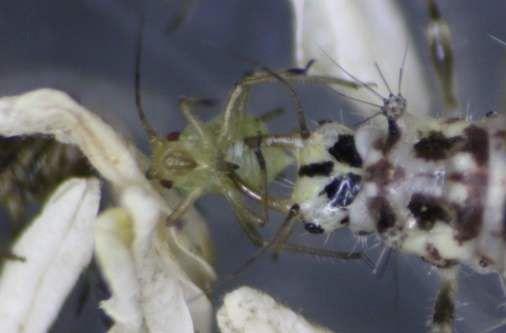
I can never step away from talking about cereal aphids. Aphids are literally born pregnant, and they’re all female, so there’s no egg period. They just drop out and they tap into the phloem and they
start feeding, so your aphid populations can increase exponentially unless you’ve got a beneficial insect that acts on them. An aphid can produce two to seven live clones per day, and about 60 in her lifetime. And within about seven or eight days, those babies can start having their own babies.
We have three cereal aphids to worry about. The English grain aphid, the greenbug, and the bird cherry-oat aphid. They can cause honeydew issues. They basically poop sticky sugar, which can get mouldy and cause problems for the crop. They can also transmit viruses like barley yellow dwarf virus. And they of course they suck on the phloem and affect yield directly that way.
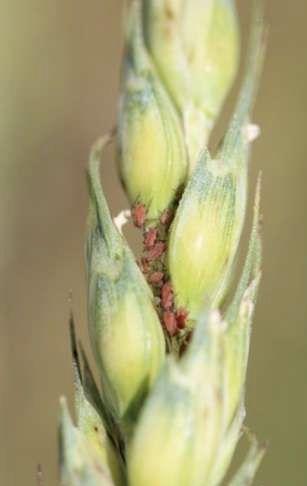
Our economic threshold for cereal aphids is 12 to 15 aphids per head, but that’s an average. If you have one head with 60 and you have 20 heads with zero, you are not at your threshold yet. You need to get out there and count 50 to 100 heads per field, and then take the average.
Originally, we used a conventional action threshold where if we get to that economic threshold of 12 to 15 per head you would spray. Now we are using a dynamic action threshold that takes the beneficial insects in the field into account. It uses an equation that predicts the number of aphids eaten by these beneficials. We have an app for that, the Cereal Aphid Manager app. This is free on the Apple and Android systems, and we released it in March 2018. This was a big project of mine.
I’ve been working on pea aphids lately. We have a good economic threshold for peas at nine to 12 per sweep at flowering. But lentils is a nominal threshold. “Nominal” means “anyone’s best guess” and is 30 to 40 per sweep. So we are working on a threshold for lentils. Until we started working on it, science had absolutely no idea what pea aphids were doing to fababean. No one had done any research on it before.
In conjunction with Sean Prager at the University of Saskatchewan and Ningxing Zhou, a master’s candidate, we are looking at improved management of pea aphids in Saskatchewan pulse crops.
In this research, we are actually counting individual lentil plants. My summer student Haroon Andkhoie doesn’t hate me yet, but I’ve been getting him to count aphids on individual plants. Another summer student figured out that one cup holds 38,000 pea aphids. There is an actual economic threshold down in the United States where they use quarter cups, half cups, and full cups of aphids, so I wanted to know how may aphids they actually had.
Our research on fababean is looking at a cumulative aphid density. That is the number of aphids on the plant and how long they’re on that plant for. At our first density fairly early on, we would reach that density and then spray. By our third, fourth, fifth density the aphids had overwhelmed the plants and we had huge yield losses. There were no pods on density 4. I think that the lack of pods in fababean was due to the aphids just stressing the plants out and they aborted their flowers.
Lentil research was basically the same as fababean. With insecticidal treatments at our first two densities, we get some yield, but no
yield at the three later densities. So what we need to do in the future is look more at thresholds in the early spray timing and completely forget about those really high aphid densities later on, because obviously lentils and fababean cannot handle really high populations –they have to be sprayed earlier. Crop staging is likely a major factor.
Aphids have parasitoids, too. The larva develop inside an aphid and create dead aphid mummies that are stuck to plants. These are great visual cues to say, “Hey, you’ve got parasitoids active in your field.” Aphidius spp. create brown mummies and Aphelinus spp. create flat black ones. After the parasitoid lays an egg in the aphid, about 10 days later you get these aphid mummies and then five days after that parasitoid wasps emerge. These wasps attack other cereal aphids and start the cycle over again.
For pea aphids, there is also a different genus of parasitoids, the Praon. Instead of staying inside the mummy, the larva crawls out underneath the aphid and it pupates underneath this now-empty aphid-mummy.
Not all wasps are “beneficial.” Pteromalus venustus is a little wasp that is not beneficial because it goes after alfalfa leafcutter bees. Another parasitoid, Dinocampus coccinellae attacks ladybeetles. This wasp lays an egg into the ladybeetle, and also leaves behind a virus that becomes active as soon as its offspring is ready to crawl out. It paralyzes the ladybeetle when the larva crawls out from underneath it’s wings, and then it pupates between the legs of the ladybeetle as the ladybeetle gently hug its parasitoid that has just crawled out of it.
Dinocampus coccinellae are all female. They can emerge from a ladybeetle and lay an egg right back into that ladybeetle. The ladybeetle is alive and still kicking, but still paralyzed.
There are other wasps that we don’t like and they are called a “hyper-parasitoid.” They will lay an egg into a parasitoid that’s inside the mummy. So we’ve got wasps that attack the wasp inside the aphid, and these guys are not our friends. Dendrocerus bicolor and Asaphes suspensus are two hyperparasitoids that are not beneficial.
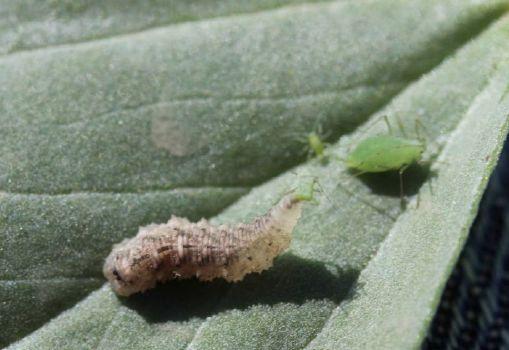
Predators eat other insects. The hoverfly larva is “aphidophagous” and that means, “I eat aphids.” That’s basically all the hoverfly larva does. They’ll take out about 12 aphids a day.
Also associated with pea aphids is the soft-winged flower beetle (Collops). They look like a cereal leaf beetle, so you have to look at the different patternings and what they’re doing. When you see this beetle associated with pea aphids in a pea crop, it’s probably not a cereal leaf beetle because it’s in a pea crop. These soft-winged flower beetles can eat about 54 pea aphids a day.
We’re also finding soft-winged flower beetles associated with Peritrechus convivus. Back in 2017, we just called this “the Twitter mystery red bug.” We had it identified by experts in Ottawa and we identified it by genetic barcoding, and the name of the genus is “dirt-coloured seed bug.” The nymphs are red while the adults are actually coloured like dirt. This insect has been bringing up more questions than answers. We didn’t have any funding to look more into these questions, so I just went out, looked at a few fields, and brought some to the lab.
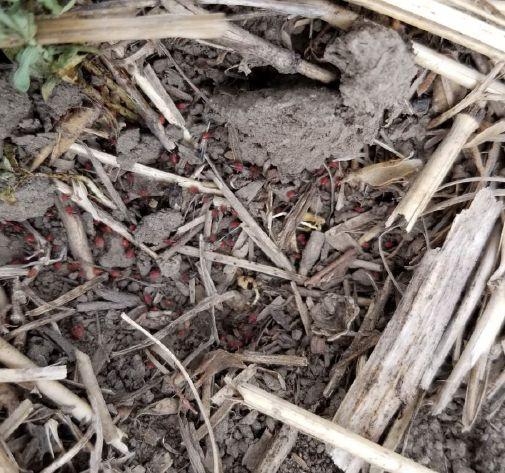
What I can tell you about these red bugs is the literature suggests they like to hang out in the edges of sloughs. During our drought years, we often plant into the sloughs. So there’s a good chance that we’ve planted crops right into those slough edges, and now we’re seeding in their territory.
This is one of those insects that we just don’t know when it’s going to become a pest and why it’s becoming a pest. I’ve seen
them go after flax, canola, and soybean – whatever is there. After it rained though, they stopped feeding on the plants, so it might just be a drought trigger, because there’s nothing else for them to get water from, and that’s why they are feeding on the plants.
Bertha armyworm goes in cycles. Prairie Pest Monitoring Network monitors them with a pheromone trap so that we can let growers and agrologists know if populations are building up. They get attacked by Banchus flavescens, this amazingly big and orange parasitoid. Bertha armyworm also gets attacked by flies that parasitize them.
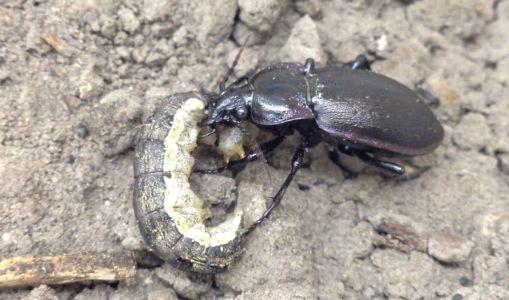
Predatory ground beetles will also attack bertha armyworm. Bertha armyworms, if found on the ground, will get torn apart by ground beetles. Pterostichus melanarius is an introduced ground beetle from Europe, and it, other ground beetles and a few species of rove beetle might also attack bertha armyworm.
Calosoma species, another ground beetle, actually has the common name “caterpillar hunter,” and eats bertha armyworms. If it’s got big eyes that are forward-facing, you know it’s a predator. These guys are excellent predators, and most of our insecticidal sprays will leave the ground that they’re running across toxic to them for about a week afterwards. These ground beetles are kind of the unsung heroes in your field.
Diamondback moth is another pest that blows in, so we also use pheromone monitoring traps. If they come in early, we can have problems on the canola. They get attacked by a lot of different parasitoids though. Diadegma semiclausum is one that lays its eggs inside a diamondback moth larvae.
Ladybeetles also eat diamondback moth larvae. If you have ladybeetle larvae in your field, you want to scout for whatever they’re eating, because mama ladybeetle won’t lay eggs in a field unless there is something for her offspring to eat.
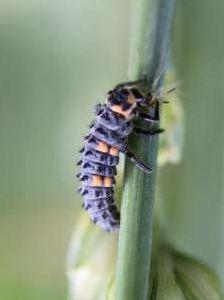
7-spotted ladybeetle larva.
In the dynamic action threshold for cereal aphids, adult ladybeetles are eating about 50 to 80 aphids per day, which is pretty good, and their larvae will eat about 70 per day.
Green lacewings are green and have wings that look like lace. Their larvae are commonly called aphid lions. If you’re sweeping and you find one of the adults in your sweep net, the first clue that you have a green lacewing will be the smell. They
release something that smells really bad, because it doesn’t want you to eat it. In the dynamic action threshold, their larvae will take out about 30 aphids per day, and they leave behind the dried husk of an aphid. Their big mandibles inject a digestive enzyme that liquefies the inside of the aphid, and then it sucks out the digested insides like an aphid milkshake. It takes about 15 minutes or so to eat an aphid. For a cabbage looper, the green lacewing larvae takes about one hour to suck out all the juices.
Another one that uses this piercing and injecting of digestive enzymes is the minute pirate bug. Around Saskatoon, we get Orius tristicolor and in Eastern Canada they have Orius insidiosus It’ll eat about 12 aphids a day, but it will also eat things like diamondback moth eggs.
Damsel bugs are like a little praying mantis, with raptorial front legs. They have a long beak, and they will also inject digestive enzymes.
Spiders are also predators, although they aren’t ‘insects’ because they have eight legs.
Some spiders build webs in your fields, and others run around on the ground eating insects. Their impact is kind of understudied in Canada right now. “Daddy longlegs” or “harvestmen” are not quite spiders but have these huge fangs that they use to capture their prey.
Wheat head armyworm has started to show up. You often don’t know that you have a problem in your field until you go to swath it, and you see a mess of them on your cutter bar.
This insect will attack barley and wheat. One can take out an entire wheat head in one day. It has two generations in one year. If parasitoids don’t take out the first generation, you can get a buildup into the second generation that continues the damage.
We don’t usually have too much in the way of issues, though, because it’s got a pretty good parasitoid, a Cotesia species. You may see the pupae of Cotesia in white clusters on the awns of the heads of cereal crops. The wasp lays an egg in the wheat head armyworm and the egg splits multiple times before each cloned egg hatches inside the armyworm. The genetically identical female Cotesia larva all emerge at the same time from the one egg that has split inside the caterpillar. As soon as they come out, they start making their cocoons and you get these Cotesia clusters in the field.
The two main flea beetles that are attacking canola are the crucifer and the striped that is moving down from the north. When you’re scouting, you want to look for 25 per cent damage – that is the action threshold. If it’s a hot day, by the afternoon that plant can be at 50 per cent damage, which is where we see yield losses in canola. We have two generations of flea beetles, so you’re going to see them coming back into the field in the fall for the “overwintering generation.” Conventional wisdom used to be to plant early to escape flea beetles because the crucifer didn’t peak until mid- to late-June. But the striped flea beetle peaks before the crucifer flea beetle. So now we have a longer period of flea beetle feeding from mid- to late-May through late June.
I’ve had the question of whether there were just more flea beetles in 2019. I compared the number of flea beetles collected on sticky cards in my plots at Saskatoon in 2018 to 2019. The answer was yes, there were a lot more in 2019. If we look back 10 years ago, they would have been mainly crucifer, but the striped has really been taking over recently. The second generation will come back in the fall, and they’ll feed on anything that’s green. If it’s nothing but pods, they will feed on pods, and they can cause debarking, and this can lead to pod shatter. But none of the research has indicated that this is economical damage at this point in time.
Microctonus vittatae parasitizes flea beetles, but unfortunately this parasitoid doesn’t do a really great job. It has only 2.5 to 5 per cent parasitism rate, which is not enough to control populations.
A well-fed crop is a strong crop.
Presented by Jeff Schoenau, College of Agriculture and Bioresources, University of Saskatchewan at the Top Crop Manager Plant Health Summit, Feb 25-26, 2020, Saskatoon.
We think a lot about yield, but another important part of crop production is the influence that plant nutrition has on crop quality and health. And that transcends to human health as well. Soil health affects plant health, and that ultimately affects human health.
A basic premise of plant health is that a well-nourished crop with the balance of essential macro and micro nutrients really provides the best yield, and also the best ability to fend off foes, whether it’s diseases or maybe even insects. We can probably sum it all up into a single short statement: “a well-fed crop is a strong crop.”
The first key principle of plant health from a nutritional standpoint is concentration of nutrients in plant material. Concentration may be linked to nutrient density. I like to think of nutrientdense foods defined as a food that is rich in minerals, vitamins, and other components that are desired for human health.
To increase the nutritional value of foods requires an understanding of those factors that affect the concentrations that are found in the plant. The most important is genetics. For example, canola has a high requirement for sulphur because of the sulphur containing compounds that are involved in the physiology of those Brassicae crops. So, genetics is important.
Anybody that does crop scouting and takes tissue samples is certainly aware of the importance of the effect of plant part and age on nutrient concentrations in a plant. For example, annual crops take up most of the nutrients they need early on in their life cycle, but as they grow and photosynthesize and fix carbon, that concentration decreases.
Environment is very important. For example, nutrient concentration might be higher if something shuts down plant growth, so that nutrient isn’t diluted by photosynthetic fixation of carbon and higher yield.
Another consideration is the availability of a nutrient in the soil. Nutrient concentration in plant tissue can be influenced through fertilization. That concentration typically follows an S-shape relationship in soils with very low levels of nutrients. For example, nitrogen concentration in plant tissue may actually decrease initially with fertilization in a very nitrogen-deficient soil. That is called growth dilution. A little bit of nutrient added under a condition of extreme deficiency results in an explosion of plant growth and a production of dry matter such that the concentration may actually decrease initially.
Beyond that, as we increase the nutrient availability, the concentration in plant tissue increases. Finally, depending on the nu-
trient, as we increase nutrient availability further, there may be no further increases in concentration as the plant reduces or ceases uptake. But for some nutrients – for example, nitrogen – as nutrient availability increases further in that soil, the plant continues to take it up beyond the point of maximum yield. There’s no further increase in yield, but the concentration increases, and this is referred to as “luxury uptake.”
In cereals there is a critical level where further increases in nitrogen fertility are not associated with any yield increase but instead the nitrogen is going towards increasing protein content. In spring wheat, that is around 13.5 or 14 per cent.
Typical grain and protein curve in wheat. Adapted from Engel et al.,1999.
A study by Amy Mangin and Don Flaten at the University of Manitoba showed that split applications of nitrogen – for example, 80 pounds (lbs.) of nitrogen per acre at planting, plus 30 to 60 lbs. at stem elongation to flag leaf – bumped protein content up by about half a protein unit. Late supply of nitrogen in a cereal crop will go more towards protein and less towards yield. High yielding spring wheat varieties need high rates of N to optimize both yield and protein.
Sulphur is another important nutrient, and is a building block of two amino acids, cysteine and methionine. Research by Rigas Karamanos showed that wheat grown on soil that is highly deficient in available sulphur may respond to sulphur fertilization and increase protein concentration.
There is also some research that shows that having adequate amounts of sulphur-containing amino acids can also contribute to increased protein quality and improved bread-making quality.
Forages benefit from fertilization. For example, a study conducted by one of my graduate students, Bayartulga Lkhagvasuren, looked at the response of brome grass to nitrogen fertilization. At one of our sites close to Colonsay, Sask., 50 to 60 lbs. of nitrogen per acre added as dribble banded urea ammonium nitrate solution
maximized yield and also produced significant increases in protein content of brome grass. Rates of nitrogen fertilizer added above that continued to increase protein, but there was no further increase in the brome grass yield.
In pulse crops, protein content is generally not highly responsive to nitrogen fertilization. One of my graduate students, Harshini Dona, conducted a field study in south-central Saskatchewan with soybean and lentil and different rates of starter fertilizer. A starter blend of urea and monoammonium phosphate – a 50-50 blend of 11-52-0 and 46-0-0 – was applied at increasing rates of zero, 10, 20 and 30 lbs. N per acre. There was not any increase in protein content with increasing N rates. The reason is that with a legume, the biological nitrogen fixation process will generally compensate for low nitrogen availability when conditions for fixation are good.
Some studies have reported that under phosphorus deficient conditions, starter phosphorus can give a protein boost to pulses, and this is related to the importance of phosphorus in the nitrogen fixation process.
Micronutrients are also important for crop quality. The contents of bioavailable zinc and iron in grains are of special interest. For example, zinc deficiencies in humans are estimated to affect over 30 per cent of the world’s population. There are areas that have quite widespread crop zinc deficiency. One particular area is the Middle East, where human deficiencies of zinc are quite widespread in the population. A high content of bioavailable zinc is desirable in pulses that are exported to countries like Pakistan, India and Bangladesh.
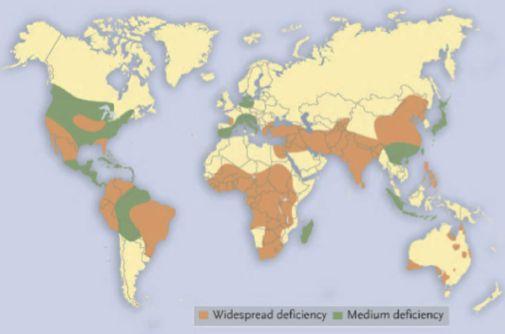
On the Prairies, we’re quite fortunate because our soils, in general, are relatively high in available zinc. As a result, our pulse crops tend to be quite high in zinc content compared to some other parts of the world where the soils are low in available zinc. That gives our pulse crops a bit of an edge when it comes to marketing and selling.
There are several ways to help ensure high zinc content in pulse crops. Work at the Crop Development Centre by Dr. Vandenberg and Dr. Warkentin is looking at ways to increase the content of these important micro-elements in grain through plant breeding efforts.
Fertilization is another potential strategy for improving plant health. Sarah Anderson, as part of her MSc work at the University of Saskatchewan, looked at the effects of zinc fertilization on the phytate:zinc molar ratio and the estimated bioavailable zinc in lentil grain.
Phytate is a major storage form of phosphorus in seeds. It has plant and human health benefits but is also anti-nutritional be -
cause it inhibits absorption of zinc ions within the human intestine if it is too high in concentration. The phytate:zinc molar is the ratio of phytate to zinc. If the ratio is low, that indicates generally higher bioavailability of the zinc content in the grain.
In Sarah’s research, compared to the unfertilized control, fertilization with zinc decreased the phytate:zinc molar ratio, which is a good thing for human bioavailability. It appeared that the chelated form was slightly more effective than the sulphate form in enhancing bioavailability.
Zinc bioavailabitity in lentil fertilized with various forms of Zn
In terms of genetic effects, Sarah looked at three different classes of lentil – Maxim red lentil; Invincible, small green; and Impower, large green lentil at two field sites. At both of the field sites under the same zinc availability status, there was significantly higher concentrations and higher bioavailable zinc in the large green lentil compared to the small green or the red lentil.
Some other work conducted by Noabur Rahman, one of my PhD students, looked at zinc concentration in pea grown on a Brown Chernozem soil that had quite low concentration and supply rate of available zinc. Compared to the unfertilized control, zinc fertilization increased the concentration of zinc in pea seed. The chelated form also produced some of the highest zinc concentrations.
Another question that we addressed in some of our research is how does the addition of phosphorus influence the phytate and the zinc concentrations in grain? As part of the work that Steven Froese did in his thesis work, we looked at the effects of 20 kg of P2O5 per hectare added in different combinations of seed-placed monoammonium phosphate and a mid-season foliar monopotassium phosphate spray to field pea. The treatments include all the phosphorus applied at seeding, three-quarters at seeding and remaining at foliar, a 50:50 split between seeding and foliar, and the entire 20 kg at foliar timing. Each treatment had the same total rate of 20 kg/ha.
There was a trend towards lower phytate concentrations in the seed as the proportion of applied phosphorus at the foliar timing was increased. But as the proportions of foliar P were increased, yield was lower than with seed-placed P. Overall, there was no significant effect on total phytate content between the treatments.
Looking at zinc, there was occasionally slightly higher concentration of zinc in the grain when the phosphorus was applied in the foliar form. This suggests that foliar application may reduce that phytate:zinc molar ratio, but we really didn’t see any large effects, and no effects on the iron concentrations.
Nutrient management can affect the incidence of a plant disease. It can stimulate root and shoot growth, but very high rates of nitrogen can produce a heavy crop canopy with high humidity within that canopy that may favour the spread of certain pathogens. Work done by Randy Kutcher at Melfort showed that very high rates of nitrogen in canola, for example, were associated with increased incidences of blackleg and sclerotinia. With high fertilization rates, attention must be paid to address potential disease issues from a heavy canopy through fungicide application.
The second way that nutrient manipulation can influence plant disease is by changing the physical or biological micro-environment in the soil. A good example is how different fertilizers may affect the pH of the soil. For example, ammonium produces acidity when it’s oxidized to nitrate in the nitrification process, versus nitrate, which is not associated with acidity. Some work conducted on winter wheat in northwestern United States showed some interesting interactions of how ammonium versus nitrate influenced the population of pseudomonas bacteria in the rhizosphere, which is actually an antagonist to root rot disease that was affecting the winter wheat.
Another way that nutrient manipulation can impact plant health and disease is by increasing plant vigour and strength. Some recent research found that the optimum rate of phosphorus fertilizer for field pea is higher when the root system is compromised by Aphanomyces. The crop may be especially challenged in accessing an immobile nutrient, like phosphorus, in the soil under conditions of reduced vigor and root growth. However, it is desirable to try to get rid of the source of the problem rather than using a Band-Aid to try to address it.
The next year peas were grown on the wheat stubble, and were fertilized with zinc. There was a bit of response to zinc, but in many cases, it wasn’t statistically significant. But the interesting thing was that pea yield was significantly higher in the treatments where we had applied copper to the wheat the year before. It had us puzzled. We really couldn’t find evidence that it was a nutritional response, but pondered that perhaps it had something to do with the effect of the copper in reducing disease pressure in the pea. I think this is something that deserves some further attention down the road. Chloride fertilization can also play a role in plant health. Potash (KCl 0-0-60) is the most common source used to meet chloride recommendations on the Prairies. We’ve known for a long time – for example reported in literature in the 1990s south of the border in Montana – of the role that chloride fertilization can play on low-chloride soils in reducing the incidence of leaf diseases and root diseases in cereals. Brian Fowler at the University of Saskatchewan, in his program with winter wheat, also showed some responses of the winter cereals to chloride fertilization in the reduction of leaf spot in winter wheat.
Based on work by Ieuan Evans in Alberta in the 1990s, lower copper fertility was identified to aggravate ergot infections in wheat. A copper deficiency causes the self-pollinating florets to remain open longer, which increases the likelihood of the infection entering into that floret and the ergot body developing. On copper-deficient soil, copper fertilization may help to reduce the incidence of ergot in cereals, although this may not be a 100 per cent effective management strategy. And I think you’re only going to see this effect on soils that are truly copper-deficient.
Rotation can also impact micronutrient nutrition and response. My colleague, Dr. Ryan Hangs, looked at copper and zinc in a wheatpea rotation – copper added to wheat, followed by zinc added to pea. Soil was collected from 47 different locations across Western Canada. Some of these soils had available concentrations and supply rates of a micronutrient that indicated potential responses to fertilization. When copper was applied to wheat on 12 mineral soils that were suspected to be responsive to copper, there was a significant yield response. Foliar and banded application of copper sulfate significantly increased yield. However there was a lower yield from banded chelated copper compared to the control, which I think was because our rate was too high, and we saw some toxicity show up. We always need to be aware, with micronutrients in particular, there can be a fine line between sufficiency and toxicity.
I was involved in a study in the 1990s looking at the application of 40 lbs. of KCl at foot slope positions versus upper slope positions in the landscape in a farm field southeast of Saskatoon. We were interested in this topographic effect because the foot slope positions in this landscape had very low chloride levels in the top two feet. In the two years of the study, one year we had a significant wheat yield response to the application of potash in the foot slope regions, which we were able to attribute to the effect of the chloride. Was it a disease thing, or was it a nutritional factor? Unfortunately, we did not do any disease ratings. I think it had to do with a lot of snow the winter before that leached the chloride out of the upper profile in the depressions where the snowmelt water accumulated. The next year was drier and there wasn’t any response to the potash at either the upper or lower slopes.
There is less talk about chloride as a limitation in recent years, and I think one of the reasons is that there is more widespread use of potash in fertilizer blends, particularly for cereals. With chloride, the important thing to remember is that almost all of the chloride remains in the straw, which means that that all of it gets recycled back into the soil if the straw isn’t baled off the field.
A question was raised in the past about whether boron addition can reduce the incidence of clubroot in canola. Some early work indicated that boron addition reduced the infection of Brassicae by clubroot, but it was also associated with phytotoxicity. Followup work that was done in 2014 in a study conducted in Alberta, Ontario, and Quebec showed no reduction in clubrooted incidence with boron fertilization and no yield response except on one organic soil in Ontario.
Calcium is another nutrient that some researchers are looking at to help control clubroot. It seems that soil pH of 7.2 or 7.4 would be an optimum pH to help reduce the incidence of clubroot. We also need to be thinking about how fertilizers may be influencing soil pH and how that might perhaps have an indirect effect on the incidence of this disease.
Disease updates, reducing risk and practical management tips.
Presented by Dan Orchard, Canola Council of Canada & Curtis Henkelmann, central Alberta canola grower at the Top Crop Manager Plant Health Summit, Feb 25-26, 2020, Saskatoon.
My name is Dan Orchard and I’m an agronomist with the Canola Council of Canada at Wetaskiwin, Alta. I guess my claim to fame was the first discovery of clubroot in canola. A farmer called me because he had a problem in his canola and he didn’t know what it was. I helped identify it, so I guess my claim to fame is kind of the inventor of clubroot in Alberta.
Curtis: Well, that’s how I got to know Dan back in 2003. We farm just south of the Edmonton International Airport area. We’re spread out about 30 miles across and we crop about 4,000 acres. I figured out that we move 96 times down the road, in and out of about 128 parcels of land. In ’03 when we discovered this disease, it was quite devastating at the time. But, hey, we’re here today, and at the point now where we feel that we’re seeing a reduction in what we had initially.
Dan: I realized that the county south of where I discovered clubroot on Curtis’s farm was just as bad, but nobody knew how to look for it or what it was. So, I think one of the big take-home messages here is that you need to find clubroot early. You need to look for it.
Some other key points are to keep your spore loads low. The lower your spore load, the easier clubroot is to manage. We have incredible resistant varieties, but when they’re overused, they’re not going to last forever.
I think it’s also important for everyone to understand that as an agronomist or as a consultant or as a farmer, you need to always be thinking about a clubroot management plan because this is a
very controllable, manageable disease if it’s proactively managed. If we wait until we can see huge patches of clubroot, we’re behind the eight ball.
Plant cells are meant to be hollow to transport water and nutrients. Instead clubroot plugs the cells with microscopic clubroot spores, and that keeps the plant from up-taking water and nutrients. It’ll wilt and potentially die. You could fit 10 clubroot spores across the width of a human hair, and, in my opinion, this is why it’s so difficult to control and so prolific.
How is it spreading? Canola propagates clubroot but it doesn’t spread it. Moving soil spreads clubroot. Whether you’re growing barley or wheat or oats or just tilling your land, that’s what’s moving clubroot around.
When I first met Curtis, he was the first and only person to sanitize every piece of equipment.
Curtis: This was kind of a double-edged sword at the time. I was working for the municipality on the enforcement side of clubroot management. With our farming operation, we had to follow a protocol. We started with sanitization, and worked with it for about three years, and basically, it was impractical. You can’t clean every piece of dirt off your equipment, wash it and then sanitize it. We now blow or brush off the majority of the dirt that we can every time we move from a field, which has become a practical way. It takes a little bit of time – half an hour each time to move – but the whole thing with our operation – we’ve followed a plan.
We had a lot of oil field activity, and we thought maybe it was a salt spill or it was something from the past. Actually, it was a clubroot infection. Once we’ve identified these areas, we’ve avoided them, and I believe it’s helped us gain the opportunity to educate anyone we interact with on the farm. We have people coming on the land: surveyors and hunters. I tell everybody where it is so the patches can be avoided.
Dan: It would be a stretch to say that anyone in Curtis’s area doesn’t have clubroot. It’s unfortunate that the stigma is still there, and that people hide it for some reason. But I think in the heart of the clubroot area now, it’s just understood that you need to let people know where it is so they don’t drag it to their farm, or you don’t drag it over your whole farm.
The entrances and some of the hotspots are areas where Curtis can tell people not to enter or not to park there. I do think that the shocking part is how much soil we move with our equipment. We can point the finger at oil and gas, or exploration, or hunters, or deer, or geese, but we’re moving clubroot mostly with our farm equipment.
Curtis: I’ll give you a small example. A nutrient company was in a neighbour’s field, and we had one of those spring downpours, and the truck was stuck. The following day the truck was pulled out and it went to another neighbour’s place down the road. He was unloading the truck, and the guy kicked the mud flaps off. Exactly where that area was, a year later with canola, there were these small eight-inch patches of clubroot. Within a three-year period on the next canola crop, and that was an area that was worked quite a few times, there’s a 25-acre patch. That’s how easily it moves.
Dan: There are other ways of spreading that are out of the control of the farmer as well. Research has tracked wind trajectories that originated from Edmonton, and where they were deposited in various parts of the Prairies. There were two wind events that were tracked to carry dust particles that originated in Edmonton, with some as far east as Portage la Prairie, Man., and up into the Peace River region to the northwest.
Curtis and I have both seen trends downwind from bins or areas where dust collects in your field, and that is where clubroot can often be found quite easily. Intuitively, I think we knew it was spreading in the dust from other crops, as well.
When you harvest wheat, the dust will have clubroot spores in it, too. In the seed cleaning plants all around our area, tailings and dust from all crops have clubroot spores on the dust.
Alberta, Saskatchewan, and Manitoba all have a little different
way of reporting. They’re trying to unify the map across Canada, but I don’t know that we’ll ever get there because Alberta is not testing soil, because it would be a waste of money because it is everywhere.
Manitoba reports by the number of spores per gram of soil and when you overlay that with the frequency of canola in rotation, it’s not a surprise there is a correlation.
Saskatchewan reports by municipality with clubroot detected in soil samples, and by visual symptoms. Alberta has now switched to total number of cases affected by clubroot per county. But that has issues, because where Curtis farms, they’re one of a few counties that look at every single canola field, so they’re going to find many more fields than the counties who don’t survey as many fields.
Curtis: I can elaborate on that. Working at the county for about 18 years, they still, to this day, try to inspect every field. The problem is in the surrounding municipalities where they don’t inspect every field. You can identify clubroot by driving down the road at 100 kilometres an hour. You can see it, but they have their heads in the sand. That’s really troublesome for myself and a lot of producers that are trying to manage it, because these other MDs and municipalities, they just seem to brush it off and rely on genetics.
Dan: Researchers and industry came up with this clubroot management recipe in the last few months. I find it kind of ironic because in talking to other farmers in the heart of the clubroot region, they’ve been following this recipe for years and years, not because we told them but because they’ve found ways to successfully farm with clubroot.
• Scout. Scout. Scout
• Have at least a two-year break between canola crops
• Use R-rated varieties before clubroot gets established
• Avoid movement of soil and make sure incoming equipment is free of soil
• Control host weeds and volunteer canola
• Use patch management strategies
Scouting for clubroot is unbelievably important. A two-year break from canola is a saviour for canola production. Recent research that’s been repeated numerous times is showing that 90 per cent to as many as 99 per cent of the spores are not viable after a two-year break. A three-year rotation or that two-year break is probably the biggest thing to combat clubroot if it’s done proactively. You can’t wait until clubroot arrives and then extend your rotation. Using resistant varieties is huge.
Curtis: We’ve been on primarily a three-year rotation – sometimes four. We’ve also been using a resistant variety. In the last four years, on average, we grow 1,200 acres of canola. The county inspects every canola field and in the last four years, we haven’t received an Information Notice, which is issued if they find clubroot on less than 30 plants per 100 canola plants inspected in a field. So we know our clubroot pressure is going down. Unfortunately, we had 26 inches of rain over this past growing season and we have 3,000 acres of ruts, and we have to work the whole thing. I’m not happy about it, but I feel fairly confident that we’re going to contain the spread just by what we’ve been doing.
Dan: It is really important to control host weeds, minimize soil movement, and manage patches. Managing patches means dealing with that patch. You don’t ignore it and keep working the land and
spread that patch out across your whole farm. Maybe you grass that patch. There’s evidence that grasses will drive the spore load down much quicker than not having grass there. For Curtis, some of his patch management is just simply telling people not to go work that piece in the corner because there’s clubroot there, right.
Curtis: We’ve actually grassed a couple areas because it doesn’t produce anything anyways because of compaction from pulling in and out of the field. I look for the offsite of the prevailing wind, especially where you have a bush line. That’s where we’re seeing the higher levels of clubroot. Another area is some of the old yard sites that are higher in fertility that have higher clubroot.
Dan: We’ve seen a lot of old garden sites where they grew cabbage or broccoli or some susceptible Brassica crop in the past that was the source of clubroot. Then you can watch it spread to the whole field. I’ve seen wheat straw bales that have been piled on the edge of the field for a few years and when the bales are removed and canola seeded, the canola dies in the shape of where the bales were. It was because of the dust on the straw carrying clubroot spores.
Mary Ruth McDonald at the University of Guelph looked at how many spores are needed to start showing clubroot symptoms. These numbers aren’t exact, but typically you need 10,000 to 100,000 spores in one gram of soil, which is about the size of a loonie, to consistently see clubroot symptoms. In Alberta, we’re at a million or millions of spores in one gram of soil so we see symptoms all the time.
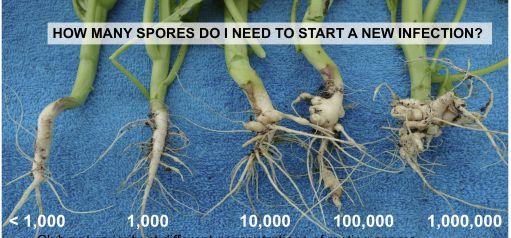
In Saskatchewan and Manitoba, you’d be at 30,000 or 10,000 or less. The key in these provinces is to do a two-year break and the spore load would become almost be not detectable. In Alberta even starting at 100,000 spores, with a one-year break, the spore load goes up into the millions. Even if 99 per cent of the spores die within that first two years, at 100 million spores in a gram of soil, one per cent survival is still a million. That’s the problem with not proactively managing clubroot – the spore loads get so high that they just can’t be controlled in a rotation.
Pull plants to scout for the disease. We originally thought the way to scout for clubroot was to drive down the road at swathing time and look for a big dead patch, but we’ve since learned that’s far too late to be discovering it. Every single time you can, stop the swather and pull plants.
When you are scouting, you want to find plants with very mild symptoms, because it is very, very early and very easy to manage. A two-year canola break, controlling host weeds and growing a resistant variety could be adequate. In Alberta, we have seen entire fields not harvested due to severe clubroot infestation. That shouldn’t happen in Saskatchewan and Manitoba because you have so many more tools and information than we had when we started.
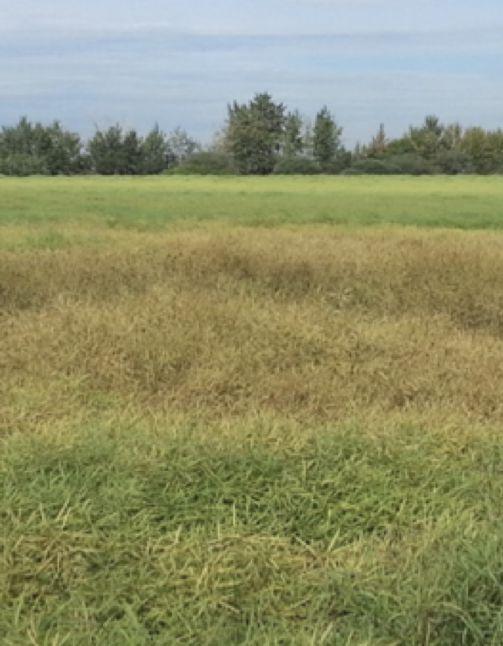
Curtis: Back in ’05, there was a field outside of the International Airport at Edmonton. It was 120 acres, the grower couldn’t fill a John Deere 9600 combine hopper off that 120 acres. That was quite devastating at the time.
Dan: Crop rotation is so important. I looked at AAFC Annual Crop Inventory Maps to see how often canola is grown in rotation. I chose western Manitoba and eastern Saskatchewan from 2009 to 2014. The map covers every 80 acres, and suggests that in a lot of cases, every second year is canola in this area, and probably three out of five years or four out of six is in canola. That crop rotation is like Alberta’s was in the 2000s.
Curtis: One principle we operate on is a margin basis. We don’t look at the margin we make off of canola. We look at it over wheat, peas, barley, and canola. We average it out. A lot of people don’t do that. A lot of farmers that I talk to still think resistant varieties are the silver bullets, and it’s not. It’s the whole management practice, and you can’t reduce that rotation.
A little footnote, there’s a farm family in the area and they refused to change their practices. They have had a few Notices. Someone has been going out to their equipment every morning and leaving a jug of bleach sitting on the step. This has happened probably 25 times now, so we nicknamed these guys “the bleach brothers.” Finally, this year, the county has stepped down on them, and they had nine quarter sections restricted for canola growth for five years.
Dan: Grow resistant varieties. Here’s a picture where a father and a son farmed a quarter section, and they had an argument on whether or not they should grow a resistant variety. The son grew a non-resistant variety because it had higher yield potential and Dad grew a resistant variety. The resistant variety yielded about 50 bushels and the other five bushels. The moral of the story is “listen to your dad.” When you’re picking a variety, yield doesn’t have to always be the number one selection.
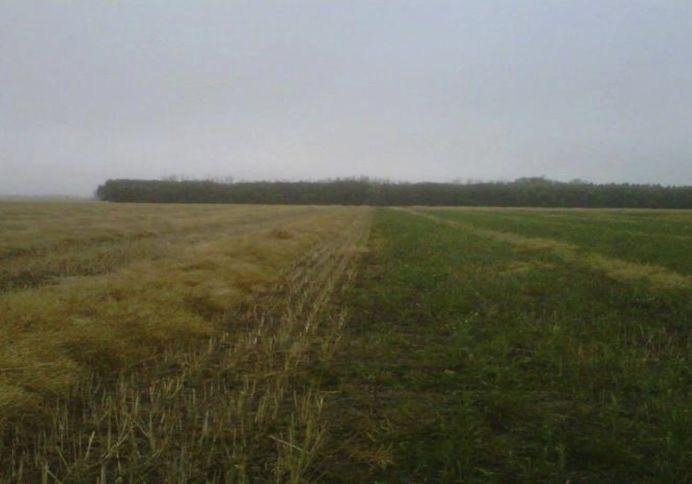
Resistance management is also important. If you have high spore loads and grow canola too frequently, you’ll select for different pathotypes in the field. Up until last year, we thought there was between 16 and 19 strains or pathotypes of clubroot. Now, that’s up to 36 pathotypes. There’s so many strains out there that there’s absolutely no way that breeding is going to take care of this. It’s just one tool in the toolbox.
Curtis: Some growers, because of the cost of some of the resistant varieties, have mixed a resistant and non-resistant variety together.
Dan: Yeah, that’s not recommended. Initially, the first generation of resistant varieties was effective against only few pathotypes. Now, there are 19 pathotypes that have overcome that resistance. There are a few new genetic sources that are able to control some of these new pathotypes, but we have no idea how many and which ones because the new material hasn’t been screened, and these pathotypes were just discovered last year. It’s a mess, believe it.
We’re up to hundreds of fields that are showing clubroot symptoms in a resistant variety, but that’s in the fields that have been reported. There would be hundreds alone in Curtis’s county. So, the numbers are dramatically underrepresented. I think that there’s thousands and thousands of fields that have broke resistance that we just don’t look for, or we don’t believe it, or it’s too difficult to find without intensive scouting.
As I mentioned, equipment sanitation is another important part of the recipe. For farmers, the most practical thing is to knock off dirt at grassed entrances and exits before moving equipment.
Curtis: I’d say it takes half an hour. If you do it all the time, we don’t notice it anymore. But the last year was pretty challenging in the fall with ruts from grain carts and Super B’s stuck all the time. We left the loader at every approach, and we pushed the mud into the field because we felt that obligation. We run a closed system, so we know we’re not letting anybody else on our land. No more custom operators or hunters. But in our area there are a lot of custom manure hauling and silage outfits. They seem to be the ones that are really moving it a distance.
Dan: I was called to a field last year with a resistant variety and we went fencepost to fencepost, looking for clubroot. It was bad because he pretty much broke every rule. He used a high-speed tillage unit and grew canola, wheat, canola, wheat, canola, and wheat. It was his fifth time he was growing a resistant variety of the same genetic source. He dragged clubroot to every corner of his field and farm. He had a lineup of neighbours who all wanted to borrow his high-speed unit, and this undoubtedly spread around the county.
Researchers have captured dust blowing off fields with clubroot, and found up to 220,000 spores in a gram of dust, so we need to reduce our tillage. On boots, a Swedish study found boots can carrying
140 grams of soil and had concentrations of 600,000,000 spores per gram. That is 84,000,000,000 spores on each boot. Undoubtedly, you could spread clubroot with your boots as an agronomist, with a quad, with your truck.
Weed control is something else that I think we do quite a good job of, but I don’t know that we’re removing the weeds early enough. A recent study has shown that three weeks after the weeds emerge, clubroot spores are viable to carry on the next generation. If we don’t kill Brassica weeds until five or six weeks after they emerge, they’re likely contributing to the spore load in the soil.
Often we see a clubroot the size of a table. I don’t think it’s completely unrealistic to go out and pull these awful-looking plants out of the ground and burn them. The vegetable growers do that, and then they put lime on and seed the patch to grass. We still need to have more research on liming. I’ve seen amazing results, but our soils are so variable that we need to have more research on the 4Rs of liming.
Plants like ryegrass and brome grass that have a really dense, fibrous root explore more soil, and come into contact with more spores. When the spores come out of dormancy, they have no host plant to attack, and they die off. Research was shown that after grassing a heavily infested patch, 90 per cent of the spores were not detectable anymore.
I like the recommendation to grass entrances and exits. It’s a little easier than grassing patches out in the field.
Curtis: It’s easier. I will say it’s a bit of a pain. We have grass in places that we don’t really want it, but it’s helped us. It has helped reduce the spread.
Dan: We have a long list of resistant varieties. There’s not a big premium, if there is a premium at all. To understand the genetic sources or resistance behind them so that you can rotate those genes, I recommend you talk to your retails and your seed companies. The time to start using them is now, even if you don’t think you have clubroot.
Curtis: Another thing we’ve done is if we had a really bad field, we would leave seeding it until the last, but we still try to clean everything off when we’re done. We’ve been dealing with clubroot for 18 years now, and we’re at the point where we’re comfortable in our rotation and management practices. I believe we can continue to grow canola by following just these small practices.
Breaking down the re-evaluations and next steps for this form of pest control.
Presented by John Gavloski, Manitoba Agriculture and Resource Development, at the Top Crop Manager Plant Health Summit, Feb 25-26, 2020, Saskatoon.
Neonicotinoid (neonic) insecticides have recently come under a lot of scrutiny. They belong to Insecticide Group 4A and in Western Canada are used mainly as seed treatments in field crops. The seed treatments that you’re probably familiar with are ones like Helix, Poncho, Prosper, Cruiser, and Raxil. There are also several different active ingredients for neonics and the three that I am going to focus on are imidacloprid, thiamethoxam, and clothianidin. These are the three that are undergoing reviews by Health Canada’s Pest Management Regulatory Agency (PMRA).
There are three separate re-evaluations for neonics going on. All of our pesticides go through cyclical re-evaluations. A product will be re-evaluated just to make sure that nothing has changed, that the label doesn’t need to be amended, and so new science can be factored into that product’s status and use patterns. In addition to these cyclical evaluations, PMRA does “special reviews” in response to an issue that might arise.
In this presentation we will explore why there has been so much controversy over neonics, and, if they were to be phased out, what the alternative insect management options are.
PMRA initiated a pollinator focused re-evaluation on neonics in 2012, because it was noted that pollinators were being killed and neonics were thought to be a potential cause. The final decision was published April 11, 2019.
The final decision was that many of the foliar applications were cancelled in flowering crops that bees find attractive, such as orchard trees. For some fruiting vegetables and berry crops, foliar sprays are not allowed right before or during flowering. The assessment was that use as seed treatments was still acceptable, but the labels had to have a statement that exposure of pollinators to dust had to be minimized when applying to cereals and legumes.
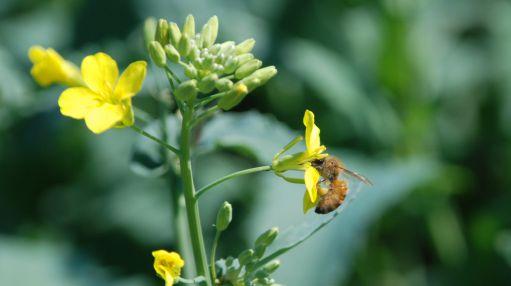
A cyclical re-evaluation was completed a few years ago on imidacloprid, and the proposed decision came out in November 2016. PMRA proposed to discontinue all agricultural uses of imidacloprid. This was based on water quality data, mainly from Eastern Canada where detections were exceeding the acceptable threshold of 41 nanograms per litre (ng/L). That threshold is also controversial.
But this isn’t the final decision. When a review comes out, initially it’s a proposed decision. Individuals and organizations get a certain period of time to respond to this proposal. If there’s science or implications that we think might have not been considered, we can add that to the picture. The final decision is expected later in 2020.
After the imidacloprid cyclical review, it became evident that there’s potential groundwater and surface water issues with neonicotinoids, and a special aquatic review was done on the other two neonics, thiamethoxam and clothianidin. Once again, the review is in the proposed phase, and what was proposed was the phase out of all outdoor uses of these two insecticides. This again was based on water quality data.
Initially, PMRA was supposed to have their final decision out late 2019, but there was a lot of feedback and new information submitted. Now we’re expecting the final decision to occur probably in the fall of 2020.
One of the things that make neonics really good insecticides is that they’re very highly toxic to insects. They also have low toxicity to vertebrates, which means less risk to humans. The oral LD50 [median lethal dose] to mammals of a lot of these products is actually quite high (meaning less toxic), into the thousands, which compares favorably to an insecticide like Furadan that had an LD50 around seven.
Neonics are also systemic and move in the plant in the xylem, which means they can be very useful as seed treatments because xylem is moving from the roots up through the plant, into the leaves. Early in plant growth, it is highly concentrated in the new leaves, but as more leaves form, you get less and less neonic concentrations until eventually it’s not going to do its job anymore. They are persistent too. Persistence can have a good and a bad side to it. On the good side, they hang around long enough to do the job. On the bad side, if they’re too persistent, they end up where you don’t want them to end up.
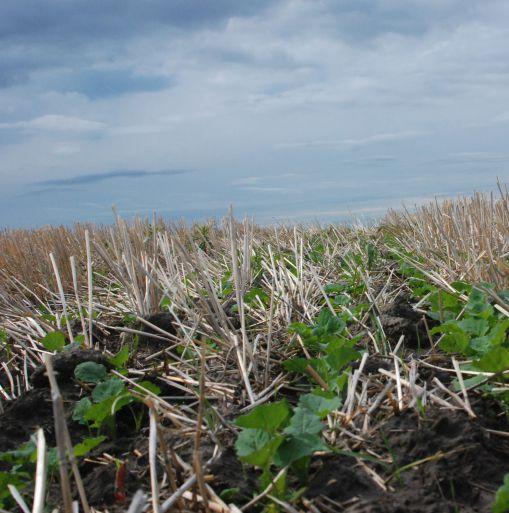
When growers use treated seed, for some crops it is helpful to have a lubricant to make the seed flow better through the planters. A typical practice for corn and soybean growers was to throw in talc or graphite that would help the seed flow better. But there is some abrasiveness and some of the seed treatment can come off of the seed. There is often a cloud of dust behind the planter at seeding time, and that dust could contain neonic insecticide in it. And this can be harmful to pollinators.
Early in the season, honey bees don’t have a lot to feed on, so they’ll be going to things like dandelions and some of the flowering plants along your field margins, and they might be flying through the fields at the time of seeding. There have been some significant bee kills because of dust from seeders. Once the connection between the dust from seeding and pollinator kill became known, growers were encouraged to use practices that could minimize the dust. Deflectors are one option, as they direct the dust to the soil surface.
Bayer also came out with a “fluency agent” that is a lubricant. There was a study in Ontario that looked at 18 fields and they found that there was 68 per cent less dust, but the dust had 3.7 times the concentration of neonics. The end result was about a 28 per cent reduction in neonic dust coming out of the seeders. So the fluency agent helps, but other dust reduction measures, such as deflectors, are still encouraged.
Other sources of potential exposure for pollinators to neonics are pollen and nectar. There was a study that determined the dose of neonics to get abnormal foraging behaviour in honey bees was greater than 40 parts per billion (ppb).
A study in canola, seeded with clothianidin in the seed treatment at label rates, measured the level of neonic residues in nectar and pollen. About 3 ppb was found in the pollen and about 3.7 ppb in the nectar. These levels are probably biologically insignificant, but, again, the concern was that it’s still there.
Honey bees also like to feed on pollen. Corn is a good pollenproducer, and honey bees really like corn pollen. Another study looked at neonic levels in pollen samples from corn, seeded with
clothianidin in the seed treatment at label rates, and found about 3.9 ppb. Once again you probably won’t see abnormal behaviours in the bees at those levels.
Another study showed neonics showing up in “guttation fluids” of seed-treated corn plants. Guttation fluids are the excretion of xylem fluids at leaf margins. If you ever go out early in the morning when you’re doing your crop scouting, you might notice drops of water along the edges or margins of the leaves. That’s guttation fluids. Researchers took samples of these guttation fluids and analyzed them for neonics.
Neonics are highly water-soluble, so you’d expect they would be there, and they were. But again, the question biologically is “Does this mean anything to pollinators?” Pollinators do need water, but how much are they feeding on guttation fluids? We really don’t have a good answer to that question.
Neonics in surface waters is another very controversial topic. Neonics are highly water-soluble so they make good seed treatments, but they end up in water quickly. Their half-life in water is fairly long, so they will persist in water. And they have a fairly high leaching and runoff potential.
I am going to show results from four studies on neonics in waterways. Some studies show that heavy rain events in the spring can produce pulses of neonics into waterways. Results aren’t always consistent between studies. Weather conditions, and how much rain you’ve been getting, can affect levels of movement into waterways.
The reason that neonics in surface water matters is that insects are really important in the aquatic food chain. Three groups of insects that are all very sensitive to neonicotinoids are mayflies (Ephemeroptera), caddisflies (Tricoptera) and Diptera (which includes midges). Fishermen will probably know these groups of insects. One of the standard test organisms, Daphnia magna appears to be very tolerant to neonics. Fish, amphibians and molluscs are also relatively insensitive to neonics.
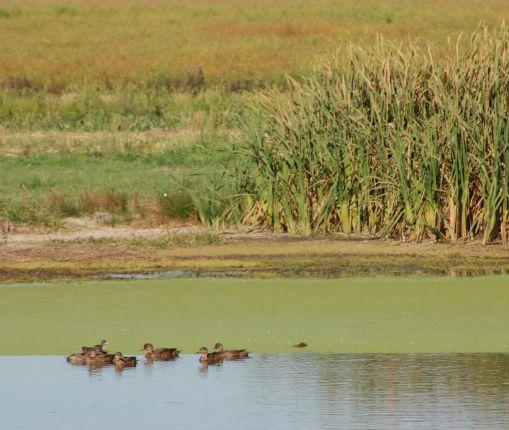
The first of the four studies I’m going to show you was done in Saskatchewan. They looked at 136 wetlands in 2012 and 2013. Water sampling was done over four time periods – right before seeding in 2012, during the growing season, at harvest, and then early the next spring in 2013. There was a fairly high percentage of wetlands where neonics were detected. For example, during the
summer of 2012, neonics were detected in 62 per cent of those 136 wetlands. Not all of those had concentrations that were likely biologically significant. But they did detect neonics in the water samples in all four of their sampling periods, and again that alone created a lot of alarm and controversy.
Study number two was done in the Corn Belt of the U.S. Midwest. The researchers took water samples out of nine streams over different time periods. They found neonics in all nine streams. The levels varied greatly depending on when they took their sample. One of the conclusions in this study was that rainfall events following seeding resulted in pulses of neonics into the streams.
Study number three was done in Ontario by Art Schaafsma and collaborators from the University of Guelph. Water samples were taken from puddles in corn fields, and also samples from puddles, ditches and drains outside of corn fields. They also looked at a couple soil samples taken from a conservation area nearby. They found clothianidin and thiamethoxam in virtually all the water samples. Within the corn fields, residue levels increased six-fold during the first five weeks after planting.
The neonics were quite a bit higher, at 2.41 ng/ml, than in the Saskatchewan study. In fact, they’re about 13-fold greater than the levels that were found in the Prairie Pothole study in Saskatchewan. But, again, you have to be careful when you’re looking at these studies, too – where the water was taken from, and what the rainfall conditions were like. There’s a lot of variability with these studies.
The two soil samples from the conservation area contained detectable levels of clothianidin. The big question was, “How were the neonics getting into the soil samples from this conservation area?” It may have been dust from the seeders at seeding time, or soil blowing, or a foliar spray from a potato field nearby. I don’t think they really know, and this is an interesting question from that study.
The fourth study was done in Manitoba in 2017. Water was collected from 33 surface water sites and eight ground water sites. Thiamethoxam was the most commonly detected in 20 sites, followed by clothianidin and imidacloprid. The sites were along major rivers, streams, and lakes like the Red River, Lake Winnipeg or a major stream.
PMRA has set proposed threshold levels for aquatic life for each neonic. For imidacloprid it is 41 ng/L, thiamethoxam is 26 and clothianidin is 1.5. The tricky part is scientists sometimes disagree about what acceptable levels to protect aquatic life should be. In PMRA’s report on the water quality data in 2017, they chose the 41 ng/L level to compare their data.
In this Manitoba study, post-seeding, two of the 31 sites had levels above 41 ng/L for thiamethoxam and two for clothianidin. During the growing season, one imidacloprid, five thiamethoxam, and five clothianidin sites had concentrations higher than 41 ng/L. After harvest, the numbers dropped to three for imidacloprid and one for clothianidin.
So the big question now is whether 41 ng/L is a good benchmark? That’s something that’s being highly debated. There are also different groups that have their own guidelines, including the Canadian Council of Ministers of the Environment, the US EPA and the EU. This is where it gets really tricky and controversial.
The other consideration is that neonicotinoids are often found as mixtures, which can have additive toxic effects on aquatic life, as they are all working on organisms in the same way. So if you had 30 ng/L of thiamethoxam and 35 ng/L of clothianidin you’re now up to 65, so you could have biological effects happening. So that’s the
other thing that has to be considered when the PMRA is evaluating this data.
There are a few things that can be done to reduce the risk of neonics moving into surface water. A study done in Saskatchewan found that neonics were found in fairly high levels (43 per cent) in wetland plants around sloughs and waterways. Field horsetails, northern water plantain and broadleaf cattails had high rates of detection of neonics. Unvegetated wetlands had higher concentrations of clothianidin and thiamethoxam than vegetated wetlands.
Neonics should only be used when necessary. In some instances, more regular use of insecticide-treated seed is justified, such as for flea beetles in canola. For potato growers or horticultural operations, where foliar application of Admire or Alias might be necessary, read your label. Any of the neonicotinoid foliar spray labels, read: “Avoid application when heavy rain is forecast.” In general, if you’ve got something that’s highly water-soluble, do not be putting it on before heavy rain is expected. Your chances of getting that into your waterways is magnified.
Canola is one of the crops where neonics are very heavily needed for flea beetle protection. Right now the alternative is an insecticide Group called the diamides, with product names of seed treatments like Lumiderm and Fortenza Advanced. There are pros and cons to some of these products. The diamides aren’t quite as water-soluble as the neonics, so the trade-off is that they might be a little bit slower acting. However, they do a very good job of killing flea beetles. Currently the diamides are more expensive than the neonics.
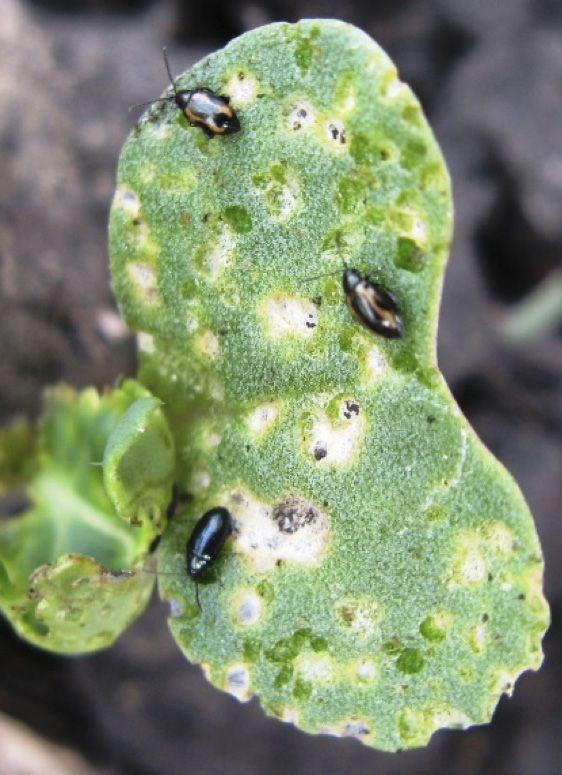
Looking further ahead, something I’m quite excited about is a new concept in insecticides. It’s called RNA interference. Genetic material specific to an insect is used to make an insecticide. When the target insect ingests the material, it silences genes inside that insect and kills it. It’s very targeted and will only kill flea beetles. This is being worked on and a company I talked to hope to have something to release by about the mid-2020s.
In cereal crops, the only insect that the neonics are used to manage in Western Canada is wireworms. So you really don’t need a neonic like Cruiser or Raxil on your cereals if you do not have a wireworm issue.
A year ago, I would have said there are no alternatives to neonics for wireworms. However, Lumivia is now registered in cereal crops for wireworm control. Lumivia is a diamide, and is the same active that is in Coragen, a foliar insecticide that’s highly toxic to grasshoppers and a lot of chewing insects.
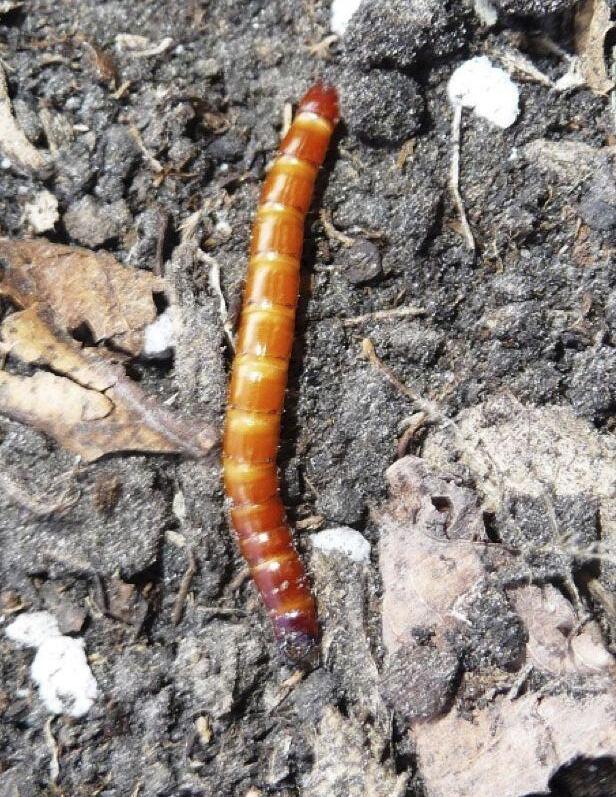
In soybeans and pulse crops, the main reasons to use a neonic are wireworms or seedcorn maggot. In Manitoba, these are a very localized, sporadic concern. They’re not widespread at economic levels, so most soybean growers don’t need a neonic on their seed. However, many soybean growers were using neonic-treated seed because that is what they were sold. Again, we’re suggesting to use these in a more targeted way.
We do have seed treatments coming onto the market in pulse crops and soybeans as well. Fortenza is another diamide with the active ingredient cyantraniliprole that is registered on soybean. It’s the same active that is used in Fortenza seed treatments in corn and canola
Scorpio Ant and Insect Bait can provide suppression of wireworms. I don’t know how practical it is. It is a bait in a granular formulation that you have to mix with the seed. It contains spinosad. It will help repel wireworms and make them a little sick,
just like the neonics do. I don’t know how much it’s going to be used in the Canadian Prairies, but it is registered as an alternative.
For corn growers, wireworms are the main reason to use a seed treatment, and sometimes seedcorn maggot. Corn rootworm shouldn’t be a problem with proper crop rotations. They only feed on corn, but we sometimes have a hard time getting people to rotate their corn if they’ve got livestock operations.
An alternative seed treatment in corn is once again the diamides. Fortenza is an option on wireworm and cutworms. An organophosphate, Pyrifos 15G is registered on corn rootworm. I don’t think a lot of people are using it. We do have corn rootworm-resistant corn varieties and people who have had problems in Manitoba have been exploring their use.
In potatoes, neonics use is a lot more widespread. They are used as a seed treatment on the potato or as an in-furrow foliar application at seeding. Products like Admire, Actara, or Alias are also used as a foliar spray. The main insects of concern are wireworms, aphids, leafhoppers, Colorado potato beetles, and potato flea beetle.
If neonics were phased out, potato growers have a few options. Capture (bifenthrin) is registered for wireworm control. I don’t know that it’s widely used. It is a very persistent product, can be hard on some of the natural enemies, and may not always be permitted by those buying potatoes.
Another registered option for wireworm control is chlorpyrifos products like Pyrifos 15G and Phyrinex. But these products are often not a practical option because they are not on the permitted products list of some companies that buy potatoes.
Another insecticide for wireworms in potatoes is Thimet 20-G. It is a granular product but has been heavily regulated because of toxicity. The only way you can apply it is in a “smart box” on the seeder that administers the product. I think because of the inconvenience, not a lot of people are using it.
Down the road, at least for wireworms, there is a new, quite exciting product coming out. Broflanilide will be on the market in the next year or two, and it actually kills wireworms very similar to what lindane used to do. Initially it’ll likely be registered in cereals and potatoes, and after that the label will probably be expanded to other crops.
Some studies in the U.S. looked at using “prairie strips” to reduce soil erosion, but the benefits extended beyond soil management. Narrow bands of often native vegetation were planted along contours and at bases of slopes in the field. In one of the studies done in the U.S. Corn Belt, they found that neonic concentrations in water and soil were lower in fields that had the prairie strips.
Responsible marketing, as well as responsible use, is essential for sustainable use of neonics. A few years ago, neonics were being promoted as growth promoters and for use as a “Vigour Trigger,” even if no insect pests were a threat. If we want to keep neonics as a tool in our toolkit, we need to use them as only insecticides and where risk is highest.
Assuming we keep our neonics, we have to be thinking very carefully about where and how we’re using them. Flea beetle control is probably essential. Wireworm and seedcorn maggot control is maybe required at times. We should be finding out the fate of neonics this fall 2020, but in the meantime, don’t overuse them.
Making management decisions with the help of smart ag technology and all of its data.
Presented by Joy Agnew, Director of Applied Research, Olds College, at the Top Crop Manager Plant Health Summit, Feb 25-26, 2020, Saskatoon.
Agriculture is a risky business, and that’s what the value of “smart” ag or ag technologies really is about – it’s to help mitigate that risk. Data and technology can help producers make decisions that account for all of the things that affect the overall profitability and productivity of farming. Weather and climate change, high and fluctuating cost of inputs, market volatility, that insanely complex relationship between soil, plants, air, and water, long-term impacts of cropping on soil health, and declining soil health, labour shortages, logistical challenges: all of it.
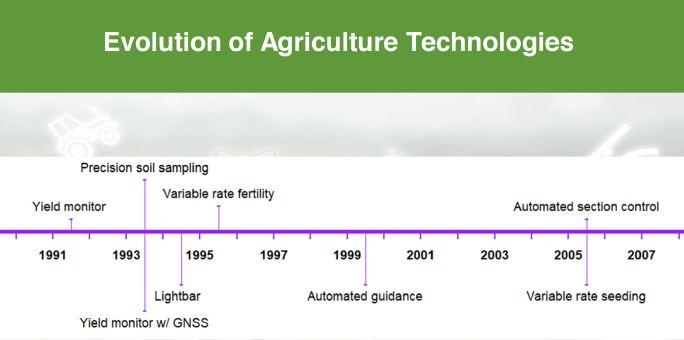
One thing that is confusing is the definition of “precision” ag, and what’s the difference between “precision” ag and “smart” ag. Olds College’s definition of smart agriculture is “utilizing technology and data to make science-based or evidence-based decisions to improve overall productivity, profitability, and sustainability of agricultural production.”
The classic definition of precision ag is using technology to account for or deal with the variability within a field. So while precision ag addresses variability within the field, smart ag goes beyond that by basing management tasks not only on location or variability within the field but also based on data, historical and potentially future forecasted data, enhanced by context and situation awareness, triggered by real-time events.
A few words on big data, because that’s really what precision ag and smart ag are based on, and that is utilizing data. Everyone’s talking about “big data” but big data is only useful if the little data has not been ignored for the last couple of decades. For example, if you don’t know your own cost of production, then you shouldn’t even be thinking about “big” data. You need to be focusing on the little data and use it well before you start thinking about incorporating big data into your management decisions.
Dr. Terry Griffin out of Kansas State University put together a timeline of the evolution of agriculture technologies. Yield monitors were introduced in the early ’90s, precision soil sampling was big back in the ’90s, variable rate fertility was introduced in the ’90s, automated guidance was becoming much more popular in the 2000s, and sectional control and variable rate seeding were introduced around 2005.
In the last 10 years, the ag tech evolution isn’t bringing anything
new to the table. It’s just improving how we might be able to do some of these ag technology practices better.
What’s the new current state and what’s coming out in the next few years? We are going beyond yield monitoring to do yield mapping. Rather than having an average bushel per acre on a field, we’re mapping it within discrete sections of the field to know the kind of productivity that is found in various parts of the field.
Instead of scouting or relying only on boots-on-the-ground in a field, there’s micro-climate and crop sensors and RPAS scouting to support boots-on-the-ground evaluations. RPAS is the new term for drones. It’s “remotely piloted aircraft structures” using imagery and remote sensing for scouting and looking at things like disease pressure or weed pressure or sometimes even staging.
There is a lot of talk about robot agronomists being available in the next five to 10 years. I’m not really sure how realistic this is going to be, mainly because of the nuances in determining crop staging. I’m not convinced that remote sensing or robot agronomists are ever going to be able to key in on those nuances.
Instead of blanket application of herbicides, there are opportunities to do variable rate application of herbicides or other pesticides, or targeted applications based on technology like optical spot spray technology. Further out, autonomous swarms of micro-bots kill weeds without herbicide. There is a lot of interest in being able to utilize non-herbicide methods of killing weeds in an autonomous way that could help deal with some of the herbicide-resistant issues that agriculture faces.
Soil sampling has moved from just taking a composite sample across the entire field to precision soil sampling or high-density grid sampling with improved analytics. Instead of soil sampling,
there is a technology that is claiming to eliminate the need for soil sampling. This provides in-the-field real-time continuous sampling or assessment of soil constituents, including plant-available nutrients, texture, temperature, EC, everything that you need in order to make a prescription map, theoretically.
Automated guidance is moving to smarter guidance and on to autonomous operation. I’m sure everyone has seen or heard of DOT and other OEM options for autonomous agricultural operation.
Variable rate prescriptions based on a single data layer are moving towards multi-layer data for prescription mapping. And then there may be no need to even generate a map because you’re going to be able to apply herbicide or fertilizer variable-rate in the field with a real-time soil nutrient sensor.
Instead of just mapping yields within the field, there is technology to map yield and quality within the field in real time on the combine, knowing exactly what your protein, oil, and starch content is, and whether there’s glyphosate residue on the crop going into the tank in the combine. That real-time analysis on the combine is possible and coming.
These are all very cool technologies, but I’m also very skeptical and somewhat practical when it comes to “What is the value to producers?” We can collect 6,000 data points per acre using this soil nutrient sensor, but what value is 6,000 data points per acre to a producer? How is that helping them make management decisions that actually put money in their pocket? That is the focus of our research at Olds College.
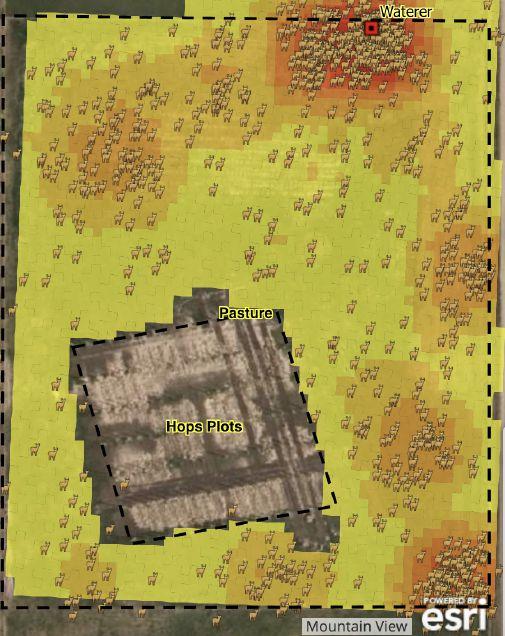
One of the very first internal projects we decided to tackle was utilization of ag data management platforms. We selected five, but there are dozens if not a hundred of these management platforms available for producers. The five were from Trimble, Climate Field-
view, Decisive Farming, AgExpert Field and Farmers Edge. We operated all five of these on our entire farm last year and looked at things like functionality and options, what does it help us manage, how easy is it to use, how easy is it to unload data from the equipment into the platform, and what kind of security and stability does it have? Our key question was which tool is the best fit for different applications? The Olds College Smart Farm has both cropping and livestock operations, so we’re able to look at platforms from a variety of different angles. This study will be ongoing because one year of experience with these data management platforms isn’t enough, and we will probably add additional platforms as they become available.
We had a student project with some GPS livestock collars that were donated to the College. They put the collars on some sheep to do a mapping exercise to track animal movement. The GPS collars provide real-time live tracking of animal movement. Once that data was downloaded and mapped, they created a heat map of the movement of a single sheep over the course of four days to see where it was spending most of its time. Where it was most of the time was around the watering bowl. The question that we’re now asking about this technology is can animal behaviour be easily monitored and then managed to improve herd health?
Our soil and climate sensor validation research is growing and it’s going to be ongoing for several years. There are numerous soil sensors and microclimate sensors coming onto the market but we have a lot of questions about them. What connectivity options do you need to provide real-time data that is going to be useful for management decisions? How robust are they? Do they have to be taken out every fall? Do they have above-ground portions that have to be managed during in-field operations? What is the quality of the data? How accurate are the measurements?
An interesting example of the usefulness of this technology is a micro-climate sensor that we looked at last year. One of the outputs of this particular sensor is leaf wetness index, and it was theoretically supposed to help you with timing of fungicide applications. But the reading that came back to us on leaf wetness index was an uncalibrated number on a scale from zero to 10. We went back to the technology developers and asked what the number meant. It turns out they had never deployed their technology or looked at their algorithm for a cereal crop. They were designed and implemented for row crop production in the United States. So what is the applicability to western Canadian agriculture? That is what we’re always interested in.
One type of soil sensor we are testing required us to dig a trench to place these sensors at various depths. They provide soil temperature and soil moisture at various depths. But we wonder what digging that trench did to the soil structure and the infiltration rate of that soil? And how comparable is that to the majority of the soil in a field that didn’t have a trench dug in it? The required density of these sensors for management decisions is another question we are trying to answer, knowing the optimum density of sensors will be dependent on field variability.
We are looking at the compilation and utilization of data layers. A
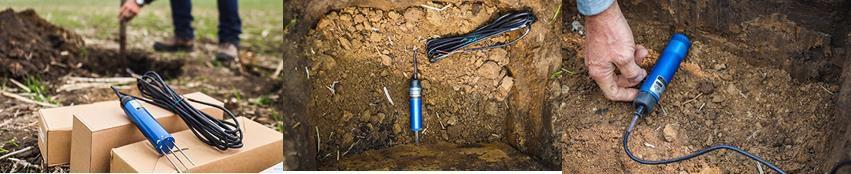
lot of companies are utilizing data layers for prescription mapping. But from a research farm perspective, we realize that we need to come as close as possible to having a calibrated soil. We have technology developers coming to us to validate assumptions or help them correlate their readings with the “true” reading. So we are developing the hyper-layer of data concept to as many of our fields as possible. These “calibrated” soils will help us validate and optimize these technologies, as well as help us define zones within that field for in-field trials of other technologies.
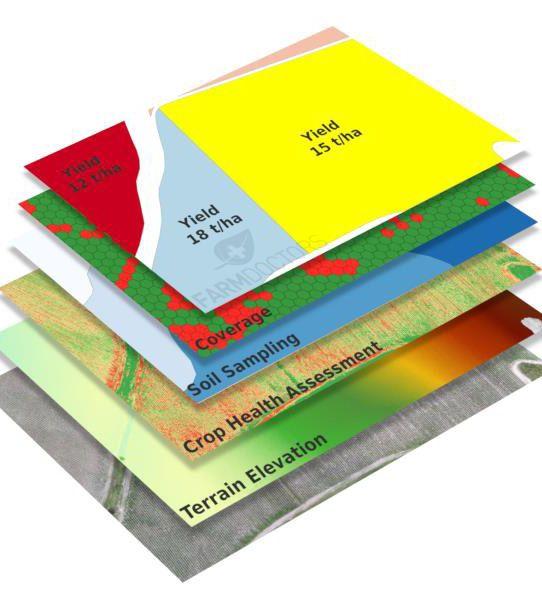
Remote sensing with RPAS, remotely piloted aircraft structures, and the associated imagery can be a benefit to agriculture. The imagery can be thermographic, multispectral, hyperspectral, NDVI, RGB, or using more innovative things like ground-penetrating radar. Imagery is a very important data layer that can be used for management decisions or understanding soil variability.
There is a lot of interest in herd health management with thermographic imagery. Research has already been done showing that you can use thermographic imagery to detect disease or health issues in animals days earlier than symptoms appear, but that has to be done on an animal-by-animal basis and fairly close up. Using thermographic imagery to scan entire herds in a much shorter period of time for herd health management holds a lot of potential.
A lot of questions and trepidation around autonomous ag, mainly on the regulatory and safety and efficiency side, still exist. Over the
next few years at Olds College we will be operating DOT for as many operations as possible on as many acres as possible to start getting third-party unbiased information on overall functionality, fuel efficiency, the effect on soil compaction, and actual labour requirements.
One of the big selling features of DOT or other autonomous ag technology is that you can supposedly set it and then go do something else. There are questions around that. Does it have to be monitored? What kind of skillset is required to set this up and then troubleshoot it when it stops? We are going to be operating DOT as a commercially operating farm for as many acres as possible to try to answer these questions.
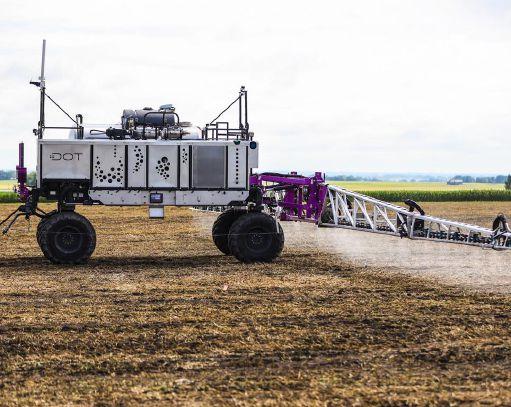
We are working with an optical spot spray technology called WEED-IT. Rather than blanket-applying herbicide across the entire boom width, WEED-IT optical technology looks for green and sprays only the green in real-time. It is well suited for pre-seed or pre-emergent application, or possibly pre-harvest or post-harvest application as well. There are a lot of early adopters in Alberta and Saskatchewan that are utilizing this technology for their operations. But we have questions about its functionality and its efficiency for western Canadian conditions. Specifically, how stubble type, travel velocity, and the size and type of weeds are going to influence the effectiveness.
Again, we are trying to develop a third-party, independent, unbiased evaluation of the chemical use reduction and overall efficiency of this technology. We’ll be looking at chemical use reduction with a variety of treatments, and monitoring crop and weed pressure throughout the growing season, and ultimately assessing the effect on yield as well.
This is a technology from a company called SoilReader. A sensor is mounted on a disc, and it is measuring the spectral bands as it goes through the soil for up to 15 soil constituents. It can measure nutrients, temperature, pH, EC, and even texture, at several different soil depths up to six inches deep.
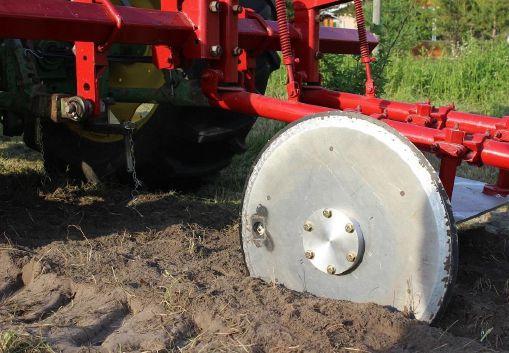
Their tagline is, “We’re digitizing soil. Six-thousand data points per acre.” How does that actually help make management decisions though? There are still so many unknowns. We need to find out if there is value in knowing 6,000 real-time soil constituent data points per acre.
We have another 10 or more projects that are in in the planning stages at Olds College. There’s technology for real-time seed depth adjustment, and coulter-by-coulter seed depth adjustment based on soil moisture during seeding and several other pre-commercial and commercialized precision ag technologies of interest for western Canadian implementation.
Quantification of the economic and environmental benefits of sectional control fertilizer application is another project. What effect does that have on overall carbon footprint of agriculture, and what is the actual percent reduction in fertilizer use due to reduced overlap?
Traceability systems for bulk commodities to reduce food loss are another area of interest. There are a lot of companies with interest in utilizing technology along the entire agri-food supply chain. Automatic grain sampling systems for quality control and improved grain marketing opportunities is another area. Precision beekeeping with sensors can give you a sense of hive health, or what kind of pollination activity is happening in the area.
I want to measure and share return on investment of these technologies to producers. I very quickly realized that is much easier said than done, because ultimately most on-farm decisions boil down to dollars. And in some cases it’s easy to assign a dollar value or an economic value or an economic return to a technology or practice, but a lot of times it is hard to account for enough of the value or the benefit of the technologies. The value of technology or the value of being of being able to make decisions or adopt practices has to be broader than just dollars.
But even if we can define a measurable value to something like a yield increase due to variable rate technology, the spatial and temporal variability of that yield make it very difficult to measure ROI. That spatial and temporal variability of crop yield is massive and it’ll require hundreds of site-years of data before we can even have any kind of confidence in what that ROI really is based on yield alone.
So most likely ROI is going to have to be a range of values. The ROI or the payback period of something like variable rate technology is going to be a range, and it might be a big range of three to
seven or three to 10 years. If you happen to adopt and utilize variable rate technology in a year that variable rate is very beneficial, then it might be a three-year payback, but it could be 10 years under other environmental conditions.
The ag tech evolution is going to have challenges. The most obvious one is one of the most aggravating, and it is the imperfect matching of technology. Basically we have technology companies in another industry who have a great technology and want to fit it into agriculture. They don’t understand the constraints or the problems associated with agriculture. That’s been the biggest frustration for me over the last year, seeing all these square pegs trying to be fit into round holes. Let’s understand the hole first and then design the peg to go in it.
An even more frustrating challenge is the translation of data into an actionable insight. I have learned very quickly that it’s so easy to collect terabytes and terabytes of data , but turning that into something that actually helps you make a management decision is a different ballgame altogether. So bridging that gap between collecting the data and turning that into something that’s useful, that’s another big challenge. More data does not necessarily result in more economic value.
Another gap is the limited access to expertise for innovators and small to medium-size enterprises to take their idea and turn it into a commercial product. In the ag industry, you need a pretty broad spectrum of expertise and infrastructure to be able to turn a basic idea into something that is going to be commercially viable. You need people with agronomic backgrounds and business backgrounds and technological backgrounds and experience with communication protocols and various other aspects of technology. We’re starting to build that at Olds College, and at the same time helping producers understand what the value really is.
All these evolving technologies are going to require dynamic learning opportunities for farmers and agronomists, because the technologies are changing all the time. There needs to be a place for agronomists and producers and crop advisors to learn.
Olds College is addressing many of these challenges with our Smart Farm platform. Olds College always had a commercially operating farm – 2,000 acres, about 700 acres of crop and 1,300 acres of forage and pasture land. We have infrastructure for innovation, validation, demonstration, and scaling. And we are also forming ourselves as the hub for a pan-Canadian smart ag ecosystem.
Olds College is launching two new ag tech programs this fall, a post-diploma certificate and a diploma in “techgronomy.” It’s a combination of technology and agronomy. These programs are going to be graduating very unique skillsets. We are also in the approval processes of getting our first four-year degree approved at Olds College, and that degree would be in precision ag.
Extension and dissemination is also going to be part of getting information out. The AgSmart Expo in August is one of our main dissemination platforms. We are also developing research reports and webinars and presentations.
The Strategic Innovation Fund from the federal government has provided funding for a network called the Canadian Agri-Food Automation and Intelligence Network, or CAAIN. The goal of CAAIN essentially is to advance and adopt automation and digitization technologies for agriculture. Olds College and Lakeland College and Alberta Innovates are three core partners within this group, and we’re expecting the money to start flowing this year for projects.

Getting to the roots of global food security.
Presented by Leon Kochian, Associate Director, Global Institute for Food Security, Canada Excellence Research Chair in Food Security, University of Saskatchewan at the Top Crop Manager Plant Health Summit, February 25-26, 2020, Saskatoon.
The Global Institute for Food Security (GIFS) is a public-private partnership that operates as an institute at the University of Saskatchewan with its own board of directors. Its research focus is to perform fundamental research generating information that can be used to deliver transformative innovation to agriculture in both the developed and developing world.
The four research focus areas include digital and computational agriculture, root-soil-microbial interactions, seed and developmental biology, and omics and precision agriculture laboratory.
Within the root-soil-microbial interactions focus, the objectives include the use of genomic, genetic and systems biology research to improve root mineral/water acquisition efficiency, resiliency to other abiotic stress, and to reduce the carbon footprint through:
• Development of high-throughput root phenomics platforms
• Phenotyping of root architecture, anatomical structure and function
• Research on role of root microbiome in root function and health
• Developing infrastructure and resources for integrating digital root phenotypes into crop molecular breeding pipelines
• Targeted breeding of superior root traits
One success story addressed aluminum (Al) toxicity to plants that occur on highly acidic soils. These highly acidic soils are common
across parts of South America, Africa, Russia and eastern North America. A symptom of Al toxicity is the inhibition of root growth that leads to severe yield reductions due to drought and nutrient deficiencies.
Dr. Jurandir Magalhaes identified that inheritance of Al tolerance was explained by the segregation of a single major locus. A gene in the multidrug and toxic compound extrusion (MATE) family confers that Al tolerance in sorghum. Marker-as-
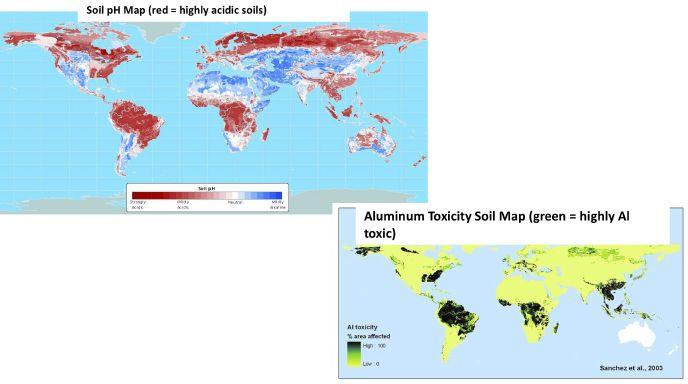
sisted breeding was used to introgress tolerant SbMATE alleles into Al-sensitive sorghum lines. Information on the Al tolerance gene was used for a molecular breeding pipeline for maize and sorghum improvements in Kenya, Mali, and Niger.
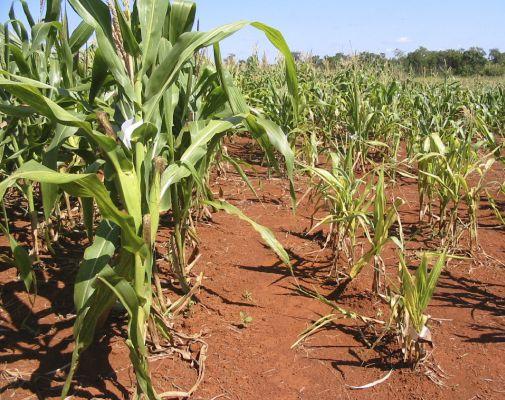
However, the SbMATE gene wasn’t enough to provide optimal Al tolerance. The genetic background of different sorghum lines resulted in different levels of Al tolerance. Analysis of sorghum’s genome looked at Al tolerance and SbMATE expression. Two transcription factors were identified, WRKY (SbWRKY1) and DHHC-type zinc finger (SbZNF1) on chr 9, that regulate SbMATE expression in a compensatory fashion. As a result, we are developing a molecular toolbox for sorghum Al tolerance combining Al-tolerant alleles of SbMATE, SbWRKY1 and SbSNF1 for more efficient and effective marker-assisted breeding of sorghum Al tolerance.
On acid soils, low phosphorus (P) availability and high soil P fixation is a second major agricultural limitation. The spatial distribution of roots in the soil, a trait called root system architecture (RSA), plays an important role in many rootbased plant traits such as efficient acquisition of water and mineral nutrients under drought and mineral deficiency in soils.
Plants with good root architecture have more adventitious roots, basal root whorls, shallower basal roots, more taproot laterals, and longer, denser root hairs. Research by Dr. Hong Liao at Fujia Agriculture and Forestry University investigated the ideal RSA in soybean, and found that P-efficient soybean lines had a shallow, fibrous root system near the soil surface, where the majority of P is found in the soil.
Our research is developing sorghum varieties with improved RSA for low P soils. In fact, we have already had some improvement by just screening existing germplasm, but obviously this is not enough. We must have systematic improvement of soybean root traits, which can ensure stable adaptation to low P soils.
A 3D RSA imaging system, RootReader 3D, was developed that quantifies a number of different RSA and topology traits. This imaging system was used to identify sorghum lines with superior RSA traits. From these superior lines, Dr. Magalhaes has identified ge -
netic markers that are linked to superior, more P-efficient genes, and has been able to pyramid several of these genes in sorghum to obtain significant (0.25 ton/hectare) increases in yield on low P acid soil field sites in Brazil.
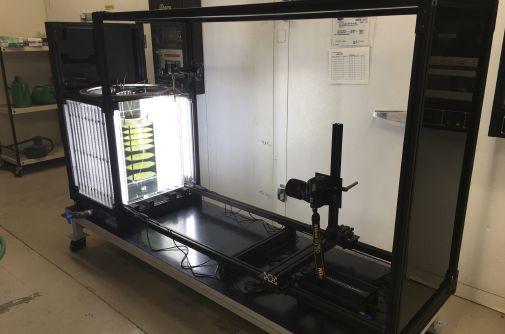
Another area of research is looking at improving drought resistance of agricultural crops. The Target of Rapamycin (TOR) complex plays an important role in plants, including roles in regulating cell proliferation and cell size, plant development, protein synthesis, transcription and metabolism.
Our research has found that overexpression of TOR both in guard cells and throughout the Arabidopsis plant confers a significant increase in plant growth during drought stress. This increased drought resistance is due in part to reduced transpirational loss of water via leaf stomata. This was also associated with reduced stomatal conductance to CO2 into the leaf, which should have negatively impacted photosynthesis. Surprisingly, photosynthetic CO2 assimilation was increased in TOR overexpression lines. These findings demonstrate that manipulation of TOR genes in developing crops can enhance drought tolerance and water use efficiency.
TOR-Expressing Lines Transpire Less Water than WT Arabidopsis Plants During Period of Drought Stress
TOR-Expressing Lines Transpire Less Water than WT Arabidopsis Plants During Period of Drought Stress
On a closing note, the 8th International Crop Science Congress is planned for Saskatoon from June 21-25, 2020. This congress will address basic and applied aspects of plant and crop sciences as they relate to strategies to develop unique, sustainable, agricultural systems having the capacity to support animal and human health, on a global scale, while being mindful of our custodial responsibilities towards the well-being of our planet Earth.
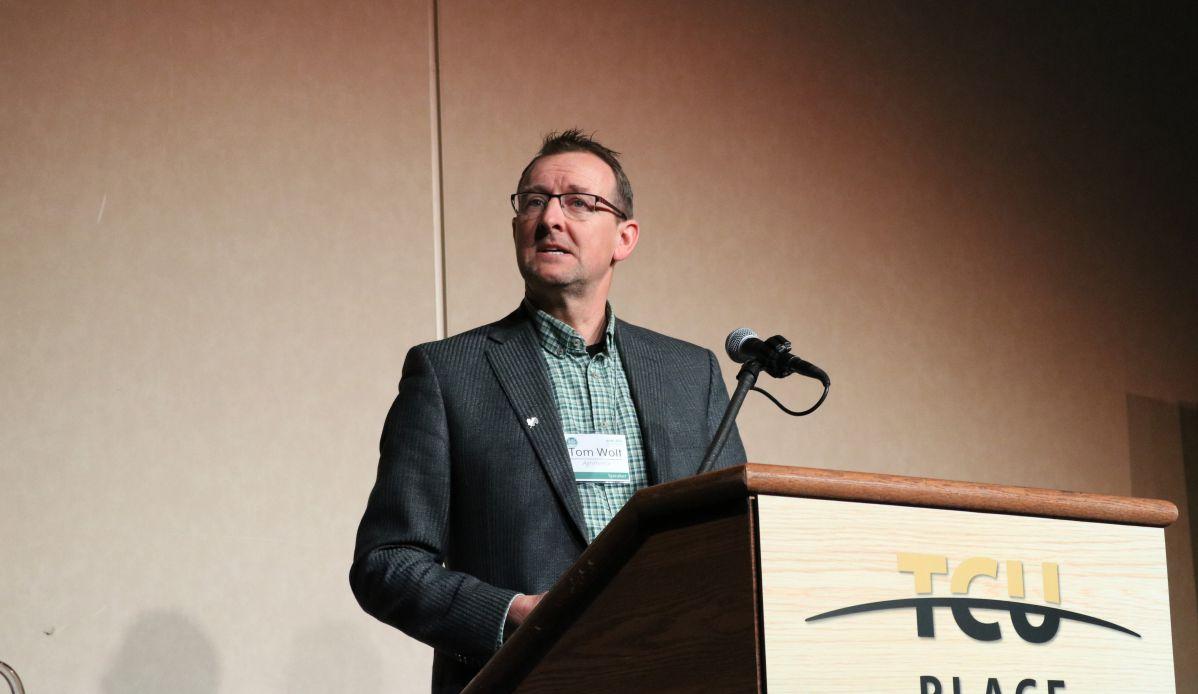
Managing fungicide application with modern approaches.
Presented by Tom Wolf, Agrimetrix Research and Training, at the op Crop Manager Plant Health Summit, February 25-26, 2020, Saskatoon.
First of all, herbicide spraying is easy. There are a large number of modes of action available. Weeds are targeted in wide open spaces with no canopy covering the weed. On the other hand, spraying fungicides into denser canopies is a challenge. Solving this challenge is quite elusive. There are no silver bullets.
We have done a couple dozen studies in a lab environment with actual crop canopies, and monitored where the spray goes in the canopy – the top, middle or bottom. By the time the spray reaches mid-canopy, about 40 per cent of the spray is reaching into the canopy. At the bottom of the canopy, just a fifth of the spray is left. With fungicides, that’s often where the target is. When we look at the variability of the deposit in the canopy, the bottom of the canopy has the highest variability. So, these two challenges, diminishing the dose and increasing its variability as the spray moves into the canopy can really work against us in the fungicide world.
Maximizing fungicide efficacy depends on what principles you are trying to achieve.
It is important to know your target. Fungicides may require whole plant coverage, but in some cases there is a very specific target. Fusarium head blight is one of those, and it’s at the top of the canopy. In many of our pulse diseases, the target is further down.
Knowing the mode of action is also important. Typically, in the fungicide world, most of the popular modes of action are “locally
systemic,” which means they move in the xylem. This means they don’t move towards the growing point. Therefore, the spray must target the part of the plant that requires protection.
A principle that I want to start with is counterintuitive, because it is commonly thought that a finer spray works better with a fungicide because they provide better coverage. But I would like everyone to start with a coarse spray. There’s no harm in using a finer spray, but the reason I’d really like to debunk that whole myth is that there is value in using a coarser spray, and that value has to do with the timing of the operation. Coarse sprays provide a larger window of application, and that is important because spray timing is, in fact, the most critical component of disease control.
After selecting a nozzle that delivers a coarse spray, spray coverage can be fine-tuned with water volume, spray pressure and nozzle angle. This allows modification of the droplet numbers to suit specific situations.
A challenge with disease control is that fungicide labels have generic, feel-good statements that say things like, “Ensure adequate coverage,” or, “adequate and uniform coverage.” There’s only one case in the world of fungicides that I have found that is incredibly specific. It’s the Proline label for Fusarium head blight, where the label makes reference to the forward and backward orientation of nozzles to increase deposition on the wheat head.
What does ensuring good coverage mean? To me, it means mea-
suring it. I like to use water sensitive papers as indicators. They’re easily available locally. Water sensitive paper can help measure droplets per unit area. Percent area covered can be calculated. These measurements infer what is really important. They imply the dose per target or coverage. They can also teach us something about uniformity. Are we getting the same result over and over again in different parts of the canopy or different parts of the field? Uniformity is a very, very important part of efficacy.
There are a couple of tools that can help with measuring spray coverage. In Australia, the GRDC funded the development of an app called SnapCard. With this app, you take a picture of water sensitive paper, and it analyzes an area and provides percent coverage. It quantifies it, and it’s repeatable.
A second tool is from Brazil. DropScope is a scanner that hooks up to your computer or mobile device with a USB port or Bluetooth connection. It reads a one-inch by three-inch water sensitive paper and gives you five or more quantifiable parameters such as droplets per square centimetre, average droplet size, and per cent coverage.
Spray quality is categorized as “fine,” “medium,” “coarse,” “very coarse,” “extremely coarse,” and “ultra-coarse.” For herbicides, spray quality has migrated from fine and medium sprays in the 1980s to extremely coarse and even ultra-coarse now in the era of dicamba herbicide protection against spray drift. Fungicide application has stayed more or less static with medium spray quality.
Fine spray quality may have a large proportion of the droplets as fine droplets – less than 150 micrometres. These fine droplets provide coverage, but they also drift and evaporate. That limits your window of opportunity in using these droplets effectively.
Extremely coarse sprays, on the other hand, have exactly the opposite composition of droplet sizes. They have a large proportion of extremely coarse droplets – greater than 500 micrometres in size. They’re large, but are they providing coverage? They might even be bouncing off the target.
The middle ground has been coarse sprays that provide a reasonable amount of the dosage – 20 per cent in this example – in fine droplets that provide coverage and a relatively small amount of extremely coarse droplets that might not do anything. One of the big moves over the years has been the migration from a medium spray, which drifts too much, to a coarse spray, which is good for


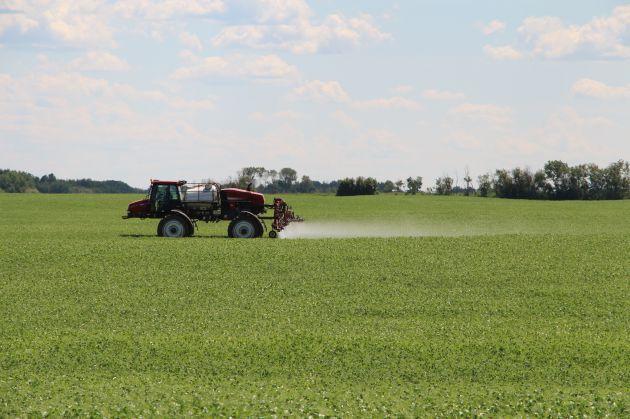
Sclerotinia control
I conducted research on sclerotinia control in canola with Randy Kutcher when he was with AAFC at Melfort. For sclerotinia control, the primary target for fungicide application is the petals and buds in the top of the canopy. But there is a secondary target that
may be important as well, and that is the leaf axil further down in the canopy where the saprophytes decompose the flower petal.
A fine/medium spray from a conventional flat fan nozzle and a coarse/very coarse spray from a TurboDrop air induction tip were compared at 40 and 80 psi, along with a very fine spray produced by a hollow cone nozzle. The research had five site years in the Melfort area in the early 2000s, and found that the two fungicides that were applied significantly reduced sclerotinia stem rot incidence compared to the untreated control. But there was no statistical difference in control between the different spray qualities in the field trials.
In the lab, dye was sprayed onto a canopy of canola. The plants were partitioned into top, medium, and bottom parts and then further separated into petals, buds, leaves, and stems. The parts were washed in solvent, and the dye analyzed to determine the spray deposition on the various parts.
Looking at the total amount of spray retained by each plant, the proportion of spray dye retained by the important targets, petals and buds, did not differ with application methods. This is good news because it means that coarse sprays can be used for sclerotinia control. And there is value in that because you can spray with less drift, under a wider range of conditions, with a better chance of being environmentally friendly.
The lab study looked at the effective boom height comparing 20- and 30-inch heights. Spray deposition did not vary between the heights in the upper, mid and lower parts of the plant.
Three spray pressures of 20, 40 and 60 psi were also compared for spray deposition. Spray pressure is interesting because, traditionally, people believe they can force the spray into the canopy by applying a very high pressure. The fact is that small drops slow down to their terminal velocity within a few inches of leaving the nozzle. In this research, again, there was no difference between the three pressures in deposition in the upper, mid and lower parts of the plant. It was quite clear that increasing spray pressure did not result in greater deposition lower in the canopy.
Based on the research, the ideal application for sclerotinia stem rot control isn’t that different from what’s currently being done. Applying at the correct crop stage has always been important. Single or twin nozzles both work, but there’s really no need to go to twin nozzles in this situation. Coarse to very coarse sprays are going to be adequate. There’s no harm done going to a medium spray, but there’s probably nothing to be gained. A slower travel speed of 10 to 12 miles per hour (mph) is recommended because it is conducive to more uniform application. The boom can be run at medium-to-low height of 24 to 30 inches. I believe any fungicide application should use at least 10 gallons per acre (GPA) – 10 to 15 GPA is the benchmark. High water volumes are a function of crop density. A canola crop growing five to six feet tall could have the flowering region extend well into that canopy, so higher water volumes are important for better coverage.
With Fusarium head blight the primary target is the head, while the secondary target is the flag and penultimate leaf. Research in the lab looked at spray coverage of the head. However, one important factor missing in the lab is wind, so this research shows the best-case scenario.
A single nozzle moving at slow speed of eight kilometers per hour deposited about two-thirds of its spray on the forward side of the vertical target. Almost one-third of the spray was deposited
on the backward side of the head. This was likely from wrapping around to the other side by the smallest droplets.
With a double nozzle at eight km/h, spray is directed forward
Double nozzle, 8km/h
and backward. The same spray volume is still applied. The double nozzle added deposition to the rearward-facing side of the target with most of that from the backward-facing nozzle. That’s very important because fungicides don’t translocate within the wheat head. Both sides of the targeted head have to be hit with the fungicide if you’re going to be successful.
Research also found that greater angled spray produced better
results. Air induction double tips set at 30 degrees from vertical with a coarse spray traveling at 15 km/h produced variable results with 79 per cent of the coverage on the front of the target. When the double nozzles were set at 60 degrees from vertical, the wider angles added spray to both the front and the rear side compared to the narrower spray.
Coarser sprays deposited more on the forward side of the heads than a medium spray. Coarse droplets retain their trajectory, and with the nozzles pointed forward and backwards, the droplets fly in that direction. Finer sprays lose that trajectory.
Probably the most important recommendation is to maintain a low boom height. We compared three boom heights of 30 cm (12 inches), 45 cm (18 inches) and 75 cm (30 inches) with fine,
medium and coarse sprays with double nozzles. Moving from low to medium to high boom height resulted in the overall deposit being cut in half. That’s strictly a function of the droplets still moving forward and backward at the low boom height, but they are no longer doing that with the higher boom heights. There was still a benefit of a coarser spray at all three heights.
Vertical Deposits
Travel speed also had an effect on spray deposition on the wheat head target. Fusarium spray application is the only situation where a faster travel speed consistently provides a better deposit. Moving from five mph to 10 mph increased deposition at the low, medium and high boom heights. Droplets being forced into a forward motion improve the deposition on the vertical target.
Effect of Speed (Vertical Deposits)
Overall, the ideal application for Fusarium head blight control is to apply fungicides with a low boom set at 20 to 24 inches above the canopy, twin nozzles with coarse to very coarse spray quality, travel speed of 10 to 12 mph, and 10 to 15 GPA water volume.
In research with Sabine Banniza at the University of Saskatchewan College of Agriculture and funded by Saskatchewan Pulse Growers, fungicide application was assessed in pulse crops. A conventional flat fan nozzle with medium spray quality, an air-induced nozzle with coarse spray, and a twin nozzle that produced a fine spray quality were compared. Water volumes of 10, 20, and 30 GPA were compared with a conventional 8001 nozzle at varying travel speeds. Partitioning of the spray in the different parts of the plant was assessed.
Surprisingly, the nozzle type didn’t have much impact on spray deposit in chickpeas. Fine, medium and coarse droplets all had similar deposition on the lower, middle and upper parts of the plants.
The impact of water volume on spray deposition varied by canopy type. On kabuli-type chickpeas with a more open unifoliate canopy, there was no real advantage of applying more water to get
through the canopy. But with desi chickpea with a denser, more closed canopy, there was a strong effect with more droplets deposited in the lower canopy with increasing water volume.
When you can’t see the target that you’re trying to hit with a spray, that’s when increased water volume starts to pay dividends. When lentils were all the rage about three or four years ago, many people sprayed their lentils three times, and the third application, when that canopy was closed, was indeed at 30 GPA.
I did some research with an industrial partner and PAMI, and looked at the distribution of the spray in field pea. We looked at spray deposition in the top, middle and bottom of the peas, and at five, 10, and 15 GPA using water sensitive paper. Coverage in the top of the canopy was fairly good at five GPA, but better at higher water volumes. In the mid canopy, droplet density was starting to go down. But at the bottom of the canopy, the droplets are getting very sparse with a low water volume but are possibly still acceptable with the highest water volume.
When you look at deposit density, according to Syngenta’s instructions on water sensitive paper, 80 drops per square centimetre should be the minimum target when using a fungicide. Five GPA didn’t meet that objective; partially met it with 10 gallons, the 15 GPA met that target more completely on field pea.
has to be dealt with. Smaller droplets must be used, or you have to be satisfied with lower droplet density. But low water volume and finer spray risks less coverage and more drift.
With aerial application, droplet density is simply lower because of fine droplets. In fact, it’s difficult to make large droplets from an aircraft because of shear atomization. When too large of a droplet is emitted from an aircraft, there’s a secondary atomization to the air shear, and the big drops in air resistance just break apart, explode, and make a lot of small drops. A lot of counterintuitive things happen in the spray world.
Rotary atomizers are commonly used with aerial applicators. They have adjustable vanes that adjust their rotational speed, and that adjusts their droplet size. They form a deposit that is actually not bad.
We have to be mindful of the variability that’s inherent in aerial spray. There are regions under all aircraft where the deposit is different from adjacent regions. It is an ongoing challenge.
Saskatchewan Pulse Growers funded a study at Saskatoon that I again collaborated on with Sabine Banniza. It compared ground and aerial applications applied within one-half hour of each other targeting aschochyta in chickpea. We did two Headline and two Lance applications.
Sabine did the disease ratings and the disease became progressively worse over the growing season. Fungicide application significantly reduced the disease severity. Ground and aerial application were statistically similar except at the last rating on August 15, but in all likelihood yield would have been determined by then.
Weigh wagon results showed the value of using fungicides to control aschochyta. Yields with fungicide application were almost triple the untreated check. Aerial was slightly less yielding but not statistically significantly. I think that’s very important, and that you can have confidence in aerial application for disease control.
Spray timing is absolutely crucial in helping fungicides work well. With some diseases, the spray window is tight – one or two days – depending on the weather. There is an opportunity cost for not spraying on time. If you have a quarter section and you lose $20 per acre because of that three or four-day delay resulting in higher disease, that hour that it would’ve taken to spray that field is worth $20 x 160. That’s $3,200. That’s why a lot of the work that we’re doing on Sprayers 101 with Jason Deveau is looking at how to get more hours of spray time.
The answer is to improve the efficiency of the operations when you’re not spraying. That means to fill faster, clean faster, and adjust the spraying operation so that you spend more time spraying. An analysis of eight John Deere R4045 sprayers found that when the sprayer engine was running, 45 per cent of the time the equipment was spraying, 33 per cent it was idling (cleaning and filling), and 22 per cent was spent in transport.
The single biggest efficiency improvement that we’ve seen in spraying in the last 10 years is the three-inch pump. Spray time is incredibly valuable and improving efficiencies can pay off.
In the aerial application world water volume is a constraint that
More rotary-winged aircraft are being used in Saskatchewan. At normal flying speeds they are more productive, as they turn faster than a fixed wing aircraft. Even though they don’t have a large tank or a wide boom or a very fast travel speed, they can be more productive. If rotary-winged aircraft fly at slower speeds, the rotary wash can push the spray further into the canopy.
One of the application methods not used on the prairies is air assist. Jason Deveau studies air blast spraying in trees. Air is used to transport small droplets into the canopy. That technology isn’t available for field crops, but perhaps a future aerial application method can deliver that for us.