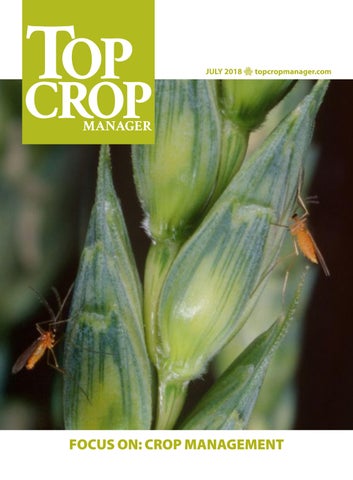
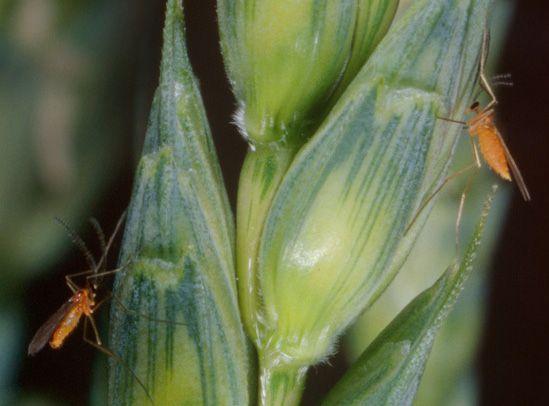
resistance to wheat midge in Canadian wheat varieties.
PHOTO COURTESY OF BOB LAMB.
Several factors contribute to the success of a crop. Some of these variables – such as disease risks and the ever-unpredictable weather – are out of your hands. But others – for example, the specific crop and variety you plant, your integrated pest management strategy and the amount of fertilizer you apply – are in your control, and it’s up to you to make informed decisions to best manage your crop.
However, it’s important to remember what works one year may not be the best option for the following season. Though it’s easy to go back to what’s familiar, those tried-and-true methods aren’t always the best decision.
Top Crop Manager Focus On: Crop Management is the third instalment of our special summer digital series, and in this issue we’ve compiled a selection of stories featuring advice from the experts. You’ll find tips on sustainable fertilizer management from Ross McKenzie on page 11 and an update on new research surrounding soil nutrient budgets on page 14. We also outline some of the tactics corn growers in Manitoba are using to increase yields on page 18.
We hope you’ll draw inspiration from what you read in the pages of this edition and all of our issues, and find the best growing practices that work for you and your operation. And when you do, let us know! You can reach us via email (topcrop@annexweb.com) and Twitter (@TopCropMag). We’d love to hear from you.
Associate
Associate
National
Group
Media
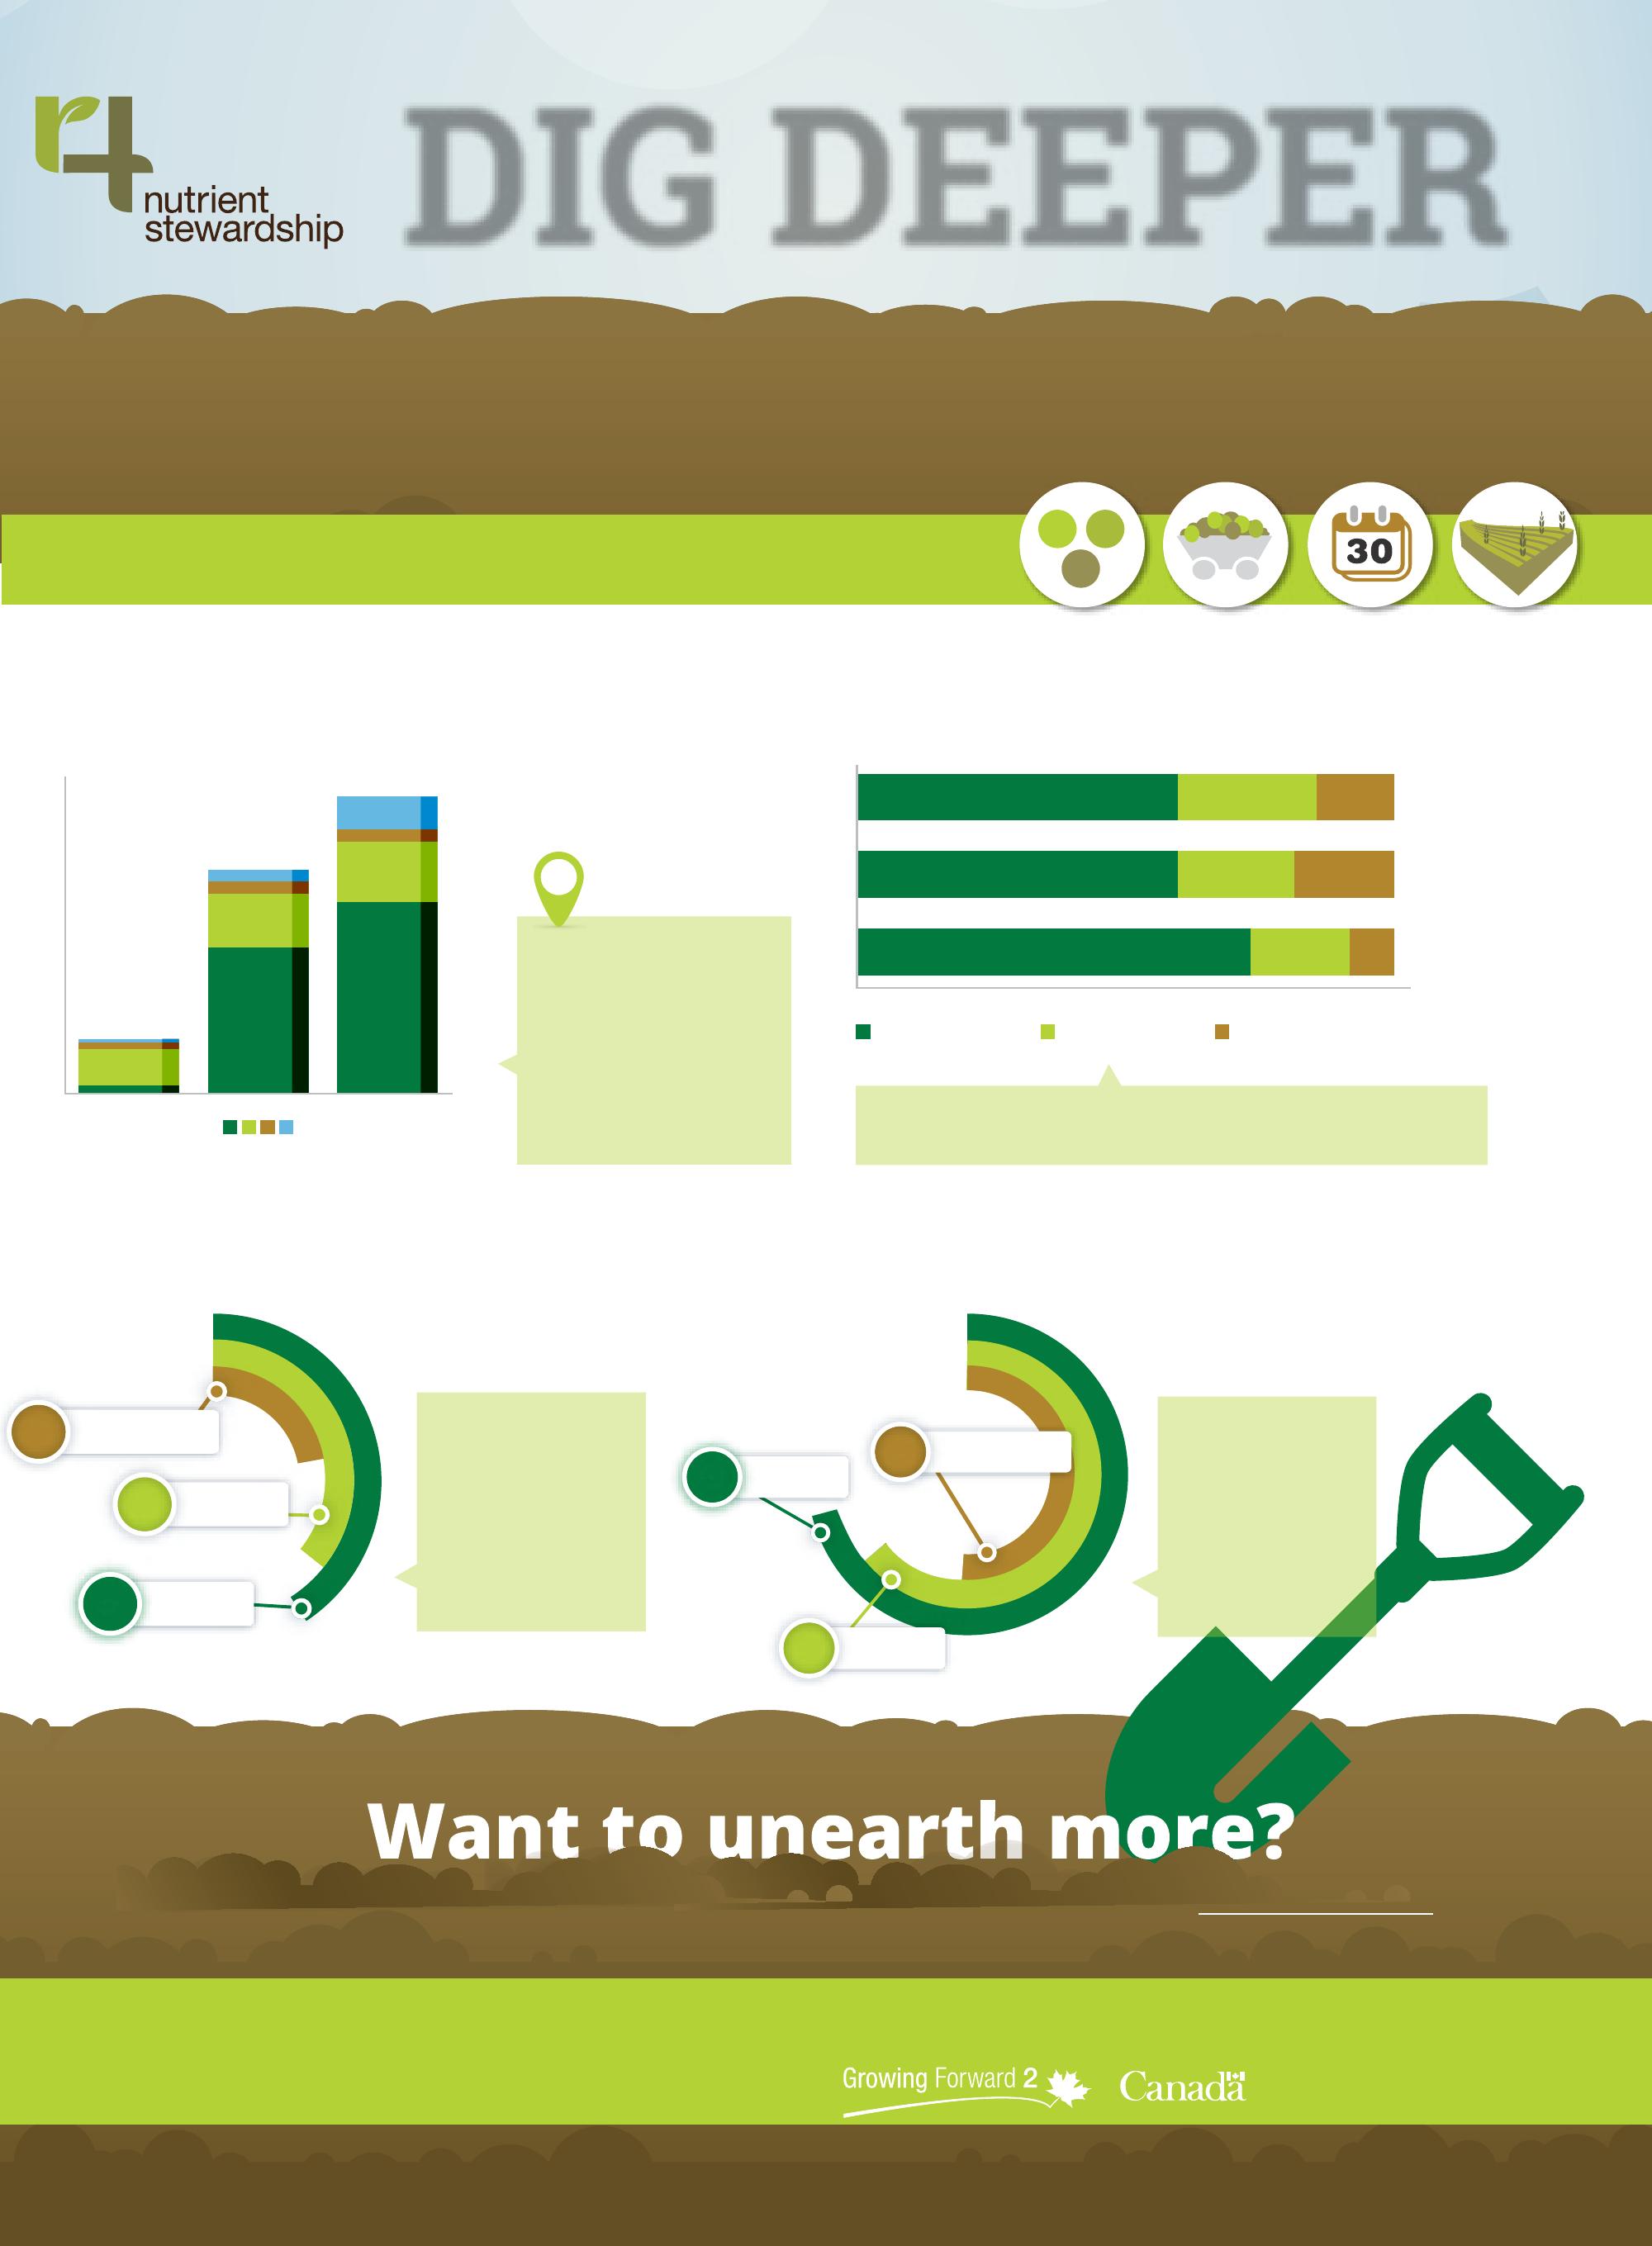
DIG DEEPER
SOURCE @ RIGHT RATE, RIGHT TIME, RIGHT PLACE®
A new 3 year survey has captured data on fertilizer use from 3,292 Canadian growers who have completed the online survey detailing fertilizer use practices on 8.3 million acres of cropland.
Source and Rate
Soil Testing Frequency by Province
Time and Place
This is just a snapshot. More information can be unearthed in the full survey results. Visit www.fieldprint.ca to view the survey summary or request the full report.
Thanks to our supporters for making this work possible: Canadian Canola Growers Association, CropLife Canada, Fertilizer Canada, Grain Farmers of Ontario, Manitoba Pulse and Soybean Growers, and Pulse Canada.
This initiative has been made possible through Growing Forward 2 a federal-provincial-territorial initiative.
CANOLA
CEREALS (SPRING, DURUM, BARLEY) PULSES
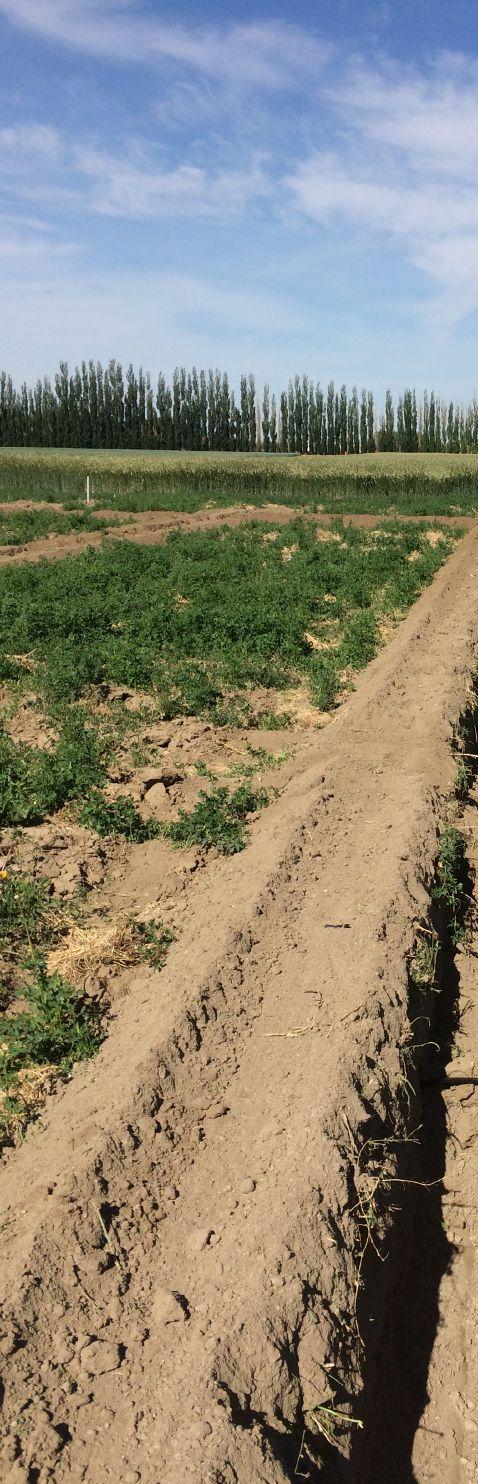
PUTTING THE MOISTURE WHERE IT COUNTS
Subsurface drip irrigation delivers water directly to root systems.
by Julienne Isaacs
In 2013, Lethbridge’s Southern Drip Irrigation Ltd., took farmer Don Plett down to Texas to look at subsurface drip irrigation (SDI) systems in 400,000 acres of cotton.
“That’s when I decided to try it on my own place,” Plett says, who farms near Gem, Alta. “I have a little trouble on my soil getting the water to come up to the surface for germination, so that was one concern I had. But in Texas I saw there was moisture there for germination when it was managed right.”
Plett installed a drip irrigation system on a test plot in 2013, and since then he’s grown wheat, hemp, fababeans and alfalfa seed under drip irrigation. Although only approximately 70 acres of Plett’s land is irrigated using SDI, he says if he didn’t have it, he would be far more stressed.
So far, Plett is one of only a few farmers to adopt SDI in Alberta, but interest is growing.
New research
Leonard Hingley, a soil and water specialist with Alberta Agriculture in Brooks, Alta., has been working on an SDI study for the past two years. His project, which uses an SDI system designed and installed by Southern Irrigation, began as a way to manage irrigation in alfalfa seed.
“We wanted to give alfalfa seed producers an indication of how they could target the crop’s water use requirements,” he says. “This is more difficult with alfalfa seed because you’re trying to stress the plant enough so that it’s producing flowers which in turn increases seed production in the fall, but not stressing the plant so much that it is dying, or irrigating so much that you produce a forage crop.”
That point is just above the wilting point, but isn’t yet known, Hingley says.
The biggest reason Hingley’s team wanted to use SDI was leafcutter bees: sprinklers suppress bee activity and drown bees. “We thought if we could eliminate the impact of irrigation on bee activity, our research would provide a truer response to the irrigation treatments themselves.”
Hingley’s project, funded by Growing Forward 2, completed its second and final year in 2017. Alberta’s Alfalfa Seed Commission is funding an additional two years.
The project looks at the impact of five irrigation treatments on yield, including a full irrigation treatment; irrigation until the end of June; irrigation until the end of June, followed by 50 per cent irrigation; 50 per cent irrigation for the full season; and a dryland check.
In the second year of the study, the largest yield response came from the fourth treatment – 50 per cent irrigation for the full season until cut-off (August 23) – but Hingley
<MAIN: Subsurface drip tape installation in the spring. Photos courtesy of Leonard Hingley.
<LEFT: Drip line is installed first about 12 inches deep, followed by main lines, sub mains and a flush header.
says that producers should be cautious applying these results to their operations until further research can verify these initial findings.
This winter, Lethbridge College and Southern Irrigation are partnering on another, indoor study that will compare SDI systems with various flow rates and durations at different depths in three soil types – sandy, loamy and clay.
Willemijn Appels, Lethbridge College’s Mueller applied research chair in irrigation science, says there are a lot of theories about how water moves around individual SDI emitters, but many unknowns in terms of how to best operate full systems for field crops, especially during hot summers like that of 2017.
“To make the system more representative of water demand conditions in the field, we’ll grow alfalfa in each of the bins. We will measure the patterns of moisture distribution with a variety of soil moisture sensors,” Appels explains. “There will also be ample opportunity to test plant water stress sensors that show operational potential, like thermal infrared cameras.”
Southern Irrigation and their supplier, Netafim, collaborated with the college on design and will help execute the project.
Costs and benefits
Frank Oostenbrink, who manages sales and technical design of SDI systems for Southern Irrigation, says the company has 12 to 15 customers in Alberta’s irrigation districts, but as they continue to invest in research and outreach – the company does three or four trade shows per year, as well as field days –producers are increasingly interested in the technology.
“A centre pivot system is a circle so you’re always losing the corners. As soon as you put in SDI you get those corners,” Oostenbrink says. “As far as the cost of the system goes, it’s double that of centre pivot, but a lot of producers see the potential. You’ll see the value on some crops more than others.”
Hingley says startup costs for producers interested in SDI are high, but there are major efficiency gains. “Guys are interested in saving on energy costs, because running a pivot is really expensive with delivery, transmission and electrical demand charges. If you can save on energy costs you will find some producers making the change to SDI. This doesn’t mean the crop uses less water with SDI, that doesn’t change, but there is an efficiency gain,” he says.
“You’re around 98 per cent efficient, you’re reaching all the corners of the field, and your disease pressures are lower because the canopy isn’t wet.”
Don Plett installed his SDI system with the help of his wife and neighbours, but Southern Irrigation offers installation and maintenance services.
Installation “isn’t rocket science,” Oostenbrink says, but proper installation is critical to ensure a successful system. Drip line is installed first about 12-inches deep, followed by main lines, sub mains and a flush header. “But there’s no such thing as a cookie cutter drip system,” he adds.
The company has just hired an agronomist to help with application of fertilizers through drip lines and give advice on specific crops.
“We’re really excited about it,” Oostenbrink says. “Our goal is to give customers something of value.
IMPACTS OF UNHARVESTED AND OVERWINTERED CROPS
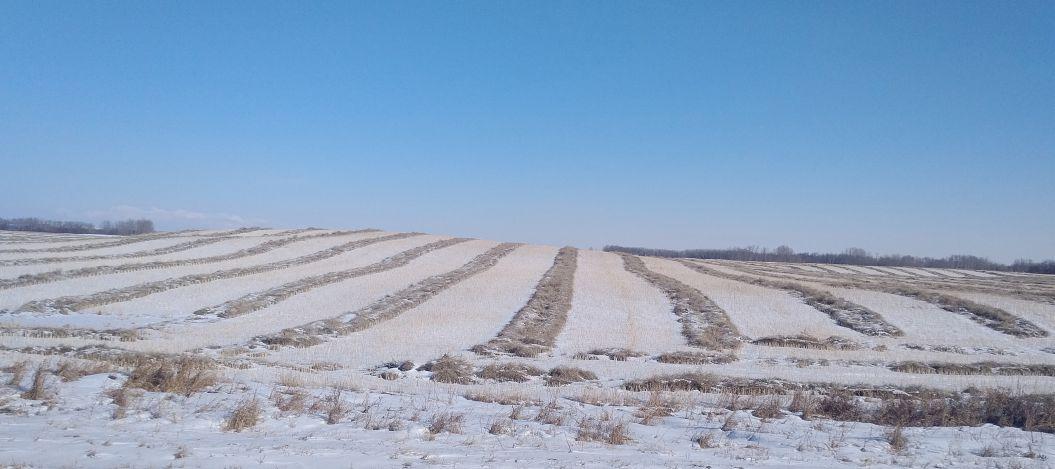
Stats Canada reported 2.5 million unharvested acres in the Prairies at the end of December 2016, with the majority in Saskatchewan and Alberta.
by Donna Fleury
In the fall of 2016, early snowfall and excess moisture resulted in 2.5 million acres of unharvested crop in fields over the winter, primarily in Saskatchewan and Alberta. Although these unusual conditions happen rarely, taking a look back at the impacts on the 2017 cropping season and some of the lessons learned can be useful.
According to Stats Canada, excess moisture in parts of the Prairie region resulted in decreases in crop quality and yields and, as of the end of December 2016, 2.5 million acres remained unharvested. Most of the unharvested acres were in Saskatchewan, reporting 1.3 million insured unharvested acres across the province, and Alberta reporting 960,000 unharvested insured acres, mostly in central, north and Peace regions. In both Saskatchewan and Alberta, crop insurance reports show just over half of the crops were harvested for grain in the spring of 2017. The remaining crops were put to other uses such as livestock feed or silage or grazing, and a portion were abandoned and worked under. The reported payouts for yield and quality loss in Saskatchewan reached $621 million. Alberta reported a total of $94.2 million paid out for 98 per cent of unharvested claims on 800,000 acres considered in production shortfall by mid-August 2017.
“In Saskatchewan, we had crop insurance extensions from across the province in every one of our 21 customer service locations in 2016,” says Darby Warner, executive director of the Saskatchewan Crop Insurance Corporation (SCIC). “The majority of the losses were in spring wheat and canola acres affected by the early snowfall that flattened crops and prevented harvest until the following spring. In some locations, such as Tisdale, Carrot River and Hudson Bay areas, field conditions were too wet to hold farm equipment, making them
inaccessible for spring harvest. Some losses were due to high rainfall and diseases such as fusarium head blight, leaf disease and mold in the Kindersley and Rosetown areas, mostly in lentils, durum and spring wheat.”
Recognizing early the number of farms with extensions on more than 7,000 crops on 1.3 million acres, SCIC brought a team together to develop an extensive planning and communications process to assist farmers in the fall and winter of 2016. “Our goal was to allow producers to manage their farm as a normal business without us interfering,” adds Warner. “We adjusted some of our procedures so the farmers could do their work without waiting for us to get to the farm. We developed an extension communications plan including social media, video messaging and newsletters to industry and producers affected by this. We also made personal phone calls to the farmers to talk about impacts to their individual operations and what their responsibilities were in the process. Crop appraisals including sample grades on those unharvested acres were made in the fall and producers paid upfront so they didn’t have to wait until they harvested in the spring to get paid. If there were any further losses over winter, those adjusted payments were finalized in the spring. We also administer the wildlife loss program and covered any losses over winter, not including disease or quality.”
Overall the main impacts from the overwintered crops were late seeding or an increase in summerfallow acres in 2017. In some areas, conditions were too wet for field equipment, delaying harvest until much later in the season. The good news is there haven’t been any other longer-term agronomic concerns, such as increased disease or pest issues, reported as a result of overwintered crops.
ABOVE: Unharvested 2016 canola crop near St. Paul, Alta., at the end of February 2017.
Clint Jurke, agronomy director with the Canola Council of Canada, says the biggest hiccup for 2017 was that some fields didn’t get seeded in a timely fashion, or remained unseeded because of the overwintered unharvested crops. “We didn’t see anything in terms of diseases or agronomic concerns that were a carryover result of the unharvested crops left overwinter. A few fields didn’t get harvested until June or July, so were they summerfallowed, however planting on fallow generates nice crops the next season. Overall, the results from the overwintered canola crops were better than most had anticipated, with grade and yield losses not as bad as predicted, as reported by the Canadian Grain Commission.”
Canadian Grain Commission special canola quality report and annual harvest sample program
The Canadian Grain Commission (CGC) provides a number of services to producers and industry, including an annual harvest sample program, and other special projects, such as the assessment of the impact on the 2016 overwintered canola crops. In collaboration with industry, researchers setup a special project to assess the impact of snowed-in and over-wintered canola on the quality of the 2016 crop. The CGC asked producers and processors to submit canola samples into December and again into the spring of 2017.
“This project, which involved a lot of different people across the industry, presented an opportunity to address some questions from this special cropping situation,” explains V<1>ronique Barthet, program manager (oilseeds) for the CGC Grain Research Laboratory. “We ended up with about 173 spring canola harvested samples in the project. Although this isn’t a large enough sample to make scientific conclusions, the information provides a good indication of what happens to quality under these cropping conditions. The degradation we saw on this sample size is likely similar to what other producers experienced, and may help with managing under similar conditions in the future.”
The report showed that of the 161 spring canola samples analyzed, 55 were graded Canola, No.1 Canada (34.2 per cent), 41 were graded Canola, No.2 Canada (25.5 per cent), 33 samples graded Canola, No.3 Canada (20.5 per cent) and 32 samples graded Sample (19.9 per cent), respectively. The remaining 12 samples were not analyzed because they were too mouldy by the time they arrived at the lab. The 2017 spring canola was mainly downgraded for damage as the seed hulls showed various
degrees of discoloration (weathering), and once crushed, the canola seed meal showed an orange tint quite different from the usual pale yellow of the seeds, suggesting the seeds were oxidized. All seeds in the lower grade also exhibited an odour, suggesting the seeds were getting moldy or rancid. It is likely that some producers did not send in samples when they determined that their spring canola seeds were of very low quality. Therefore, the true percentage of 2017 spring canola graded Canola, No. 1 Canada, might be lower than what was found in the research project.
The 2016 CGC canola harvest samples were segregated into four harvest times: August to October 2016 (before the snow), November to December 2016 (after the snow), January 2017 (winter 2017) and April to June 2017 (spring 2017). The analyses showed no statistical difference for oil, protein and chlorophyll contents between the four groups of seed samples. “However, we did see a difference in free fatty acid content averages as a result of oxidation and degradation, which were higher in the samples harvested in December 2016, January 2017 and in spring 2017,” Barthet says. “We analyzed a few of the original samples six weeks later, quickly realizing that even stored in our controlled lab conditions, the samples continued to oxidize and degrade, increasing the free fatty acid levels significantly.”
Barthet adds that although its difficult to draw conclusions, the report shows that there can be a big impact on quality when left overwinter. “The increased degradation we saw in the lab means similar degradation is happening in the field, and possibly quicker as it is not under controlled conditions. Therefore, if producers were able to harvest No. 1 or No. 2 canola in the spring, they would be better to sell and move it as soon as possible, as the quality may degrade the longer the canola is stored. Overall, it is important for producers to recognize the importance and value of submitting crop samples to CGC through the harvest sample program and other special research projects, not only for industry but also for their own specific operation.”
The CGC Harvest Sample Program is a long-standing voluntary and free program for Canadian grain producers. Producers are provided with grade and quality information, which is not only useful for selling grain, but also for understanding the grade and quality in unusual circumstances such as the unharvested 2016 crops and settling insurance claims. About 6,000 producers are currently signed up, and in 2017, CGC tested 14,000 samples of various commodities, mostly from Western Canada.
“Once producers are signed up, we send out a harvest sample kit annually for the crops requested,” explains Twylla McKendry, chemist, analytical services, at the CGC Grain Research Laboratory. “Producers take the samples at harvest, put them in the post-paid envelopes provided and send them to our lab. Once received, samples are graded and analyzed, with results available usually within five to ten business days. In 2017 we started an automated email of results process, which means those signed up with an email address receive an email with the results the day the analysis is completed. Producers benefit from receiving an unbiased third party assessment of the grade and quality of the grain they have on their farm and in their bins. Some producers also use the program to compare different varieties they may be growing on their farm. The information is useful to producers so they know what they have when they go to sell their grain, including any degrading factors such as frost, disease or insect damage. They are better prepared to address grade and quality questions from buyers. Producers not only get their individual crop information, they are also contributing to the overall annual Canadian Crop Quality assessment.”
Producers can send in the samples anytime during harvest up until November 1. However, earlier is better for the CGC; for example, wheat crop composite samples are developed in mid-October for extensive milling, baking and quality analysis. This information is used to provide information on the crop quality and grading, which is important for outgoing crop missions to the various export markets. McKendry adds that during harvest, quality factors such as wheat protein are updated weekly on the website, something that international buyers are interested in and watch closely. The overall Canadian harvest and export quality results are published and available online.
“We encourage producers to sign up and take advantage of this program,” McKendry says. “It is important that producers submit samples annually, whether they have a good quality crop or a poorer quality crop, so we can understand the quality and grade of our Canadian crops every year. This also helps the CGC research team to find new uses and markets for Canadian grain, improve grading and other factors and address specific industry concerns, such as canola quality from the unharvested 2016 crop special project.”
Producers can either signup online or call the toll-free number.
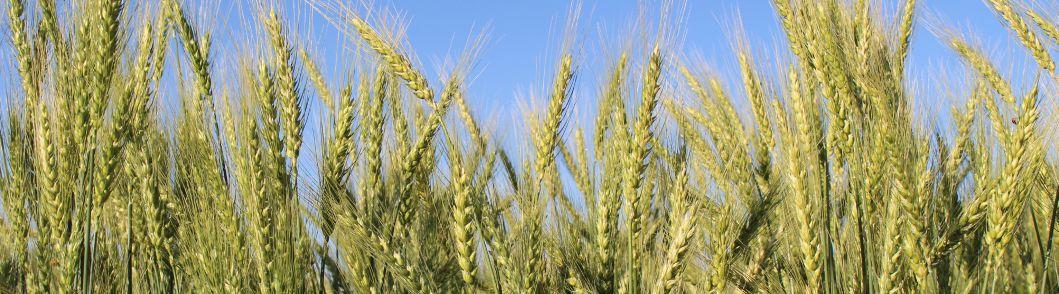
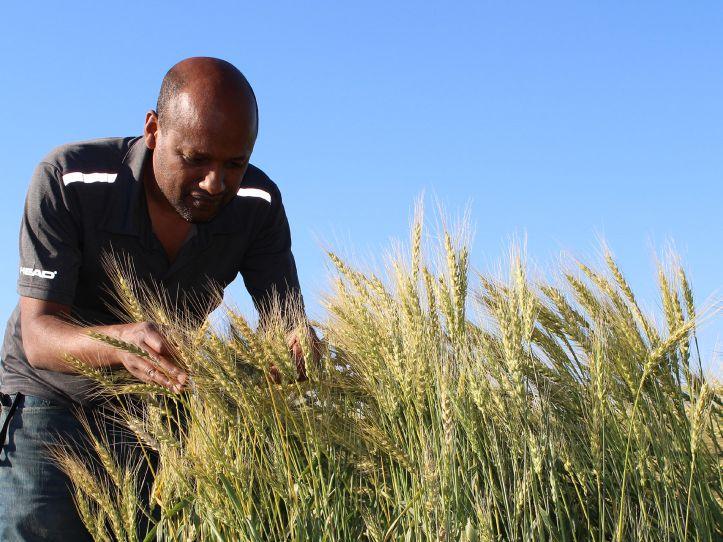
STRENGTHENING RESISTANCE TO WHEAT MIDGE
Efforts are underway to ensure western Canadian wheat continues to have effective resistance to this major pest.
by Carolyn King
Without resistant wheat varieties, wheat midge would be causing about $60 million in damages per year on the Canadian Prairies, according to Curt McCartney, a research scientist with Agriculture and Agri-Food Canada (AAFC). “There is a strong incentive to have resistant varieties for farmers,” he says. McCartney, who is located at AAFC in Morden, Man., and Alejandro Costamagna, assistant professor in the department of agriculture and food sciences, entomology, at the University of Manitoba, are tackling the challenge of maintaining and enhancing wheat midge resistance from some innovative angles.
Known as the orange wheat blossom midge (Sitodiplosis mosellana), this little orange fly – about half the size of a mosquito – is a big pest. The larvae feed on wheat kernels, causing downgrading and yield losses. Resistant wheat varieties are the key tool for managing wheat midge; other tools include crop rotation, insecticide application, and a parasitic wasp (Macroglenes penetrans).
The first Canadian varieties with wheat midge resistance became commercially available in 2010. Now, over 20 Canadian spring and
durum wheat varieties have this trait. It is more effective in spring wheat than durum, but all the varieties marketed as being tolerant to wheat midge rely on a single gene called Sm1.
“When a variety has this Sm1 gene, it will kill wheat midge larvae once they start feeding on a wheat kernel. This type of resistance is called antibiosis. The larvae die when they are very tiny and they don’t cause much damage to the kernel so there is negligible downgrading at the elevator and yield loss is basically zero in spring wheat,” says McCartney, who specializes in cereal genetics and the development of DNA markers. “However, we’re very concerned that Sm1 will become ineffective over time. Similar insect resistance genes in wheat have become ineffective once the varieties are grown on very large acres because the insect eventually adapts to the presence of the gene.”
One crucial strategy to help prolong the effectiveness of Sm1 is already in place in Canada. “The technique developed and implemented by industry is sometimes called ‘refuge in a bag’ or an interspersed
ABOVE: Researchers are working to strengthen resistance to wheat midge in Canadian wheat varieties.
PHOTO COURTESY OF BOB LAMB.
refuge system,” Costamagna says. With this method, each midge-resistant wheat variety is sold as a varietal blend, where 90 per cent of the seed in the bag is a midge-resistant variety and 10 per cent is a midgesusceptible variety. The susceptible 10 per cent is called the refuge.
The refuge ensures that some midges in the wheat field are not exposed to Sm1, so there is less selection pressure for midge strains that can overcome Sm1, which are referred to as virulent strains. “The refuge allows some susceptible midges to be maintained in the wheat field, and the susceptible midges can mate with virulent midges. As a result, it takes longer for the virulent midges to become the dominant strain in the population,” Costamagna explains. “The refuge also helps maintain populations of the parasitic wasp that attacks the midge. The parasitoids by themselves don’t completely control the midge, but they certainly contribute to keeping the midge population down.”
However, Costamagna cautions, “While the refuge-in-a-bag method will extend the efficacy of the Sm1 gene, we know from many other pests that insects will adapt to the genetic resistance in plants.”
Research efforts also involve working with breeders to check for Sm1 in their candidate varieties. “AAFC and the University of Manitoba have an ongoing collaboration to test wheat lines in the western Canadian co-operative variety testing system to see whether or not they have Sm1,” McCartney explains. “The breeders collect samples of wheat heads from their yield plots across the Prairies and send them to our lab at the University of Manitoba. The wheat heads are examined under a dissecting microscope, and we classify the kernel damage as being consistent with either a susceptible wheat or a resistant wheat.”
The Sm1 gene’s presence in North American wheat germplasm has not been completely tracked from its origins in European winter wheat varieties and because of this it can arise in unexpected places. For example, through the co-op testing, researchers found a number of soft white spring wheat lines from the Lethbridge breeding program that had Sm1 even though the program had never deliberately made crosses to bring Sm1 into its lines.
“It’s a significant issue because, if you don’t know the gene is present in a variety, then the seed would not be packaged in a varietal blend when it goes to farmers,” McCartney notes. These days all candidate wheat varieties are tested to see if they have Sm1.
Among the varieties with Sm1, some have stronger resistance than others. For example, previous research discovered that this gene functions better in the variety Shaw than in other Sm1 spring wheat varieties, like Goodeve. So, McCartney is looking into the genetic differences between Shaw and Goodeve to understand why Shaw’s resistance is more effective. The results from this work could help breeders develop other varieties with improved Sm1 functionality.
McCartney is also working on DNA markers for Sm1. A DNA marker is a sequence of DNA that is associated with a particular trait, in this case wheat midge resistance. “The DNA markers allow breeders to select for Sm1 in the absence of the insect in the nursery. In any given year you may or may not have wheat midge just because of natural fluctuations in the insect population,” he explains.
“The markers also give the breeders greater ability to track the inheritance of Sm1 in their breeding program. As well, once a breeder has extracted DNA from different plants in the breeding program, the DNA can also be tested for markers for other important genes at the same time.” He adds that a skilled technician can extract and test DNA from about 200 samples in about eight hours, so using DNA markers is much more efficient than having to take weeks or months to grow seeds into plants and test them for the traits of interest.
A DNA marker is usually near the gene’s location on the
chromosome, but the marker may not actually be part of the gene so it might sometimes predict the gene’s presence when the gene isn’t actually there. That has been the case with the Sm1 markers, so McCartney and his colleagues have been working to make more precise markers.
“There seems to be a lot of mixing and matching of the DNA in the area of the chromosome where Sm1 is located, so even markers that are fairly close to the gene are not always associated with the gene. However, the closer you get to the gene, the more associated the marker will be with the trait. So, we are working on getting as close as possible to the gene,” he explains. “We’ve gotten very close now, and through collaboration with our colleagues at the University of Saskatchewan, we’ve identified a DNA marker that we believe is very predictive.” University of Saskatchewan wheat breeders are already using this new marker.
McCartney is searching for additional resistance genes that are similar to Sm1. “To do this, we are testing wheats that have been collected from different parts of the world, from different collections like AAFC’s Plant Gene Resources of Canada in Saskatoon. We grow the wheats in field trials where wheat midges are present, and we dissect the spikes to see if there is any evidence of resistance.”
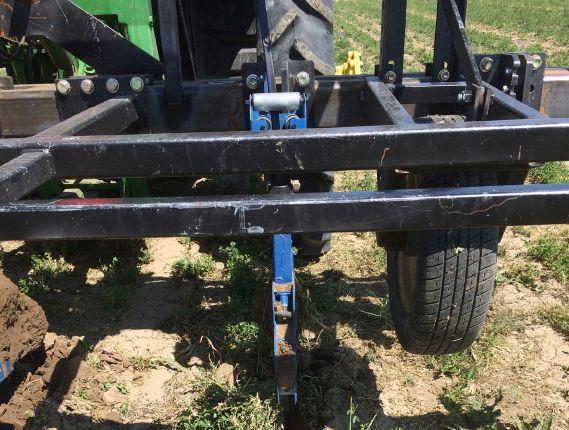
To help in this and other wheat midge studies, McCartney’s group has set up a small field with conditions that increase midge numbers. They have split the field in half and use a two-year chemfallow/wheat rotation on each half, so that every year half of the field is in wheat plots and half is in chemfallow. “So, the previous year’s wheat stubble is next to the current year’s wheat, and the insect only has to fly a very short distance to go from the previous year’s wheat to the current year’s wheat.”
McCartney and Costamagna are investigating another resistance mechanism called oviposition deterrence (egg-laying deterrence). “This mechanism can reduce egg laying by female wheat midges that land on the wheat spike by about two-thirds, compared to a susceptible plant; however, the amount of the reduction differs quite a bit between varieties,” Costamagna says. In at least one wheat variety, the trait also causes the female to lay eggs farther from the florets, so the tiny, newly hatched larvae have to travel longer distances to feed and have a greater risk of desiccation.
A long-term goal in this research is to combine both oviposition deterrence and Sm1 in wheat varieties. “This could help achieve higher control of the midge, but more importantly, it could further delay the wheat midge’s adaptation to resistant varieties, since it is much more difficult for a pest species to adapt to two separate genes with different modes of action,” Costamagna explains.
His group is currently exploring how oviposition deterrence works. “We know chemical volatiles [compounds released by the plant] are involved in the deterrence processes, and we are focusing part of our efforts to determine their chemical identities. Once we know their identities, we can infer the chemical pathways involved and perform a more targeted selection for the wheat genes involved in oviposition deterrence.”
Costamagna is also collaborating with McCartney on extensive field trials to identify sources of oviposition deterrence in different cultivars. Oviposition deterrence seems to be less effective than Sm1, but possibly breeders could make it more effective by crossing different wheat lines with the trait. “We are looking for markers for oviposition deterrence in both spring and durum wheat,” McCartney notes. “We have good sources of the trait in spring wheat – the variety Waskada carries this trait and a few varieties from the U.S. have it as well. In durum wheat, two old unadapt lines have the trait. We’re trying to understand how many genes are involved in the trait and developing markers for that resistance in these different sources of the trait.”
PESTS AND DISEASES
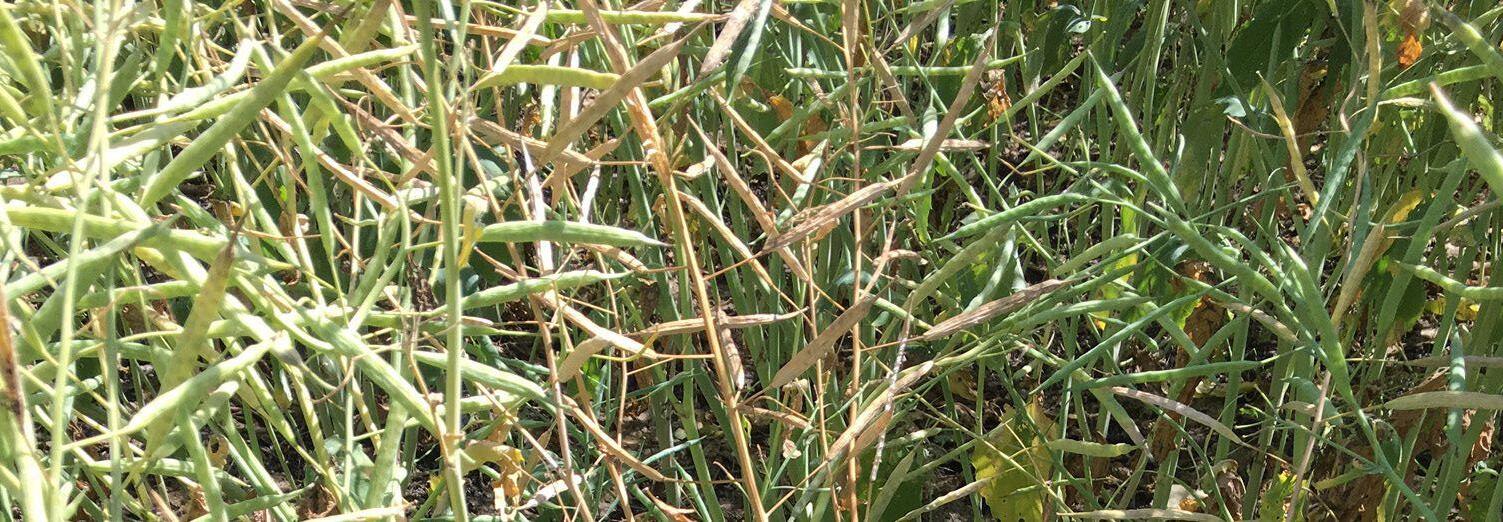
BLACKLEG CONTROL STRATEGIES
Scouting is the foundation of blackleg management.
by Bruce Barker
Blackleg disease is on the rise.
Research scientist Gary Peng, with Agriculture and Agri-Food Canada (AAFC) in Saskatoon, says tighter canola rotations have meant an increase in virulent races of the blackleg pathogen. However, properly identifying the disease through scouting will help canola producers assess their risk of blackleg on each field to help guide them when selecting blacklegresistant hybrids.
Scout for the disease
“Producers need to first scout their crops for the disease and know how to identify it. If they are able to find significant levels of the disease they then need to make sure they are growing a R/MR variety and look at extending their crop rotation,” says Justine Cornelsen, Western Manitoba agronomy specialist with the Canola Council of Canada (CCC) at Onanole, Man.
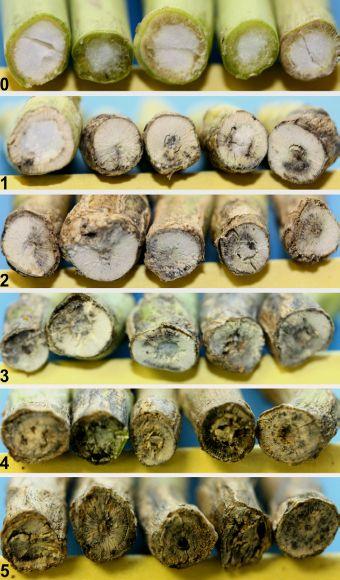
The best time to survey a crop for yield loss from blackleg is just prior to swathing or straight cutting. Pull up at least 50 plants in a “w-pattern” starting at field’s edge. Cut the base of the stem/top of root and look for blackened tissue inside the crown of the stem.
Peng developed a pictorial guide to help farmers assess the level of disease. His Blackleg Field Rating Scale runs from zero
to five and helps provide an indication of the severity of the disease.
“If you don’t have major blackleg damage, there’s no urgency for you to switch between resistance groups right away,” Peng says.
Assess your risk
The Blackleg Steering Group (BSG), chaired by the CCC, has been working to help producers reduce the impact of blackleg. Previously a risk assessment matrix was used. The matrix is being discontinued and a simplified, step-bystep procedure is being developed for managing the disease.
Cornelsen says the main recommendations are a continued emphasis on crop scouting and lengthening the crop rotation for managing blackleg. Rotation of different R-gene groups needs to occur when there are significant blackleg levels within a field.
“We recommend that producers monitor crops yearly to determine if blackleg levels are changing. If blackleg is not an issue, there is no need to rotate your variety to a different group,” Cornelsen says.
Peng cautions that resistant-gene rotation isn’t a silver bullet. “In reality over 90 races have been detected. That means with every known resistance gene, there is at least one virulent isolate out there that would be able to overcome the resistance right away,” he says.
“Therefore, other management practices, including crop rotation and disease scouting, should be diligently conducted. Many of our varieties have shown a level of background resistance against blackleg, which is of great value to blackleg management on the Prairies for most of the years.”
ABOVE: Blackleg is increasing on the Prairies.
SUSTAINABLE FERTILIZER MANAGEMENT
By fully understanding the effects of fertilizers, farmers can ensure they are used responsibly and sustainably.
by Ross McKenzie PhD, P. Ag.
Developing sustainable cropping systems is complex and must integrate the management of soil, water, nutrients and various pest management practices.
The agricultural cropping systems in Canada rely heavily on commercial fertilizer inputs to optimize crop yields and to replace nutrients removed from soil. Canadian crop production would decline by more than 50 per cent in just a few years without the use of commercial fertilizers.
Commercial fertilizers increase crop production, which contributes to increased organic matter (OM) addition to soil. Increased soil organic matter content increases soil quality. It’s important to fully understand the potential positive and negative effects of fertilizers on soil, water and air.
Soil quality
Maintaining or improving soil quality is an important part of sustainable crop management. Soil quality refers to the long-term ability of soil to function in order to sustain plant and animal productivity, maintain or enhance water and air quality and support
human health and habitation. In other words, a cropping practice we use today would be sustainable if it was used for the next 200 years without negative impacts on soil, air or water quality. Indicators of soil quality include soil OM level, total soil nutrient levels, soil nutrient turnover rates, microbial activity and abundance and various physical and chemical characteristics, such as soil pH.
All farmers should monitor the quality of soils to assess the long-term effects and impacts of their cropping practices. Generally, conventional agricultural practices over the last century have resulted in declines in soil quality. However, more recently, more sustainable cropping practices like continuous cropping, reduced tillage, direct seeding and modest commercial fertilizer use to replace soil nutrients have all promoted soil quality improvement.
Sustainable nutrient inputs
Nitrogen (N) and phosphorus (P) are the two most commonly used fertilizers, followed by potassium (K) and sulphur (S). All
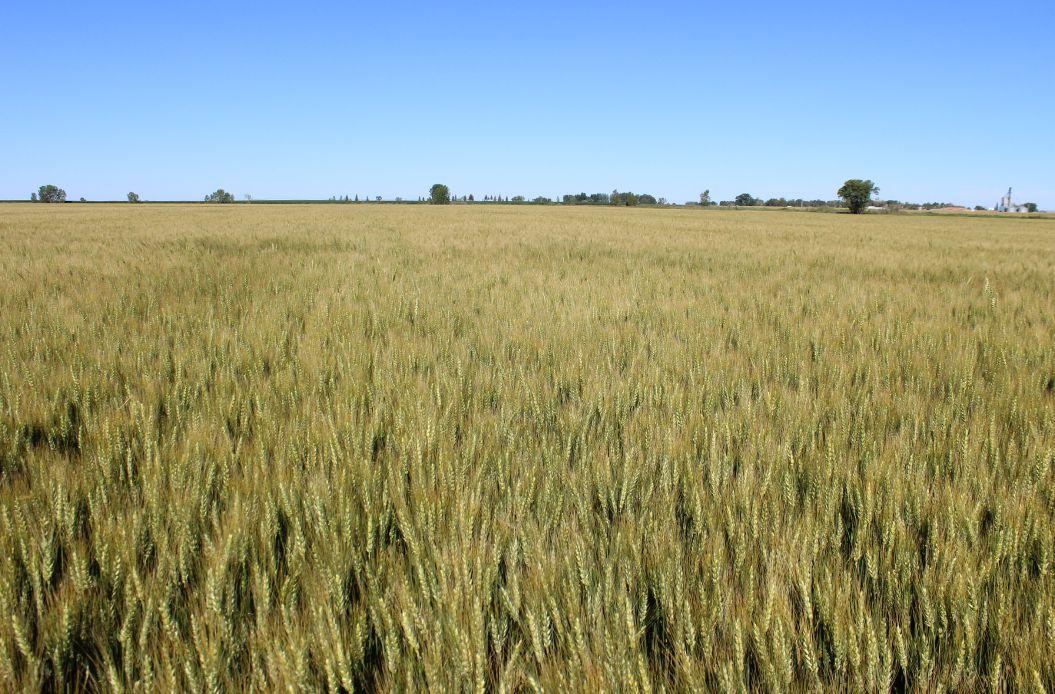
ABOVE: An adequately fertilized spring wheat field.
PHOTO BY ROSS MCKENZIE.
commercial fertilizers require production and transportation. Nitrogen fertilizer can be fixed from the air with energy, as the main production cost. Other nutrients must be mined and processed into soluble, plant available forms.
World abundance of P and K is finite. Availability of P and K fertilizers likely will not be a concern in our lifetimes, but the International Plant Nutrition Institute estimates world reserves of rock phosphate will only last about 200 years, and in the United States, reserves may be exhausted in less than 25 years. World reserve estimates for K project they will last for more than 300 years. For agriculture to be sustainable in the long-term, we must think about how we can conserve fertilizer nutrient sources for future generations. We must make the best use of our limited nutrient sources and ensure nutrients are applied to crops with the highest efficiency.
Evaluating nutrient sources
Commercial fertilizers, animal manures and nutrients released from soil organic matter are common plant nutrient sources for crops. All plants take up nutrients in inorganic form; plants cannot differentiate whether nutrients come from commercial fertilizer or organic matter breakdown. For example, plants cannot differentiate between nitrate (NO3) released from organic materials versus from commercial fertilizers. However, the timing of nutrient release varies greatly among commercial fertilizers, manure and organic matter breakdown, which is important from a plant requirement standpoint.
Most nutrients in commercial fertilizers are usually in soluble, inorganic form and are either available for plant uptake after application or become available within a few weeks of application. Immediate availability of a nutrient can be beneficial to a crop providing a “pop up” effect to help the crop off to a healthy start after emergence. Starter fertilizer with or near the seed at germination can be very beneficial when nutrient availability is low in early spring, or when soil is cool, nutrient availability is reduced and OM decomposition rates are slow.
Fertilizers are often applied before or at the time of planting, when the crop does not need the quantity of nutrients applied. This can
decrease fertilizer use efficiency and possibly contribute to nutrient leaching, runoff problems or nutrient losses to the atmosphere. In recent years, new commercial fertilizers have been developed with slow-release characteristics to more closely match nutrient release with crop nutrient uptake patterns. Slow-release fertilizers or nutrients from organic materials can be beneficial, providing a more continuous, low concentration of nutrients throughout the growing season so a crop takes up what it needs as nutrients become available. Organic materials must undergo decomposition by soil micro-organisms, which takes time. Additionally, the release rate is affected by the type of organic matter, soil biological activity and soil and environmental conditions – particularly moisture and temperature.
The various types of fertilizers used by farmers and when and how they are applied can have profound and long-lasting effects on uptake efficiency by crops, as well as environmental effects on soil, water or air quality.
Fertilizer effects of soil pH
Soil pH is a soil quality factor farmers should monitor over the longterm. Soil pH is a measure of hydrogen (H+) and hydroxyl (OH-) ion concentration in soil. It refers to the acidity (low pH) or alkalinity (high pH) of soil and is measured in pH units. Ideally, soil pH should be between 6 and 8. Some commercial fertilizers contribute to acidification of soil. Lower soil pH can reduce availability of some plant nutrients, such as phosphate. Lower pH will reduce the viability of nitrogen-fixing rhizobium bacteria, which in turn will affect production of N-fixing pulse crops and legume forages such as alfalfa. As soil pH declines, aluminum and manganese in soil become more soluble. A drop in pH can result in an increase in soluble aluminum and manganese, which can be toxic to plants and will reduce crop yields. Aluminum stifles root growth, which restricts access to water and nutrients.
Nitrogen fertilizers are commonly used in Canada and contribute to soil acidification. Fertilizers of greater concern include urea [CO(NH2)2], anhydrous ammonia (NH3), mono-ammonium phosphate (NH4H2PO4), ammonium sulfate [(NH4)2SO4], urea ammonium nitrate (a liquid mixture of urea and ammonium nitrate)
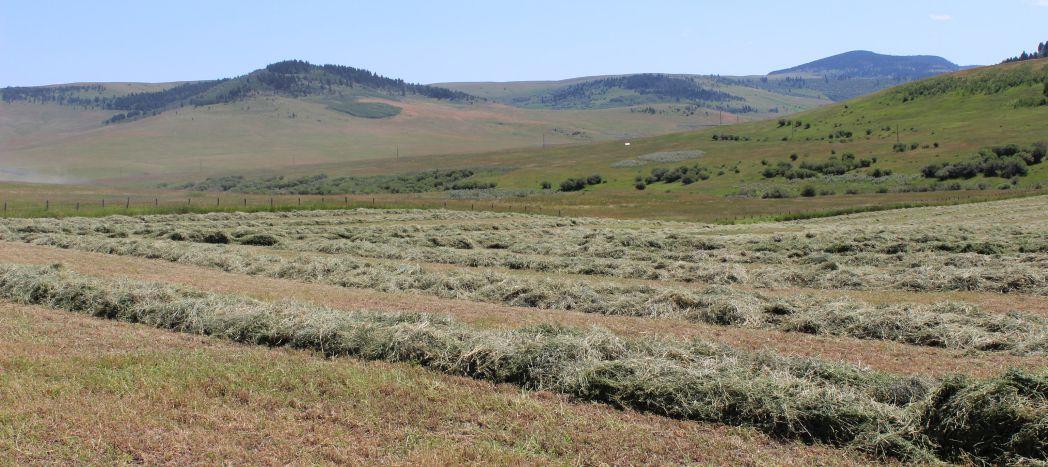
ABOVE: An adequately fertilized hay field.
PHOTO
and ammonium polyphosphate (NH4PO3). Other fertilizers such as elemental sulphur (So) are also acidifying. As the N fertilizers undergo conversion to nitrate (NO3) , H+ ions are released into the soil solution, causing soil pH to decline. The pH of Prairie soils has been declining over the last 20 to 30 years, primarily due to repeated N fertilizer application, particularly in no-till cropping systems. Soil pH decline has been most notable in the zero- to three-inch depth in fields that have been in no-till. With continued N and S fertilizer use, soil pH will gradually decline over time.
Fortunately, significant decline in soil pH has not severely affected soil productivity in most areas across Canada – yet. All farmers need to closely monitor soil pH change. As pH approaches 5.5 or less, action may be necessary.
In no-till fields with a soil pH of less than 5.5 in the zero- to three-inch depth, but with a soil pH of greater than 6.5 in the threeto six-inch depth, cultivating to mix the zero- to three and three- to six-inch depths may rectify the problem for up to 10 years. However, if soil pH is less than 6 in the three- to six-inch soil depth, using tillage to mix the two layers may have limited benefits.
The most common and effective practice to raise soil pH is applying agricultural lime (calcium carbonate). Liming is an expensive and time-consuming process. To determine the correct lime rate needed to raise soil pH to 6.5, have a soil test lab do a lime requirement test. The solubility of lime is relatively low, so when it’s applied to the soil surface, it must be very well incorporated to react with soil and effectively raise soil pH over a few years.
In agricultural regions where acidic soil is becoming an increasing concern, farmers will need to become more proactive to monitor soil pH and deal with soil acidity.
Fertilizer effects on the atmosphere
Nitrogen fertilizer can be lost to the air by denitrification and cause serious environmental concerns. Denitrification is the reduction of nitrate-nitrogen (NO3-N) to nitrous oxide (N2O), which is lost to the atmosphere. One molecule of nitrous oxide has the same negative greenhouse gas effect as almost 300 molecules of carbon dioxide.
Soils that are warm, saturated with water and have nitrate present are the most prone to significant denitrification losses. Denitrification occurs more commonly on medium- and finetextured soils. When soil pores are filled with water, displacing air from the soil, soil micro-organisms strip off the oxygen from nitrate, converting it to nitrous oxide. Considerable soil nitrate-nitrogen can be lost due to denitrification. For farmers, denitrification means economic loss of nitrogen fertilizer and crop yield loss. For society, denitrification means negative effects on air quality and the
environment.
Farmers can be very proactive to reduce denitrification on their farms, using various types of products to slow down N fertilizer release or using slow-release N fertilizers, such as environmentally smart nitrogen (ESN). Nitrogen fertilizer rates, timing and placement can all be used to help minimize N loss from soil. For example, N fertilizer should not be fall-applied to areas subject to saturated soil conditions in the spring or to low-lying land subject to wet spring conditions. Because of possible denitrification losses, it is generally recommended that fall-applied nitrogen be banded in the ammonium form and applied as late as possible once the soil is cold so the nitrogen remains in the ammonium form. Denitrification losses do not occur if the fertilizer nitrogen remains in the ammonium form.
Using summerfallow in a cropping system is not advised, as the available N is present in the nitrate form and quite vulnerable to losses under excess moisture conditions.
Fertilizer affects water quality
Leaching of nitrate nitrogen or sulphate occurs when excess water moves soluble, mobile nutrients from the surface soil, through the root zone and down into groundwater. When leaching occurs, nitrate-N and sulphate-S are lost from the root zone, reducing the utilization of N and S by crops. Excess precipitation will cause leaching anytime from early spring to late fall, particularly in sandy soils. Leaching of nitrate into groundwater has human and livestock health concerns. When nitrate is higher than 10 parts per million (ppm) in groundwater, it is unacceptable for human consumption. Fertilizer management practices used to prevent denitrification are often applicable to prevent leaching, such as slow-release N products and fertilizers.
Nutrients in runoff water from farmland can seriously affect surface water quality. N and P fertilizers can significantly contribute to contamination of surface waters. Soluble nutrients and nutrients attached to sediments can be carried in surface runoff. Nutrients in organic matter carried into surface water will also negatively affect surface water quality. The result is eutrophication. Overgrowth of aquatic plants caused by excess nitrates and phosphates results in a shortage of oxygen in the water, leading to death of aquatic life. The United States Department of Agriculture notes one pound of phosphate in surface water will contribute to the production of up to 500 pounds of blue-green algae.
On-farm fertilizer management practices are critically important to minimize nutrients in surface runoff and make our cropping practices more sustainable in the long-term.
THE MANY BENEFITS OF SUSTAINABLE NUTRIENT MANAGEMENT
Sustainable nutrient management practices must be the goal of every farmer. Sustainable practices:
• Conserve our fertilizer resources for future generations.
• Improve soil quality over time.
• Can reduce farm inputs and costs.
• Minimize negative effects of fertilizers on air and water quality.
• Ensure Canadian farms are economically viable.
• A range of sustainable cropping practices will need to be developed to ensure more efficient use of fertilizer resources for longterm sustainable crop production across Canada’s diverse soil and agro-ecological regions.
BUILD A SOIL NUTRIENT BUDGET FOR YOUR ROTATIONS
Researchers at the University of Manitoba are developing a new tissue test that can help producers balance the nutrients in their fields over the course of their crop rotation.
by John Dietz
Understanding soil nutrient dynamics in a field is about more than numbers, and a new approach, using a spreadsheet with built-in formulas and a new bioassay, is intended to address some of the problems with conventional soil test numbers.
“We look at it – budgets for soil nutrients – as a piece of the puzzle for understanding nutrient dynamics,” says Joanne Thiessen Martens, an agricultural research technician in plant science agronomy at the University of Manitoba. For about 12 years, she has worked on soil nutrition and organic production.
In essence, financial budgets are about cash-in and cashout. A conventional nutrient budget works in a similar way, covering inputs and outflows over a single growing season for a field or even the whole farm.
But Thiessen Martens and her colleagues have used a Microsoft Excel spreadsheet to develop a rotation-based nutrient budget to address the shortcomings of a single-season budget.
The rotation-based nutrient budget and bioassay tools are currently being piloted by about a dozen agronomists working mainly with organic farmers across the Prairies. They expect to release the tools for general use within the next year or two.
Budget details
The direct appeal is for organic production planning, where growers routinely promote healthy soil biology. It isn’t a planner to tell them what inputs they need for the year, but it will guide them in that planning. The tool considers all the inputs and outputs from that field over the period of the rotation and sums up the change in nutrient status: if you follow this rotation, in the end your soil will have more of this and less of that than at the start.
It could be useful for conventional farming as well.
“It’s well-suited to farms that are relying on some of the organic inputs like manure or green manure,” Thiessen Martens says. “When you’re dealing with organic inputs – like using green manures for soil fertility or animal manures or rock phosphate – the nutrients may be released very slowly. Conventional soil tests don’t tell the whole story.”
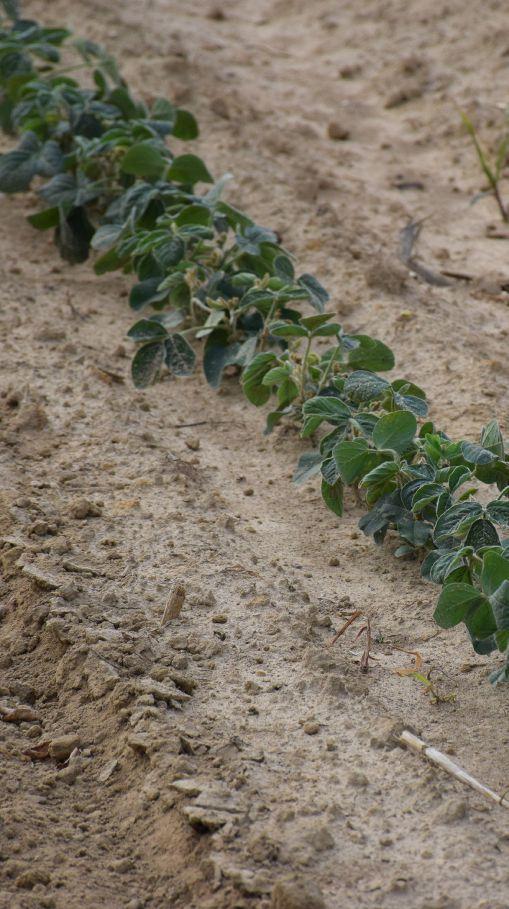
PHOTO BY STEFANIE CROLEY.
ABOVE: A new tool to help farmers develop a rotation-based nutrient budget may be useful for both organic and conventional farming.
The idea of tracking nutrients over time, through a whole rotation, began a few years ago, with Martin Entz. Entz, a specialist in organic cropping systems at the University of Manitoba, teaches students to use the nutrient budget concept as an approach to understanding and managing nutrients.
In 2014, Thiessen Martens worked with Entz to develop a more detailed approach using spreadsheet tools. Thiessen Martens used it for two years in her own research and, in 2016, released it to a few agronomists.
“You compile all the quantities of material coming onto and going off of a field every year over the course of a whole rotation. That includes seeds, soil amendments like manure and an estimate for any nitrogen fixed by the legumes in rotation,” she explains. “Then we quantify the exports – grain harvested, straw or hay removed, forages grazed off by livestock. We have built-in coefficients for the concentrations of the four major nutrients [nitrogen, phosphorus, potassium and sulphur] in each item. Then the spreadsheet simply does all the math. It calculates the totals for each year, as well as over the rotation.”
After gaining the initial results from a rotation on one field, the grower can then make substitutes to test the effects from changes in advance.
If the field has a deficit, or over-supply, the tool can help a grower reach a “balanced budget” for the nutrient supply over time.
It doesn’t take in results from a current soil test, although it is meant to be used with a soil test, and it doesn’t incorporate amounts for micronutrients, Thiessen Martens says.
In 2008, Frey was a technician working with Entz and Thiessen Martens on organic crop research. He was one of the first agronomists to begin using the new nutrient balancing tools in spring 2016.
That year he worked with two farmers to apply the new tools in the field. One farmer had an issue with low phosphorus. He and Frey put all the data required into the spreadsheet, then considered results from a soil test, a plant tissue test and the bioassay. They concluded that, despite the extra cost for buying and spreading manure, in the long run, this would be the most sustainable option for that farm.
A year later, Frey says, “This tool is very helpful. It provides a way of bridging the gap between what has escaped description in conventional systems and supplies more of that hybrid of quantitative and qualitative nutrient information that organic farmers want to see.”
“Organic farmers don’t have the luxury of adding granular fertilizer, and soil tests fail to accurately capture the more nuanced picture of what’s happening in the life of their soils, so they have needed a new tool,” he adds.
Quantitative measures of available nutrients are readily available but fall short of the qualitative measures needed for really understanding the dynamic nutrient balance in a field.
For instance, he’s seen growers become very alarmed by a soil test report that said a field needed more nitrogen when, in fact, it had recently received a large amount in the form of green manure and the most recent yields were fairly good.
If the field has a deficit, or over-supply, the tool can help a grower reach a “balanced budget” for the nutrient supply over time.
Growers already have access to a variety of nutrient budgeting tools. “Ones I’ve seen tend to be fairly simple, geared to the short term and to conventional production with synthetic fertilizers. They aren’t meant to cope with manures, where every batch or crop is different,” she says.
As Entz and Thiessen Martens worked with the nutrient budget concept, they realized that a second tool was needed to fill in the blanks on nutrient content for natural, slow decomposition of organic manure and green manure.
The solution was a new bioassay.
“We’ve developed a bioassay test that takes samples of a green manure crop at its peak, just prior to termination,” Thiessen Martens explains. “We test that plant tissue for nutrient concentration as an indicator of how well the crop extracted nutrients from the soil.
“That bioassay test, together with the soil test and soil nutrient budget, rounds out a suite of information to make decisions about crop rotations and fertility management.”
Field trials
In Roblin, Man., Manitoba Agriculture partnered with the Parkland Crop Diversification Foundation (PCDF) for the northwest region. James Frey, as a specialist for the PCDF, now works with cover crops and integrated farming systems to spur “environmentally minded” production among conventional and organic growers.
After a green manure crop, nutrients become available slowly, on a different time scale than the conventional soil test is geared to measure.
“[This test] brings the strength of the number that a conventional soil test [or plant tissue test] can generate, as well as the qualitative observations of an agronomist working with the farmer,” Frey says.
Just saying green manure contains 100 pounds of nitrogen may not be useful. Over a five-year period, that nitrogen may give a nice payback in yield and in “building resilience” into the system through factors like disease management, water retention and buffering against compaction.
There are also applications for these new tools among conventional farmers who are open to asking broader questions about how green manures and cover crops can fit within conventional agriculture.
“Engaging in dialogue to get a better understanding of the history of the site carries the qualitative understanding and opportunity to nudge a farmer in the direction of that non-conventional thinking,” Frey says. “This tool could be really important for conventional growers to figure out just how green manures can actually benefit them when they can’t measure them year by year. They need the bigger picture.”
He concludes, “It’s not a simple tool, but it is a way of simplifying a very complex system.”
A BALANCING ACT
Improving pre-harvest sprouting tolerance without hampering spring germination or the malting process.
by Carolyn King
Pre-harvest sprouting – germination of the grain while it is still in the head – can cause costly losses in Prairie cereal crops, so research is underway to develop tools and knowledge for more efficient breeding of elite wheat and barley varieties that better resist or tolerate pre-harvest sprouting.
“Pre-harvest sprouting causes a substantial reduction in yield and quality because it degrades the starch,” notes Belay Ayele, an associate professor at the University of Manitoba who is leading this research.
Wheat and barley grains affected by pre-harvest sprouting have a high activity of alpha-amylase, an enzyme that is produced during the germination process. Alpha-amylase breaks down the starch in the seeds to provide energy for the growth of the new seedlings. This degradation of starch into sugars causes significant grain quality losses. For example, flour from sprouted grain with high alpha-amylase activity has poor baking quality, and malting barley grain with high alpha-amylase activity can quickly lose germination capacity during storage, so it needs to be malted as soon as possible after harvest.
Ayele’s expertise is in plant hormones, so he is looking at the problem of pre-harvest sprouting in that context. “Plant hormones are plantproduced compounds that regulate growth processes within a plant, including seed germination and dormancy,” he explains. His research is focused mainly on the two major plant hormones involved in the control of seed dormancy and sprouting: gibberellins and abscisic acid (ABA).
These hormones have opposing roles in a seed: gibberellins promote germination and ABA promotes dormancy. “Depending on the levels of these two hormones or the sensitivity of the seed to these hormones, seeds can be dormant, meaning that they cannot germinate, or seeds can be susceptible to pre-harvest sprouting, meaning that the strength of dormancy is lower,” Ayele says.
“Breeders have been selecting wheat and barley crops in favour of quick and uniform germination and seedling establishment, meaning that the cultivars were selected against seed dormancy. So, most of the
modern cultivars of these two crops have very low dormancy, meaning that if cool, moist conditions occur after physiological maturity, then the grain can germinate very easily while still on the plant.”
Ayele’s research is targeting intermediate dormancy – an optimal balance between too much and too little dormancy. This would enable the seeds to tolerate or resist pre-harvest sprouting while also having good and timely germination when seeded for the next crop or during the malting process in the case of malting barley. To create this intermediate dormancy, he is aiming to balance the amounts of ABA and gibberellins in the seed.
His current studies in both wheat and barley focus on ABA. A major task in these studies has been the identification of genes involved in the regulation of the ABA level in each crop.
Gene identification was especially challenging in wheat. Ayele explains, “Genomic studies of wheat were lagging behind other crops because wheat has a very large, complex genome. We had to start our work from scratch using genomic research from other cereal crops, such as rice, corn and barley. Their genomes are not as complex as wheat’s genome, so there was more information available about them at that time.” Fortunately information on the wheat genome is growing; a whole genome assembly of a bread wheat variety was completed in 2016 and a high-quality bread wheat reference sequence is expected soon.
Ayele and his research team recently succeeded in identifying various genes in wheat that influence ABA levels in the seed. Some of these genes are involved in the formation of ABA and others are involved in the degradation of ABA.
To test the functionality of these genes, as part of Ayele’s basic research program, they transferred the identified genes into a “model plant” called arabidopsis. This species is very easy to use in laboratory experiments – it is small and has a very short, six-week life cycle, and its relatively small genome was the first plant genome to be sequenced. Scientists use this plant as a model to help in understanding
PHOTOS COURTESY OF BELAY AYELE.
ABOVE: Belay Ayele aims to develop molecular tools to accelerate breeding of wheat and barley varieties with better pre-harvest sprouting tolerance.
GLOSSARY: WORDS TO KNOW
Abscisic acid (ABA): Major plant hormone involved in the control of seed dormancy.
Allele: One of two or more alternative forms of a gene
biological processes and then they apply their learning to crops.
By using the ABA-formation and ABA-degradation genes, Ayele and his team found they could manipulate the amount of ABA in the model plant’s seeds to induce dormancy or tolerance to pre-harvest sprouting.
Now that they have confirmed the functionality of the identified genes, Ayele and his team are collaborating with researchers from Agriculture and Agri-Food Canada (AAFC) to find particular alleles of the identified genes. An allele is one of two or more alternative forms of a gene; the researchers want to find alleles that produce an optimal level of ABA to achieve intermediate dormancy in wheat seeds.
To find the desirable alleles of the ABA-related genes, they are working with wheat lines from AAFC’s Morden Research and Development Centre in Manitoba and other wheat germplasm collections. Results from some of these lines show that lines with different degrees of tolerance to sprouting exhibit allelic variations in the genes of interest. Ayele says, “Those alleles can eventually be used in incorporating the trait for pre-harvest sprouting tolerance into elite wheat cultivars.”
Ayele and his team are taking a similar approach to their malting barley research. They have already identified various ABA-related genes in barley and are characterizing and assessing these genes. Currently, in collaboration with AAFC researchers at the Brandon Research and
Development Centre in Manitoba, they are evaluating barley breeding lines and germplasm from several sources to find the alleles that are optimal for moderate dormancy in barley seeds.
“When we characterize these lines, we find that some lines have really strong dormancy, which is not required, and some lines have very low dormancy – they germinate in a day, which is not required under field conditions,” Ayele explains. “We need to have multiple growing cycles to see how the different barley lines are affected by different growing conditions.”
The researchers will apply their findings in developing molecular tools to accelerate breeding of elite barley cultivars that are less susceptible to pre-harvest sprouting but still suitable for the malting process, resulting in improved crop yield and quality.
For both wheat and barley, faster development of varieties with better pre-harvest sprouting tolerance “will, in turn, help farmers to supply quality grain to domestic and international markets, and thereby they will maintain their competitive edge in the marketplace and maximize their farm incomes,” Ayele says.
The main funders for Ayele’s pre-harvest sprouting research are the Western Grains Research Foundation and the Manitoba Wheat and Barley Growers Association, along with the Natural Sciences and Engineering Research Council of Canada, and two Growing Forward 2 programs: the National Wheat Improvement Program and the Manitoba Grain Innovation Hub.
Alpha-amylase: Enzyme that is produced during the germination process, breaking down the starch in the seeds to provide energy for the growth of the new seedlings. This degradation of starch into sugars causes significant grain quality losses.
Arabidopsis: Called the “model plant” because the species is very easy to use in laboratory experiments due to its size and short life cycle, and its relatively small genome was the first plant genome to be sequenced.
Gibberellins: Major plant hormone involved in the promotion of germination.
Intermediate dormancy: Optimal balance between too much and too little dormancy. Enables seeds to tolerate/resist pre-harvest sprouting while also having good and timely germination when seeded for the next crop (or during the malting process in the case of malting barley).
Pre-harvest sprouting: Germination of the grain while it is still in the head.
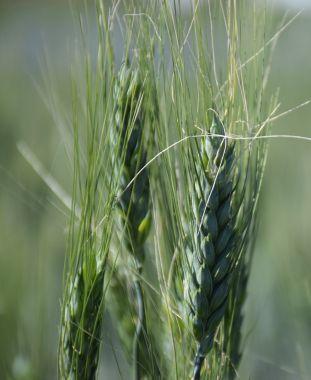
ABOVE: Ayele’s research studies are evaluating wheat and barley lines to find gene variants for intermediate seed dormancy.
ROOM FOR IMPROVEMENT
There’s been progress in grain corn yields in Manitoba, and there’s room at the top for even more yield.
by John Dietz
Genetics, agronomics and better practices are all coming together in the grain corn industry in Western Canada.
A yield competition sponsored by the Manitoba Corn Growers Association (MCGA) seems to grab headlines each fall with a new record. Behind that, though, are real returns that are getting better and better.
The perennial winner, or close competitor, is Baker Hutterite Colony of MacGregor. It set a record yield, for a hand-picked 50foot row sample, of 271.69 bushels per acre in 2013. The colony also has won that competition four other times in the past few years, including 2016.
The real field and farm averages are much different, and climbing quickly. According to crop insurance reports to the Manitoba Agricultural Services Corporation, the average grain corn yield has climbed from 113 bushels per acre a few years ago to about 141 in 2016, or 25 per cent.
That’s in line with Myron Krahn’s numbers. Krahn is a seed grower with about 800 acres of dryland corn, plus cereals, soybeans, hempseed and grasses. He’s also president of the MCGA.
“Our average crop has gone up by about 40 bushels an acre over the past five or six years, the same as the rest of the province,” Krahn says.
“It is a huge increase, and it sounds unbelievable, but lots of farms have gone through this in the past decade,” he says.
Seeded acres of corn haven’t really kept up with the yield growth. Production acres are around 300,000 to 350,000 each year. But there is growth.
“We’ve definitely not topped out the yield potential yet, or the potential acres,” Krahn says. “You can’t make a blanket statement on yield because areas of the province have never grown corn. Some have only started in the last three to five years.”
However, he added, all producers in Manitoba are enjoying the blessings of better genetics, better agronomics and better practices, leading to bin-busting yields.
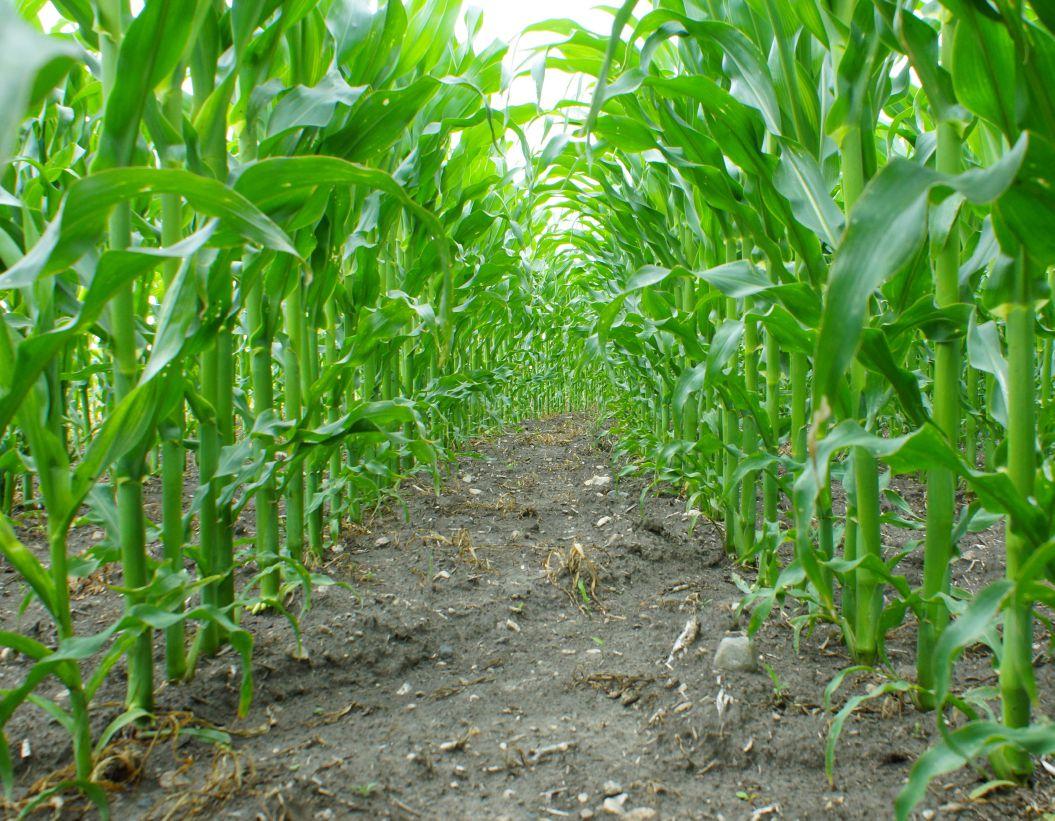
ABOVE: Average grain corn yield in Manitoba has increased by about 25 per cent in the past few years thanks to good management practices.
PHOTO COURTESY OF JOHN DIETZ.
Scott McIntosh, DuPont Pioneer account manager for Manitoba, agrees with Krahn. He’s seen it, and he is confident that the peak of prairie corn production is yet to be found.
“We’re seeing an increase in corn acres over the long term,” McIntosh says. “The trend is up. Growers in the Red River Valley are expanding their facilities to handle more acres of corn, and replacing cereal acres. For western Manitoba, more growers are coming on line, investing into equipment and drying facilities. We have more people at training meetings, and we’re hearing more and more questions.”
Fertility and yield potential
Krahn says veteran corn growers now target a 150-bushel yield. That compares to 80- to 100-bushel corn twenty years ago.
The rule of thumb he uses is that each bushel will need to use one to 1.2 pounds of nitrogen. He budgets for supplying up to 170 pounds of nitrogen – but he doesn’t put it all on at once.
“A lot of producers are fertilizing throughout the season. That allows you to observe the quality of the crop and the potential as it grows. In June and July, as you see the potential getting higher, you start adding more fertilizer. On the other hand, if it’s halfway through June and half your fields are drowned, you don’t have to put all that fertilizer down,” Krahn says.
Precision planting tools also are part of the explanation for higher yields. Rows are uniformly spaced, and seeds are uniformly spaced. Fertilizer is precision-placed two or three times in a season, and it is packaged in forms that release it slowly to the eager plants.
“We know more about targeting nitrogen. It’s almost like spoon-feeding the crop. The standard now is twice, and some do it three times,” Krahn says.
McIntosh describes a new technology for applying fertilizer.
“A lot of growers have purchased or made their own Y-drop system in the past two or three years. It allows a grower to run liquid 28 fertilizer along the ground, below the canopy, without burning the plants,” McIntosh says.
The new system was developed by an American company called Yield 360, he says.
McIntosh explained that with a separate boom, mounted on a precision-guided sprayer, hoses hanging below the boom can dribble the liquid fertilizer beside the plant rows and feed the roots, quickly and without trampling.
Another contributor to the higher yield is a higher plant population.
“We are definitely seeding populations that are quite a bit higher than back in my father’s day. That’s translating into yield,” Krahn says.
Thirty-inch row spacing still is standard in Manitoba, but not always.
“Instead of planting a 30-inch row, guys are moving to 20- or 22-inch rows,” McIntosh says. “Basically, you get more plants in the field. In Minnesota and the Dakotas, guys are seeing five to seven per cent yield gains with 20- or 22-inch row spacing over 30-inch. In the old sugar beet market, guys are re-investing and changing over to narrower spacing for corn. We’re going to follow, I think.”
One more contributor is improved field drainage. Water is one of the biggest factors in the growing season. One year there isn’t enough; the next may have excess.
“Tile drainage and surface drainage both benefit growers, and are increasing,” McIntosh says. “Drainage work is definitely improving yields. Surface drainage technology has improved greatly over the last five years. Doing, and improving surface drainage is a continual thing for a grower.”
New genetics
New genetics help today’s corn to use more fertilizer than ever before. The new high-yielding varieties can mature with less heat and with fewer days of growth.
“What’s available to grow is just far superior to what we had 10 years ago. If you went back to one of those old varieties from 10 or 20 years ago and gave it the same fertilizer we give today, that corn would not know what to do. It would be far too much fertilizer,” Krahn says. “Today’s genetics are very responsive to proper fertilization, and farmers are doing that. It’s contributing to the trend to higher yields.”
McIntosh agrees. “The biggest opportunity is in the genetics. Over the last 10 years we’ve seen a big increase in genetic potential. Even yearly, we see improvements. And, another reason we see more yield is that tolerance to certain stresses has been much improved.
“I think the 150 to 160 yield is a good target today. Environment is going to play with the factors, but that’s very achievable for an average grower,” McIntosh says. “Our strips are small and as uniform as possible, and usually in the better part of a field. We can see those yields come off at anywhere from 170 to 230 bushels.”
New lines during development are evaluated by the plant breeders for characteristics like tolerance to dry, wet or windy conditions, as well as yields and disease resistance. And, they’re evaluated in trials with close proximity to the primary growing areas, enabling growers to be more successful in selecting the lines that are best adapted locally.
As well, genetically modified corn has been a big boost to yields – by early protection from weed competition. Today’s corn gets off to a cleaner start than ever before, free of weed stress that was a yield-robber.
“Before Roundup Ready corn came along, the herbicides we sprayed were not nearly as effective; they could be damaging to the corn in some conditions,” Krahn says. Now, the weed control is definitely superior. There is a critical time when the emerging crop absolutely cannot have any weeds out there. Roundup Ready corn really helped with that. You can take down pretty well all your weeds in one fell swoop.”
Potential for tomorrow
“If we can add, over five years, four or five bushels across the provincial average for crop insurance, that would be great. I’d like to think that, in 15 or 20 years, we might be averaging 170to 180-bushels per acre on a regular basis,” McIntosh says.
“In the corn competition, we probably will see 300 bushels per acre – but that’s not representative of a whole field,” Krahn adds.
On yield maps right now, the corn grower’s monitors often record spots with a rate of more than 200 bushels per acre.
“I’m thinking we probably will be targeting 175 bushels, at some point, and the potential for more is there, no question about it,” Krahn says.
The easy way to manage your farm
Analyze your data. Plan your strategy. Then track your performance. AgExpert Field gives you the details you need to know to make the best business decisions.
It’s all new. And seriously easy to use. Get it now and see.