
THE CHALLENGING LANDSCAPE OF NZ WINE CONTINUES
The purpose of this commentary is to share insights on global demand, supply from Marlborough, forecasted Sauvignon Blanc carryover inventory levels, and Marlborough Sauvignon Blanc grape price trends. The current landscape continues to be challenging due to consumer trends and market conditions, resulting in fragile demand patterns. This trend in demand is partly due to moderation, from lower consumption due to health and lifestyle choices combined with pressure on disposable income. This is impacting the frequency of wine consumption as consumers seek greater value when they make a wine purchase.
A step change increase in Marlborough grape supply has occurred since vintage 2022, from record harvests in 2022 and 2023. This has resulted in higher inventory levels and increased pressure on pricing and future cashflows for winegrower and grape grower businesses. The complexity of the current landscape is also affected by higher excise tax and input costs from inflation which is not unique to the wine industry. The winegrower business model is based on the three Vs: viticulture, vinification, and vendre (to sell)*. Due to changing demand trends, to sell profitability has become the biggest challenge and future success will be based on innovation, access to new export markets, greater penetration into existing markets, and connecting with consumers to encourage purchase at higher price points.
* The Wine Economist August 2024
KEY INSIGHTS:
1. Marlborough grape supply for the 2024 vintage is 313K tonnes, 21% or 81K tonnes below the 2023 vintage. A 2025 vintage target of 342K T for Marlborough supply will improve the demand supply equilibrium.
2. Global demand volumes have plateaued since FY19. The FY25 forecast of 320ML has been downgraded by 10ML due to the latest September 2024 quarter export result. This forecast is below the (2019-2024) 6-year average of 328ML. This forecast considers consumer demand trends and assumes a stable domestic market at 42ML with 0% export growth.
3. NZ Wine current export MAT September 2024 of $2.07 billion has declined 10% year on year. Resulting from an 8% decline in volume and a 2% decline in the $ per litre ($7.61 LT) from both packaged and non-packaged exports.
4. Global wine consumption of white wine has grown over the 2000-2021 period and Sauvignon Blanc is the consumer preference #1 or 2 for white wine in eight of the top 10 global wine markets. This illustrates a consumer trend towards white wines and lighter wine styles as they moderate their consumption and seek greater value when purchasing wine.
5. |There is a direct correlation between demand, supply and the Marlborough Sauvignon Blanc grape pricing. After two record harvests in 2022 and 2023 combined with a softening in demand the current landscape has moved into an over supply position. This decline in grape pricing is forecast to continue in vintage 2025. The level of decline is dependent on managing a balance between future demand and supply.
6. Sauvignon Blanc carryover inventory levels increased to 53ML (V23), a direct result of softer FY24 volume demand combined with the large V23 Marlborough harvest. The July – December 2024 period will be unusual as the V23 carryover will continue to be sold whilst the V24 wines are released to customers.
MARLBOROUGH SUPPLY TRENDS
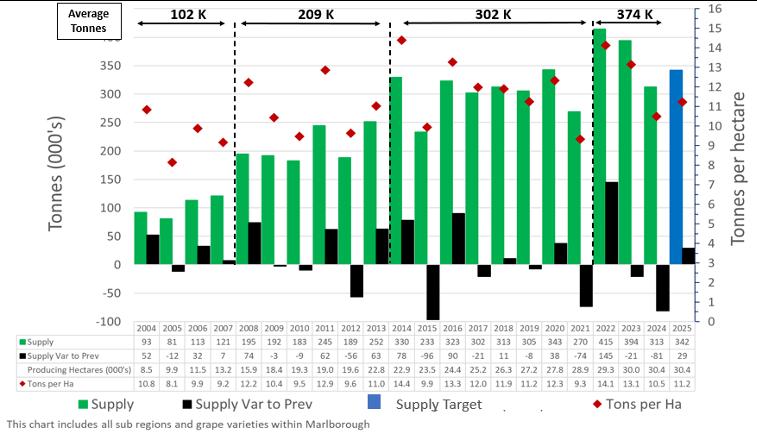
Marlborough grape supply is in the 4th phase of growth. The latest phase from the last three vintages (V22-24) averaged 374K tonnes. This is a result of producing hectares moving above 30K hectares and the high tonnes per producing hectare (V22 = 14.1 T, V23 = 13.1 T) compared to historic yields. Since 2004 only two other vintages (V14 and V16) have been above 13T per hectare. In hindsight the supply from V22 and V23 was 45-50K T above what was required to fulfill the global demand volume in FY23 and FY24.
We have introduced a vintage 2025 target of 342K T, this includes all sub regions and grape varieties from Marlborough. It is demand led calculating the Marlborough supply required to achieve a NZ wine global demand volume of 320ML per annum in FY25 and FY26. The balancing of supply with demand is important to achieve; continuity of supply, price stability, and acceptable levels of inventory for winegrowers.
The V25 target is inline with V20 tonnes (record at the time) however the producing hectares are estimated to be 2.6K hectares higher than V20 therefore the required tonne per hectare in V25 will need to be lower than V20. This is the immediate challenge to ensure supply alignment with demand. This will be managed by nature (V21 and V24) or through operational management by reducing yield per hectare or the longer-term impact of less producing hectares.

Source: Vintage 2004 – 2024 statistics from New Zealand Winegrowers Vintage Survey Report. Vintage hectares from Marlborough Wine Industry Growth projected hectares in production. Targets are from JPEW Advisory Ltd and are indicative only.
KEY POINTS:
• The last three vintages have step changed Marlborough supply to new levels of producing hectares and yields.
• Higher levels of V25 supply above the forecast could be managed by achieving higher levels of demand, to sell (Vendre) above the FY25 & FY26 demand forecast of 320ML (export and domestic) per annum.
• This chart includes all sub regions and grape varieties within Marlborough.
• Climate change, water availability, bud initiation, labour supply, trunk disease, time lag of new planted and producing hectares and nursery supply are all recognised as impacting on harvest yields.
NZ WINE GLOBAL SALES TRENDS
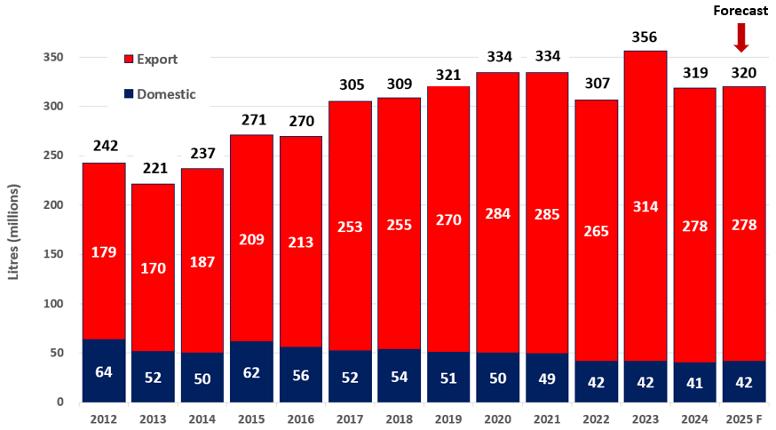
Note: global demand is measured in financial years. Each year is based on a 30th June year end, inline with NZ Winegrowers.
Since FY19, NZ wine global demand volumes have ranged between 356ML to latest FY24 result of 319ML, which is 3% lower than the 6-year average (2019-2024) is 328ML.
The FY25 forecast of 320ML assumes a stable domestic market at 42ML and 0% export growth. Unless the current market landscape improves this forecast is best viewed as a best-case scenario and expected to continue into FY26. This forecast has been downgraded from July by 10ML due to the performance of the latest export quarter (July to September 2024).
The FY25 volume forecast acknowledges a challenging sales landscape due to the impact of inflation, with input cost pressures including duty and excise increases. Price increases are sensitive to maintaining sales volumes (price elasticity) but necessary to improve profitability for gatekeepers and winegrower businesses.
Whilst the current landscape is challenging NZ wine sold domestically is holding, premium price segments continue to grow, low or no alcohol is in growth, and younger consumers are more confident and knowledgeable when engaging with wine. The perception of value has always been important to consumers, they are prepared to pay a higher price for quality as they drink less or purchase less expensive wine that offers better quality.
Another dynamic is a change in consumer demand resulting from moderation with lower consumption due to health and lifestyle choices, combined with pressure on disposable income. This is impacting the frequency of wine consumption. Also, competition from other countries of Sauvignon Blanc source (US, Chile, South Africa) and cross category (spirts, RTDs, beer, non alcohol) competition are influencing consumer choice.
Note: each year is based on a 30th June year end.
Source: New Zealand Winegrowers reports: NZ Domestic Market Reports and NZ Wine Export Reports. Forecasts are from JPEW Advisory Ltd.

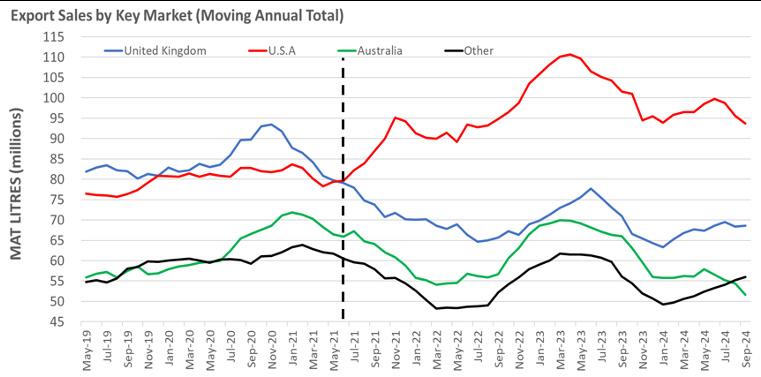
SIGNIFICANT CHANGES IN THE EXPORT MARKET MIX
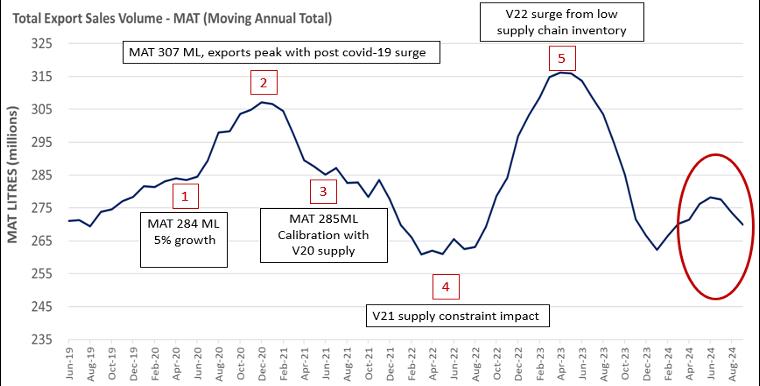
The current export MAT September 2024 is 270ML which is inline with the June 2019 export MAT 271ML.
Export shipment trends (ex NZ) over the past five years have been volatile due to the trading uncertainty from covid-19 (2020) followed by the low vintage 2021 harvest that constrained customer demand in 2021 and 2022. From this position, the release of the record vintage 2022 harvest resulted in a bull whip effect resulting in a surge of export shipments from July 2022. This peaked in June 2023 and was in decline until January 2024. Since then, exports have been seeking an equilibrium with in-market inventory levels and consumer demand.
In the past five years the change in the export market mix has been significant. From June 2021 USA have achieved step change growth. The current USA MAT September 2024 of 94ML is 15ML or 19% above June 2021 but inline with November 2021. All other key markets have been in decline since June 2021 highlighting the impact V21 supply constraints (allocations) had on these markets. The latest quarter correction is due to the USA and Australia with the UK holding and Other markets in growth.
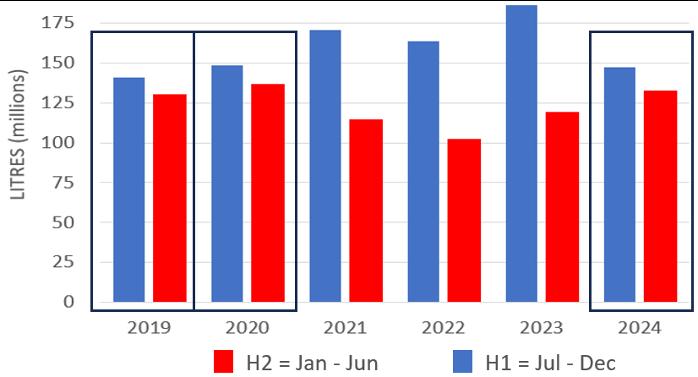
NZ WINE EXPORT SALES TRENDS
The timing of export demand has changed over the last 6 years. The chart below illustrates the strong weighting of H1 export demand throughout the 2020-2023 period.
The timing of export demand between H1 and H2 in 2024 is moving back to a weighting that mirrors 2019 and 2020. This rebalancing is driven from lower in-market stock levels, consistency of supply, and continued depletion growth (off retail shelf, online sales, or wine list) in key export markets. This change in the timing of export demand reflects customer demand and will have an impact on winery storage capacity and cashflow as higher levels of inventory will be required to be held leading into future vintages.
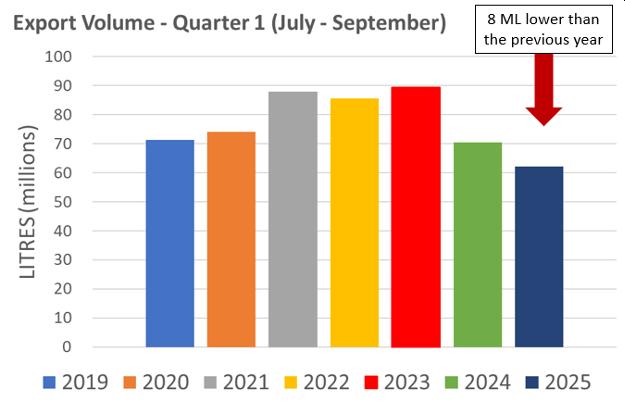
The export volume performance in the latest quarter (July – September 2024) is the lowest volume sold in the past 7 years.
DRIVERS OF CURRENT DEMAND TRENDS: VALUE PROPOSITION
AND PRICE ELASTICITY
The growth of NZ wine in global markets is based on the success of NZ Sauvignon Blanc. Wine consumers adore the taste as they find it unique and interesting.
Global wine consumption of white wine has grown over the 2000-2021 period* and Sauvignon Blanc is the consumer preference #1 or 2 for white wine in eight of the top 10 global wine markets**. This illustrates a consumer trend towards white wines and lighter wine styles.
The value proposition is based on a consumer trend to drink less and seek greater quality when they decide to consume wine. Another aspect to this trend is when consumers spend less per bottle but seek greater quality.
Price elasticity is the sensitivity to price appreciation (or decreases) on volume demand, this relationship drives the $ value performance of each product. As winegrower businesses look to improve profit margins the pricing tactics of their products will have an impact on the volume sold.
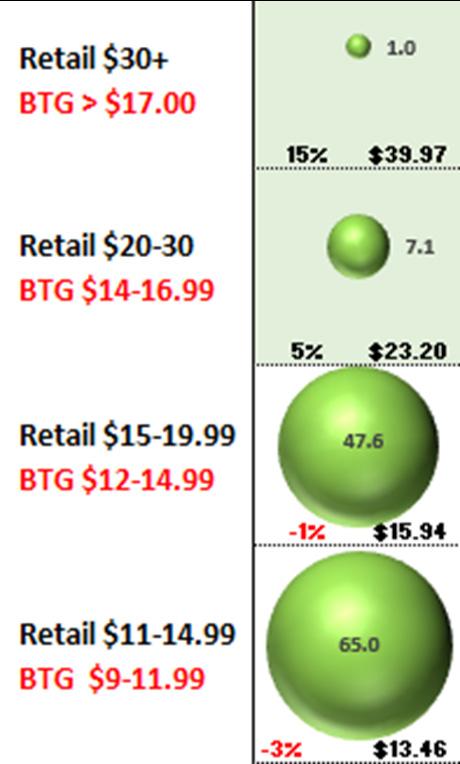
Chart A and B are a snapshot into the domestic wine category. NZ is the 4th largest market by volume for NZ Wine and Sauvignon Blanc is the leading still white wine sold in this market. Total Sauvignon Blanc MAT $150M is in decline 3% or $4M.
Chart A segments the total Sauvignon Blanc MAT $150M by price. Retail is the average price per bottle and BTG is the by the glass equivalent price within on premise. The size of the bubble illustrates the $ value of each price segment in millions, the % is the $ value variance and the average $ per bottle per segment is also illustrated.
The insight is consumers are purchasing Sauvignon Blanc at higher price points above $15. The total Sauvignon Blanc $ value decline is occurring in the price segments below $15 per bottle due to less volume purchased.
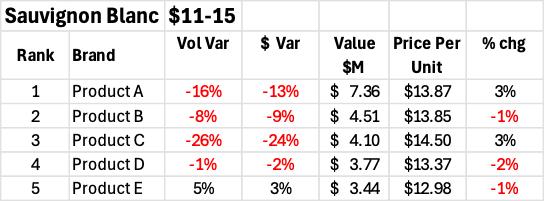
Chart B illustrates price elasticity in the Sauvignon Blanc $11-15 segment. Product A (ranked #1) MAT is $7.36M. The $ value is in decline -13% as the 3% price per unit (bottle) increases. This results in a -16% decline in volume sold. The price elasticity of each product is unique due to pricing tactics.
THE CORRELATION
OF DEMAND & SUPPLY WITH GRAPE PRICING TRENDS
This chart illustrates the historic relationship between total Marlborough supply with the NZ wine global sales volume, we then overlay the Marlborough Sauvignon Blanc grape price trend to identify a correlation. Global sales volume over the last 20 years has been a great NZ success story. Supply constraints (decline in vintage supply) adversely impacts global sales volume the following financial year (July to June) highlighted with V12, V15, and V21. The NZ wine global demand decline in FY24 is different as it is not due to a supply constraint but the challenging trading landscape. As previously highlighted, on average the global demand volume has remained relatively static since FY19.
We have introduced a V25 supply target of 342K T. This is demand led calculating the supply required from Marlborough to achieve a global demand volume of 320ML in FY25 and FY26.
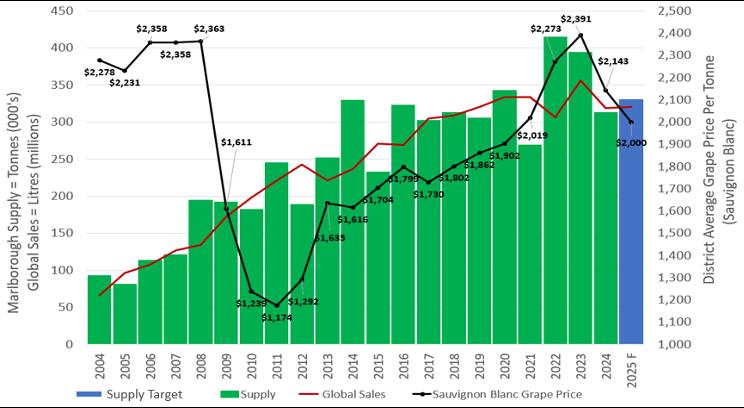
From the steady rise in grape prices between 2013-2021 there was an 18% increase from 2020 to 2023, resulting in a record $2,391 per tonne for vintage 2023. The correction in grape pricing in vintage 2024 was indicative of high inventory levels held by winegrower businesses.
The vintage 2025 grape price forecast for Marlborough Sauvignon Blanc is $2,000 per tonne. This is indicative only as this price will be influenced by future demand trends of NZ wine and post flowering supply estimates from vintage 2025. It is highly probable the grape pricing will continue to fall as winegrower businesses manage current inventory levels.
The chart above illustrates a correlation between levels of supply, demand, and the movement in grape prices. After two record harvests in 2022 and 2023 combined with a softening in demand the current landscape has moved into an over supply position, resulting in the correction in the vintage 2024 grape price.
Grape pricing beyond vintage 2024 may improve however any future movement in grape price will be dependent on the performance of global demand in FY25 and FY26 and how supply is managed in V25. Source: New Zealand Winegrowers Final Annual Grape Prices per tonne: Marlborough Sauvignon Blanc.
SAUVIGNON BLANC CARRYOVER LEVELS
We wanted to understand how much Sauvignon Blanc was sold from July the year after vintage (V16 carryover = the volume of V16 sold after July 2017). This is referred to as carryover inventory on the basis that a vintage is usually released in June of the same year as vintage.
Our approach was to calculate the Sauvignon Blanc export volumes sold as carryover inventory believing this sample size is large enough to build a picture.
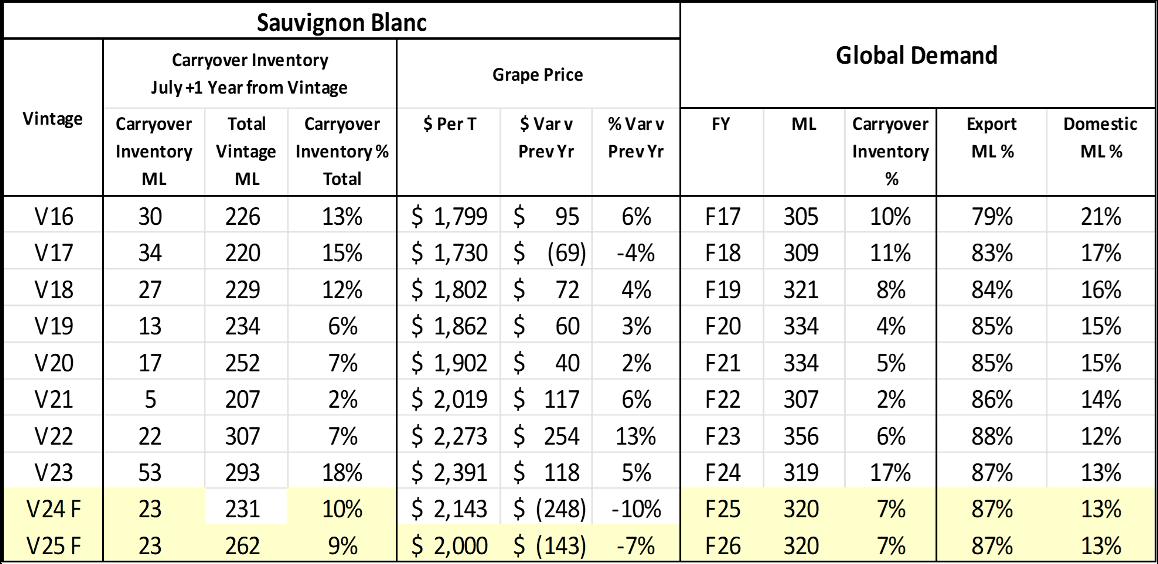
Source: New Zealand Winegrowers Final Annual Grape Prices per tonne: Marlborough Sauvignon Blanc. All the demand and supply volumes are sourced from New Zealand Winegrower reports. JPEW Advisory Ltd provide the forecasts highlighted in yellow. Note: Global Demand is ex NZ shipments based on the NZWG reporting year which is July – June.
Historical patterns illustrate V16-18 carryover inventory was +10% of the total Sauvignon Blanc supply, grape pricing was level and the carryover inventory cover to global sales ranged between 8-11%. Between V19-22 carryover inventory dropped to 2% in V21. Over this period grape prices increased from $1,862 to $2,273 per tonne.
Carryover levels build from the record V22 supply where carryover inventory increased to 22ML then increased to 53ML for V23. The July – December 2024 period will be unusual as the V23 carryover will continue to be sold whilst the V24 wines are released to customers.
The decline in the V24 grape price correlates with the high V23 carryover position where wine grower businesses manage high current inventory and weaker demand. The lower V24 supply combined with a lower grape price will adversely impact vineyard profitability after two successful years.
The FY25 global demand forecast (highlighted yellow in the table above) is 320ML, this is expected to hold in F26. Once the V23 carryover inventory is sold it will result in a lower V24 carryover inventory level due to the lower V24 harvest. The key lever to manage this is stability in demand volumes.
The V25 total Sauvignon Blanc forecast of 262ML is based on a supply required from Marlborough of 342KT, inline with V20. This V25 supply required target will align with global demand volume forecasts and ensure a V25 forecast carryover inventory of 23ML.
JOHN WILSON

+64 27 837 3420 | john.wilson@jpew.co.nz | www.jpew.co.nz
WE PROVIDE SPECIALIST WINE INDUSTRY SERVICES, ADVICE, AND INSIGHTS TO IMPROVE YOUR BUSINESS PERFORMANCE.
REQUEST A FREE NO OBLIGATION CONSULTATION.
DISCLAIMER This document is published solely for informational purposes. It has been prepared without taking account of your objectives, financial situation, or needs. Before acting on the information in this document, you should consider the appropriateness and suitability of the information , having regard to your objectives, financial situation and needs, and, if necessary seek appropriate professional or financial advice. We believe that the information in this document is correct and any opinions, conclusions or recommendations are reasonably held or made, based on the information available at the time of its compilation, but no representation or warranty, either expressed or implied, is made or provided as to accuracy, reliability or completeness of any statement made in this document. Any opinions, conclusions or recommendations set forth in this document are subject to change without notice and may differ or be contrary to the opinions, conclusions or recommendations expressed. Neither JPEW Advisory Limited nor any person in volved in the preparation of this document accepts any liability for any loss or damage arising out of the use of all or any part of this document. Any projections and forecasts contained in this document are based on a number of assumptions and estimates and are subject to contingencies and uncertainties. Different assumptions and estimates could result in materially different results. JPEW Advisory Limited does not represent or warrant t hat any of these valuations, projections or forecasts, or any of the underlying assumptions or estimates, will be met.