MARCH

+64 27 837 3420 | john.wilson@jpew.co.nz | www.jpew.co.nz JOHN WILSON
2024 MARLBOROUGH VINTAGE & NZ WINE INDUSTRY OVERVIEW

MARCH
The current landscape is the most challenging I have seen for a considerable time. We have seen a correction in export demand which has occurred after a step change in supply from Marlborough, with record harvests in 2022 and 2023. The realignment between demand and supply has resulted in higher inventory levels, changing demand patterns, and a new harvest expected to have lower yields. All placing pressure on the future cashflows for winegrower and grape grower businesses.
A change in consumer demand is partly due to moderation, resulting in lower consumption due to health and lifestyle choices combined with pressure on disposable income. This is impacting the frequency and intensity of wine consumption.
The complexity of the current landscape is also affected by ongoing inflation and input cost pressures that are having a direct impact on the growing risk of lower profitability. This challenge is not new or unique to NZ winegrower businesses. The purpose of this commentary is to share future insights on global demand, future supply from Marlborough, forecasted Sauvignon Blanc carryover inventory levels, and the downstream impact on grape pricing (Marlborough Sauvignon Blanc).
Demand management (including pricing strategy and promotional investment) becomes a key lever in future success which is reliant on increasing access to new export markets, greater penetration into existing markets, and connecting with consumers to encourage purchase at higher price points.
1. Marlborough grape supply for the 2024 vintage is forecast to be 314K tonnes, 20% or 80K tonnes below the 2023 vintage. This is the result of producing hectares moving above 29,500 and lower tonnes per producing hectare, compared to historic yields.
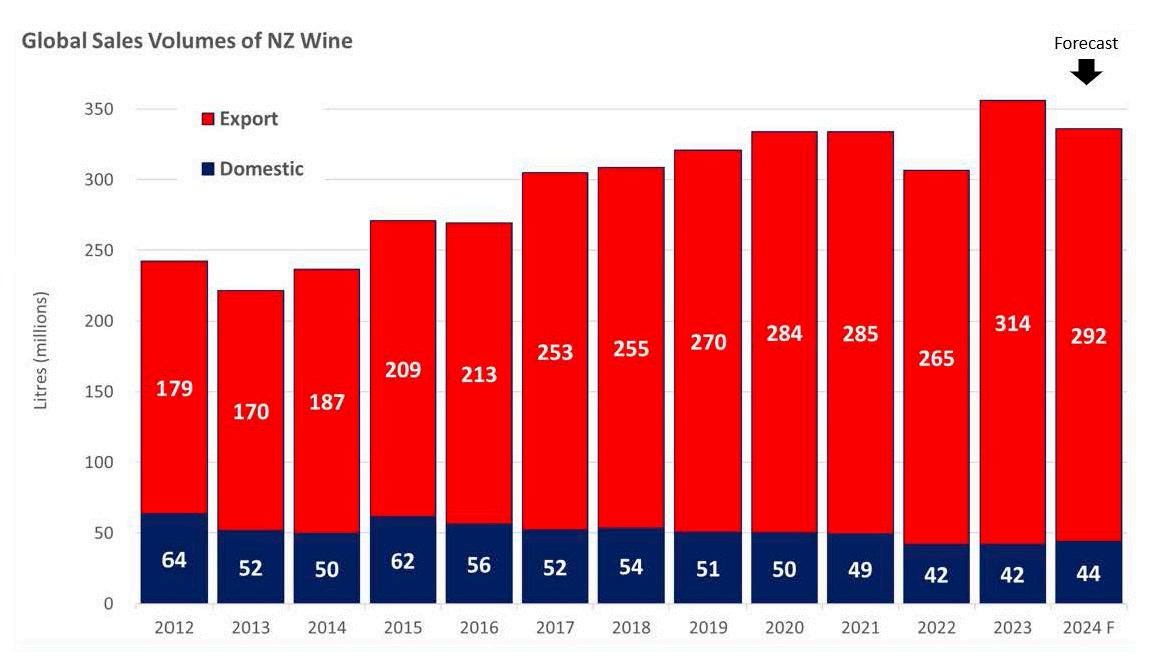
2. Global sales are forecasted at 336ML MAT by June 2024 which is inline with 2020 and 2021. This assumes a turnaround in export shipments (growing in January – June 2024) combined with continued growth of NZ wine sold in the domestic market.
3. Current export MAT December 2023 of $2.1 billion has declined 7% year on year. Resulting from a 10% decline in volume and a 4% increase in the $ per litre ($7.83 LT) from both packaged and non-packaged exports.
4. The export forecast MAT June 2024 is 292ML. This will require a strong Jan – June 2024 performance of 144ML ex NZ shipments, which is 25ML or 21% above the same period last year. The forecast is based on continued positive depletion demand in key markets and a rebalancing of the monthly timing of demand. This turnaround is driven from lower in-market stock levels, stronger promotional programs for NZ wine, and continued depletion growth (off shelf or wine list) in key export markets.
5. There is a direct correlation between demand, supply and the Marlborough Sauvignon Blanc grape pricing. After two record harvests in 2022 and 2023 combined with a softening in demand the current landscape has moved into a temporary over supply position, resulting in the lower forecasted 2024 vintage grape price of $2,000 per tonne.
6. V22 Sauvignon Blanc carryover inventory levels of 19ML have been sold. V23 carryover inventory is forecast to increase to 41ML reducing to 8ML for V24. This is based on a 2024 Marlborough grape supply forecast of 314K and achieving global demand in F24 of 336ML, holding to the same level the following year.
Note:
The Marlborough 2024 vintage is forecast to be 314K tonnes, 20% or 80K tonnes below V23. Frost in some sub regions, an up and down flowering period, and continuing dry conditions has resulted in a reduction in bunches, smaller bunch sizes, and berry size variability. The availability of water supply will also influence the final yield. Historically vintages 2021,2015, and 2012 had similar corrections.
Marlborough grape supply is in the 4th phase with the last two vintages averaging 404K tonnes. This is a result of producing hectares moving above 29,500 and the high tonnes per producing hectare (V22 = 14.1 T, V23 = 12.9 T), compared to historic yields.
The 3rd phase averaged 302k tonnes over 8 vintages between 2014 – 2021. This phase was relatively stable and consistent however vintage 2015 & 2021 reduced the average due to lower yields. The 2nd phase averaged 209k tonnes, the 6 vintages were a challenging period after the global financial crisis, resulting in a calibration between demand, supply, grape pricing and asset values.
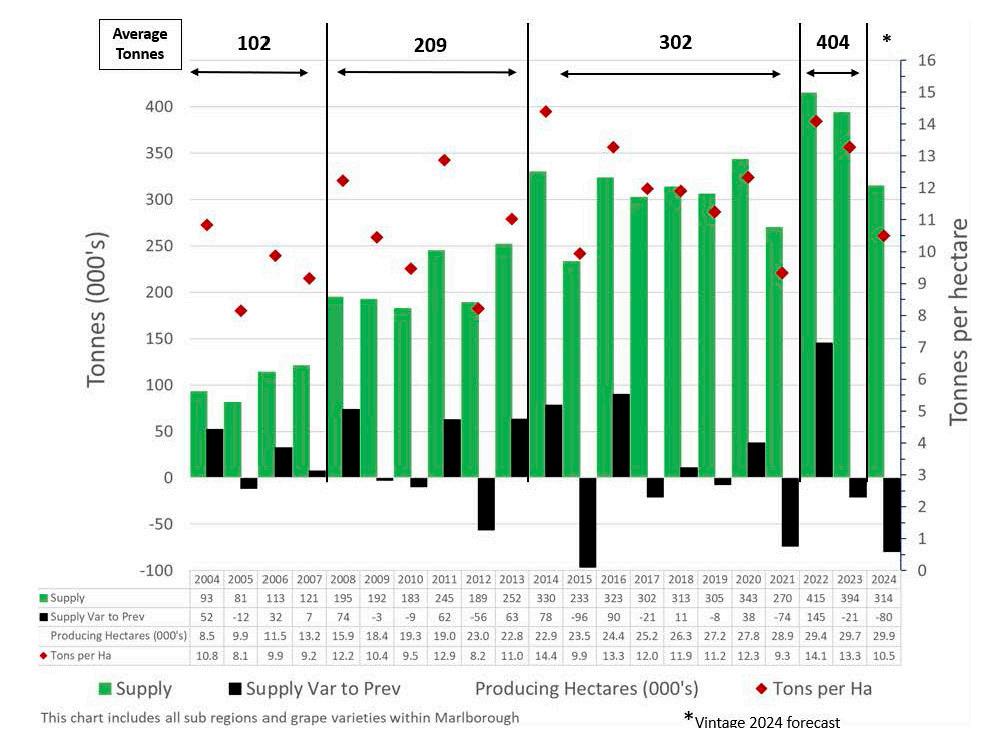

• The last two vintages have step changed Marlborough supply to new levels of producing hectares and yields.
• This chart includes all sub regions and grape varieties within Marlborough.
• Climate change, water availability, bud initiation, labour supply, trunk disease, time lag of new planted and producing hectares and nursery supply are all recognised as impacting on harvest yields.
Source: Vintage 2004 – 2023 statistics from New Zealand Winegrowers Vintage Survey Report. Vintage 2023 hectares from Marlborough Wine Industry Growth projected hectares in production.The 2024 forecast has been reset to 336ML which is inline with 2020 and 2021. NZ wine sold in the domestic market is growing and forecast to achieve MAT 44ML, partly due to growth in the +$15 per bottle price segments.
Our export importers, distributors, retailers, and on-premise customers (gatekeepers to the consumer) have also been experiencing the impact of inflation and input cost pressures (including duty and excise increases) resulting in an increased focus on cashflow and profitability. The impact has been a weakening of export shipments over July – December 2023 as in-market inventories are reduced and price increases (impacting volume sales) are implemented to improve profitability. The export forecast MAT June 292ML builds in growth over January – June 2024 compared to last year.
Another dynamic is a change in consumer demand resulting from moderation with lower consumption due to health and lifestyle choices, combined with pressure on disposable income. This is impacting the frequency and intensity of wine consumption. Also, competition from other countries of Sauvignon Blanc source (US, Chile, South Africa) and cross category (spirits, RTDs, beer, non alcohol) competition are influencing consumer choice.
Whilst the current landscape is challenging the F24 global demand forecast builds in future growth as NZ Sauvignon Blanc remains in demand within export markets, NZ wine sold domestically is growing, premium price segments continue to grow, low or no alcohol is growing, and younger consumers are more confident and knowledgeable when engaging with wine. Note:

To achieve the export forecast MAT June 292ML it will require a strong performance in Jan – June 2024 with 144ML ex NZ shipments, this is 25ML or 21% above the same period last year. The forecast is based on continued positive depletion demand in key markets and a rebalancing of the timing of NZ shipment demand between H1 and H2**, back to a weighting similar to 2018 and 2019. This rebalancing is driven from lower in-market stock levels, stronger promotional programs for NZ wine, and continued depletion growth (off shelf or wine list) in key export markets.
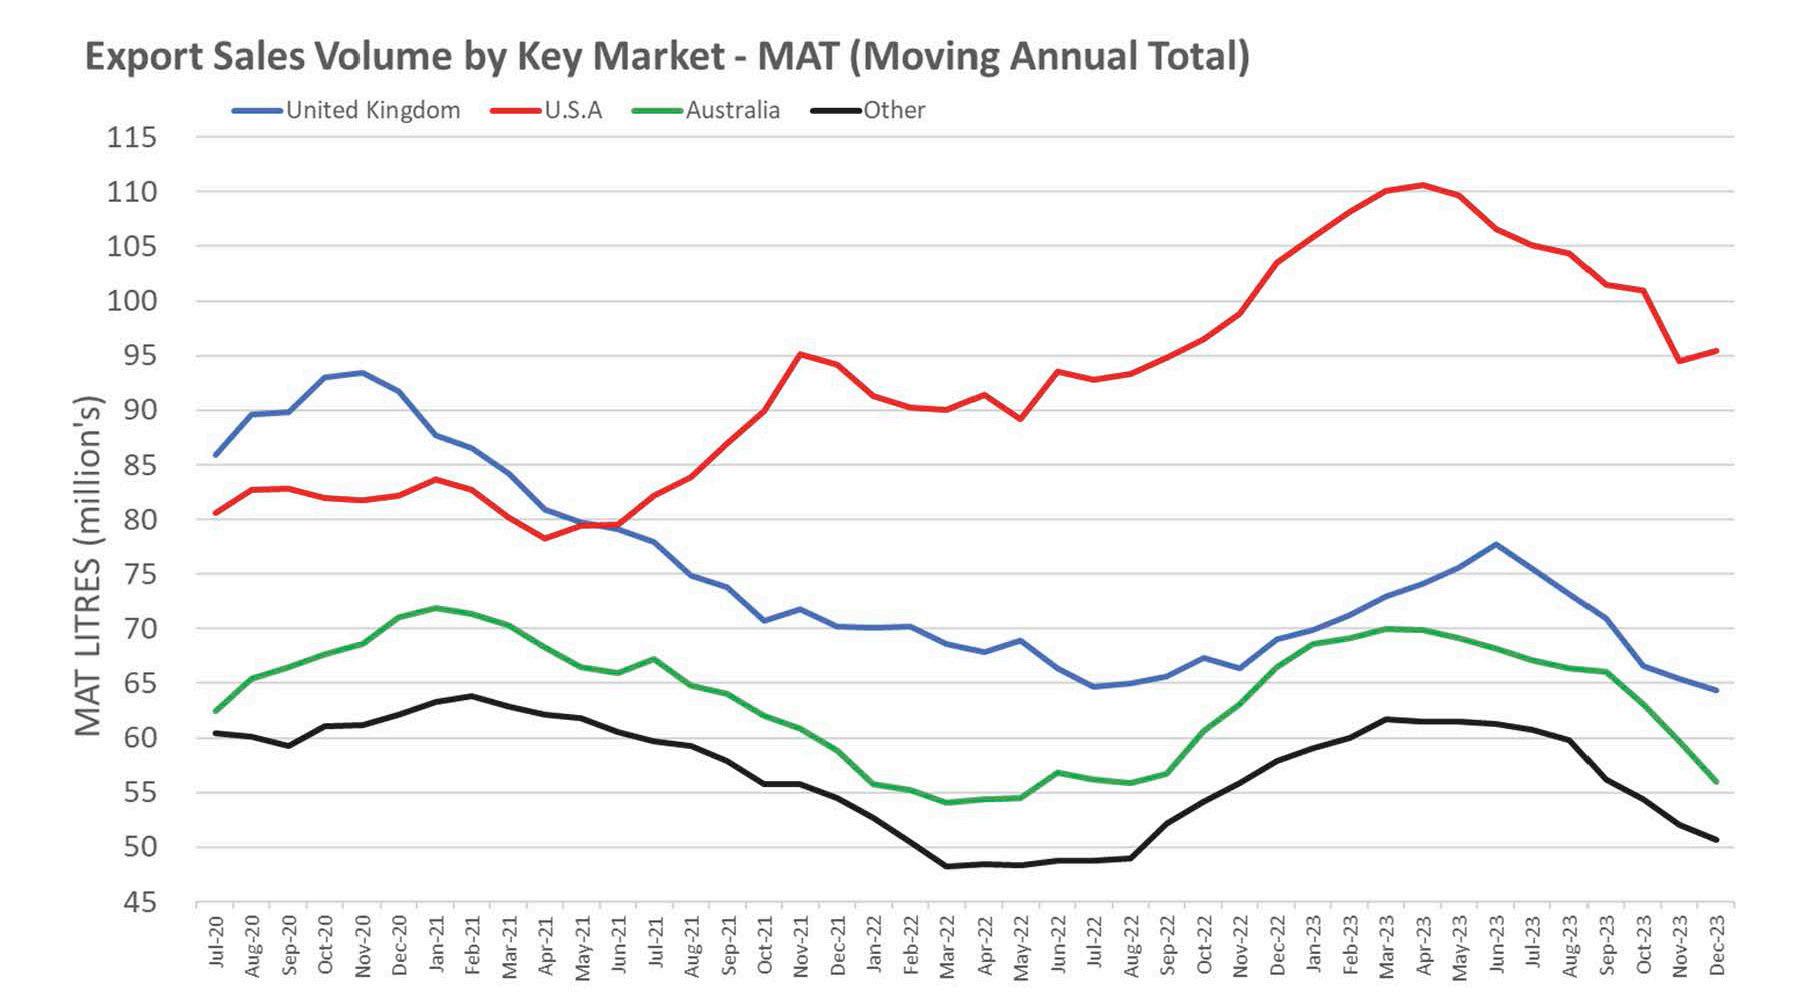
The chart below illustrates the volatility over the last 4 years creating a strong weighting of H1** export demand throughout the 2020-2022 period. The H1 growth in 2020 was driven from the uncertainty of demand (from the pandemic) leading to a surge in shipments to the UK (supported by a record 2020 harvest at the time). The 2021 H1 demand was the beginning of step change growth in the US resulting in 18% growth or +14.6ML. Achieved from a very low 2021 harvest. Over this period shipments to all other key markets were in decline. The 2022 H1 demand was exceptional driven from low in-market stocks and positive in-market depletions. This step change in demand was led by the US and supported by UK, AU, and other key markets. A natural response to constrained demand becoming unconstrained.
From April 2023 the trend turned from a peak MAT 316ML dropping to the current December 2023 MAT 266ML. August 2022 was that last time it was at this level. The performance in December 2023 month suggests an early sign of a turnaround with 28.8ML shipped, the highest export month since December 2022.
* * H1 and H2 = H1 is July – December period (1st half of the year). H2 is the January – June period (2nd half of the year)
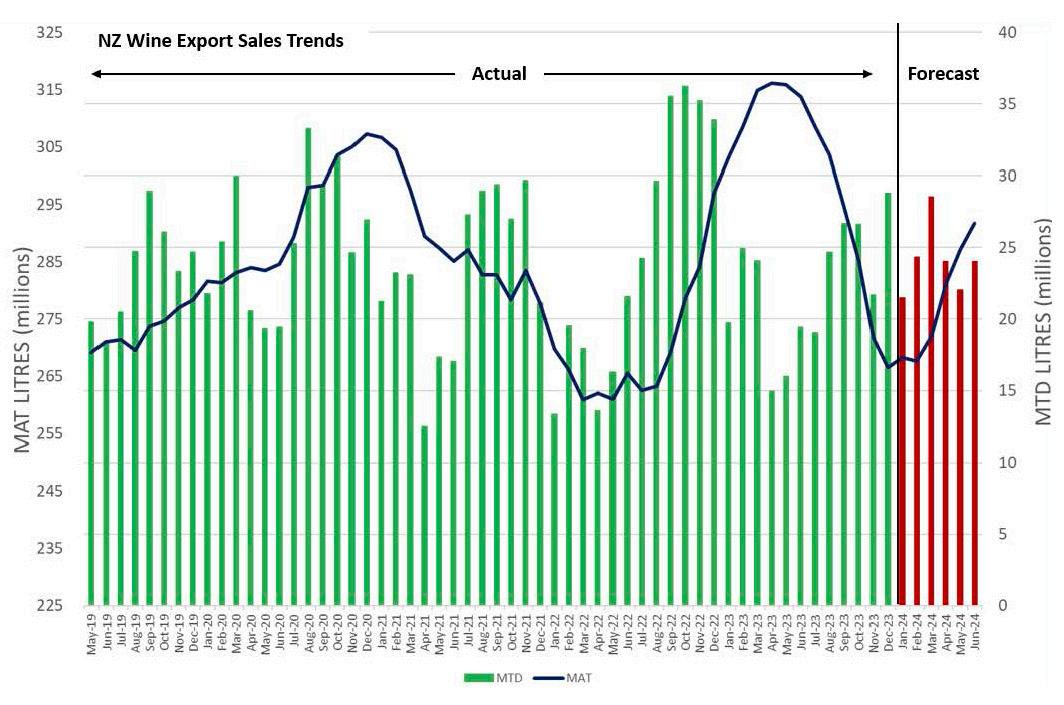
Note: each year is based on a 30th June year end.
Source: New Zealand Winegrowers reports: NZ Wine Export Reports. 2024 Forecast is from JPEW Advisory Ltd.
The MAT decline in export shipments in April – December 2023 is 49ML or 15.5%. This has been consistent across all key markets, led by the US (-15ML), AU (-14ML), and UK (-10ML), with all Other markets (-10ML). December 2023 illustrates the turnaround of this trend in shipments to the US.
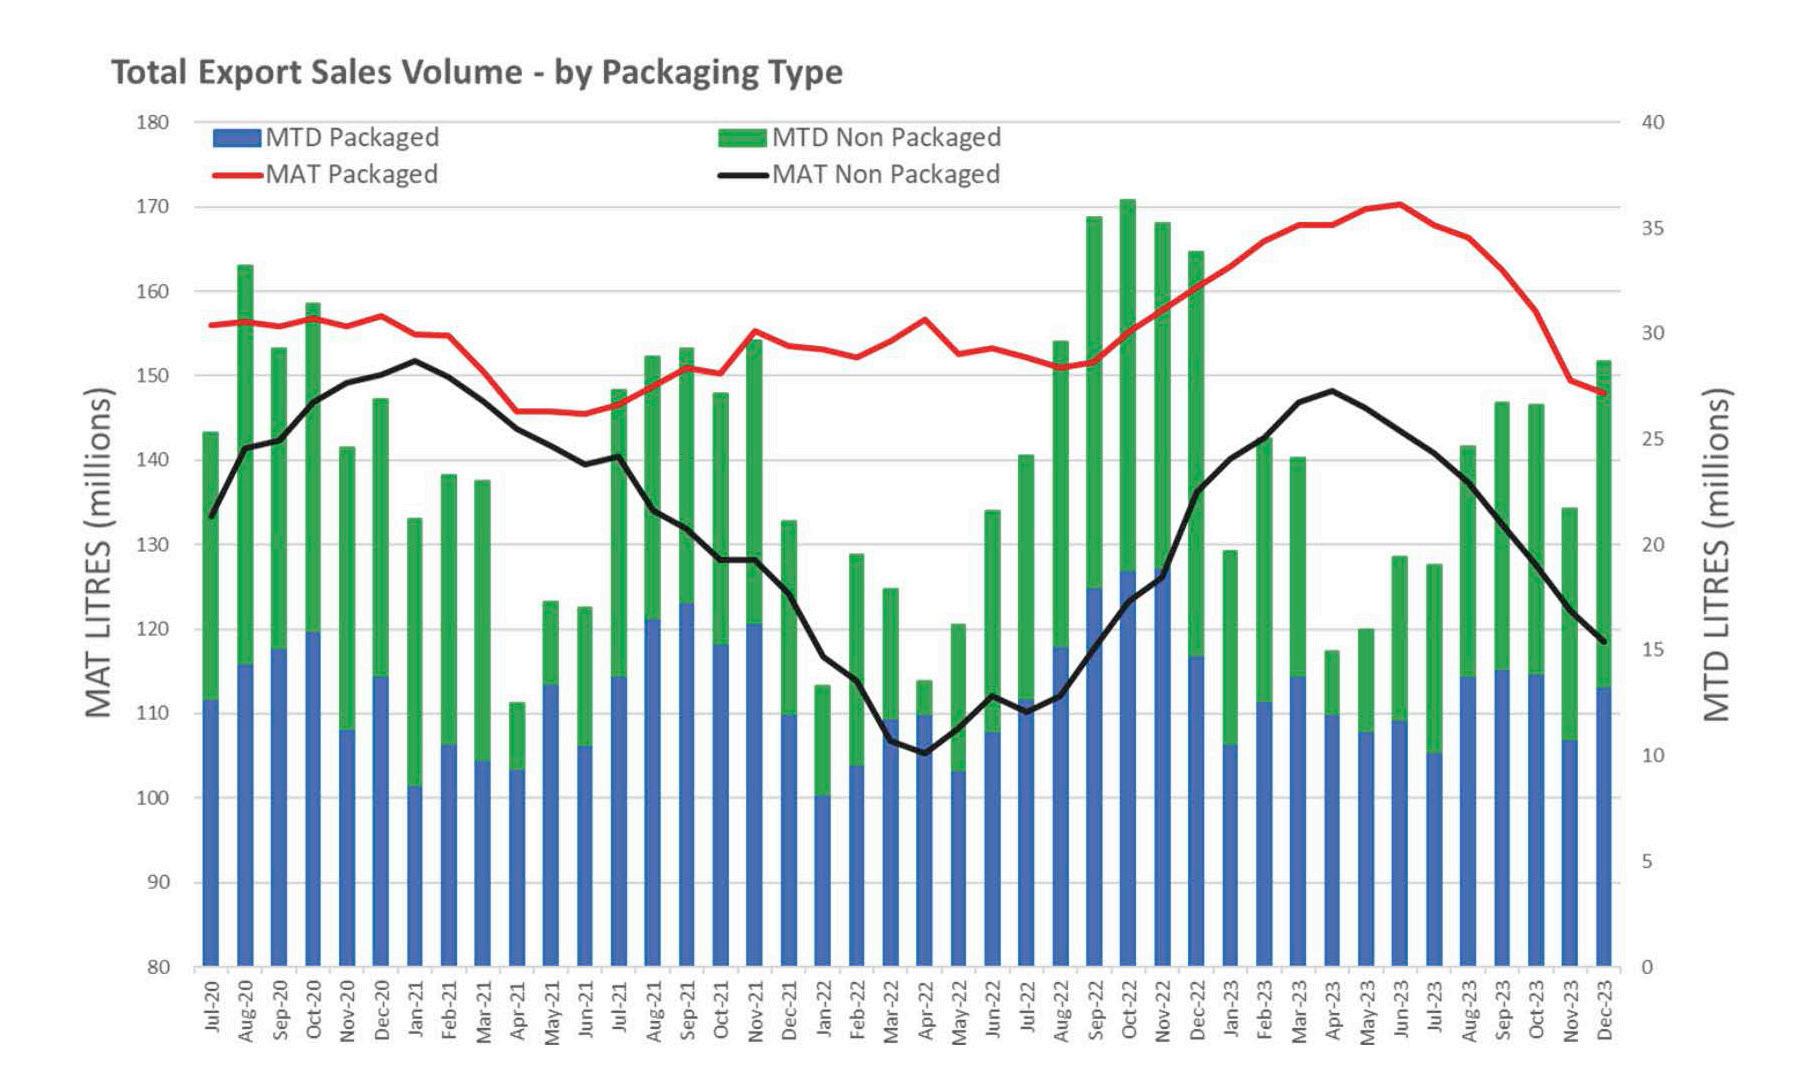
The MAT decline from April was due to non-packaged wine as packaged wine exports continued to grow until June 2023, since then they have both been in decline. December 2023 has a reduction in the rate of decline for packaged wine. Source: New Zealand Winegrowers reports: NZ Wine Export Reports.

This chart illustrates the historic relationship between total Marlborough supply with the global sales volume, we then overlay the trend of Marlborough Sauvignon Blanc grape prices to identify a correlation. Global sales volume over the last 20 years has been a great NZ success story. Supply constraints (decline in vintage supply) adversely impacts global sales volume the following year (July to June) highlighted with V12, V15, and V21. The global demand forecast decline in F24 is different as it is not due to a supply constraint.
From a steady rise in grape prices between 2013-2021 there was an 18% increase from 2020 to 2023, to a record $2,391 per tonne.
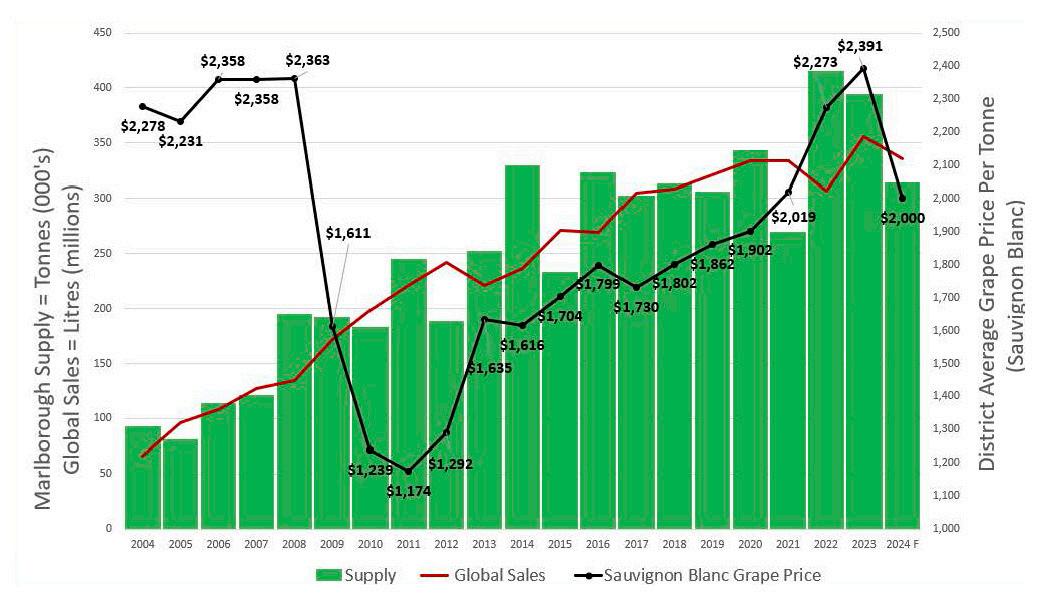
The vintage 2024 grape price forecast for Marlborough Sauvignon Blanc is $2,000 per tonne, inline with the 2021 grape pricing. It is estimated the grape pricing will fall within a range between $1,900 to $2,400 per tonne. This is dependent on the grape pricing strategy of each winegrower business.
This forecasted correction in grape pricing is the first since vintage 2017 however the size of the forecasted correction is higher.
The chart above illustrates a correlation between levels of supply, demand, and the movement in grape prices. After two record harvests in 2022 and 2023 combined with a softening in demand the current landscape has moved into a temporary over supply position, resulting in the lower forecasted grape price in 2024.
Grape pricing beyond vintage 2024 may increase as the 2024 harvest is forecasted to be a 20% below the previous year. Any future movement in grape price will be dependent on the performance of global demand in 2024 and 2025 (each demand year is based on a 30th June year end).

We wanted to understand how much Sauvignon Blanc was sold after July the year after vintage (V16 carryover = the volume of V16 sold after July 2017). This is referred to as carryover inventory on the basis that a vintage is usually released in June of the same year as vintage.
Our approach was to calculate the Sauvignon Blanc export volumes sold as carryover inventory believing this sample size is large enough to build a picture. To place this approach in context, Sauvignon Blanc is 89% of MAT December 2023 export volume and export volume is 87% of global sales volumes. The total NZ Sauvignon Blanc supply (378K T) is 78% of total V23 NZ tonnes and Marlborough Sauvignon Blanc is 92% of total NZ Sauvignon Blanc tonnes.
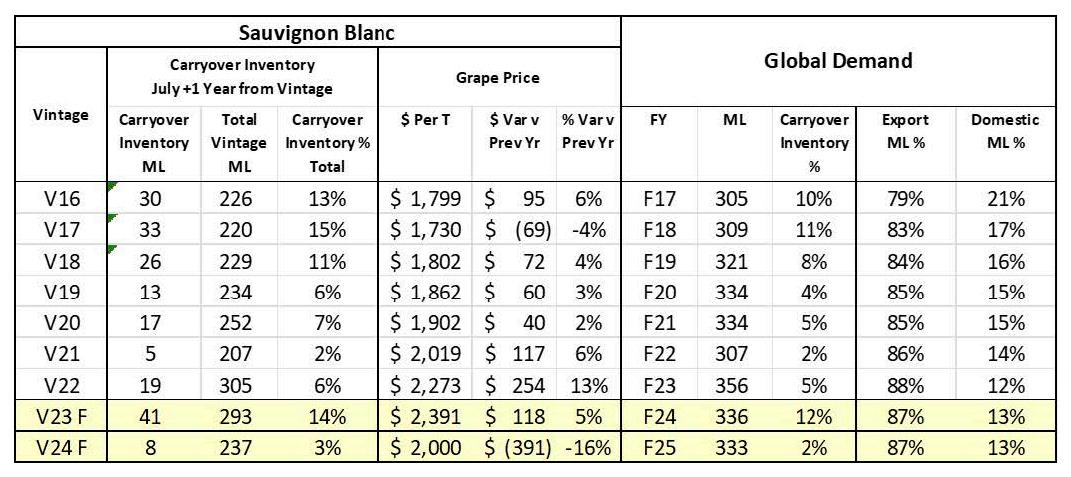
Historical patterns illustrate V16-18 carryover inventory was +10% of the total Sauvignon Blanc supply, grape pricing was level and the carryover inventory cover to global sales ranged between 8-11%. Between V19-22 carryover inventory dropped to 2% for V21. Over this period grape prices increased rom $1,862 to $2,273 per tonne.
Carryover levels build from the record V22 supply where carryover inventory increased to 19ML.This has been sold and the focus is managing the V23 carryover (forecast 41ML) due to a reduction in the global demand (F24 forecast). This level of carryover inventory will be the highest since 2016 but inline at 14% with V16 and V17 as a % of Total Sauvignon Blanc supply.
The expected decline in the V24 grape price correlates with the high V23 carryover position where winegrower businesses manage high current inventory and weaker demand. If the forecasted turnaround in export shipments (Jan-June 2024) does not happen then the V23 carryover level will increase.
The lower V24 supply combined with a lower grape price will adversely impact vineyard profitability after two successful years.
The forecasts (highlighted yellow in the table above) achieve F24 global demand of 336ML and hold this the following year. It is expected the V23 carryover inventory will be sold in F25. Resulting in a lower V24 carryover inventory level due to the lower V24 harvest. The key lever is achieving the F24 and F25 global demand forecasts.


+64 27 837 3420 | john.wilson@jpew.co.nz | www.jpew.co.nz
WE PROVIDE SPECIALIST WINE INDUSTRY SERVICES, ADVICE, AND INSIGHTS TO IMPROVE YOUR BUSINESS PERFORMANCE.
REQUEST A FREE NO OBLIGATION CONSULTATION.
DISCLAIMER This document is published solely for informational purposes. It has been prepared without taking account of your objectives, financial situation, or needs. Before acting on the information in this document, you should consider the appropriateness and suitability of the information , having regard to your objectives, financial situation and needs, and, if necessary seek appropriate professional or financial advice. We believe that the information in this document is correct and any opinions, conclusions or recommendations are reasonably held or made, based on the information available at the time of its compilation, but no representation or warranty, either expressed or implied, is made or provided as to accuracy, reliability or completeness of any statement made in this document. Any opinions, conclusions or recommendations set forth in this document are subject to change without notice and may differ or be contrary to the opinions, conclusions or recommendations expressed. Neither JPEW Advisory Limited nor any person in volved in the preparation of this document accepts any liability for any loss or damage arising out of the use of all or any part of this document. Any projections and forecasts contained in this document are based on a number of assumptions and estimates and are subject to contingencies and uncertainties. Different assumptions and estimates could result in materially different results. JPEW Advisory Limited does not represent or warrant t hat any of these valuations, projections or forecasts, or any of the underlying assumptions or estimates, will be met.