
MARCH 2023
MARLBOROUGH
IMPACT
“ RECORD EXPORT GROWTH FROM A YEAR OF TWO HALVES”
A respected business commentator highlighted the importance of having a strong NZ agricultural export sector. To achieve this the key areas of focus are; control the cost base, manage the debt levels, and sell like hell.
NZ wine globe demand over the last 12 years has been growing consistently at 3.5–4.0% year on year, it is forecasted to achieve MAT 370ML by June 2023. The upcoming 2023 vintage becomes a key vintage to maintain this steady growth trend.
NZ wine export volume and value is rebounding off the back of the 2022 vintage. Current export MAT $2.3b is forecasted to achieve $2.5b by June 2023.
Demand is driven from developing availability to consumers, achieved by increasing access to new export markets combined with greater penetration into existing markets. To maintain relevance the continuity of supply becomes critical to ensure customers have confidence to range or list NZ wines. In Jan–Jun 2023 the forecasted sales growth will help smooth the demand curve across the year to provide consistent supply for customers and consumers.
KEY INSIGHTS:
1. The domestic market continues to be the 4th largest market (in volume) for NZ wine. The current MAT 40ML is in decline as consumers trade up into higher price points and the price increases have an adverse impact on volume sales. Driven by the trade and wine suppliers looking to improve profit margins.
2. Export demand is achieving records levels in $ value driven from record volumes exported (Sept-Dec 2022) combined with a higher $ per litre return. Sauvignon Blanc growth at 9% (+22ML) drives export growth, all other export varieties are in decline.
3. The USA market achieved MAT 104ML in Dec 2022, the first export market to break through 100ML. Resulting from 18 months of step change growth, 29% since June 2021.
4. The release of the 2022 vintage has seen 7% growth in packaged wine exports combined with the re emergence and steady growth of non packaged wine exports.
5. 2023 is the year of two halves as increased supply from the 2022 vintage builds a smoother demand curve over the July 2022 – June 2023 period. Providing consistency and confidence for export customers.
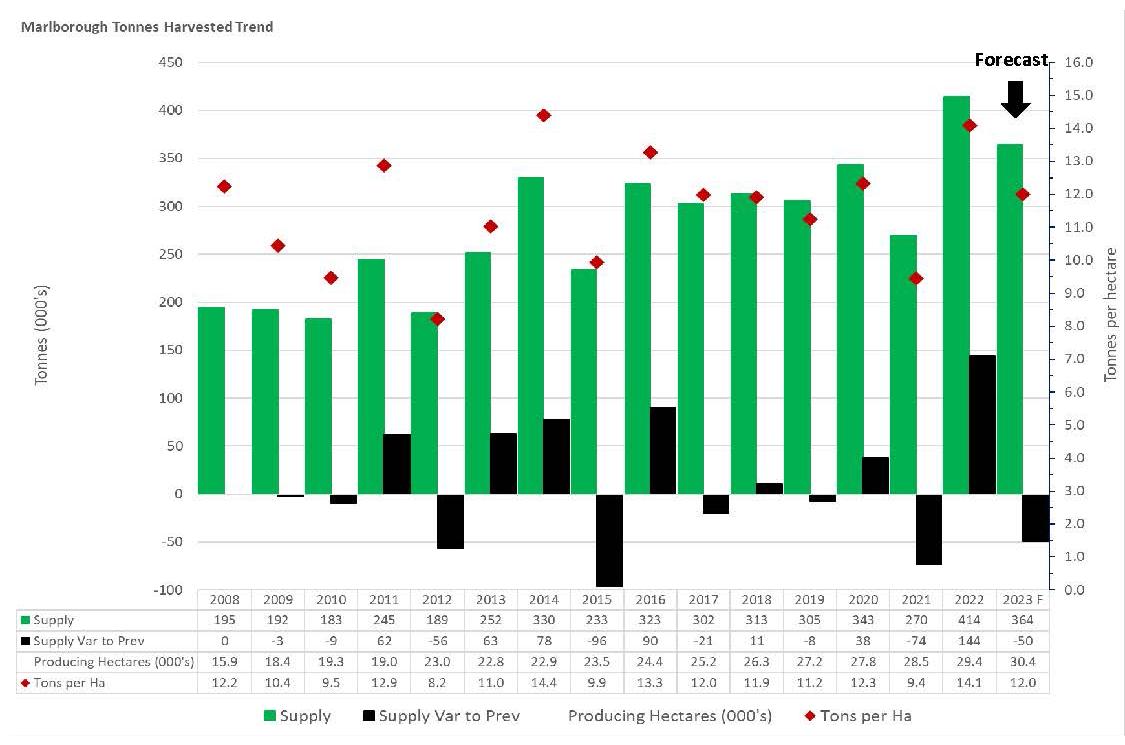
6. Our Marlborough 2023 vintage forecast is 364,464 tonnes. This includes all sub regions and grape varieties from 30,400 producing hectares. It assumes an average 12 tonnes per producing hectare.
MARLBOROUGH SUPPLY TRENDS
The forecast for the Marlborough 2023 vintage is 364,464 tonnes. It is based on 30,372 producing hectares which is 986 hectares above the previous vintage. This forecast is marginally above the 3 year average and based on 12T per producing hectare. The 3 year average yield between the 2020–2022 vintage is 342,186 tonnes. This includes the yield volatility of the last two vintages and is inline with the 2020 vintage. The 3 year average yield per producing hectare is 12T, this is consistent to the 10 year average. The outlier was vintage 2022 delivering 14 tonnes per hectare. Since 2008 this has only been achieved once before, in 2014.
KEY POINTS:
• 2023 F is the 2023 vintage forecast purely based on analytical trends at a macro level.
• This chart includes all sub regions and grape varieties within Marlborough.
• Climate change, water availability, bud initiation, labour supply, trunk disease, time lag of new planted and producing ha are all recognised as impacting on harvest yields.
 Source: Vintage 2012–2021 statistics from New Zealand Winegrowers Inc Annual Report 2022. Vintage 2022 from New Zealand Winegrowers Vintage Survey Report. Vintage 2023 hectares from Marlborough Wine Industry Growth projected hectares in production. Forecast is from JPEW Advisory Ltd.
NZ WINE GLOBAL SALES TRENDS
Global demand is forecast to achieve a new record of 370ML (by June 2023) resulting in a *CAGR of 3.9% over a 12 year period (2012–2023).
With the exception of 2022 (due to constrained supply) the CAGR growth has been consistently within the 3.5–4.0% range. All growth has been achieved with export sales countering a decline of NZ Wine sold in the domestic market.

Achieving the Marlborough 2023 vintage forecast of 364,464 tonnes will be important to maintain export sales volumes into 2024.
NZ wine sold in the domestic market MAT is forecast to decline to 39 ML. The recent decline commenced in August 2021 (MAT 49 ML) due to supply constraints from 2021 vintage and has continued (in the last 6–12 months) due to increases in the retail price per bottle, resulting in a decline in volume sold. This is having a marked impact on volumes sold in the domestic market as suppliers look reposition pricing to maintain or improve profit margins.
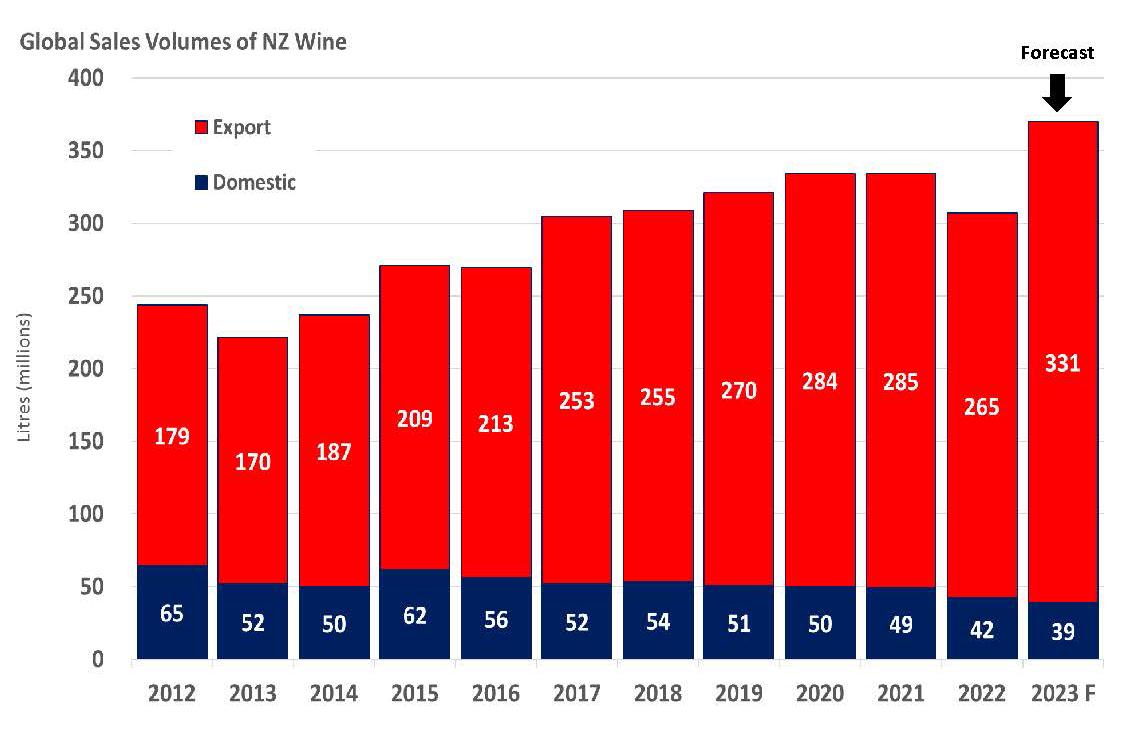
* CAGR = Compounding Annual Growth Rate is the year on year % growth between periods (2012–2023)
Note: each year is based on a 30th June year end.
Source: New Zealand Winegrowers reports: NZ Domestic Market Reports & NZ Wine Export Reports. Forecast is from JPEW Advisory Ltd.NZ WINE EXPORT SALES TRENDS
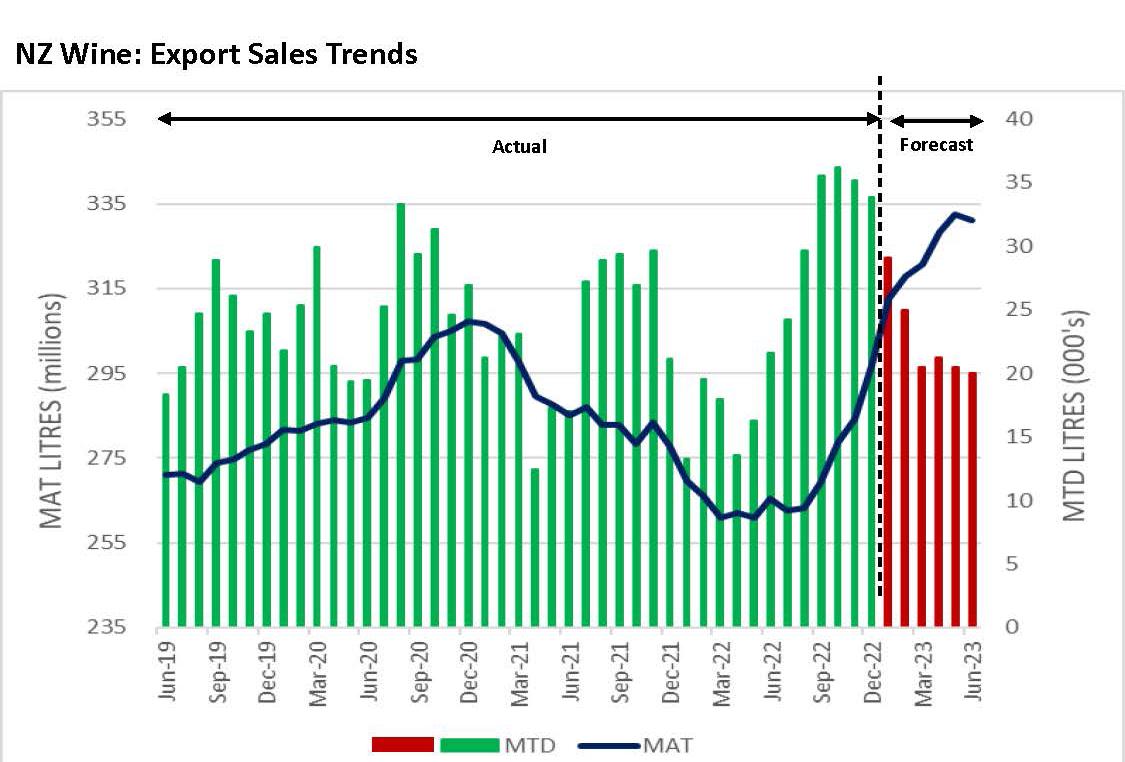
Current (Dec 2022) export MAT 297ML has rebounded from the low point of 260ML (May 2022). Export volume of 297ML was last achieved in Aug 2020. This rebound has been driven from an outstanding Sep–Dec 2022 period, averaging 35ML per month.
The export MAT forecast is 331ML (by June 2023) led by continued growth in the US market. Achieving this full year forecast requires export volume of 136ML over the Jan–Jun 2023 period, growth of 34ML (+33%) from the same period last year.
This forecast is based on the need to provide continuity of supply and build consistent in market stock levels. Similar export volumes (136ML) were achieved in Jan–Jun 2019.
Forecasted growth will restore depleted in market export stocks to ensure consistency in supply for export customers. This consistent availability is critical to connect with consumers and build customers confidence to range and list NZ wine.
A record export MAT $2.26 billion is growing at 16% year on year. Driven from an improved $ per litre ($7.54 LT) in both packaged and non packaged exports. This is forecasted to increase to $2.5 billion, by June 2023.
 Source: New Zealand Winegrowers export market reports. Forecast is from JPEW Advisory Ltd.
SIGNIFICANT CHANGES IN PACKAGING TYPE TRENDS
The release of vintage 2022 has seen the re emergence of non packaged wine exports. The current MAT % ratio between packaged and non packaged wine is currently 56:44.
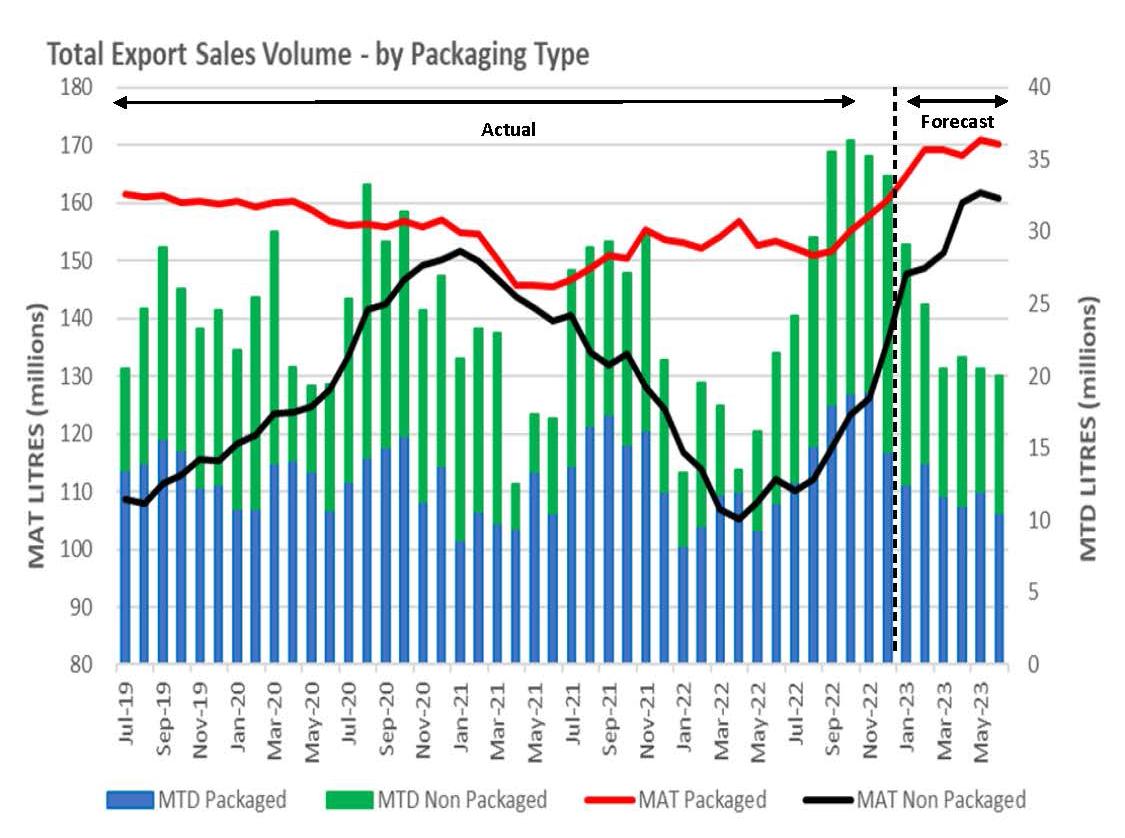

Since August 2022 packaged wine export volume is 7%, resulting in a Dec 2022 MAT 160ML. This MAT level was last achieved in April 2020, just after Pernod Ricard closed their bottling lines thereby reducing local bottling capacity. This has since recovered with a forecast for continued growth.
However, to achieve the export growth in Jan–June 2023 the demand for non packaged wine will also continue to grow at a higher %. Led by the three leading export markets (USA, UK, AU).
We predict the MAT % ratio between packaged and non packaged wine to be 51:49 by June 2023.
Source: all the data above was sourced from New Zealand Winegrowers NZ Wine Export reports. Forecast is from JPEW Advisory Ltd.
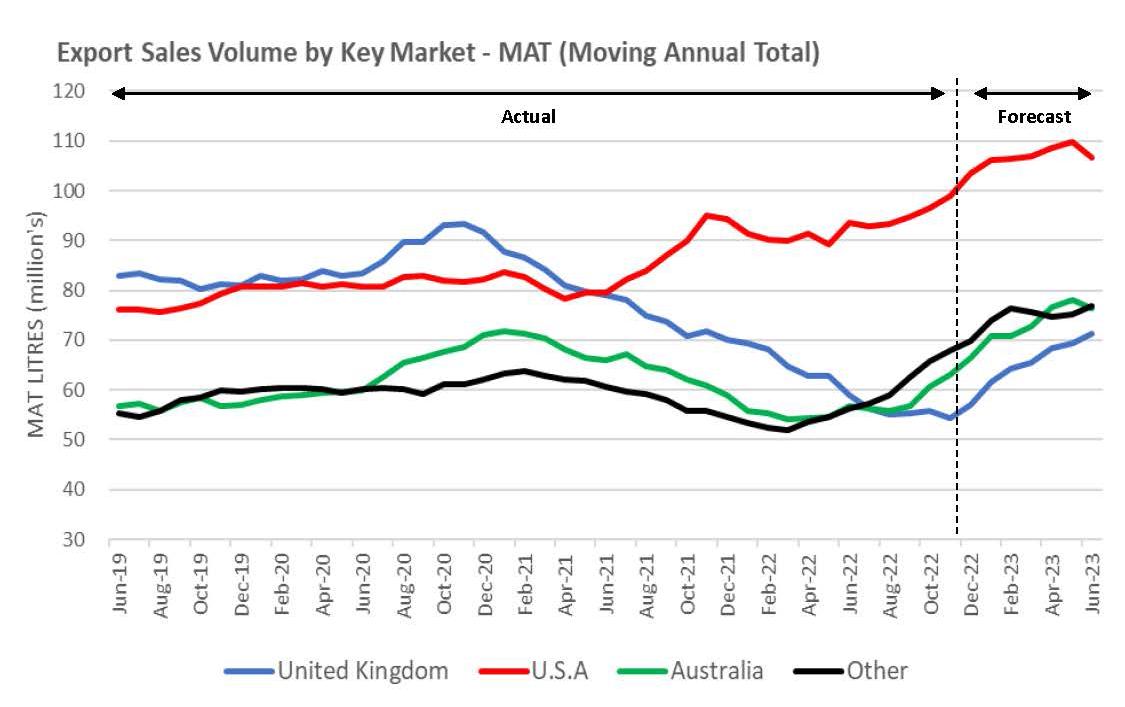
SIGNIFICANT CHANGES IN THE EXPORT MARKET MIX
The USA market achieved MAT 104ML in Dec 2022, the first export market to break through the 100ML barrier. Resulting from 18 months of step change growth, 29% since June 2021. It has been achieved through a MAT % ratio of 67:33 between packaged (69ML) and non packaged (35ML) wine. To achieve this exceptional growth strategic supply positions are now part of the supply framework in Marlborough. This was evident when USA export volume grew 12% (+9.5ML) over the June 2021 to May 2022 period, predominately supplied by the constrained 2021 vintage.
The UK trend is recalibrating from the surge in export shipments in Jun-Dec 2020 and post Brexit trends where historic UK shipments are moving directly to the EU incl IRE (which is in Other MAT in the chart below). The UK is the 2nd largest market in volume, current MAT 69ML is in decline 3% (–2.1ML). Balanced by the combined export volume to the EU MAT 20ML, growing 10% (+2.1ML) led by Germany (10ML, +12%) Ireland (4.1ML, +18%) Netherlands (3.1ML).
Canada is performing well at MAT 14.4ML growing at 10%, all in packaged wine.
Australia at MAT 66ML is growing at 13%, back to volume last achieved in August 2021.
Source: all the data above was sourced from New Zealand Winegrowers NZ Wine Export reports. Forecast is from JPEW Advisory Ltd.

ACHIEVING EXPORT GROWTH REQUIRES A YEAR OF TWO HALVES
To achieve the export forecast of 331ML (by June 2023) it requires significant growth in the second half of the year, compared to 2021 and 2022. However, with all things being equal the H2 forecast in 2023 is achievable as it is inline with H2 export volumes in 2019 and 2020.
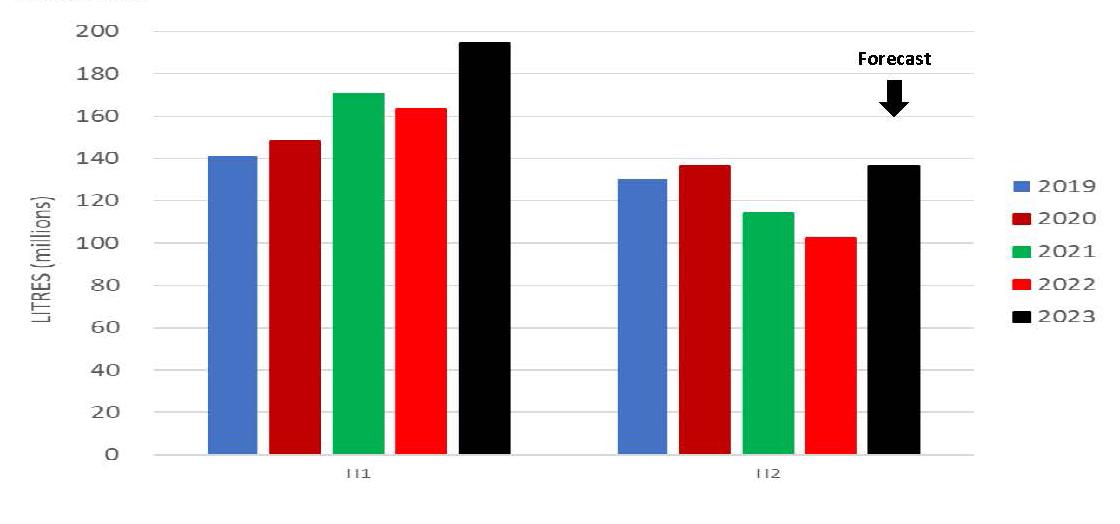
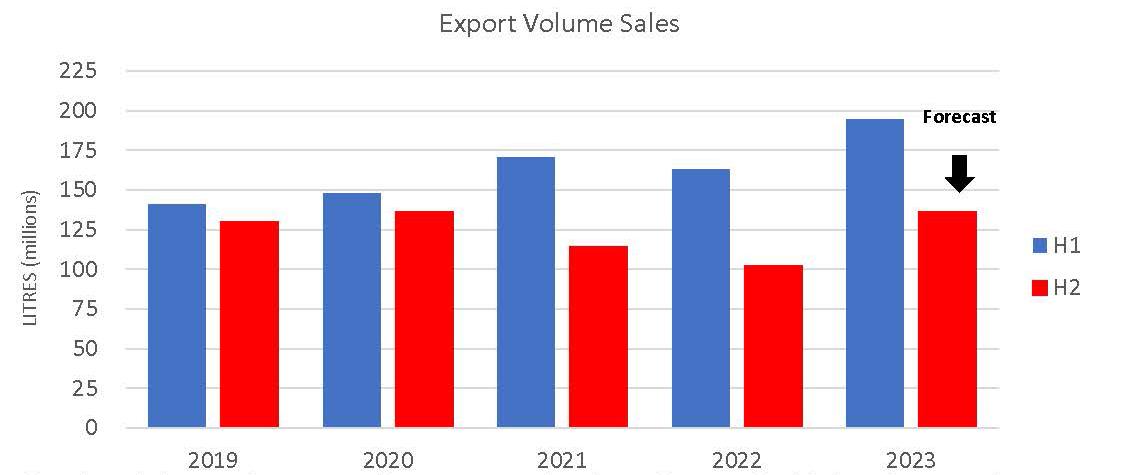
Note: H1 = July–December. H2 = January–June. Year end is June.
The chart below is the same information as the chart above. It highlights the growth in H2 2023 creating a smoother continuous demand curve providing customers with the opportunity to plan promotions, continue category ranging, and confirm wine listings with confidence.
Source: all the data above was sourced from New Zealand Winegrowers NZ Wine Export reports. Forecast is from JPEW Advisory Ltd.

+64 27 837 3420 | john.wilson@jpew.co.nz | www.jpew.co.nz
DISCLAIMER This document is published solely for informational purposes. It has been prepared without taking account of your objectives, financial situation, or needs. Before acting on the information in this document, you should consider the appropriateness and suitability of the information , having regard to your objectives, financial situation and needs, and, if necessary seek appropriate professional or financial advice. We believe that the information in this document is correct and any opinions, conclusions or recommendations are reasonably held or made, based on the information available at the time of its compilation, but no representation or warranty, either expressed or implied, is made or provided as to accuracy, reliability or completeness of any statement made in this document. Any opinions, conclusions or recommendations set forth in this document are subject to change without notice and may differ or be contrary to the opinions, conclusions or recommendations expressed. Neither JPEW Advisory Limited nor any person in volved in the preparation of this document accepts any liability for any loss or damage arising out of the use of all or any part of this document. Any projections and forecasts contained in this document are based on a number of assumptions and estimates and are subject to contingencies and uncertainties. Different assumptions and estimates could result in materially different results. JPEW Advisory Limited does not represent or warrant t hat any of these valuations, projections or forecasts, or any of the underlying assumptions or estimates, will be met.
 JOHN WILSON