


www.ag.tools info@ag.tools May 2023
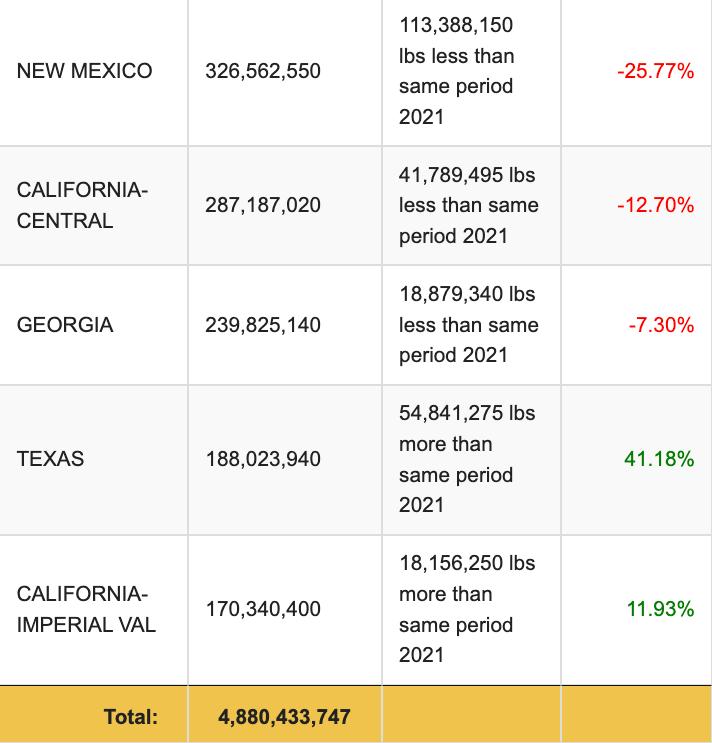
Onions 2022 U.S volume for Onions by Region and Market Share


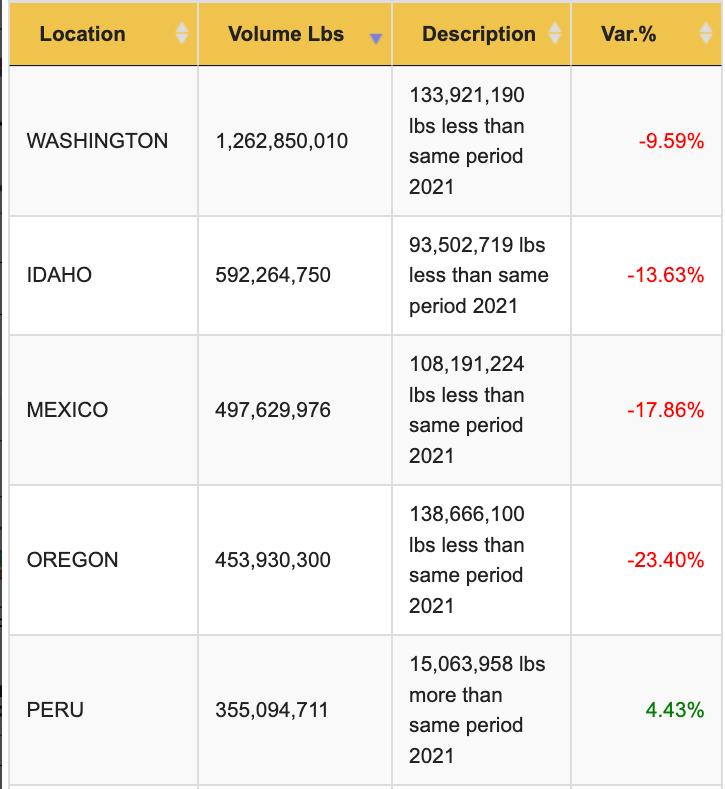
The U.S. onion volume has had minimal volume increases over the last five years with the largest volume decline between 2021 and 2022, -11%. In 2022, all four major onion-producing regions showed a decline in volume with Oregon showing the largest YoY decline at -23.4%.
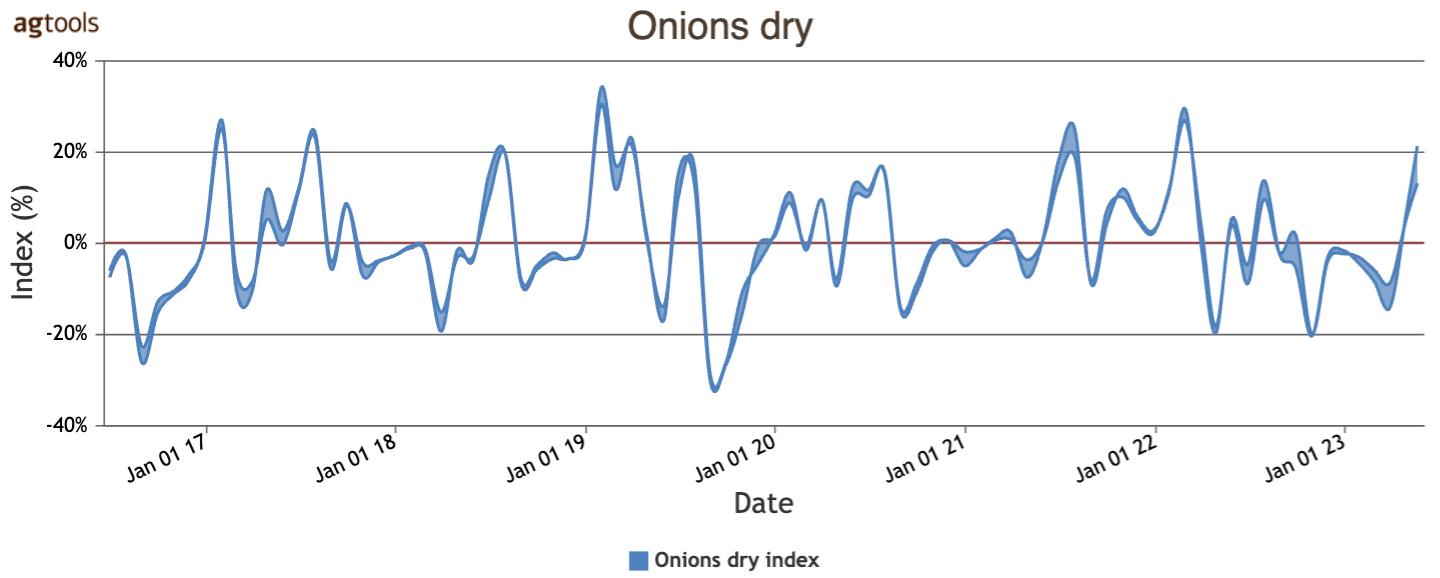
The 7–year rate of FOB change reflects the change in volume with Jan. 2021 showing the least fluctuation than the other timeframes.


Washington holds the #1 market share at 40%, but has been showing very little growth with the largest YoY decline in volume, - 10% between 2021 – 2022. Mexico compensates for the drop in Washington’s volume between June – August.
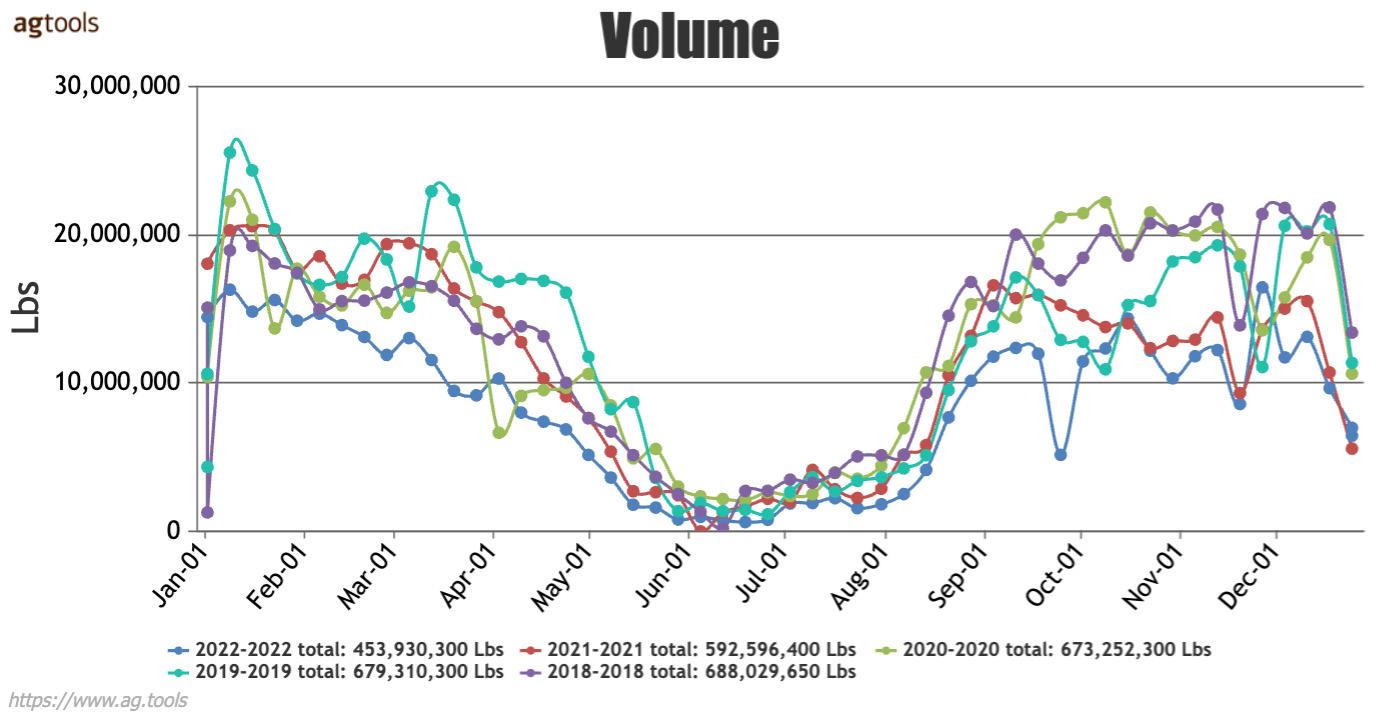
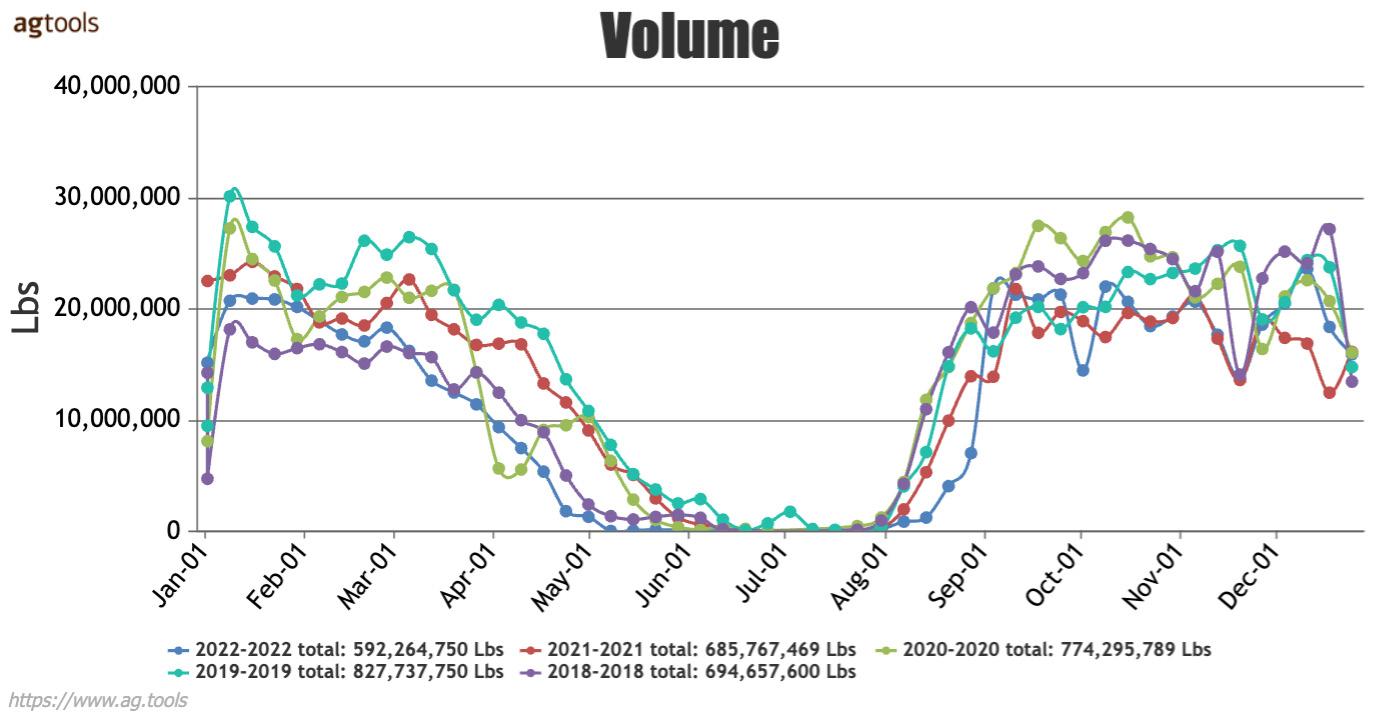
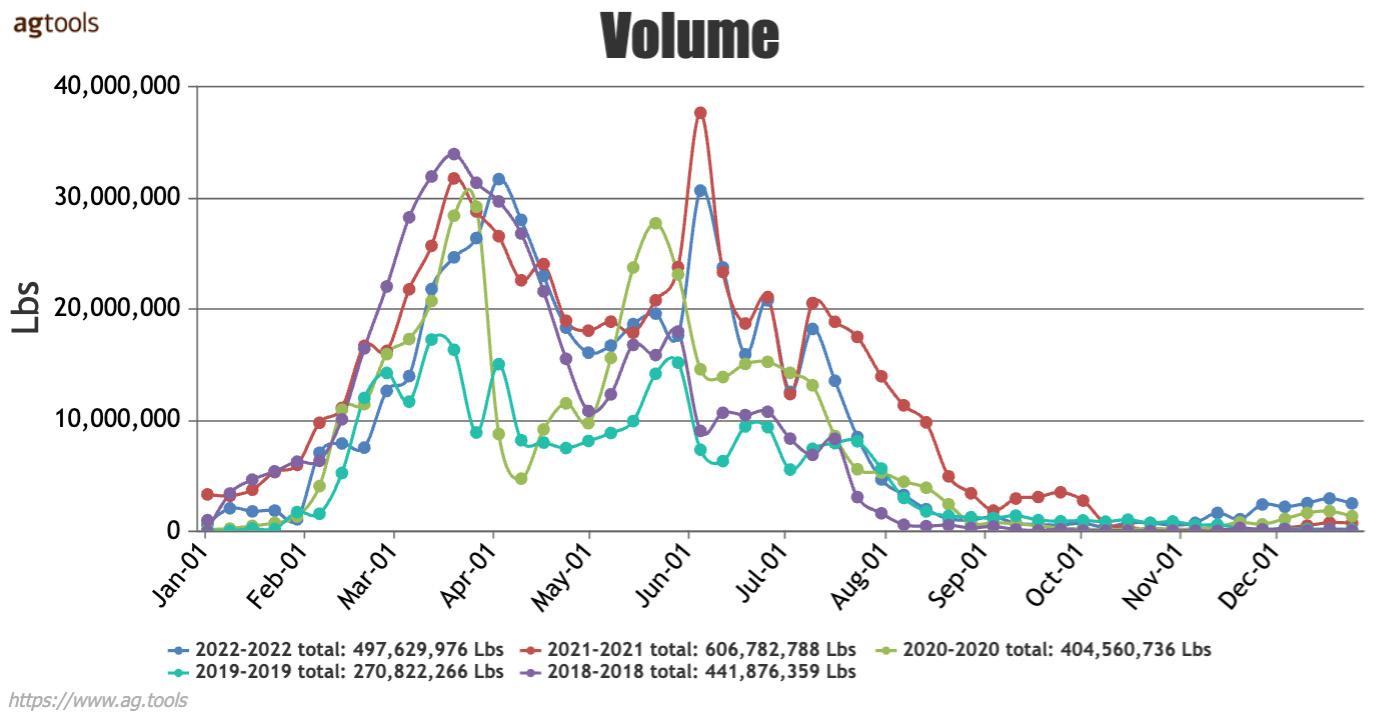
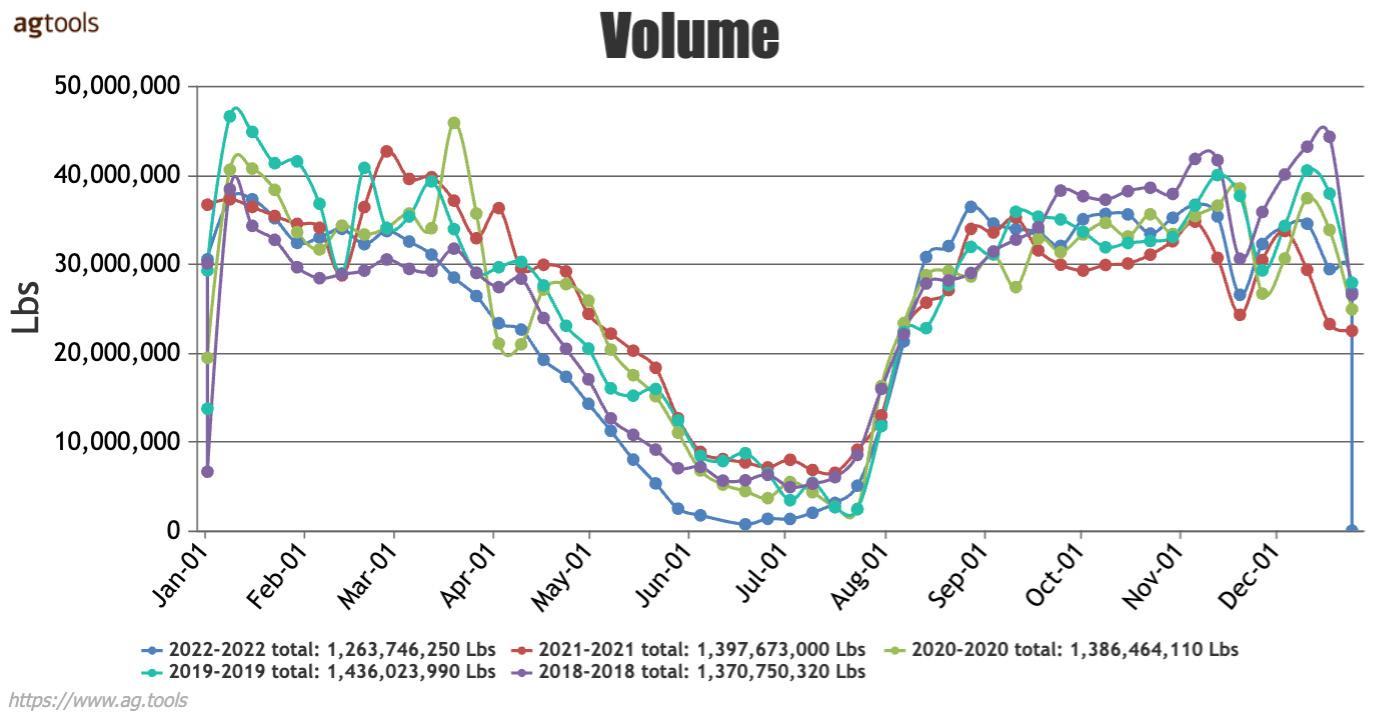
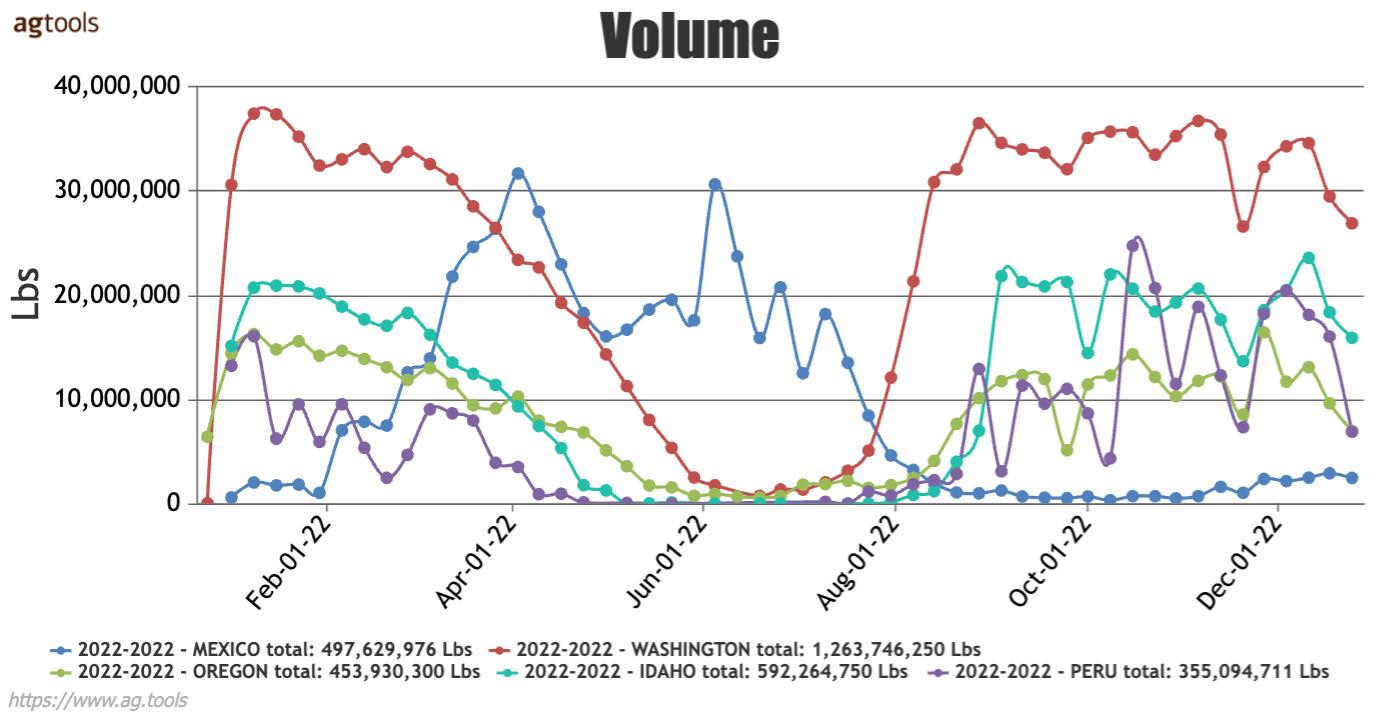
Between 2018 and 2022, Mexico is the only region showing volume growth at 13%. All other regions lost volume with Oregon showing the largest volume loss at -34%, while Washington lost -8% in volume. Idaho lost -15% in volume.


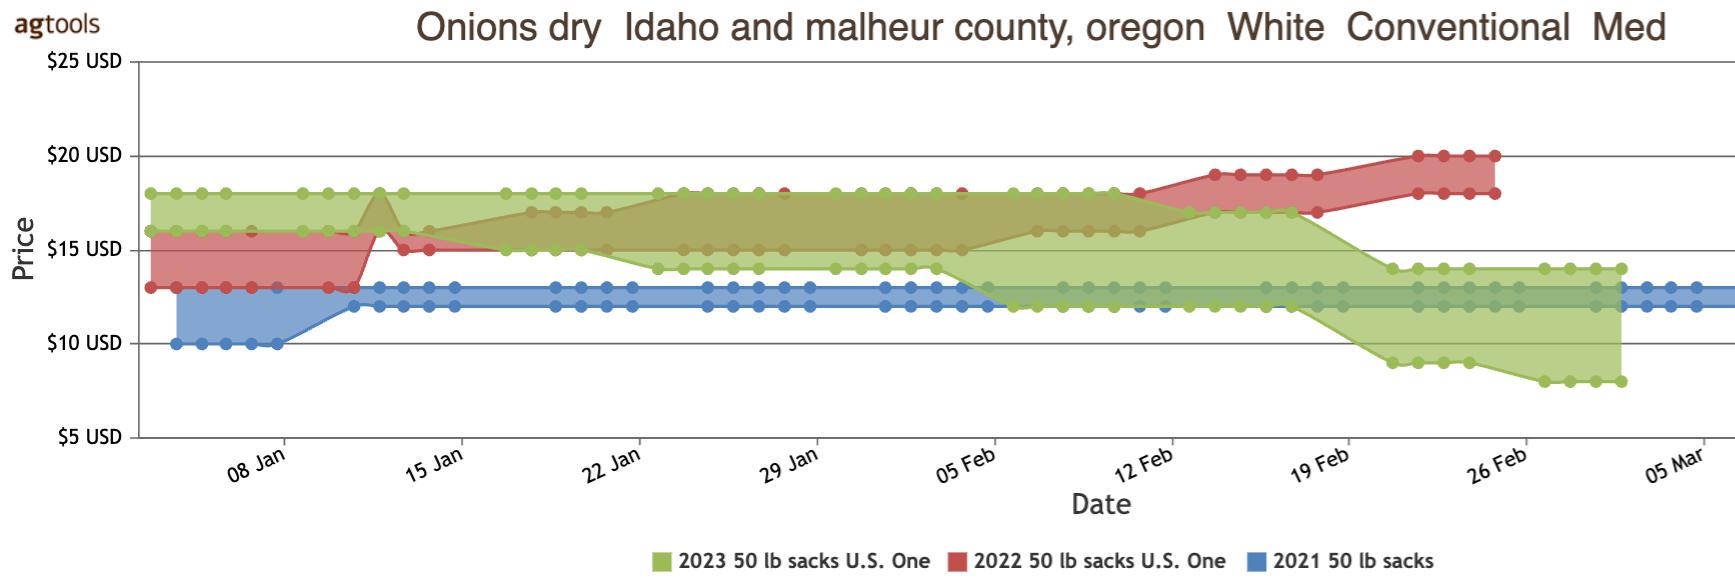
Comparing FOB three-year timeframes for prices between yellow and white conventional medium onions from the Malheur County, Oregon region, white conventional onions show a considerably higher price than yellow for 2023, at $18.00 trending with the 2022 price. By February the 2023 price falls to the 2021 level.
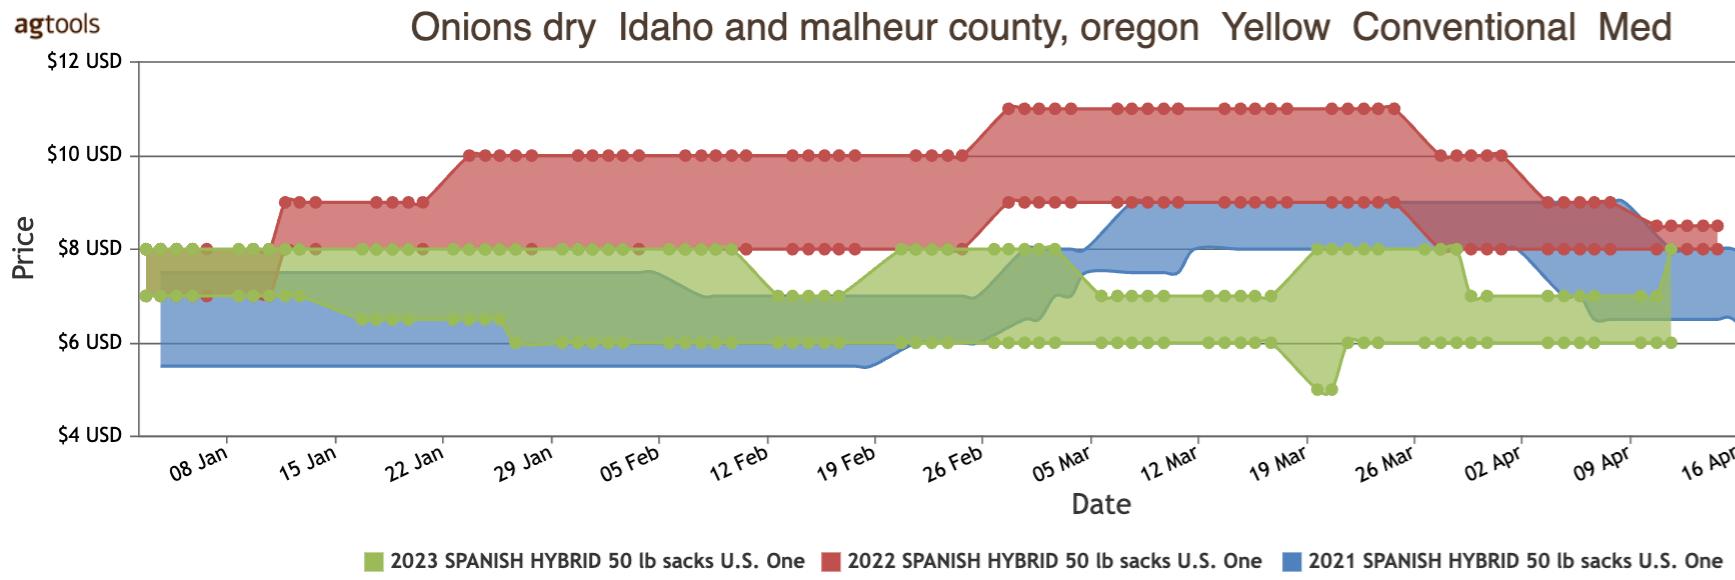
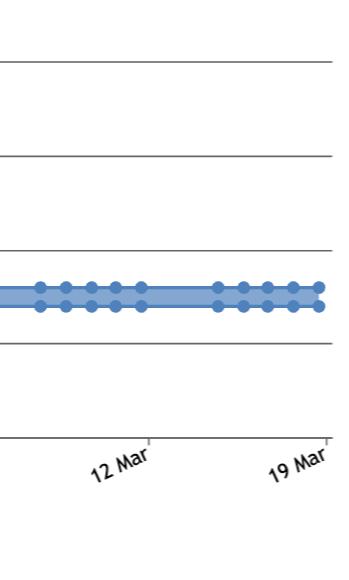
Yellow conventional FOB prices for 2023 start off similar to the 2022 price of $8.00 and trends at that price through February before falling below 2021 pricing. 2022 prices are the highest among the three timeframes.


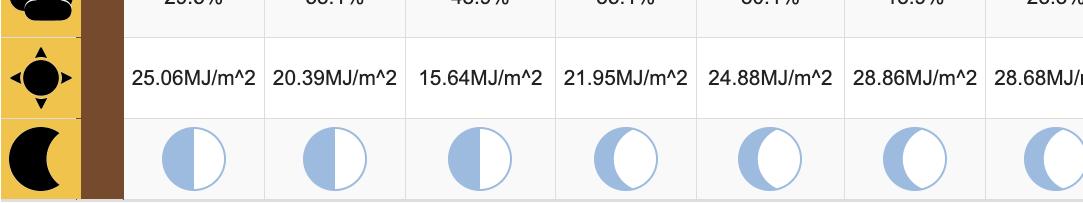
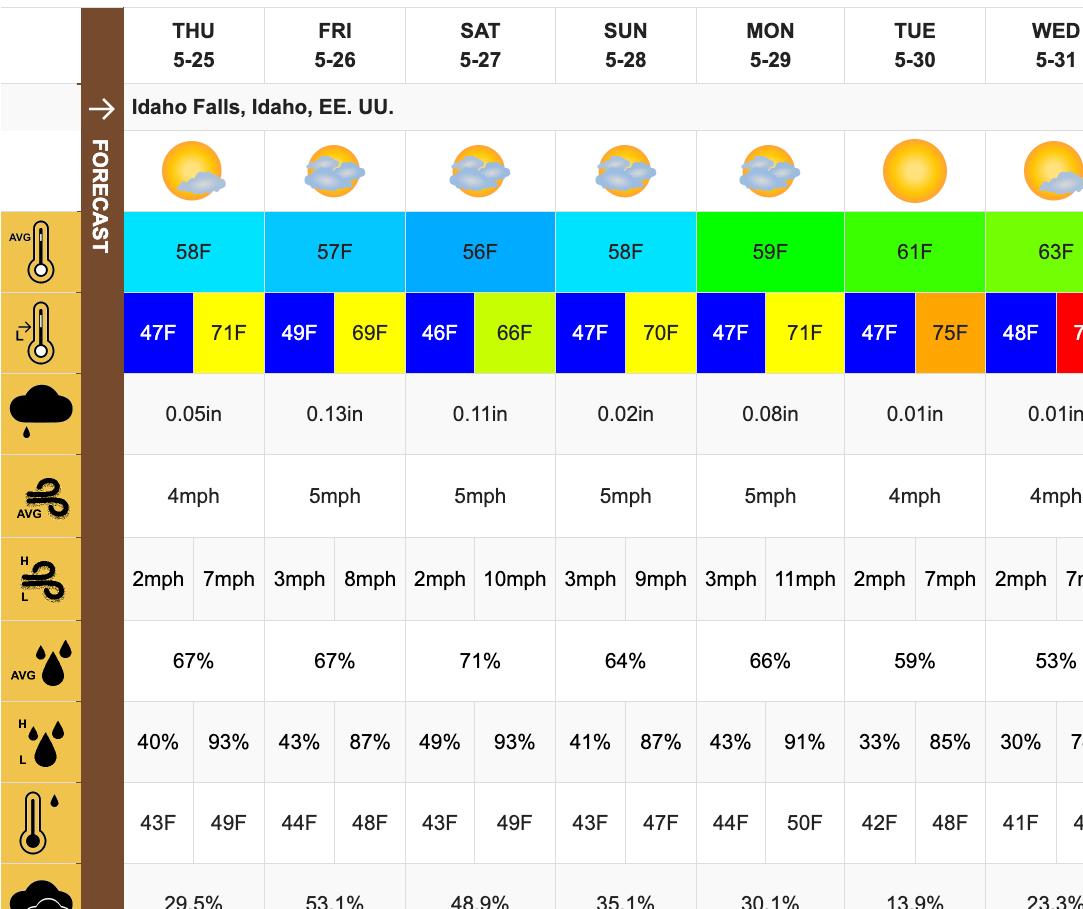
We are looking at two things in the weather charts: The 14-day forecast for the onion-growing region in Idaho Falls, Idaho Comparing weather patterns over three years 2021 – 2023 and how the temperature compares to the ideal minimum and maximum temperatures during this timeframe.


The temperatures beginning with 5/25 show to fall below the ideal minimum temperature for this region gradually warming to fall in the ideal temperature range by 5/29 as shown in the green-shaded areas
In comparing weather trends for 2021 – 2023, in the graph below, 2021 and 2022 show wild temperature trends gyrating between cold and hot as the temperatures fall below and above the ideal minimum and maximum temperatures. 2023 temperatures show a more stable pattern falling within the ideal temperature range.
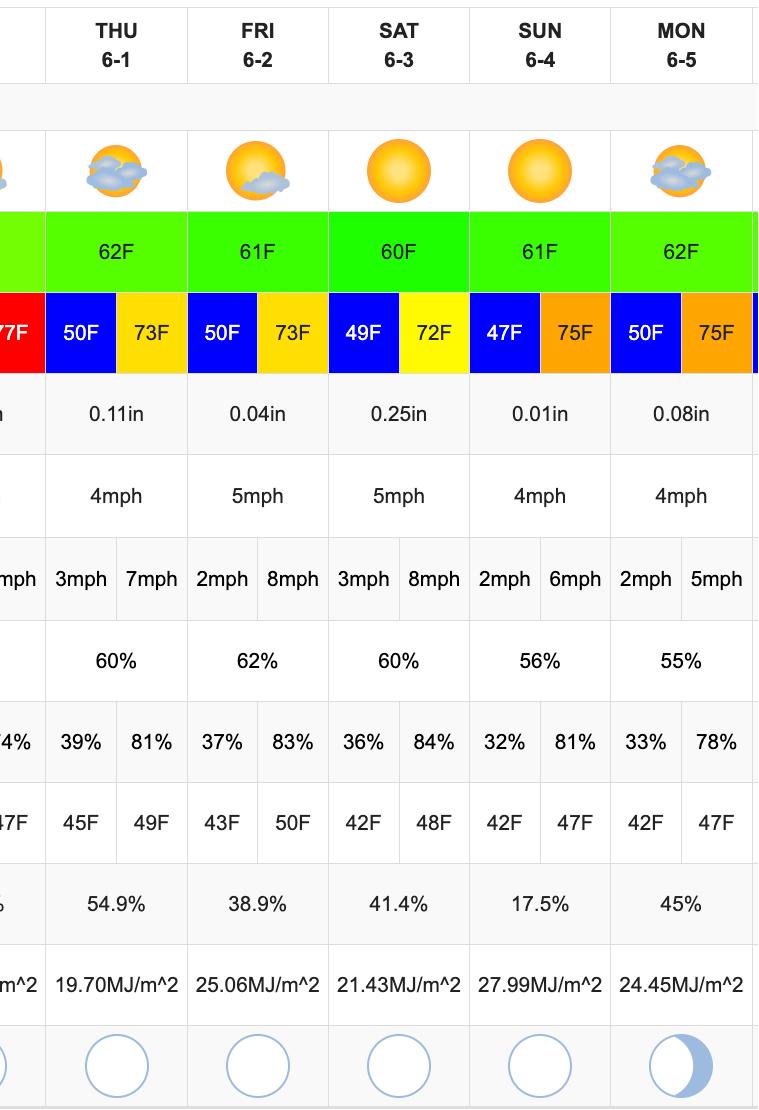
We are looking at two things in the weather charts: The 14-day forecast for the onion-growing region in Idaho Falls, Idaho Comparing weather patterns over three years 2021 – 2023 and how the temperature compares to the ideal minimum and maximum temperatures during this timeframe.
The temperatures beginning with 5/25 show to fall below the ideal minimum temperature for this region gradually warming to fall in the ideal temperature range by 5/29 as shown in the green-shaded areas
In comparing weather trends for 2021 – 2023, in the graph below, 2021 and 2022 show wild temperature trends gyrating between cold and hot as the temperatures fall below and above the ideal minimum and maximum temperatures. 2023 temperatures show a more stable pattern falling within the ideal temperature range.