Trade relations between US and Latin America are experiencing significant growth.
Trade relations between the United States and Latin America have experienced significant growth in recent decades, especially in agri-food exports.
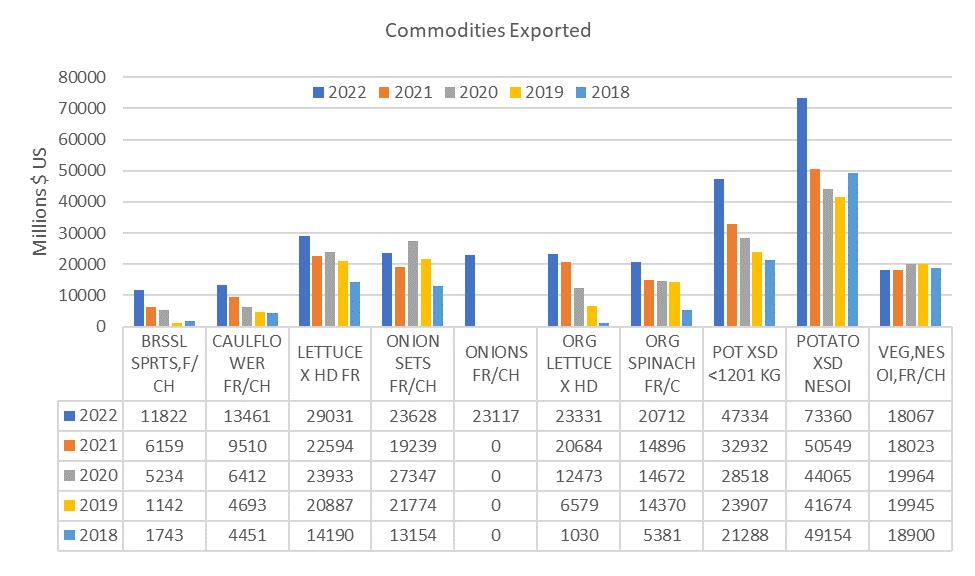
Over the past 28 years, horticultural exports have experienced a significant increase in terms of value. In 1994, the total value of Horticultural Products exports was $1.206 billion, while in 2022 it reached $7.380 billion. Growth was also notable in Other Hort Products, which went from $0.540 billion in 1994 to $3.62 billion in 2022. In the case of Vegetables and Preparations, the value increased from $0.292 billion to $1.791 billion during the same period. On the other hand, the value of Fruits and Preparations exports increased from $0.317 billion in 1994 to $1.407 billion in 2022, while Tree Nuts and Preparations exports grew from $0.054 billion in 1994 to $0.556 billion in 2022. These data demonstrate the importance of fruit and vegetable exports in the global economy and the relevance of these products in international markets. The average annual growth rate of Horticultural Products in this period was 6.68% in economic value and 4.49% in the quantity of products.

The following are the most important changes in exports for the main horticultural products.


The major products that the United States exports to Mexico are Grains & Feeds, Oilseeds & Products, Horticultural Products, Livestock & Meats, and with vegetables: onions, lettuce, shallots. Their demand has increased in recent years. Product quality and transportation infrastructure are key factors in the success of these exports.
powered by See More Achieve More ® ©2023 All Rights Reserved Agtools Inc. www.ag.tools info@ag.tools
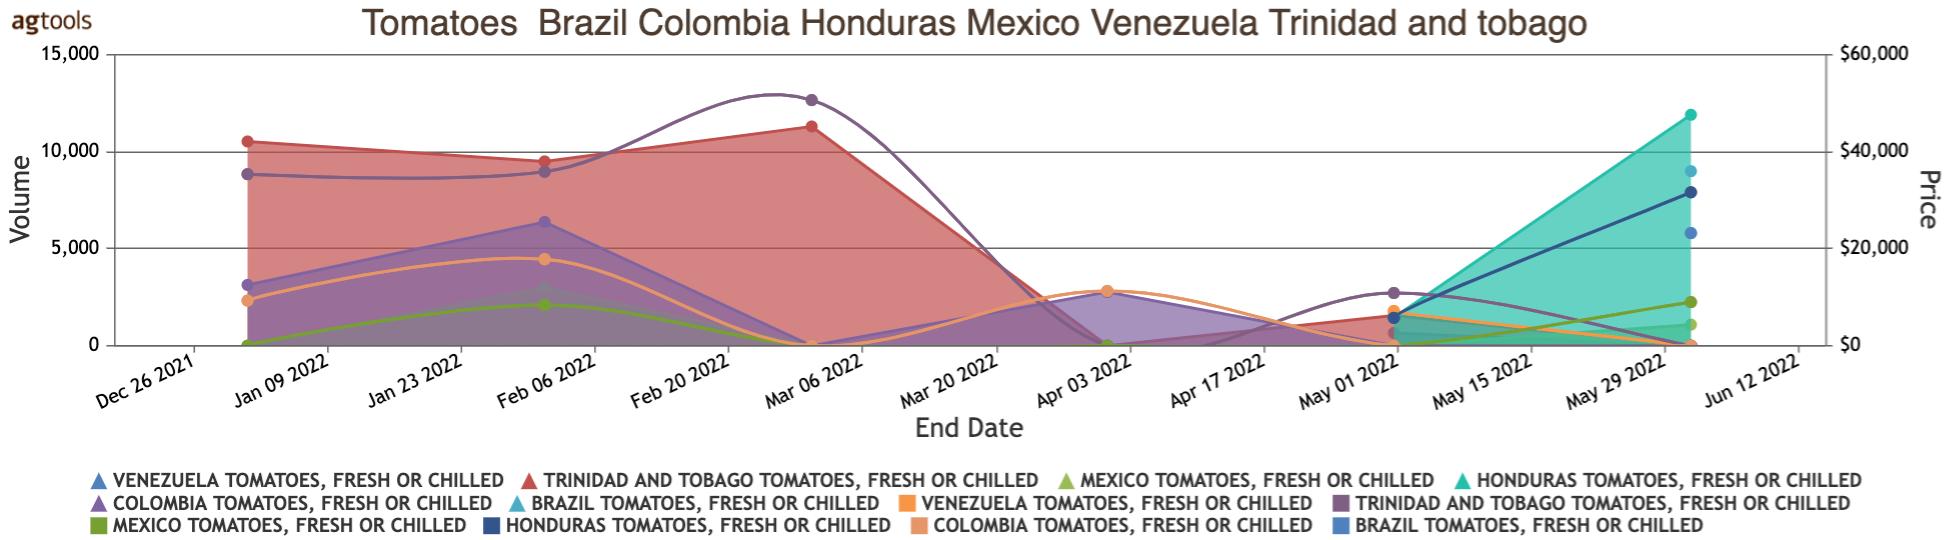
ONION SETS,FR/CH MT 4.28 9,290.10 LETTUCE,XH,F/CH MT 2.94 9,115.90 TOMATOES,FR/CH MT 14.32 22,376.90 GARLIC,FR/CH MT 5.96 6,002.90 CARROTS,FR/CH MT 2.15 4,344.60 PEPPERS,FR/CH MT 2.01 2,035.50 CELERY,FR/CH MT 0.69 2,088.30 SHALLOTS,F/C MT 8.28 27,109.30 VEG,NESOI,FR/CH MT 15.79 13,659.90 LETTUCE,FR/CH MT 6.34 17,817.90 Unit Product Value Million Qty Million 1994 MT 18.07 10,895.60 MT 13.46 10,011.10 MT 23.63 30,872.90 MT 20.71 10,052.40 MT 11.82 8,489.70 MT 10.63 7,091.50 MT 8.65 11,839.70 MT 23.33 16,963.20 VEG,NESOI,FR/CH MT 29.03 23,291.00 MT 23.12 32,464.20 ORG LETTUCE X HD LETTUCE X HD FR Unit Product Value Million Qty Million 2022 SHALLOTS,FR/CH ONION SETS,FR/CH ONIONS FR/CH ORG SPINACH FR/C CAULFLOWR FR/CH BRSSL SPRTS,F/CH BEANS, FR/CH Ⓒ 1/2
Tobago
Major U.S. exports to Latin America are as follows
U.S. agri-food imports from Latin America have increased significantly, especially in terms of trade value, in contrast to the quantities of products.
Total U.S. value imports Horticultural Products in general (Fruits and Preparations, Vegetables and Preparations, Tree Nuts and Preparations) from Latin America increase:
U.S. value imports from Latin America increase:

Total quantity U.S. imports Horticultural Products in general to Latin America increase:
Main Latin American countries that supply Fresh Veg Exc Potato food to the United States.
Value of U.S. imports.

Ⓒ
and
powered by See More Achieve More ® ©2023 All Rights Reserved Agtools Inc. www.ag.tools info@ag.tools
Trade relations between US
Latin America are experiencing significant growth.
Costa Rica 31.89 Peru 13.67 Chile 11 77 Guatemala 9.33 Jamaica 8.15 Peru 340.93 Guatemala 211.57 Costa Rica 94.04 Dominican Republic 63.40 Honduras 51.23 Mexico 875.86 1994 Mexico 7,940.79 2022 Millions Millions Vegtbls, Frozen MT 157 708 1,008 469 228 829 593.485 Vegtbls, Prep or Pres MT 143.531 893.456 153.767 494.491 Fruits and Preparations MT 2,353.404 20,813.035 5,465.202 14,002.009 Fresh Veg Exc Potato MT 972.609 8,857.879 1,403.082 7,393.916 Vegtbls, Dried/Dehydr MT 16 981 157 199 4.034 78 434 Dried Beans MT 2.463 92.765 5 159 63.791 Vegetables Juices MT 0.050 25.200 0.030 9.533 Olives, Prep or Pres MT 3.205 25.005 5.365 14 656 Dried Chickpeas MT 6.058 19.927 9.724 15.337 Dried Lentils MT 0.012 1.076 0.012 0.522 Dried Peas MT 0.637 0.257 0.741 0.174 Potatoes, Fresh & Seed MT 0.020 0.020 0.033 0.024 Other Hort Products Tree Nuts and Preparations MT MT 904 306 20,813 035 169.887 711.238 105 180 530 133 74.065 123.543 Horticultural Products MT 4,730.871 48,250.455 7,455.193 23,310.516 Vegs and Preparations MT 1,303.275 11,081.253 1,810.746 8,654.831 Unit Product Qty Million Qty Million Value Billion Value Billion 1994 1994 annual growth rate of 8.65% 1994 2022 US$4.7B US$48.2B Total
annual growth rate of 4.16% 1994 2022 7.45 tons 23.31 tons Total quantity of U.S. imports from Latin America increase: MT 22,376 90 14.317 MT 27,109.30 8.283 MT 13,659.90 15.79 MT 17,817.90 6.337 ONIONS/SHALL,F/C VEG,NESOI,FR/CH Unit Product Qty Value Million 1994 TOMATOES,FR/CH LETTUCE,FR/CH MT 30,872.90 23.628 MT 16,963.20 23.331 MT 23,291.00 29.031 MT 32,464.20 23.117 ORG LETTUCE X HD LETTUCE X HD FR Unit Product Value Million Qty Million 2022 ONION SETS,FR/CH ONIONS FR/CH 2/2

