Cyclones: Formation, Structure, and Impact
Empowering a new generation of Map Makers Features
Prediction Of Crime, Based On GIS And Ml

Cyclones: Formation, Structure, and Impact
Empowering a new generation of Map Makers Features
Prediction Of Crime, Based On GIS And Ml
for Assessing the Impact of Land-Use and Land-Cover Change on Groundwater Recharge
Pg24


EXECUTIVE EDITOR
Prof. Gordon Wayumba
HEAD OF CONTENT
William Kiarie
CONTRIBUTING EDITORS
Kelvin Yego
Neville Okumu
Sino Deogracious
Patricia Sila
Mearg Belay Shibesh
Gerald Nyanjua Amolo
David K. Njoroge
Christine Wahome
The magazine and related website provide topical overviews and reports on the latest news, trends and developments in geomatics all around the world. Afrospatial is orientated towards a professional and managerial readership, those leading decision making, and has a worldwide circulation.
Subscriptions
Afrospatial is available six times per year on a subscription basis. Geospatial professionals can subscribe at any time via https://www.afrospatial.com/subs
Subscriptions will be automatically renewed upon expiry, unless Afrospatial receives written notification of cancellation at least 60 days before expiry date.
Advertisements
Information about advertising and deadlines are available in the Media Kit. For more information please contact our marketing advisor: marketing@afrospatial.com
No material may be reproduced in whole or in part without written permission of Afrospatial.
Copyright © 2024,
Cyclones: Formation, Structure, and Impact - Pg 3
Embark on a Geo-Odyssey: Unveiling Earth’s Hidden Stories - Pg 6
The Transformative Power of GIS - Pg 9
Integrating Google Earth Engine (GEE) with Google Cloud - Pg11
Exploring the Latest QGIS Plugins - Pg15
Empowering a new generation of Map Makers - Pg 17
Arcgis Dashboards - Pg 21
Geo-spatial Approach for Assessing the Impact of Land-Use and Land-Cover Change on Groundwater Recharge. - Pg 24
UAVs For Topographical Surveys - Pg 30
GIS in Urban Planning - Pg 32
The Impact of CORS on Modern Land Surveying - Pg 36
Prediction Of Crime, Based On GIS And Ml - Pg 38
As we present this month’s issue of our geospatial magazine, we delve into the intricate connections between land use, environmental changes, and their broader impacts on essential resources. The main article, Geo-spatial Approach for Assessing the Impact of Land-Use and LandCover Change on Groundwater Recharge, highlights how technological advancements in geospatial analysis are uncovering critical insights into the sustainability of our natural resources.
In addition to this, we explore a diverse range of topics showcasing how geospatial technologies are being applied across various fields—from urban planning and disaster management to environmental conservation and infrastructure development.
As always, our goal is to bring you the latest research, innovative approaches, and practical applications in the geospatial field, fueling both professional growth and informed decision-making.
Thank you for your continued readership and passion for geospatial science.

By Sino Deogracious

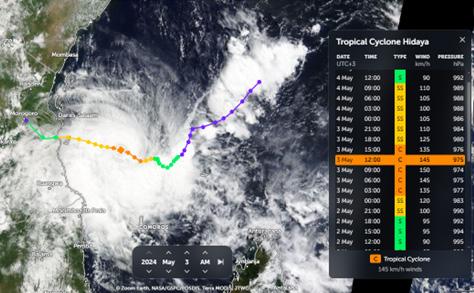
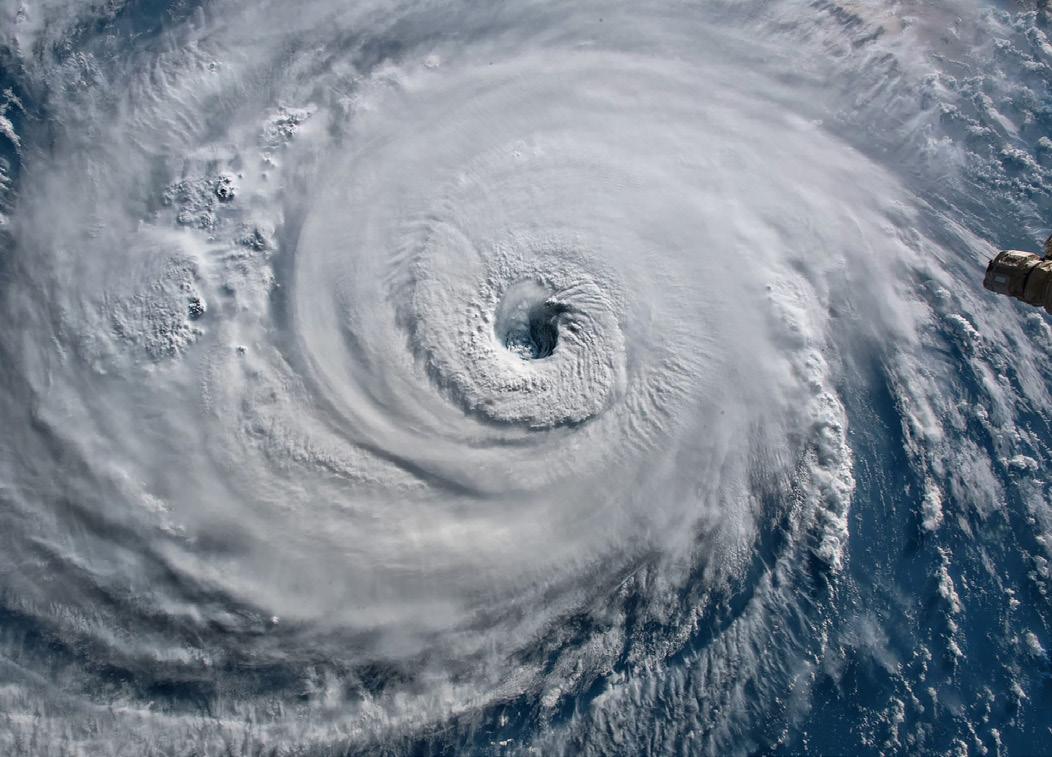
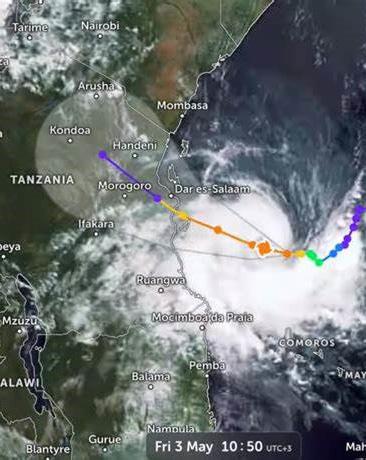
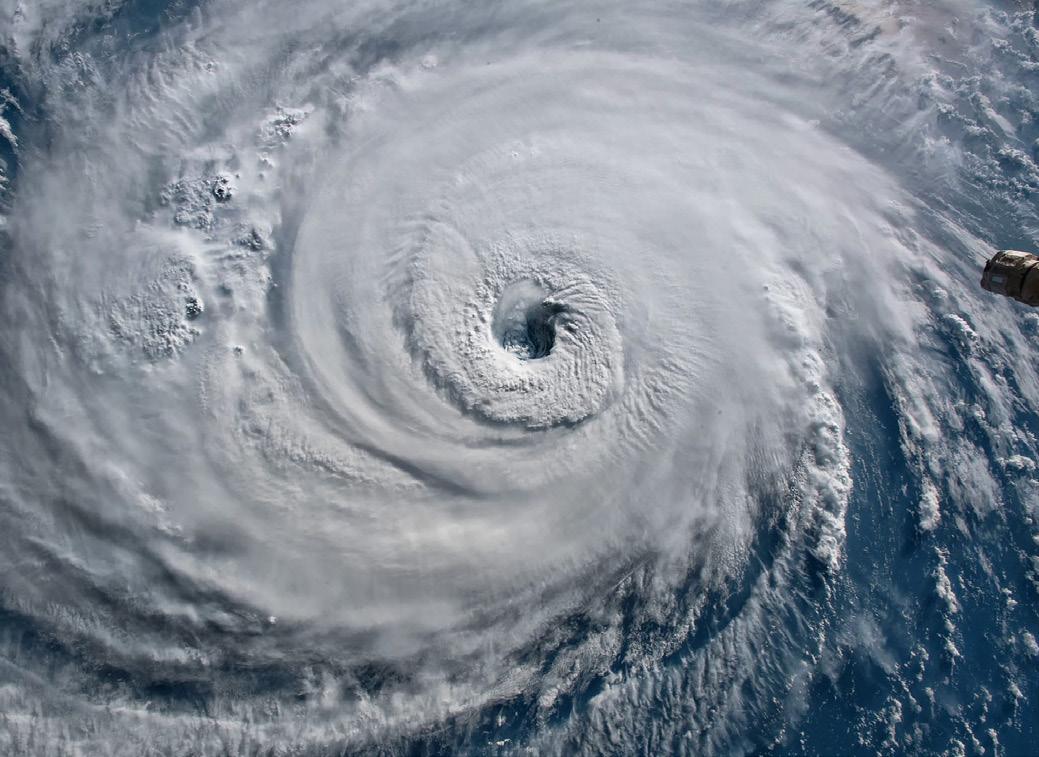
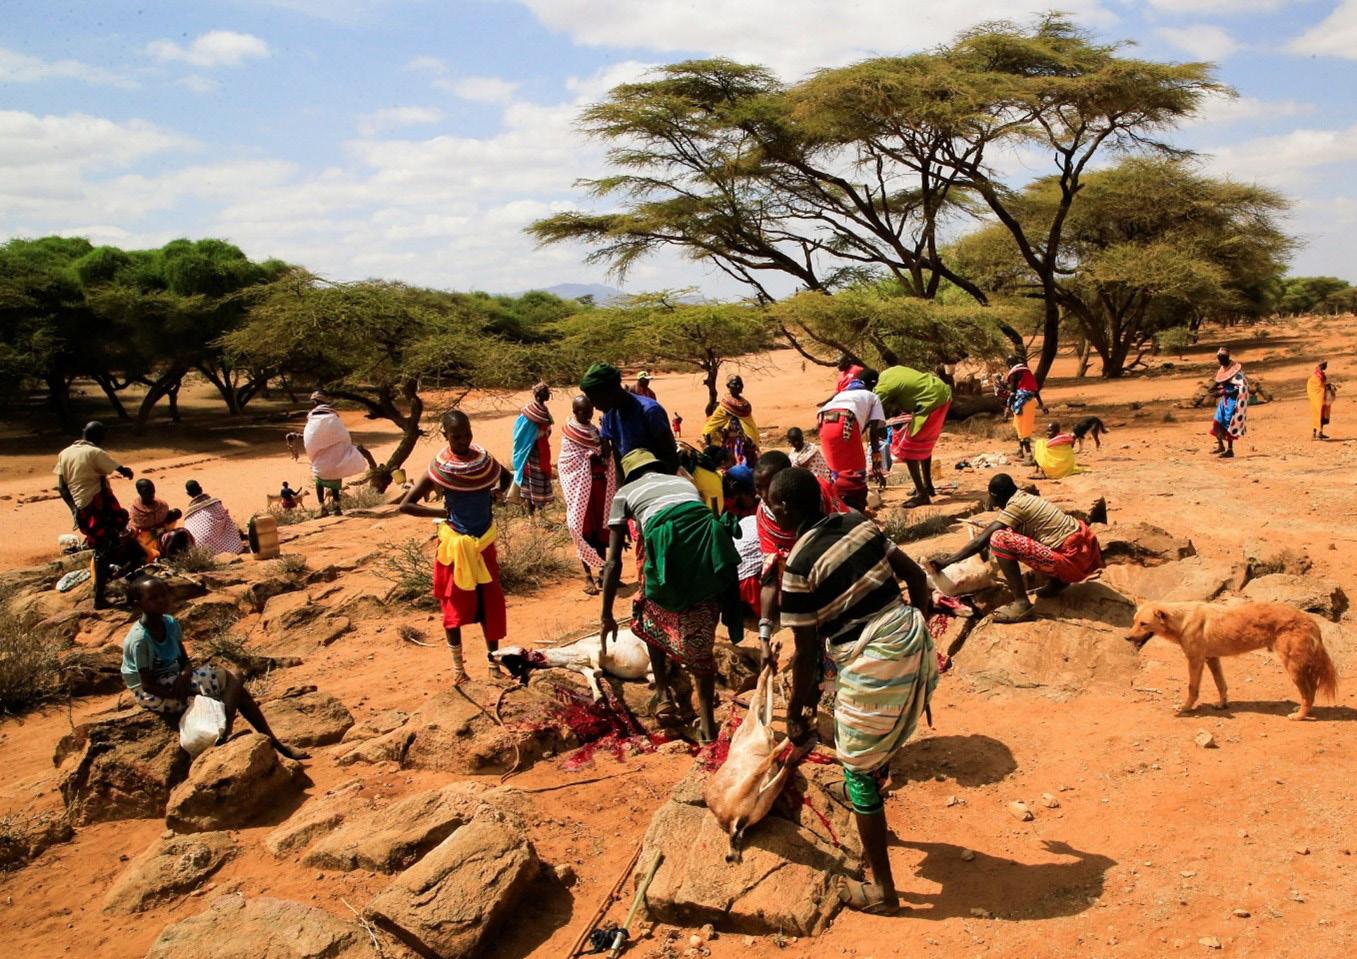
The recent path of Cyclone Hidaya, which struck Tanzania but was too weak to significantly impact Kenya, highlights the intricate dynamics of cyclone formation and movement. Understanding these powerful natural phenomena involves exploring their origins, development stages, and the crucial factors influencing their strength and direction.
A cyclone is a large rotating air mass formed over warm ocean waters due to low atmospheric pressure. Cyclones originate from a process called cyclogenesis, which occurs in tropical regions between the Tropic of Cancer in the Northern Hemisphere and the Tropic of Capricorn in the Southern Hemisphere. These regions are characterized by vertical, direct, and high solar radiation.
A cyclone is a large rotating air mass formed over warm ocean waters due to low atmospheric pressure. Cyclones originate from a process called cyclogenesis, which occurs in tropical regions between the Tropic of Cancer in the Northern Hemisphere and the Tropic of Capricorn in the Southern Hemisphere. These regions are characterized by vertical, direct, and high solar radiation.
Tropical cyclones are known by different names depending on the region:
Cyclone – Indian Ocean region
Typhoon – Northwest Pacific region
Hurricane – Northeast Pacific and Atlantic regions
Meteorologists categorize the development of tropical cyclones into four stages:
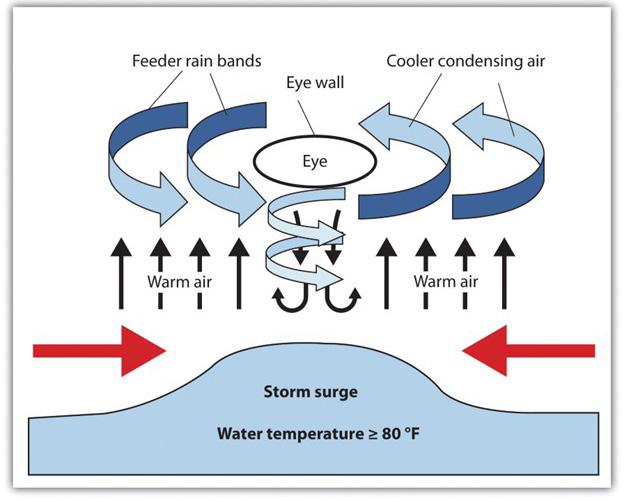
Tropical Disturbance: Evaporation from sun-heated water surfaces (above 26.5°C) initiates the process. Rising water vapor cools, condenses into clouds, and releases heat, creating a self-perpetuating loop with a low-pressure zone at the surface. This leads to a disorganized cluster of thunderstorms with weak circulation.
Tropical Depression: The system becomes more organized, with wind speeds between 23-38 mph (37-61 km/h) and a distinct low-pressure center at the surface. Favorable conditions like warm water, low wind shear, and supportive atmospheric conditions are critical for further development.
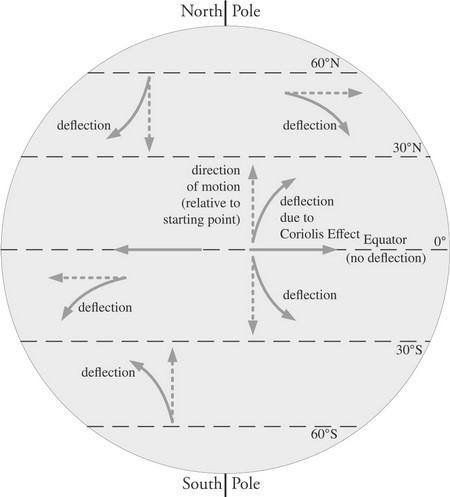
Earth’s rotation adds a twist to cyclone winds through the Coriolis effect. Imagine a ball thrown outwards on a spinning merry-goround – it appears to curve due to the rotation, even though its path is straight relative to the thrower.
Similarly, rising air in a cyclone experiences an apparent deflection due to Earth’s spin. This deflection, to the right in the Northern Hemisphere and left in the Southern Hemisphere, creates a low-pressure center that acts like a vacuum, sucking in surrounding air.
As this air spirals inwards, the Coriolis effect and the narrowing path cause it to accelerate, resulting in the powerful, characteristic winds of a cyclone. The Coriolis effect itself doesn’t create the wind but orchestrates the swirling circulation that fuels the cyclone’s growth and destructive power.
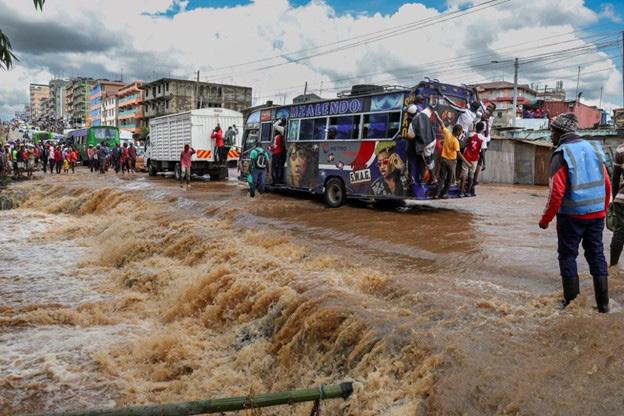
Tropical Storm: Wind speeds increase to 39-73 mph (63-118 km/h), and the storm gains a well-defined low-pressure center and swirling circulation. These storms bring heavy rain and potential flooding, often leading to weather warnings and preparations. Tropical storms can intensify into hurricanes, typhoons, or cyclones, or they may weaken and dissipate.
Hurricane/Typhoon/Tropical Cyclone: These mature systems have winds exceeding 74 mph (119 km/h). The Saffir-Simpson Hurricane Wind Scale categorizes them based on wind speed, with Category 5 being the most catastrophic, featuring winds exceeding 157 mph (252 km/h). These storms unleash powerful winds, storm surges leading to coastal flooding, heavy rain triggering inland flooding, and even tornadoes.
Sunlight warms the ocean surface, causing the air above to rise and create a low-pressure zone. Cooler air from surrounding areas is drawn in, heated, and rises, creating a continuous circular motion. This process forms the characteristic “eye” of the cyclone, a calm region amidst the surrounding storm’s fury.
Landfall presents a critical juncture for a powerful cyclone, transforming it from a swirling behemoth at sea into a potential harbinger of destruction for coastal communities. However, the cyclone’s fate hinges on a crucial factor: its access to moisture, the very lifeblood that fuels its growth.
When a cyclone makes landfall, it loses its primary moisture source – the warm ocean surface. This loss weakens the rising warm air and the associated low-pressure zone at the cyclone’s center, leading to a rapid decline in strength. The rough terrain of landmasses further accelerates this weakening process through increased friction.
Smaller cyclones with limited internal moisture reserves are more vulnerable to rapid weakening compared to larger ones. The presence of landforms like mountains can also disrupt a cyclone’s circulation, hastening its demise.
The path of Cyclone Hidaya underscores the influence of the Coriolis effect on cyclone development. Cyclones rarely form near the equator due to the weak Coriolis effect. This effect is caused by Earth’s rotation, which plays a vital role in deflecting winds and initiating the swirling circulation that fuels cyclones. At the equator, Earth’s rotation has minimal east-west deflection due to its alignment with the rotational axis. This weak Coriolis effect is insufficient to create the sustained swirling motion needed for a cyclone to form.
Cyclone formation thrives in zones with a stronger Coriolis effect, typically between 5 and 30 degrees latitude (both north and south of the equator). This zone offers the right balance between warm ocean temperatures (fuel for the storm) and a strong Coriolis effect to initiate and sustain the swirling circulation.
In the case of Cyclone Hidaya, Kenya’s proximity to the equator likely placed it in a region with an insufficient Coriolis effect to support significant cyclone development. Conversely, Tanzania, located further south, offered more favorable conditions for cyclone formation due to a stronger Coriolis effect in its waters. This explains why Cyclone Hidaya bypassed Kenya and struck Tanzania.


Imagine this: A vibrant tapestry unfolds, not woven with thread, but with pixels. Towering skyscrapers pierce the clouds in bustling cityscapes, emerald rainforests teem with life, and vast deserts stretch towards a fiery horizon. This isn’t just a map, it’s a portal to a hidden world, a world revealed through the power of Geographic Information Systems, or GIS. Join us on a captivating geo-odyssey as we explore how GIS is transforming our planet.
• To provide timely access to viable geodetic control.
• To reduce reliance on multiple chat groups.
• To provide a reliable storage space for geodetic control.
Our adventure begins shrouded in a data fog
Imagine a swirling pool of information – satellite imagery, weather patterns, social demographics, and resource distribution – all in a chaotic state. For generations, these valuable insights remained obscured, their potential unrealized.
But a beacon of innovation has emerged to pierce this data fog
GIS, our digital compass and cartographer, acts as a bridge between the intangible and the tangible. Through its transformative lens, we begin to see Earth’s hidden stories come to life.
Let’s zoom in on bustling megacities
Here, GIS empowers urban planners. Building footprints into vibrant maps, traffic flows like shimmering arteries, and heat signatures reveal pockets of vulnerability. This newfound knowledge allows cities to optimize infrastructure, create green havens, and pulse with a newfound vibrancy.

In these lands, GIS equips communities to weather the storms. Advanced hazard maps depict potential threats, allowing proactive preparation. Early warning systems flicker to life, and evacuation routes become etched in digital pathways. Lives are saved as communities become more resilient.
Southward we travel, to vibrant landscapes teeming with life
Here, GIS empowers environmental guardians. Real-time deforestation maps pinpoint areas under threat, allowing authorities to intervene and protect precious ecosystems. Rainforests sigh with relief as oncehidden threats are brought to light.
Across the vast Pacific, we land on sundrenched islands
In these paradises, GIS aids agricultural development. Soil analysis maps paint a vibrant picture of fertility, while weather data visualizations predict optimal planting seasons. Farmers leverage this knowledge to maximize harvests, ensuring food security for communities and a bountiful future.
With each step of our geo-odyssey, the transformative power of GIS resonates
It’s a tool not just for scientists and policymakers, but for everyday people across the globe. This technology empowers them to tackle challenges, build sustainable futures, and unlock the hidden stories woven into the fabric of our planet.
As we delve deeper, we’ll meet the remarkable individuals harnessing GIS to revolutionize the world. Stay tuned for the next edition in this exciting exploration!

Sparks from the fire cracked against the night sky. In its vicinity, aged physical features shimmered with the fading light, bearing the insight of many evenings. A village elder told stories tonight about a period before memory, when the Earth itself whispered secrets into the breeze. She said that these whispers described the earliest people to walk the earth, rivers that ran in lost directions, and the relationships that existed between people and the natural environment. However, these murmurs were a mystery for many centuries, a secret language engraved deep inside the planet.
Years turned to decades, and decades to centuries. The whispers remained, a constant murmur just beyond comprehension. Then, a revolution arrived, Geographic Information Systems (GIS). A tool so powerful it could translate the Earth’s whispers.
Imagine satellites soaring high above, their cameras capturing every detail of our land in vibrant detail. Imagine software breathing life into this raw data, generating of elevation data, imagery, and complex algorithms.
Suddenly, the familiar sights of our homeland came alive. Dusty paths, etched by countless migrations, became ancestral highways, humming with the echoes of forgotten footsteps. Acacia trees, once silent sentinels, now stood as proud storytellers, whispering tales of empires that rose and fell like the midday sun. Even the very grains of sand beneath our feet held stories waiting to be unearthed.
That’s where we at AfroSpatial come in. We are the Geospatial Bridge between this hidden language and our people. We are the explorers, voyaging not across oceans, but across time itself. With GIS as our guide, we delve into the ancient landscapes, visualizing the very ground that witnessed the first sparks of human existence. Through the lens of GIS, these lands transform from mere scenery into a living archive, waiting to reveal the secrets they’ve held close for millennia.
But the power of GIS goes beyond mere exploration. It’s a potent weapon in the fight to protect our land. We can map the pathways that wildlife relies on for survival, becoming their guardians against a changing world. We can analyze deforestation patterns, becoming the guards who stand against the destruction of our precious ecosystems. We can track the movements of endangered species, ensuring their continued existence for generations to come. This isn’t just about protecting animals, it’s about safeguarding the very whispers of the Earth that sing of the interconnection of all living things.
The benefits of GIS extend far beyond the realms of conservation and exploration. Imagine communities empowered with the knowledge to manage resources with ancestral wisdom, a future where understanding land use patterns becomes second nature, allowing for the efficient management of water and fertile soil, the transformative potential of anticipating natural disasters with a level of precision previously unimaginable, safeguarding lives and livelihoods. GIS empowers users to become architects of their own future, building more resilient and sustainable societies for themselves and their children.
Are you ready to join AfroSpatial on this captivating journey? Together, we can delve into the hidden song of the Earth, a language that holds the power to reshape our understanding of the world around us. Let’s embark on this quest to unlock the Earth’s secrets, one pixel at a time. With every click, every zoom, every analysis, we become part of a story that is far grander than ourselves. We become the storytellers, the protectors, and the architects of a future where humanity and nature exist in harmony, a future as vibrant and alive as the Kenyan spirit itself. This is the promise of AfroSpatial, and this is the captivating journey that awaits.
But this journey isn’t just about grand pronouncements. It’s about the day-to-day triumphs.A young Maasai boy, his eyes wide with wonder, as he uses GIS to map the migration patterns of his family’s cattle herd, ensuring their survival during the dry season or a group of women, empowered with GIS data, strategically planting drought-resistant crops to revitalize their land or a team of conservationists, armed with real-time data on poaching activity, successfully protecting a herd of endangered elephants.
These are just a few glimpses of the transformative power of GIS. It’s a tool that empowers, educates, and inspires. It allows us to see our land not just as a collection of resources, but as a living testimony with stories waiting to be unearthed. It allows us to become the guardians of our planet, ensuring its beauty and bounty for generations to come.
This is the AfroSpatial story, a story that unfolds with every click, every zoom, and every analysis. It’s a story waiting to be written, and we invite you to join us on this captivating journey.


By Patricia Sila

If you are an active Google Earth Engine user, you have probably received an email prompting you to link your account to Cloud Projects. As of June 2024, you should have Cloud Projects to continue accessing the platform. What does that mean for GEE users?
Google Earth Engine (GEE) is a cloud-based platform that is free of charge for noncommercial use. All you need to do is create an account and explore the world of geospatial analysis, gaining access to multifaced data from various sources and storage options for your scripts and projects online. Google Earth Engine has truly metamorphosized remote sensing by enabling the analysis and visualization of satellite imagery, with accelerated processing owing to its computational power through parallel processing. Simply put, numerous computers simultaneously execute parts of a task, shortening the processing time.
Recently, GEE updated its terms of use for noncommercial users, which affects how you access the platform. You must now link your GEE account to Google Cloud Projects. Initially, GEE was an independent Google service with its systems and ran separately from other Google services. With the integration, GEE will sync with Google Cloud, which offers cloud services. GEE will now be under Google Cloud’s systems, terms, and conditions.
In 2022, GEE became a Google Cloud API. Cloud Project users could access GEE without creating an individual GEE account. With the update, GEE users with an individual GEE account but no Cloud Project will not have access to the platform. A Cloud Project is a workspace to store projects and access Google Cloud services. Some changes will include logging in and accessing GEE through Google Cloud. Nevertheless, GEE will remain free of charge for noncommercial use. Google Cloud has some billing, but you don’t have to set up a billing account or make any payments unless you are a commercial user.
The update is good because you can now access Google Cloud services. You can integrate your geospatial analysis with Google Cloud tools for a better experience. With a Cloud Project, you can run custom machine learning models with vertex AI, automate workflows, manage access and resources, and export large datasets to BigQuery to derive
solutions for complex cases requiring a multifaced approach.
You will also need to review your eligibility for noncommercial use and verify that you qualify. Remember, if you don’t sign up for a Cloud Project, your GEE will stop functioning at some point.
To transition:
Open the GEE Code Editor with your GEE individual account.
Click on the profile logo at the top right corner and select ‘Register a new cloud project’.
Start registering for your Cloud Project by clicking ‘Register a noncommercial or commercial cloud project’.
Select ‘Unpaid usage’ for noncommercial use and the category that applies to you. Select ‘Paid’ usage for commercial use.
Next, choose a ‘New Google Cloud Project’ and select ‘No organization’ for the organization category. The project ID takes up your username. Click ‘Continue to Summary’.
If you have never signed up for a Google Cloud account, an error message will appear, prompting you to accept the terms and conditions. Open the terms and conditions link to choose your country, review the terms, and click ‘Agree and continue’.
Go back to the previous tab and click ‘Continue to Summary’.
Review the summary of your submitted information and click ‘Confirm’.
That’s it! You will be redirected to the Code Editor, and your linked Cloud Project will be on the profile icon. GEE is an invaluable powerhouse for geospatial analysis, including environmental monitoring, landscape change detection, and climate change studies. The platform has over 40 years of historical and global data, including multispectral images, DEMs, and Night Lights data. Integrating GEE with Google Cloud Services is bound to increase efficiency and improve the overall GEE experience, with additional tools to enrich your analysis.
By Sino
QGIS, a leading open-source Geographic Information System (GIS) platform, continually evolves through its robust plugin ecosystem. From enhancing data manipulation to integrating advanced geospatial analyses, the latest plugins released between January 2024 and June 2024 showcase significant innovations. This article provides a comprehensive overview of these new QGIS plugins, highlighting their features and potential applications.
Pan Europeo
Power Clipboard by Łukasz Świątek
Purpose: Simplifies copying and zooming to coordinates.
Features:Four buttons to quickly copy or zoom to coordinates in XY/YX format.
Supports multiple separators: tabulation, space, or comma.
Automatically adjusts the decimal separator based on locale settings. This plugin enhances productivity by streamlining the process of working with geographic coordinates, making it easier for users to navigate and manipulate spatial data.
by Fernando Badilla Veliz - Fire2a.com
Purpose: Generates qualitative summary rasters from large datasets.
Features:
Processes approximately 30 rasters at 100m resolution (~30 GB of data). Allows users to define relative weight, utility attributes, and resampling methods.
Includes target precision configuration for efficient data handling.
Ideal for large-scale environmental and land-use studies, this plugin facilitates complex raster data analysis and visualization.

Trainminator2 by IGN

Purpose: Labeling tool for semantic segmentation and change detection in remote sensing.
Features:
Supports single-date or bi-date labeling.
Enhances geomatics and remote sensing workflows by providing advanced image classification tools. This plugin is crucial for researchers and analysts involved in monitoring and mapping changes in land cover and land use.

CartoGrapher by Anqi Ouyang, College of Geographic Information Science, Jilin University
Purpose: Generalized map creation.
Features:
Provides tools for cartographic design and map generalization.
This plugin supports the creation of high-quality maps, catering to cartographers and GIS professionals.


Swiss GeoAdmin Bulk Geocoder by Niklas Vogel, Felix Reiniger, Stefan Keller
Purpose: Bulk geocoding for Swiss addresses.
Features:
Uses geo.admin.ch service for geocoding.
Adds coordinates to address attributes in a vector layer.
Essential for projects involving extensive address data in Switzerland, this plugin streamlines the geocoding process.
EDAC Tools by EDAC dev team
Purpose: Collection of Python-based geospatial tools.
Features:
Requires external libraries (geopandas, shapely).Offers solutions for various data analysis tasks. This toolbox is beneficial for users needing advanced data manipulation and analysis capabilities.
CompareClasseA by Vincent Bénet
Purpose: Compares two datasets of GPKG pointZ geometry based on French legislation.
Features:
Ensures data compliance with French Class A standards.
Ideal for geospatial professionals working with regulated datasets in France.


Stats By Polygon by Murat Çalışkan
Purpose: Generates statistics for raster bands based on polygon features.
Features:
Creates detailed statistical summaries for spatial analysis.
This plugin aids in deriving insights from raster data, crucial for environmental and agricultural studies.
Band Stacker by Mirjan Ali Sha
Purpose: Stacks bands from selected raster layers.
Features:
Simplifies the process of creating multi-band rasters.
Useful for remote sensing specialists, this plugin facilitates the combination of various spectral bands into a single composite image for enhanced analysis.


UMap by IIC Technologies
Purpose: Transforms bathymetric data into community maps.
Features:
Facilitates visualization and use of bathymetric data.
This plugin democratizes access to bathymetric information, enhancing marine and coastal research.
SkyGIS by Asteria
Purpose: Integrates SkyDeck web application with QGIS.
Features:
Allows data import from SkyDeck to QGIS.
Enables GIS operations and updates back to SkyDeck.
This integration enhances the versatility of SkyDeck data within the QGIS environment. research.

Amazon Location Service Plugin by Amazon
Purpose: Adds location functionality to applications.
Features:
Supports maps, geocoding, routing, tracking, and geofencing. Prioritizes data security and user privacy. This plugin extends QGIS capabilities with robust location services, beneficial for developers and GIS analysts.
CIGeoE Series by Centro de Informação Geoespacial do Exército


CIGeoE Copy Paste Features 3D:
Preserves original Z coordinates when copying and pasting features.
CIGeoE Reverse Line:
Reverses vertices order in a selected line. These plugins enhance vector data manipulation, crucial for precision mapping and editing tasks.
UA Coordinates Transformation by Bohdan2505
Purpose: Transforms coordinates within Ukraine.
Features:
Supports SK-63, SK-42, USK-2000 systems. Uses the official State Geodetic Network API. This plugin is essential for geospatial projects in Ukraine, ensuring accurate coordinate transformations.

Viper (QGIS Snake Clone) by Viper MiniQ
Purpose: Snake game clone using QGIS canvas.
Features:


CIGeoE Translate To Fit To Adjacent Polygon: Aligns polygons with the nearest neighbor.
CIGeoE Toggle Vertex Visibility: Toggles vertex marker visibility.
GeoBasis_Loader by GeoBasis_ Loader
Purpose: Simplifies adding WMS/WFS services and background maps.
Features: Provides a nationwide collection of GeoBasis data.
Ideal for users needing quick access to up-to-date geospatial services and maps.
Interactive and educational tool using vector layer geometries. This plugin adds a fun and engaging way to interact with spatial data.
S2 Toolkit by Mikhail Melnikov, Oleg Petrov
Purpose: Creates S2 Geometry in QGIS.
Features:Currently includes “S2 From Extent” tool. Future updates will add more tools. This plugin expands QGIS’s capabilities in handling S2 geometries, essential for advanced spatial analyses.
PL-2000 by Szymon Kędziora
Purpose: Satellite measurements with ASG-EUPOS reference stations in Poland.
Features:
Converts measurements to the PL-2000 system.
This plugin supports geodetic projects in Poland, ensuring accurate data conversion.

Luftbildfinder NRW by Kreis Viersen
Purpose: Loads aerial images for North Rhine-Westphalia, Germany.
Features:
Available in German language only. This plugin provides easy access to regional aerial imagery, beneficial for local planning and analysis.
Conclusion: The latest QGIS plugins demonstrate the platform’s continuous innovation and responsiveness to user needs. Whether enhancing data manipulation, integrating new services, or providing advanced analytical tools, these plugins expand QGIS’s functionality, making it an indispensable tool for geospatial professionals worldwide. As these plugins become more widely adopted, they will undoubtedly contribute to more efficient and effective geospatial analysis and decision-making.

By Patricia Sila
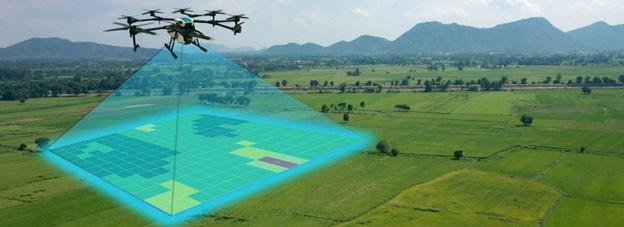
Drones have significantly revolutionized various industries and operations over the years. If you didn’t know, a drone is an acronym for Dynamic Remotely Operated Navigation Equipment. While drones may seem like a new invention, the concept has existed for centuries. Initially, the equipment was confidential and intended only for the military’s security purposes.
Dating back to World War I, militia used unmanned aeroplanes to spy on enemies during wars. It was around 2006 when nonmilitary use of drones began. While the military still uses high-endurance drones to survey borders and deliver equipment in war zones, its application has spanned numerous domains and enhanced efficiency, saving resources and time. They are used for educational purposes, rescue missions, deliveries, filming, and photography. The utilization of drones has evolved since the Industrial Revolution and continues to advance as technology spearheads innovation.
The geospatial domain has immensely advanced from the use of drones. The journey began with hot air balloons for aerial photographs in the 1800s, which we can say was the inception of remote sensing. Researchers needed a bird’s view to understand their landscape better. However, the image
quality was poor at that time. This challenge prompted innovation and creativity as scientists sought to produce better images, paving the way for the inception of the high-quality aerial photography and videography we now have.
Today, drones have top-notch components to capture exceptional images for analysis. They have High-definition (HD) cameras, stabilization and navigation systems, and flight controller boards. The flight controller board processes sensor data and controls the device’s commands. Other advanced features include the incorporation of Artificial Intelligence (AI) software, Machine Learning (ML), and Light Detection and Ranging (LiDAR). Drones are characterized by precision, object recognition and avoidance.
Drones have become a staple in the geospatial industry. They are used in various sectors, including surveying, urban planning, and climate and environmental monitoring. The instruments are efficient for high-accuracy mapping and surveying within a short time. They have enhanced geospatial data collection, gathering a wide range of data. Surveyors can use the equipment with LiDAR for topo surveys to capture elevation, produce maps and generate DEMs. They are especially advantageous for inaccessible or rough terrains that would be difficult to do with traditional methods. We have drones for bathymetric surveys that establish the water volumes and levels of dams and oceans, in conjunction with a radar system and echo sounders.
Drones are widely utilized in urban planning for land use management, detecting changes, and detecting illegal construction works for sustainable planning, environment conservation, and the development of smart cities. The data captured enables streamlined transportation systems by monitoring areas of congestion, infrastructure inspection of roads and bridges, and 3D visualizations of urban areas.
Drones are integrated with hyperspectral cameras to produce multispectral images for climate and environmental analysis, such as evaluating vegetation and water quality. We can use drone data to monitor forests, assess damage from fires and deforestation, and calculate areas and volumes.
The equipment can also be utilized for wildlife management by capturing photographs of wildlife and monitoring their migration and habitat areas. Drones are also integrated with other geospatial technologies like a Geographic Information System (GIS) to analyze and manage the data in geodatabases and Global Positioning Satellite (GPS) for real-time locations.
Despite the benefits, there are various challenges associated with drones. As drone technology advances, guidelines have been established to restrict its use for security and privacy reasons. On the bright side, various institutions offer drone technology courses to help users learn how to operate drones and implement them for appropriate purposes.
Some of the drawbacks include:
The cost: A1 drones with high-quality cameras, sensors, and additional components like LiDAR are expensive. It is a heavy investment that only a few can afford.
Susceptibility to damage: Drones are affected by weather and obstructions like trees, making them prone to damage. It is crucial to properly operate and maintain the equipment to avoid extra repair costs.
Complex data processing: Drone data tends to be very large and heavy, requiring significant computational power. The hardware and software must be compatible and capable of processing and managing the data.
Security risks: Drone data requires robust cyber security because it is vulnerable to cyberattacks and hacking. There has to be an efficient data management system with encryption and regular security checks to maintain the data’s integrity.
Inadequate regulation: Regulation for the commercial use of drones is insufficient, and there is a lack of harmonization when using drones across borders. In Kenya, the use of drones is regulated and licensed by the Kenya Civil Aviation Authority (KCAA), which supports the advancement of drone technology and devises policies to ensure safety for all.
Few drone operating experts: There is a limited number of specialized drone operators in the drone industry. Standardized training with interfaces that are easy to understand would go a long way in encouraging enthusiasts to take drone courses.
Drones have revolutionized our world today. There are many other applications, including precision agriculture, disaster management using real-time images to facilitate fast and effective response, and delivery of medical supplies to inaccessible areas, which we witnessed during the COVID-19 crisis. Drones are fundamental in our everyday operations and essential for enhanced efficiency.
In the ever-evolving landscape of geospatial software, Felt has emerged as a challenger, promising an intuitive and collaborative mapping experience. But can it truly compete with established players, especially for users who rely heavily on QGIS, the popular open-source desktop GIS software? This in-depth review explores Felt’s strengths and weaknesses to determine if it deserves a place in your mapping toolkit.
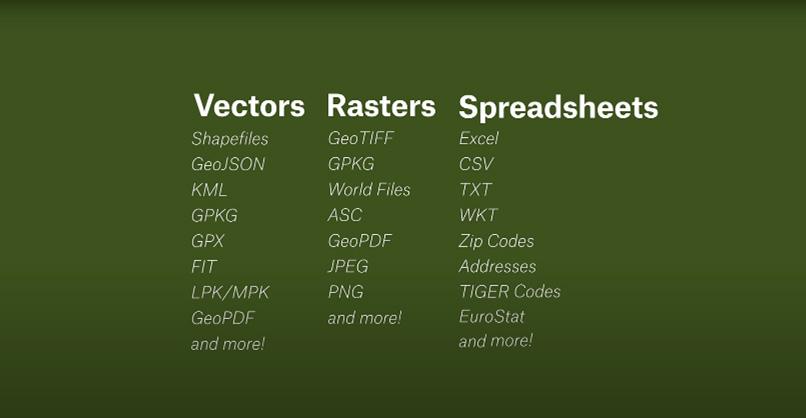
Felt sets itself apart with its remarkable ability to handle a vast array of data formats. Gone are the days of struggling with restrictive file types. Felt embraces the “Upload Anything” philosophy, seamlessly integrating vector shapes (ESRI Shapefiles, GeoJSON, GeoPackages, KMLs), raster imagery (aerial and satellite imagery, digital elevation models), spreadsheet data (CSV, Excel, Numbers), and even GPS data formats (GPX, TCX, FIT).
By Sino Deogracious
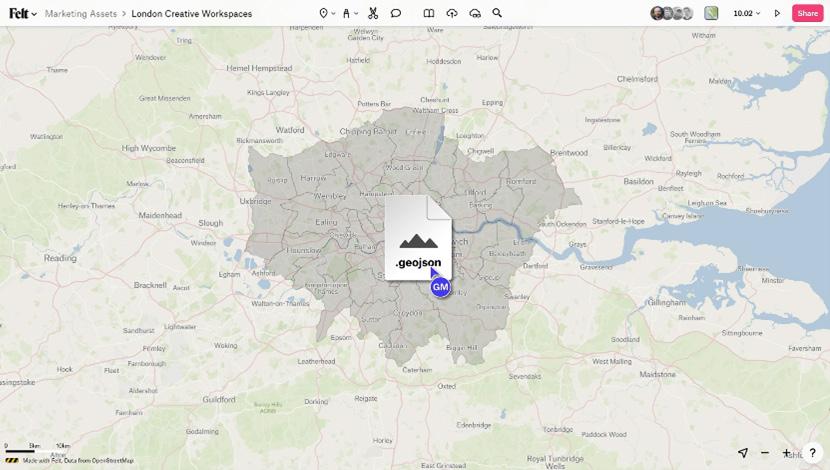
Importing data is refreshingly straightforward – a simple drag-and-drop, URL paste, or the dedicated QGIS plugin for effortless integration from your desktop GIS software. This plugin acts as a bridge, allowing you to seamlessly transfer layers and elements created within your QGIS project directly into your Felt map. QGIS users will appreciate this smooth workflow, eliminating the need for data conversion or reformatting. Felt boasts impressive file size support, accommodating datasets up to 5 gigabytes, catering to users working with large-scale geospatial information.
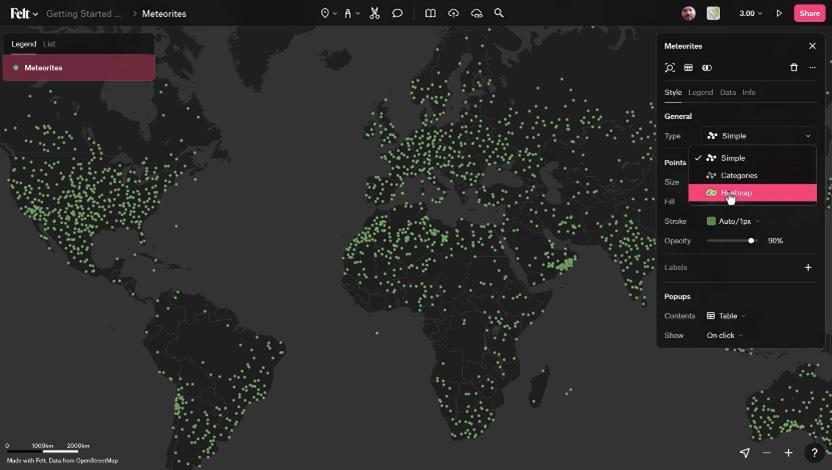
Felt’s interface prioritizes user-friendliness, making map creation an accessible process. The intuitive style editor empowers users to craft visually appealing maps in just a few clicks. Choose from heat maps, categorical color-coded representations, or sized elements to effectively communicate patterns and trends within your data. Customization options abound, allowing you to refine the appearance of points, lines, and polygons for a polished look. Label and popup configurations are easily adjusted to ensure clarity and enhance user comprehension.
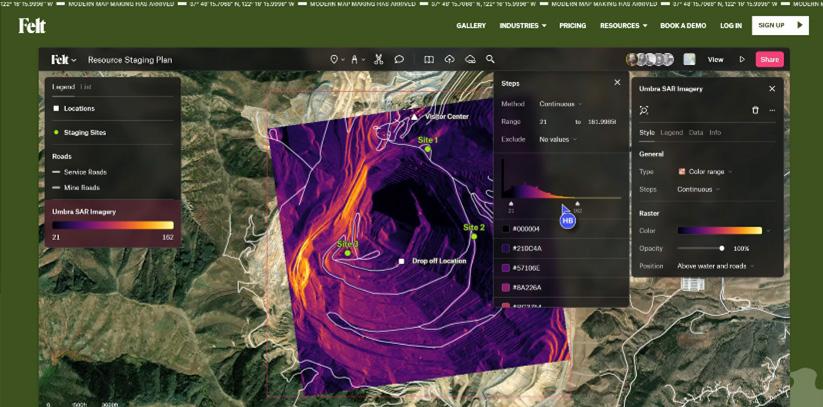
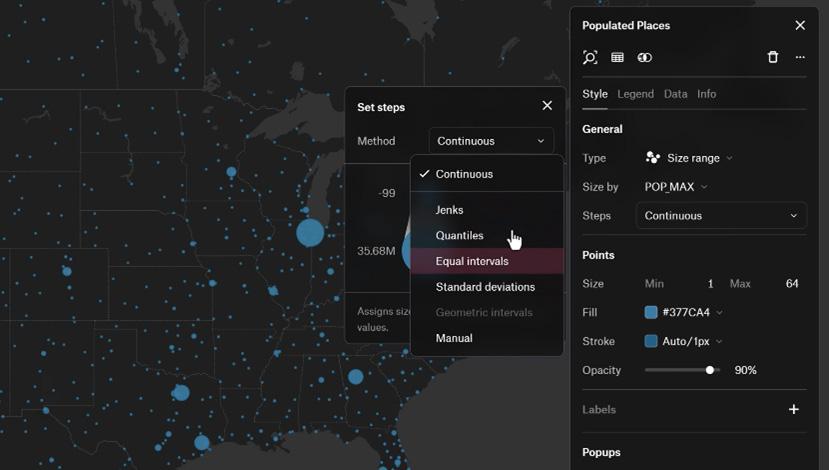
For users demanding more than basic visualization, Felt caters to power users as well. Advanced options enable in-depth analysis of raster data, unlocking valuable insights from satellite imagery and elevation models. Utilize tools for highlighting, visualization, and data extraction to glean hidden patterns and inform decision-making. The ability to customize legend placement, color schemes, and thematic layers further enhances the map’s communicative power, making it a versatile tool for both beginners and advanced users.
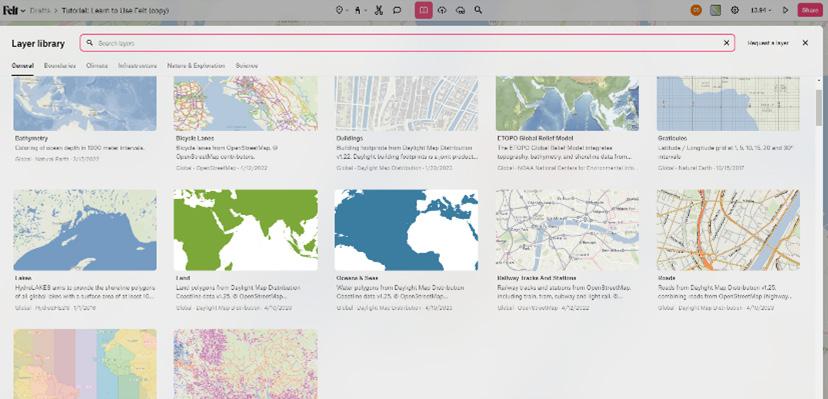
Felt fosters a collaborative environment with its suite of annotation tools. Highlight key areas, add notes, draw routes, and even extract buildings and boundaries directly from the base map for a truly interactive experience. Enrich your maps with context by embedding videos, linking to relevant websites, or leveraging Felt’s built-in library of datasets. Collaboration features like granular permission control, comment-driven discussions, and well-organized workspaces streamline project management.
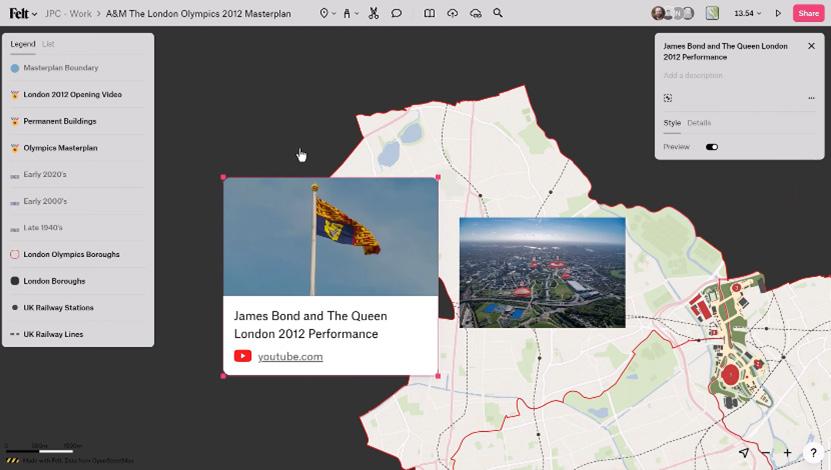
However, it’s important to note that some users might find the commenting system lacking compared to more mature mapping platforms. Realtime collaboration could be further enhanced by features like simultaneous editing or user presence indicators. Despite these minor shortcomings, Felt’s collaboration tools are robust enough to facilitate teamwork across different geographic locations, making it a valuable asset for remote teams and large organizations.
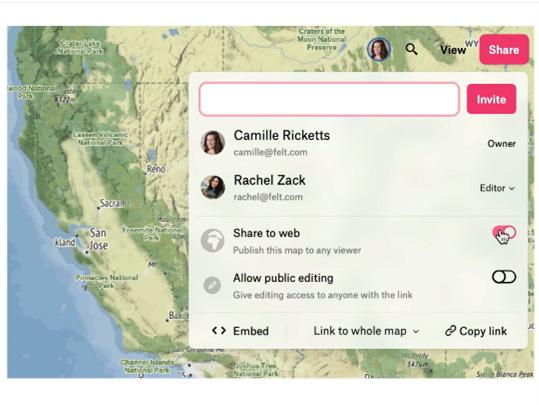
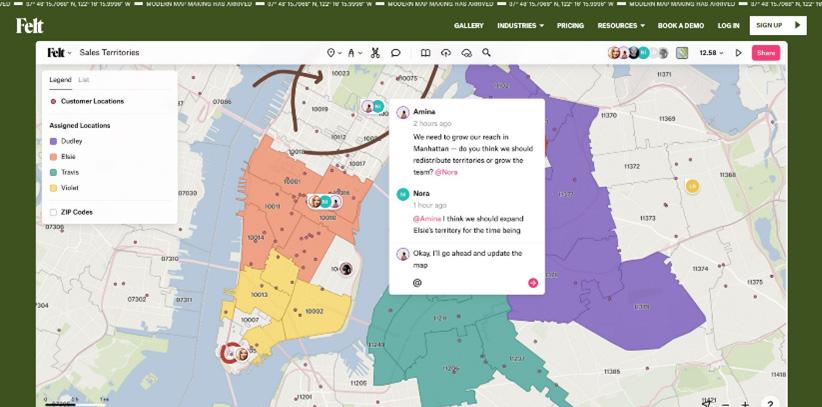
Fig 7: Members collaboration during fieldwork
Flexibility and Integration: Master of Collaboration
Felt integrates seamlessly with existing GIS tools, particularly QGIS, through a user-friendly plugin. This plugin fosters a smooth workflow between the two platforms.
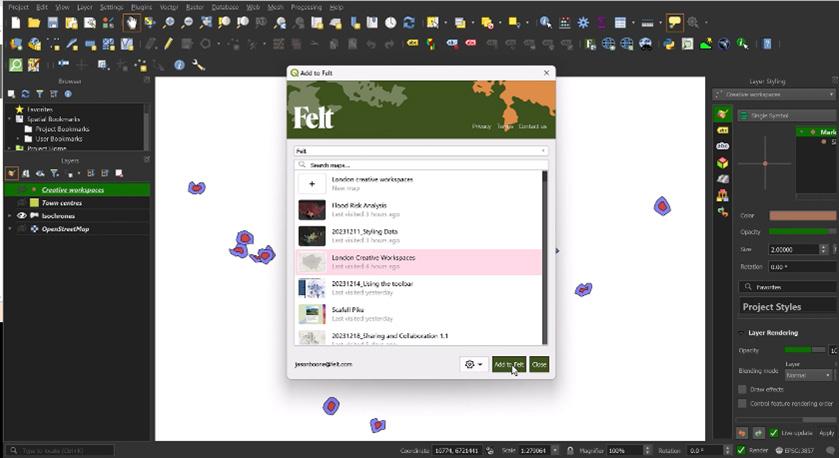
Fig 8: QGIS add to felt Plugin
Felt also functions admirably as a standalone application.
Developers can leverage the Felt API for programmatic work with maps and perform advanced integrations. While the API offers robust functionality, the documentation might feel limited for highly experienced developers seeking extensive customization options.
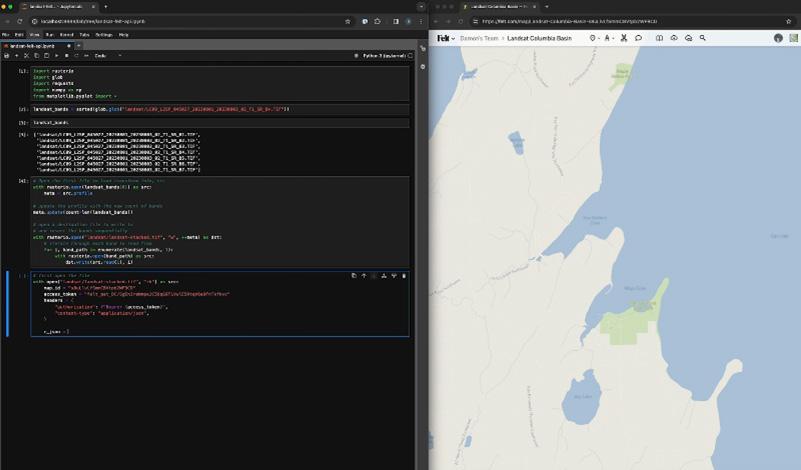
Fig 9: Felt developers interface
Where Felt truly shines is in its collaborative capabilities. The platform integrates seamlessly with various cloud storage providers, allowing multiple users to work on the same map simultaneously, even if they are not using QGIS. This makes Felt ideal for teams working on shared projects across geographical boundaries. Moreover, the ability to export maps in various formats ensures compatibility with other GIS applications and platforms, further enhancing its flexibility.
Felt excels in performance. Data loads quickly, ensuring a smooth workflow. Maps render in a flash, minimizing wait times and maximizing productivity. The platform prioritizes aesthetics with default map styles that are presentation-ready, showcasing your data in a visually compelling manner. The highquality rendering ensures that maps not only look good on screen but also in print, making it a reliable choice for creating professional-grade maps for reports, presentations, and publications.
Felt empowers you to set the perfect stage for your map with a variety of base map options. Choose from classic views, explore satellite imagery, or upload your own custom base map to match the specific needs of your project. This level of customization allows you to tailor the visual foundation of your map to effectively communicate your message. Advanced users can even overlay multiple base maps to create unique, hybrid views that highlight different aspects of the data, enhancing the storytelling potential of the map.
For users requiring in-depth spatial analysis, Felt 2.0 offers a powerful toolbox. Generate bounding boxes and buffer zones to analyze spatial relationships. Extract centroids, clip features based on specific areas, calculate point distribution, dissolve polygons to simplify complex datasets, identify overlapping features for spatial queries, and create masks to highlight specific regions of interest. These tools empower you to unlock deeper insights from your geospatial data and support informed decisionmaking.,
Felt 2.0 also introduces machine learning capabilities for predictive analysis, enabling users to model future trends based on historical data. This feature is particularly useful for urban planners, environmental scientists, and disaster response teams who need to anticipate changes and prepare accordingly.
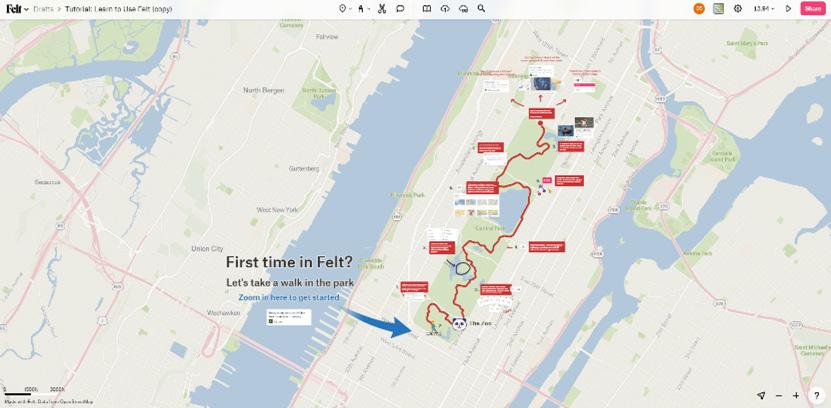
Felt understands that user experience goes beyond the software itself. The platform offers a comprehensive support system, including detailed documentation, video tutorials, and live webinars. New users can quickly get up to speed with stepby-step guides, while advanced users can delve into more complex features through specialized training sessions. The active user community and dedicated support team are always available to assist with any issues, ensuring that users can fully leverage the platform’s capabilities.
While Felt brings many innovative features to the table, it’s essential to consider how it stacks up against other GIS solutions, particularly for QGIS users. QGIS, known for its extensive range of plugins and advanced analytical capabilities, remains a powerhouse in the GIS community. However, Felt’s strength lies in its user-friendly interface
and collaborative features, which make it more accessible to non-specialists and teams.
For users who require deep analytical tools and extensive customization, QGIS remains the goto choice. However, for projects that emphasize collaboration, ease of use, and quick turnaround times, Felt provides a compelling alternative. The two platforms can complement each other, with QGIS handling the heavy analytical work and Felt facilitating the collaborative and presentation aspects.
Felt is continuously evolving, with the development team actively working on new features and improvements based on user feedback. Upcoming updates are expected to include enhanced real-time collaboration tools, more advanced spatial analysis capabilities, and expanded support for additional data formats. The introduction of mobile app support will further extend Felt’s accessibility, allowing users to create and edit maps on the go.
Felt is a robust mapping tool that offers impressive data ingestion, powerful visualization, and seamless collaboration. While it may not yet fully replace QGIS for highly specialized GIS tasks, it provides a complementary platform that enhances team collaboration and simplifies the map-making process. The ease of integration with QGIS, combined with Felt’s user-friendly interface and extensive customization options, makes it a valuable addition to the geospatial toolkit of any mapping enthusiast or professional. Whether you are creating maps for presentations, conducting spatial analysis, or collaborating with a team, Felt offers a compelling blend of performance, flexibility, and aesthetic appeal that is hard to overlook.
In summary, Felt stands out as a versatile and powerful mapping solution that caters to a broad range of users. Its emphasis on collaboration, ease of use, and visual appeal makes it particularly suited for projects that require teamwork and clear communication. As Felt continues to evolve and expand its feature set, it is poised to become an indispensable tool for geospatial professionals and enthusiasts alike.
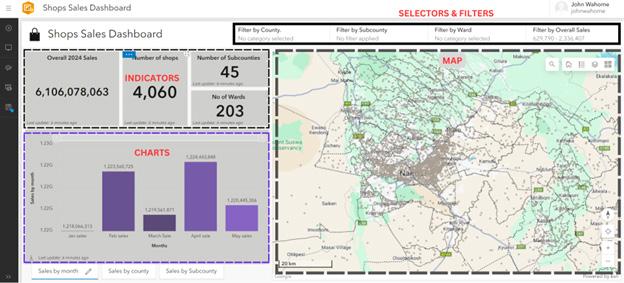
ArcGIS Dashboards, a component of ESRI’s ArcGIS Online, empower users to communicate insights by showcasing location-based analytics through intuitive and interactive visualizations on a unified screen.
Organizations leveraging the ArcGIS system can utilize these dashboards to support decision-making, visualize trends, monitor real-time status, and inform their communities.
Customizable dashboards allow audiences to filter data to obtain the answers they seek. As vital information products, akin to maps and apps, dashboards are a critical component of your geospatial infrastructure (ESRI).
These dashboards allow users to monitor, analyze, and interact with data through various visual elements such as maps, charts, gauges, and indicators. They are particularly valuable for real-time data monitoring, operational management, and strategic decision-making.
Maps: At the heart of any GIS dashboard, maps (while not a compulsory feature) visually represent spatial data, allowing users to explore different layers of information, such as locations, boundaries, and thematic data.
Selectors and Filters: These tools enable users to interact with the data by applying specific criteria filters. Filters can be based on location, time, or attribute values, allowing for focused analysis.
Indicators: Indicators provide quick insights into key metrics. They can display figures like total sales, the number of incidents, KPIs achieved, or average values, offering a quick snapshot of the current status.
Charts: Charts represent data trends and distributions visually. Common types include bar charts, line charts, pie charts, and histograms, complementing maps by providing a different perspective on the data.
Gauges: Gauges display data within a range, often used to monitor progress towards goals or thresholds, such as showing the percentage of a target achieved.
Before creating a dashboard, ensure your data is clean, structured, and geospatially enriched. This involves eliminating inconsistencies or errors, organizing data for easy interpretation and including necessary spatial components like coordinates and boundaries
This step involves using the ArcGIS online to create a map using MapViewer or MapViewer Classic while symbolizing data appropriately, creating ArcGIS Dashboard as a new app and finally adding the created map in the new Dashboard.
This step involves adding interactive tools like dropdowns, filters, sliders, and date pickers as well as configuring them to interact with the map and other elements. Additionally, indicators, charts/graphs and gauges are added to display key metrics in real time, depict data trends, patterns and distribution as well as provide a quick overview of the key insights.
The dashboard can be customized as per the author’s wishes in a way that promotes intuitive user interaction by utilizing a clean layout, adjusting fonts, colors, balancing element sizes relative to other elements and map content. This stage helps to create a well balanced cohesive look.
After customizing the dashboard to the author’s liking, the author publishes the dashboard through embedding it in a website or by sharing it directly with the intended audience. The author should ensure that all layers/datasets used in the map and dashboard are accessible to the audience before sharing the dashboard.
ArcGIS Dashboards offer powerful tools for visualizing and analyzing geographic data across various sectors, enhancing decision-making and operational efficiency. They can be used for various functions and sectors as shown in the following non-exclusive examples.
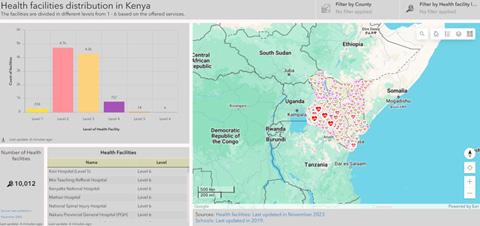
In public health, ArcGIS Dashboards enable realtime tracking of disease outbreaks, vaccination coverage, and health resource allocation. By integrating data from multiple sources, health officials can quickly identify hotspots, monitor trends, and deploy resources effectively, as seen during the COVID-19 pandemic.
Environmental management can benefit significantly from ArcGIS Dashboards which offer tools to monitor natural resources, track environmental changes, and manage conservation efforts. Dashboards can display data on deforestation, water quality, and wildlife populations, helping agencies respond to environmental threats and develop longterm sustainability plans.
In business, ArcGIS Dashboards support market analysis, asset management, and customer service improvements. Retailers can analyze customer demographics, sales data, and competitor locations to optimize store placements and marketing strategies. Utility companies use dashboards to monitor infrastructure, manage outages, and plan maintenance activities.
In summary, with rapidly expanding applications of geographical information systems and data analysis, ArcGIS Dashboards are among the most essential tools aimed at translating data into valuable information. This functionality of presenting location based analytics in a visually appealing and responsive manner makes them essential tools for organizations regardless of the sector.
Through the application of ArcGIS Dashboards, organizations can complement their decisionmaking process, analyse trends, receive status updates in real-time and share information with their stakeholders. Finally, it is essential to understand that the primary focus of dashboards is on the type and format of displayed information, allowing users to choose options that will meet their needs and provide valuable insights. As one of the information products, ArcGIS Dashboards fit well into maps and apps to complete a must-have capability in any GIS system.
By Mearg Belay Shibeshi

Land-Use and Land-cover (LU/LC) changes are the major factors influencing catchment hydrology. Thus, understanding the impact of LU/LC on recharge is important for management of water resources. The main objective of this study was to determine the LU/LC change of Akaki catchment between the year 1986−2015 G.C and to evaluate the impact of these changes on recharge.
To analyze the changes in area over the time, a satellite image was obtained for the years 1986, 2000 and 2015. The methodology consists three steps. First land-cover (LC) maps of the year 1986, 2000 and 2015 were compiled. Secondly, the relationship between hydro meteorological elements and recharge has investigated. Finally, WetSpass modeling was applied to estimate the seasonal and annual ground water recharge. The model was run for the three different years LC maps keeping the other parameters constant. Hence, the result reflects impact of LULC change on recharge. The simulated results of the model indicate that the mean annual recharge was decreasing from 268.6 mm/y for land‒use (LU) map of 1986 to 264.9 mm/y and 260 mm/y for LU maps of 2000 and 2015, respectively. The Study outputs indicated that recharge in the catchment did not change significantly. However, LULC had remarkable variation in the period between1986 and 2015.
Impacts of LU/LC change on atmospheric components of the hydrologic cycle (regional and global climate) are increasingly recognized (IPCC, 2007). Unlike surface water where, the impact of LU/LC on subsurface components of the hydrologic cycle, the saturated and unsaturated zone are less well recognized. However, the potential scale of subsurface impacts is large. So far, impacts of LU/LC change on ground water resource particularly ground water recharges are less well recognized. Therefore, to estimate and understand the impact of LU/LC change on ground water recharge, it is also important to accurately assess the type and direction of changes occurring within the watershed.
Thus, land use changes have to be evaluated properly. For the sustainable management of groundwater resources, the amount of recharge received by an aquifer is by far the most important figure required. Yet this figure is usually the least well-known quantity in hydrogeology, especially in arid and semi-arid environments (Kinzelbach et al., 2002). It is also important to understand how LU/LC change impacts ground water recharge, especially in regions that are undergoing rapid urbanization.
Therefore, this study focused on the analysis of hydrological processes and recharge ability of various land‒use types. A specific modeling tool to estimate recharge that should be mentioned in depth, as it was used in this research project, is the WetSpass modeling. For this study the WetSpass model is to be applied with a focus on how hydrological processes respond to land use change, and what affect various land uses have on groundwater recharge.
WetSpass is an acronym for Water and Energy Transfer between Soil, Plants and Atmosphere under quasiSteady State and it was built as a physically based methodology for estimation of the long-term average, spatially varying, water balance components. It is especially suited for studying long-term effects of land use changes on the water regime in a watershed. The model is completely integrated with GIS ArcView (3.x) as a raster model coded in Avenue, the programming language of ArcView.
WetSpass is an acronym for Water and Energy Transfer between Soil, Plants and Atmosphere under quasiSteady State and it was built as a physically based methodology for estimation of the long-term average, spatially varying, water balance components. It is especially suited for studying long-term effects of land use changes on the water regime in a watershed. The model is completely integrated with GIS ArcView (3.x) as a raster model coded in Avenue, the programming language of ArcView.
The model uses seasonal (summer and winter) geographical information systems (GIS) input grids of the mentioned inputs to estimate annual and seasonal groundwater recharge values:
R= P S ET
Equation (1)
Where, R is the groundwater recharge, P is the precipitation, S is surface runoff and ET is evapotranspiration, with mm units for all parameters. The surface runoff is calculated using the classical rational formula:
S = CHOR C (P – I)
Equation (2)
Where, CHOR is a coefficient that parameterizes the part of the seasonal precipitation that actually contributes to runoff, C is a runoff coefficient based on the rational formula and I is the interception (mm).
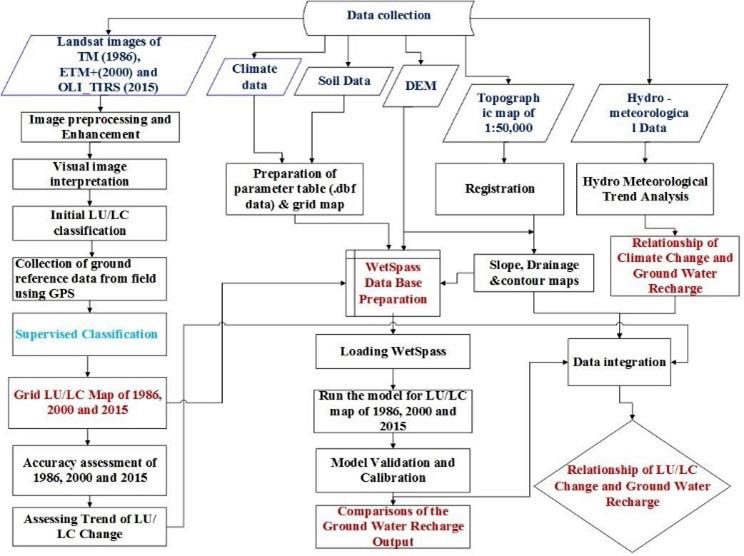
This study was conducted using data collected from literature, secondary data collected from office, primary data gathered from field survey and laboratory analysis of remote sensing imageries. The methodology used for this study was given below in Fig. 1.
Fig. 1. Flow chart showing the general frame work of the study.
Land-Use and land-Cover change detection
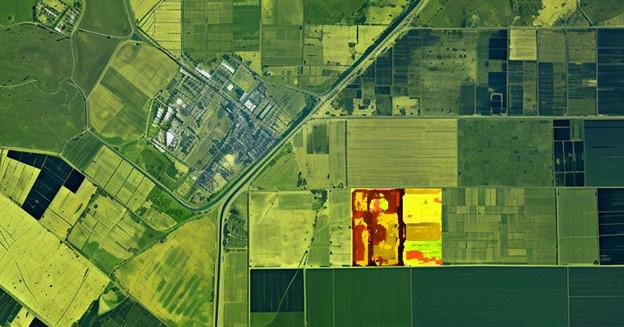
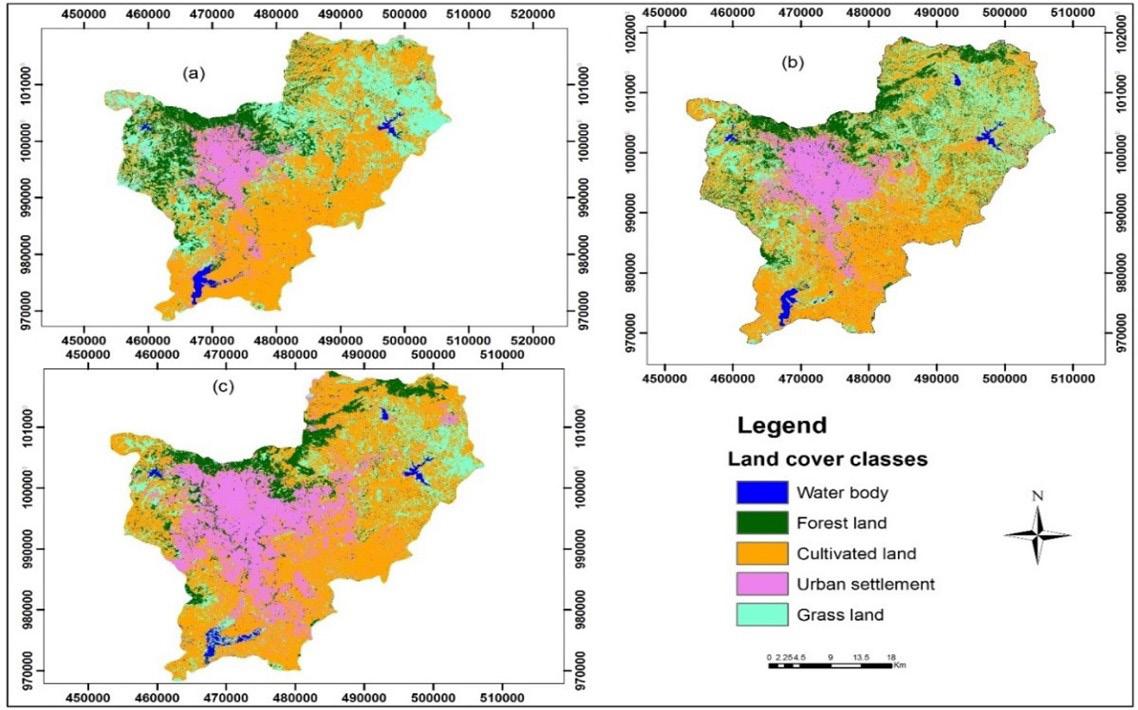
The land‒use maps for 1986, 2000, and 2015 for Akaki catchment are presented in Fig.2 Comparison of classification results suggest that the principal land‒cover changes observed in the study area between 1986 and 2015 are the urban settlement, grass land, forest and cultivated lands. The area and percentage coverage of these five lands‒use classes during the three intervals are presented in Table I. It shows that the urban settlement and cultivated land areas were increased while that of forest and grass land declined continuously from 1986 till 2015.


Table- I: Land-use/ land-cover categories in the study area during 1986, 2000 and 2015.
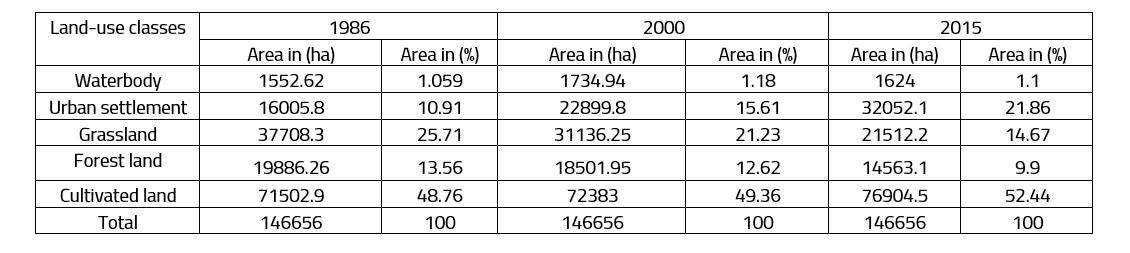
Table I shows the spatial distribution of land-use/land-cover categories of the study area during the three years 1986, 2000 and 2015 in the Akaki catchment. For the year 1986, the land cover map is shown in Fig. 2a. The percentage coverage of each class is shown in Table I and indicates that the highest area of the catchment is covered with cultivated land (48.97%), while forest, grass land, urban settlement and water covered 13.56%, 25.71%, 10.9% and 1.06%, respectively.
For land-use/land-cover map of 2000 as shown in Fig. 2b, the areal coverage of cultivated land, urban settlement and water body was increased to 49.36%, 15.61% and 1.18%, respectively, while the areal coverage of forest land and grass land was decreased to 12.62% and 21.23%, respectively.
The LU/LC map for 2015 of the Akaki catchment is presented in Fig. 2c, in which the cultivated land is covered for about 52.44% of the areal extent of Akaki catchment. Whereas forest land, grass land, urban settlement and water body covered 9.9%, 14.67%, 21.86% and 1.1% of the areal coverage of the study area, respectively.
Fig .2. Land‒use map of the years 1986 (a), 2000 (b) and 2015(c)
WetSpass gives various hydrologic output grids on a yearly and seasonal (summer and winter) basis. Even though the model was originally developed to compute the long-term spatially distributed recharge of a basin, it also simulates runoff, evapotranspiration, interception, transpiration, soil evaporation and errors in water balance. The results of the modeling are given by digital grid maps of the spatial distribution of annual average values of actual evapotranspiration, surface runoff and groundwater recharge for the 29 years period from 1986 to 2015 under different land use scenarios.
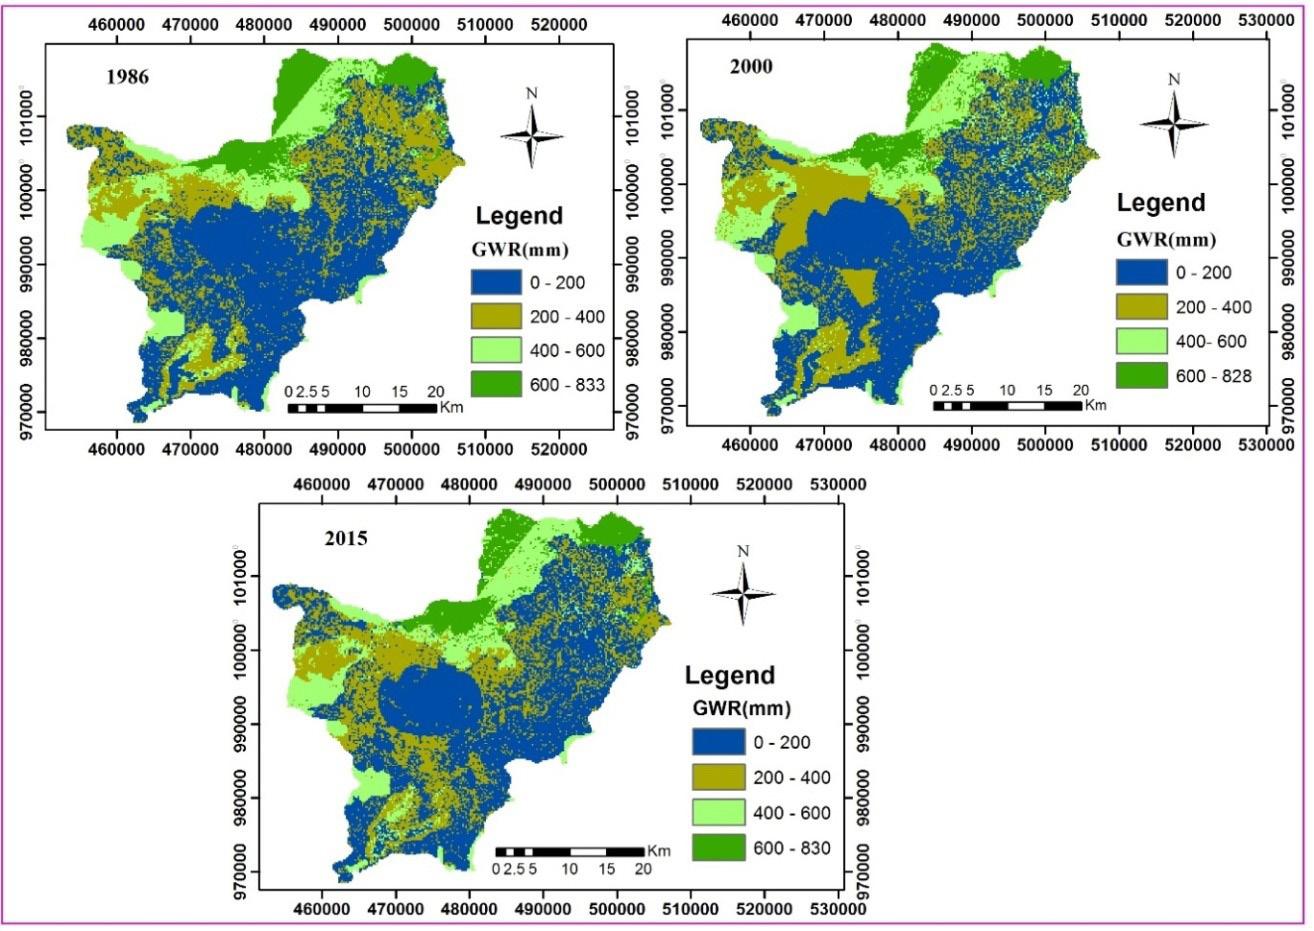
The WetSpass model was applied for the three different land‒use maps to assess the impact of land‒use and land‒cover change on water balance of the catchment especially ground water recharge. It estimates seasonal and annual long-term spatial distribution amounts of groundwater recharge by subtracting the seasonal and annual surface runoff and evapotranspiration from the seasonal and annual precipitation respectively. A simulated result of WetSpass modeling for groundwater recharge was summarized for each period as an average map
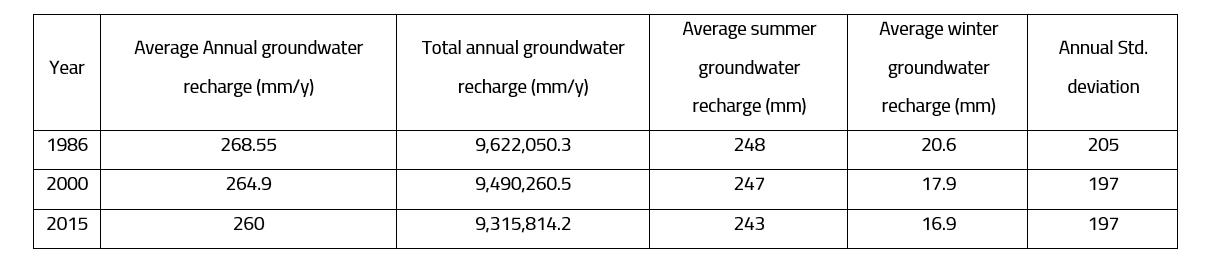
Fig. 3. The results indicated that the total annual ground water recharge for Akaki catchment was changed insignificantly from time to time with change in land‒use and land‒cover. The model estimates the simulated total annual ground water recharge of the catchment for land‒use and land‒cover maps of 1986, 2000 and 2015 to be 9,622,050.3 mm/y, 9,490,260.5 mm/y and 9,315,814.2 mm/y respectively. Table II shows the simulation results of WetSpass modeling for ground water recharge under different land‒use and land‒cover scenarios and season (summer and winter). It also shows both the annual and seasonal ground water recharge of the catchment was slightly decreasing with changing in land‒use and land‒cover.
Table- II: Comparison of ground water recharge under different land use and land cover scenarios
Impact of land‒use change on groundwater recharge
Based on three different periods of remote sensing and the longterm observed hydro-meteorological data from the 1986 to 2015, the impacts of land use changes in the groundwater system in the Akaki catchment were analyzed by estimating of groundwater recharge.
Land-use and land-cover changes like urban settlement expansion and change of grass land and forest land in to cultivated land are found to be the major changes in the catchment. From the land‒use land‒cover classification result maps for the periods of 1986, 2000 and 2015, it has been observed that grass land and forest land have changed negatively during 1986 to 2015 change detection phase by -16,196.1 ha and -5,323.16 ha area while urban settlement, cultivated land and water body area have changed positively by 16,046.3 ha, 5,401.6 ha and 71.38ha respectively.
Such dramatic change was caused by the uncontrolled expansion of urbanization, industrialization and increase of population. It has been reported that in many parts of the world the water table is declining at the rate of 1–2 meter/year as a result of population increase and land‒use and land‒cover changes particularly urban expansion and deforestation (Singh et. al., 2010).
Some previous works that make effort to estimate ground water recharge are available in the Akaki catchment such as the one published by Demilie et al. (2006), AAWSA (2000) and Nigussa (2003). The model results for this research were continuously verified by the previous model results and independent runoff data. According to Demilie et al. (2006) estimates ground water recharge of the Akaki catchment by using the chloride mass balance (CMB) method and he was calculated the annual ground water recharge of the catchment to be 265 mm, which amounts to 23% of the weighted mean annual areal precipitation of the catchment.
Comparison of this value with the present simulated model result appears to be in a good agreement. On the other hand, Nigussa (2003) estimates the average recharge of the catchment by using empirical model known as DRASTIC and GIS.
However, this study appears to overestimate the recharge values estimated by Demilie et al. (2006),
AAWSA (2000) and Nigussa (2003). The variation in the estimated values of ground water recharge by different methods indicates the requirements of relatively high-quality methods of recharge estimation. Hence, for successful estimation of groundwater recharge utilization of a variety of exhaustive and accurate independent methods is mandatory.
Humans have exerted large‒scale changes on the terrestrial biosphere, primarily through the landuse/land-cover changing. However, the impacts of such changes on the hydrologic cycle particularly groundwater recharge are poorly understood. Hence, groundwater recharge estimations under different land‒use scenarios are essential for the management of groundwater aquifers.
The objective of this study was firstly to use RS imageries to see the changes on LU/LC of the catchment for the past 29 years. Secondly, to map areas of recharge and understand how land management practices could affect recharge. In this study, a geospatial analysis approach based on RSGIS technology and the seasonal steady-state water balance model, WetSpass, was implemented.
Comparison of classification results indicates that the water body, urban settlement and cultivated land areal coverage from 1986 to 2015 increases form 1,552.6 hectare, 16,005.8 hectare and 71,502.9 hectare to 1,624 hectare, 32,052.1 hectare and 76,904.5 hectare respectively. While forest and grass lands are decreased from 19,886.26 hectare and 37,708.3 hectare to 14,563.1 hectare and 21,512.2 hectare respectively. Results from the WetSpass model are in good agreement with some of the recent previous studies and indicates the validity of the simulated recharge.
I want to express my feeling of gratitude to Dr. K.V. Suryabhagavan and Dr. Dessie Nedaw.They have fully utilized their precious time and also providing all the necessary relevant literatures and information that are crucial for the quality in the present study. The financial support from the university of Aksum and Addis Ababa University was essential for my studies and merits great thanks. Autors wants to give special thanks to GSE (Geological Survey of Ethiopia), Ministry of Water Irrigation and Energy (MoWIE) and AAWSA (Addis Ababa Water and Sewerage Authority) for their helps and providing all necessary data.
IPCC, Climate change, ”The physical science basis.10thSession of working Group I of the IPCC”, Paris. France. 2007.
W. Kinzelbach, W. Aeschbach, C. Alberich, B.GoniI, U. Beyerle, P. Brunner, W.H. Chiang, J.Rueedi, and K.iZoellmann, ”A Survey of Methods for Groundwater Recharge in Arid and Semi-arid regions. Early Warning and Assessment Report Series”, UNEP/DEWA/RS.02-2. United Nations Environment Programme, Nairobi, Kenya. 2002.
Addis Ababa Water and Sewerage Authority (AAWSA ), Addis Ababa water supply project. Stage-III A groundwaterphase I , 2000.
R. B. Singh, D. Kumar, and A. Kumar, “Groundwater Situation in India: Problems and Perspective”. 2010, pp:563-580.
M. Demlie, S. Wohnlich, B. Gizaw, and W. Stichler, “Groundwater recharge in the Akaki catchment, Central Ethiopia: Evidence from environmental isotopes ( 18O, 2H and 3H) and chloride mass balance”, Journal of Hydrology Process, 2006.
D. Nigussa, “GIS based groundwater vulnerability assessment in the Akaki rive catchment (Addis Ababa), central Ethiopia”, MSc Thesis, School of Graduate Studies, Addis Ababa University, Addis Ababa, 163 , 2003.


Elevate your brand to new heights by aligning with Afrospatial Magazine, your gateway to the pulse of geomatics innovation worldwide! As we celebrate our inaugural issue, we are offering special advertising packages designed to boost your company’s visibility. Act now to unlock unique opportunities and connect with the global geospatial community.
By Kevin Yego

In any construction project, a surveyor is always the first person on the ground and often the last. The first task surveyors undertake during a project’s lifecycle is performing a Topographical/Feature Contour Survey. This survey that entails measuring and depicting the Terrain, Elevation changes and existing Natural and Man-made features of a land parcel. The resulting topographical maps are used by architects and engineers to inform the project’s designs.
Despite technological advancement in surveygrade equipment used-from Theodolites to Total Stations, Robotic Total stations and the Global Navigation Satellite System (GNSS), the process largely remained terrestrial. Surveyors physically collected feature points which can be quite laborious, dangerous and expensive especially when dealing with large tracks of land that’s densely populated with features.
UAVs (Unmanned Aerial Vehicles) or drones offers a solution to above mentioned challenges. Their advent has singlehandedly revolutionized how topographical surveys are conducted ushering an era that has seen the art of topo survey transformed from terrestrial to aerial. In this blog we take you through how drones came to be a surveyors’ ultimate tool in matters topographical survey.
Drone survey is an art and skill of using drones to capture high resolution imagery that is post-processed to produce an Ortho-photo/ Orthomosaic, from which measurements are made. This is a photogrammetric process thus adheres to photogrammetric principles. Photogrammetry is the science of making measurements from photographs, especially for mapping and surveying.
Early concerns and Technological Advancements. In its early days, the surveying fraternity largest concerned with drone technology was whether or not it could survey large tracks of land without a significant margin of error denting its deliverable.
Ground Control Points (GCPs) carefully placed using GNSS (Base and Rover) were used to geotag photos, creating georeferenced orthomosaics. Although simpler than terrestrial techniques, this process was still arduous especially when dealing with large parcels of land.
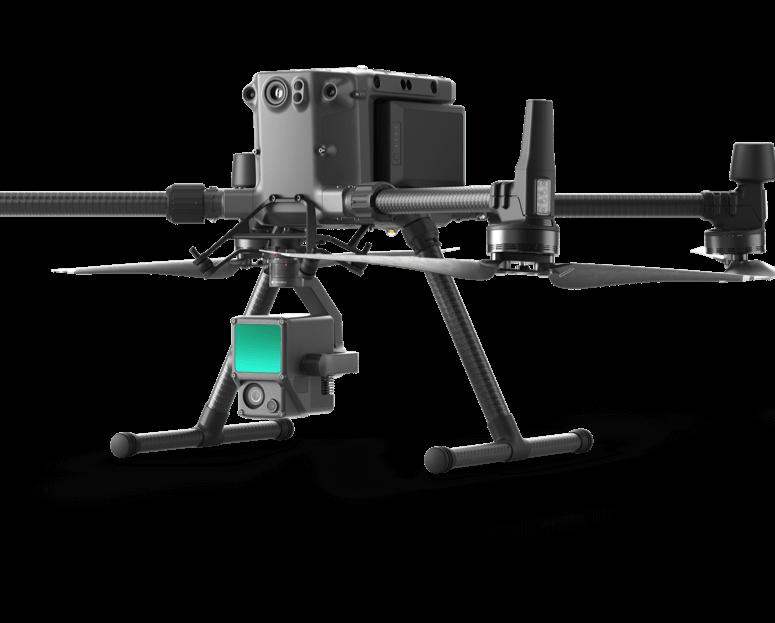
Technological advancement in GPS technology particularly Real Time Kinematics (RTK) and the miniaturization of GPS modules came to our rescue ushering a new era of RTK drones.
These drones can now produce ortho-photos with survey-grade accuracy (centimeter level) without the need to set GCPs on-site.
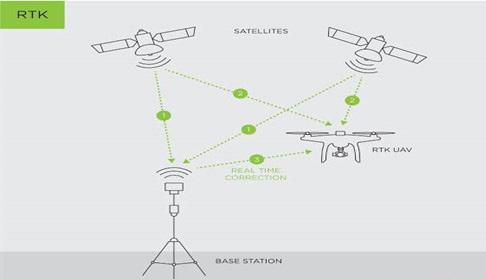
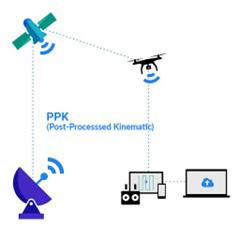
RTK modules onboard the drone collects its positional information allowing photos to be geotagged during flight. An active base station sends raw GPS data, which the drone combines with its own observations to accurately determine its position relative to base station. This real time processing ensures high accuracy in data collected.
With Post Processing Kinematics (PPK), the workflow involves resolving positional errors after data collection. This method does not require a constant connection to a base station, making it more flexible in certain scenarios. PPK processes the data after the flight resolving any positional discrepancies ensuring precise geolocation.
Armed with UAVs equipped with high resolution optical sensors, and RTK or PPK workflows, surveyors can capture detailed aerial imagery of land parcels. This imagery is then processed using specialized software to produce topographical maps, gone are the strenuous days spent working out points manually.
Topographical map of a construction site.
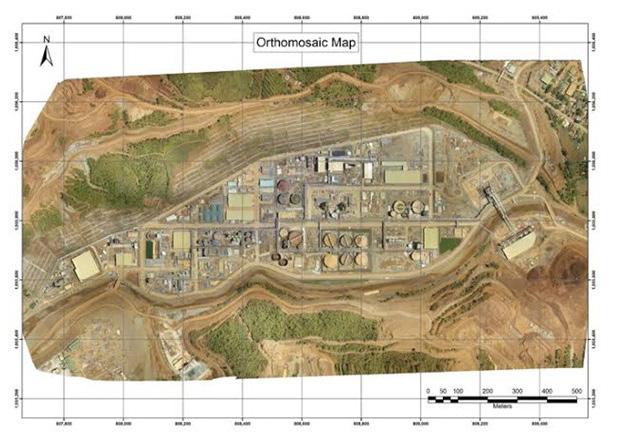
Project teams can obtain detailed and precise topographical maps, contour lines, and Digital Elevation Models (DEMs) to evaluate large worksites rapidly. Architects and engineers can reference the data provided on these topo-maps throughout the design process to develop designs that are both practical and aesthetically pleasing.
Given that these flying robots can conduct topographical survey at a nick of time while meeting industry standards by delivering precise topographical maps, DEMs, DTMs (Digital Terrain Models) and DSMs (Digital Surface Models) while instantaneously keeping survey crew lives safe from hazardous fields, it’s easy to see why it came to be a must have gadget for surveyors in matters topographical Survey.
UAVs not only increase productivity by enabling engagement in more projects in the same timeframe, but also provide more qualitative data, allowing for better analysis in compared to conventional, costly, laborious and time consuming survey methods.
By Gerald Nyanjua Amolo

As I author this article, many Cities and Urban setups have failed due to inappropriate planning and Urban Planning practices. Before I delve into the use of Geographic Information Systems (GIS) in Urban Planning, it is crucial to understand the concept of Urban Planning. Urban Planning is the management and coordination of the construction of built-up areas for improving human living standards in habitable, effective, and aesthetically pleasing environments.
The technology of GIS is very crucial and needed in urban, as it provides substantial functionality to handle spatial data to support decisions made in the Planning process. This article extends further in explaining how GIS is utilized in Urban Planning, constituent, role, use, and value. GIS hardware hereby refers to the equipment used to run GIS software and handle spatial data. This commonly includes computers, servers, GPS devices, and other mobile data collection devices.
Stable hardware is employed because it is important to handle big data and have effective methods for computations. The technologies associated with GIS provide the toolsneeded for gathering, archiving, accessing, processing, and visualizing geographical information.
1. ArcGIS:
One of the most comprehensive integrated software applications that improve spatial analysis and mapping tools.
2. QGIS:
An open-source GIS software, which is
considered by many to be extremely flexible and modular due to a plugin system.
3. Google Earth:
They are also used in the production of maps that display geographicalinformation across the globe. GIS is based on two forms of information: spatial information (which can be places, forms, and structures) and attribute information (which provides extra information about spatial information).
4. Remote Sensing:
Second, using satellite imagery and aerial photographs as tools for data collection and analysis. Surveys: Primary data was collected from a survey through GPS devices and total stations.
5. Existing Maps and Databases:
Geospatial references, and other references that include topographic maps, cadastral information, and other demographic databases. This means that dataanalysts or scientists, urban planners, policymakers, or even any other member of the community can apply GIS.
Therefore, the right GIS implementation is grounded on the ability to ensure a sufficient number of highly skilled staff can analyze the spatial data and apply them to tackle issues facing Urban Planning and Development. The methods component is the procedures and techniques used to operate and analyze GIS data. This encompasses Spatial Analysis, Modeling, and Statistical Techniques that are quite unusual in handling various Urban Planning issues.
Several roles of GIS include assisting in the collection, storage, and analysis of both spatial and non-spatial data about Urban Areas. This aspect makes GIS useful in planning because it synthesizes data from various fields and presents Planners with the bigger picture. Among the spatial analysis techniques in GIS that can be employed by Urban Planners to describe relations, patterns, and trends at the city level include;
Proximity Analysis: Defining how near or far one feature is from the other features that might encompass schools, hospitals, and residential units.
Overlay Analysis: placing one or more maps on top of another to emphasize some areas of concern or interest such as areas prone to floods and regions that experience high rates of criminal activities.
Network Analysis: Deciding on which strategies should be followed by the transportation systems, taking into account traffic and coverage.
Geographic Information Systems mapping is essential in waste management because it provides a clear picture of waste generation patterns, collection routes, and potential disposal sites. This visual understanding helps optimize collection schedules, minimize transportation costs, and identify areas for improved waste management infrastructure. By analyzing data on waste hotspots and flow patterns, Urban Planners can develop efficient waste management strategies, reduce environmental impact, and promote sustainable waste management and disposal practices.
Another aspect of GIS is visualization. This is key because GIS assists Planners in creating a mirror of the environment based on various aspects in the form of maps and models. When key constituencies and audiences consume and decode information, the method of representation offers value in the way that it creates a surface for the exchange of ideas and cooperation. As such, GIS is effective in the modeling and simulation of Urban Systems where a Planner can try out different scenarios and see the outcome. For instance, they can use the model to predict the impact of population growth on the amount of infrastructure to be used or the impacts of zoning alteration on land utilization.
This again can play an important role in the decision-making process by presenting the bits of information in the form of recommendations and suggestions supported by the available spatial data. The analysis can be applied to potential development plans, assess impacts on the environment, prioritize projects, and more.
What is the Basic Geographical Information System when incorporated into Urban Planning? Agricultural land management is an activity in the field of Land Use Planning that aims at the division of and use of the land among the various sectors of development such as residential, commercial, industrial, and recreational. GIS assists Land Use Planning by Analyzing Land Suitability, which evaluates the chances for the development of some territory according to the type of soils, reliefs, and position to communication. Zoning assists in identifying a checklist that would indicate which areas are suitable to be provided with structures and outlining the set of regulations to be used in the process of the development of those areas based on the current type of land uses in the regions.
GIS is very useful in observing change by monitoring the developmental changes in land utilization, evaluating the impacts of planning policies that have been implemented, and detecting new trends. Appropriate end-use of the infrastructures ensures an increased durability of built-up areas and service provision. GIS also plays a vital role in infrastructure planning and management, the application of GIS in infrastructure planning and management can be described as follows:
Infrastructure Networks to be mapped: These are important in locating on the map roads, utilities, public transport facilities, and green areas. This can be used to show that some areas seem to lack these important infrastructures to plan how to distribute resources for proper development of the area and to ensure that attention is paid to such areas that do not seem to have any proper road network for transportation and other utilities
Analyzing Demand: Regarding the number of infrastructural services needed today and in the future concerning population and several activities that occur on different pieces of land.
Asset Management: Synchronization of measurements in terms of observing the usage and depreciation of infrastructural assets based on their useful economic life. In this process, various conditions for further development of the urban territory are weighed with the necessity to preserve the environment.
GIS serves the purpose of environmental management in the following ways:
Assessing Environmental Impacts: Taking into account the potential impacts of development projects on natural resources and environments in regards to the measure of bio-diversity value. Identifying Risk Zones: Conducting assessment on geographic areas prone to risks from natural disasters such as floods, landslides, or erosion to plan and design adequate mitigations and other sustainable measures and practices.
Conservation Planning: This capacity allowed for estimating and ranking species and ecosystems according to their significance and consequently, choosing targets for conservation. GIS in Transportation Transportation systems are the main instruments in making society more mobile or less congested, and hence, more affluent.
The following are some of how GIS aids in transportation planning:
Analyzing Traffic Patterns: Identifying features of the traffic and congestion to define the existing vulnerabilities and potential sources of traffic improvement.
Optimizing Public Transport: Ensuring that the everyday itineraries and operational timetables of public transport services cover as many people as possible.
Evaluating Connectivity: Assessing the integration of different types of transport networks and potential ways to enhance and develop them.
This is because the participation of the individuals is highly encouraged more so when it comes to identifying the needs of the urban areas and coming up with a way of meeting such requirements. Integrating GIS into the Planning and decision-making process and promotes public participation in the following ways:
Providing Interactive Maps: Offering a scenario whereby the citizens can employ technological tools to comprehend planning proposals or even engage in an active survey.
Facilitating Transparency: Relaying the planning information and data of the company to the public in an endeavor to make the company more transparent.
Supporting Collaborative Planning: Creating interactivity of planners, stakeholders, and the community to create multiple possibilities for further expansion of cities. GIS is therefore a very important tool in Emergency Planning and Management practices to offset or prevent the loss of an urban area in case of disaster.
Risk Assessment : Using G. I. S in determining risk avoidance areas vulnerable to natural and other anthropogenic disasters.
Evacuation Planning: Assessment of the number of refugee areas and evacuation corridors based on physical characteristics and population density in the danger areas.
Resource Allocation: Delivery of emergency products and services in a bid to ensure that the cases are dealt with as required.
The following are the benefits of GIS in urban planning.
Decision-making: Here, GIS contributes to the correct decision-making within a short time based on data typical for the modern urban environment. In this way, the Planner secures a good number of choices in which he can reason and work where it is required and necessary without jeopardizing and possibly offering a raw deal to the country and its people.
The benefits it has include that the GIS software does most of the Planning aspect because; it is useful in the collection of data, analysis of data, and presentation of data. That reduces time, it also releases a lot of time for the Planners and other individuals who are involved in the Planning as well as do lots of planning and formulation of Planning policies.
Collaboration: The major advantages that GIS has over other systems include the fact that it fosters interconnectivity between the different departments of an organization, and other stakeholders who may be involved in a particular project or members of a community associated with the GIS. This increases the chances of having a strong approach to Urban Planning since the different views of people are taken into consideration.
Transparency: As a result, GIS transcends barriers and contributes to Planning data dissemination, thereby enhancing the degree of accountability to the public. They get a chance to collect information on various projects and changes in the zones and the development of the infrastructure that the citizens should actively take part in Planning.
Better resource management: It makes it easy for planners to identify areas of shortage or lack of amenities and, therefore, ensure that necessary resources are channeled towards such regions. This ensures that the available scarce resources will be well utilized in the overall management of society to have the best results.
Sustainable Development: GIS in Planning incorporates Environmental, Social as well as Economic perspectives in such a way that it would increase Sustainable Development. Thus, the impact of development on resources and communities will be identified, and the cities for habitation that are Sustainable, Sufficient, and Environment-friendly can be planned
Conclusion
Technology in the form of Geographic Information Systems has enhanced Urban Planning by making it possible to analyze spatial data; display features and patterns, and justify planning decisions. Cities are rapidly expanding and developing, they are likely to experience challenges like climatic change, resource constraints, and high pressure regarding human population, GIS will remain an indispensable tool in the development of sustainable and resilient cities. With the help of GIS, Urban Planners and Landscape Architects can implement mechanisms for creating comfortable Urban Environments, which, at the same time, protect the interests and opportunities of the next generation.
By David K. Njoroge

The Continuously Operating Reference Stations (CORS) system is essential in modern land surveying, providing real-time GPS corrections for highly accurate geospatial data. Let dive into some of the areas it enhances precision.
Continuous data collection is crucial for monitoring changes in the Earth’s surface, infrastructure stability, and environmental conditions. CORS networks, by offering roundthe-clock GPS data, enable surveyors to collect high-precision information over extended periods, which is critical for long-term projects and dynamic environments. One of the primary benefits of using CORS in continuous data collection is the ability to monitor and analyze gradual changes in the landscape. This is particularly important for projects involving land subsidence, tectonic movements, or the stability of large structures such as dams and bridges. CORS stations provide a stable reference point that allows surveyors to detect even minute changes in position with a high degree of accuracy. By continuously collecting and analyzing data from CORS, surveyors can identify trends and potential issues early, enabling proactive measures to prevent structural failures or environmental damage.
In addition to monitoring changes, CORS facilitates real-time data collection, which is essential for dynamic environments where conditions can change rapidly. For instance, in coastal areas subject to erosion or in regions prone to landslides, continuous data from CORS allows for real-time monitoring, providing valuable information for emergency response and disaster management. The ability to collect data continuously ensures that there are no gaps in the dataset, which is crucial for accurate modeling and analysis.
CORS also supports the automation of data collection processes, reducing the need for manual intervention and increasing efficiency. This automated process is particularly useful for largescale or long-term projects, where consistent data quality is essential.
In land surveying, the accuracy of positional data is paramount. Traditional GPS receivers, without correction, can only provide accuracy within a few meters due to atmospheric conditions, satellite orbit errors, and other factors. However, with CORS, surveyors can apply differential correction techniques, significantly improving the accuracy of GPS measurements. The CORS network functions by continuously recording satellite data, which is then processed to determine corrections for positional errors. These corrections are relayed to surveyors’ GPS units in real time, allowing for precise on-the-fly adjustments.
One of the significant advantages of using CORS in land surveying is its contribution to the efficiency and reliability of data collection. Since the CORS network is widely established and maintained by government and research institutions, surveyors can access reliable reference data from nearly any location. This reduces the need for setting up temporary base stations, thus saving time and resources. Furthermore, CORS data is crucial for applications requiring long-term stability and consistency, such as monitoring land subsidence, tectonic movements, or coastal erosion.
A baseline in surveying is the distance and direction between two fixed points, typically established using high-precision GPS techniques. CORS networks provide the necessary data to establish these baselines with exceptional accuracy. In traditional land surveying, establishing a baseline required the physical placement of markers and the use of manual measurement techniques, which were timeconsuming and prone to errors. With the advent of CORS, surveyors can now leverage real-time or post-processed differential GPS data to define baselines more accurately and efficiently.
The CORS stations, which are strategically located and continuously recording satellite data, provide a stable reference point from which surveyors can measure the exact position of their GPS receivers in the field. When using CORS to establish a baseline, surveyors place a GPS receiver at one point of interest while referencing data from the nearest CORS station. The receiver collects satellite signals, which are then corrected using the data from the CORS. The differential corrections account for atmospheric disturbances, satellite orbit errors, and other factors that can affect GPS accuracy. By doing this, surveyors can precisely determine the position of the receiver relative to the CORS station, establishing a highly accurate baseline.
The ability to establish precise baselines using CORS is particularly important in large-scale projects, such as infrastructure development, where accurate measurements are crucial for ensuring the integrity and alignment of structures. CORS also allows for the re-establishment of baselines over time, enabling consistent monitoring and maintenance of critical infrastructure.
Environmental Management.
Continuously Operating Reference Stations (CORS) are integral to environmental management within the realm of land surveying, providing the precise geospatial data necessary for monitoring, analyzing, and managing environmental resources and changes. Environmental management often involves the tracking of land use, vegetation, water resources, and natural hazards, all of which require accurate and consistent spatial data. CORS networks, with their ability to deliver high-precision positional data, are essential in ensuring the accuracy and reliability of this information.
In environmental management, the need to monitor changes in the landscape over time is critical. CORS provides a stable reference framework that allows surveyors and environmental scientists to track these changes with great precision. For instance, CORS is used to monitor coastal erosion, deforestation, and land subsidence—processes that can have significant environmental impacts. By comparing positional data collected over time, professionals can identify trends, assess risks, and implement mitigation strategies more effectively. CORS has influenced environmental
management by providing real-time data for monitoring natural disasters, supporting early warnings, and improving disaster response.
In urban planning, the development and maintenance of infrastructure require precise measurements to ensure proper alignment, safety, and functionality. CORS enhances this process by providing real-time or post-processed differential corrections to GPS data, significantly improving accuracy. This is vital for tasks such as aligning roads, railways, and utilities, where even minor errors can lead to significant problems. By using CORS, surveyors can achieve centimeter-level precision, ensuring that urban infrastructure is laid out according to plan and that future expansions are accurately integrated with existing structures.
CORS also plays a crucial role in monitoring urban growth and land use changes. Urban planners need to track the expansion of cities, the densification of neighborhoods, and the development of new areas. CORS enables continuous, accurate monitoring of these changes over time, helping planners assess trends and make data-driven decisions about zoning, resource allocation, and environmental protection. For example, CORS data can help identify areas at risk of flooding or other environmental hazards, allowing planners to design resilient infrastructure and implement protective measures.
Furthermore, CORS supports the creation of detailed, accurate maps and Geographic Information Systems (GIS) used in urban planning. These maps and systems are foundational tools for visualizing current land use, planning future developments, and ensuring that all aspects of urban growth are managed sustainably and efficiently. The high precision of CORS data ensures that these tools are accurate, reliable, and up to date. The future of CORS in land surveying is promising, with technological advancements enhancing precision and efficiency.
In conclusion, the CORS system is crucial for modern land surveying, enhancing accuracy, efficiency, and reliability. Its continued evolution will provide essential, high-quality data for future surveying needs.

By Christine Wahome

Crimes are widespread social issues that have an impact on a nation’s reputation, economic progress, and standard of living. They cost the government substantially because law enforcement, prisons, courts, and other services are required. People are at an unsettling point where they need to reduce crime even more quickly since it is rising so rapidly, especially in Kenya.
According to the National Police Service (NPS) (2022), the total number of police-recorded offenses in Kenya has increased by more than 20%, with increases in violent offenses being considerably higher. The law enforcement stations in Nairobi, Kiambu, and Meru had the greatest percentage of recorded crimes, 9.7%, 8.9%, and 6.5%, respectively, making Kiambu the county with the second highest crime rates (NPS, 2022). Researchers can evaluate and predict the locations of crimes, as well as take proactive actions beforehand to lower these numbers.
According to the National Police Service (NPS) (2022), the total number of police-recorded offenses in Kenya has increased by more than 20%, with increases in violent offenses being considerably higher. The law enforcement stations in Nairobi, Kiambu, and Meru had the greatest percentage of recorded crimes, 9.7%, 8.9%, and 6.5%, respectively, making Kiambu the county with the second highest crime rates (NPS, 2022). Researchers can evaluate and predict the locations of crimes, as well as take proactive actions beforehand to lower these numbers.
Real-time crime prediction and widespread surveillance have the potential to drastically lower crime rates, and saving lives is ultimately what matters most (Jawadi et al., 2021). The conventional crime analysis methods have become erroneous due to the abundance of crime-related information available from law enforcement and the intricate relationships among different types of data (Kennao & Kesharwani, 2018). Moreover, other factors, like socioeconomic activities, population, and school dropouts, affect crime occurrence, making crime analysis a complex process.
Therefore, modern technologies, concepts, models, and methods for enhancing crime analytics (exploration, visualization, and evaluation) simplify crime analysis and prediction, streamlining the crime eradication process. A lot of research work was done by various researchers in this domain.
Nevertheless, there has been little study done on the effects of different land use types and unemployment on crime, with most previous studies concentrating on the impact of one land use type on crime-related offenses and unemployment separately. Studies examining the association between unemployment and land use and crime in large urban areas of industrialized countries make up small quantity of empirical research on the effects of land use and facilities and unemployment on the geographical distribution of crime.
Therefore, it was necessary to comprehend such a connection domestically and to consider the effect of environmental, social, and economic factors on crime simultaneously. The main objective of this research was to predict the occurrence of crime in Ndumberi municipality.
Ndumberi, located in Kiambu County, Kenya, is a rapidly developing municipality with a population of about 31,359 people (2019). The area is known for its agricultural activities, notably the Ndumberi Diaries Cooperative, a major yogurt producer in Kiambu County. Improved road access, particularly the Nairobi-Kiambu highway, has enhanced connectivity to Nairobi, driving further development and attracting both residents and non-residents.
However, rapid population growth has strained resources, leading to increased crime rates. Poorly designed residential areas and inadequate lighting have created environments conducive to criminal activities. While development projects and commercial activities have drawn many, particularly youth, in search of jobs, the temporary nature of these opportunities and the closure of large farms have left many unemployed and struggling, further contributing to the rise in crime.
Network analysis was conducted to determine the spatial patterns of crime in relation to road networks. Land use land cover classification was conducted to obtain Ndumberi’s land use classes (bareland, forest, agriculture land, built up, and grassland). Supervised classification was used to obtain these classes using 10-metre sentinel-2 imagery.
Visibility analysis was done to determine areas that were visible or hidden from specific vantage points, showing visible and nonvisible areas that influenced criminal activities. Geocoding and data cleaning of the collected crime and population data were done manually, as the data was given with locations as texts.
Zoning (functional zoning) was then done to divide Ndumberi municipality into smaller segments, which was the foundation of this study’s crime analysis. Zonal statistics operations were used on all variables to obtain summary values of the variables per zone.
Regression was done to determine which of the above factors significantly influenced crime and the extent of their influences on crime in Ndumberi. In addition, an accuracy assessment for the regression was conducted to guarantee the credibility and reliability of the regression results.
Significant independent variables obtained from the regression model served as inputs (as explanatory variables for the crimes) into the prediction model (Random Forest). Random Forest was chosen because it captured complex relationships between variables.
Moreover, crime data contained some outliers and this model was robust to outliers as it made decisions based on multiple decision trees rather than relying on a single tree, leading to more stable and accurate predictions. 70% of the crime data was used for training, while the remaining 30% was used for validation of the resultant prediction. Predicted crimes then informed the decision to choose optimal sites for the installation of CCTVs and security lights, which help eradicate crime.
This research developed a methodological approach to analyze and predict crime spatially, revealing that traffic and road accessibility significantly impact crime rates. The study emphasized the importance of incorporating environmental solutions, such as infrastructure planning and security lighting, into crime prevention strategies.
Key factors influencing crime in Ndumberi were identified, including population density, land use and land cover (LULC), unemployment rates, traffic, and low visibility. These factors highlight the socio-economic and environmental dimensions of criminal behavior. The study found that both commercial and residential zones, along with increased built and agricultural land use, contributed to crime incidence.
The regression method used was highly effective, with an r squared of 0.894, indicating strong correlations between these factors and crime. Significant crime was predicted along road networks, particularly near the Ndumberi highway. Insufficient surveillance due to low visibility was also identified as a major factor, suggesting that increasing visibility could enhance crime prevention.