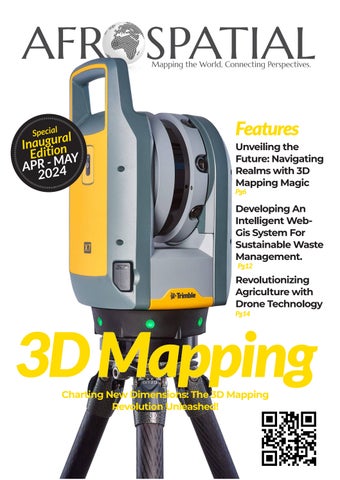
Features
Unveiling the Future: Navigating Realms with 3D Mapping Magic
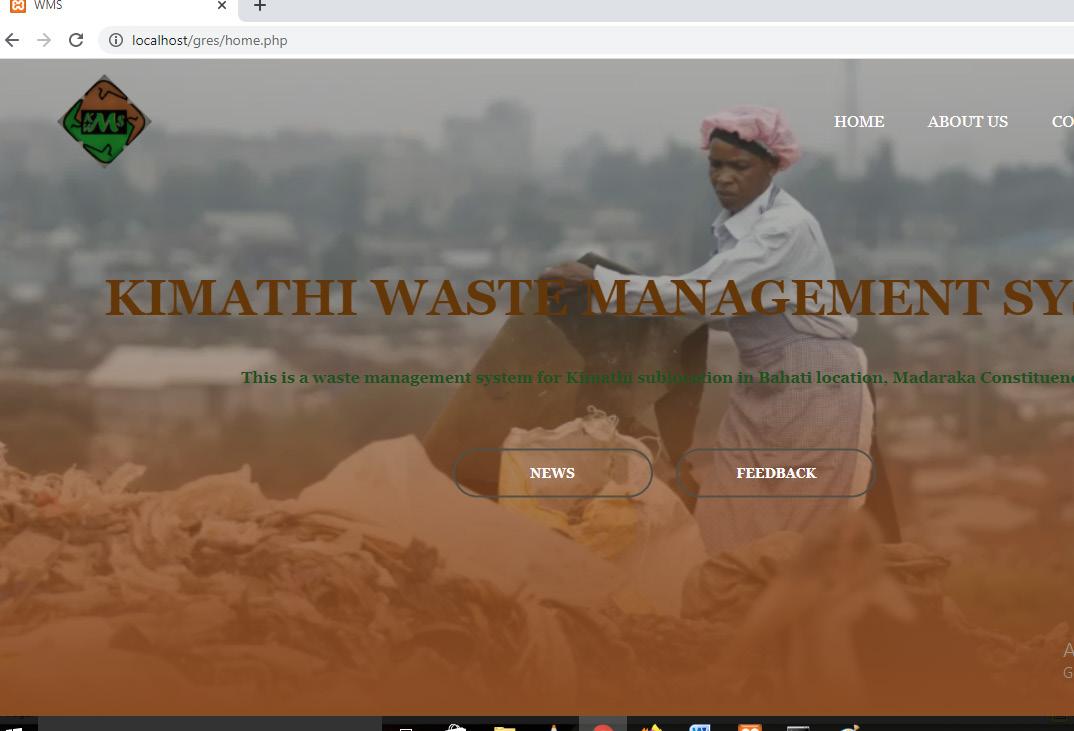
Developing An Intelligent WebGis System For Sustainable Waste Management.
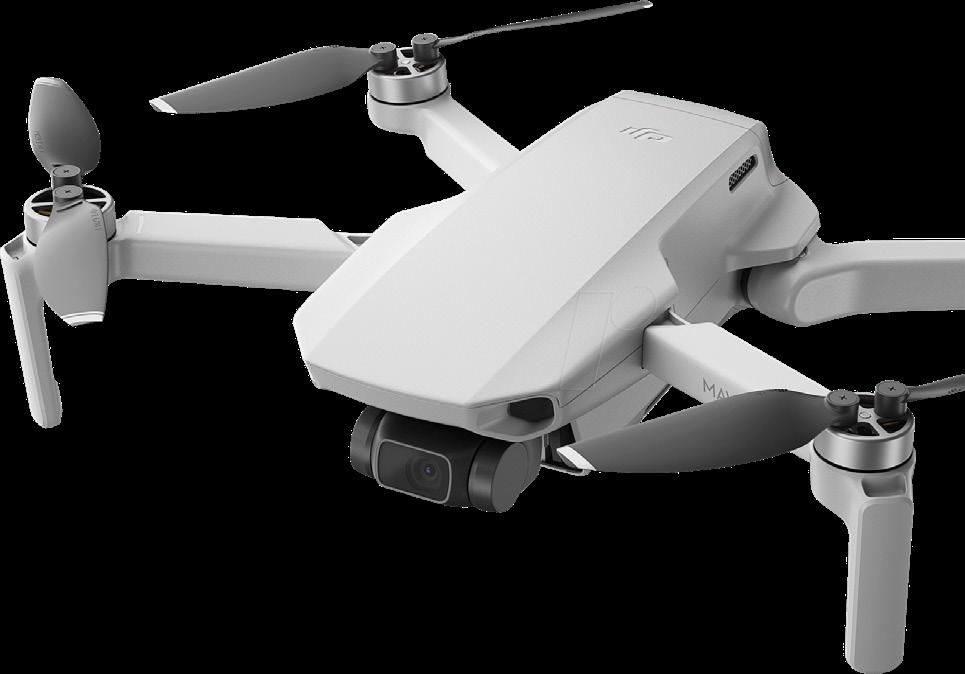
Revolutionizing Agriculture with Drone Technology
Features
Unveiling the Future: Navigating Realms with 3D Mapping Magic
Developing An Intelligent WebGis System For Sustainable Waste Management.
Revolutionizing Agriculture with Drone Technology
Charting New Dimensions: The 3D Mapping Revolution Unleashed!


EXECUTIVE EDITOR
Prof. Gordon Wayumba
HEAD OF CONTENT
William Kiarie
CONTRIBUTING EDITORS
Benard Odhiambo
Ivy Raph Kut
Kelvin Yego
Neville Okumu
The magazine and related website provide topical overviews and reports on the latest news, trends and developments in geomatics all around the world. Afrospatial orientated towards a professional and managerial readership, those leading decision making, and has a worldwide circulation.

Afrospatial is available six times per year on a subscription basis. Geospatial professionals can subscribe at any time via https://www.afrospatial.com/subs Subscriptions will be automatically renewed upon expiry, unless Afrospatial receives written notification of cancellation at least 60 days before expiry date.
Advertisements
Information about advertising and deadlines are available in the Media Kit. For more information please contact our marketing advisor: marketing@afrospatial.com
No material may be reproduced in whole or in part without written permission of Afrospatial.
Copyright © 2024,
Soaring Heights: Revolutionizing Agriculture with Drone Technology - A Comprehensive Exploration 6 14 18 24 26 26 27 30 32
Developing An Intelligent Web-Gis System For Sustainable Waste Management. 12 34 39
Gis Tactile Maps Solve Navigation Problems For The Low Visioned People And The Blind
Mapping The Depths: High-Resolution Seafloor Mapping With Sonar Technology And Lass/Sin
Starlink in Kenya
Revolutionizing Urban Air Mobility With Human-Shaped Evtol Technology
Careers Showcase Sayari Labs
Navigating Tomorrow: Augmented Realities in Web GIS

Sub Saharan Africa has an immense challenge to rapidly and cheaply map millions of unrecognized land tenure rights in the region. Land tenure recording helps to deliver tenure security, dispute reduction,investment opportunities, and good governance. Available global statistic indicate that millions of people-to-land relationships need to be identified and recorded. Existing recording and and mapping approaches have failed; and disputes abound, investment is impeded, and the community poorest lose out; therefore new documentation tools and approaches are needed to overcome the cadastral divide.
Currently, there are emerging geospatial tools such as the Unmanned Aerial Vehicles (UAVs), smart sketch masters, Automated Feature extraction geocloud services, Artificial Intelligence and Machine learning Algorithms that would greatly contribute in tenure mapping the unrecognized land rights in Africa. The launching of this magazine is a response to the above challenges and wishes to show-case current technologies and projects being undertaken in the Africa region, with a view to demonstrate to the world the available technological tools and how they are being employed in tenure mapping.
It is therefore with great pleasure and excitement that I welcome you to the inaugural issue of AfroSpatial. As the Editorial Lead, I am honured to present to you a publication that aims to explore the dynamic and ever-evolving world of geospatial technology and its profound impact on our lives. In this premier edition, we embark on a journey to unravel the innovations, trends, and transformative applications within the geospatial realm. From cutting-edge satellite technologies to the latest advancements in mapping and data analytics.This magazine is dedicated to bringing out insightful perspectives and in-depth analyses.
Geospatial technology is not merely a collection of tools; it’s a gateway to understanding our world in ways previously unimaginable. In each issue, we will delve into the stories of professionals pushing the boundaries of geospatial science, showcasing how their work influences diverse fields, from environmental conservation to urban planning. As we navigate through this rapidly evolving landscape, our commitment is to provide you with compelling content that sparks curiosity, fosters knowledge, and fosters a community passionate about the potential of geospatial technologies. I extend my gratitude to our contributors, whose expertise and dedication have shaped this magazine into a valuable resource for geospatial enthusiasts, experts, and novices alike. Together, let us embark on this journey of discovery and exploration.
Thank you for joining us in this exciting venture. Your feedback and engagement are invaluable as we strive to make each issue an enriching experience.
Professor Gordon Wayumba Chief Editor, AfroSpatial Magazine
These captivating three-dimensional landscapes can be derived from a diverse array of data sources, including satellite imagery, aerial photography, and ground-based sensors.
Within the realm of 3D mapping, the fundamental building blocks are known as 3D models. In the domain of Geographic Information Systems (GIS), a 3D model is a construct meticulously designed to depict an object in the three-dimensional coordinates of x, y, and z.
In the language of GIS, these 3D models are commonly referred to as 3D features, precisely crafted to encapsulate real-world objects within maps or scenes.
What sets these 3D features apart is their ability to incorporate elevation values (referred to as z-values) seamlessly integrated into the geometric fabric of the feature.
This sophisticated process of collecting and representing objects in this immersive dimension is what we fondly term 3D mapping.
For a substantial part of our history, the representation of three-dimensional objects was confined to the limitations of existing technologies.
Traditional printed maps, for instance, could only portray these objects in two-dimensional forms, relying on techniques like contours and hill-shading.
However, the relentless march of technological progress, especially within the realm of GIS and interactive mapping, has not only unleashed the power to represent 3D objects authentically but has also ushered in the era of interactive experiences.
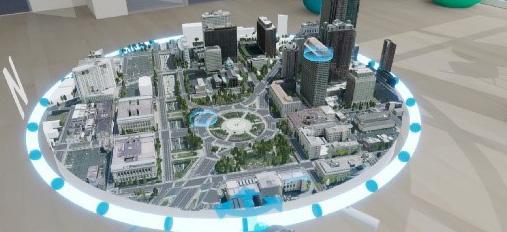
This evolution has reached remarkable heights, extending to the point where 3D maps can be viewed and explored through the immersive lenses of virtual reality (VR) headsets and interactive boxes, reshaping the way we perceive and interact with our dynamic world.
The unstoppable advancement of technology has had a significant impact on the way data is collected. New and compact devices have been developed, including LiDAR technology, geoSLAM devices, drones equipped for data acquisition, 360-degree cameras, VSLAM (Visual Simultaneous Localization and Mapping) systems, and sophisticated depth cameras.
These innovations have improved spatial understanding and added a new level of precision and depth perception to data collection.
In the dynamic world of 3D mapping, the process of capturing three-dimensional objects (real objects) can be accomplished through a diverse array of methodologies. These methodologies can be broadly classified into two overarching categories: active and passive techniques, each harnessing distinct approaches to capture the essence of our three-dimensional reality.
Active 3D Mapping:
Active methods, as the name suggests, actively engage with the environment or object being mapped by deploying a source of energy. This energy source, often in the form of laser beams or radar waves, is directed toward the subject of interest, illuminating it and facilitating the data collection process. A notable exemplar within this category is LiDAR, an acronym for Light Detection
and Ranging. LiDAR operates by emitting rapid laser pulses that bounce off objects within the environment, enabling precise measurement of the distances to these objects. This laser-based approach forms the foundation of many cuttingedge 3D mapping endeavors. (Leicas BLK, FARO, DJI Dronw with L1 Sensors, etc)
Passive 3D Mapping:
In stark contrast to active methods, passive techniques chart an alternative course by forgoing the use of an external source of energy. Instead, they rely on the natural light present in the surroundings, capturing the reflections and interactions of light with the object or environment under scrutiny. Within the realm of passive 3D mapping, we encounter two notable contenders: Photogrammetry and Structure from Motion (SfM).

Photogrammetry stands as a testament to the power of imagery. This method harnesses the potential of photographs captured from various angles to construct a comprehensive 3D model. Through the artful synthesis of these images, photogrammetry unveils the depth and intricacies of objects and landscapes, weaving them into a cohesive three-dimensional tapestry. (Drone, smartphones, and 360 cameras(insta360, GoPro, Ricoh Theta Z1 ).
Structure from Motion (SfM), on the other hand, takes a dynamic approach. By leveraging the motion of a camera, SfM orchestrates the creation of 3D models that encapsulate the essence of an object or environment. As the camera moves, it captures multiple perspectives, and sophisticated algorithms meticulously stitch these perspectives together, bringing forth a vivid and detailed 3D representation.
In the realm of 3D mapping, the choice between active and passive methods is often guided by the specific requirements of a given project, the available technology, and the desired level of precision. By exploring the intricacies of these diverse techniques, we unravel the fascinating world of 3D mapping and its profound impact on our understanding of the three-dimensional realm that surrounds us.
3D mapping technology boasts a diverse range of applications, spanning across various domains, including:
Navigation: In the realm of navigation, 3D maps come to the rescue when traversing unfamiliar terrain, whether it’s navigating a challenging hiking trail or maneuvering through the labyrinthine streets of a new city. These three-dimensional guides provide a heightened sense of spatial awareness, ensuring a smoother and more informed journey.
Planning : The utility of 3D maps extends to the realm of urban planning and construction projects. They serve as invaluable tools for architects, urban developers, and city planners, offering a dynamic platform to visualize and strategize complex building projects, urban expansion initiatives, and other endeavors that shape our physical environment.
Disaster Response : When disaster strikes, 3D maps play a crucial role in assessing the aftermath. Whether it’s the devastation left in the wake of a hurricane, earthquake, or other catastrophic events, these maps provide emergency responders and relief agencies with a comprehensive view of the impacted areas, facilitating swift and effective response efforts.
Virtual Reality : The fusion of 3D mapping technology with virtual reality has unlocked a realm of immersive experiences. By employing 3D maps, developers can recreate real-world environments within virtual reality settings, offering users the opportunity to explore and interact with these digitally reconstructed spaces. This convergence has paved the way for captivating and educational virtual reality experiences.
Entertainment : The allure of 3D maps extends to the realm of entertainment, where they serve as the foundational canvas for interactive games and various forms of digital amusement. The dynamic and visually engaging nature of these maps enhances the user experience, fostering engaging gameplay and captivating entertainment ventures.
In addition to the diverse range of applications highlighted above, it’s worth noting that 3D mapping technology, especially in the context of indoor environments, has seen remarkable advancements. Prominent pioneers like Matterport, for instance, have carved out a significant niche in the realm of indoor 3D mapping. Matterport’s innovative services have rapidly expanded across a spectrum of domains, augmenting its applicability in various areas:
Indoor Navigation : Matterport’s 3D mapping solutions are invaluable when it comes to navigating complex indoor spaces. Whether you’re exploring a sprawling shopping mall, a museum, or a multi-story office building, these 3D maps provide an intuitive and immersive means of finding your way, enhancing indoor navigation experiences.
Interior Planning: In the domain of interior design and space planning, Matterport’s technology has proven indispensable. It empowers designers, architects, and real estate professionals to envision and strategize interior layouts with remarkable precision, aiding in the efficient allocation of space and resources.
Property Management: Property management, especially in the residential and commercial sectors, benefits immensely from Matterport’s 3D mapping prowess. It facilitates virtual property tours, enabling potential buyers or tenants to explore spaces remotely, revolutionizing the real estate industry.
Training and Education: Matterport’s 3D mapping solutions have found applications in training and education. They enable educators to create
immersive, virtual environments for learners to explore, enhancing engagement and knowledge retention.
Retail and Hospitality: In the world of retail and hospitality, Matterport’s technology plays a pivotal role. It allows businesses to showcase their spaces to potential customers, providing an engaging preview of stores, hotels, and venues.
Documentation and Record-Keeping: Matterport’s 3D mapping services are instrumental in documenting and preserving spaces over time. This capability is invaluable in sectors such as historic preservation, facility management, and more.
In essence, 3D mapping technology transcends conventional boundaries, leaving an indelible mark on a wide spectrum of industries and applications. Its capacity to imbue depth and dimension into our understanding of the world around us has ushered in a new era of innovation and exploration, redefining the way we navigate, plan, respond to disasters, embark on virtual adventures, and find enjoyment in the realm of entertainment.
(source)[odhiambo et al. 2022]
In the realm of 3D mapping, innovation knows no bounds. Authors in this field have been diligently working on projects that exemplify the potential of this cutting-edge technology. Here, we shed light on a couple of noteworthy ventures undertaken by these pioneers:
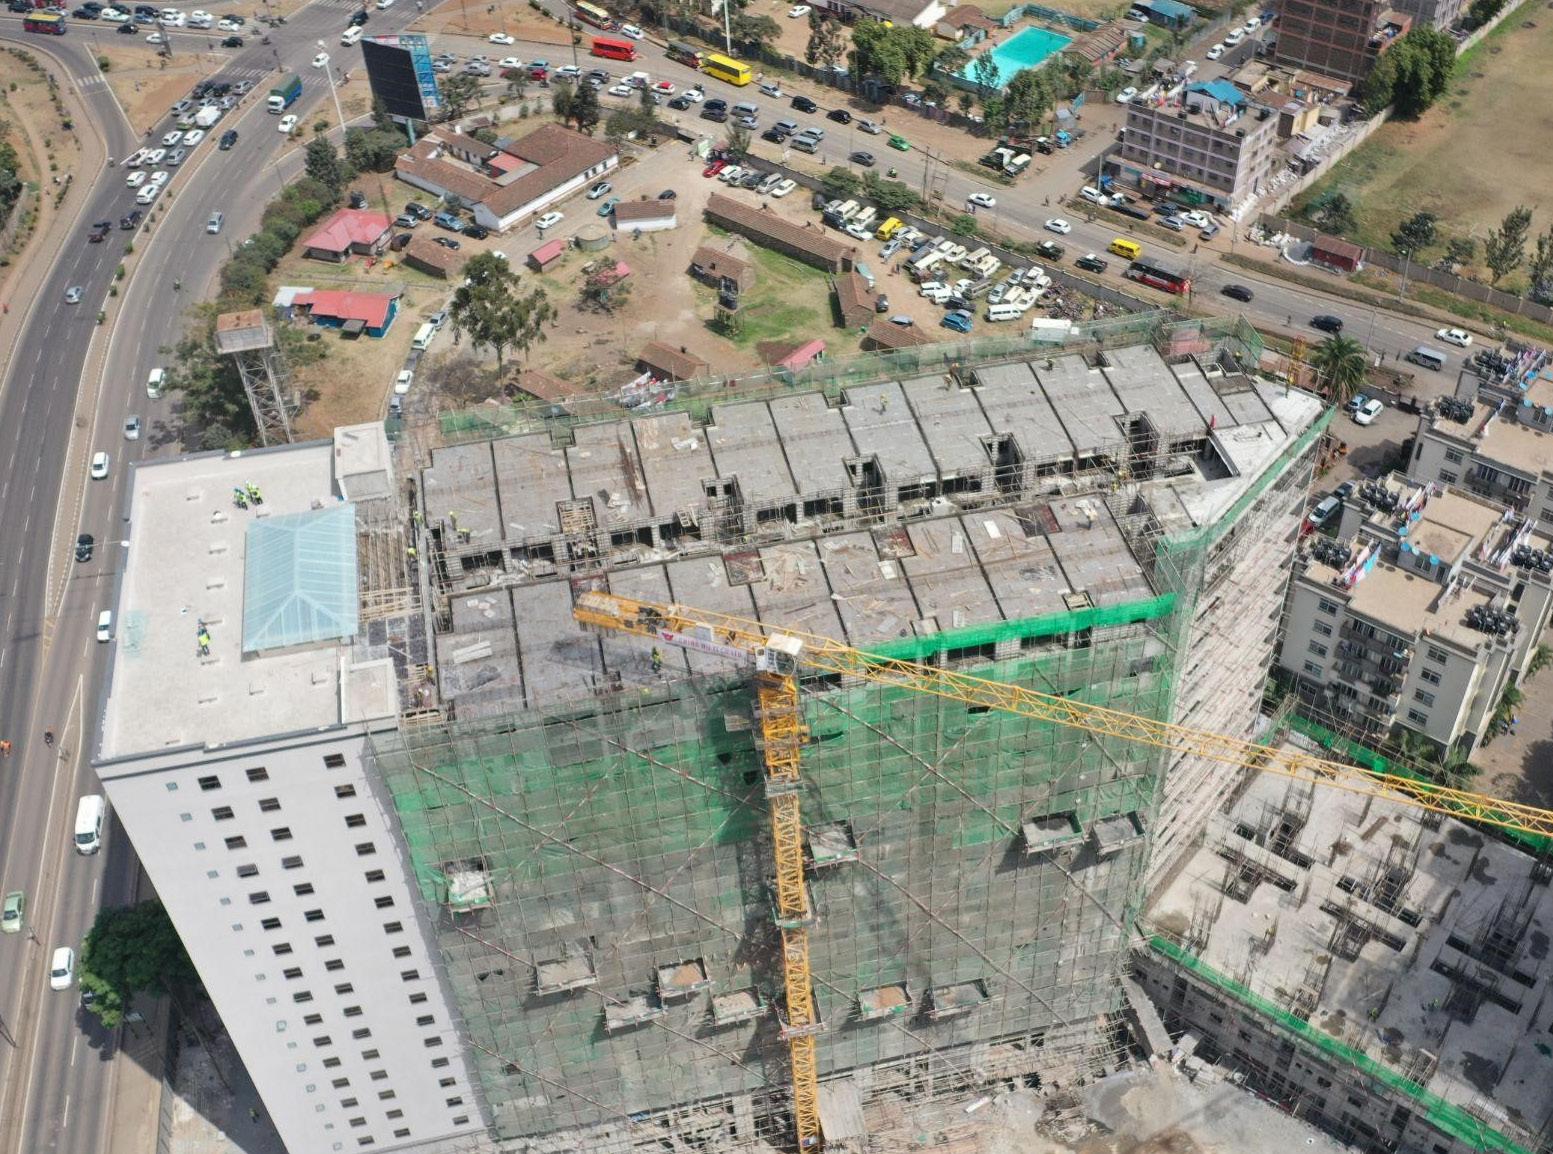
3D Mapping of Pangani Affordable Housing for Sectional Property Registration Tools Utilized: LiDAR : Leica BLK360 Gen 1, Drone : DJI Mavic 2 Pro Total Station : Leica GNSS : Comnav
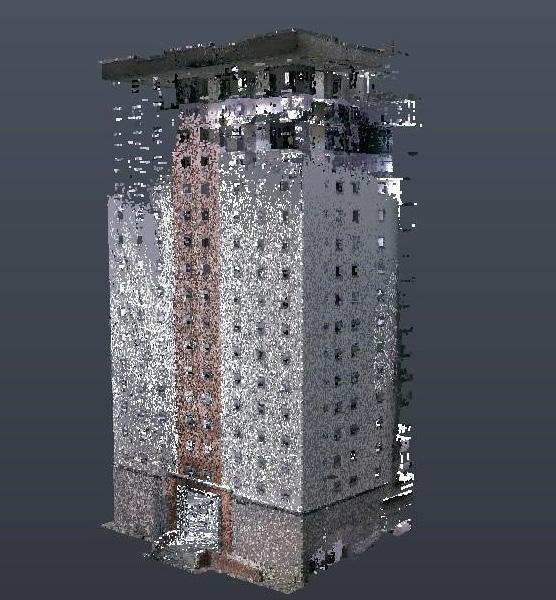
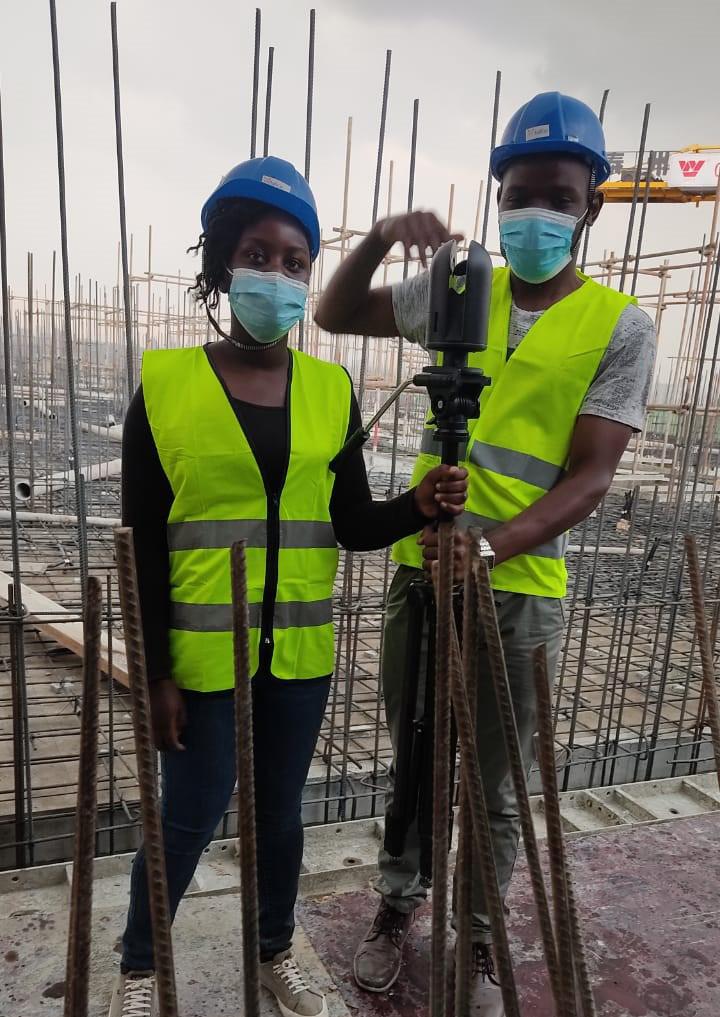
The project’s outcomes have been nothing short of remarkable. Equipped with LiDAR technology, the team harnessed the Leica BLK360 Gen 1 to accurately capture the nuances of the Pangani Affordable Housing complex.
Aerial insights were gathered using the agile DJI Mavic 2 Pro drone, while ground-level data was measured with the Leica Total Station to provide control for drone and lidar data. GNSS technology from Comnav ensured precise control densification within a short time.
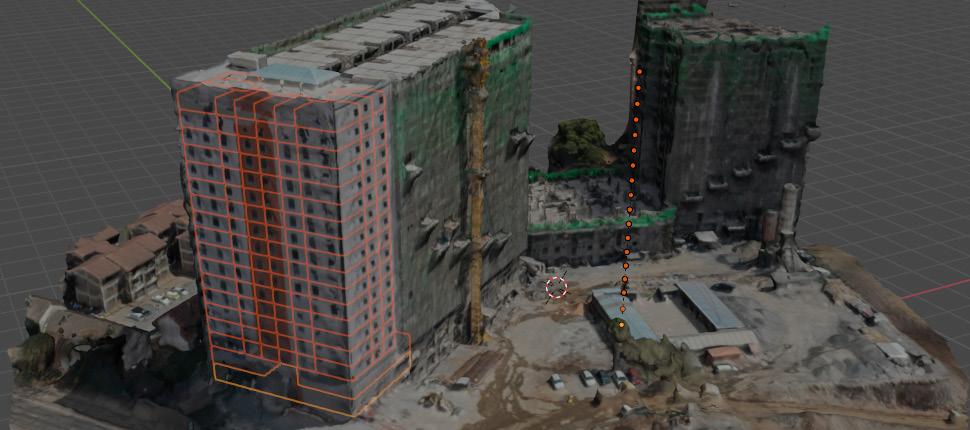
The result? A detailed 3D map that serves as a cornerstone for sectional property registration, offering an accurate and immersive representation of the Pangani Housing complex.
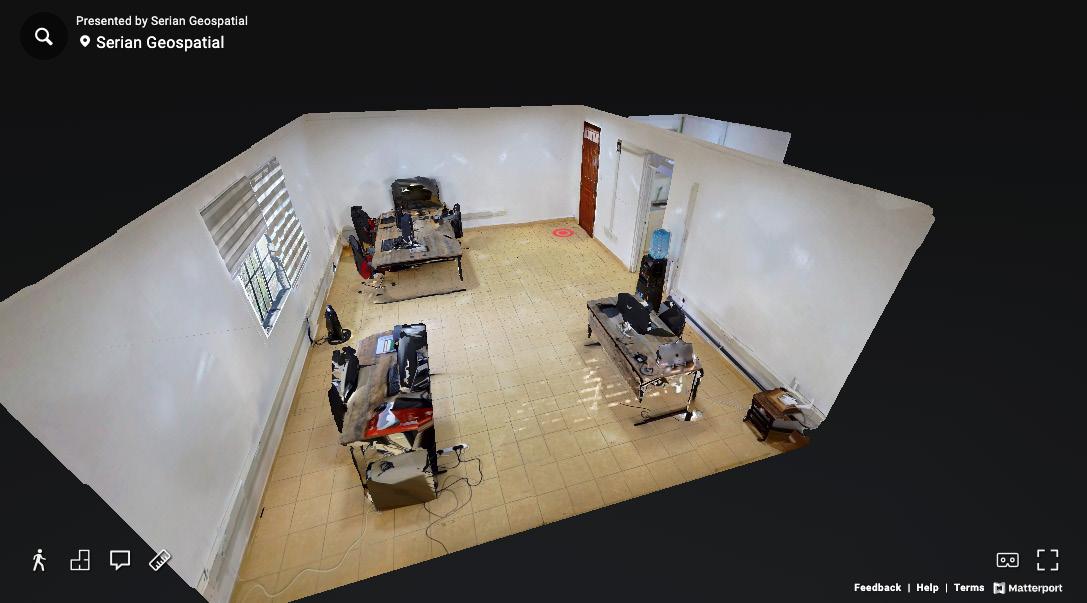
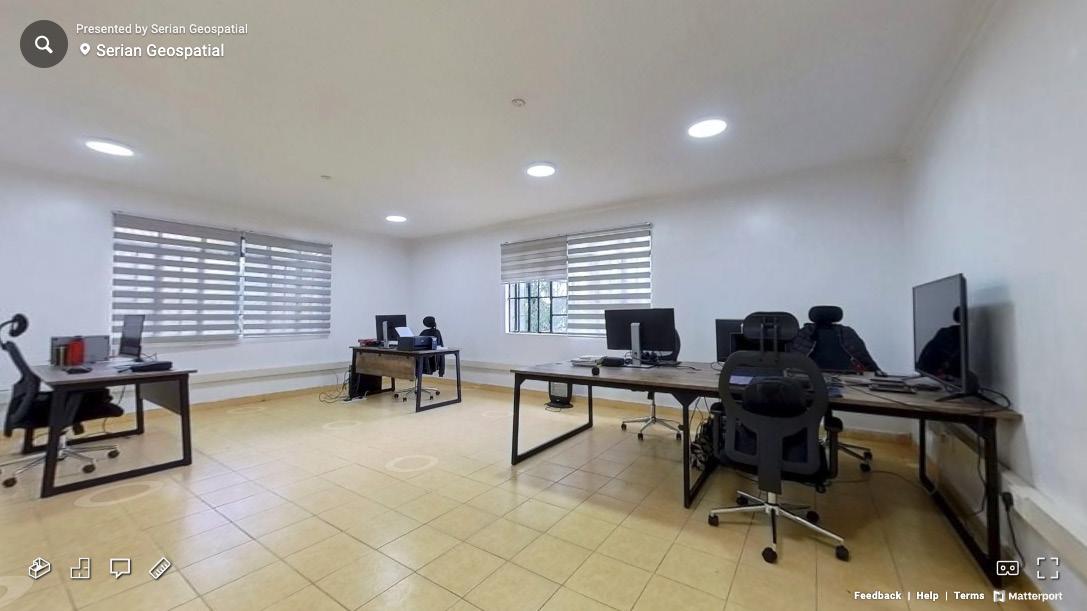
Crafting a 3D Map for an Immersive VR Tour of the Serian Geospatial Office Tools Utilized: Camera: Insta360 One RS 1-Inch 360 Edition , Software: Matterport Mobile
(source)[odhiambo et al. 2022]
The Serian Geospatial Office created a virtual reality experience to allow visitors to explore their workspace. To accomplish this, they turned to the powerful Insta360 One RS 1-Inch 360 Edition camera, which effortlessly captured the office’s every nook and cranny.
The Matterport Mobile software seamlessly transformed these captures into a captivating 3D map. Now, anyone can embark on a virtual tour of the Serian Geospatial Office, delving into the heart of their workspace from the comfort of their own screens.
In these sample projects, the authors have exemplified the versatility and transformative potential of 3D mapping technology. From property registration to immersive office tours, 3D mapping is redefining the way we engage with our surroundings, promising a future where exploration knows no bounds.
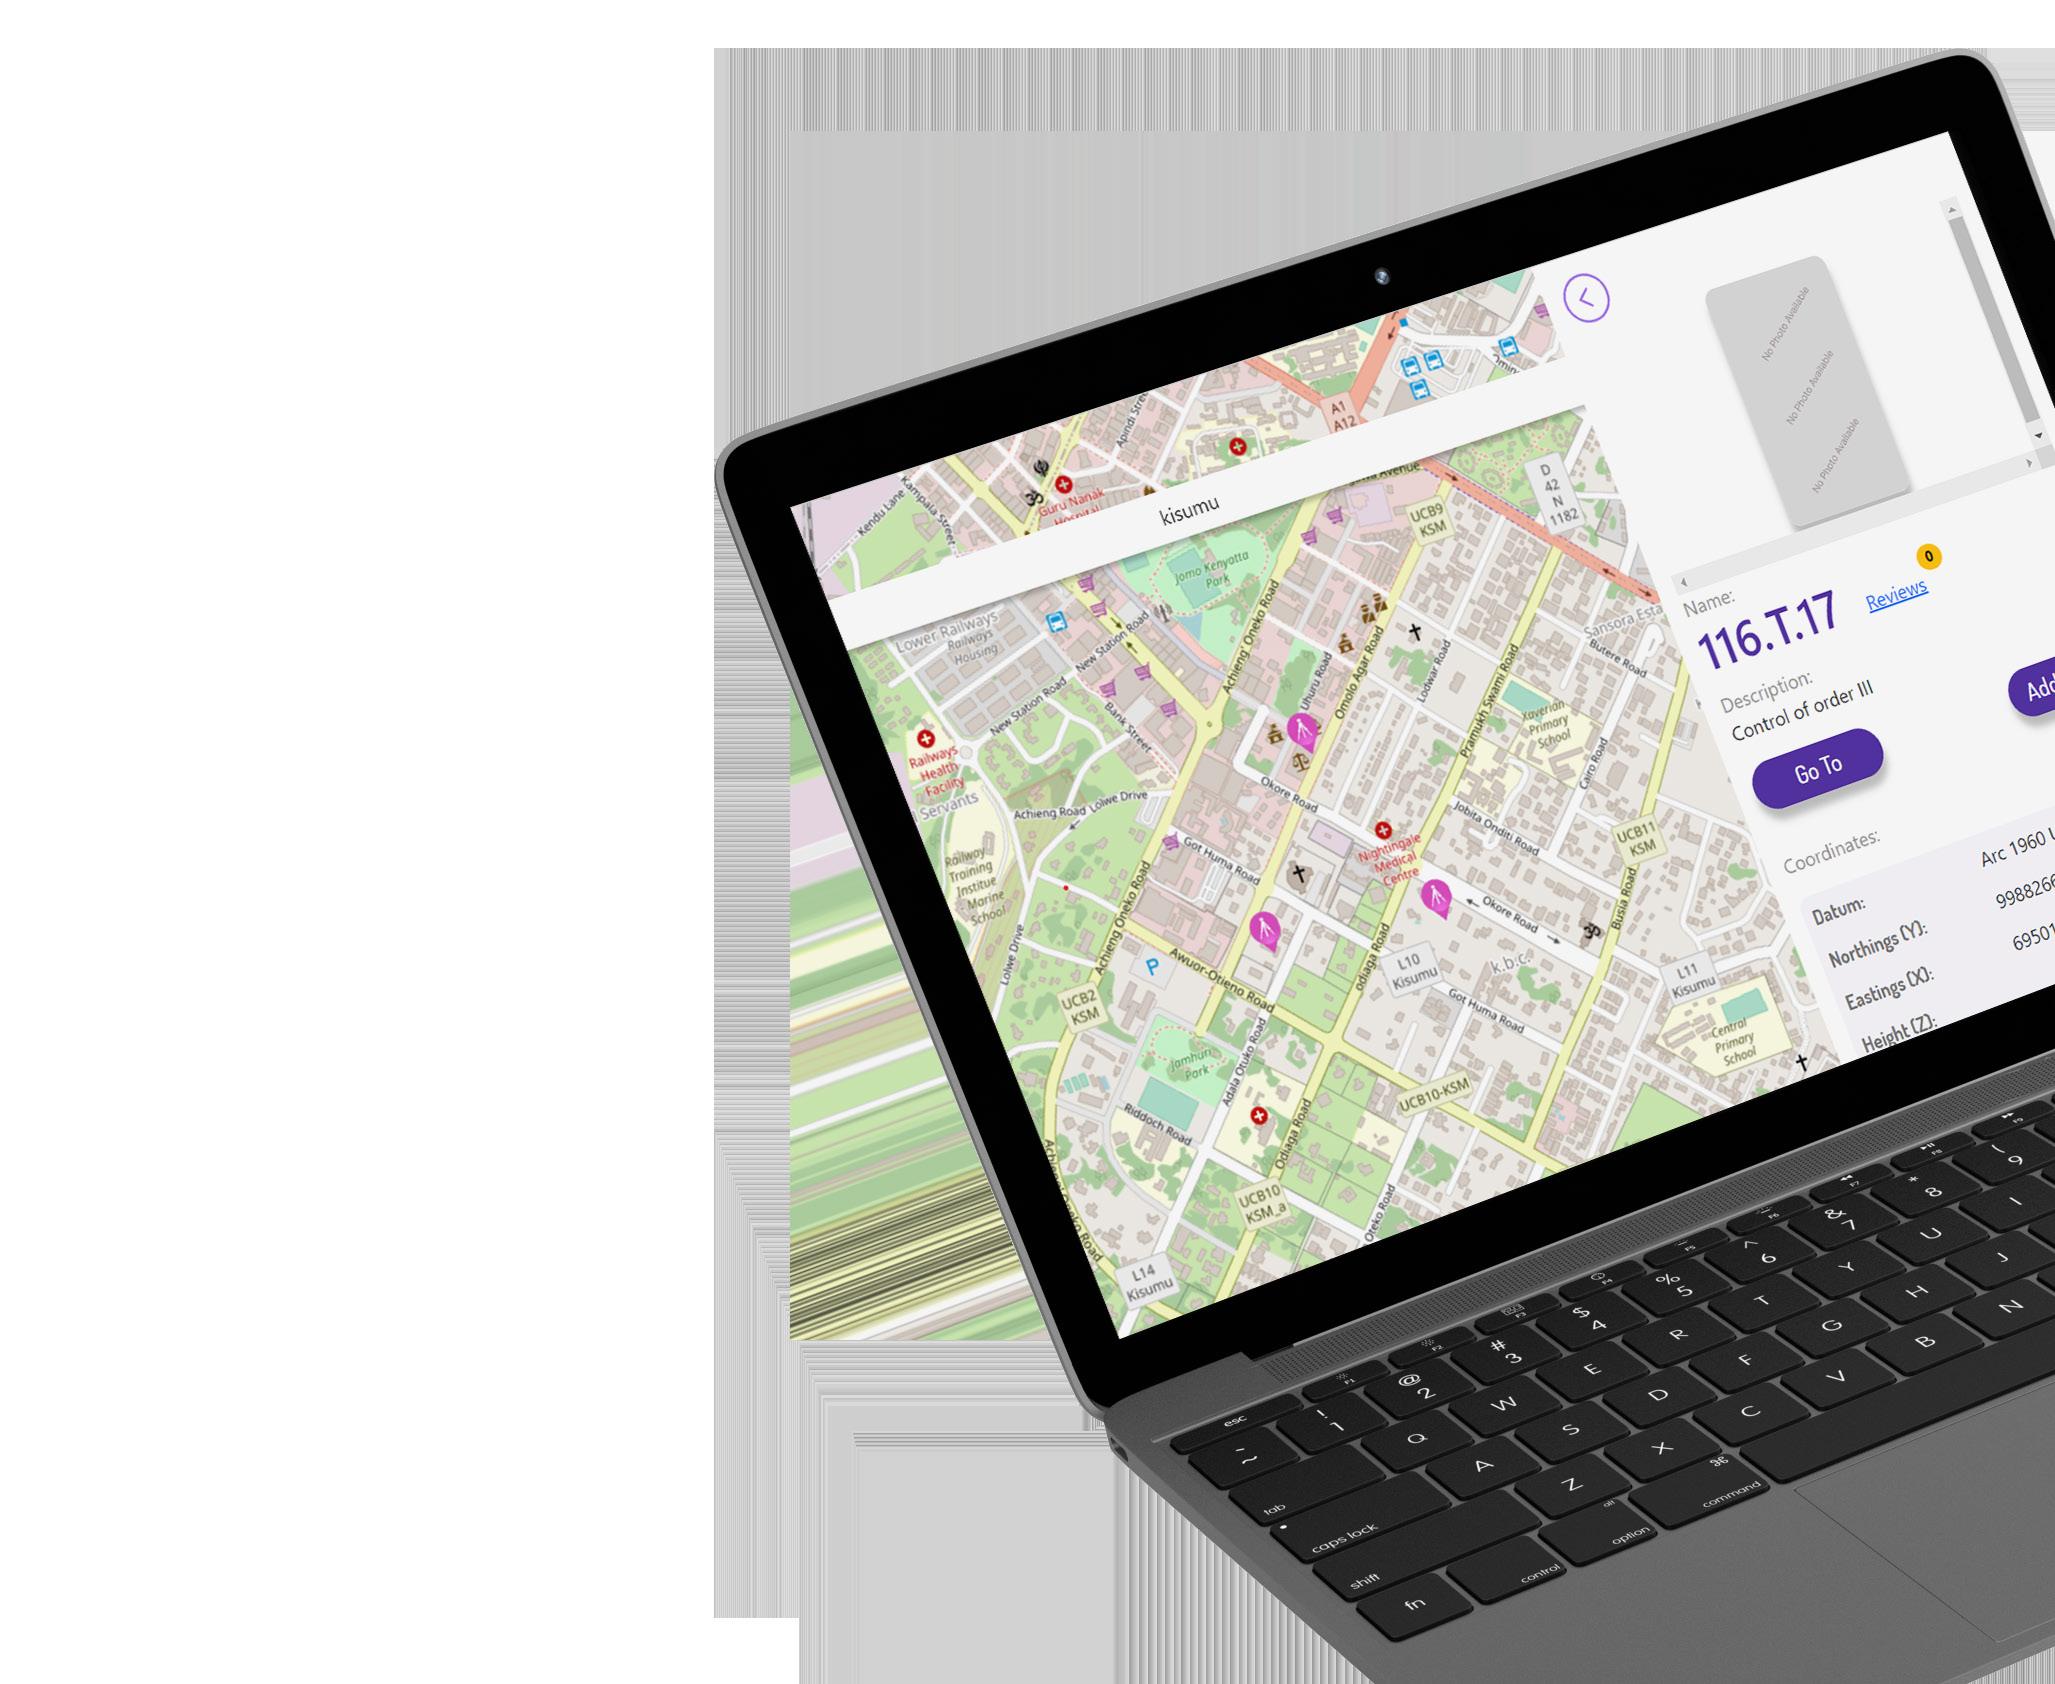
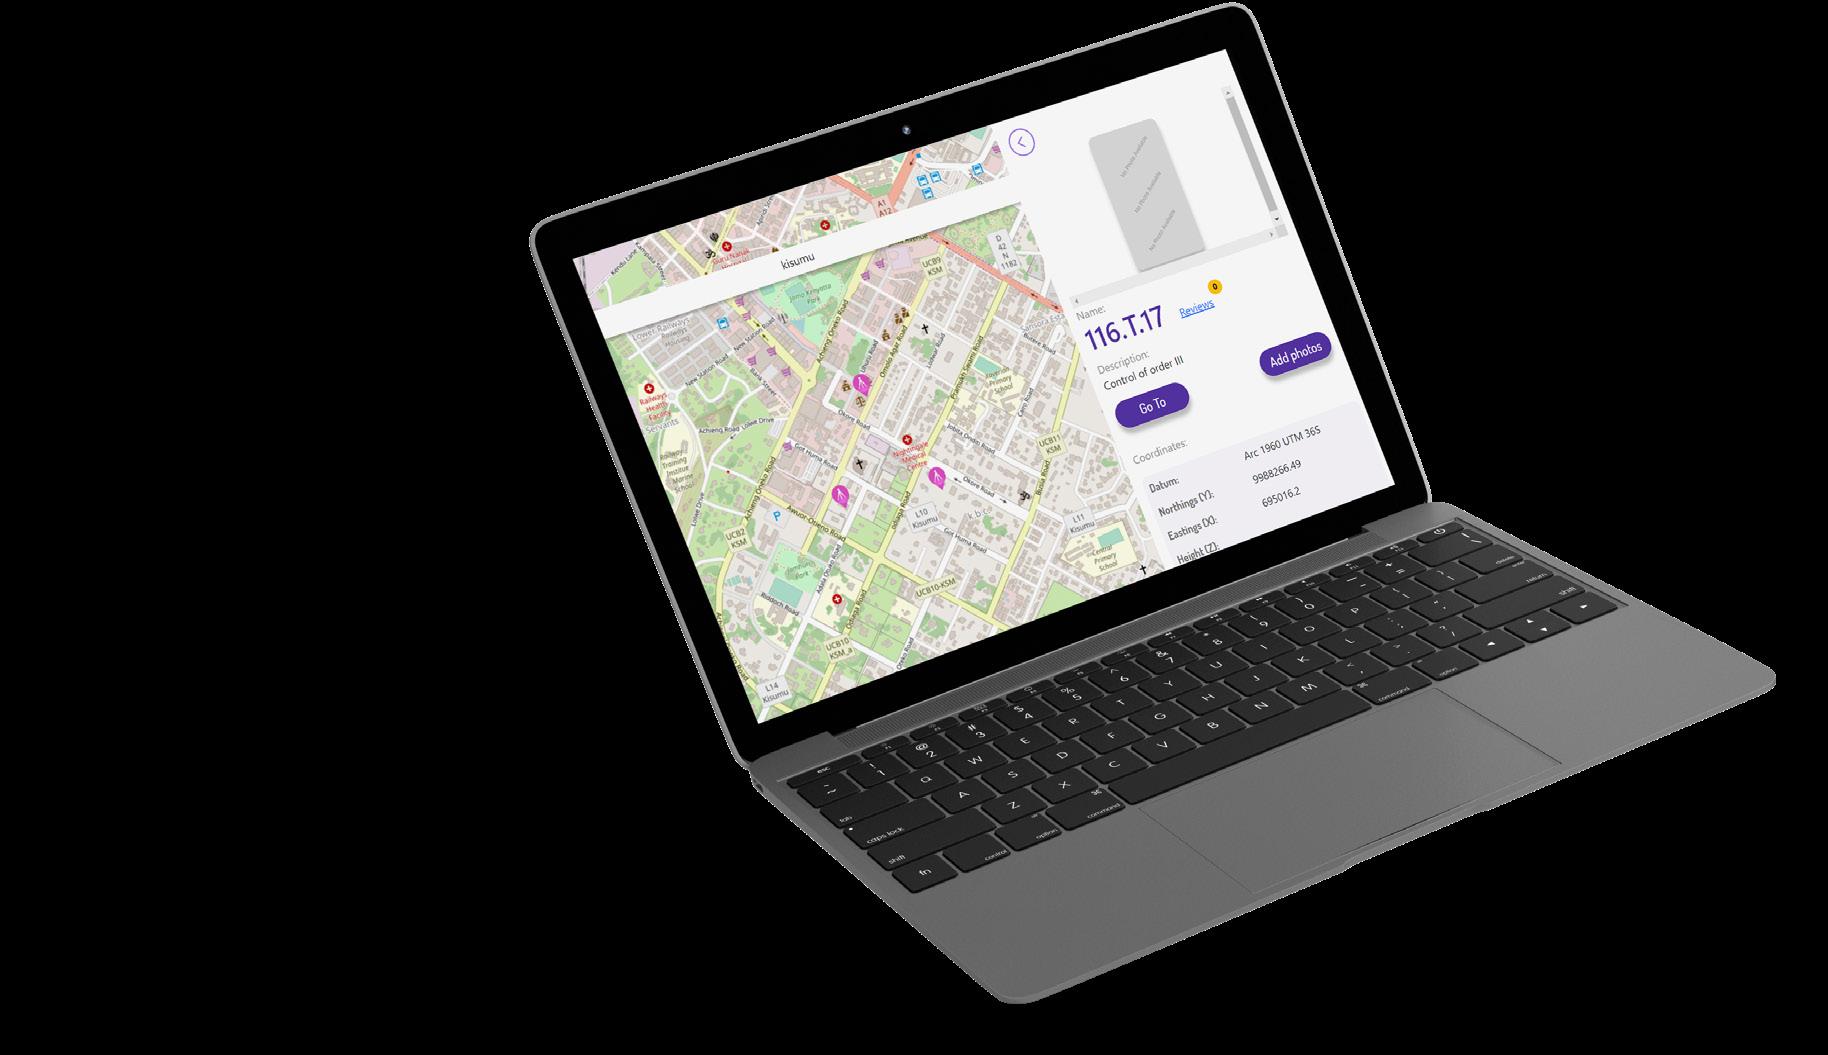
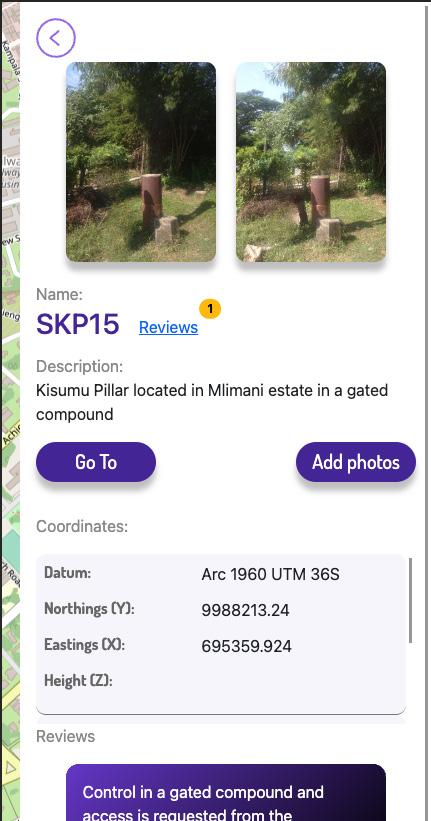
The application is a web-based platform that allows surveyors to crowdsource information about the condition of geodetic network controls in Kenya. The application was developed in response to increasing difficulties experienced by surveyors in identifying viable geodetic control points when undertaking survey work. This has led to increased costs and longer survey times.
The application’s distinguishing feature is its ability to facilitate frequent updates on control conditions. This was a major feature request from surveyors, who wanted to be able to quickly and easily share information about the condition of control points with other surveyors. The application also allows surveyors to report damage to control points, which helps to ensure that the network is maintained in a safe and accurate condition.
Objectives:
• To provide timely access to viable geodetic control.
• To reduce reliance on multiple chat groups.
• To provide a reliable storage space for geodetic control.
• Features:
• The system provides the following features for its users:
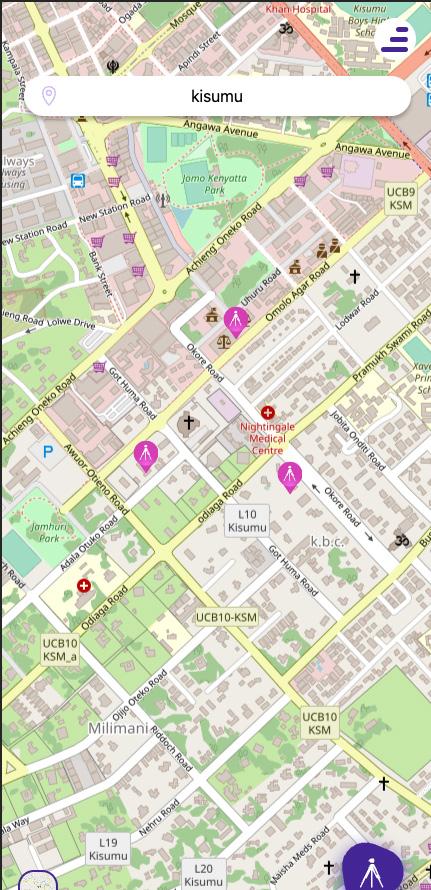
• View geodetic controls on maps
• Search for place names and navigate to them
• View detailed information on each geodetic control, including images
• Get Google navigation information for geodetic controls
• Log in and log out
• Add control points
• Add images to controls
GeometerAF is owned and maintained by surveyors, which has helped to ensure its adoption and success. Surveyors are more likely to use an application that they feel is owned and controlled by their peers. The application is also open source, which allows surveyors to modify and improve it to meet their specific needs.
The application has been a success in Kenya. It has helped to reduce the cost and time of surveying projects, and it has improved the accuracy and safety of the geodetic network. The application can also be adopted in other countries, hence, helping to improve the quality of surveying work worldwide.
• Provide reviews or comments on geodetic controls
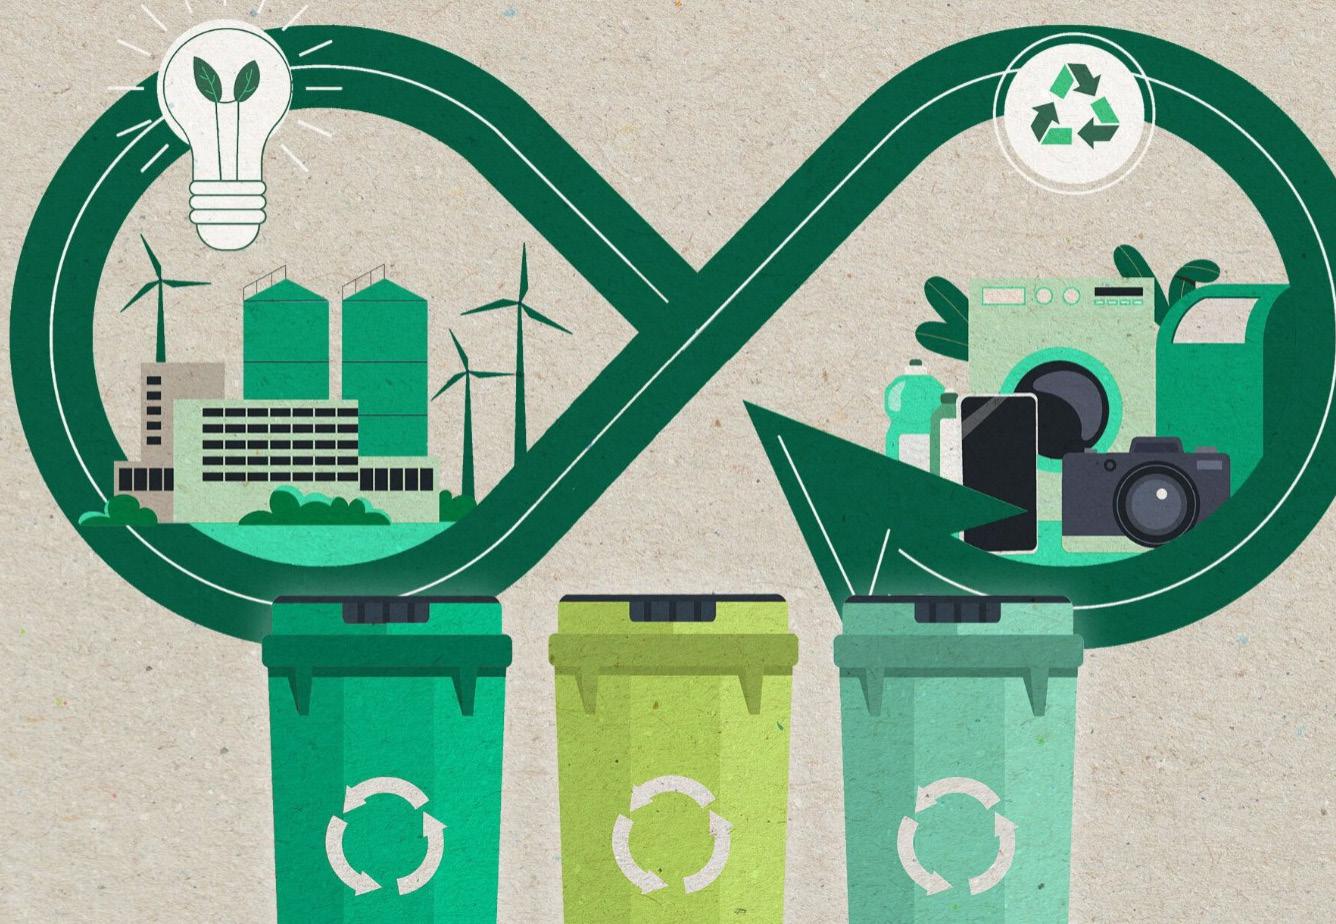
Sustainable waste management is one of the main aspects of a green economy. A green economy is aimed at reducing environmental risks and ecological scarcities.
However, production of solid waste in Kenya is increasing by the day with the rapid population growth due to the expansion of the industrial (service and manufacturing) sector especially in urban areas. This is especially the case in Nairobi County where about 2475 tons of solid waste is produced per day.
Waste management is therefore a big challenge. It is hence vital that especially Nairobi has an effective solid waste management system that can be echoed by other public and private organizations.
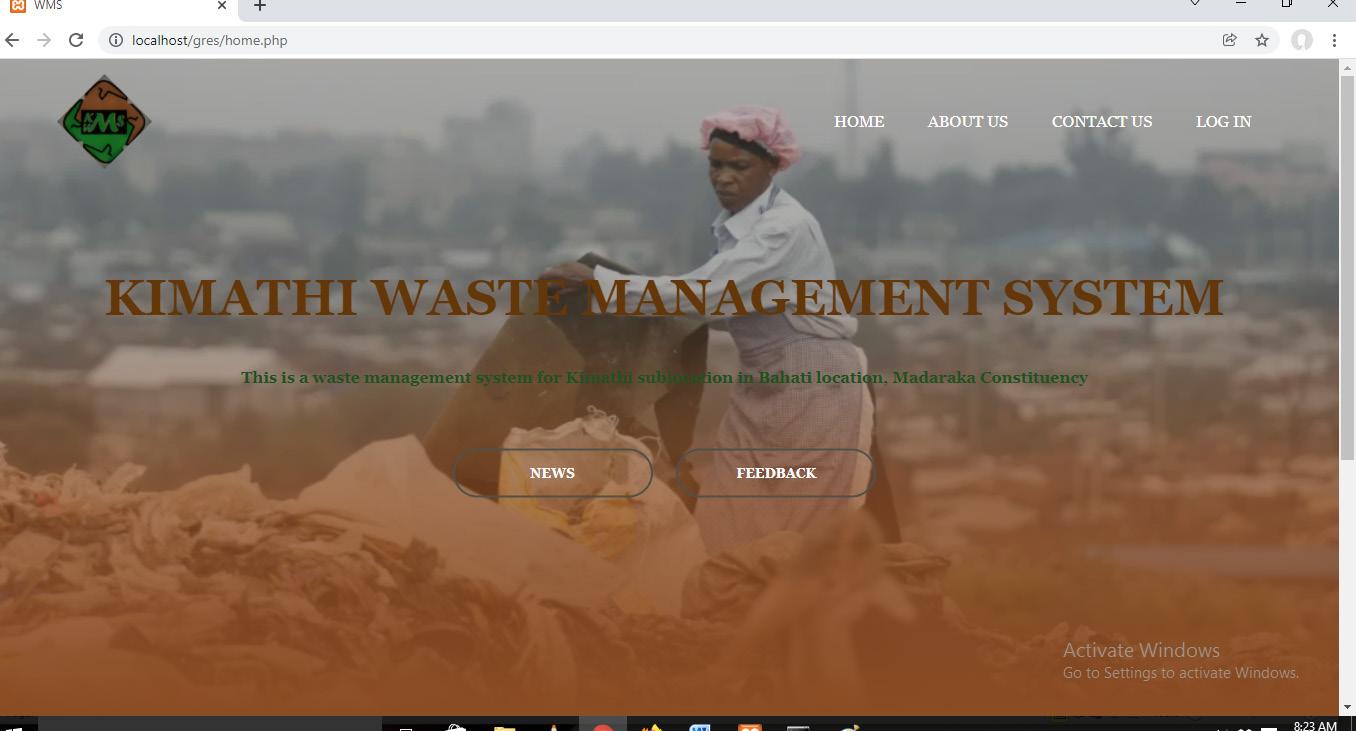
The goal of this research is using GIS and ICT knowledge in designing, developing and implementing an intelligent and interactive webbased system that would aid in dynamic waste management for Kimathi sub location. This is through depicting its current situation by mapping the existing waste collection, sorting, and dumping locations in the area; identification of optimal locations for collection points in the sub location; implementation of a routing system for the waste management and integrating these different modules into an interactive dashboard for easy access, communication and interaction.
Assessment of the current waste management system especially collection and disposal of waste in the area was done. These findings mainly acquired through GIS technology were manipulated and analyzed through the same and was coupled with web technology to
enable increased performance of the system, cost reduction and involvement of citizens in waste management. Digital technology has also been brought to play in connecting different components of the system into one interactive dashboard.
A suitability map produced in this research is key since it can enable planners and policy makers to determine the fitness of the position of a collection point/ bin in the area. Depicted from the results is a case where most of the sub location is not suitable to set up waste collection points, further pointing out the need of such analysis/ findings to help minimize or completely eradicate the emergent dump spots currently the sore of the area.
This research has presented suitable sites for waste collection with specifications that enable optimum waste collection. These sites would be 30 meters away from the riparian land (which is in accordance to the Kenyan laws (Environmental Management and Coordination Act 2015) that define riparian land as being a minimum of 6 meters and up to a maximum of 30 meters on either side of a river bank from the highest watermark.), close proximity to roads and road intersections and 10-meter buffer from residential/ built-up regions.
Empowering Communities: A Holistic Approach to Waste Management Along Nairobi River - From Riparian Lands to Web-Based Solutions
Protection of Riparian lands compound to high water quality, which is a current problem for the Nairobi River passing through the area. Having collection points/ bins near the roads and road intersections would successively lead to saving of fuel costs used by garbage trucks since time used for collection would be minimized.
With a cooperative community, residential associations would come in handy, and subsidized prices for the waste collection could be agreed on.
Properly understanding and assessing a situation is fundamental in giving a proper solution. In this study, the area is visualized in the web application presenting the condition of waste dumping in the area.
Overlain with a raster layer(suitability map) that is spatially aligned (co-registered), covering identical areas with the vector ones while maintaining equal resolution is an added asset for the system. Combination of this information, therefore, can aid in locating the appropriate waste collection points and procedures in the sub location.
A routing system found in the application would also enable saving of fuel costs used by garbage trucks since time used for collection would be minimized. This is because it not only suggests the shortest but also the best routes for navigation.
An integral part of the application is on the interaction of different users to show accountability on collection, transportation, recycling and dumping of waste. This is due to the fact that it proposes incorporation of municipal administrators, transporters/ collectors, recyclers, residents and the landfill management in the entire process, actively.
By each of these members giving a feedback/ report, the whole process can be controlled, efficient and effective. A manual method of recording has been in use where information on the waste collection is recorded in a book.
This research aims to improve on the efficiency of the system since the information entered would be on a real-time basis. This also would lead to reduction of paper-work which would minimize its unnecessary use and waste and in the long run would save our forests; additional costs including financial storage, time and energy costs will also be reduced.
 By Kelvin Yego
According to United Nations (UN) projection, the world’s population is expected to surpass 9.7 billion by 2050, increasing the number mouths to feed by 2.7billion. This increase according to FAO, needs to be met through a 70% rise in agricultural production (FAO, 2009) The scenario thus raises the query as to how the growing demand for food is going to be met with a constant decrease in arable land.
Embracing technological advancements; Internet of things (IoT), Smart Farming (the act of using modern information and communication technologies to increase the quality of produce while optimizing human labour required) and Drones/ Unmanned Aerial Vehicles (UAVs) offer a reprieve. IoT and UAVs augment each other to facilitate seamless smart farming practices.
At its core (smart farming) is crop health management and monitoring- the process of periodically and systematically observing, accessing and collecting data about crops throughout their
growth cycle with aim of making informed decisions regarding crop management practices, optimizing resource allocation and maximizing yields. It is at this stage that the farmer either makes it or breaks it and yields are directly dependent on the actions taken here.
Today, drones are used in almost all industries with agriculture being a major benefactor. Nearly all phases of farming from pre-planting to postharvest in the agriculture value chain use drones directly or indirectly.
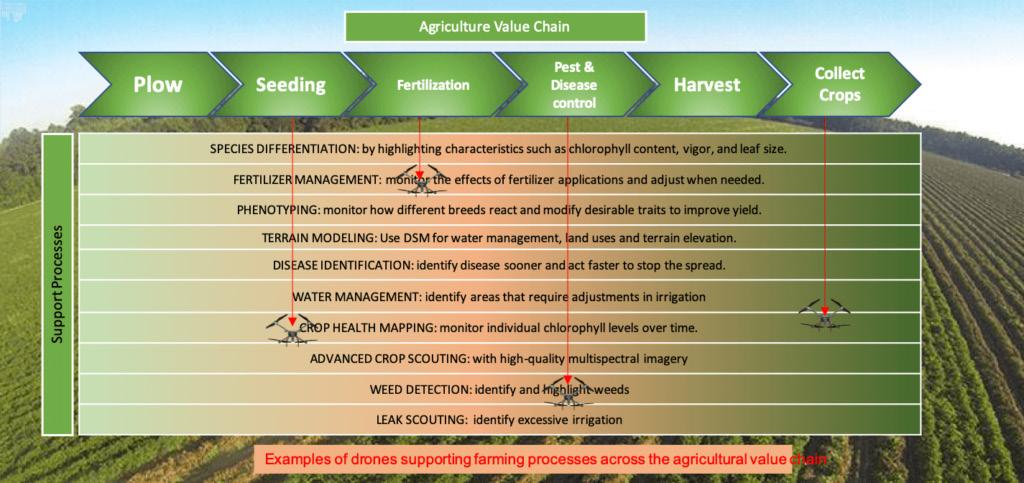
Some of the tasks done by drone include but are not limited to;
Survey and mapping
Aerial surveying facilitates rapid land survey determine the actual acreages of the parcels to be planted for planning.
Topographical mapping
High resolution imagery captured by drones creates accurate topographical maps and Digital Elevation Models (DEMs) vital for levelling and drainage planning ensuring water is evenly distributed across the fields averting waterlogging.
Drones with electromagnetic induction and multi-spectral payloads can access the soil providing detailed information about the soil quality, moisture levels, pH, and nutrients content enabling farmers make informed decision about soil amendments and type of fertilizer to use.
Land-use optimization
Aerial Imagery is a planning tool that enables the farmer to optimize land use by identifying areas with potential yield limitations and make adjustments in a way that utilizes available space.
management
Fertilizer & Pesticide application spray drones offer precise application of fertilizer and pesticides based on real-time needs reducing wastage compared
to other techniques such as aircrafts and tractors.
Pest and Disease detection
Drones with multispectral and hyperspectral sensor cameras can identify pest infestations and disease early enabling targeted treatment.
Crop scouting using remote sensing techniques, multispectral payloads can be used to locate mature crops and guide autonomous harvesters to the right areas.
By analysing plants health and density drones provide crop yields estimates and produce yields maps depicting spatial variations in expected yield across the field assisting the farmer to optimize logistics and timing of harvesting operations.
Drones equipped with thermal mappers are used to inspect storage facilities to check for temperature and humidity level thus preventing spoilage.
With the cost of fuel rising and climate changing at an alarming rate, the need for green energy has never been at its peak, transportation drones can assist farmers in transporting produce to processing centers reducing the carbon footprint of diesel-powered machines.
Monitoring through IoT, Sensors, and UAV Technology
Crop health monitoring used to be done manually before the introduction of satellites, remote sensing, IoT, and UAVs, by visiting farms and collecting physical samples. Satellites ushered in a paradigm change away from physical means and toward the use of Remote Sensing Techniques, allowing enormous areas to be examined at once.
This, however, has its own restrictions. For example, the high cost of imagery gathering hampered many farmers, low resolution photography limited the amount of analysis that could be done, and its vulnerability to weather fluctuations meant that the data acquired fell short of the optimal level required for crop health monitoring.
With the development of the Internet of Things (IoT), sensor actuation platforms, and unmanned aerial vehicles (UAVs), a platform that might be used to overcome the limitations of satellites was offered. There are now multispectral sensors available. They were installed on satellites that scan the planet perpendicular to their orbital path, collecting light energy at various wavelengths that are both visible and invisible to the human eye.

Multi-spectral and Hyper-spectral sensors payloads captures high resolution imagery carrying information in the range of infrared and visible light (RGB) part of electromagnetic spectrum.
These images can be analyzed using vegetation indices to give insights about the crop’s health. The indices are used at different stages of crop phenology giving different results. NDVI - Normalize Difference Vegetation Index, GNDVI- Green Normalized Vegetation Index and NDWI- Normalized Difference Water Index.
GNDVI
GNDVI is a vegetation index for estimating photosynthetic activity. It uses the Near Infrared and Green band of the electromagnetic spectrum which is more sensitive to chlorophyll variation thus majorly used to determine water and nitrogen uptake into the plant canopy. Predominantly applied in the intermediate and final stages of the crop cycle.
GNDVI= [NIR-GREEN]/[NIR+GREEN].
The values range from [-1 to 1] with [-1 to 0]indicates presence of water of bare soil.
NDWI is a vegetation index used to monitor the water status of the crop. It identifies moisture deficit and saturation in the crop. It Utilizes Green & NIR bands and is mostly used in conjunction with NDVI change products to access the content of apparent change areas.
NDWI=[NIR-WIR]/[NIR+SWIR].
The values range from [-1 to 1] with high values representing high plant water content and coverage while low values representing low vegetation water content and sparse coverage.
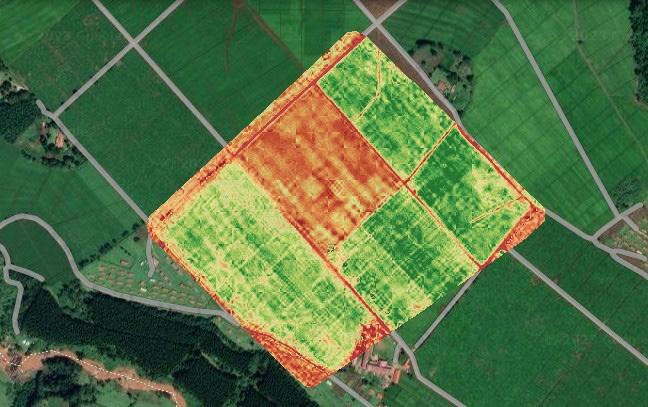
NDVI is metric for quantifying health and vigor of vegetation. It’s based on the principle that a healthy
crop has high chlorophyll content (green coloring matter) and would thus absorb the blue and red light while reflecting green, thence appearing green when viewed by naked eye. It has 3 variants namely; NDRE, MSAVI2 and VISIBLE.
NDVI = (NIR-RED)/(NIR+RED).
NDVI Values:
Negative Values- [ -1 to 1] this indicates nonvegetated/ barren surface I.e., water bodies, bare soil or urban areas. It normally appears blue or black on the color map.
Low Values - [0 to 0.2] indicates sparse, stressed or unhealthy vegetation, this could be due to water stress, minerals insufficiency or pest infestation. It normally appears red on the color map.
Modern values- [0.2 to 0.5] indicates healthy vegetation at not at its peak, usually brownish/ greenish in color.
High values- [0.5 to 1] indicates healthy and vigorous vegetation likely to have sufficient nutrients and moisture. It is usually green on the color map.
With the map, farmers and agronomists can perform ground truthing by visiting the farms to validate the interpretations and make necessary changes for optimal yields.
It’s similar to NDVI but used to detect variations in crop health at an advanced stage. It uses red-edge light that penetrates leaves much deeper than the red light in NDVI making it suitable for generating nitrogen fertilizer maps.
NDRE= [NIR-RED EDGE] / [NIR + RED EDGE].
MSAVI2
Modified Soil Adjusted Vegetation Index.
It’s used in areas where NDVI and NDRE provide inconclusive or incomplete data mainly due to lack of vegetation or chlorophyll. Its ability to minimize the influence of bares soil makes it ideal for crop monitoring in its early stages like germination rate and crop emergence.
MSAVI2= [2*NIR+ 1-1 √(2*NIR+1) ^2 - 8*(NIR-RED) ^2] /2.
As I conclude, a revolution dubbed the “Fourth Agricultural Revolution” has been born from the union of technology and agriculture and is expected to revolutionize our farming methods. With a bird’s eye view that enables farmers to make knowledgeable decisions about their farms, drones have come to be recognized as the quiet sentinels of our fields.
Drones provide a potent instrument to solve the issues of food security and environmental conservation as we traverse the constantly changing landscape of sustainable and effective farming. These drones examine our fields and plant the seeds for a more sustainable agricultural future with each flight.
The sky is not the limit, but rather a launchpad for creativity, therefore as we say goodbye to this piece, let’s keep that in mind. Accept the drone revolution, and observe your fields prosper unlike anything you’ve ever seen. The farming of the future is hovering above us, ready to take your farming operations to new heights.
Dive into the world of geospatial intrigue with our mind-bending Word Search Puzzle! Can you unravel the secrets hidden within the grid? Challenge your spatial wit and tease your brain in a playful pursuit of geospatial discovery!
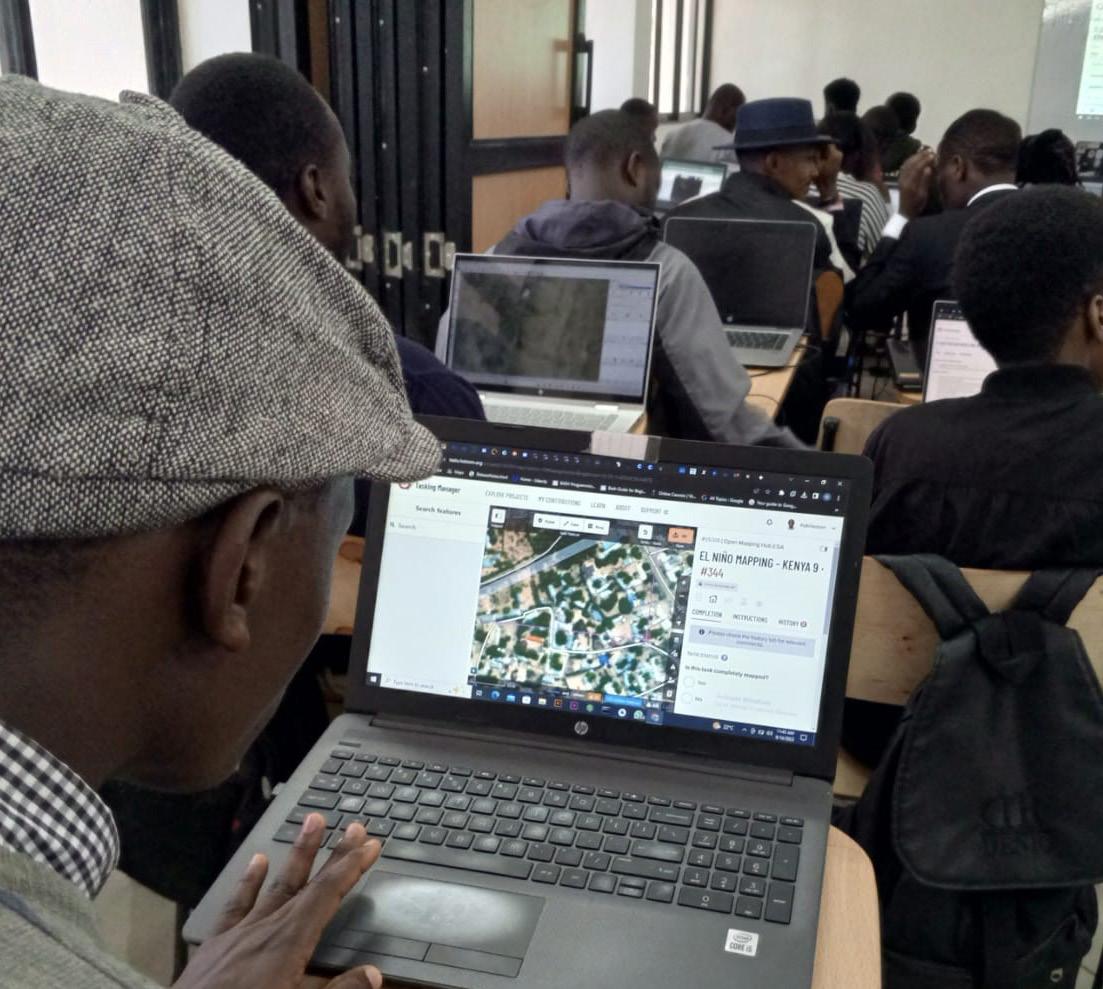
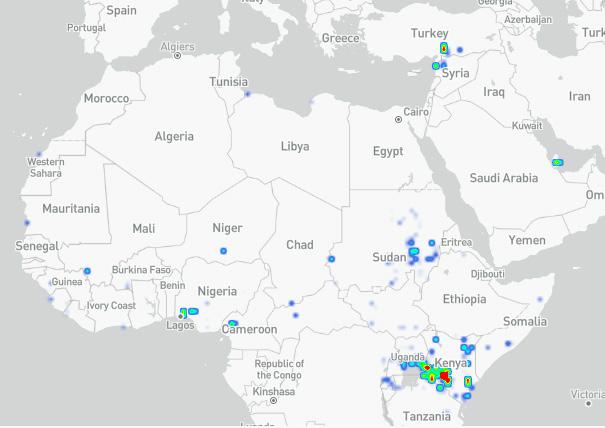
YouthMappers is a global university student community contributing to humanitarian open mapping projects. They work to map areas where maps are outdated or nonexistent to support humanitarian, disaster response, and sustainable development efforts. YouthMappers contribute to open data by mapping regions of OpenStreetMap, which is an open-source and collaborative mapping project. They trace roads, buildings, waterways, and other features from satellite imagery or local GPS data to create up-to-date open map data.
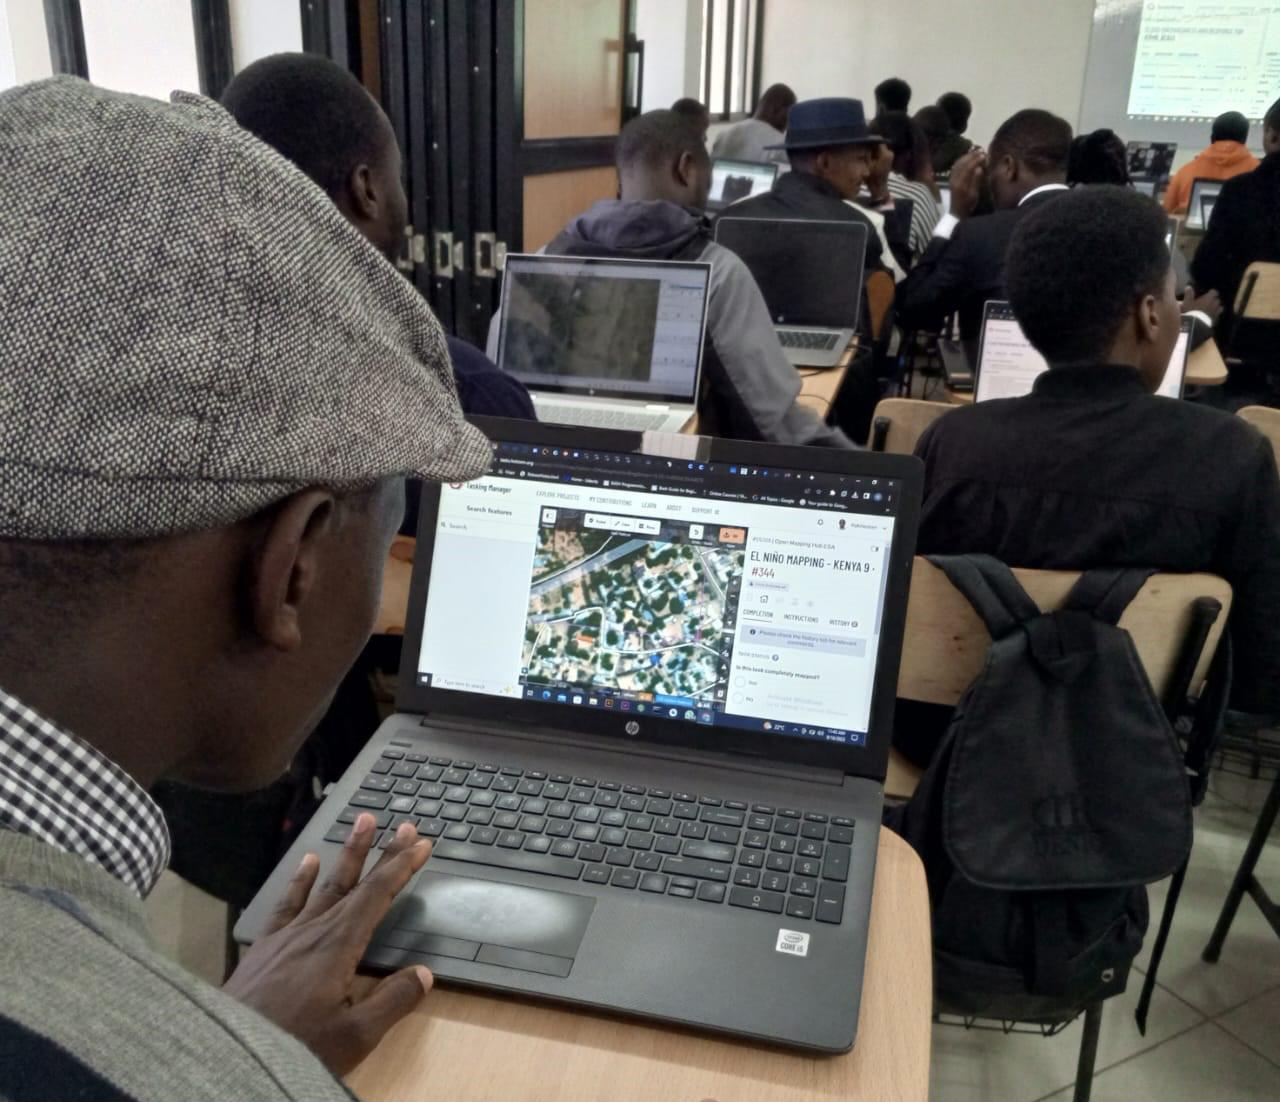
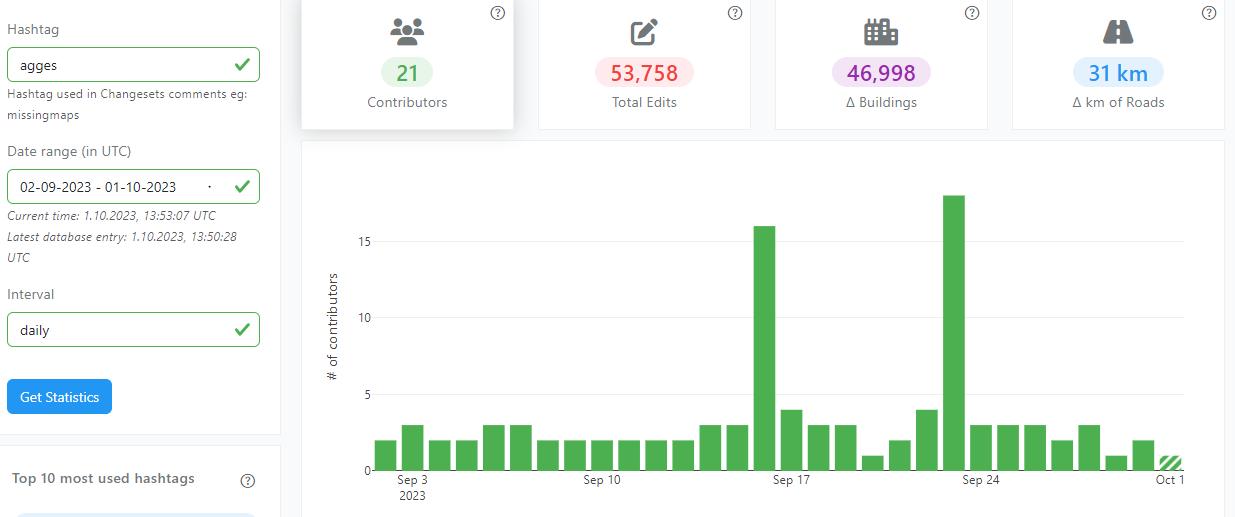
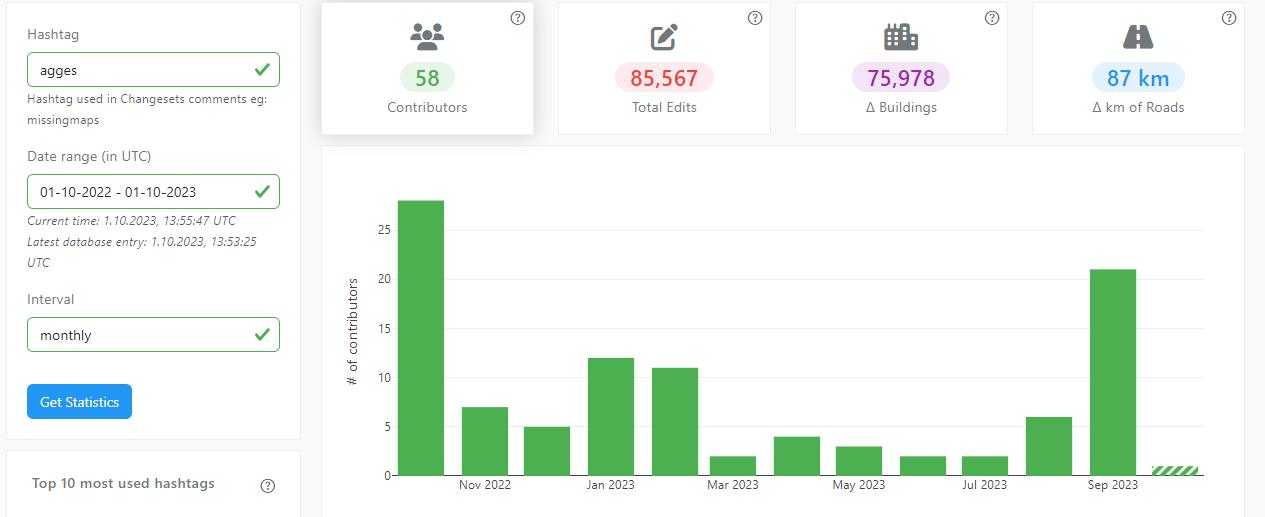
YouthMappers has around 5,000 chapters located at different universities worldwide. We have 14 chapters in Kenya, and the JKUAT Association of Geospatial and Geomatic Engineering Students (AGGES) is one of them.
In our chapter, we strive to contribute to the significant disasters happening worldwide by mapping buildings, roads, and waterways, which help humanitarian organizations make informed decisions.
Furthermore, we also map the unmapped areas of Kenya. We have recently completed a section of Juja, which is awaiting validation to ensure the mapped buildings and roads conform to the desired accuracy.
When it comes to contributing to the disaster preparedness dataset, our chapter also participates in those projects; such as the ongoing Mapping for El Niño 2023 Early Warning and Anticipatory Action campaign. Our chapter has added over 30,000 buildings to the OpenStreetMap.
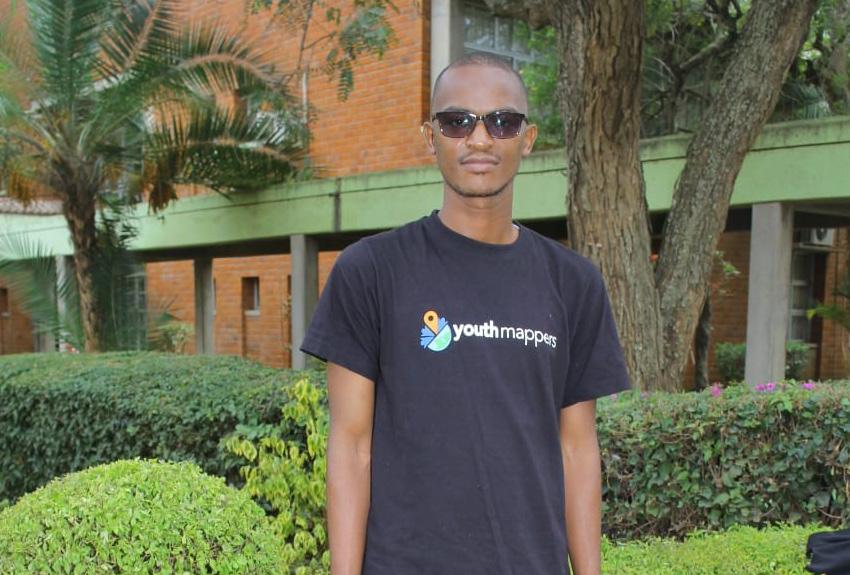
Joseph Munyenze is a final year student taking BSc. in Geomatics Engineering and Geospatial Information Systems and is serving as the chapter president for the 2022/2023 term.
He has acquired numerous OpenStreetMap editing skills, which he has been able to pass on to the chapter members. Last year, he participated in the OSM Uganda training internship and UN Mappers Training Workshop.
Additionally, he recently completed an OSM Kenya Data Quality internship program. He is an active volunteer at the Humanitarian OpenStreetMap Team.
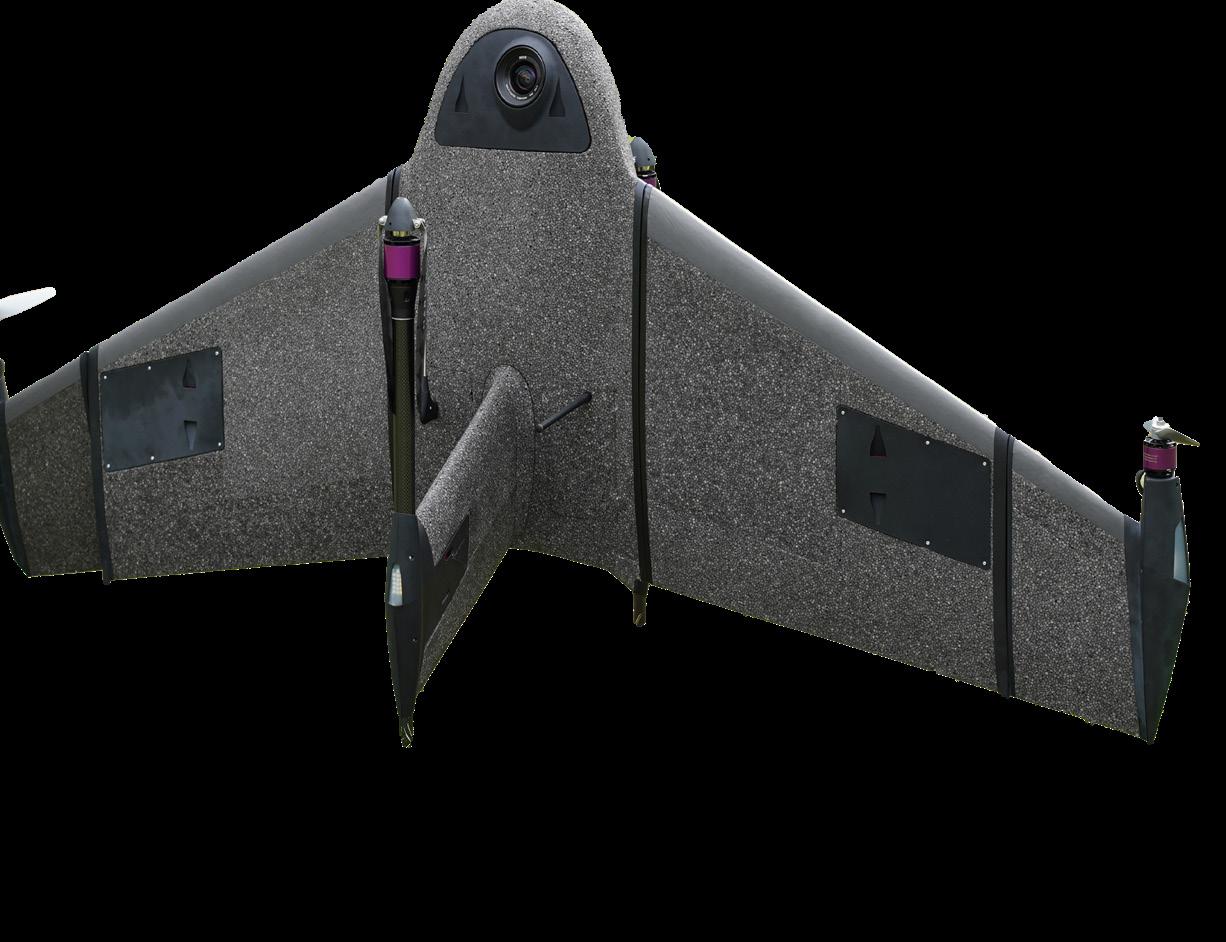
ATMOS UAV, a Marly Cobalt drone innovator in the drone industry, is pleased to announce the release of a new Sony a6100 camera for its surveying drone set to be used for urban survey in the production of 3D models.
This camera combines Sony’s 24mp a6100 with a Meike 12mm Lense providing excellent solutions to cost effective and lower resolution surveys. It is also cheaper than the workhorse a7RIV camera, which is its cousin, this allows professionals to access high resolution imagery without incurring too many costs.
With its 12mm Lense feature, it enhances data collection efficiency and 3D data collection. The feature is mounted in a fixed angle enabling data collection efficiency, giving surveyors and urban planners extraordinary insights for their projects. The camera is able to capture 350 hectare coverage at 400 feet hence covering vast areas in a single flight delivering sharp and detailed images for precise analysis, reducing operational time and costs.
Testing of the Sony camera was done by one of Atmos’s customers in Santa Maria neighborhood, Netherlands for urban planning purposes. They were able to inspect houses, treetops etc. through different processing methods using the camera.
ATMOS UAV CEO stated the following “we are thrilled to collaborate with Sony and introduce the Sony a6100 camera to our Marlyn Combalt drone.”
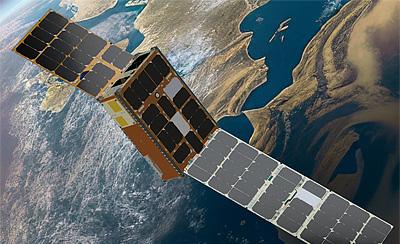
Open Cosmos, a space firm, has successfully launched its fourth Earth Observation satellite, ALISIO-1, in 2023. ALISIO-1, or Advanced Land-Imaging spacecraft for Infrared Observations, is a 6U spacecraft designed for the Canary Islands Institute of Astrophysics.
Its primary goal is to improve optical communications from space and revolutionize Earth monitoring capabilities. Launched from California’s Vandenberg Space Force Base on SpaceX’s Falcon 9, ALISIO-1 is already in its intended orbit. The satellite’s first ground contact was made shortly after launch, marking a significant milestone in its operating phase.
The satellite’s primary payload, DRAGO-2, is a tiny uncooled camera operating in the Short-Wave Infrared region, providing a hidden perspective for various applications such as wildfire monitoring, volcano activity monitoring, oil spill identification, and desertification and crop humidity control. ALISIO-1 will also host an optical communications terminal for Space-Earth communications using lasers.
The satellite’s design and production are validated through a suite of technologies, including digital recording of every test, which speeds up problem identification and resolution, improving Open Cosmos’ capacity to deliver space missions more efficiently, reliably, and cost-effectively.
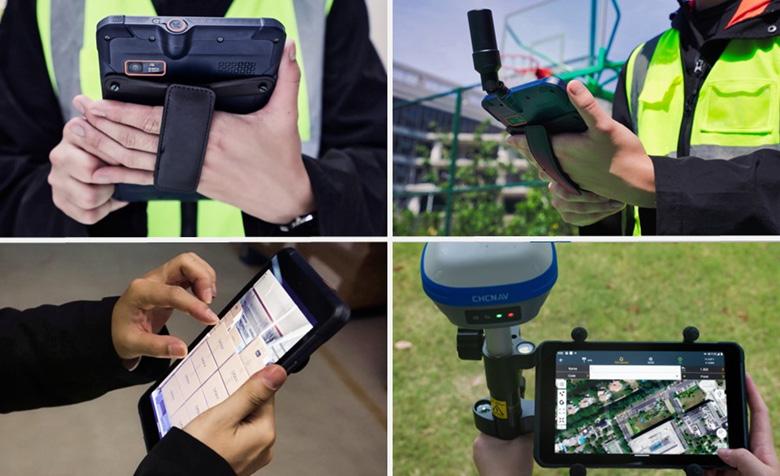
The LT 800H stands at the forefront of centimeter-to-decimeter accurate positioning systems, revolutionizing precision GIS data collection. Equipped with the advanced CNC nav landstar survey software, this cutting-edge device seamlessly integrates with most existing Android server applications, boasting compatibility with Android 12 simplicity.
What makes LT 800H stand out?
Server Application Correction LT 800H to RTK Network Service
The LT 800H is empowered by a Server application correction LT 800H, linking to an RTK network service that delivers unparalleled survey data accuracy. Its GPS module enables rapid positioning within seconds, setting new standards in efficiency for fieldwork.
Crafted for durability, the tablet is designed to endure all-day use in harsh environments. Protected from dust, rain, extreme temperatures, and impact, it ensures the safety of the device and collected data alike. Field members can seamlessly conduct their work, reaping the benefits of unrivaled position accuracy.
What are the benefits of using an
The LT 800H excels in centimeter-to-decimeter positioning accuracy, facilitated by a high-performance 1408 channel GPS, GLONASS, Galileo, BeiDou module, and an advanced tracking GNSS helix antenna. The integrated modem ensures easy connectivity to GNSS network corrections, elevating data collection precision.
Boasting a high-performance hardware system, the LT 800H experiences no lag or slowdown. The Glass 3 IPS touchscreen displays large maps and data sets, providing a clear view of the outdoor environment and enhancing efficiency during fieldwork.
The tablet’s rugged design ensures maximum efficiency in
Tanzania’s commitment to orbital space exploration is a significant milestone, contributing to the growing prominence of African nations in satellite technology. The chosen orbital position at 16 degrees west reflects careful planning and strategic thinking, positioning Tanzania’s satellite in a specific region of the vast expanse of space.
This choice may hold implications for the satellite’s functions, connectivity, and its role in global collaborations. Tanzania’s foray into orbital space exploration holds tangible promise for the nation’s development across diverse sectors, including the geospatial industry, disaster management, agriculture, and communication.
In disaster management, the satellite can play a crucial role in monitoring and responding to natural disasters, providing real-time data for efficient interventions. In agriculture, satellite technology can enhance precision farming, optimizing resource utilization and improving crop yields. The communication sector can benefit from improved connectivity and data transmission capabilities, potentially bridging gaps in remote areas and fostering economic development.
As Tanzania continues its journey into orbital space exploration, it is poised to unlock further potential in various sectors, contributing to national development and Africa’s growing influence in space technology. The successful launch of its maiden satellite in 2023 will undoubtedly open new horizons for Tanzania’s scientific and technological prowess on the global stage.
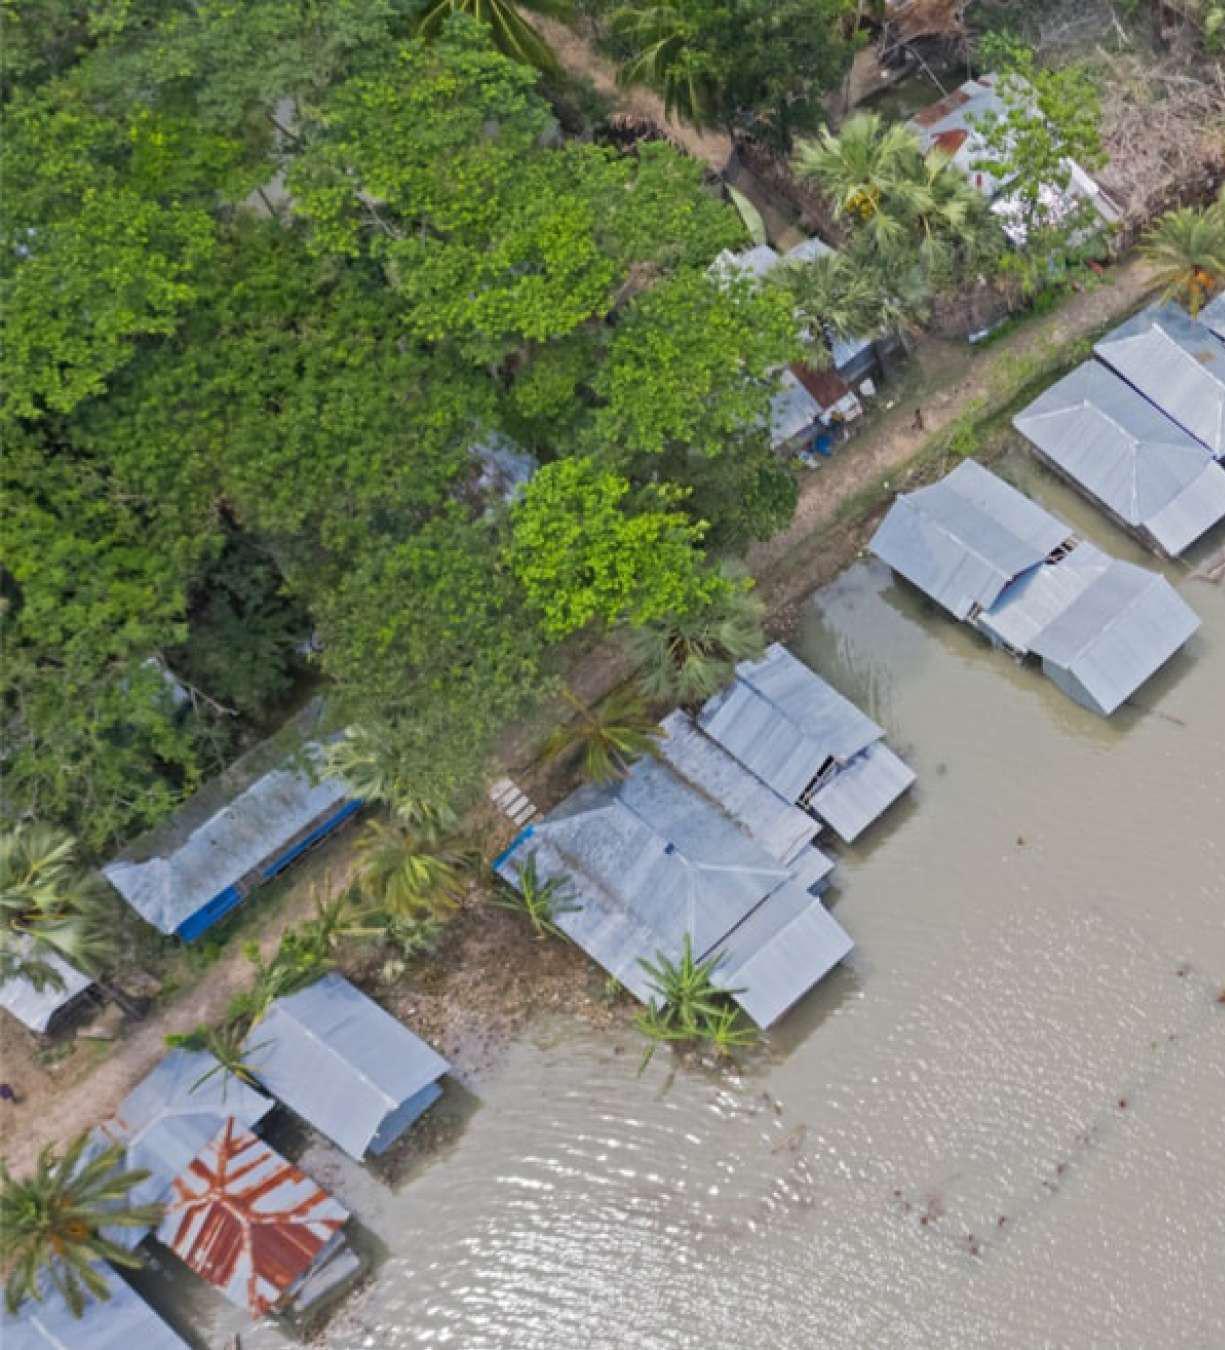
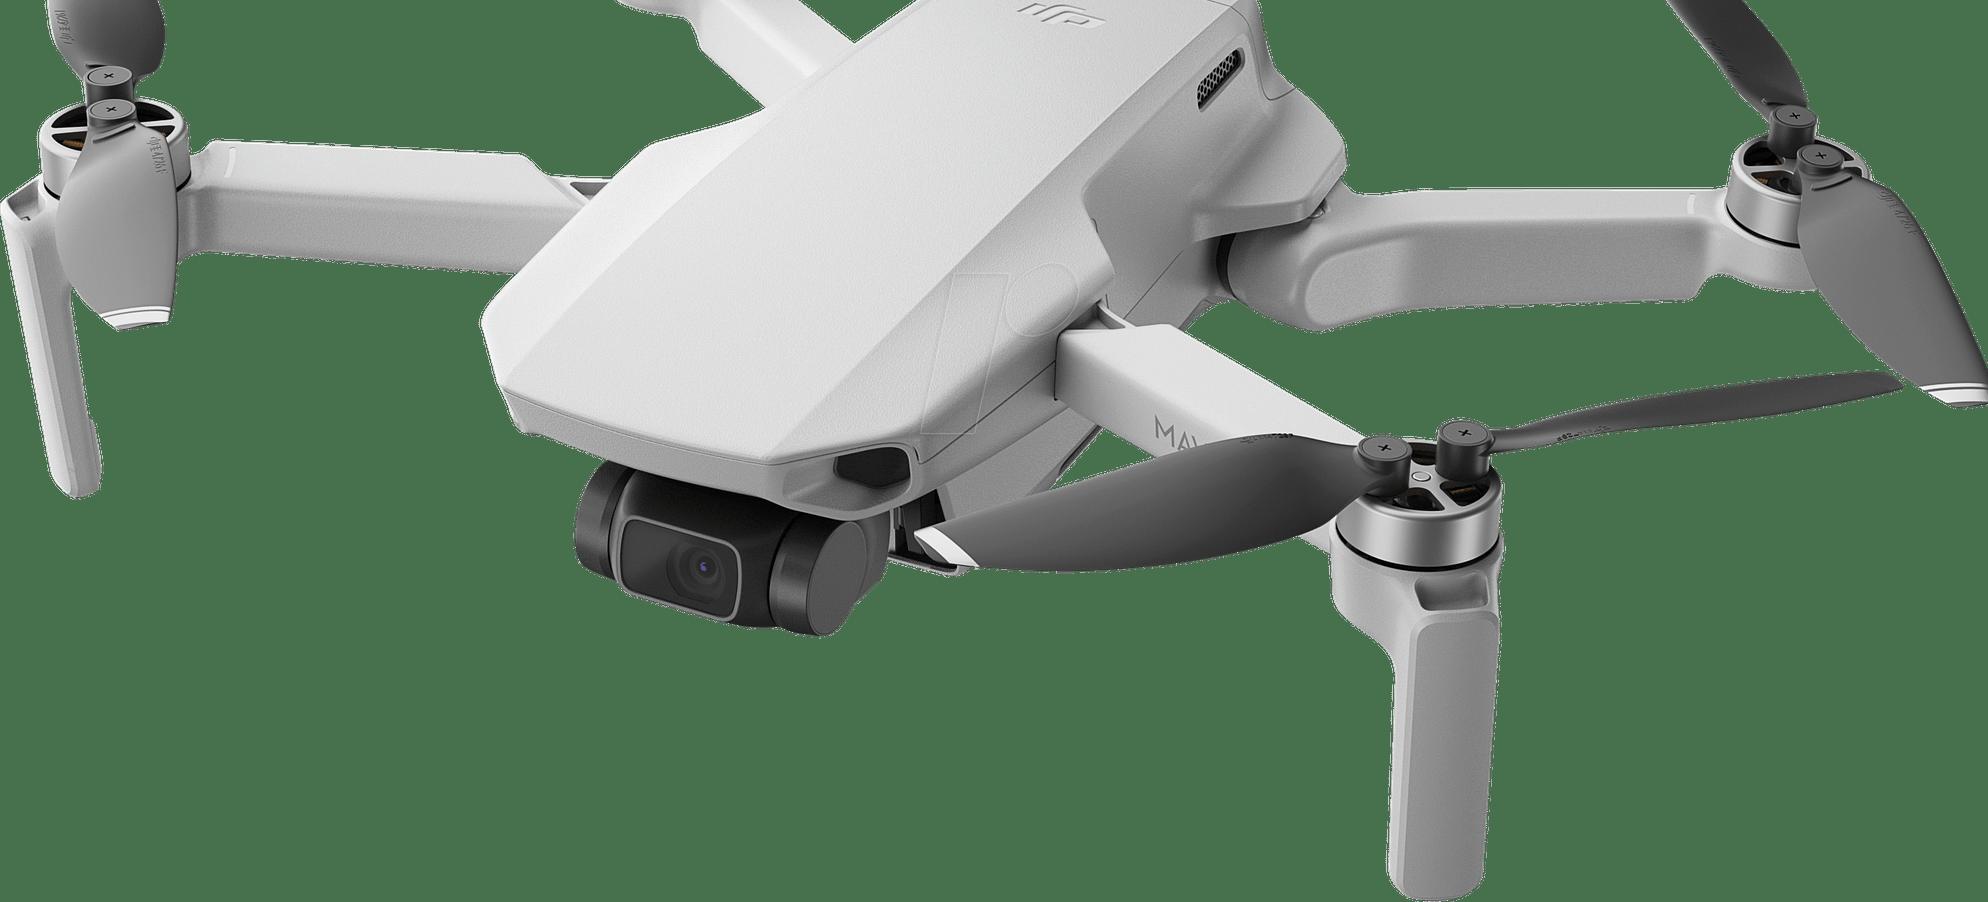
Drones, or unmanned aerial vehicles (UAVs), are small aircraft that can be controlled remotely or programmed for independent operation.
They have become increasingly popular in floodprone areas due to their efficiency, high-quality aerial imagery, and reduced obvious danger and health risks. Drones, equipped with a Geographic Positioning System (GPS), can identify precise locations, facilitating the identification of individuals in distress and determining areas heavily impacted by floods. They are used in various sectors such as agriculture, construction, oil and gas, and other sectors of the economy.
Drones also provide high-quality aerial imagery, with top-notch sensors capturing large volumes of accurate images. They are easily deployable, providing quick access to infrastructure and areas inaccessible to traditional aircraft.
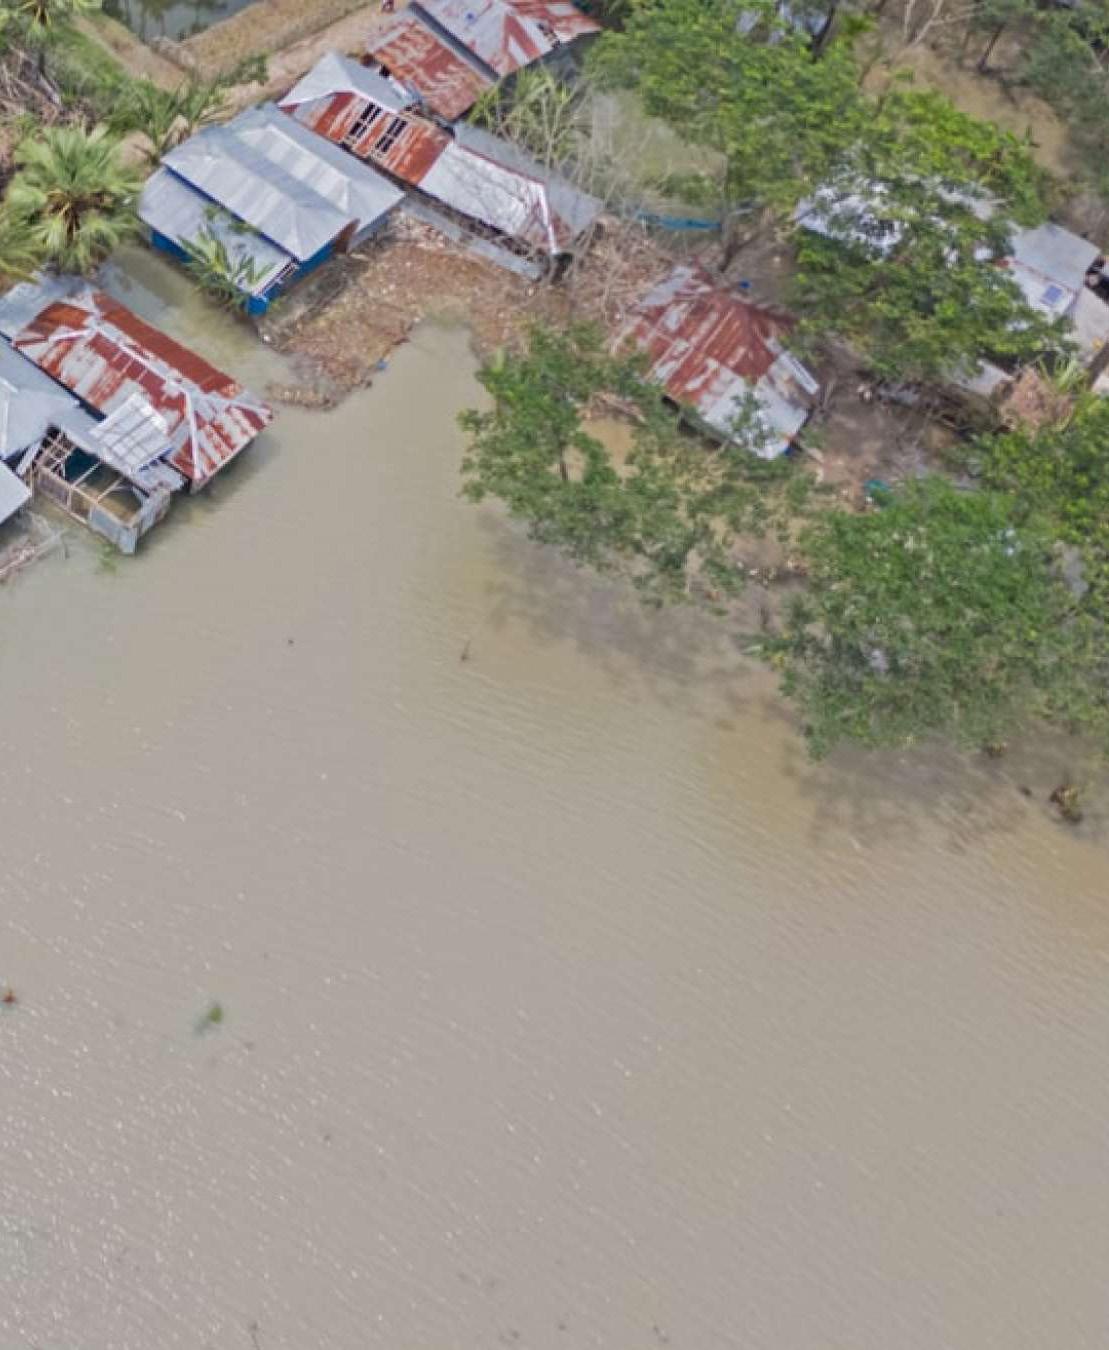
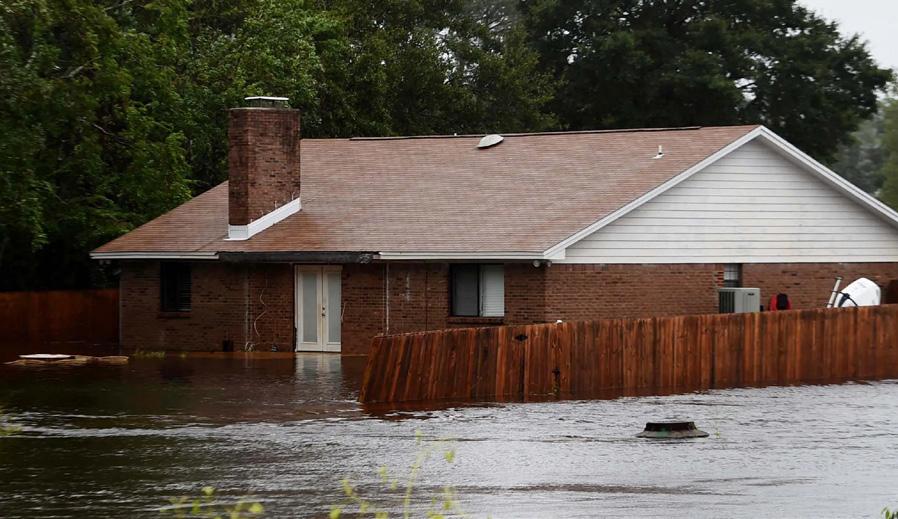
Drones mitigate hazards and health risks to rescue teams in scenarios like earthquake tremors, radiation, and excessive floods, enabling timely warnings and the implementation of appropriate mitigation measures.
UAVs also capture high-resolution imagery, revealing cracks, damages, and displaced electrical equipment that may go unnoticed by the human eye. This information is crucial for understanding the long-term effects of damages and developing adequate future plans.
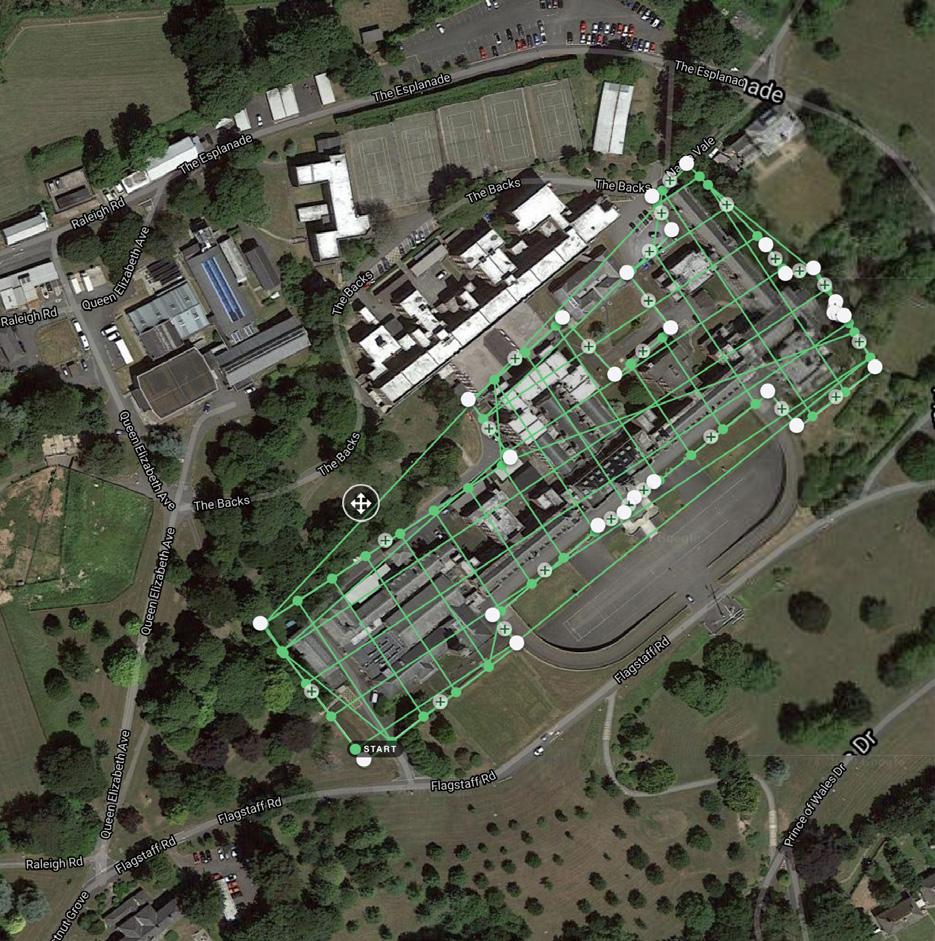
Google’s street view project on Guernsey Island faced challenges when local commissioners accused the company of collecting wifi data on private roads. This led to Google halting the collection prematurely, leaving the task incomplete. The Data Protection Law of 2017 prompted Google to adopt a new strategy, integrating artificial intelligence algorithms to automatically blur faces and car registration plates in uploaded images, addressing privacy concerns.
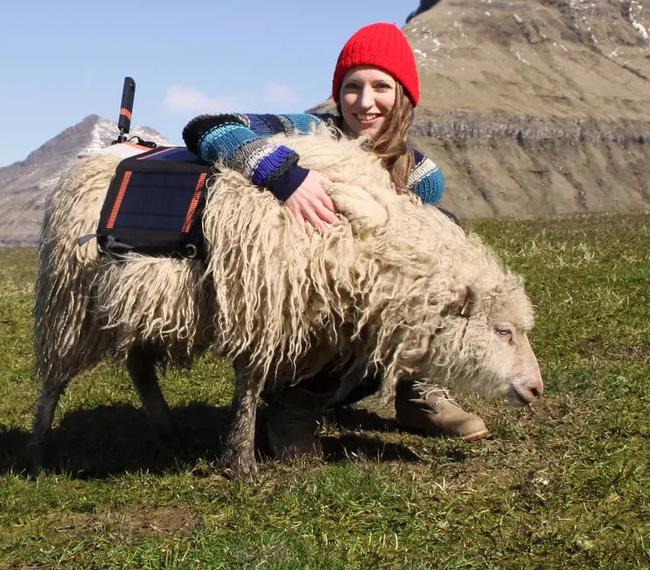
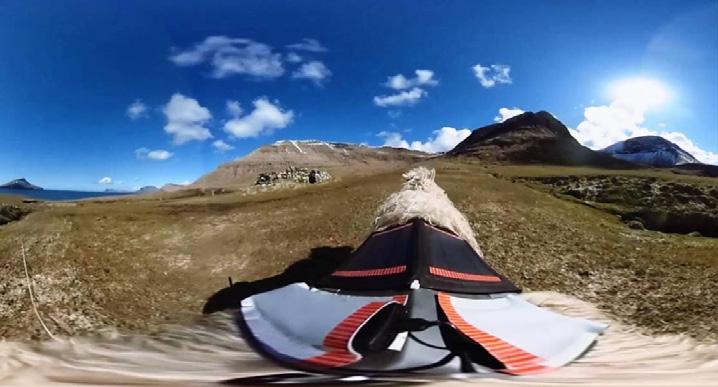
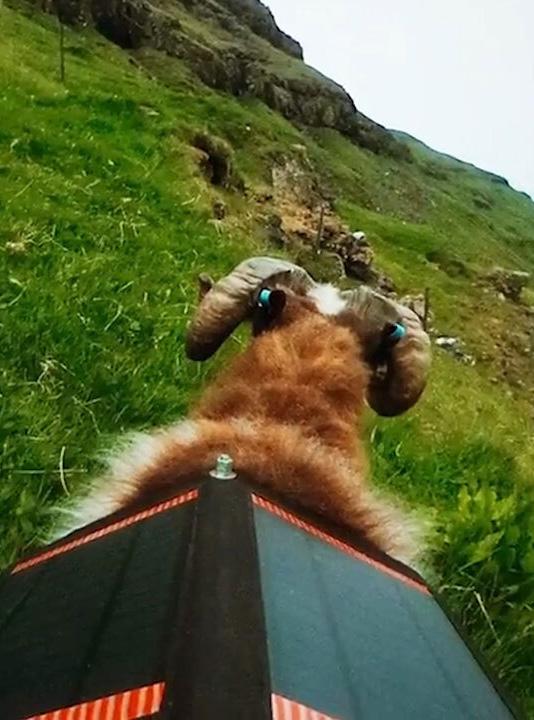
Resident Andre Quevatre documented the streets with a camera gifted on his birthday, leading to the Braye du Val and some parts of L’Ancresse. Durita Andreasen, a woman from the Faroe Islands, captured the island’s trails and tracks using a 360-degree camera and a team of sheep equipped with cameras. The footage was uploaded for further processing on Street View.
Locals campaigned for Google’s support using the Sheep view 360 campaign, which provided cameras for islanders to document their surroundings using various means. The campaign empowered the community to feature their island online and transformed the once overlooked destination into a virtual tourist attraction, highlighting its steep coastal cliffs, seabirds, serene valleys, and expansive heathlands. The collaborative effort between Google and the islanders resolved privacy concerns and transformed an obstacle into an opportunity for global visibility and appreciation.
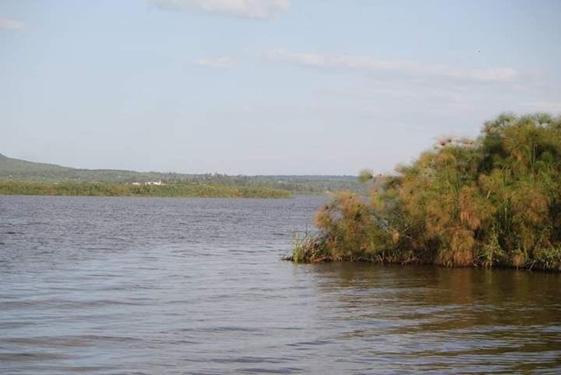
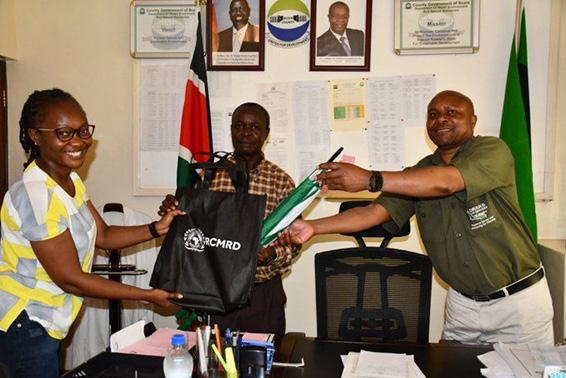
The Directorate of Resource Surveys and Remote Sensing (DRSRS) has partnered with the Regional Centre for Mapping of Resources for Development (RCMRD) to collect extensive spatial data on the Yala swamps in Siaya and Busia counties, Kenya, to aid in sustainable resource management and environmental conservation.
The primary objective is to amass detailed spatial data related to the Yala swamps, encompassing topography, land use patterns, vegetation cover, water resources, and human settlements within the region. Through the utilization of existing data and expertise, the partnership aims to construct a unified and comprehensive spatial database, collaborating closely with government agencies responsible for environmental management, water resources, and local governance.
The engagement of stakeholders, including local communities, NGOs, and academic institutions, is deemed critical for the mission’s success. Their input and on-the-ground knowledge will enrich the dataset, ensuring the collected information is both accurate and contextually relevant.
The collaboration places a strong emphasis on capacity-building within local communities and government agencies. Training programs on geospatial technologies and data interpretation will empower stakeholders to actively participate in future resource management initiatives.
The amassed spatial data will serve as a baseline for ongoing environmental monitoring.
Establishing a robust monitoring system, the partnership aims to track changes in the Yala swamps over time and identify emerging challenges requiring prompt intervention.
This collaboration facilitates a holistic understanding of the Yala swamp ecosystem, integrating scientific data with local knowledge. This ensures that management strategies are not only effective but also culturally sensitive. Government agencies, NGOs, and local communities can utilize this information to plan and implement interventions promoting sustainable development while preserving the ecological integrity of the Yala swamps.
To ensure the collected data meets global standards and can be applied in a broader context, leveraging the expertise of DRS&GRI and RCMRD allows the incorporation of international best practices in geospatial research and resource management.
The Directorate of Resource Surveys, Geospatial Research International, and the Regional Centre for Mapping of Resources for Development have partnered to protect the Yala swamps in Siaya and Busia counties, promoting sustainable resource management and a resilient ecosystem.
DJI FlyCart 30 is the ultimate solution for longdistance heavy lifting in the realm of aerial logistics in remote areas. This cutting-edge drone is equipped with a host of features that redefine the possibilities of air transport, providing a safe, economical, and efficient solution for a variety of applications.
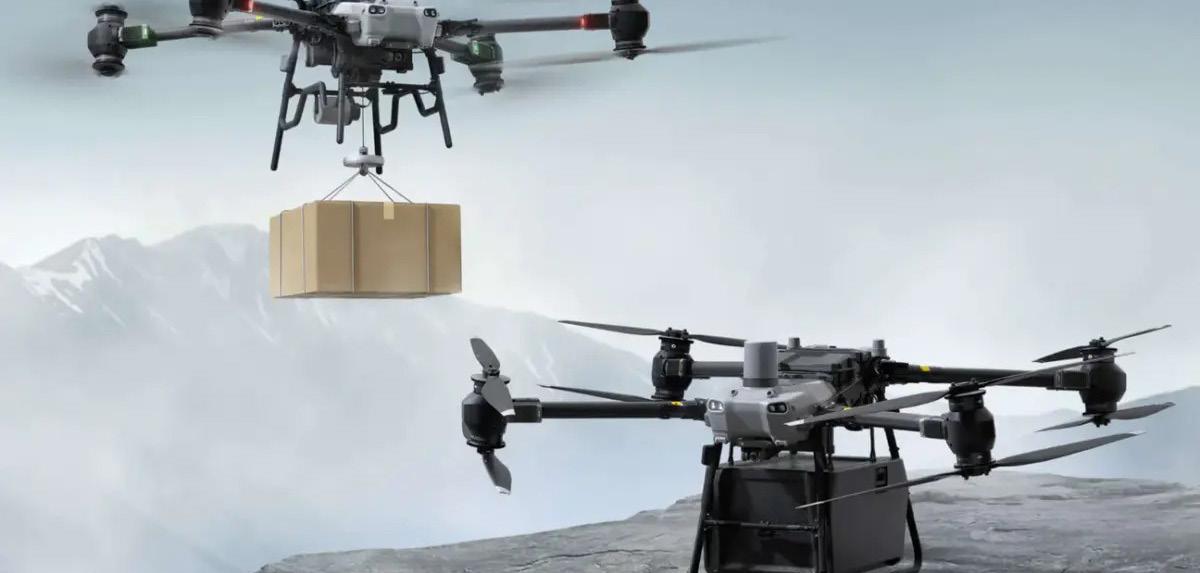
With a maximum payload capacity of 30kg, the DJI FlyCart 30 boasts an impressive 28km flight distance without payload and 16 km flight distance with a full payload. Its remarkable capabilities make it a reliable choice for heavy payloads and longdistance deliveries.
Built to endure the harshest conditions, the FlyCart 30 can operate in temperatures ranging from -20 degrees to 45 degrees (-4 F to 113 F). It can reach a maximum flight altitude of 6000 m and withstand wind speeds of up to 12 m/s, ensuring consistent performance in diverse environments.
The FlyCart 30 prioritizes safety with its 1P55 protection and corrosion resistance. Equipped with advanced sensors, including radars and binocular vision, it incorporates intelligent obstacle sensing to navigate through challenging terrain seamlessly. Dual batteries and a parachute system further enhance its safety measures, ensuring a secure and controlled descent in case of emergencies.
Designed for convenience, the FlyCart 30 features a foldable design for easy transport and storage. Its 70-liter EPP case provides a protective and efficient storage solution. The inclusion of a winch system adds versatility, allowing for efficient cargo handling and delivery.
The FlyCart 30 is geared for full automatic operations, streamlining the entire process. Utilizing DJI Pilot 2 and DJI DeliveryHub, it ensures precise and autonomous navigation. Additionally, a health management system keeps track of the drone’s vital statistics, ensuring optimal performance and maintenance scheduling.
To conclude: DJI FlyCart 30 stands as a beacon of innovation in the realm of heavy-lifting drones. From its robust performance metrics to its advanced safety features and intelligent automation, it sets a new standard for longdistance cargo transportation, offering a reliable and efficient solution for a wide array of logistical challenges.
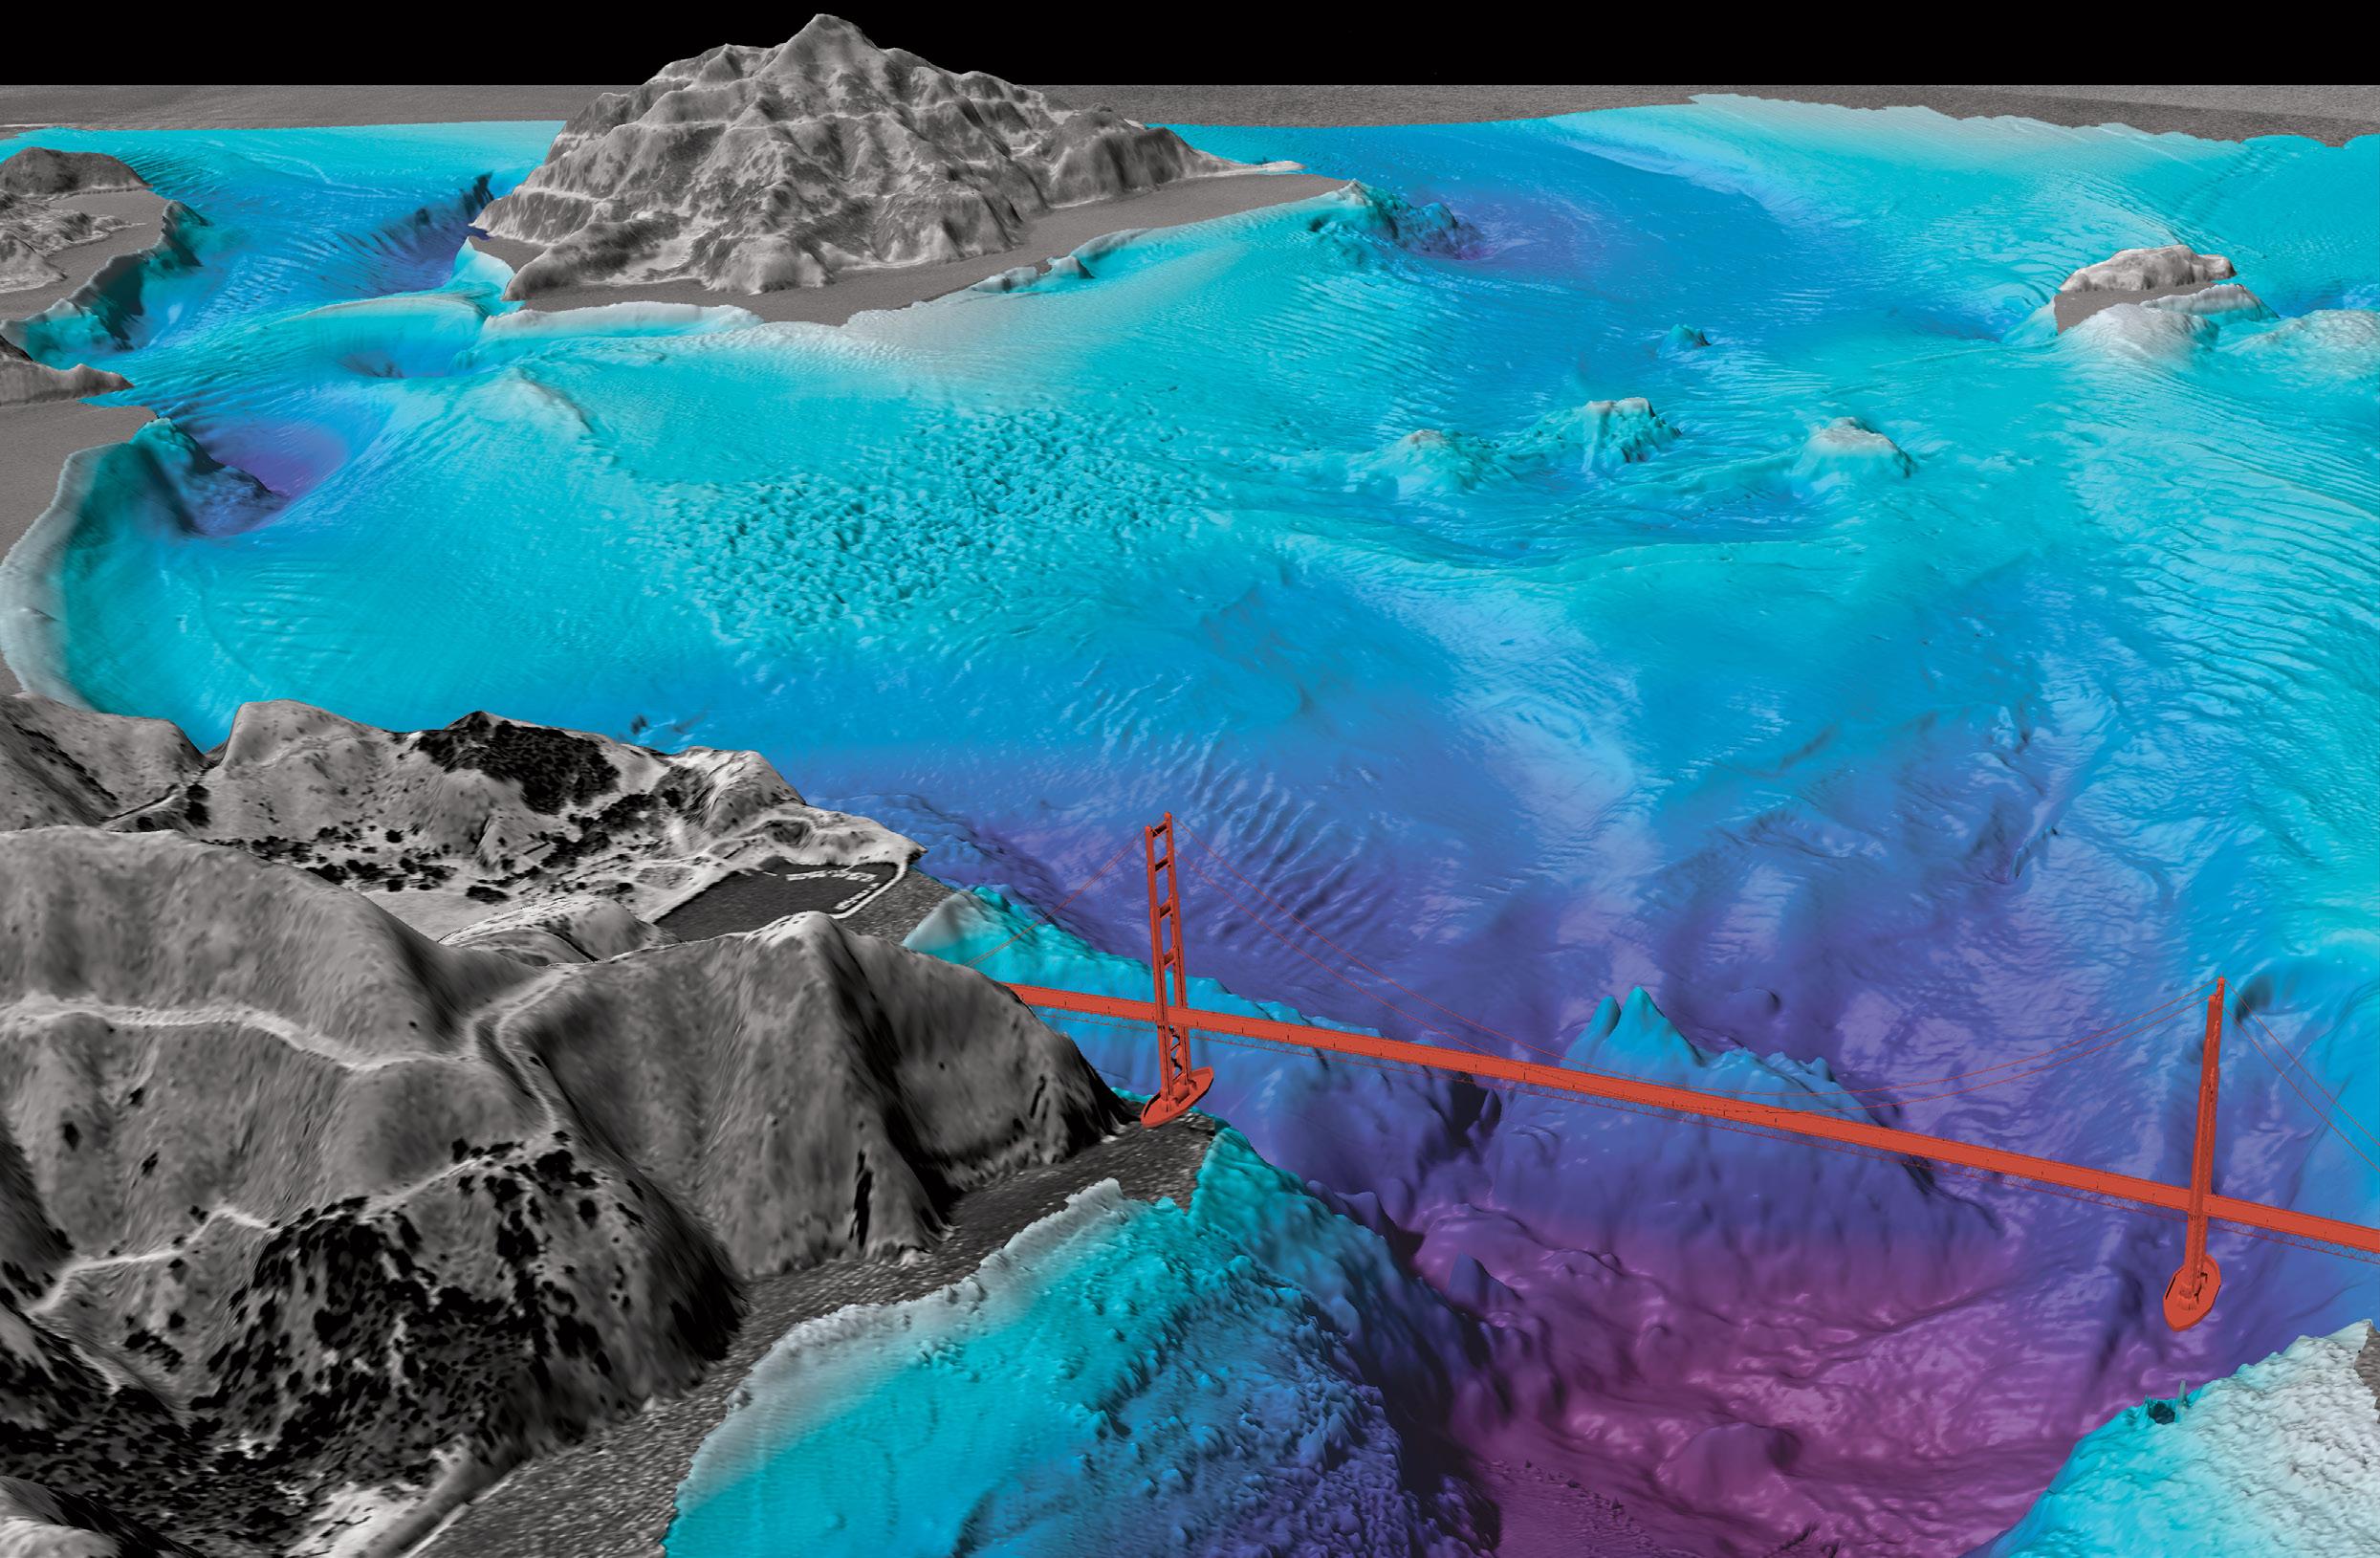
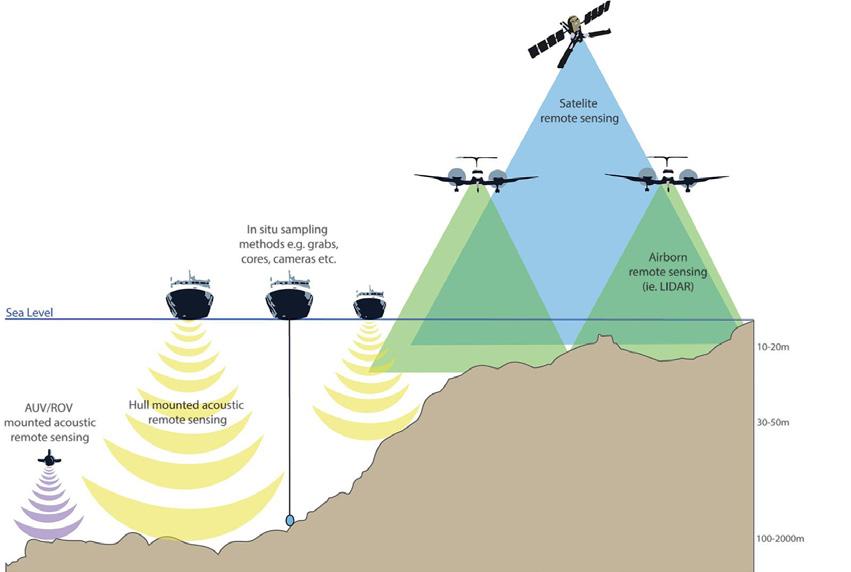
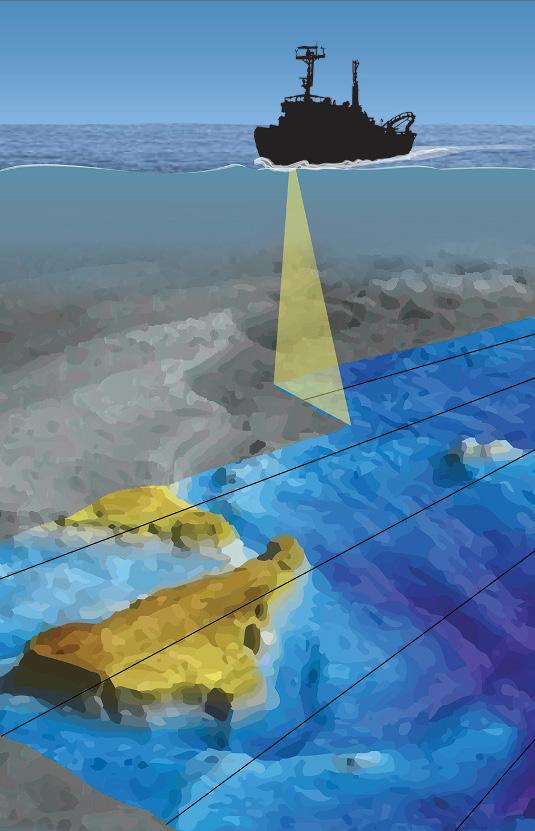
The world’s oceans cover more than 70% of the Earth’s surface, yet much of the seafloor remains uncharted and mysterious. To explore and understand the hidden wonders of the deep, scientists and researchers have turned to advanced technologies, including sonar technology, Low Altitude Survey Systems (LASS), and Seafloor Instrument Nodes (SIN). These tools have revolutionized our ability to create highly detailed seafloor maps, unlocking valuable insights into the geological, biological, and environmental aspects of the ocean floor.
Sonar technology is the cornerstone of modern seafloor mapping. It stands for Sound Navigation and Ranging and operates on the principle of sending sound waves into the water and measuring their return time to determine the distance to an object. This technology has been instrumental in creating detailed seafloor maps by providing accurate depth measurements and identifying underwater features.
There are two primary types of sonar used for seafloor mapping:
Multibeam sonar systems use multiple beams of sound waves to simultaneously cover a wide swath of the seafloor. This results in highly detailed bathymetric maps, which show the underwater topography with exceptional precision. Multibeam sonar technology allows researchers to create 3D representations of the seafloor, revealing underwater canyons, ridges, and other geological features.
Sidescan sonar systems are designed to produce detailed images of the seafloor’s texture and composition. These systems emit sound waves at an angle and record the echoes that bounce back. By analyzing the strength and timing of these echoes, researchers can create images that highlight seafloor sediments, shipwrecks, and even biological communities.
Seafloor Instrument Node (SIN): Real-Time Data Collection and Monitoring
In recent years, the deployment of Seafloor Instrument Nodes (SIN) has further revolutionized seafloor mapping and research. SINs are autonomous, sensor-equipped devices that are placed on the seafloor for extended periods. They serve as underwater observatories, continuously collecting data on various oceanographic parameters, including temperature, salinity, pressure, and currents.
SINs are often integrated with sonar technology, creating a comprehensive monitoring and mapping system. This combination enables real-time data collection and the ability to study seafloor processes, such as underwater volcanic eruptions or the movement of tectonic plates.
The creation of highly detailed seafloor maps using sonar technology, LASS, and SIN has numerous applications across various scientific disciplines and industries:
Geological Research: Detailed maps help geologists study the Earth’s crust, tectonic plate boundaries, and the formation of geological features like seamounts and mid-ocean ridges.
Environmental Conservation: Mapping the seafloor aids in identifying sensitive marine habitats, enabling the establishment of marine protected areas and sustainable resource management.
Underwater Archaeology: High-resolution maps assist in locating and documenting shipwrecks and submerged archaeological sites, preserving cultural heritage.
Navigation and Safety: Accurate seafloor maps are essential for safe navigation of ships and submarines, reducing the risk of accidents in the ocean.
Resource Exploration: Detailed seafloor data can be used to locate valuable resources such as minerals, oil, and gas, supporting responsible resource extraction.
The collaboration between sonar technology, Low Altitude Survey Systems (LASS), and Seafloor Instrument Nodes (SIN) has transformed our understanding of the seafloor. Highly detailed seafloor maps not only unravel the mysteries of the deep but also contribute to scientific research, environmental conservation, and safe navigation. As technology continues to advance, our ability to explore and protect the vast underwater realms of our planet will only grow, paving the way for new discoveries and insights.
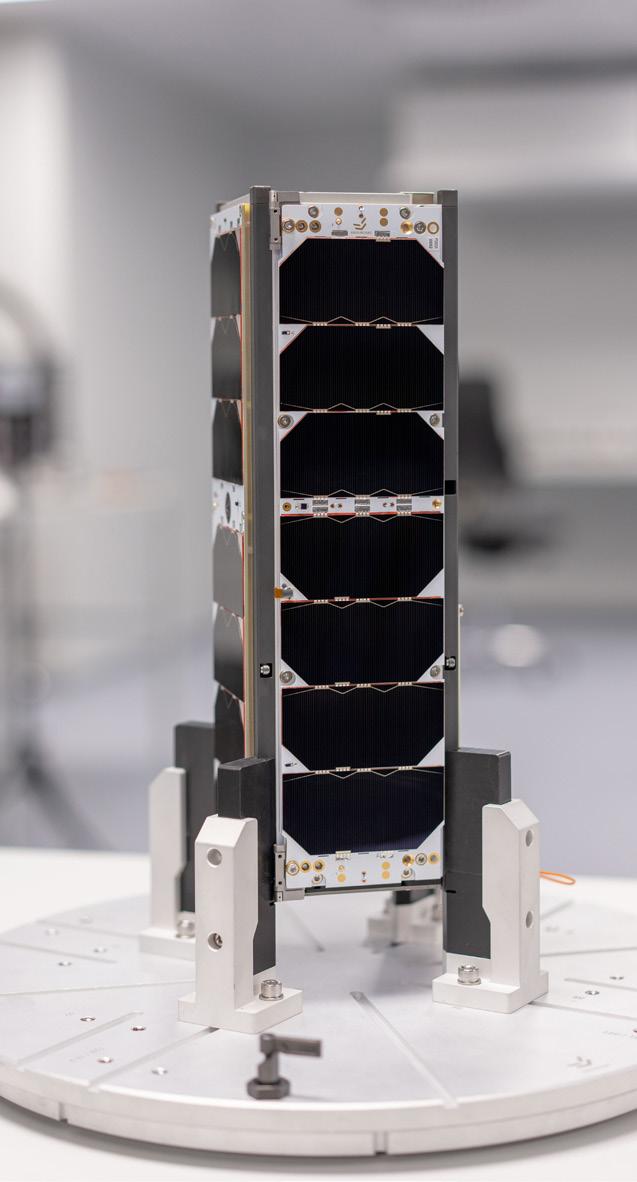
They are a Kenyan aerospace research and development company that is pioneering satellite engineering in response to unique problems that plague Kenya and the rest of the developing world.
Most of the countries that have done this before have the advantage of having started from space and because of the requirements of developments from space they end up developing technology that can trickle down to an acceptance of: security services, health services, agriculture etcetera. So, space is a frontier that once you reach it shows that you are able to take a world lead in other sectors of your economy.
There’s a problem that comes with relying on other countries for their satellite services. You are at their mercies and they would charge you more than if you did it on your own. Also, there are restrictions, in that, if the worst comes to worst and you don’t have your own space assets, telecommunication services will be brought to a halt and any other services we gain from space technology. It is a journey that each country has to take in order to reap all the benefits without the said restrictions.
With the satellites, we are trying to solve a problem from space and there are advantages of being able to act from space, such as: you have the bird eye view and you are able to do a lot of things such as communication, earth Observation and research. So, the process starts from identifying the problem you want to solve and the ways in which you want to improve life. With the mission we launched, we
were trying to tackle problems such as: frequent floods, drought, insecurity, deforestation, poor urban planning, etcetera.
Once we have identified the problem, we begin the mission analysis and design whereby we come up with a mission statement. The mission/problem statement in this case describes the problem and describing how to use the knowledge and resources we have to solve the problem.
The mission objectives are then developed. This is what must be achieved for the mission to be considered successful.
The mission requirements are then identified, for example, which orbit will the satellite operate in, the kind of payload, power requirements of the system, constraints such as time, man power and financial capital.
Once all these has been established, the spacecraft design begins because the mission is segmented into: the ground segment, launch segment, the space segment and the mission support segment. The design of these segments begins.
Sayari labs focuses on designing the space segment. Once the requirements and constraints have been properly defined, we design how our design is supposed to be. Here, we define how many subsystems we need for the camera to work properly. We then come up with the designs for the different modules such as electronic design, firmware and software design, mechanical design, Quality Assurance and Testing.
Once all these is done, we have the flight model which is the version of the spacecraft that is ready to go into space. The flight model is sent to the launch service provider who helps us to take it to space.
Your team at Sayari Labs was instrumental in this historic moment in Kenya.
What role did Sayari labs play in ensuring the success of the satellite launch project? What specific role did you play in the design and launching project?
We started as a team of Kenyan Engineers trained from local Universities. Only one of us trained in the United States. We were drawn from the different universities, myself being from JKUAT. We then underwent training for six months before the project started.
We were then ready to do the first bits I mentioned: problem identification, coming up with the mission statement, establishing the mission objectives, identifying the requirements and the constraints and coming up with the preliminary design of the mission. That is the role we played. Because we could not produce the hardware at the time, we partnered with a European company to help us come up with the hardware.
We later did the integration of hardware together with the partner. We also did the launch coordination, registration of the satellite, satellite commissioning and operations.
Personally, I took part in all the initial phases of design. I was then the lead Communications Engineer and the lead payload integration Engineer. My responsibility essentially is to ensure we have a proper communication budget so that once the satellite is in space it can communicate as required to our ground station and we can receive the images through the radio modules. Mine was to then come up with the communication parameters that we pass on to the manufacturers. I was
also tasked with doing the payload integration and because we don’t specialize in payload manufacturing at the moment, we get the payload from an established manufacturer and integrate it with our spacecraft systems, I was tasked with identifying the appropriate payload and integrating it with the system.
Could you describe the technical challenges experienced by you and your team in the design and launch of the satellite? How did you overcome them?
Since this was a new venture for our country, the ground-breaking was steep. We had to do a lot of conversion training to be able to have a grasp of what goes on. Being engineers, it was not hard to understand what needs to be done because you simply take the aerospace standards and bring them into what you usually do. That was the conversion process. That was quite steep but we managed.
Also, during the development process there was a problem with supply of electronic chips. Another problem was the lack of the testing facilities. We had to look for partners for the testing process. We ensured that any time we partnered with an entity we gained as much as possible so that next time, if we have the resources, we can get the most on our own. We also ensured we partnered with other people both locally and internationally.
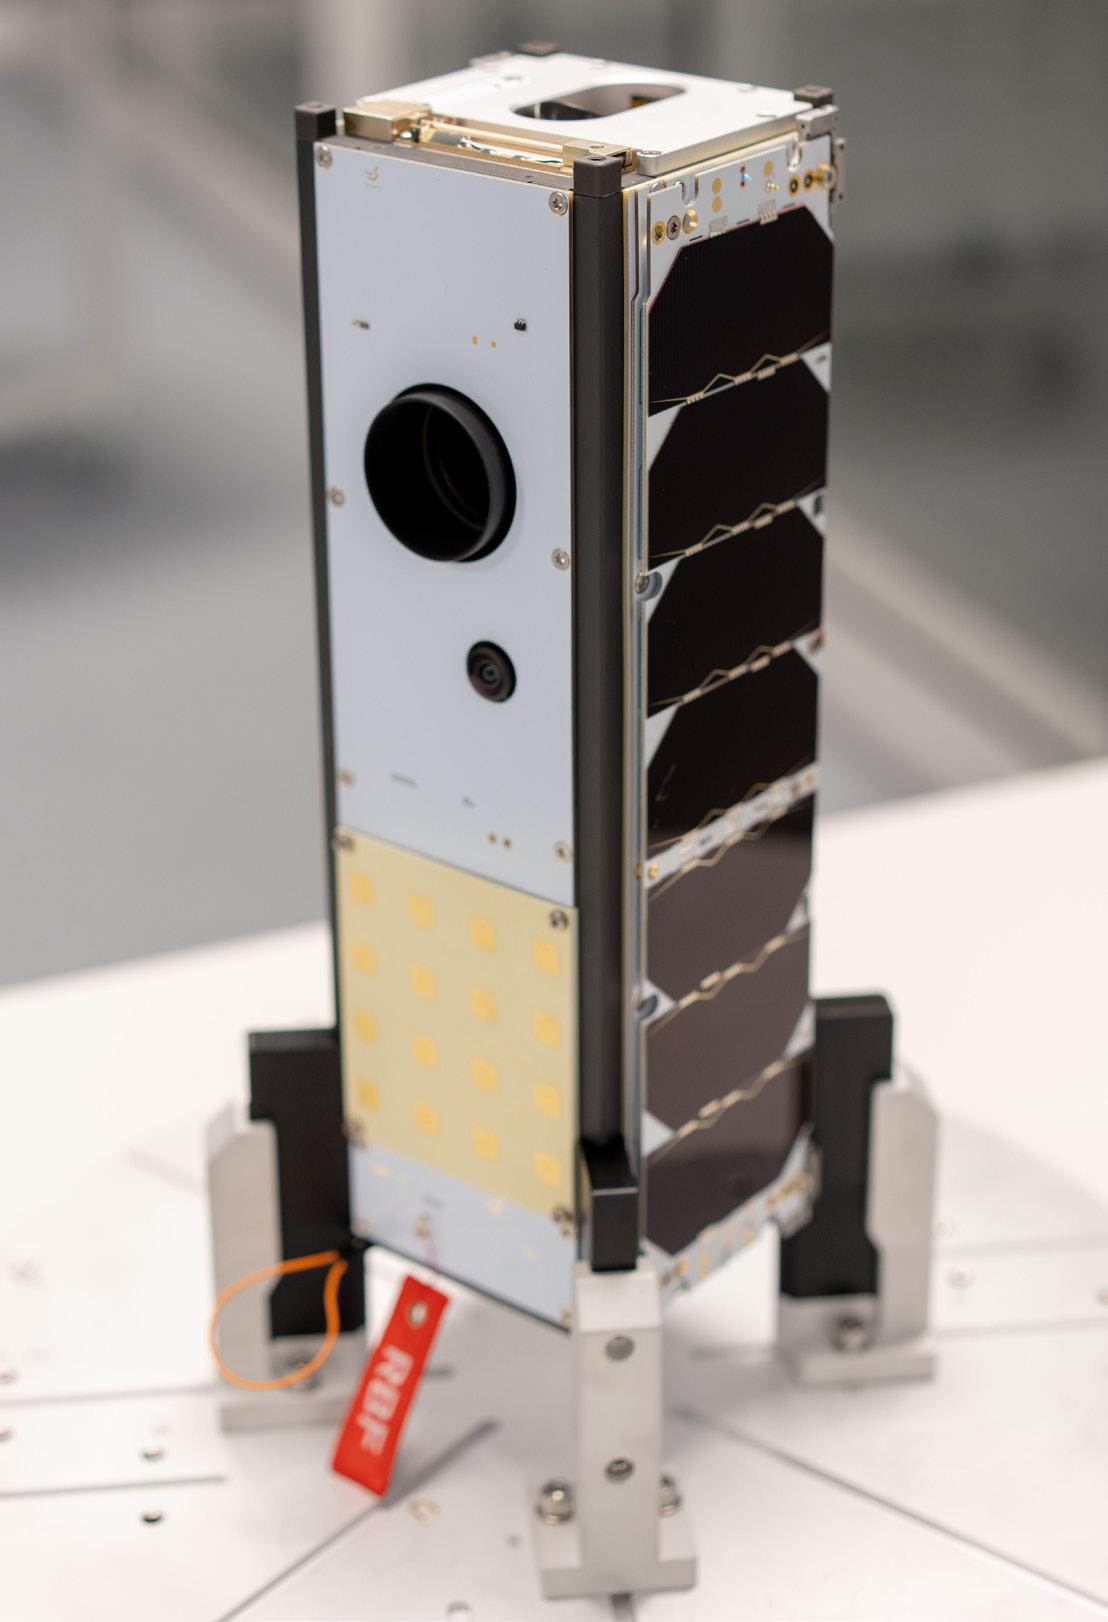
. What was the satellite’s payload and its intended purpose?
We had a Multi Spectral Camera. We designed it to work with a concept of operation that the spacecraft flies but any time it reaches Kenya, we turn on the camera. It then takes images and once it’s past Kenya, it charges its battery or sleeps.
Any time it passes over our ground station or a partners ground station, you are able to download the images that have been taken. Some people consider the radio module to be our payload but the camera was our main payload.
Can you explain the selection of the launch vehicle and launch site and why those decisions were made?
The factor of cost was an issue although not the primary factor. The launch vehicle was Falcon 9, Space X. This is because it is the main transporter to space. Also, they transport up to two times a month. They also provide right share missions whereby many satellites come together and are lifted at once. That helps to subsidize the cost of launch.
The launch schedules were also a determinant of the choices we made. Another factor was our destination orbit. Our destination orbit was the Sun synchronous orbit. Launching into a sun synchronous orbit uses the least amount of energy when you launch from the west coast. The west coast we found was in the United states from where Falcon-9 launches. All these factors working together sent us to launch with the Falcon-9 in the United States.
How did you collaborate with the international partners, if any, during the project?
We collaborated with Space- X for the launch services and Usually, we do so through launch brokers. The launch broker sits between you and the launch service provide because they are able to buy a slot in the launch vehicle, then they can sell you those slots.
The launch broker aggregates several satellites and adapts them to the launch vehicle. We also partnered with Endurosat (a satellite manufacturer) for training to be able to understand the process of satellite making and collaborated with the for the manufacturing process given that didn’t have the facilities yet. We also had local partners like The Kenya Space Agency who have played a big role in helping to train our engineers and also helping to set up our ground station.
What
was your experience on the launch day and what emotions did you go through?
Unfortunately, on the day of the launch I was unwell. However, we had gone through those emotions a number of times because the launch kept being postponed. Obviously, it was exhilarating that the satellite is going to space. It gives you a chance to do your mission and the first mission enables you to build up and progress to other missions. It was exciting for us as young engineers. It gave us strength to continue to work on other projects. We celebrate but had to get to work for the next mission.
What technologies or innovations were used in the satellite or launch that were particularly noteworthy or cutting-edge?
Our high-speed radio module is capable of communicating at a very high data rate. And for a satellite of that size, it is cutting edge. The speed at which it is communicating is reserved for bigger satellites with bigger radio modules but ours is very small but capable of communicating almost like a much bigger radio module.
The amount of redundancies we get to implement is also cutting edge. Again, the satellite is small but we find a way of implementing redundancies all across to ensure that we prevent cases of on subsystem bringing a problem to other subsystems. Usually, that is only done in much bigger satellites but we managed to fit all those into a smaller satellite.
How has the satellite’s data and findings from the satellite benefitted Kenya since its launch?
Well, as a technology demonstration mission, we are building on it to realize the local brand name. This is just the first step as we progress. The ground sampling distance, at around 32 meters, might not be very significant for applications that really bug us.
It would be good for monitoring forests, vegetation but not the best for doing urban planning or for security analysis etcetera.
So, this is just a first step. Also, given that it is just one satellite means that it cannot bring forth all the immediate fruits we want it to bring. It is an entry into what we want to deploy at the end of the day.
But that aside, being able to do the operations, to go through the launch and the commissioning process gives us a lot of the experience we want to build on and move on to build even a bigger constellation that can now realize things that people will identify as local brand. The benefits currently are good for the engineering team, to allow them to build on the next iterations until we can deploy a full constellation.
What are some lessons you and your team learnt during this project that will be beneficial in future missions?
We learnt that there are many interfaces as you work with different entities. There’s a lot of things that go in there that as an engineer you might not see. But we don’t have experts in these areas in the country and usually, we still have to step out of our comfort zones and establish some kind of knowledge on who to liaise with to make this possible. So, from this current mission, the process of coordinating a space mission is something we have learnt.
The part of handling the products that come from the satellite was also something we had to learn so that as we build the spacecraft, we know what the workflow will be once the products begin to arrive. We have also learnt a lot about the engineering development including Monitoring the satellite and verifying our designs which is our core business as engineers.
How do you see the role of satellite technology evolving in Kenya space program and its broader applications in the future?
Our researchers have to wait for the data from abroad. Sometimes they buy those resources and that’s a setback that they experience. We trail the west in scientific research because we are not capable of doing it at that level. That is one frontier that this space system could open for our local researchers.
Also, the moment you can develop systems that work in space, it is almost assured you can develop systems that can work in any other part of the world, be it systems you can take to war frontlines, or systems you can take to the harshest parts of the country to improve quality of life, you can build that.
So, we look at satellite project as something that once achieved can trickle down to other areas of the economy positively. And of course, the obvious ones which are that based on the images we get, we can improve our urban planning, improving our forest ecosystem, improving our agriculture etcetera. We are also looking into doing experiments with communication payloads which will help us open up some rural areas to remote communication. All these are benefits Kenya will get from satellite engineering.
Are there any upcoming satellite projects or space-related initiatives in Kenya that you are excited about or you are involved in?
When you say space-related projects, I think about students from JKUAT who are building rockets at a small level but they are really trying. For the satellite systems, yes, they are there and are very exciting but I have to wait for the agency to announce them. But there are some we are already taking part in which are very exciting, some we are partnering with other countries to do missions for Africa and they are exciting.
We are always working to improve our design so that any need that comes up, we can meet that need. We are also doing our designs with openness to customers who want to have support for their own missions.
How has the Satellite design and launch project contributed to your personal and professional growth as an Engineer?
Well, saa hizi ninasoma sana, there’s a lot of learning for me because I have to answer a lot of questions and provide solutions. Engineering is about problem solving, so we Engineers have to develop an empathy for the person who is suffering. We have to help the people beyond the level which they cannot help themselves.
We have become very versatile. We have also become people who can guide one another and support one another in achieving things that would not be easy to achieve. We have also been able to train other engineers and other students and ensuring that we are not the last people to do this.
Our team is always glad to know that there are young people who are in this. That’s why I mentioned the rocket project by students. We also have the university students that we work with to design their own satellites which from time to time they attempt to launch. It is exciting to see young people taking interest.
Young people are very creative. In the current times we up against Social media which tries to take the brains of young people and make money off of it. We are trying to establish a system where our young people can find purpose by giving them a chance to do something and think creatively.
What
We learn wherever we go. I am learning a lot, which is fantastic. I have gained hands-on experience with drones, 3D mapping, field work, article writing, surveys, and map customisation.
Do you have any words of advice for the young professionals out there?
Never underestimate your potential; your only limitation is yourself. So get out there and do your best wherever you are. Perhaps this is God’s method of testing you to determine if you are capable of handling the monumental task that he has in store for you.
Embarking on a geospatial journey unveils a world where data dances with the digital, and landscapes become living canvases of information. Geographic Information Systems (GIS), the architects of this digital terrain, have evolved into a dynamic force, seamlessly merging with the World Wide Web to create the captivating realm of Web GIS. Augmented Reality (AR), the enchantress of our digital interactions, steps onto this stage, turning the exploration of space into a visual symphony. From visualizing offside lines in football matches to Pokémon playfully inhabiting our daily reality, AR subtly intertwines with our lives. This article delves into the cutting-edge integration of Augmented Reality in Web GIS, where technology paints not just spatial landscapes but stories waiting to be discovered.
Real-world Integration
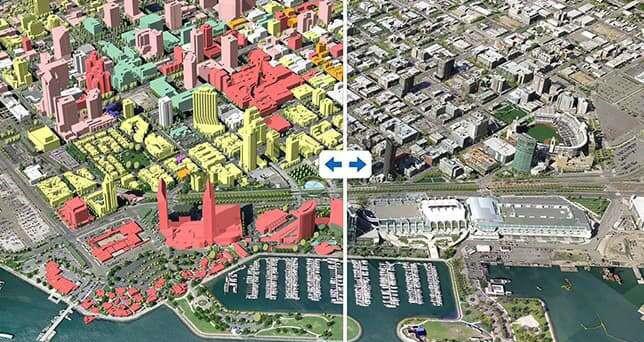
AR serves as a trailblazer by seamlessly overlaying digital maps and data onto the physical environment, transcending traditional spatial experiences. As you stroll through a city, envision real-time information not only illuminating historical landmarks on your smartphone but also providing immersive narratives about each monument’s significance. Imagine feeling the vibrancy of history, virtually stepping into bygone eras through AR-enhanced content that breathes life into the bricks and mortar around you. This not only enriches your understanding of the surroundings but also transforms a casual city walk into an engaging journey through time, where the past converges with the present in a captivating fusion of information and tangible reality. One exemplary application showcasing the real-world integration of AR in GIS is the “Urban Visualizer” developed by Esri.
Esri’s Urban Visualizer is a groundbreaking AR tool that allows users to superimpose proposed urban development plans onto the existing physical environment. This technology redefines how city planners, architects, and stakeholders interact with spatial data. Imagine standing at a vacant lot in a city and, through the lens of an AR device, witnessing a virtual representation of a proposed building or urban project seamlessly integrated into the real-world surroundings.
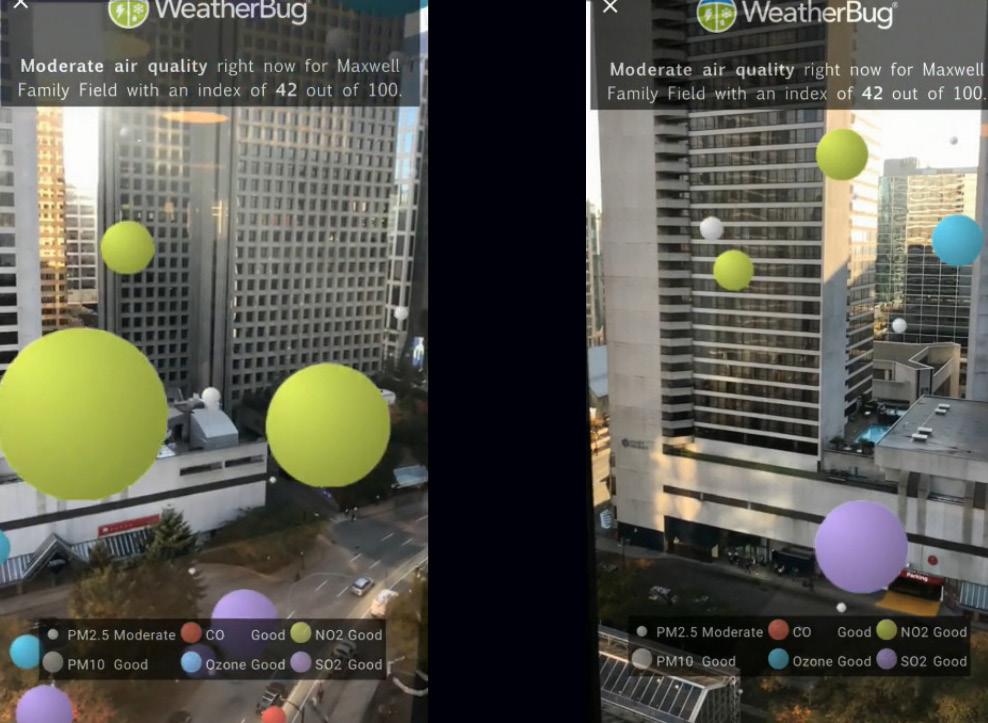
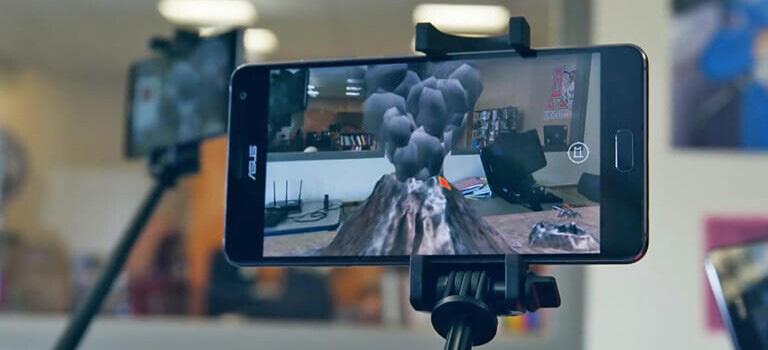
The integration AR with geospatial data empowers users with a dynamic and immersive visualization experience, transcending traditional interpretation methods. In the realm of environmental science, AR becomes a pivotal tool for visualizing pollution levels in real-time at precise locations. For instance, applications like Plume Labs’ “Air Report” and Amazon Sumerian “WeatherBug” utilize AR overlays to provide users with live air quality data directly in their surroundings.
By simply pointing their smartphones or AR-enabled devices, users can witness color-coded indicators representing air pollution levels, fostering a direct connection between data and the physical environment. This real-time visualization not only simplifies the interpretation of complex geospatial information but also equips environmental scientists and the general public with actionable insights for informed decision-making on conservation strategies.
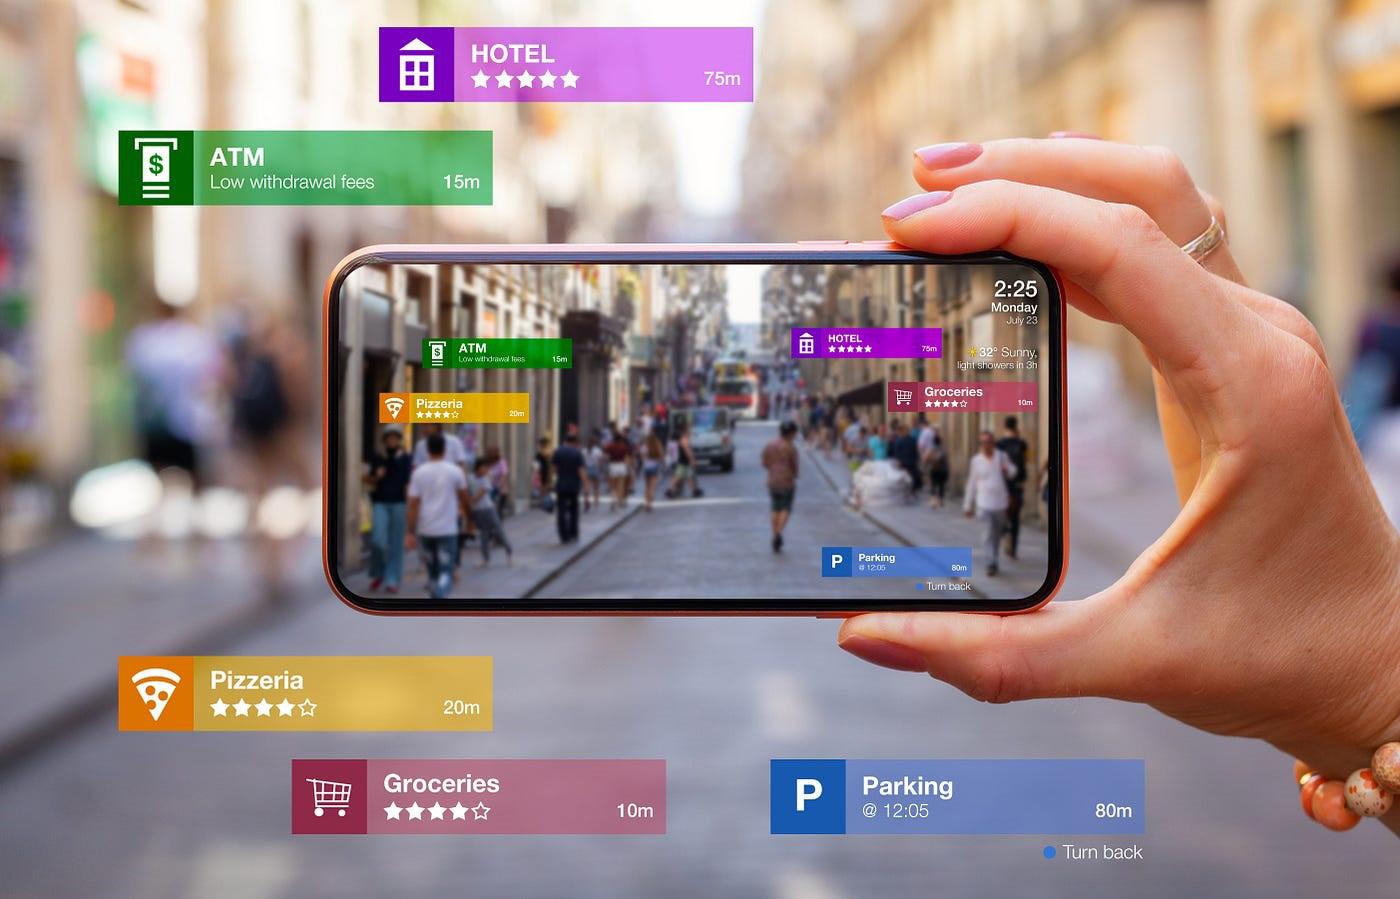
The convergence of Web GIS and AR gives rise to interfaces that transcend utility, becoming akin to trusted companions in uncharted territories. Imagine tourists navigating through unfamiliar cities, guided by AR-enhanced maps seamlessly integrated into their surroundings.
Applications like Google Maps’ AR navigation feature exemplify this fusion, providing users with real-time, visually intuitive directions overlaid onto the physical world. As tourists traverse streets, landmarks are highlighted, and turn-by-turn directions appear, creating a warm and familiar navigation experience. This not only simplifies the exploration of new locales but transforms navigation into an engaging journey, where every turn is accompanied by contextual information, enriching the overall travel experience.
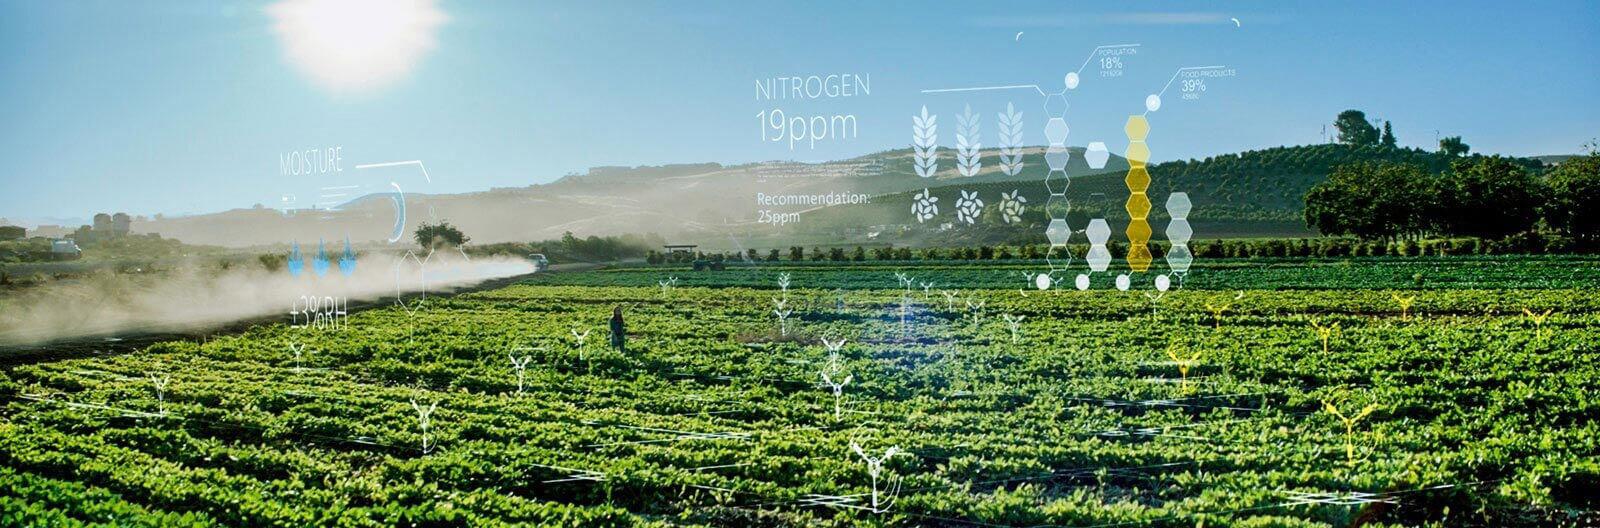
Field workers, armed with AR applications, transcend traditional data collection by immersing themselves in a digital tapestry of information. In agriculture, farmers adorned with AR glasses go beyond assessing crops visually; they become stewards of their land, making decisions that resonate with the rhythm of the seasons.
This immersive approach allows them to not only collect data but also feel connected to the heartbeat of their agricultural endeavors, fostering a more profound understanding of the intricate dynamics shaping their fields. For instance, companies like Microsoft’s “FarmBeats” utilize AR, computer vision, and IoT devices to empower farmers with real-time data on soil health, crop conditions, and environmental factors, facilitating informed decision-making for sustainable and efficient farming practices.
The collected field data seamlessly integrates into the vast canvas of Web Geographic Information Systems (GIS) platforms, forming a collaborative mural of our geographical narrative. Picture geological surveys where scientists, surrounded by the breathtaking beauty of nature, capture and visualize data that contributes to a shared geospatial heritage.
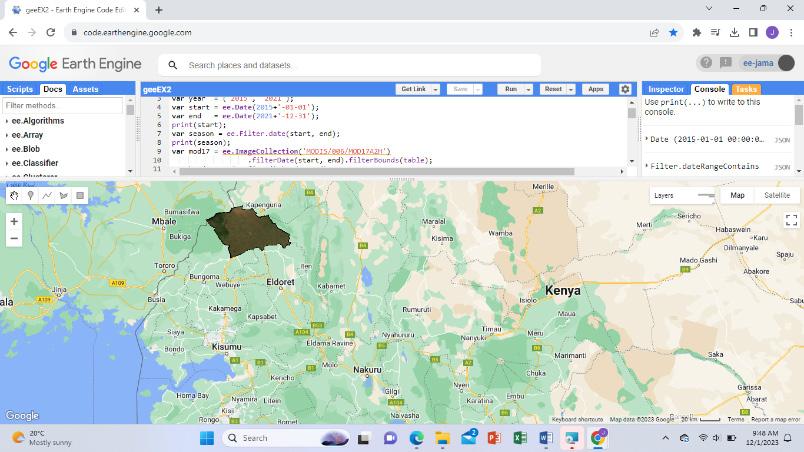
This integration goes beyond mere data points; it weaves together the stories of landscapes, creating a comprehensive tapestry that enriches our collective understanding of the Earth’s dynamic features. An example of this is the “Earth Engine” by Google, which combines satellite imagery, remote sensing data, and GIS capabilities to enable scientists to monitor and analyze changes in the Earth’s surface over time.
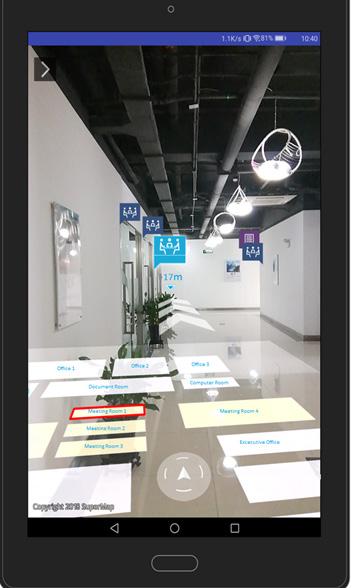
Navigating through expansive buildings, guided by the marriage of GIS and AR, feels like a dance through spaces that whisper stories. Imagine healthcare professionals moving seamlessly through complex medical facilities, becoming conductors of efficiency in patient care.
The fusion of GIS and AR not only provides directions but also enhances the efficiency and precision of movements in intricate indoor environments, revolutionizing how we navigate large structures. For example, companies like IndoorAtlas use AR for indoor navigation, helping users find their way within large buildings such as airports or shopping malls.
AR fosters not just collaboration but shared experiences in realtime. Urban planners, immersed in AR-enhanced environments, feel the pulse of the city they are shaping. Each decision resonates with the collective heartbeat of a community, turning the urban planning process into a dynamic, collaborative symphony where stakeholders contribute to the narrative of their city.
An example is the “CityEngine” by Esri, which allows urban planners to collaboratively visualize and simulate urban environments in real-time, facilitating shared decision-making processes.
In the realm of remote collaboration, users scattered across diverse physical locations feel the power of unity through shared AR-enhanced spatial environments. Corporate teams, digitally connected, collaboratively analyze and strategize, with each decision echoing across virtual landscapes.
This collaborative decisionmaking process transcends geographical boundaries, offering a seamless platform for teams to work together as if they were in the same physical space. Platforms like Spatial .io exemplify this by providing virtual collaboration spaces where users can interact with 3D models and data in real-time.
The fusion of Web GIS and AR transforms education into captivating journeys of discovery. Students exploring geography and environmental data interactively find themselves on a voyage of understanding.
AR facilitates virtual tours of historical sites, unlocking the secrets of our planet and turning lessons into immersive experiences that linger in the memory.
An example is the “Google Expeditions AR” app, which allows students to explore augmented reality versions of historical events and landmarks, bringing history and geography lessons to life.
Web GIS providing real-time data feeds to AR applications transforms the interaction into a continuous conversation with our planet. In weather forecasting, meteorologists visualize real-time weather patterns not as mere data points but as living, breathing entities.
This dynamic visualization impacts our connection with the environment, turning weather tracking into an immersive experience. Platforms like “Weather. com” utilize AR to provide users with real-time weather overlays, enhancing their understanding of weather conditions directly in their surroundings.
The fusion of Augmented Reality (AR) with Web Geographic Information Systems (GIS) transforms spatial data engagement. AR overlays digital maps onto the physical world, redefining interactions in urban planning and navigation, as seen in Esri’s Urban Visualizer and Google Maps’ AR feature.
Real-time insights, enhanced field data collection in applications like Microsoft’s “FarmBeats,” and collaborative experiences with platforms like Spatial.io highlight the dynamic impact.
Education evolves with AR in Web GIS through platforms like “Google Expeditions AR.” Continuous real-time updates, exemplified by “Weather.com,” enhance our understanding of spatial conditions. In navigating tomorrow, the synergy of Augmented Reality and Web GIS unlocks new dimensions in spatial exploration, blending innovation with unfolding stories.
Elevate your brand to new heights by aligning with Afrospatial Magazine, your gateway to the pulse of geomatics innovation worldwide! As we celebrate our inaugural issue, we are offering special advertising packages designed to boost your company’s visibility. Act now to unlock unique opportunities and connect with the global geospatial community.
Contact us today! +254 741 609234 or email us on marketing@afrospatial.com