THE OFFICIAL JOURNAL OF THE AUSTRALIAN INSTITUTE FOR NON-DESTRUCTIVE TESTING
RADIOGRAPHY ULTRASONICS EDDY CURRENT PENETRANT MAGNETIC PARTICLE
VIBRATION ANALYSIS LUBRICATION ANALYSIS THERMOGRAPHY ACOUSTIC EMISSION


THE OFFICIAL JOURNAL OF THE AUSTRALIAN INSTITUTE FOR NON-DESTRUCTIVE TESTING
RADIOGRAPHY ULTRASONICS EDDY CURRENT PENETRANT MAGNETIC PARTICLE
VIBRATION ANALYSIS LUBRICATION ANALYSIS THERMOGRAPHY ACOUSTIC EMISSION

November marks an important period for our Institute, I provide this update in the lead up to our upcoming Federal Council Meeting, to be held in Richmond, Victoria from 18–19 November, preceded by meetings of both the NDT Certification Board (NDTCB) and the Condition Monitoring Certification Board (CMCB) on 17 November. These meetings provide a valuable opportunity to progress several major initiatives that will shape the future direction, governance, and capability of AINDT.
The Certification Boards continue to play a crucial role in ensuring the integrity and global alignment of our certification schemes. Their work over the past year including the implementation of ISO 9712:2021, ongoing improvements to examiner qualification processes, database enhancements, structured credit clarifications, and strengthened procedural compliance, has been both extensive and essential. The upcoming board meetings provide the chance to consolidate recent improvements, address member feedback, and continue refining the systems that support our national certification framework. I would like to thank the Chairs and all board members for their dedication to this important work and look forward to productive sessions in Richmond.
This month’s Federal Council Meeting will be particularly significant as we progress discussions on the proposed revisions to the AINDT Constitution and supporting governance documents. The past two years have involved an independent governance review, extensive consultation, federal council deliberation, and the establishment of a Constitution Review Committee to guide the development of a modernised, transparent, and robust governance architecture. The proposed model is centred on clear role delineation, enhanced strategic alignment, stronger documentation, and improved procedural consistency, yet remains anchored in one of AINDT’s greatest strengths which is the Federal Council structure that ensures every state contributes directly to the direction of the Institute.
Alongside the constitutional work, revision of our Quality and Procedures Manual continues to progress, with recommendations to modernise, consolidate, and simplify the documentation that supports our certification operations. This work is essential for strengthening our governance, supporting future Certification Services Managers, and ensuring alignment with JAS-ANZ, ICNDT, and ISO 17024 requirements.
I would also like to draw members’ attention to two important opportunities currently open for Expressions of Interest. The first is the AINDT representative to ICNDT Working Group 1 (WG1). WG1 plays a vital role internationally in guiding the development of best
practice in qualification and certification, contributing to ICNDT Guides, and representing the collective interests of NDT societies around the world to provide support for harmonization in the qualification and certification of NDT personnel. This is an important position for AINDT, ensuring that Australia’s voice is present at an international level.
The second EOI invites members to join the newly forming Rail Industry Qualification and Certification Working Group, which will support the Certification Board in addressing long identified gaps between existing certification structures and the specific needs of the rail sector in Australia. Both opportunities provide meaningful avenues for experienced members to contribute expertise that will benefit Australian industry.
Across all these initiatives, it is essential to continue to recognise the outstanding efforts of our volunteers, branch councillors, certification board members, examiners, committee members, and countless others who give their time, energy, and professional expertise to strengthen our Institute.
We continue to see excellent technical evenings, state AGMs, and member engagement activities across the branches, reminders that AINDT’s strength lies with its people as much as its processes.
With substantial work ahead in governance, certification, and member engagement, the upcoming meetings in Richmond represent a pivotal point in our continued modernisation and growth. The collaboration and constructive discussions across the Federal Council and Certification Boards will help ensure that AINDT remains a strong, credible, and member focused organisation equipped to serve the industry for decades to come.
On a personal note, this may be my last message to you as Federal President as I approach the end of my second year in this role and my second term as President of the AINDT. It has been an honour to once again lead the Institute through a period of significant transition, challenge, and renewal. I am grateful to the Board of Directors, our CEO, the Federal Office, state branches, certification boards, and all our volunteers for their support and their unwavering commitment to strengthening AINDT and upholding the integrity of our profession.
Thank you for the privilege of working with you as President. I look forward to seeing many of you in Richmond and to supporting a smooth and positive transition into the next chapter for AINDT.
Joshua Morris, President Australian Institute for Non-destructive
Testing


President:
Secretariat
President
Vice

Production Sally Wood Design Alarna O’Connell
AINDT
PO Box 52, Parkville Vic 3052
P: (03) 9486 9267
www.aindt.com.au
E: federaloffice@aindt.com.au
ADVERTISING
AINDT Federal Office
P: (03) 9486 9267
E: sally@wordly.com.au
Manuscripts should be submitted in electronic form:
1. in word
2. typed with single spacing
3. with figures as tif or jpeg files at better than 300dpi
Manuscripts should include:
1. symbols and abbreviations conforming to recognised standards; metric units (SI)
2. references listed, after the text, in the order in which they occur in the paper
3. references indicated in the text by arabic numerals in square brackets
4. tables and figures numbered separately but consecutively with Arabic numerals and brief, descriptive titles
5. a reference in the text to all tables and figures
6. graphs and diagrams made with lines of sufficient thickness to reproduce well
7. titles and address of authors
Procedure for submission of manuscripts:
1. articles should be sent to: journal@aindt.com.au
2. manuscripts will be submitted to referees who will remain anonymous
3. reprints of each paper will be supplied free to the author
Published by:
The Australian Institute for Non-Destructive Testing, PO Box 52, Parkville, Vic 3052 Australia
ISSN: 2203-2940

Recently I had the opportunity to do a tour of a castings and foundry facility and saw firsthand the role NonDestructive Testing (NDT) plays in the production of components, mainly for defence equipment. The key take away I had was how testing using non-destructive methods ensures not just the safety of the pieces made but also their reliability and performance.
From a business perspective, I was taken by how NDT contributes significantly to cost efficiency and sustainability in the manufacturing process. Detecting defects early helps prevent expensive failures, unplanned downtime, and material wastage. It proved to me that Australia has the expertise to manufacture, albeit that the cost to do so continues to increase.
While much of the process I witnessed was bespoke, with individualised wax and ceramic models for each piece, the volume of technology and data used in the process was significant. There is so much chatting online and in the press about AI eradicating jobs, but my visit to this facility demonstrated that AI enhances increases the output of each employee.
Often in my role it is easy to focus just on the certification process. This makes it easy to forget the importance that NDT and CM play in making products, powering our nation, and ensuring our defence equipment is the best it can be.
It is my hope that I will be able to witness more of how NDT is used by end users as we look to engage with them more into the future.
The public would be forgiven for thinking that gas is on the way out (especially in Victoria). However, the announcements in 2025 from both governments and the private sector demonstrate that the sector is set to increase in the coming years.
In May, the Queensland Government announced that nine new areas will be open for both conventional and non-conventional gas opportunities. In October, the Queensland Government also released their Queensland Energy Roadmap which included an increase in domestic gas supply from 3.5 GW to 4.1 GW by 2030, and again to 6.1-8.3 GW by 2035.
In March, ExxonMobil Australia and Woodside Energy announced a final investment decision for the Turrum project in Bass Strait. This project is aimed at helping the predicted east coast gas shortfall in the coming years.
Santos’ Barossa Gas Project (located off the coast of the Northern Territory, not the wine region of South Australia) received final Federal Government environment approval this year to commence production. This project will feed the Darwin LNG facility and replace the Bayu-Undan supply.
Not long after the May 2025 Election, the Federal Government finally approved the extension of the Northwest Shelf. While this is currently being challenged by several environment activist groups it is more likely than not to continue and will help lock in long-term gas supply and export capacity for Western Australia.
There has also been some encouraging comments from the Premier of South Australia, Peter Malinauskas who stated at the Energy Nation Conference that: “The eco-purists that fill Instagram with screeds demanding an end to gas production should be careful what they wish for… If there's gas, this is the time to get it out of the ground… Without gas there is no firming of our electricity system.”
These comments, and the actions of other states, demonstrate that there will continue to be gas production for domestic and export use as well as for electricity generation into the foreseeable future.
Notable Changes With The Transition To ISO 9712:2021
With AINDT now having transitioned to ISO 9712:2021, I wanted to take this opportunity to clarify a couple of aspects to our certification system.
1. The Institute will no longer be issuing ‘Trainee Status’ letters for initial Level 1 and 2 applications. This is because exam results are now valid for five years from the date of the exam.
2. When renewing your Level 1 or 2 certification you have the choice of undertaking a practical exam or completing the Structured Credit System (SCS).
Should you choose to use the SCS, the general rule is that 95 of the 100 points required will be covered by your experience. The remaining five points can be awarded for being a member of an NDT Institute such as the AINDT (1 point per year).
Please be aware that this is in accordance with ISO 9712:2021 and not an additional requirement of the AINDT.
We will continue to communicate this to all certificate holders and the broader industry as it could be perceived that this is an attempt by AINDT to increase membership and revenue.
3. A key focus of ISO 9712:2021 is that when applying to renew or recertify that applications demonstrate five years of continued experience without interruption.
4. ISO 9712:2021 has seen some changes to the Visual Acuity Test. To provide a seamless pathway for future certification applications, the AINDT recommends that your company reviews their current procedure against the latest requirements.
The AINDT has been in contact with companies outlining this but would recommend that applicants check with their employer to ensure that their procedures are complaint and approved by the AINDT.

The Australian Institute for Non-Destructive Testing (AINDT) is seeking expressions of interest from members to represent the Association as a volunteer on the International Committee for Non-Destructive Testing (ICNDT) Working Group 1 (WG1) – Qualification & Certification.
The International Committee for Non-Destructive Testing (ICNDT) is a non-profit organisation dedicated to promoting the global development of NDT science and practice, working in collaboration with national and regional NDT societies. The ICNDT is a registered legal association based in Vienna, Austria.
Working Group 1 (WG1) brings together experts from ICNDT member societies to develop and recommend best practices in qualification and certification. WG1 contributes to the creation of ICNDT Guides, published documents, and conducts regular workshops on certification (typically held at World or Regional NDT Conferences).
Membership in WG1 is open to national NDT societies by application to the Group Chair.
The successful applicant will be responsible for keeping the AINDT BoD, NDTCB, and CMCB informed of all WG1 activities through written and verbal reports, both before and after WG1 meetings to ensure AINDT’s interests and perspectives are effectively represented.
Prior to each WG1 meeting, all pre-meeting documentation (e.g., agendas and related materials) must be forwarded to the AINDT CEO, who will coordinate input and guidance from the BoD and certification boards, including direction on voting or discussion points as required.
WG1 typically meets at least once annually, generally in conjunction with international technical conferences. The appointed representative will be expected to attend these meetings and represent AINDT in person.
Applicants must:
• Be a current financial member of AINDT.
• Possess extensive knowledge of AINDT’s certification processes in accordance with ISO 9712, ISO 18436, and ISO 17024.

• Be a current AINDT committee member or active branch councillor with a sound understanding of AINDT policies, procedures, and governance processes.
The appointed representative will report directly to the AINDT Board of Directors (BoD) and both the NDT Certification Board (NDTCB) and Condition Monitoring Certification Board (CMCB).
• Reasonable travel expenses will be reimbursed following each meeting in accordance with AINDT’s expense claim procedure and upon submission of relevant receipts.
• All travel must receive pre-approval from both the AINDT CEO and the AINDT BoD.
To submit an Expression of Interest, please email a current CV and a cover letter outlining your eligibility and suitability for the role to:
Stuart Norman
Chief Executive Officer, AINDT stuart.norman@aindt.com.au

The Australian Institute for Non-Destructive Testing (AINDT) is seeking expressions of interest from members to work collaboratively together with other members of the AINDT to form a Working Group to assist and provide guidance for the Rail Industry in Australia relating to Qualification & Certification in the field of NDT.
The Working Group will assist the Certification Board to develop the required framework to allow people employed in the Rail Industry to develop skills and a certification framework relating to the specific aspects of the Rail Industry in Australia.
There is currently a gap between what is required in the Industry and what Certification is suitable for application for the Rail Industry.
The Working Group will work together to develop the necessary pathway that will allow Rail Industry members to achieve the appropriate level of qualification and competency to support the numerous organisations that provide fabrication and maintenance support for the Rail Industry in Australia.
This working group will be entirely voluntary with a view to meet periodically to discuss strategy to develop a plan to formulate recommendations and develop solutions to address the issues currently facing the industry. The group will then assist the Certification Board to implement the framework into the current suite of certifications offered and supplied by AINDT that will specifically address Rail requirements.
To submit an Expression of Interest, please email a response outlining your reasons for applying for the role to:
Stuart Norman Chief Executive Officer, AINDT stuart.norman@aindt.com.au


The Australian Institute for Non-Destructive Testing (AINDT) wishes to advise that the AINDT Summit, originally scheduled for 18–20 November 2025, will now be held on 20–22 April 2026 in Newcastle, New South Wales.
This decision follows extensive feedback from members, service providers, and industry partners indicating that November was not the most suitable time for maximum participation. By moving the Summit to April 2026, we aim to create a stronger, more accessible event that better supports the needs of our members, sponsors, exhibitors, speakers, and delegates.
We understand that this change may cause inconvenience and sincerely apologise for any disruption. However, we are confident that the new dates will allow us to deliver an even more valuable program of technical presentations, exhibitions, workshops, and networking opportunities.
All existing sponsorships, exhibition bookings, and delegate registrations will automatically transfer to the new dates.
We are working to ensure the transition is as smooth as possible for all delegates.
In recognition of your commitment, and to ensure fairness across all registrations:
• All registrations will automatically transfer to the new April 2026 dates. If you registered at the full rate, rather than the early bird rate, AINDT will refund you the difference. This way, all delegates will benefit from early bird pricing.
• If you are unable to attend the new dates, you may request a full refund of your registration.
We want every delegate to feel valued and supported, and we are confident the April 2026 Summit will deliver even greater value through its program, networking, and industry engagement opportunities.
The Summit theme, “The Power of Inspection”, remains unchanged, and AINDT is committed to ensuring that the event reflects the highest standards of technical excellence, industry engagement, and professional development.
We thank all members and stakeholders for their continued support and look forward to welcoming you to Newcastle in April 2026 for a world-class Summit experience.
For further information, contact: federaloffice@aindt.com.au
Preparations are well underway for the AINDT Summit 2026, to be held in Newcastle, New South Wales, from 20–22 April 2026.
With around half of the exhibition booths already sold and a strong lineup of sponsors confirmed, momentum is building for what promises to be a standout event for the non-destructive testing (NDT) and condition monitoring (CM) community.
The Summit is designed to bring together key decisionmakers, senior professionals, and technicians from across the NDT and CM fields. Whether you’re a seasoned practitioner or looking to expand your technical knowledge, the program will deliver diverse opportunities for learning, collaboration, and professional growth.
Across multiple rooms and concurrent sessions, delegates will experience a rich mix of technical presentations, workshops, and panel discussions. This year’s program will feature interactive forums with the AINDT Certification Boards and the Board of Directors, inviting open conversation about the direction of our industries over the coming decade.
While the educational component is central to the Summit, there will also be plenty of time to network and reconnect with peers. Between sessions, delegates can mingle at Newcastle Town Hall, explore the bustling exhibition space, or join one of several social events planned throughout the three days.
The event will officially commence with a Welcome Reception in the exhibition hall on Monday 20 April at 6.00 pm, providing a relaxed opportunity to meet fellow delegates, exhibitors, and sponsors. On Tuesday night, 21 April, the highly anticipated Gala Dinner will celebrate excellence in our profession and honour those who have made outstanding contributions to the Institute and the wider NDT community.

For those eager to keep the celebrations going, a Gala Dinner After Party will follow at a nearby licensed venue—open to all delegates and guests free of charge (drinks at bar prices). Expect plenty of networking, music, and sponsor giveaways to carry the camaraderie well into the evening. Additional tickets for both the Welcome Reception and Gala Dinner can be purchased via the Summit website.
This year’s theme, The Power of Inspection, explores the concept of power both as a generative force— driving progress, energy and innovation—and as the detailed insight that inspection provides into the integrity and performance of critical assets. As part of the program, AINDT invites researchers, practitioners, and innovators to submit original papers showcasing new developments, technologies, or case studies that advance our industry’s understanding.
A reminder that, following extensive consultation with members and industry stakeholders, the Summit has been rescheduled from November 2025 to April 2026 to ensure maximum participation. All existing registrations have automatically transferred.
Early bird registration is now open, offering significant savings for those who book early. To secure your place, visit the Summit website: aindtevents.eventsair.com/ aindt-summit-2025/register.
Join us in Newcastle this April to celebrate The Power of Inspection—three days of innovation, insight, and industry connection that you won’t want to miss.

2025
The AINDT is a national peak body that promotes the professional practices of non-destructive testing and condition monitoring personnel. Our mission is to provide members, industry and the community with independent and professional service in relation to the science and practice of non-destructive testing.
Through the work of our state branches and federal office, AINDT is committed to fostering a community of professionals and organisations dedicated to the fields of non-destructive testing, engineering, and materials and quality testing.
We offer a tiered membership structure, inviting businesses to enhance their professional standing and industry influence by becoming a Company, Corporate, or Sustaining member. Our memberships unlock a suite of benefits, including marketing opportunities, heightened support, streamlined staff certification management, and much more. AINDT would like to thank the companies below for their valued support.
SUSTAINING MEMBERS
ATTAR
D R May Inspections
EnerMech
SRG Industrial Pty Ltd
Intertek
SUPPORTING MEMBERS
Chevron
COMPANY MEMBERS
NSW
ARL Laboratory Services Pty Ltd
(Yennora)
AXT Pty Ltd
Barry Evans Lifting World
Bluescope Steel (Port Kembla)
ENDETEK
Hot Engineering
HVT Inspection Services
Magnetic Analysis Aust Pty Ltd
NBQC & Inspections Services
NDT Equipment Sales Pty Ltd
Nobel Engineering Services
Reliance Hexham
RPG Australia
Russell Fraser Sales Pty Ltd
Simplifi Nii P/L
SmartChem Industries Pty Ltd
Sonix NDT Pty Ltd
Thermal Imaging Services (AUS)
QLD
AXS Pty Ltd (Mackay
MEMBERS
Azure NDT Quality Services Pty Ltd
Bureau Veritas Australia
Chemetall (Australasia) Pty Ltd
Evident Australia Pty Ltd
GFS NDT
Hofco Oilfield Services
IRISNDT
OMS Engineering Pty Ltd
SafeRad SE Asia Pty Ltd
School of Engineering
TR Pty Ltd
Equipment Direct International Pty Ltd
Industrial Mining Inspection Solutions
International Tube Testing Pty Ltd
Metal Testing Pty Ltd
M-Test Mackay Pty Ltd
Queensland Alumina Limited
Testing Inspection and Calibration Services
ABEN Technical Services
ATCL
Defence Science and Techology Organisation (DSTO – Fishermans Bend)
Gippsland NDT Services Pty Ltd
Global Inspections & Engineering Services Pty Ltd
ITest NDT
LMATS Pty Ltd (Williamstown)
NATA
OMS Software Pty Ltd
SA / NT
ASC Pty Ltd
Kuzer Technical
QMS
Red Earth NDT Pty Ltd
WA
Alliance Solutions Group
Applecross Electrical & Testing Service
Asset Reliability Inspections Pty Ltd
Assurity NDT & Consulting
GoldFields NDT
Hofmann Engineering
ICM Training Solutions
Integrity Engineering Solutions
MJ Engineering Inspection Services (Welshpool)
NDT Instruments Pty Ltd
Vertech
Optiflow Pty Ltd
Portable Scientific Pty Ltd
Weld Integrity
Wood – Asset Performance
Optimisation
I would like to take this opportunity to thank Barry Cooper for his stabilising influence over the past few years as the AINDT Non-Destructive Testing (NDT) Certification Board (CB) Chairman.
As Barry has stepped down as Chairman there has been a change in the makeup of the AINDT NDT CB; the beginning of a new chapter if you will, with eight new members joining the Board for a total of 15 members.
I wish to welcome the following new AINDT NDT CB members: Mark Boot, Andrew Wright, Mathew Lee, Roger Lumley, Shane Norman, Adam Ball, Adrian Chetty and Timothy Wiggins. These new members are from a wide variety of industry sectors and will bring significant insight and depth to the Board to support the AINDT into the future.
With ISO 9712:2021 now in full effect, I would like to remind everyone to please take some time to familiarise yourself with the requirements, and plan your renewals or recertifications. If you choose the Structured Credit System (SCS) for renewals, getting all your documents and evidence together prior to submission can really help. A complete application can result in a swift turnaround. Incomplete applications can cause delays and can, in extreme cases, result in period’s where certification has expired before it is renewed or recertified.
It may appear daunting the first time you attempt the SCS, but please reach out to the Certification Service team at the Federal Office if you need assistance in understanding the requirements.
For most Technicians at Level 1 and 2, that choose the SCS, claiming points under option A.1 “Performance of NDT activities” could be the best way to gain up to the maximum of 95 out of the 100 points required. All you need to provide is evidence of your activities, and you are 95% complete. This equates to evidence of only 10 days of NDT activities, per year, over the past five years. The Certification Division in the Federal Office is there to assist you through the process.
Part of the NDT Certification Board’s duties is to take a proactive role in the development of new industry sectors where a demonstrated need is evident and to ensure a clear focus on improvements to the scheme.
To this end, I would like to announce some coming changes. These additions and changes have been in the works for some 12 to 18 months and longer. These have been waiting until the AINDT achieved the ISO 971:2021 approval from JAS-ANZ and can now be unveiled.
Some of the changes coming include the following:
Direct Access to CR/DR RT
This change was requested by technicians and industry. The current prerequisite is holding an RT 2 certification. Technicians that want CR/DR radiographic certification are required to hold a film based radiographic certification to be eligible. In more and more cases, CR/DR Radiography is the only certification some technicians need as industry adopts more Digital Radiographic options for inspections.
The removal of the RT2 prerequisite will result in an adjustment to the required training hours needed for CR/DR to allow a direct route.
Prerequisites
This change is in response to the ambiguity around Radiation Safety Training and Radiography Training. This has been expressed by many sectors of the NDT industry for quite some time. This will align the AINDT completely and unambiguously with ISO 9712 around not including Radiation Safety Training as part of Radiographic Training.
A different syllabus, ISO TS 25107 RT 1F/D will replace the current EA 612 as specified in Note 6 in section 3.8 of the Guide to certification. The AINDT is not offering RT 1 Certifications at this time. However, it should be noted that the training hours for certification to Level 2 include the training hours required at Level 1.
It should be made explicitly clear, that this change does not in any way diminish individuals or company requirements around compliance with Radiation Safety Training and Licensing to operate Irradiating Apparatus or Sealed Sources to state / territory radiation licencing regulatory requirements.

This new PAUT sector is in direct response to in industry need for its addition to the scheme. Having this sector for PAUT allows technicians who exclusively perform corrosion mapping work be trained and certified in this sector without the need for certification in UT 2 Welds, as this is prerequisite to PAUT Level 2 MS. The prerequisite to PAUT Level 2 CDM certification will be UT2 CDM. PAUT MS will remain a sector.
This new certification has been asked for by multiple industry sectors including oil and gas, mining, defence and many more over the past 18 months in growing numbers.
This advanced ultrasonic method is remarkably different to conventional ultrasonic methods. It has been highlighted as a method where the benefits of certification for operators used in its deployment is becoming increasingly apparent. The AINDT shall monitor this new certification for take up, and if the welds sector is relevant, or if other sectors are required or applicable.
This new endorsement will be similar, in how it may be obtained, to the current Nozzle and Node weld geometry endorsements. This will be a useful certification endorsement for technicians to show they have been independently examined on the ultrasonic inspection of these challenging welds.
In addition, clients and end users of NDT that rely on the AINDT certifications will have increased confidence in the technicians that perform these inspections where they have this endorsement.
I genuinely look forward to a bright future with the new, reinforced, Certification Board. Finally, to all those that have, and continue to work tirelessly in the background at all levels within the AINDT, and to all our partners, thank you.
Regards,
Mark Welland AINDT NDT Certification Board Chairman
Unlock the future of your career with top-tier condition monitoring training from trusted providers.
These training centres have earned the endorsement of AINDT, aligning perfectly with the national syllabi approved by the AINDT Certification Board. This ensures that you receive the highest standard of education and training.
To maximise your learning experience, AINDT recommends obtaining a copy of the training module—either directly from the training provider or by downloading it from the AINDT website. This will ensure you are well-prepared for your course.
For those seeking certification, it's crucial to successfully complete the specified training program and required training hours outlined in ISO18436. This is essential for achieving certification in your desired conditioning monitoring method, category, and industry sector. All examinations are conducted by the AINDT. For exam dates and further details, please contact AINDT via: federaloffice@aindt.com.au.
Elevate your skills and advance your career with the industry's best training and certification programs.
Victoria
Industrial Precision Instruments
A: Unit 12, 634-644 Mitcham Road, Vermont 3133
T: 1300 781 701
E: training@ipi-inst.com.au
W: ipi-inst.com.au
IR Technology Australia
A: 39-45 James Street, Lara 3212
T: 0418 569 698
E: erik.t@bigpond.com
W: irta.com.au
University of Melbourne
A: Parkville 3010
T: 03 9810 3348
E: claudine.evans@unimelb.edu.au
W: unimelb.edu.au
Wood – Asset Performance Optimisation
A: Level 3, 171 Collins Street, Melbourne 3000
T: 08 6314 2000 or (08) 6314 2280
E: svt.bu.training@woodplc.com
W: woodplc.com
Western Australia
ICM Training Solutions
A: 45 Delawney Street, Balcatta 6021
T: 0419 993 233
E: rainingacademy@icmt.com.au
W: icmt.com.au
SRG Training Academy
A: 109 Bannister Road, Canning Vale 6155
T: 08 9232 0300
E: trainingacademy@srgglobal.com
W: srgglobal.com
Wood – Asset Performance Optimisation
A: Level 1, 240 St Georges Terrace, Perth 6000
T: (08) 6314 2000 or (08) 6314 2280
E: svt.bu.training@woodplc.com
W: woodplc.com
Queensland
Advanced Infrared Resources Australia AIRA
A: PO Box 372, Hervey Bay 4655
T: 0467 565 836
E: jeff@irtau.com.au
W: irtau.com.au
Machinery Diagnostics Institute
A: 16 Wheeler Avenue, Gracemere 4702
T: 0499881 294
E: training@mcsturbo.com
W: mdiaustralia.com
SRG Training Academy
A: 7 Brisbane Road, Riverview 4303
T: 07 3816 5500
E: training@mcsturbo.com
W: mcsturbo.com
Wood – Asset Performance Optimisation
A: Level 20, 127 Creek Street, Brisbane 4000
T: (08) 6314 2000 or (08) 6314 2280
E: svt.bu.training@woodplc.com
W: woodplc.com
AQBs are authorised to offer AINDT-approved training and initial and recertification examinations in any Australian state, at any time throughout the year.
The AINDT also conducts scheduled examination rounds twice yearly, with dates advertised in The Industrial Eye and the AINDT e-newsletter.
While the AINDT strives to notify certificate holders of impending certification expirations, it remains the responsibility of the certificate holder to initiate the renewal and recertification process before their certification expires. Please note that late fees apply to overdue certification applications.
South Australia
Kuzer Technical
T: 1300 199 086
E: info@kuzer.com
W: kuzer.com
NDT methods, levels, and industry sectors offered:
• Magnetic Particle Level 1, 2 and 3 Multisector (ISO 9712)
• Dye Penetrant Level 1, 2 and 3 Multisector (ISO 9712)
• Ultrasonics Level 1, General Engineering (ISO 9712)
• Ultrasonics 2 and 3 Welds (ISO 9712)
• Phased Array Level 2 and 3 Multisector (ISO 9712)
• Time Of Flight Diffraction Level 2 and 3 Multisector (ISO 9712)
• Radiographic Testing Level 2 and 3 Welds (ISO 9712)
• Visual Testing Level 1 and 2 Multisector (ISO 9712)
• Eddy Current Level 1, 2 and 3 Multisector (ISO 9712)
• Level 3 Basic Exam Prep (ISO 9712)
• OCTG drill pipe inspection
• Material Science in NDT – Multisector
• NDT for Managers & Engineers
• Radiation Safety (exceeding the syllabus of national module EA612)
Victoria
ATTAR
T: 03 9574 6144
E: training@attar.com.au
W: attar.com.au
NDT methods, levels, and industry sectors offered:
• Computed and Digital Radiography 2, 3
• Ultrasonic Testing 1,2,3 Welds, Casting, Wrought,
• Aerospace, Thickness
• Radiographic Testing 2,3 Welds, Casting, Aerospace
• Magnetic Particle Testing 1,2,3 Multisector, Aerospace
• Penetrant Testing 1,2,3 Multisector, Aerospace
• Eddy Current Testing 2,3 Multisector, Aerospace
• Magnetic Flux Leakage 2
• Tank Bottom Testing
• Phased Array levels 2 and 3 Ultrasonics 2 Multisector
• Visual/Optical Testing 2 Multisector
• Time of Flight Diffraction (TOFD) levels 2 and 3 Welds
• Heat Treatment
• ISO 9712 UT Level 2 Corrosion/Erosion Detection and Mapping (CDM)
Western Australia
ATTAR
T: 03 9574 6144
E: training@attar.com.au
W: attar.com.au
NDT methods, levels, and industry sectors offered:
• Computed and Digital Radiography 2, 3
• Ultrasonic Testing 1, 2,3 Welds, Casting, Wrought,
• Aerospace, Thickness
• Radiographic Testing 2,3 Welds, Casting, Aerospace
• Magnetic Particle Testing 1,2,3 Multisector, Aerospace
• Penetrant Testing 1,2,3 Multisector, Aerospace
• Eddy Current Testing 2,3 Multisector, Aerospace
• Magnetic Flux Leakage 2
• Tank Bottom Testing
• Phased Array 2, 3 Ultrasonics 2 Multisector
• Visual/Optical Testing 2 Multisector
• Time of Flight Diffraction (TOFD) 2, 3 Welds
• Heat Treatment
• ISO 9712 UT Level 2 Corrosion/Erosion Detection and Mapping (CDM)
SRG Training Academy
T: 08 9232 0300
E: trainingacademy@srgglobal.com
W: srgglobal.com
NDT methods, levels, and industry sectors offered:
• Ultrasonic Testing 1,2 Welds
• Magnetic Particle Testing 1,2 Multisector
• Penetrant Testing 1,2 Multisector
• Phased Array Ultrasonic Testing 2 Multisector
Queensland
Protecs Global
T: 07 3492 9213
E: hamed.madani@protecsglobal.com.au
W: protecsglobal.com.au
NDT methods, levels, and industry sectors offered:
• Ultrasonic Testing 1 ( General Engineering) 2 Welds
• Magnetic Particle Testing, 2 Multisector
• Penetrant Testing, 2 Multisector
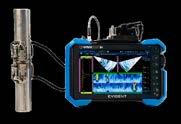
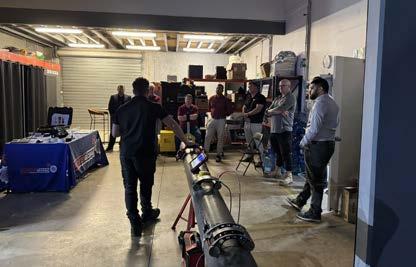
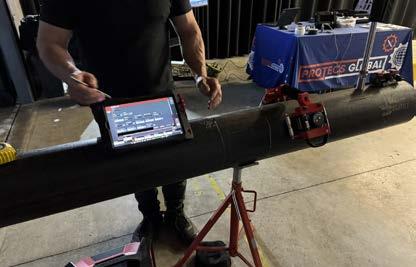
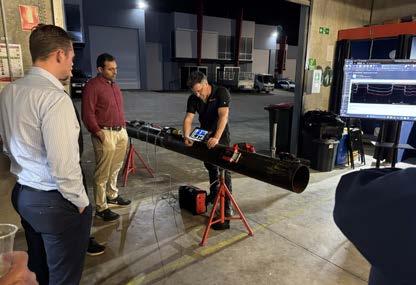
The AINDT Queensland Branch recently hosted a highly successful technical demonstration event at the Protecs facility in Brisbane, bringing together members and industry professionals for a hands-on exploration of Long Range Ultrasonic Testing (LRUT) technology.
Facilitated by Innerspec Technologies, the event provided attendees with an in-depth look at the latest innovations in long-range ultrasonic inspection — a technique used for screening large sections of pipelines and structures for corrosion, erosion, and other defects without the need for full access or insulation removal.
The live demonstration highlighted the practical applications, advantages, and limitations of LRUT in real-world scenarios. Participants observed how the technology enables efficient inspection of otherwise inaccessible areas, significantly reducing downtime, safety risks, and associated costs.
Innerspec’s team of experts guided attendees through the technical principles behind guided wave propagation, signal interpretation, and data analysis. The session also covered recent advancements in sensor design, data acquisition systems, and software analytics, which are enhancing the sensitivity, range, and reliability of long-range ultrasonic inspections across sectors such as oil and gas, mining, and infrastructure.
The event fostered valuable discussion among participants, who shared insights and experiences from the field, reflecting AINDT’s commitment to ongoing professional development and the exchange of practical NDT knowledge.
AINDT extends its sincere thanks to Innerspec Technologies for facilitating the demonstration, and to Protecs for providing their facility and support. Appreciation also goes to all members and industry guests who attended and contributed to making the event such a success.
As the NDT industry continues to evolve, events like this remain crucial in keeping professionals at the forefront of emerging technologies and inspection methodologies.
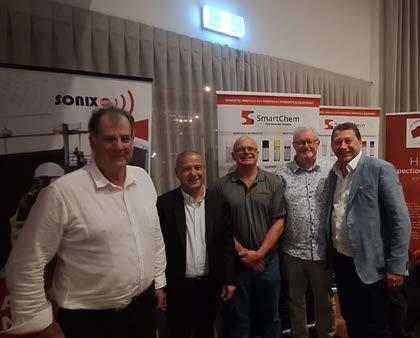
The AINDT South Australia Branch recently held its Annual General Meeting (AGM) at Little Bang Brewing Co. in Stepney. While attendance numbers were a little lower than hoped, those who joined enjoyed a relaxed evening of conversation, networking, and local craft beer in a welcoming atmosphere. The event provided a valuable opportunity for members to reconnect, exchange ideas, and discuss the direction of NDT in South Australia.
A key highlight of the evening was the confirmation of the new branch office bearers for the year ahead.
The AINDT SA Branch extends its congratulations and appreciation to the following elected representatives:
• President: Tyson Jenke
• Vice President: John Greig
• Treasurer: Hanz Zuidland
• Secretary: Nick Hart
• Councillors: Luke Jones, Matt Hobbs, Michael Nichol, Davis Suade, Tim Wiggens, Leroy Daniels, Aaron Lotstra, and Daniel Bryan
The newly appointed committee brings together a strong mix of experience and fresh perspectives, all dedicated to supporting the continued growth and engagement of the South Australian NDT community.
Upcoming Technical Night
Looking ahead, the branch is excited to announce its upcoming Technical Night, to be held on Wednesday, 26 November 2025, from 5.30pm to 7.00pm at NDE Solutions, 61A Bacon Street, Hindmarsh.
This event will feature a live, in-person demonstration of the Voliro Aerial NDT/ LPS Robot, an innovative drone technology redefining inspection in hard-to-reach areas. The session will be facilitated by two Chief Drone Pilots, offering attendees an exclusive opportunity to see aerial inspection robotics in action and gain insight into the future of non-contact testing and lift-off potential systems (LPS).
AINDT SA encourages all members—new and existing— to attend, reconnect, and continue building the strong professional community that underpins our industry’s success.
The Victorian and Tasmanian Branch has enjoyed a productive few months, marked by strong participation across technical and social events, renewed council engagement, and a growing emphasis on wellbeing and collaboration within our NDT community.
2025 AGM and Branch Council Elections
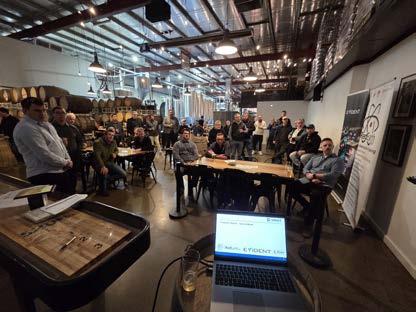
Our 2025 Annual General Meeting was held on 5 September 2025 at Brewmanity Brewery in South Melbourne, attended by more than 40 members, partners, and guests. The evening combined formal proceedings with an enjoyable networking atmosphere.
Special thanks go to our Gold sponsors, Evident and NATA, and Silver sponsor, LMATS Pty Ltd, for their continued support. Congratulations to all the award recipients recognised for outstanding examination results and professional achievements, and to all members who contributed to another successful year for the branch.
The new Victorian Branch Council for 2025–2026 was announced on the night:
• President: Miro Katouzi
• Vice President and Secretary: Peter Milligan
• Treasurer: Samad Asghary
• Past President: Paul Trigg
• Councillors: Pranay Wadyalkar, Glen Haberl, Darryl Pierce, and Sadegh Abbaspour
The meeting also acknowledged the dedication of outgoing councillors and the late Neil Joiner, whose contribution to the NDT community remains deeply valued.
The AINDT Victoria Branch recently hosted a special online technical night, bringing together professionals across the country to engage in a vital conversation: Mental Health in the NDT Workplace. With the nature of Non-Destructive Testing involving shift work, site isolation, safety-critical decisions, and high pressure, the mental wellbeing of professionals is no longer a side conversation—it’s a necessity.
Attendees were privileged to hear from Matt Glover, a leading counsellor, author, and director of MGA Counselling; and Cam Semmens, an experienced speaker and mental health trainer known for his humancentred approach to communication. Together, they tackled the silent pressures often felt across technical industries.
Matt’s session, deeply grounded in both personal counselling experience and organisational consultancy, encouraged leaders to lead by example and normalise conversations around stress, burnout, and emotional fatigue. “We often focus on physical safety, but ignore the psychological strain that can cause just as much harm,” he noted.
• Mental Health in High-Risk Roles: Recognising stress and burnout in inspections, site work, and safetycritical jobs.
• Impact of Isolation and Shift Work: Understanding how rosters and remote locations affect mental wellbeing, and how to stay connected.
• Creating Mentally Healthy Workplaces: Empowering leaders to foster a culture of openness and reduce stigma.
• Recognising the Signs: Equipping supervisors and peers to identify and respond when someone is struggling.
• Psychological Safety in Safety Cultures: Making mental health a core component of any safety program.
The session was more than theory. It was a candid, realworld discussion. Matt Glover highlighted how burnout, chronic stress, and emotional fatigue often go unnoticed in NDT environments, yet quietly erode productivity and morale. The emphasis was clear: leadership sets the tone.
Among the most powerful takeaways was the proposal to incorporate self-care KPIs into job descriptions,

placing equal priority on physical, mental, and emotional wellbeing. ‘Taking your leave, staying connected with your children, or maintaining a sleep routine should be recognised as professional strengths,’ Matt said.
Participants discussed how to build psychologically safe teams, where leaders model vulnerability and check in without judgment. From embedding mental health into toolbox talks to conducting walking meetings in nature, the event gave attendees practical steps to implement immediately.
Attendee feedback showed how valuable the space was for open, honest reflection, highlighting the need for more industry-wide conversations that support not just physical safety, but emotional resilience.
To connect with the presenters or explore mental health resources tailored for technical workplaces, visit:
• mgacounselling.com.au/matt-glover/
• mgacounselling.com.au/cameron-semmens/ Let’s keep the conversation going, because mentally healthy teams are safer, stronger, and here to stay.
Western Australia Annual General Meeting (AGM)
The AINDT Western Australia Annual General Meeting (AGM) was hosted on the evening of Friday 1st August. The event was hosted at the impressive Rooftop Bar at the Reveley venue on the Elizabeth Quay Waterfront.
There was a really great buzz around the event with over 100 attendees consisting of a mix of members, non-members, member companies and industry legends who all mingled, networked and enjoyed the fantastic food and drinks on offer throughout the evening.
As part of the formalities of the evening, Branch President Josh Wilkinson conducted a review of the Branch activities over the year and provided a Membership Report. Plus, Mike Needham provided his usual succinct Treasurers Report. The Western Australia Branch also welcomed Jay McDonnell, Brad Cox, Vincent Tan, James Stewart and Dylan Edwards to the council. We also thank Andrew Barry for being a part of the council for the past two years.
As always, these events wouldn’t happen without our generous sponsors, so a huge thank you to Rio Tinto, Evident, Applus, MIS, SRG Global, LMATS and Vertech. All sponsors provided fantastic door prizes that were very well received by the winners.
Thank you to all the attendees who made it a very enjoyable evening and we look forward to seeing you all next year. The event closed out a very positive year for the Western Australia Branch of AINDT, while also looking ahead to a positive year of engagement with our members.


A DAY TO RELAX, CATCH UP WITH COLLEAGUES AND LET YOUR COMPETITIVE JUICES FLOW!
THURSDAY, 04th December 2025
Collier Park Golf Course
First Tee off - 11AM
NSW AGM Recap: Full House, Formal Flair and Future-Facing Focus
Each year, the AINDT Branch Annual General Meetings (AGMs) offer a pulse check on how we’re tracking as a community. In NSW, we took that responsibility seriously—perhaps a little more seriously than our colleagues in Queensland and Western Australia who enjoy the luxury of pints over proceedings. (We love a pub night too—ours just happens to come with linen napkins.)
The 2024-2025 NSW AGM was held at the Novotel Sydney Central and completely booked out. We even had to ask the hotel to add an extra table. A full house is always a good sign. It reflects not just member interest, but a shared commitment to shaping the direction of NDT in Australia.
While there were no new elections or dramatic resolutions, the night was an important touchpoint, especially as much of our NSW branch council effort is currently focused on supporting the upcoming AINDT National Summit. That collaboration is already well underway, and we’re proud to be helping lead the charge in making the next Summit a landmark moment for the institute.
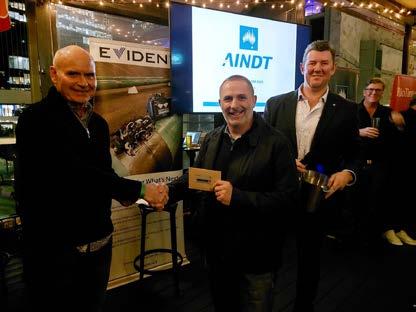
One of the real highlights of the evening was recognising our 2024 AINDT examination award winners. These aren’t just names on a certificate. They represent the next generation of excellence in our field. A huge congratulations to:
• Lewis Gale – SmartChem Award (Highest Mark in Level 2 General Magnetic Theory)
• Christian Agena – Chemetall Practical Award (Highest Mark in Level 2 MPI Practical)
• Lewis Gale (again!) – SmartChem Academic Excellence Award (Top Overall MPI Result)
• Theophilus Hayford – Baker Hughes Award (Highest Mark in Level 2 UT General)
• Hindraws Matti – Duerr NDT/EN DE TEK Award (Highest Overall Level 2 Result across CR/DR categories)
To all award winners: your dedication reflects the professionalism we strive to uphold. And to the sponsors who support these recognitions—including local businesses like Smart Chem, En De Tek, Sonix NDT, HVT Inspection Services & AINDT—thank you for continuing to invest in Australia’s technical future.
NSW has no shortage of experienced technicians, forward-thinking service providers, and passionate newcomers.
To the technicians quietly scrolling this from the field— your voice matters. Come to an event, contribute to the conversation, and help shape the future of your branch. Whether it’s a conference room or a pub table, the community is better when you’re in the room.
And to the other states—we’d love to host you one day. Just pack something a little more formal than a fluro vest!
One of the main items of interest relating to Standards is that a draft version of AS 3978:2025 Non-destructive testing - Visual inspection of metal products and components was available for comment.
This comments period ended on 8 October 2025. The result and if any comments were not available at the time of this news being published and is expected around mid-October. The Standard was worked on by MT007 NDT together with TC44 welding.
ISO Ballots for upcoming and revised Standards continued with many continually moving through each voting period and getting close to adoption.
ISO/CD 25222-2 Non-destructive testing — Characterization and verification of ultrasonic aircoupled equipment — Part 2: Probes
ISO/FDIS 5577 (Ed 3) Non-destructive testing — Ultrasonic testing — Vocabulary
ISO/DIS 18490 (Ed 2) Non-destructive testing — Evaluation of vision acuity of NDT personnel
ISO 12713:1998 (vers 5) Non-destructive testing — Acoustic emission inspection — Primary calibration of transducers
ISO 17643:2015 (Ed 2, vers 2) Non-destructive testing of welds — Eddy current testing of welds by complexplane analysis
ISO 22232-1:2020 Non-destructive testing — Characterization and verification of ultrasonic test equipment — Part 1: Instruments
ISO 22232-2:2020 Non-destructive testing — Characterization and verification of ultrasonic test equipment — Part 2: Probes
ISO 23277:2015 (Ed 2, vers 2) Non-destructive testing of welds — Penetrant testing — Acceptance levels
ISO 23278:2015 (Ed 2, vers 2) Non-destructive testing of welds — Magnetic particle testing — Acceptance levels
Please contact me using the details below if you have any questions or require further information and I will reply at the first opportunity.
Angelo Zaccari MT007 Standards Chairperson. angelo.zaccari@outlook.com

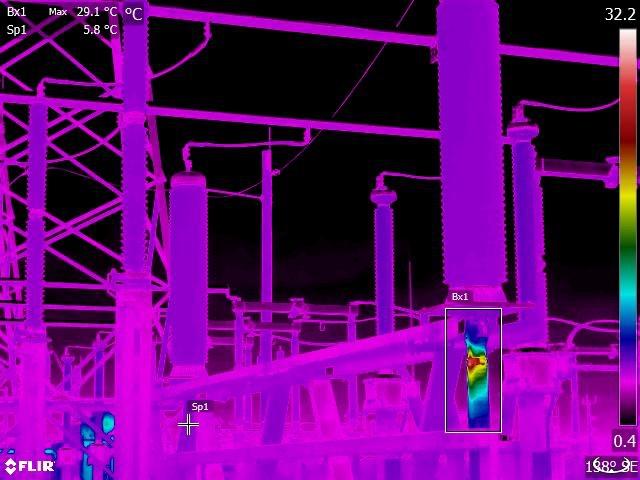
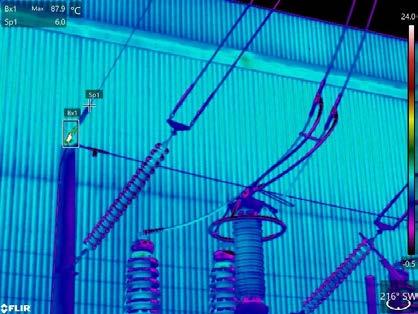
In the Transmission and Distribution HV industry in Victoria we currently work from 11KV up to 500KV. The usual modus of operandi for Thermography is to look at all the energised connections and contacts in the system, but sometimes a hot spot is found where you least expect it.
BY ERIK THORUP, DIRECTOR IR TECHNOLOGY AUSTRALIA PTY LTD CATEGORY 3 THERMOGRAPHER, ELECTRICAL/MECHANICAL (AINDT/BINDT)
Induction (electromagnetic induction) occurs when you have varying electrical fields in combination with some material which can be magnetised, and which can cause the rise of another electrical field at a different place all together.
We will here show 4 different anomalies found over a long period, and also supply a small discussion.
It is possible that the science behind the explanations is slightly flawed but remember – in electrical Thermography you always need a current to flow in a resistance to cause a hot spot, so the hot spots here MUST have some current flowing in them.
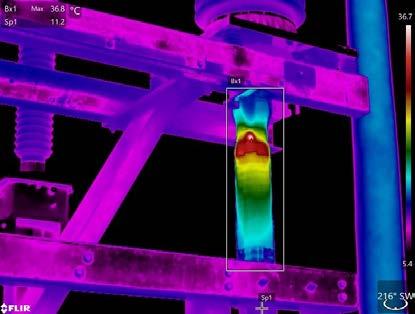
11KV connection from an underground cable (Cable head)
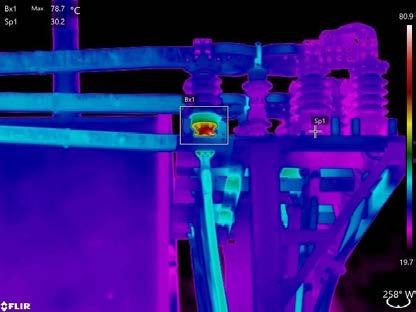
An 11 KV connection from an underground cable has shown up warm. Usually this will be due to a high resistance at the cable junction, but in this case a closer look reveals the image to the right.
A closeup image from a different angle reveals that one bolt which is likely part of the earth sheathing system is the hottest point, so some current must be flowing in the earth and there is some resistance associated with this bolt.
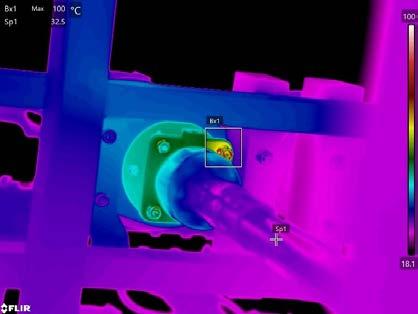
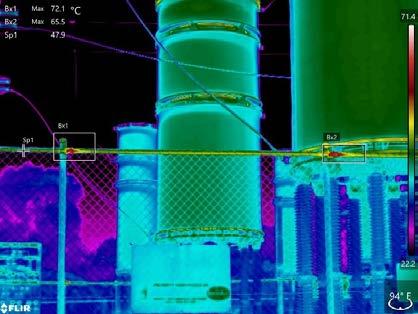
2. 220KV connection from an underground cable.
A 220KV connection from an underground cable has shown up warm. Usually this will be due to a high resistance at the cable junction, but in this case a closer look reveals the image to the right.
A closeup image from a different angle reveals that a hot spot under the insulating sleeve which is likely part of the earth sheathing system is the hottest point, so some current must be flowing in the earth and there is some resistance associated with thispoint.
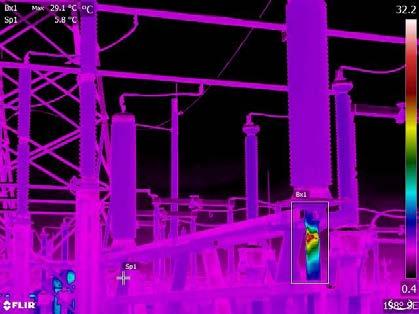
The fence around a 300KV Capacitor Bank show some odd hot spots at the top of the fence post uprights. Although this is not a problem for the continued supply it may be of safety concern if the temperature is very high.
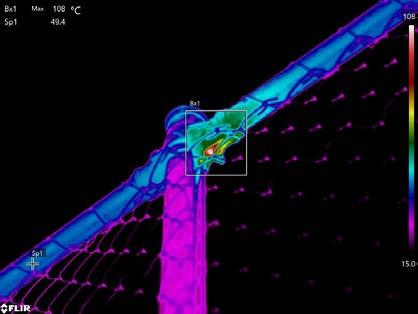
A closeup image from a different angle reveals that part of the pole bracket has the highest temperature so some current must be flowing in this part and there is some resistance associated with this bracket connection and contact.
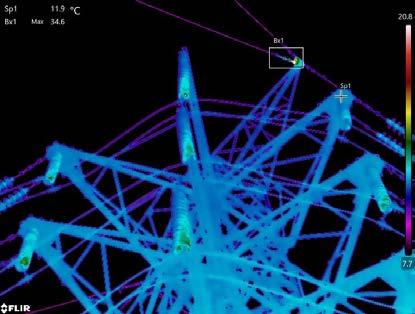
The earth wire connection to the top of a 220KV Tower close to a Terminal Station has increased temperature so some current must be flowing in the earth at this point and there is some resistance associated with this termination.
The earth wire connection to the top of an ground insulator at a 220KV Underground cable at a Power station is hot. Some current must be flowing in the earth at this point and there is some resistance associated with this termination.
As can be seen from the images provided, it seems that as long as the earth cables are running parallel to the energised cables as is the case from tower to tower on the transmission and distribution lines, but when you get to “the end of the line” the Earth may take a slightly different route, and maybe induction into the earth cable may happen.
If the route to Ground/Earth has no resistance, then current will flow directly to ground and you may not find any anomalies, but if there is a resistive part in the path (other than the cable/wire) then this will show up as a hot spot. Note that induction is usually highly dependent on the load (Ampere) in the system and a rise in load can easily cause an even higher change in the anomaly.
This article was written to show that it is imperative for the Thermographer to keep an eye open in places where a hot spot may not be expected. Any such anomaly should be reported and left to the HV professionals to analyse and rectify if necessary.

Gas explosions are often catastrophic, causing irreversible damage and, sadly, human fatalities.
When an ignition source, such as electrical or thermal equipment, enters a space where there is flammable and potentially explosive substances (typically in a confined building or vessel), extreme heat increases pressure in the space and causes an explosion. Working environments that manage these risks on a daily basis are:
• Oil and gas refineries
• Chemical plants
• Hazardous storage tanks
• Fuel depots
• Road tankers
• Chemical, oil and gas tankers
• Industrial processing facilities in explosive atmospheres.
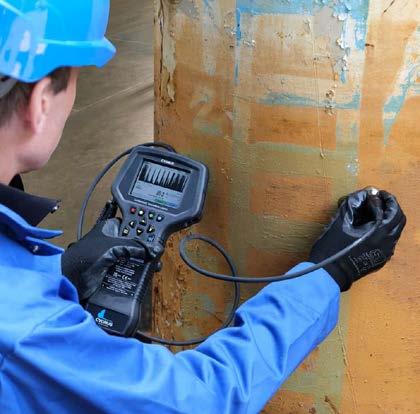
There are many ignition sources that may be brought into these areas for various reasons. One of these reasons performs a rather crucial task – ultrasonic testing equipment designed to carry out essential maintenance checks on the machinery operating to these processes.
Whilst maintenance is vital to the safety of these areas and can even contribute to prevention of explosions by preventing leakage, the maintenance equipment itself needs to be safe to handle in these hazardous environments.
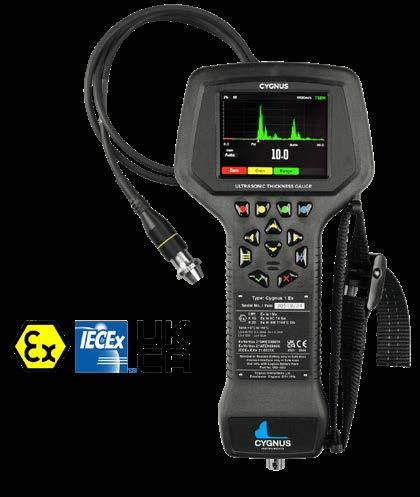
The Cygnus 1 Ex is certified safe to use in locations where there is a risk of fire or explosion due to the presence of ignitable or flammable substances in the air at concentrations high enough to produce an ignitable mixture. This includes gases, vapours, and dust. This is because Cygnus 1 Ex is Intrinsically Safe. For any equipment like Cygnus 1 Ex, that contains electronic components including batteries, intrinsic safety technology limits the energy present in a system, meaning no arc or spark can be generated, and no component can heat up enough to ignite a hazardous atmosphere under any conditions. This applies under both normal use and with applied fault conditions, at low power levels, and low stored energy.
Cygnus 1 Ex has an Intrinsically Safe Design, featuring:
• Limited output energy to prevent ignition of explosive atmospheres
• Anti-static enclosure to prevent static electricity discharge
• Multiple redundant safety components
• In the event of damage or a fault, no high surface temperatures are generated that could ignite an explosive atmosphere.
‘Intrinsically Safe’ is an Ex-Protection Concept, used to determine which areas of a facility (‘zones’) the equipment is suitable for. The term ‘Ex’ is recognised globally when referring to explosive atmospheres and the schemes used to prevent explosions. In both IECEx, ATEX and North American systems, intrinsically safe equipment can be used in any Zone or Division with the correct equipment protection level.
Cygnus 1 Ex is the only gauge of its kind in the world that meets the highest classification of ATEX Zone 0, which is equivalent to NEC (UL) Class I Division 1 Group “ALL”. Zone 0 is defined as ‘a place in which an explosive atmosphere is present continuously or for long periods. It is also certified to Zone 1; ‘a place in
which an explosive atmosphere is likely to occur in normal operation occasionally’ and Zone 2; ‘a place in which an explosive atmosphere is not likely to occur in normal operation, but if it does occur, will persist for a short period only’.
Plants and facilities will have many different Divisions or Zones, and once these hazardous areas have been established, signs must be installed to warn and inform anyone entering the area. It is important to be aware that these area labels can change, especially, for example, as a result of a leak. If a welded joint, flange or valve is leaking, the Zone around it can be elevated from Zone 1 to Zone 0.
The Cygnus 1 Ex ultrasonic thickness gauge offers an invaluable leap forward for safe structural inspection in hazardous areas. Reviewed as “versatile, multifunctional, robust and intuitive,” by our customers, this intrinsically-safe gauge provides first-class user control and flexibility, eliminating the need for plant shutdown or a Hot Work permit.
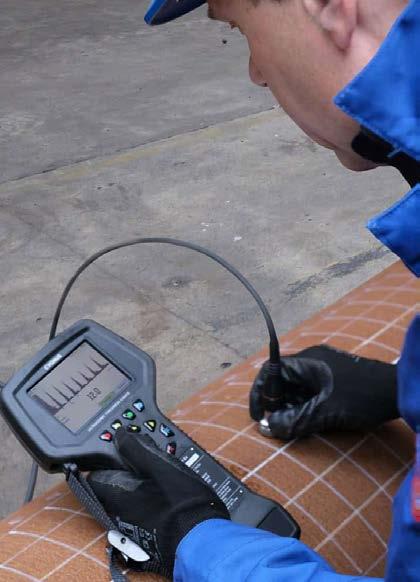
Equipped with three measuring modes and a selection of probes, the gauge can measure a range of materials and metals with severe corrosion or protective coatings up to 20mm thick. This saves considerable time and money removing coatings.
The great news for advanced users is that the Manual Measurement Mode ensures measurement on trickier areas, like heavy corrosion, is easier and more accurate, thanks to more versatile settings.
Like a flaw detector, you can manually adjust two gates, positioning them anywhere on the A-scan, alter gate height, start-point and width, and measure from a gate or between gates. Furthermore, Time-Controlled Gain (TCG) enables introduction of different gains to boost weaker echoes.
When storing and analysing data, you’ll enjoy equal flexibility. Comprehensive data logging offers linear, templates, and 2-D or 3-D grid formats, with 16 grid patterns and annotation capability. Radial Points enable further investigation on areas of interest or heavy corrosion, allowing you to add up to 12 additional measurements ‘around’ the principal measurement.
The Cygnus 1 Ex is currently available from Russell Fraser Sales. For further information, visit: rfsales.com.au
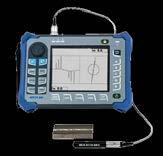
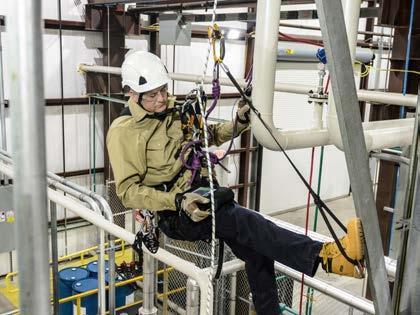
Using the EPOCH™ flaw detector with dual element transducers (“duals”) for corrosion monitoring and flaw detection applications on offshore oil platforms.

Marine drilling risers are an area of interest when discussing corrosion on offshore oil platforms. Marine risers form the link between the seabed pipeline or well and topside processing equipment. Risers are subject to constant wetting and drying in the splash zone—the area of the risers immediately above sea level.
This wetting and drying combined with defects in the risers’ protective coatings can contribute to corrosion. Corrosion is concerning to platform managers because it can reduce the wall thickness and threaten the structural integrity of the risers.
Assessing the remaining service life of aging risers is often dependent on corrosion monitoring with NDT technologies. There are several non-destructive testing methods used to inspect marine risers for corrosion, however conventional ultrasonic testing (UT) is often the most convenient and cost-effective method.
There are two primary corrosion inspection methods that use conventional ultrasound. The first is the point measurement method, using an instrument like the Evident 39DL PLUS™ ultrasonic thickness gauge. The
point measurement method uses precision thickness measurements taken in a defined pattern and repeated over time to monitor remaining wall thickness.
This method is effective for periodic corrosion monitoring and precision measurements of discrete defects but is not well-suited for identifying neighbourhoods of corrosion, corrosion-induced cracking, or other flaw mechanisms.
The second method uses an instrument like the EPOCH™ 650 ultrasonic flaw detector to scan a suspected corroded part for pits and corrosion-induced cracks and to support length sizing and characterization of detected defects.
Compared to the first method, this technique is bettersuited for finding and sizing isolated defects but is less effective at making high-precision spot thickness measurements to aid in periodic corrosion monitoring. The EPOCH 6LT flaw detector with corrosion software enables the user to switch between a thickness gaging measurement algorithm (corrosion mode) and a flaw detection measurement algorithm (flaw detection mode), depending on the corrosion inspection method the user wishes to perform.

Conventional flaw detectors typically use edge or peak gate detection modes, where the instrument records a thickness measurement based on where the edge of the echo crosses the gate or the peak of the gated echo, respectively. Edge measurement accuracy can be affected by the echo amplitude and surface conditions, while peak detection can be insensitive to small pits.
The new corrosion software for the EPOCH 6LT flaw detector utilizes the zero-cross measurement algorithm typically used by corrosion gauges when operating in corrosion mode. This measurement algorithm measures from the zero-crossing point of the first signal that breaks the detection threshold, resulting in less sensitivity to fluctuations in coupling and amplitude, helping ensure greater precision when taking thickness measurements.
By combining the key functionalities of a precision thickness gauge and a flaw detector in one instrument, NDT inspectors can use the EPOCH 6LT flaw detector for a wide range of conventional UT corrosion inspections. Users can scrub for pitting and size defects in flaw detection mode, and switch to corrosion mode to make reliable and accurate measurements of remaining part thickness.
The EPOCH 6LT corrosion software includes the following features: automatic probe recognition, dozero offset compensation, V-path correction for dual element transducers, automatic gain control, a thickness gauge measurement algorithm, and a color-coded grid view for saving thickness readings.
Offshore oil platforms pose a challenge for NDT inspectors and their equipment. They are subject to harsh weather conditions, and inspections often require rope access, with the inspector hanging over the ocean. For offshore rope access inspections, instrument size and weight are a key concern.
The EPOCH 6LT portable ultrasonic flaw detector is uniquely suited for offshore corrosion inspections. This instrument is Ingress Protection (IP) rated to IP65/67, drop tested, and engineered to strict environmental ratings to withstand the challenging environment of an offshore platform. The instrument weighs less than 2 pounds and supports software that enables it to function as both a conventional flaw detector and a corrosion gauge. These technical advancements enable offshore NDT inspectors to be confident in the reliability and usability of their flaw detector, even in a challenging offshore environment.
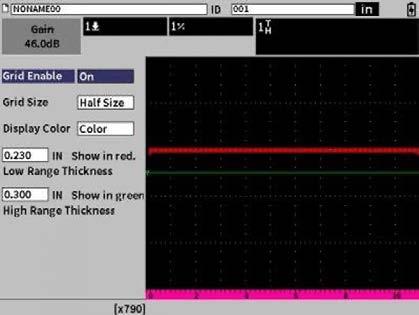
Once the EPOCH 6LT corrosion software is activated and enabled, first calibrate the instrument in both corrosion mode and flaw detection mode for the intended material, inspection range, and general sensitivity. Pulser and receiver settings are automatically optimized for supported Evident dual element transducers when plugged into the instrument.
After performing a two-point depth calibration in both corrosion mode and flaw detection mode, the user can enable grid view, select colour, and set low and high range thickness values based on the inspection requirements.
The grid view feature is intended for use in corrosion mode while using the point measurement method to record precision thickness measurements and acts as a visual aid for monitoring corrosion.
Once the instrument has been calibrated for the inspection, select flaw detection mode and couple the transducer to the inspection material in an area without corrosion to determine the depth of the back wall. Once the back wall signal has been identified, the user can scan the part while monitoring the A-scan for a change in back wall thickness or the appearance of an echo before the back wall signal, which could indicate potential cracking, pitting, or corrosion.
Once a potential defect is identified, switch to corrosion mode to measure the remaining part thickness. If grid view is enabled, thickness readings saved into the grid will be color-coded based on the specified low and high thickness ranges.
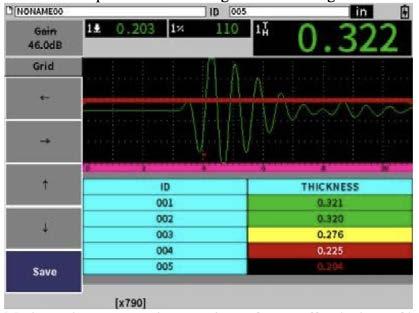
Modern advancements in corrosion software offer the best of both worlds of corrosion inspection. By providing key corrosion gauge and flaw detector functionality, the EPOCH 6LT flaw detector with corrosion software helps make corrosion inspections more accurate and efficient.
For further information, visit: ims.evidentscientific. com/en/applications/advancements-in-offshorecorrosion-monitoring-and-flaw-detection

Join the vibrant team of volunteers at your local state branch and turn your passion for progress into action. Volunteer with us and connect with a community of professionals dedicated to making a difference in our industry. W H Y V O
Network with industry leaders and peers Develop professional skills and gain unique experiences Influence the direction of our industry and contribute to


As rotating machinery continues to form the backbone of critical industrial systems, the ability to accurately diagnose and prevent faults is essential to safe, reliable operation.
BY SALAH ATTIA
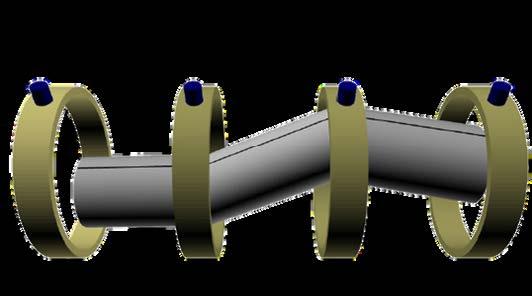
One of the most insightful tools available to vibration analysts and reliability engineers is the shaft centreline plot. This is a simple yet powerful way to visualise the behaviour of a rotor supported by fluid-film bearings.
When the speed of a rotor changes, the stiffness of its bearings and the static radial load on the shaft also change. These variations cause the average position of the shaft to shift within the bearing clearance. By tracking how this position moves, engineers gain valuable diagnostic clues about the health and stability of the rotating system.
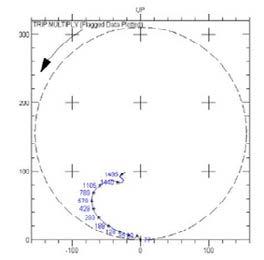
Traditionally, shaft centreline plots are used to display how the shaft position changes with speed, but they can also reveal how it varies over time under constant conditions. In either case, the technique allows analysts to correlate mechanical movement with evolving operating parameters such as load, temperature, or lubrication condition.
Because many common faults (including misalignment, rubbing, and fluid-induced instability) produce characteristic shifts in the shaft centreline behaviour, the plot serves as a vital cross-reference against other diagnostic tools such as orbit, Bode, or waterfall plots. Together, these provide a holistic picture of a machine’s condition.
To produce a shaft centreline plot, engineers measure the DC gap voltage from proximity probes positioned at right angles on the bearing housing. When the machine is stationary or running below about 100 rpm, this voltage corresponds to the static position of the shaft relative to the bearing centre. As speed increases, the shaft moves according to factors such as bearing design, applied load, and residual unbalance.
A key parameter derived from these measurements is the eccentricity ratio—the distance between the shaft centreline and the bearing centre divided by the radial clearance. An eccentricity ratio (ε) of 0 means the shaft is perfectly centred, while ε = 1 indicates it is in contact with the bearing surface. Monitoring how this ratio changes with speed or load provides direct insight into the health of the bearing film and the dynamic stability of the rotor.
By trending these movements, maintenance teams can identify early indicators of bearing wear, oil-film collapse, or other instability phenomena long before they result in vibration alarms or catastrophic damage.
In short, the shaft centreline plot remains a cornerstone diagnostic tool in the field of rotating-machinery analysis. Its ability to reveal subtle mechanical interactions between the rotor and its bearings makes it indispensable for predictive maintenance and for extending the life of critical assets across power generation, oil and gas, and manufacturing industries.

Technical Director at MCS, introducing a range of services to our customers, including vibration and oil analysis, thermal imaging, alignment, balancing and training (VCAT4, TCAT3, MLA2, CMRP, NER, RPEQ, MIEAust)
Email: salah attia@mcsturbo com
Phone: 0499881294
www mcsturbo com
www mdiaustralia com
As the speed of a rotor system equipped with fluid-film bearings fluctuates, alterations occur in the bearing's stiffness properties and the static radial load. These changes result in a shift in the average position of the shaft Consequently, variations in the shaft's position can offer crucial diagnostic insights.
The standard shaft centerline plot is frequently utilized to showcase shifts in shaft position relative to speed. However, it is also used to exhibit variations in shaft position over time, enabling correlation with evolving operational conditions. Given that certain malfunctions (such as misalignment, rubbing, and fluid-induced instability) can result in observable changes in the centerline behavior, the shaft centerline plot remains a highly significant tool for crossreferencing with other plots during diagnostic assessments.
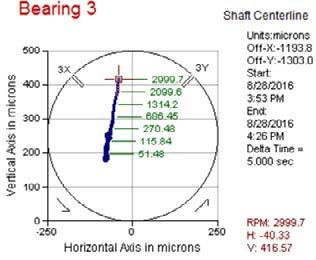
By using a DC gab voltage, we can analyze the shaft center line location start from zero where machine speed below 100 Rpm or at rest position shaft would move according to many factors such as load and bearing type, eccentricity ratio is the distance between shaft center line and bearing center divided by bearing radial clearance, (£=0, means shaft at the center, £= 1 means shaft against bearing)
Phased array ultrasonic testing (PAUT) instruments often incorporate optional weld overlays that superimpose an assumed joint geometry on the sectorial scan (S-scan).
BY ZACHARIAH D. LUTE CIRCLE B INTEGRITY SERVICES, TULSA, OKLAHOMA, USA
These overlays aid interpretation and scan planning by positioning signals relative to the weld profile based on index position. Their usefulness, however, depends on user defined weld geometry and stable index position.
In practice, welds frequently deviate from the assumed geometry (e.g., land height, land offset, bevel angle), which can lead to significant interpretation errors. Incorrect overlays lead to placement and characterization errors and may reinforce confirmation bias when the S-Scan image is trusted over the A-Scan signal dynamics.
This paper outlines common failure modes— misplacement, false negatives, and false positives—and offers mitigation: verification of weld preparation, emphasis on echo dynamics, and training that treats overlays as aids rather than authorities. The objective is balanced use: overlays remain valuable when accurate but are never a substitute for critical evaluation of ultrasonic data.
PAUT has recently become more widely used for new and in-service weld inspection. Modern systems commonly include optional weld overlays to simplify interpretation. By entering joint parameters—weld configuration, land height and land offset, bevel angle, and heat affected zone (HAZ) Width —the software draws a 2D weld profile that is overlaid on the S-scan to provide context.
While this can improve speed and accuracy by reducing manual plotting, the benefit is contingent on inputting the correct geometry, which is often assumed rather than verified. Because fabrication rarely matches idealized drawings, small deviations can shift apparent echo locations and sound paths. When the overlay does not reflect the actual joint, signals may be misplaced or misinterpreted. This paper examines these risks and offers practical mitigations.
The effectiveness of a weld overlay is entirely dependent on the accuracy of the input geometry. Welding is rarely
executed exactly as designed, and field deviations are common. This contrasts with PAUT calibration practices, which often target position accuracy (wedge delay) on the order of 0.039 in (1.0 mm) [1], while engineered weld drawings may allow tolerances as high as ± 0.25 in (± 3.2 mm) and ± 10° for bevel angles [2].
For example, a joint specified as a single-V with a 0.10 in (1.27 mm) root gap and a 37° bevel may actually be prepared with a 0.25 in (2.54 mm) root gap and a 30° bevel. Though modest in fabrication terms, such changes significantly affect where echoes plot within the weld on the S-scan. The result is a mismatch between the true echo locations and the visual representation provided by the software. This discrepancy introduces the risk of both false negatives—overlooking a relevant indication because it appears outside the weld overlay— and false positives, where irrelevant signals are mistakenly interpreted as weld defects.
Overlays represent an idealized model, not a verified reality. Unless the true joint configuration is confirmed, the overlay must be regarded as an approximation and visual aid rather than a definitive guide to signal positioning.
The use of weld overlays in PAUT interpretation has improved operator understanding of complex sound paths and streamlined analysis. Yet when the assumed geometry does not reflect the actual joint, interpretation errors arise. These errors not only reduce the accuracy of flaw characterization but also undermine inspection reliability—leading to the rejection of acceptable indications and, more critically, the acceptance of rejectable ones.
The most direct consequence of an incorrect overlay is misplacement of signals within the S-scan. A signal on the fusion face that would indicate lack of fusion may be plotted within the weld body and misread as slag inclusion. Conversely, a mode-converted response
(common in wide DSAW welds) originating outside the weld can be plotted inside and interpreted as a critical indication.
3.2 Depth and positional uncertainty
Accurate depth positioning is critical in weld inspection, particularly near the ID and OD surfaces. When the true weld geometry is different from the overlay, an ID cap could be assumed to be wider or narrower than actual, causing errors in positioning indications that appear in the 2nd leg where the sound beams reflect near the ID cap due to differing sound path lengths.
3.3 Missed indications (false negatives)
Signals plotted “outside” the overlay are often dismissed as irrelevant. If the overlay is wrong, legitimate weld-related indications can be overlooked.
3.4 False indications (false positives)
The inverse problem occurs when irrelevant indications, such as geometric reflections, mode conversions, or base-metal indications are plotted inside the weld due to overlay error. While rejecting such signals may seem conservative, it creates unnecessary cost and delay— especially since most codes and specifications already build in significant conservatism without rejecting irrelevant indications.
3.5 Confirmation bias
Visually tidy alignment with the overlay can be persuasive. Without cross-checks, inspectors may favor the image over A-scan characteristics (signal walk with probe translation, signal presentation, amplitude), increasing the risk of miscalls.
4. Case Studies
4.1 Single V SMAW Weld Actual Weld Profile VS the Prepared Weld Overlay
• Scenario: Single V SMAW Weld with an assumed typical weld profile with a consistent bevel. As welded however, the actual weld profile is irregular and asymmetrical with one side appearing near typical while the other extends well beyond the assumed weld area.
• Effect: A true fusion-face indication could be plotted outside the weld body in the overlay.
• Lesson: Normal weld variations can shift critical signals “out of weld” in the image.
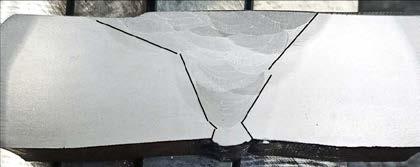
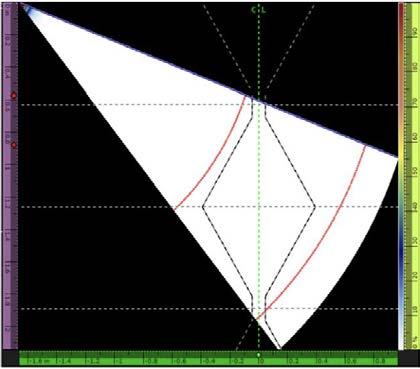
4.2 Varying Flaw locations Based on Overlay Setup.
• Scenario: Weld geometry is assumed to be nominal and is not easily verified due to weld being ground flush. The actual weld was prepared with a larger root offset and bevel angle.
• Effect: The same flaw could be characterized differently and plotted in 2 different locations within the weld based on slight differences in input geometry.
• Lesson: Correlate with echo dynamics, not just the overlay image. Verify actual weld preparation prior to welding or by confirmation with welding personnel.
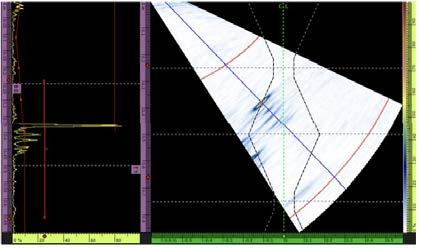
Discussion
Overlays provide a clear visual map of weld geometry and echo responses, but that strength becomes a liability when assumed geometry diverges from reality. In production environments, data volumes and inspection quotas push inspectors toward
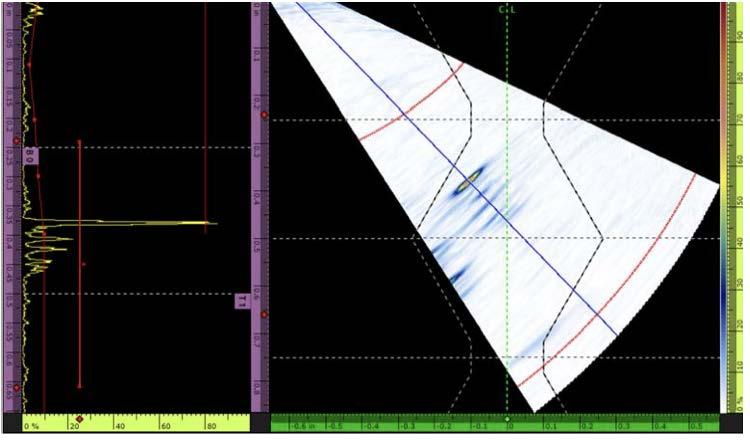
faster, overlay-driven workflows (e.g., gated C-scans referenced to the overlay). If the overlay is wrong, out-of-weld signals may never receive proper review.
There are in fact cases where overlays can be extremely beneficial and should be utilized such as projects when automated welding machines are used followed by automated PAUT crawlers where both machines can utilize the same tracks.
Automated welders produce very repeatable welds with consistent geometry which when followed with automated PAUT leaves very little room for discrepancies. Inspectors can trust in the overlay and use this consistent data to very quickly and accurately screen large quantities of data.
6. Mitigation Strategies
6.1 Verify weld preparation
Confirm the actual joint configuration before creating the overlay—via fabrication drawings, welder/supervisor confirmation, or direct measurement of bevel angle, root gap, land, and land offset during fit-up. Even approximate confirmation reduces the risk of gross mismatch.
6.2 Use overlays as guides, not absolutes
Treat overlays as approximate visual aids when geometry cannot be reliably known. Do not base critical decisions solely on whether an echo appears inside or outside the overlay. Supplement with understanding of sound paths and weld geometry.
6.3 Cross-validation across views
Evaluate indications from multiple skews (sides of the weld) using known index offset’s and compare scans. Discrepancies in plotted location are a cue to reexamine the assumed geometry.
6.4 Emphasize echo dynamics
Consider amplitude behavior, mode conversion, movement with probe translation, and actual wave characteristics before classifying an echo.
6.5 Training and awareness of limitations
Initial classroom training should include discussion of overlay limitations, supported by case studies of misinterpretation.
Inspectors should also be trained to manually plot indications when doubt exists, ensuring they can confirm their interpretation without relying solely on the overlay.

By exposing inspectors to examples of misplaced or false indications caused by overlays and reinforcing plotting fundamentals, inspection groups can reduce the risk of overreliance on the tool.
6.6 Procedural safeguards
State in procedures that overlays are optional aids. Require documentation of weld-prep verification and call for review of indications within a defined distance from overlay boundaries—even if plotted “outside” the weld area.
7. Conclusions
Weld overlays are valuable visualization aids, not authoritative truth. When user inputs do not match the actual geometry, they can drive misplacement, false calls, and confirmation bias. Verifying weld geometry, cross-checking views, and prioritizing A-scan fundamentals preserves the benefits while controlling the risks. Embedding these practices in training and procedures keeps overlays an asset rather than a liability.
The author thanks Andrew Almon V. of the Archirodon Group for the weld image and the PAUT setup file used in Figures. 3 and 4.
References
1. International Organization for Standardization (ISO), 'Non-destructive testing — Characterization and verification of ultrasonic phased array equipment — Part 3: Complete systems', ISO 18563-3:2024, §9.4.4.3(b)(2), p. 18, 2024.
2. American Welding Society (AWS), 'Structural Welding Code—Steel', AWS D1.1/D1.1M:2010, Fig. 3.3, pp. 78–93, 2010.
Phase Coherence Imaging (PCI) is a recent evolution of the Total Focusing Method (TFM) in ultrasonic Non- Destructive Testing (NDT). Unlike TFM, PCI relies exclusively on phase information and produces normalized coherence factors instead of amplitude values. As a non-amplitude technique, PCI avoids gain calibration and offers advantages for detecting specific defects.
BY WEINA KE
While TFM has been extensively studied and widely adopted in industrial practice, the benefits and limitations of PCI remain less well established. This article presents a set of experimental studies aimed at evaluating PCI’s performance across different reflector types and depths, with comparisons to TFM under identical Full Matrix Capture (FMC) acquisition conditions.
Results highlight three main findings: (i) PCI provides more stable indication patterns with reduced influence from wedge/specimen interface echoes, (ii) sensitivity distributions differ significantly between PCI and TFM, particularly for tip diffractions and side-drilled holes, and (iii) statistical analyses reveal that coherence factor variations are reflector- and depth-dependent, in contrast to the more predictable Gaussian-like sensitivity curves observed in TFM.
These findings contribute new quantitative insights into PCI behaviour and indicate that future development of numerical modelling tools will be necessary to fully characterize its sensitivity and to guide its industrial application.
Ultrasonic Testing (UT), together with Radiographic Testing (RT), is one of the two standardized volumetric inspection methods and remains essential for ensuring the structural integrity and reliability of industrial plants. The response of ultrasonic waves depends on both the propagation medium and the characteristics of the reflector, principles formalized by the timereversal concept and implemented in the advanced Total Focusing Method (TFM) [1, 2].
High-resolution TFM imaging requires volumetric data acquisition, which was first realized through Full Matrix Capture (FMC), a robust configuration whose settings are independent of both Region of Interest (ROI) parameters and ultrasonic beam characteristics. This independence represents a key advantage over Plane Wave Imaging (PWI) [3], although PWI provides strengths of its own, including powerful emission and improved acquisition speed [4- 7].
Building on TFM, Phase Coherence Imaging (PCI) emerged in 2009 as an alternative reconstruction approach [8], first introduced into industrial applications by Olympus. Unlike TFM, PCI relies solely on phase information and is therefore considered as a nonamplitude technique that does not require gain adjustments. PCI images display coherence factors on a scale from 0 to 100%, where 100% indicates full phase coherence among all signals, while 0 represents complete incoherence and is theoretically unattainable. This approach aims to further improve the signal-tonoise ratio (SNR) for specific indications, reduce the presence of artifacts such as wedge/specimen interface echoes, and enhance detection reliability, particularly for challenging applications [9-12].
This work provides one of the first systematic experimental characterizations of PCI sensitivity across different reflector types and depths. First, experiments compared the indication patterns of TFM and PCI on a typical planar flaw. Building on these results, additional tests on general reflectors were performed to better understand coherence factor variations relative to TFM sensitivity distributions. All the acquisitions, for both PCI and TFM reconstructions, were performed with FMC configuration for its robustness.
This study provides one of the first systematic experimental characterizations of PCI sensitivity across reflector types and depths. The findings point to the potential need for future numerical tools should further developments and applications of this technique be confirmed.
The experiments were conducted on a planar flaw as a lack of fusion in a weld and various general reflectors disposed in Block V6 of EkoScan, including vertical Electrical Discharge Machining (EDM) notches, and Ø 2 mm side-drilled holes at varying depths. The planar flaw
is tilted clockwise by 30° from vertical, with a centre depth of 35.6 mm and a height of 3.2 mm
as planned. Concerning the general reflectors, the top tips of the EDM notches are located at depths of 10 mm, 20 mm, 30 mm, and 40 mm. The centres of the Ø 2 mm side-drilled holes are at depths of 2 mm, 5 mm, and 10 mm.
The phased array (PA) instrument was an Eddyfi Gekko 64:128, equipped with Capture software for real-time PCI/TFM post-processing. The probe was a 64-element linear array (Olympus), with 0.5 mm pitch and 5 MHz central frequency. The used matched wedges in Rexolite® are respectively to have shear waves mainly refracted in carbon steel specimens at 55° (distance between the index point and the front face as 28 mm, wedge angle as 36.1°) for planar flaw, and longitudinal waves mainly at 0° (height as 20 mm) for general reflectors. To ensure the inspection performances, calibrations are carried out before all testing to compensate for differences in element sensitivity and verify the wedge parameters. A wire encoder from EkoScan with a resolution of 22.6 pulses/mm was used for manual line scans, guided by a magnetic strip.
3. Tracking system and scan plan
According to the objective of studying PCI coherence factor’s variation on reflector type and positions, the parallel scan is chosen with the transducer’s displacement parallel to the probe’s active plan. The conventional tracking systems as well as the scan plan, used to describe the experimental setup and the indications, are given by Figure 1.
The ROI is optimized for each reflector to efficiently include all related ultrasonic indications. Its resolution is chosen as being smaller than 1/5 of the shear wave wavelength (0.65 mm for 5 MHz in carbon steel), compliant with the recommendation of the ISO standard on TFM inspection [13]. The linear parallel scan with varied reflector-to-probe distance can have the indication appear at different ROI columns. In this way, the expected over ROI distributions of PCI and TFM signals were obtained.
4. Testing results
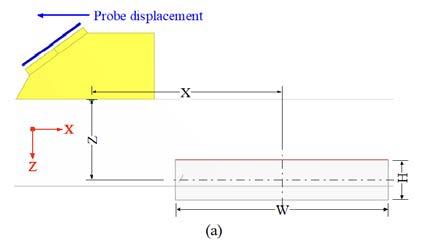
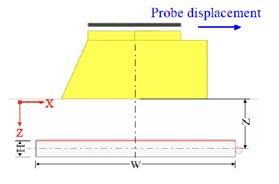
For all experiments, the Mechanical TScan Cumulated (as defined in CIVA Analyse software) image of the linear parallel scans were used to represent the expected over ROI distributions. Each column of this image is established with maximal values of each line of PCI or TFM image obtained at the indicated scan position. The correspondence between scan and indication positions in the ROI allows these images to illustrate indication pattern evolution across the ROI width. The Echodynamic Scanning (as defined in CIVA Analyse software) curve, showing the maximum value of each column of the Mechanical TScan Cumulated image as a function of scan position, highlights maximal values’ (PCI coherence factor or TFM amplitude) variations across the ROI width more clearly.
For the tilted planar reflector, which is a lack of fusion flaw, the ROI was shifted from the probe centre as shown in Figure 1(a) due to the limited probe access caused by the presence of the weld bead. The ROI used had a width W = 90 mm and a height H = 15.9 mm, with its centre located at a depth Z = 36 mm and at a horizontal distance X = 80 mm from the probe centre. The linear scan was configured to capture indications across the full ROI width, using probe- to-reflector distances from 41 to 123 mm, corresponding to the studied X range. The indication pattern varied with the probe-to-reflector distance and enabled visualization of detection sensitivity variations across the ROI width. For comparison, a corresponding TFM acquisition was also performed using the same ROI settings.
Representative PCI and TFM images of different states at selected distances are shown in Figure 2. The detection sensitivity of the target reflector can be visualized by the Mechanical TScan Cumulated images given in Figure 3, except for a spot linked to the weld bead edge in the masked area near the lower-left corner at a depth of ~40 mm. As shown in these images, the reflector indications move from left to right across the ROI as the probe moves farther from the reflector. During this displacement, the PCI indication evolves from two tip diffractions to a short line, and finally back to two separated spots. In contrast, the TFM indication appears for most of the scan as a short line, which is typically associated with specular reflections.
These results demonstrate that the indication patterns
obtained from both TFM and PCI vary with the probeto-reflector distance. The key differences lie in the dominant indication pattern and the amplitude stability, and the effective coverage: PCI generally produces two separated spots with more stable amplitudes over a wider coverage, whereas TFM predominantly yields short-line responses corresponding to specular reflections, but with larger amplitude variations and a smaller coverage. Notably, TFM exhibited a rapid amplitude drop (from ~400% to ~100%) within a short scanning interval of about 15 mm, between probe-toreflector distances of 75 and 90 mm.
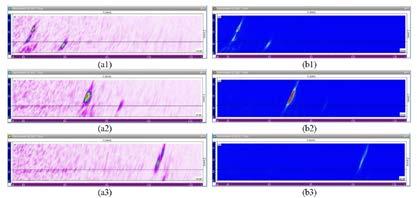
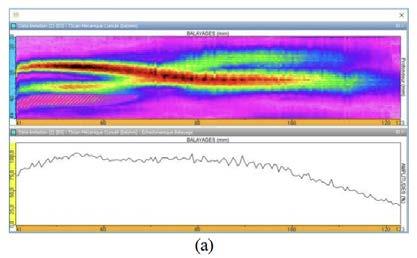
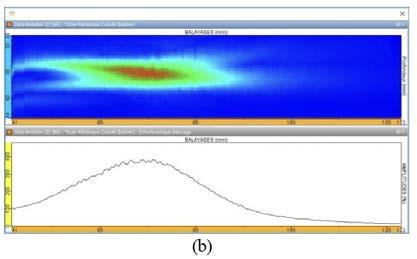
The advantages of PCI technique demonstrated in the previous case of planar flaw can probably improve the flaw detection while the variation of coherence factor, even smaller than TFM amplitude, can’t be ignored. In this case, to show the PCI coherence factor’s variation on general reflectors, similar experiments were carried out on the top tips of vertical EDM notches and side-drilled holes at different depths with 0° longitudinal waves. The same FMC acquisition configurations were used together with TFM reconstruction whose results showed the well- known Gaussian-like sensitivity distributions often compensated by TCG calibration. All the ROIs used in those acquisitions have the same width of 60 mm and are horizontally centred at the probe centre. Their depths are adjusted respectively around each aimed reflector and their heights optimized for acquisition speed.
The tips of vertical EDM notches were chosen to represent the calibrated point-like diffractors at depths of 10 mm, 20 mm, 30 mm, and 40 mm. For these diffractors, the acquisition gain for TFM was adjusted so that the maximum indication amplitude reached approximately 80% of the full-screen height, as 48.5 dB, 51.0 dB, 52.7 dB, and 55.6 dB, respectively. The parallel linear scans were performed such that the indications traversed the ROI from right to left across its entire width. No abnormal or spurious responses were observed; the gradual harmonic variations can be considered intrinsic to the method rather than experimental artifacts.
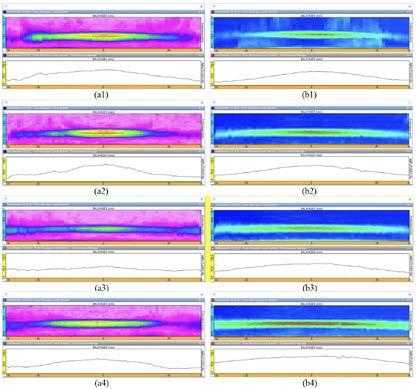
The results presented in Figure 4 show the Mechanical TScan Cumulated images and their corresponding Echodynamic Scanning curves obtained by CIVA Analyse.
The Echodynamic Scanning curves of PCI and TFM were extracted and jointly plotted in Figure 5 to facilitate comparison. The PCI curves remained unchanged from those in Figure 4, while all TFM curves were normalized to 80% of screen height to account for amplitude calibration.
According to these results with tip diffractions, the highest sensitivity for both PCI and TFM is consistently observed beneath the probe centre. For TFM, the sensitivity distribution curves exhibited Gaussianlike shapes. Their −6 dB widths, ranging from 38 to more than 60 mm, increased with depth, which can be associated to the widening of the ultrasonic beam aperture. For PCI, though the coherence factor curves appear also symmetrical, neither their −6 dB width variations nor their maximum values with depth follow the same trend as TFM. At 20 mm depth, −6 dB width for PCI was ~29 mm, compared with ~43 mm for TFM, representing a 32% reduction. The results of statistical analyses on these coherence factor variations are given by Table 1. All these results indicate that knowledge of the PCI sensitivity distribution might be important for mastering its performance.
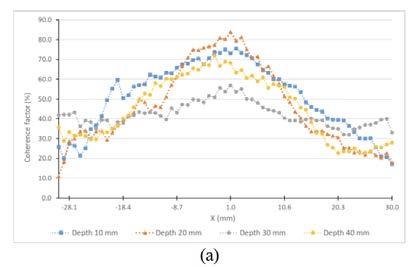
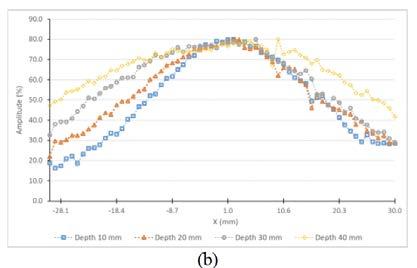
Table 1. PCI coherence factor statistics across the ROI width for tip diffractions at varying depths
On reflections from Ø 2 mm side-drilled holes
The most standardized reflectors in UT inspections are the side-drilled holes whose diameters can vary depending on the application. For this reason, similar experiments were conducted on the side-drilled holes implanted in the reference block V6 of EkoScan at depths of 2 mm, 5 mm and 10 mm. The used acquisition gains for TFM technique are respectively 39.7 dB, 35.5 dB and 35.5 dB to have a similar level for the maximal amplitudes.
The results, illustrated by Mechanical TScan Cumulated images and corresponding Echodynamic Scanning curves for both PCI and TFM acquisitions, are presented in Figure 6. The PCI results show that the maximal coherence factors obtained for holes at the depths of 2 and 5 mm are not beneath the centre of the probe, which differs from the other cases.
Nevertheless, the variations in PCI coherence factors were generally smaller than those of the corresponding TFM amplitudes. Furthermore, the PCI results for the hole at 2 mm depth confirm that the influence of the wedge/specimen interface echo can be neglected, thereby improving inspection coverage in this subsurface area.
By contrast, TFM signals from the same reflector remained affected by interface responses, which were only partly removed during sensitivity curve extraction and still influenced the Echodynamic Scanning curve near the ROI edges. This influence is corrected on the corresponding curve in Figure 7 (b) where all the TFM curves are normalized to 80% of screen height and appear quite similar in term of maximal amplitude and -6 dB width. Concerning the coherence factor distributions, Figure 7 (a) together with Table 2 show that the coherence factor distribution curves lie at different levels. The respective mean values are 44.8% for the side-drilled hole at 2 mm, 69.4% for the hole at 5 mm and 84.4% for the hole at 10 mm. However, in all cases, the PCI coherence factor distributions exhibited smaller variations than the corresponding TFM amplitude curves.
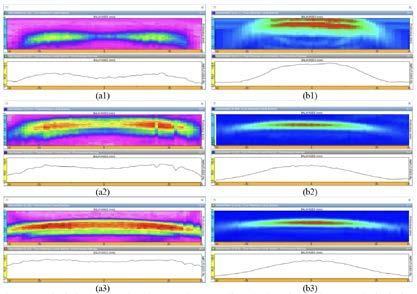
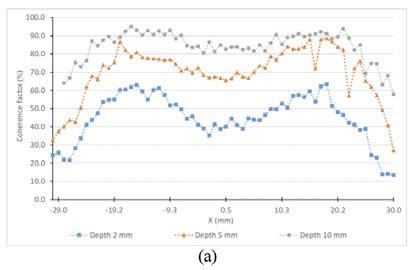
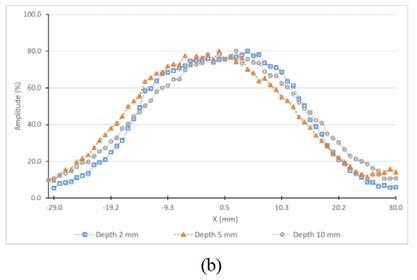
Table 2. PCI coherence factor statistics across the ROI width for Ø 2 mm side-drilled holes at varying depths
The patterns and curves clearly illustrate the variation trends, while some outliers indicate that coupling quality can influence both the PCI coherence factor and the TFM amplitude.
The PCI technique, evolved from TFM technique, extracts phase information from ultrasonic signals and may serve as a complementary technique to TFM. It offers several advantages, including reduced wedge/specimen interface echoes and improved detection sensitivity for point-like reflectors without requiring amplitude calibration. The behaviour of PCI, such as variations in coherence factors, is closely linked to signal phase variations and is influenced by parameters including wave velocity in material, reflector type, and ultrasonic frequency.
This study has provided experimental evidence of the specific behaviours of PCI compared with TFM. FMC acquisitions combined with parallel linear scans were applied to a planar weld flaw, EDM notch tips, and Ø 2 mm side-drilled holes, allowing PCI and TFM indications to be systematically analysed across the ROI width. As a non-amplitude technique, PCI coherence factor distributions were illustrated using Mechanical TScan Cumulated images and the corresponding Echodynamic Scanning curves obtained with CIVA Analyse.
The results with angled shear waves on a planar weld flaw showed that PCI indications exhibited smaller value variations over a wider probe-to-reflector distance range and primarily highlighted flaw extremities. This behaviour may be intrinsic to the reconstruction method, especially in cases where TFM responses are dominated by specular reflections. Results obtained with 0° longitudinal waves on general reflectors demonstrated that PCI distributions remained symmetrical, consistent with the acquisition setup, but differed from TFM’s predictable Gaussian-like amplitude distributions.
The findings confirm that PCI can offer complementary strengths to TFM, particularly in artifact suppression and tip diffraction detection. However, its dependence on reflector type and depth, as well as intrinsic variations in coherence factor distributions, must be carefully considered prior to industrial adoption. Although experiments were performed using a single instrument (Eddyfi Gekko), the findings reveal general behaviours expected to hold across systems, albeit with algorithm-specific variations. Future work, including validated numerical modelling of coherence factor distributions and cross-platform benchmarking, will support standardization and facilitate broader industrial adoption of PCI.
1. C Holmes, B W Drinkwater, P D Wilcox, ‘The postprocessing of ultrasonic array data using the total focusing method’, Insight: Non-Destructive Testing and Condition Monitoring, 46(11), pp. 677–680, 2004
2. C Holmes, B W Drinkwater, P D Wilcox, ‘Postprocessing of the full matrix of ultrasonic transmitreceive array data for non-destructive evaluation’, NDT & E International, 38(8),pp. 701–711, 2005
3. L Le Jeune, S Robert, E Lopez Villaverde, C Prada. ‘Plane Wave Imaging for ultrasonic non-destructive testing: Generalization to multimodal imaging’, Ultrasonics, 64, pp.128- 138, 2016.
4. A Caulder, ‘Benefits of PWI Weld Inspection for Attenuative Materials’, NDT in Canada 2019, June 18-20, Edmonton (Alberta). e-Journal of Nondestructive Testing Vol. 24(10). www.ndt.net/?id=24706
5. Eddyfi Technologies (2023), ‘Plane Wave Imaging: The Benefits of Total Focusing Method at High Speed’, e-Journal of Nondestructive Testing. www.ndt.net/?id=28023
6. Sumana, A Kumar, (May 4, 2021), ‘Total Focusing Method-Based Ultrasonic Phased Array Imaging in Thick Structures’, ASME. ASME J Nondestructive Evaluation. November 2021; 4(4): 041005. https://doi.org/10.1115/1.4050802
7. H Saulais, E Carcreff, C Thibault, ‘Benefits of plane wave imaging (PWI) for ultrasound NDT industrial applications’, DGZfP Jahrestagung 2023, Friedrichshafen, May, Germany. https://www.ndt.net/?id=28627
8. J Camacho, M Parrilla, C Fritsch, “Phase Coherence Imaging”, IEEE Trans. Ultrason. Ferroelectr. Freq. Control, 56, 5, pp. 958-974, 2009
9. T Tartaglia, Advantageous Applications for Phase Coherence Imaging (PCI), ims.evidentscientific.com/en/insights/ advantageous-applications-for-phasecoherence-imaging-pci?utm_source=chatgpt.com
10. A Le Duff, G Painchaud-April, Phase Coherence Imaging for Flaw Detection, ims.evidentscientific.com/en/learn/whitepapers/phase-coherence-imaging-for- flawdetection?utm_source=chatgpt.com
11. F Reverdy, J Poirier and G Maes, (2023). Total Focusing Method (TFM) and Phase Coherence Imaging (PCI) applied to various industrial cases. LES JOURNÉES COFREND/ COFREND DAYS, France, Marseille, 06 - 08 June 2023. e-Journal of Nondestructive Testing Vol. 28(9). doi.org/10.58286/28465
12. F Reverdy, Blog Edyfi, The Pros and Cons of Phase Coherence Imaging (PCI), blog.eddyfi.com/en/the-pros-and-consof-phase-coherence-imaging- pci?utm_ source=chatgpt.com
13. ISO 23864 (2021), ‘Non-destructive testing of welds – Ultrasonic testing – Use of automated total focusing technique (TFM) and related technologies’.
35th Annual Conference and Exhibition on NonDestructive Evaluation (NDE 2025)
11 to 13 December 2025 | Mumbai, India
This event is a vital platform for professionals, researchers, academicians and industry leaders to come together and exchange ideas, innovations and advancements in the ever-evolving domain of NDE. In line with the theme of the Conference, ‘NDE Empowering Industrial Excellence’, sessions will cover various sectors, including oil and gas, energy, metals, materials and manufacturing. NDE 2025 will feature a blend of technical presentations during scientific and industry sessions, plenary and keynote addresses, interactive sessions and a state-of-the art exhibition.
For further information, visit: isntnde.in
Latin American Workshop on Structural Health Monitoring
7 to 9 January 2026 | Santiago, Chile
Following the success of the inaugural LATAM-SHM in Cartagena, Colombia, in 2023, this event will be hosted by the Faculty of Physical and Mathematical Sciences at the University of Chile. The workshop aims to facilitate the exchange of information and to highlight the latest advancements in structural health monitoring technologies and their practical applications, focusing on contributions and developments from Central and South America. An exhibition space will also be available for product and technology demonstrations.
For further information, visit: latam-shm2026.cimne.com
NDTMA 2026 Annual Conference
19 to 19 February 2026 | Las Vegas, USA
The Non-destructive Testing Management Association (NDTMA) brings together top level speakers on NDT Management topics such as leadership, marketing, insurance, mergers and acquisitions, education, apprenticeship, certification, standards, and regulatory topics as well as presentations on emerging technologies and trends in the NDT industry. Plus, see the young professionals program and new awards program for innovation and advocacy. Decision makers in the NDT world all come together at NDTMA to learn best practices and collaborate to help the NDT industry thrive.
For further information, visit: ndtma.org
20 to 22 April 2026 | Newcastle, Australia
The 2025 AINDT Summit will bring together industry leaders, innovators, and NDT professionals for three days of knowledge sharing, networking, and professional development in Newcastle from 18 to 20 November 2025. With the theme The Power of Inspection, the Summit will explore how inspection services deliver crucial insights about critical assets across industries. This timely theme also addresses Australia's evolving energy landscape and the expanding role of inspection services in supporting our future energy infrastructure.
For further information, visit: aindt.com.au
The 17th Asia Pacific Conference for Non-Destructive Testing (APCNDT)
11 to 14 May 2026 | Hawaii, USA
APCNDT is set to be an unmissable event for NDT professionals across the globe. Held under the theme Breaking Barriers: NDT Solutions for a Changing World – Innovate, Adapt, Transform, this premier conference will showcase the latest innovations and emerging technologies that are redefining non-destructive testing. Attendees will have the opportunity to connect with global experts, share knowledge, and explore new solutions to address the evolving challenges faced by industries worldwide. Join us to discover how NDT is driving transformation, and paving the way for a dynamic future.
For further information, visit: apcndt2026.com
The 14th European Conference on Non-Destructive Testing (ECNDT 2026)
15 to 19 June 2026 | Verona, Italy
ECNDT 2026 is a leading international event hosted by the European Federation for Non-Destructive Testing. Bringing together experts, researchers, and professionals, the conference is a hub for sharing innovation, research, and emerging technologies shaping the future of inspection and quality assurance. The program features technical presentations and case studies across a range of sectors, complemented by a dynamic exhibition. This connection between research and practical application encourages collaboration, networking, and advancement of NDT worldwide.
For further information, visit: ecndt2026.org

Seeking advanced solutions in NDT, inspection, and mechanical testing? ARL can help.
Established in Sydney in 1996, ARL is a premier, global provider of advanced NDT, inspection, and mechanical testing solutions, ensuring asset integrity and operational compliance across various industries.
ARL have strategically expanded their operations with offices in the UAE, China, and Pakistan, successfully executing projects in key international locations including the USA, Singapore, and New Zealand. Their specialisation spans Non-Destructive Testing (NDT), mechanical testing, and tank calibration.
ARL delivers world-class, cost-effective solutions to the oil, gas, petrochemical, cement, power, and infrastructure sectors.
ASG NDT Supplies understands that accurate compliant calibration blocks are essential tools in the field of Non-Destructive Testing (NDT). They serve as reference standards used to verify the accuracy and performance of testing equipment such as advanced and conventional inspection devices. The importance of these calibration blocks lies in their ability to ensure that NDT instruments provide reliable, repeatable, and consistent results, which is crucial for maintaining quality standards across industries.
Calibration blocks are manufactured with precise dimensions, material properties, and simulated defect features, representing typical flaws or thicknesses that may be encountered in real-world materials. Accurate calibration ensures that NDT equipment can detect

Comet 1200W Tube Heads for the Most Demanding NDT Inspections
When it comes to inspecting thick or heavy-duty components, only the most powerful X-ray systems will deliver the penetration and image quality required. The Comet EVO 300D/1200 is engineered for precisely these demanding applications, combining 300 kV capability with an industry-leading 1200 W of X-ray power.
Each tube head is built and individually tested to the highest international safety and performance standards, ensuring absolute reliability and accuracy in the field. Its metal-ceramic X-ray tube is housed within a lightweight composite casing that meets IP65 ingress protection,
• Non-Destructive Testing: MFL, Guided Wave UT, Digital Radiography, Corrosion Mapping (RMS / Tank Crawler), Heat Exchanger Tube Testing (ECA, IRIS, RFT, NFT), PECT for CUI, ACFM, and PAUT/TOFD Weld Testing and more.
• Specialised Inspections: Drone Inspections (Confined Spaces), Statutory/Third-party Inspections (vessels, tanks, piping), and Tank Calibration/Settlement Surveys.
• Mechanical Testing: Tensile, Charpy, Bend, Proof Load and so.
• Materials and Welding: Welding Consultancy, Metallurgical Services (Hardness, Ferrite), and PMI (XRF/OES).
ARL’s commitment to quality, safety, and continuous improvement is validated by their full suite of accreditations, including NATA, ISO 9001, ISO 14001, ISO 45001, and ISO 17025.
For further information, visit: arllabservices.com.au
and size flaws correctly, preventing false positives or negatives that could lead to costly failures or safety hazards.
Calibration blocks are subject to strict manufacturing and certification processes, often traceable to national and international standards. This traceability provides confidence that calibration results are consistent and globally recognised. In conclusion, precise calibration blocks are vital for achieving accurate, dependable NDT results, ultimately safeguarding assets, and infrastructure.
ASG NDT Supplies welcomes any opportunity to assist you with your calibration block or step wedge requirements.
For further information, visit: asgndtsupplies.com
allowing safe and dependable operation in dusty or wet environments.
The EVO 300D/1200’s exceptional power and performance deliver unmatched versatility across a broad range of inspection tasks, reducing exposure times while improving image quality and workflow efficiency. Operators can further streamline their work using EVO controllers with intuitive interfaces, built-in exposure calculators, and other advanced features. Designed to perform in ambient temperatures up to 50°C, the system can also be configured with water cooling for even harsher conditions, making it the ideal choice for field and industrial NDT applications where reliability, speed, and precision are paramount.
For further information, visit: axt.com.au/comet-evo
IMIS Asset Integrity specialises in tank inspection, repair, and certification services for industrial and process storage facilities across Australia. Their qualified inspectors work to API 653 and Australian WHS standards, ensuring every inspection meets strict compliance and safety requirements.
IMIS provides a full lifecycle approach, from initial inspection and condition assessment to repair execution and re-certification. This approach helps asset owners reduce downtime and extend service life. Whether for fixed or floating roof tanks, cone-bottom, or vertical

For over 25 years, Russell Fraser Sales (RFS) has been a trusted name in NDT across Australia and the AsiaPacific region. Founded on a commitment to technical excellence and customer support, RFS has supplied inspection professionals with high-quality equipment from the world’s leading brands.
From ultrasonic testing and magnetic particle inspection to visual inspection and eddy current testing, RFS has built a reputation for delivering reliable solutions backed by expert advice and service.
In 2024, Russell Fraser Sales entered a new chapter by joining the Cebeco Group, a move that enhances its reach and resources while maintaining its specialist focus on NDT. This partnership strengthens RFS’s ability

The TICS Group of companies is Australia’s largest majority Indigenous-owned provider of inspection, testing, and compliance services, proudly delivering trusted solutions across Australia and the Asia Pacific since 2014.
They specialise in non-destructive testing (NDT), mechanical testing, industrial rope access, welding services, and advanced UAV and ROV drone inspections, including operations in confined spaces and at height. Their expertise spans mining, oil and gas, construction, shipping, manufacturing, and power generation industries. TICS Groups provide comprehensive solutions such as ultrasonic and radiographic testing,
cylindrical designs, our experience covers all tank types across mining, refining, and processing sectors. Their team utilises advanced NDT techniques to identify corrosion, settlement, weld flaws, and structural distortion before they become major issues. All findings are compiled into detailed, data-driven reports that support informed maintenance decisions and regulatory compliance.
IMIS Group prides itself on delivering accurate, efficient, and traceable inspection outcomes, ensuring your assets remain compliant, safe, and productive.
For further information, visit: imisgroup.com
to support customers nationwide with faster access to products, training, and technical support.
Among RFS’s standout offerings is the Sonatest Veo3a cutting-edge Phased Array Ultrasonic Testing (PAUT) instrument. Designed for advanced inspections, the Veo3 features a high-resolution multi-touch display, intuitive user interface, and powerful onboard processing. It supports full matrix capture (FMC) and total focusing method (TFM), making it ideal for complex flaw detection and imaging. Its rugged, IP65-rated construction ensures it performs reliably in demanding field environments.
With a strong legacy and a future backed by Cebeco, Russell Fraser Sales remains dedicated to delivering the tools and expertise professionals need to inspect with confidence.
For further information, visit: rfsales.com.au
For further information, visit: imisgroup.com
advanced NDT techniques (PAUT, TOFD, ECA), corrosion mapping, leak detection, and RBI program development. TICS is also Lloyd’s Register-approved for ship hull inspections and certified for UAV operations.
Safety, integrity, and collaboration are at the heart of everything TICS Group does. As an IRATA member and ISO 9001, 14001, 17025, and 45001 certified company, the company maintains the highest quality and safety standards. The highly qualified TICS Group team is accredited by AINDT, PCN, API, IRATA, ensuring reliable, world-class service delivery.
Partner with TICS Group for innovative, technologydriven inspection and compliance solutions backed by decades of industry experience.
For further information, visit: ticsgroup.com.au

With 35,000 professionals across 60 countries, Wood PLC is one of the world's leading consulting and engineering companies operating across the energy and resources markets.
Here in Australia, the broad range of services Wood offers includes machinery vibration and lubrication analysis for all types of equipment, across all industries. Their certified personnel can provide end-to-end routine measurement, analysis, and reporting; alternatively, they can supplement your people to match your needs.
Wood is vendor-agnostic and works with a wide range of wireless, wired, and portable hardware and software platforms to provide routine and troubleshooting services to the very highest level.
Wood does not stop at finding and diagnosing problems. From skid to piping to vessel, Wood has an unrivalled
track record of engineering actionable solutions. They also offer machinery alignment and balancing, optical motion amplification, thermography, bearing failure analysis, root cause analysis facilitation, FEAs, flow analysis, noise studies and much more.
Wood also offers vibration and lubrication analysis training per ISO 18436 Parts 1 to 4, with optional AINDT certification. Their public courses are delivered in Perth and Brisbane by active principal practitioners with decades of experience; alternatively, we can provide bespoke courses at your site or venue.
They currently offer LCAT1, VCAT1 and VCAT2 training, and will be expanding their catalogue soon. The LCAT I and VCAT I courses each provide three days of training, plus a two-hour certification examination. The VCAT2 duration is four days of training, plus a three-hour certification examination.
For futher information, visit: vdn.woodplc.com
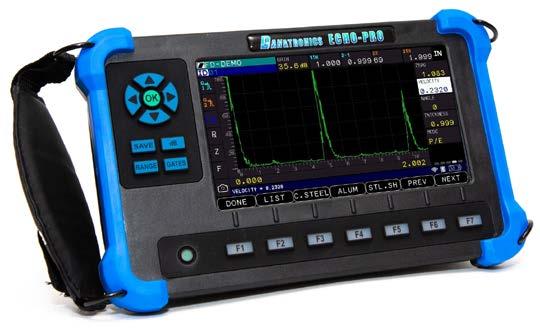

Engineered for Speed & Simplicity
Advanced imaging technology and an easy-to-use interface allow users of all skill levels to perform fast, accurate inspections—boosting performance and streamlining workflows.
Proven to Perform, Trusted to Deliver
An all-in-one imaging platform, coupled with unmatched portability and versatility, delivers exceptional results in even the most challenging inspection environments.
Designed to Evolve with Your Needs
With free quarterly software updates, the OmniScan X4 empowers you to continuously adapt to future inspection needs—ensuring that you’re always ready for what’s next.