Part II: The Learning State
MIDDLE EAST AND NORTH AFRICA REGION | ECONOMIC UPDATE OCTOBER 2022
Chapter 1: Towards a Learning State: Transparency and Accountability as the Key to Sustainable Recovery in the Middle East and North Africa
by Ferid Belhaj and Roberta Gatti
1. Towards a learning state in times of uncertainty 1
The shocks that have recently shaken the world—notably the COVID-19 pandemic and the Russian invasion of Ukraine— are causing significant disruptions globally. They are particularly damaging to the Middle East and North Africa (MENA). Higher prices—especially for food and energy—disproportionally affect the poor and threaten food security. Increases in interest rates bloat the cost of servicing public debt, which in the countries without substantial oil resources— such as Egypt, Jordan, and Tunisia—hovers around 90 percent or more of GDP. Part I explored some of the resulting vulnerabilities for MENA.
MENA’s current vulnerabilities are rooted in long-standing challenges. The regional development model of an “interventionist-redistributive” state (Yousef 2004) had increasingly shown its limits. This model resulted in persistent low growth, high debt, and the economic exclusion of young people, the disadvantaged, and, especially, women.
Today, heightened uncertainty puts heavy demands on the state: to inform and coordinate individual action during a pandemic; to sustain economic production through unprecedented cyclical swings; to protect the most vulnerable from poverty; to dial back the rapid losses in schooling and ramp up the capacity of health systems. Thanks to the current surge in oil prices, oil-exporting countries have the fiscal space to address these demands. Yet, because oil prices are predicted to be lower in the long run, these countries need to find ways to allocate resources effectively, especially as they move to diversity their economies. For oil-importing countries, these demands coincide with a dip in fiscal revenues and potential financial vulnerabilities, which puts a premium on reforms that can be implemented at limited cost. As never before, authorities must learn from the past, identify the state’s strengths and weaknesses, and be ready to change the direction of public policy towards increased effectiveness.
This is why, in Part II of this report we are keen to re-open the conversation about governance, particularly about two of its core dimensions—transparency and accountability. Good measurement and transparent information can shape an understanding of challenges shared across different stakeholders, within and outside the state. Accountability aligns incentives for action. Together, transparency and accountability are essential for a “learning state,” one that is well equipped to measure, experiment, and adjust policy action towards a common goal of inclusive and sustainable development—with reforms that require political will but that are not necessarily costly fiscally.
2. Current vulnerabilities atop long-standing challenges
The MENA region has great potential but often produces great disappointment. Rich in history and resources and blessed with favorable demographics and a strategic geopolitical position, MENA economies could be flourishing. But most are not. To be sure, in the past decades there have been improvements in various dimensions of wellbeing—such as increased school enrollment and decreased infant mortality.2 For example, infant mortality has dropped from 51.5 per 1000 live births to 18.4 in the past 30 years, most countries have achieved universal primary enrollment, and secondary school enrollment has increased from 29.7 percent in 1971 to 88.4 percent in 2018. Moreover, these improvements have been particularly impressive for young girls, whose enrollment in secondary school increased by 110 percent between 1980 and 2020.
1 We are grateful to Daniel Lederman for deep and thoughtful discussions and to Ha Nguyen for useful inputs and invaluable help in managing the process of bringing the volume together. Many thanks also to Ernest Sergenti and Kevin Carey for useful comments and to Hoda Assem and Rana Lotfi for excellent research assistantship. 2 Iqbal and Kiendrebogo (2015).
30 CHAPTER 1: TOWARDS A LEARNING STATE: TRANSPARENCY AND ACCOUNTAB ILITY AS THE KEY TO SUSTAINABLE RECOVERY IN THE MIDDLE EAST AND NORTH AFRICA MIDDLE EAST AND NORTH AFRICA REGION | ECONOMIC UPDATE OCTOBER 2022
Lebanon, Libya, Oman, Syria, the UAE, West Bank and Gaza and Yemen are excluded due to lack of TFP data. HIC, MIC and LIC average annualized TFP growth for the period are obtained by finding the median of the average annualized TFP growth per country for the period for each corresponding income classification. Calendar Year 2000 World Bank Income Classification is used. HIC global median average annualized GDP per capita growth rate is 0.2 percent. MIC global median is 0.46 percent and LIC global median is 1.4 percent.
Yet, the region falls short of its potential. Economic growth has been stubbornly low. For example, the region would be about 30 percent richer had it grown in the past two decades at the rate of the typical country in the same income group. Productivity growth has also lagged, even in Morocco and Egypt—the two economies with the fastest growth rates in the region—suggesting that not only has growth been low, it has also been inefficient, including through an unfinished process of structural transformation (see Figure 1).
Oil price vagaries played an important role in growth and fiscal patterns in oil-exporting countries. Growth in some of the oil-importing countries was accompanied by a significant buildup of public debt (see Figure 2).
whatever growth occurred did not result in the creation of quality jobs. The region displays the typical features of labor market duality, with a high level of informal employment on
hand
sought-after public employment
the scarcity of high-productivity jobs in the private sector is glaring (see Figure 3), as is the low level
other. The mismatch between the large number of new labor market entrants
of 20 percent, is the lowest in the world.3
Still,
one
and
on the
and
of female labor force participation—which, at an average
3 Gatti et al. (2014) and Islam et al. (2022). Figure 2. Median public debt and oil prices in MENA, 2009–present Public debt, percent of GDP Oil prices 90 80 70 60 50 40 30 20 10 0 2009 2010 2011 2012 2013 2014 2015 2016 2017 2018 2019 2020 20212022f 120 100 80 60 40 20 0 GCC Middle-income MENA oil exporters ▬ Middle-income MENA oil importers ▬ Average oil price (rhs) Source: Macro Poverty Outlook - October 2022, Statista (Average Annual Oil Prices) and World Bank staff calculations. Note: GCC includes Bahrain, Kuwait, Oman, Qatar, Saudi Arabi and the UAE, Middle Income MENA Oil Exporters includes Algeria, Iran and Iraq, Middle Income MENA Oil Importers includes Djibouti, Egypt, Jordan, Lebanon, Morocco, Tunisia and West Bank and Gaza. Figure 1. GDP per capita and total factor productivity growth (2000–2019) Panel A. GDP per capita Panel B. Total factor productivity Annualized 2000–2019 GDP per capita growth, percent Average annualized growth rate, percent 3 2 1 0 -1 -2 -3 -4 Yemen,Rep.DjiboutiMoroccoEgypt,ArabRep. WestBankandGazaJordanIran,IslamicRep.AlgeriaIraqTunisiaLebanon SyrianArabRepublicLibyaOmanSaudiArabiaBahrainKuwaitQatar UnitedArab Emirates 2.14 2.10 0.85 2 1 0 -1 -2 -3 -4 -5 MoroccoEgypt,ArabRep. Jordan Iran,IslamicRep. TunisiaSaudiArabia Bahrain Kuwait QatarIraq 1.44 0.46 0.23 HIC median MIC median LIC median HIC median MIC median LIC median Source: World Development Indicators, Penn World Table and World Bank staff calculations. Note: Panel A: Sample covers 185 countries, of which 19 are MENA countries. Countries are ranked in ascending order of 2000 GDP per capita (current USD). Average annualized compounded GDP per capita growth is calculated using data on GDP per capita for 2000 and 2019 (constant LCU) except for Djibouti (2013 to 2019) and Syria (2000 to 2018). HIC, MIC and LIC average annualized GDP per capita growth for the period are obtained by finding the median of the average annualized compounded GDP per capita growth per country for the period for each corresponding income classification. Calendar Year 2000 World Bank Income Classification is used. HIC global median average annualized compounded GDP per capita growth rate is 0.85 percent and MIC and LIC global median is 2.1 percent. Panel B: Sample covers 116 countries, of which 10 are MENA countries that have TFP data. Algeria, Djibouti,
31CHAPTER 1: TOWARDS A LEARNING STATE: TRANSPARENCY AND ACCOUNTAB ILITY AS THE KEY TO SUSTAINABLE RECOVERY IN THE MIDDLE EAST AND NORTH AFRICA A NEW STATE OF MIND: GREATER TRANSPARENCY AND ACCOUNTABILITY IN THE MIDDLE EAST AND NORTH AFRICA PART II: THE LEARNING STATE
This lack of dynamism in labor markets is also reflected in growing spatial inequality, that is in the distribution of resources and services across geographic locations. Spatial inequality within MENA countries is among the highest when measured against comparator economies of similar per capita GDP in other regions. Regional inequality contributes to a 63 percent larger share of inequality in MENA than elsewhere in the world. And the data show that, in MENA, an individual’s trajectory is overwhelmingly determined by where he or she is born, not by their skills or effort.4 In other words, for MENA, geography is destiny.
Today’s economic choices affect the sustainability of development. This is not only the case for public debt accumulation, which is particularly worrisome in oil-importing countries, but also for the short-sighted management of natural capital. In discussions of natural capital, MENA is almost automatically associated with oil and gas. But both land and water are fundamental to the development of the region and they are increasingly under threat. The mismatch between the projected increase in demand for land due to demographic and economic trends and the decreasing land supply due to climate and governance factors portends a crisis. The same forces that put pressure on land, also do so on water. Even with massive investments, MENA is predicted to drop below the absolute water scarcity threshold of 500 cubic meters per person per year by 2030.5
It is probably an understatement to say that development in the region has fallen short of its people’s expectations. Data confirm this. With few exceptions, life satisfaction in MENA countries is below what their income levels would predict and has dropped significantly over the past 15 years (see Figure 4).6
Part II of this report argues that poor governance, and, in particular, the lack of government transparency and accountability, is the common thread underlying these problems. Such a “governance deficit” is particularly stark in
4 Belhaj and Gatti (2021) and World Bank (2020c).
5 Falkenmark et al. (1989).
6 Many explanations have been proposed to make sense of the increase in dissatisfaction in the region, including increase in aspirations and people’s aversion to inequality and social injustice. Devarajan and Ianchovichina (2018) argue that, before the Arab Spring, dissatisfaction was triggered by the poor quality of public services, a shortage of formal sector jobs, and widespread corruption.
Figure 3. Informality and youth unemployment in MENA Panel A. Informal employment as a share of total employment Panel B. Youth unemployment rates for 15–24 year-olds have been persistently high in the MENA region Percent Lebanon Bahrain Saudi Arabia Tunisia Jordan West Bank & Gaza Egypt Morocco 01020304060 50 8070 40 16 27 51 59 64 69 77 30 25 20 15 10 5 0 MENA SA LAC ECA SSA EAP Percent J 2019 z 2000 z 2010 Source: Islam et al. (2022).
32 CHAPTER 1: TOWARDS A LEARNING STATE: TRANSPARENCY AND ACCOUNTAB ILITY AS THE KEY TO SUSTAINABLE RECOVERY IN THE MIDDLE EAST AND NORTH AFRICA MIDDLE EAST AND NORTH AFRICA REGION | ECONOMIC UPDATE OCTOBER 2022
Libya, Syria and Yemen—where the great hopes sparked during the Arab Spring were dashed by drawn-out conflict—and in Lebanon—where entrenched rent-seeking elites plunged the country into one of the world’s most severe economic collapses since the 1850s.7 Yet poor governance has also hurt all countries in the region in various ways. While playing into the hands of ruling elites, poor governance has stunted MENA’s long run economic prospects, weakened its fiscal stance, and permitted, even encouraged, the overuse of some of its most precious natural resources, such as land and water. By doing so, it has also limited the region’s resilience to shocks—whether a pandemic, a sudden change in the terms-of-trade, or climate change. For example, by increasing financing needs and keeping growth low, poor governance results in public debt build up, in part because a lack of transparency creates uncertainty among lenders, driving up financing costs.8 In turn, high debt displaces the public spending that is needed to respond to a recession, thereby reducing an economy’s resilience to the shock at hand. Or, as happened during the COVID-19 pandemic, the lack of well-established measurement systems of contagion and communication impaired the crisis response, generating not only economic costs but also uncounted preventable deaths in the early days.9
As the contributions to the rest of Part II of this report will show, governance means different things in different sectors of the economy. Yet, no matter whether the relevant element is accountability, transparency, or legitimacy, two clear messages emerge. First, that establishing elements to allow the state and the bureaucracy to measure results, align responsibilities, experiment, and learn is essential in times of high demands on the state and high uncertainty. Yet the culture of institutional learning in MENA is, at best, still emerging. Second, the upsides of improving governance are enormous, not only because the benefits are large, but because the reforms needed to put institutions on a learning path are within reach and not costly. For example, improving data openness—with its implied benefits of better resourcetargeting, planning, and evidence-based policies—could be achieved with something akin to a stroke of a pen. In other words, the region’s governance deficit could become a governance dividend at little fiscal cost. This makes improving
7 World Bank (2022). 8 Gatti et al. (2021). 9 Gatti et al. (2021). Figure 4. Life satisfaction in MENA (2006–2020) Panel A. Life satisfaction and GDP per capita Panel B. Average life satisfaction in MENA region Life satisfaction Life satisfaction 6789 10 11 12 8 7 6 5 4 3 ARE BHR DZA EGY IRN IRQ JOR KWT LBN LBY MAR OMN PSE QATSAU TUN 5.8 5.6 5.4 5.2 5.0 4.8 4.6 2006 2007 2008 2009 2010 2011 2012 2013 2014 2015 2016 2017 2018 2019 2020 Log GDP per capita Year Source: Gallup World Poll and World Development Indicators Note: Life Satisfaction is measured using a 10-point scale measure of life satisfaction on the following question: “Please imagine a ladder with steps numbered from 0 at the bottom to 10 at the top. Suppose we say that the top of the ladder represents the best possible life for you, and the bottom of the ladder represents the worst possible life for you. On which step of the ladder would you say you personally feel you stand at this time, assuming that the higher the step the better you feel about your life, and the lower the step the worse you feel about it? Which step comes closest to the way you feel? Life satisfaction measures the mean response by country for the period 2006–2020. Panel A includes 157 countries of which 16 are MENA countries. Djibouti, Syria and Yemen are excluded due to the lack of data on GDP per capita. Panel B includes the mean response for 19 MENA countries. 33CHAPTER 1: TOWARDS A LEARNING STATE: TRANSPARENCY AND ACCOUNTAB ILITY AS THE KEY TO SUSTAINABLE RECOVERY IN THE MIDDLE EAST AND NORTH AFRICA A NEW STATE OF MIND: GREATER TRANSPARENCY AND ACCOUNTABILITY IN THE MIDDLE EAST AND NORTH AFRICA PART II: THE LEARNING STATE
governance particularly timely now for countries with limited fiscal space. And for those countries where temporarily high oil prices granted a budget respite, this is an opportunity to experiment and learn what policies can be effective to tackle long-run challenges such as diversification.
The definition of what constitutes good governance usually has many aspects. In the case of MENA, the question of good governance has often been subsumed under a discussion about the role of the state and whether the state should be a producer or a regulator of economic activity. This report is not about the role or even the size of the state in MENA. While in some cases achieving more accountability and transparency will imply a rethinking of the role of the state—moving away from centralized decision-making towards a role of steward and fair regulator of the economy— the message of Part II of this report is more nuanced. It is about how the state, policymakers, and bureaucracies can learn about what they are doing well and what they are doing less well—and how they can progressively adjust what they are doing. Similarly, while accountability and transparency, with their resulting pluralism of information, are features of many democracies, this report is not about political systems. Instead, it is about how establishing a data infrastructure, a culture of experimentation, and accountability systems can help the state be more effective in responding to the needs of its citizens in times of high uncertainty.
3. A roadmap
Although there is no silver bullet in development, the messages of all the contributions in Part II point to improving governance—especially transparency and accountability—as the pathway towards unlocking the region’s low-growth and inefficient equilibrium to create the preconditions for employment-rich growth and for a more efficient and fair use of public resources.
Development is a complex, non-linear process. The shocks that increasingly roil the world—of which the COVID-19 pandemic and the war in Ukraine are just examples—overlay long-run forces such as technological growth, demographic change, climate change, and migration. Countries not only need to be able to ride the waves of long-run change productively, but also prepare for and cushion the effects of negative shocks that are becoming more and more frequent.
The resilience needed to recover from negative shocks depends critically on good governance and, especially, on transparency and accountability. Measurement and transparent information can shape an understanding of the challenges shared by different stakeholders, providing the feedback loops needed for learning. By identifying responsibilities and potential consequences of inaction, accountability aligns incentives for action. Transparency and accountability are, respectively, the instrument and the incentives for economic actors to learn from their actions and to course correct as needed to better achieve their objectives. Through this iterative process, bureaucracies learn, capacity improves, and action is progressively based on rigorous evidence.
In MENA, the benefits of better governance would go well beyond managing current risks. In education, a commitment to measure learning systematically, with feedbacks to teachers and principals, could significantly improve learning. For the private sector, levelling the playing field between private and public firms and reshaping the role of the state toward stewardship of the economy (rather than direct intervention) would unlock significant productivity and heighten employment growth potential. In a critical sector such as water, increasing the accountability of frontline providers might help moderate use and progressively fill significant fiscal gaps, such as those caused by the systematic failure of
34 CHAPTER 1: TOWARDS A LEARNING STATE: TRANSPARENCY AND ACCOUNTAB ILITY AS THE KEY TO SUSTAINABLE RECOVERY IN THE MIDDLE EAST AND NORTH AFRICA MIDDLE EAST AND NORTH AFRICA REGION | ECONOMIC UPDATE OCTOBER 2022
customers to pay for water. In digital technologies, strengthening consumer protection in e-commerce transactions and improving data governance could increase citizens’ trust in digital payments and, thus, accelerate their uptake. As such, better governance has the potential to foster inclusive, accelerated, yet sustainable, development for the region.
Part II is structured as follows. It opens with four essays that touch on cross-cutting issues. Hoda Assem examines measured accountability across regions and within MENA. Johannes Hoogeveen documents the current lack of data and access to data in the region, together with the great benefits that might accrue to countries with more transparency. Sergio de Cosmos and coauthors reflect on the preconditions for transitioning out of fragility and conflict in the region, based on their work on the Building for Peace project. Daniel Li Chen and Manuel Ramos Maqueda assess the centrality of a well-working justice system to good governance and to improving incentives for investment and growth.
Part II then examines essential elements of economic development across different sectors of the economy: human capital, itself a core pillar of growth, with contributions by Robert Prouty on the central role of governance in improving learning; Asif Islam and Federica Saliola on the importance of rethinking the role of the state to promote a dynamic private sector and, with it, robust job growth; Nelly Elmallakh on the benefits of well managed migration processes. It then moves to exploring how better governance can help manage the natural capital of the region—land and water. Technological change is the key engine of long-run productivity growth, and digital advances are an important part of it. Christina Wood discusses how good governance’s complements—such as data privacy and consumer protection—are needed if digital payments are to take off fully in the region. Separate contributions from Ha Nguyen and Rana Lotfi and from Somik Lall discuss the role of accountability and decentralization in two complementary aspects of effective fiscal policy: as a tool to smooth consumption over time, looking into fiscal policy countercyclicality, and as an instrument to redistribute across space, focusing on fiscal transfers.
The remainder of this introductory chapter to Part II will discuss some of the key literature on the role of governance in economic development. It will then weave in the common themes that emerge from the cross-cutting and sector-specific contributions to this volume.
4. A governance deficit as the common denominator of stagnant development in MENA
What is Governance and Why Does It Matter?
There are many definitions of governance. The one put forth by the Oxford Handbook of Governance is particularly useful because of its discipline and comprehensiveness: “Governance…has at least four meanings in the literature: a structure, a process, a mechanism, and a strategy. As a structure, governance signifies the architecture of formal and informal institutions; as a process, it signifies the dynamics and steering functions involved in lengthy never-ending processes of policymaking; as a mechanism, it signifies institutional procedures of decision-making, of compliance and of control (or instruments); finally, as a strategy, it signifies the actors’ efforts to govern and manipulate the design of institutions and mechanisms in order to shape choice and preferences.” Under the umbrella of this comprehensive definition are the laws, regulations, judicial decisions and administrative practices (the “structures”); the practices of governing and exercising power (the “processes”); the institutionalization of decision making (the “mechanisms”), and the very design, creation and adaptation of governance systems (the “strategy”) (Levi-Faur 2012).
35CHAPTER 1: TOWARDS A LEARNING STATE: TRANSPARENCY AND ACCOUNTAB ILITY AS THE KEY TO SUSTAINABLE RECOVERY IN THE MIDDLE EAST AND NORTH AFRICA A NEW STATE OF MIND: GREATER TRANSPARENCY AND ACCOUNTABILITY IN THE MIDDLE EAST AND NORTH AFRICA PART II: THE LEARNING STATE
Good governance matters for good development outcomes. Key elements include the characteristics of political institutions (that is, the process of decision making and the checks on political power), state capacity, and how the state intervenes in economic activity—in other words, how it regulates economic institutions (North et al. 2008).
Because there are so many overlapping factors that affect growth and there is a two-way relationship between governance and development, it has been difficult to estimate the causal effect of governance on development across countries. Competing determinants of development explored in the literature include trade, culture, geography, and access to knowledge about what the “right policies” are. In their seminal 2001 paper, Acemoglu, Johnson and Robinson posit that institutions—the panoply of formal and informal organizations, laws, norms, and traditions that shape society—are the crux of economic development. The three authors rely on a novel estimation strategy and find that institutions have a large positive impact on economic performance and incomes per capita. In other words, institutions are more important than geography and trade in explaining differences in economic development.
Measuring governance is as complex as defining it. One of the most widely used measures of governance is the Worldwide Governance Indicators (WGI).10 WGI covers six dimensions of governance: ability; political stability and absence of violence/terrorism; government effectiveness; regulatory quality; rule of law; control of corruption. These indicators represent the combined views of a large number of enterprises, citizens and experts who respond to surveys conducted in industrial and developing countries. According to WGI, the MENA region performs poorly in a number of dimensions, particularly, in “voice and accountability” (see Figure 5).
Zeroing In on Transparency and Accountability
Figure 5. Worldwide Governance Indicators,
In many, if not all, definitions of governance, transparency and accountability are core parts of the fabric of good governance. This is not only the case for international literature, but also for how “good governance” is defined and interpreted by local actors. For example, the Egyptian Administrative Control Authority defines governance as “the good management of all institutions in the state through policies, mechanisms and practices based on transparency, participation, accountability, rule of law, combating corruption, striving to achieve justice and non-discrimination between citizens, responding to their needs, and seeking efficiency to reach policies and services to the highest level of effectiveness and quality to the satisfaction of citizens.”11
Access to credible data empowers bureaucracies and citizens by giving them the information needed to hold public actors accountable. Information provides the basis for creating a system that defines responsibilities and consequences for public actors and gauges their performance. In a world where uncertainty dominates, not only do transparency and accountability reinforce each other, they are essential to a process of iterative institutional learning. Unfortunately, the MENA region falls short in both dimensions.
10 Kaufman et al. (2010). 11 Egyptian Administrative Control Authority. See also The Egyptian Center for Economic Studies; Government of Dubai; UAE Government Blog
1996–2020 2.0 1.5 1.0 0.5 0 -0.5 -1.0 -1.5 East Asia Pacificand Europe Central Asiaand Latin America and the Caribbean Middle East North Africaand Sub-Saharan Africa South Asia North America ▬ Voice and Accountability ▬ Political Stability and Absence of Violence Government Effectiveness Regulatory Quality Rule of Law Control of Corruption Source: Worldwide Governance Indicators (WGI). Note: The figure plots the six WGI for the different geographical regions. The aggregate indicators are: Voice and Accountability, Political Stability and Absence of Violence/Terrorism, Government Effectiveness, Regulatory Quality, Rule of Law and Control of Corruption. 36 CHAPTER 1: TOWARDS A LEARNING STATE: TRANSPARENCY AND ACCOUNTAB ILITY AS THE KEY TO SUSTAINABLE RECOVERY IN THE MIDDLE EAST AND NORTH AFRICA MIDDLE EAST AND NORTH AFRICA REGION | ECONOMIC UPDATE OCTOBER 2022
Transparency
There are many aspects to government transparency, but a core feature is the quality, regularity and openness with which governments produce and share data, Johannes Hoogeveen writes in Chapter 3. Open access to high quality data about the economy—whether about the welfare of households, macroeconomic aggregates, or firm dynamics—carries multiple benefits. For one, access to and good use of data allow policymakers to plan effectively (Rodrik 2010), including having the chance to aim often scarce resources to where they can have the most impact (Gatti et al. 2021). Recent evidence shows that data transparency is associated with higher GDP per capita (Islam and Lederman 2020) and that a better data ecosystem is associated with more accurate and realistic growth forecasts (Gatti et al. 2022). In turn, better forecasts are the basis for more realistic fiscal budget planning, highlighting one of the key costs of not producing relevant and credible official statistics.
With few exceptions, statistical capacity in MENA countries is below what their income level or economic complexity would predict (see Figure 6). This relative underperformance is associated with a stagnation in statistical development over the past decade-and-a-half in the non-fragile countries in the region, and rapid declines in fragile countries.
Figure 6. Statistical capacity and development in MENA
Two key features account for this underperformance. First, data are not collected with the same frequency as in income comparator countries. For example, Ekhator-Mobayode and Hoogeveen (2021) show that population censuses were collected in the past decade in only 13 of the 20 MENA countries and establishment censuses were conducted in only nine countries. Similarly, in the past five years, only half of the countries fielded a national survey on consumption aggregates and the labor force, while only one quarter of the countries surveyed health and economic enterprises. Second, and probably more problematic, is that often, even when data are collected, they are not accessible to the public (see Figure 7).
Accountability
We saw previously that, based on WGI, “voice and accountability” are the key elements of governance in which MENA falls short dramatically in comparison to other regions. While the WGI have the significant advantage of providing cross country benchmarking over time for various dimensions of governance, the methodology of their construction is not informed by an underlying conceptual framework.
A recent article by Lührmann et al. (2020) fills this conceptual gap for the accountability dimension of governance. The authors define accountability as “de facto constraints on the government’s use of political power” and distinguish among vertical accountability (between citizens and elected officials), horizontal accountability (the checks and balances through which state institutions limit the power of the government), and diagonal accountability (which captures the extent to which governments are accountable to media and civil society).
effort maps this conceptual framework
Ì
Ì
Their
Statistical Performance Index (2019) 100 80 60 40 20 68 10 12 DJI PSE MAR JOR IRQ TUN DZA EGY IRN LBN LBY SAU KWT ARE QAT Per capita GDP (2019, log, PPP) Predicted SPI 2019 Source: Hoogeveen (2022). 37CHAPTER 1: TOWARDS A LEARNING STATE: TRANSPARENCY AND ACCOUNTAB ILITY AS THE KEY TO SUSTAINABLE RECOVERY IN THE MIDDLE EAST AND NORTH AFRICA A NEW STATE OF MIND: GREATER TRANSPARENCY AND ACCOUNTABILITY IN THE MIDDLE EAST AND NORTH AFRICA PART II: THE LEARNING STATE
Saudi
Tunisia United Arab Emirates
Bank
Figure 7. Public accessibility of microdata sets Countries/data category Establishment survey Consumption survey Labor force survey Health survey Population census Economic census Algeria Bahrain Djibouti Egypt Iran Iraq Jordan Kuwait Lebanon Libya Malta Morocco Oman Qatar
Arabia Syria
West
and Gaza Yemen Total surveys with microdata publicly accessible (indicated accessible on NSO website)/microdata collected 1 (1)/5 7 (4)/12 4 (3)/11 3 (0)/6 3 (1)/14 2 (2)/9 J Microdata not collected J Microdata collected but not publicly shared J Microdata collected and publicly shared Source: Adapted from Ekhator-Mobayode and Hoogeveen, 2021. Note: Total surveys and censuses with some degree of microdata accessibility on national statistical office (NSO), World Bank, International Household Survey Network, Integrated Public Use Microdata Series, Eurostat, Demographic and Health Survey, and Multiple Indicator Cluster Survey websites. Figure 8. Dimensions of accountability across regions, over the past two decades: Averages and evolution over time Panel A. Accountability scores by region Panel B. Accountability scores over time Accountability measures across regions, 2000–2020 Aggregate Accountability Index by geographical region, 2000–2020 1.0 0.9 0.8 0.7 0.6 0.5 0.4 0.3 0.2 0.1 0 NorthAmerica ECA MENA EAP LAC SA SSA Allcountries 1.0 0.9 0.8 0.7 0.6 0.5 0.4 200020012002200320042005200620072008200920102011201220132014201520162017201820192020 J Aggregate Accountability J Vertical Accountability North America ECA LAC EAP SAR SSA MENA J Horizontal Accountability J Diagonal Accountability Source: Lührmann et al. (2020); V-Dem v-12. Note: Panel A presents bar charts of the average accountability scores by geographical region. The regions are in descending order by average GDP per capita while Panel B displays the evolution of average accountability scores by geographical region over time. 38 CHAPTER 1: TOWARDS A LEARNING STATE: TRANSPARENCY AND ACCOUNTAB ILITY AS THE KEY TO SUSTAINABLE RECOVERY IN THE MIDDLE EAST AND NORTH AFRICA MIDDLE EAST AND NORTH AFRICA REGION | ECONOMIC UPDATE OCTOBER 2022
to measurement, using the dataset compiled by Varieties of Democracy (V-Dem) to construct indices for all three subcomponents of accountability (Coppedge et al. 2022). V-Dem uses experts to code various activities (among them, the caliber of the judicial system and the quality of elections), which the project aggregates using an item-response theory.12 In Chapter 2 of this report, Assem analyzes the variation of the resulting indicators for the three measures of accountability. Her analysis paints a picture similar to, if starker than, the “voice and accountability” WGI indicator. MENA underperforms all regions of the world, with diagonal and horizontal accountability equally low, and vertical accountability marginally better but still below the rest of the world.
Measured accountability has not changed significantly on a global basis since the beginning of the millennium, although both South Asia, and to a lesser extent, MENA, experienced an uptick after 2011. The slight improvement in MENA was due to the improvement of vertical accountability in Tunisia after the transition from Ben Ali’s dictatorship to democracy (see Figure 8, Panel B). Because of vast differences in living standards and political forms within MENA, regional averages can miss interesting variations across countries. Yet, by benchmarking countries vis-a-vis income per capita, Assem shows that all MENA countries lie below the predicted level of accountability given their level of development (see Figure 9). The gap is particularly large for the Gulf Cooperation Council (GCC) countries (Bahrain, Kuwait, Oman, Qatar, Saudi Arabia, United Arab Emirates). All MENA countries perform better in horizontal accountability than they do in diagonal accountability. Notably, the least developed dimension in terms of horizontal accountability is the presence of independent institutions that might exert control over the executive.13
Strengthening Institutions: Fairer and More Efficient Justice
Figure 9. Aggregate accountability index and per capita Gross Domestic Product (GDP)
In Chapter 5, Chen and Maqueda highlight the direct relationship between justice and the four elements of governance in the Oxford definition. As a structure, the justice system is a formal institution that provides the capacity to independently resolve disputes according to the law, which is an essential service to citizens and business. This function is especially important for vulnerable populations, who need the justice system to counter power asymmetry. As a process, the judiciary also holds the executive and the legislative branches of government accountable, serving as an independent and autonomous branch that ensures the impartial and fair resolution of legal conflicts—a function that speaks to the concept of horizontal accountability that Assem analyzed using the V-Dem data. As a mechanism of governance, the judiciary shares the characteristics of any bureaucracy: it requires a set of
procedures
formalistic institutional
through 12 Item Response Theory (IRT) is a mathematical technique that explains the relationship between hard-to-observe activities and their observable manifestations (Cai and Thissen, 2014). 13 Examples of such institutions include, but are not limited to, the ombudsman, attorney general or public prosecutor.
Aggregate accountability index 1.0 0.9 0.8 0.7 0.6 0.5 0.4 0.3 0.2 0.1 0 68 91011127 ARE BHR DJI DZA EGY IRN IRQ JOR KWTLBN LBY MAR OMN PSE QATSAU TUN Log GDP per capita, PPP Source: Assem (2022). Accountability data is from Lührmann et al. (2020); V-Dem v-12 is from Coppedge et al. (2022) and GDP per capita is from World Development indicators. Note: The scatter plot shows average accountability scores according to the geographic region from 2000 to 2020. The red dots represent Middle Eastern and North African countries, and the gray dots represent nonMiddle Eastern and North African countries. The solid line represents an ordinary least squares regression of accountability score on log per capita gross domestic product. 39CHAPTER 1: TOWARDS A LEARNING STATE: TRANSPARENCY AND ACCOUNTAB ILITY AS THE KEY TO SUSTAINABLE RECOVERY IN THE MIDDLE EAST AND NORTH AFRICA A NEW STATE OF MIND: GREATER TRANSPARENCY AND ACCOUNTABILITY IN THE MIDDLE EAST AND NORTH AFRICA PART II: THE LEARNING STATE
which matters proceed and decisions follow. As a strategy, the design of the justice system is a conscious or subconscious policy choice, because procedural aspects of law can have substantive effects on citizens. For instance, any increase in the cost of filing—monetary or procedural—disproportionately burdens those who lack financial resources and legal expertise. In short, designing justice is an art of governance.
Effective justice systems matter not only intrinsically, but also because they facilitate economic development in many ways: by enforcing contractual agreements, resolving legal disputes, promoting social cohesion, and building trust among market stakeholders and towards government institutions. Earlier, this chapter briefly discussed how, in the aggregate, institutions, rather than geography or openness to trade, have been established as the key drivers of economic development. A growing body of experimental and quasi-experimental literature using microdata is shedding light on the mechanisms through which well working judicial systems affect economic outcomes. By reducing risk in contract enforcement, better justice improves firm-to-firm trade (Chemin 2012), increases investment (Crawford et al. 1978; Chakraborty et al. 2018) and promotes productive use of credit (Shvets 2013). As a result, entrepreneurship and firm size can also increase along with stronger justice systems and greater access to justice (Lichand and Soares 2014; Laeven and Woodruff 2004). There is also a fundamental distributional aspect to well-working justice systems: access to justice increases productivity and protects citizens at risk of conflict or when laws are biased against them (Aberra and Chemin 2021; Blattman et al. 2014; Sandefur and Siddiqi 2013). A more limited, but growing, academic literature finds that the presence of a strong justice system can lower corruption (Litschig and Zamboni 2018).
The challenges to building strong and binding judiciaries run deep in MENA. In fragile and conflict-affected countries, civil, commercial and administrative justice services are barely available to non-existent. In middle-income countries, underfunded justice institutions cannot deliver adequate justice services to citizens and businesses, not to mention to the large numbers of refugees who are excluded from the justice system and discriminated against. High-income countries still have high levels of inequality, and vulnerable groups with little voice face discrimination in the legal system. In terms of access to justice, which has been stagnant for decades, MENA is the worst among all regions in the world (see Figure 10).
Strengthening the certainty, speed, and inclusiveness of justice systems in MENA would go a long way towards creating a rule-based system, which could have high payoffs for development in all sectors.
Figure 10. Access to justice by region, 1946–2020 Access to justice, average of country-specific values 1.0 0.9 0.8 0.7 0.6 0.5 0.4 0.3 0.2 0.1 0 19461948195019521954195619581960196219641966196819701972197419761978198019821984198619881990199219941996199820002002200420062008201020122014201620182020 East Asia Europe LAC MENA North America SA SSA Source: Varieties of Democracies 2022. 40 CHAPTER 1: TOWARDS A LEARNING STATE: TRANSPARENCY AND ACCOUNTAB ILITY AS THE KEY TO SUSTAINABLE RECOVERY IN THE MIDDLE EAST AND NORTH AFRICA MIDDLE EAST AND NORTH AFRICA REGION | ECONOMIC UPDATE OCTOBER 2022
5. Rethinking governance in the economy: Sectoral perspectives
Better transparency, accountability, and more effective justice systems would bring broad-based gains to all sectors— similar to how a general-purpose technology—say electricity—can increase productivity across the board. The deep dives in Part II show how better governance can be transformational within each sector.
Skills and Productivity at a Crossroad
Human capital, especially skills, accounts for an important part of income differences across countries.14 MENA has a young population, and many have argued that now is the time to reap the demographic dividend. Yet, many workingage people in MENA—particularly women—are either unemployed or work in jobs in which they cannot fully use their skills to increase their productivity. The mismatch between the demographic dynamic and the scarcity of jobs translates into a strong push on people to migrate, which adds to an already large number of people displaced nationally and internationally by conflict in the region.
Better governance can be instrumental in improving schooling; in creating a level-playing field for private sector firms to compete fairly, grow, and create jobs; and in making migration both more productive and safer.
Ì Schooling
According to the Human Capital Index (HCI)—a World Bank measure of the future productivity of a child born today— someone born before the pandemic in the MENA region could expect to be only 57 percent as productive as a counterfactual worker who experienced full health and good schooling (World Bank 2021). Much of this productivity gap between the actual and the counterfactual results from shortfalls in learning, reflecting the reality that while access to education has improved in MENA over the past decades (at a rate faster than in other regions), the quality of education did not. For example, as of 2019, in Egypt only 47 percent of grade 8 students reached the “low” international benchmark of performance in mathematics, compared with the international median of 84 percent. (Kazem 2019). When harmonized for benchmarking purposes, students in Egypt score 356 on a scale in which 625 represents advanced attainment and 300 represents minimum attainment (World Bank 2020b). Moreover, if looked at through a distributional lens, measured differences in learning vary significantly, depending upon a family’s socio-economic condition (World Bank 2020a). The pandemic has strongly exacerbated these differences, with school closures resulting in significant learning losses, especially for children coming from the most disadvantaged backgrounds.
Many factors contribute to learning success. They include: well-trained teachers, effectively managed schools, involved families, and clear and available learning materials and textbooks. No single recipe can work for all countries. Yet, switching to a mindset that assesses learning regularly, acts on evidence, and aligns the incentives of the many actors involved is likely to foster an education system that works for learners (World Bank 2018). Albeit in different ways, education systems in a number of MENA countries fall short of creating an ecosystem in which learning measurement is regular, evidence is used for change, and stakeholders’ incentives are aligned for better learning.
14 Flabbi and Gatti (2018). 41CHAPTER 1: TOWARDS A LEARNING STATE: TRANSPARENCY AND ACCOUNTAB ILITY AS THE KEY TO SUSTAINABLE RECOVERY IN THE MIDDLE EAST AND NORTH AFRICA A NEW STATE OF MIND: GREATER TRANSPARENCY AND ACCOUNTABILITY IN THE MIDDLE EAST AND NORTH AFRICA PART II: THE LEARNING STATE
In Chapter 6, Prouty spells out the three core elements of education governance: setting standards, assessing progress, and ensuring accountability. To be sure, ministries of education (MOE) in most MENA countries have by now set forth national curricula that articulate learning objectives of subject-matter mastery for teachers and students. However, many of the region’s MOEs have not used learning objectives effectively to monitor learning outcomes or to introduce inquiry-based approaches to teaching and learning. And, although about half of the countries in the region conduct systematic learning assessments, few use the results of those assessments to address weaknesses in student performance. This type of measurement must be utilized if countries are to shift from input and process-driven methods—still all too pervasive—to a focus on results. Finally, accountability will require communicating progress towards goals with clarity, building on evidence to identify actions and responsibilities so that the needed follow up happens. There are some indications of reform in this direction. For example, school report card initiatives in Jordan, Kuwait, Morocco and the UAE (Dubai).15 But responsibilities in education systems tend to be more centralized in MENA than in other regions. More agency for principals, teachers, and schools—together with measurement and clear accountability systems—can put MENA’s education systems on an accelerated trajectory toward a better educated future workforce with more skills.
Ì Jobs
Improving schooling will not translate into increased productivity if economies in MENA are unable to generate the jobs needed for the large cohorts of young people that join the labor market every year. In MENA, private sector growth, and with it the overall economy’s growth, is stifled by strong barriers to companies seeking to enter or leave a market—that is, by a lack of contestability. In Chapter 7, Islam and Saliola show that state-owned enterprises (SOEs) in MENA play a dominant role in many sectors, not only in those with a natural monopoly or other intractable market failures, but also in such sectors as manufacturing, accommodations, trade, or construction—which typically are dominated by the private sector in other countries. For example, in Egypt, there is at least one SOE in each of the 29 sectors that were analyzed by Islam and Saliola. There is at least one SOE in 23 sectors in Saudi Arabia, 22 sectors in the United Arab Emirates, and 18 sectors in Morocco—compared to an average of 12 for high-income countries and 15 for upper-middle-income countries.
Not only are SOEs overly present, but they also often benefit from rules that favor them, such as preferential access to credit, competition exemptions, and extensive state support. And in many countries, government agencies act as both regulators and operators, both defying the basic principles of separation of functions and undermining competitive neutrality. A large body of research has shown that access to a privileged position in the market is not confined to SOEs. Many privately owned, politically connected firms also receive preferential treatment from the state.16 Such lack of competitive neutrality is a massive government accountability failure. Because they are shielded from market forces, SOEs lack the necessary market discipline to be at the productivity frontier. For the same reason, the forces of creative destruction in MENA are muted, resulting in firms that are older and less dynamic than those in comparator countries. As a result, job creation is anemic and jobs are generally of low quality. The informal sector accounts for most employment, contributing to sclerotic labor markets that exclude large swaths of the population, chiefly among women, whose participation in the labor force is the lowest in the world.
15 School report cards are easy-to-use information sheets that provide communities with information about their local schools--how they are doing in terms of enrollments, financing and learning outcomes--as a way of increasing accountability. 16 See Gatti et al. (2013); Schiffbauer et al. (2015); Diwan, Malik, Atiyas (2019); Islam, Moosa and Saliola (2022). 42 CHAPTER 1: TOWARDS A LEARNING STATE: TRANSPARENCY AND ACCOUNTAB ILITY AS THE KEY TO SUSTAINABLE RECOVERY IN THE MIDDLE EAST AND NORTH AFRICA MIDDLE EAST AND NORTH AFRICA REGION | ECONOMIC UPDATE OCTOBER 2022
These interconnected challenges are the product of multiple governance failures. By now, a large body of literature has highlighted how in MENA the “rules of the game”—even if different among economies—have played into the hands of the governing elites, who benefit from a privileged relationship with the government and the regulators. The economic and social features of this development model—which many call a social contract—reinforce each other.17 Universal food and energy subsidies (rather than targeted social safety nets), job security for a few (rather than dynamic labor markets supported by workers’ protections during job transitions), and protection from competition for selected firms combine to produce a low-productivity equilibrium that is difficult to undo.
Seen through the lens of transparency and accountability, the emphasis of Part II of this report is on the importance of moving towards competitive neutrality between SOEs and the private sector, so that market signals, corporate governance, and accountability enforced by effective and independent competition agencies can provide the level playing field between public and private sectors needed for sustained growth. Although the resulting reshuffling within the economy would likely generate short-term job losses, it would bring about important long-term gains in job creation and productivity—and new social protection systems could be put in place to support workers who lose their jobs during the transition.
Ì Migration
As of 2020, 30 million people in the MENA region had migrated to another country. Over the past 30 years, the number of MENA residents who left their home country increased significantly faster than in the rest of the world. The typical long-term forces behind international migration—differences in demographics and living standards between the countries of origin and destination—are heightened in a region with a median age of 28, compared to 43 in Western Europe (UNDESA 2019). Income differentials are also extremely marked, even within the region. Half of MENA migrants chose other MENA countries—primarily those in the GCC—as their destination.
A large body of literature documents the productive impact of migration: for migrants, whose income can increase by as much as three to six times (Jasso, Rosenzweig, and Smith, 1998; Cuthbert and Stevens, 1981; Massey, Alarcón, Durand, and González, 1990), and for receiving countries, because migrants fill in important job gaps (OECD, 2012; Boubtane, Dumont, and Rault, 2016). It is also good for sending countries, because the potential for migrating can increase an individual’s incentive to acquire education that would be valuable in another country, a phenomenon that is dubbed brain gain (Mayr and Peri, 2009). Return migration can also benefit sending countries because the returning migrants have acquired both new skills and human capital while abroad (Dustmann, Fadlon, and Weiss, 2011) and are more likely to have had a stronger engagement in entrepreneurial activities (Marchetta, 2012; Batista, McIndoe-Calder, and Vicente, 2017).
In Chapter 8, Elmallakh discusses how economic migration in MENA reflects not only long-term pulls based on demography and income differentials, but also the chronic lack of job creation in the region. In this sense it is a consequence of the governance failings that stunt the growth of the private sector, as Islam and Saliola point out in Chapter 7. Conflict and violence are an additional, more dramatic governance failure in some countries that pushes people to migrate. In the decade ending in 2020, conflict and violence spurred the migration of as many as 18 million people from Syria, Yemen, and Libya (UNHCR, 2021).
17 Gatti et al. (2013) and Belhaj and Gatti (2021). 43CHAPTER 1: TOWARDS A LEARNING STATE: TRANSPARENCY AND ACCOUNTAB ILITY AS THE KEY TO SUSTAINABLE RECOVERY IN THE MIDDLE EAST AND NORTH AFRICA A NEW STATE OF MIND: GREATER TRANSPARENCY AND ACCOUNTABILITY IN THE MIDDLE EAST AND NORTH AFRICA PART II: THE LEARNING STATE
In addition to the benefits that improvements in governance might bring in moderating migration flows, Elmallakh argues that improved regulatory frameworks and full-on collaboration between sending and receiving countries within migration corridors—in other words better governance of the migration processes themselves—would make migration more productive. Both migrants and refugees would benefit from improvements in the refugee and migration governance frameworks, in terms of better labor market integration and therefore better labor market outcomes. Indeed, Elmallakh and Wahba (2021) find that unlike documented migrants, undocumented migrants not only experience worse labor market outcomes at destination—reflected in lower-ranked occupations and lower wages and savings—they pay longterm penalties that persist even after returning to their home country. Likewise, Fasani, Frattini, and Minale (2021) find that employment restrictions imposed on refugees entering European countries have long-lasting detrimental effects on the integration of refugees into labor markets. For example, exposure to a temporary employment ban at arrival reduces the employment probability of refugees by 15 percent in the post-ban years and these effects can last for up to 10 years after they arrive.
As important, the experience from the pandemic also shows that when faced with public health closures, migrants chose more dangerous routes and resorted to smugglers.18 Better governance can therefore make migration safer, particularly during shocks, and should place emigration policies—aimed at protecting the rights of citizens—at the heart of a better migration governance framework. For example, formal agreements with destination countries to protect migrant workers, pre-departure training sessions to inform potential migrants about their rights in destination countries and the procedures they should follow if their rights are violated, as well as efforts to combat human trafficking and smuggling of migrants should be part of a better migration governance framework (Melde et al. 2019).
Natural Capital: Land and Water Resources
Common pool resources—those easily available to everyone and susceptible to overuse and overexploitation—make the role of the state particularly relevant in managing natural resources. Unsurprisingly, in the literature on land and water in MENA, a word that appears frequently is “scarcity.” Better transparency and accountability can chart a path towards better access to and forward-looking management of precious resources at a time when demand is increasing.
Ì Land
Economic development, urbanization, and a growing population combine to increase demand for land when its supply is shrinking due to degradation from climate change. In MENA, poor land management and governance exacerbate the supply-demand mismatch, leading to inefficient, inequitable and unsustainable land use.
In the region, the barriers to accessing land for both businesses and individuals are significant. Nearly a quarter of firms in the manufacturing and service sectors identify land accessibility as a severe constraint on their operations. Political connections are used to access land, which may result in land being unavailable to more productive firms. Barriers to accessing land reduce economic efficiency within and across sectors and perpetuate inequality, especially among women and vulnerable groups.
18 Testaverde and Pavilon (2022). 44 CHAPTER 1: TOWARDS A LEARNING STATE: TRANSPARENCY AND ACCOUNTAB ILITY AS THE KEY TO SUSTAINABLE RECOVERY IN THE MIDDLE EAST AND NORTH AFRICA MIDDLE EAST AND NORTH AFRICA REGION | ECONOMIC UPDATE OCTOBER 2022
Women in the region have the lowest rate of ownership of agricultural properties in the world and are two to three times more likely to fear losing their property after a divorce or spousal death. Formal and informal institutions and genderimbalanced social norms and practices do not sufficiently support women’s rights—especially in rural areas and in matters of inheritance and asset management. Refugees also find it difficult to access land—conflict in the MENA region has displaced millions of people who lack necessary housing, land, and property rights both in origin and destination countries. The land scarcity crisis is exacerbated by conflicts, which are prevalent in the region. Moreover, the fighting contributes to land degradation.
The poor governance of land has to do with both how land-use and ownership are administered and with a legal framework that often is outdated and not aligned with the needs of a modern economy. Except in rich MENA countries, inferior registration of property ownership is a big problem—reflecting complex land tenure situations, onerous procedures to register, and low perceived value of any benefits from registration. Furthermore, effective implementation of land governance policies frequently is complicated by institutional fragmentation at the central level and the unreliability of land administration infrastructure that limit information-sharing and coordination across central state institutions. Moreover, in many MENA countries, high levels of public land ownership, strong state control over all land, and centralized, and opaque decision-making processes concerning land allocation have contributed to inefficient land use and facilitated elite capture and cronyism. It is a problem in nearly all economic sectors in the region.
In Chapter 9, Selod et al. discuss how improved transparency, clarity of the law and accountability could remove the regulatory and institutional constraints that currently distort the supply of, and demand for, land, causing misallocation and significant economic and environmental costs. Water subsidies to agriculture, common throughout MENA, are another significant source of misallocation that incentivizes unsustainable use of land.
Ì Water
The same forces that put pressure on land in the region—population growth and urbanization—do so on water. Because of geography and climate change, the problem of water scarcity is more acute in MENA than anywhere else in the world.19
Historically, the MENA region has invested significantly in water infrastructure, such as dams and irrigation systems. Some of these projects were seen as iconic symbols of nation building within the “interventionist-redistributive” social contract that long dominated the development model in many MENA countries. The region recently ramped up investments in non-conventional water—desalinated water and reused wastewater. MENA accounts for 50 percent of the world’s capacity for desalinating water. But with a recovery ratio (that is, the percentage of intake water converted into useable water) of about 30 percent, MENA desalination is the least efficient in the world. In Western Europe, by contrast, the recovery ratio is 61 percent.
As in the rest of the world, water management in MENA is almost entirely done by large, state-owned water companies. However, unique to MENA, allocation of water across its competing uses—in agriculture, industry (oil, in particular) and water supply and sewerage—is extremely centralized. These centralized institutions are failing now. As Khemani and Ravell de Waal document in Chapter 10, the institutions are unable to win voluntary compliance with restrictions on the quantity of water that can be used or the tariff that needs to be paid to cover the costs of delivering water services. For example, in Jordan, almost half of piped water is lost to leaks, theft, or poor meter measurement before it reaches
19 See for example Gosling and Arnell (2016) and Taheripour et al. (2020). 45CHAPTER 1: TOWARDS A LEARNING STATE: TRANSPARENCY AND ACCOUNTAB ILITY AS THE KEY TO SUSTAINABLE RECOVERY IN THE MIDDLE EAST AND NORTH AFRICA A NEW STATE OF MIND: GREATER TRANSPARENCY AND ACCOUNTABILITY IN THE MIDDLE EAST AND NORTH AFRICA PART II: THE LEARNING STATE
the users (non-revenue water) and so the water actually billed to customers falls short of production costs. This loss of revenue constitutes a fiscal problem for Jordan of about 1 percent of GDP per year.20
In MENA, water regulations and tariffs lack legitimacy. The absence of trust in and among utility staff and managers also keeps utilities persistently inefficient and underfunded. Because of the impending water crisis, difficult decisions must be made soon. Khemani and Revell de Waal argue that the key to sustainable management of the water scarcity problem in MENA is to strengthen institutions—especially trust and legitimacy.
Moving water management from central to local governments has the potential to build legitimacy and could be the first step political leaders take to make the case to citizens that they represent their interests. Giving greater autonomy to the staff of water utilities could build trust between users and providers. Independent national agencies with the scientific expertise to monitor water resources could play an overarching role in providing the credible information needed to sustain legitimacy and trust. Some countries in MENA, such as Iraq and Morocco, have been debating and experimenting with empowering utilities to raise capital from international markets, but these initiatives are likely to require complementary reforms in utility governance to build their creditworthiness. Without these governance reforms, it will continue to be difficult to attract the global capital needed to finance infrastructure in this sector, since investors see challenges in receiving steady returns.
While no country has fully managed the complex problem of allocating water, by adopting an institutional lens, MENA now has the chance to lead the way in experimenting with concrete solutions to the problem. An evidencebased approach could help countries in the region design solutions that are customized to their needs and provide the necessary institutional learning to make water management sustainable and acceptable to citizens.
The Upside of Digital Technology
By reducing the costs of interactions, improvements in digital technologies provide an excellent opportunity for economic and social advancement. These data-driven general-purpose technologies include internet connection through high-speed fixed or mobile broadband, digital payment capabilities, and digital platforms that allow users, who may be physically far from one another, to connect and engage in transactions in goods or services (Evans and Schmalensee 2016). Digital technologies are what enable the transactional digital economy to flourish, and digital payment mechanisms play a crucial role in this process.
Like other general-purpose technologies (GPTs)—such as electricity, the telephone, and railroads—digital economy technologies can be used across all sectors and heighten economic connectivity, whether physical or virtual. According to Jovanovic and Rousseau (2005), as GPTs improve over time, they induce cost reductions and spur innovations in many products and processes far beyond their initially imagined applications. In so doing, they engender widespread gains throughout the economy. Cusolito et al. (2022) estimate that the region’s GDP could rise by 46 percent—about US$1.6 trillion—with the universal adoption of digital technologies. That would represent an enormous gain in growth, which would also translate to robust job creation. For example, at the firm level, manufacturing revenue per unit of factors of production could increase by 37 percent and employment in manufacturing could rise by 7 percent, equivalent to 1.5 million new manufacturing jobs.
20 World Bank (2019). 46 CHAPTER 1: TOWARDS A LEARNING STATE: TRANSPARENCY AND ACCOUNTAB ILITY AS THE KEY TO SUSTAINABLE RECOVERY IN THE MIDDLE EAST AND NORTH AFRICA MIDDLE EAST AND NORTH AFRICA REGION | ECONOMIC UPDATE OCTOBER 2022
Figure
digital paradox
social media use
use of
The uptake of the use of digital
technologies for other purposes
not primarily
societies to conduct economic
Yet, the MENA region lives a paradox: the use of digital technologies in the region is high. But only for social media purposes. Their use for economic purposes instead is much below what would be predicted by GDP per capita levels (see Figure 11).
11. MENA’s
Panel A. Facebook account penetration rate, 2018 Panel B. Use of digital payments, 2017 Percent Percent age 15+ 100 80 60 40 20 0 68 10 12 100 80 60 40 20 0 68 10 12 Log of GDP per capita in 2018 (PPP, current international $) Log of GDP per capita in 2017 (PPP, current international $) J 95% Confidence Interval Fitted values z Rest of the world J 95% Confidence Interval Fitted values z Rest of the world z EAP z MENA excl. Israel and Malta z SSA z EAP z MENA excl. Israel and Malta z SSA Note: The graphs show the empirical relationship between the level of development (measured along the horizontal axis by the log of GDP per capita adjusted for Purchasing Power Parity in US dollars) and the number of active Facebook accounts per capita (Panel A) and the share of the adult population reporting the use of the internet to make payments (Panel B). The fitted curves in both graphs show the best fitting estimate of the relationship, namely a quadratic function. Red dots correspond to observations from MENA. Econometric estimates indicate that the average vertical distance between the red dots and the fitted line on the left graph is approximately +8 percent and -16 percent in the right-hand graph. Source: Authors’ computations based on data from Facebook, World Development Indicators, and the World Bank’s Access to Finance database (Findex, Demirgüç-Kunt, et al. (2018). Figure 12. Trust, transparency, and digital use in MENA Panel A. Transparency is correlated with trust Panel B. Trust is correlated with digital payments usage Public trust in politicians Internet payments, percent 6 5 4 3 2 1 0 020406080 100 ARE QAT SAU BHR JOR MAR EGY TUN YEM LBN 12 34 56 100 80 60 40 20 0 ARE IRN BHR KWT SAU LBN JORTUNDZA EGY MAR Open data score Public trust in politicians Note: Both variables in y-axis and x-axis are in scores without units. Source: Open Data Barometer, and World Economic Forum. Note: Internet payments refers to “Used the internet to pay bills or to buy something online in the past year (percent age 15+).” Data as of 2017. Source: Global Findex Database, and World Economic Forum. Widespread
indicates that the low
digital
does
reflect infrastructure barriers.
technologies across
transactions requires instead an important complement: that users trust the regulatory environment, financial and banking institutions, and the government itself. In particular, in Chapter 11, Wood provides suggestive evidence that transparency is correlated with trust and trust is in turn associated with digital payment use (see Figure 12). 47CHAPTER 1: TOWARDS A LEARNING STATE: TRANSPARENCY AND ACCOUNTAB ILITY AS THE KEY TO SUSTAINABLE RECOVERY IN THE MIDDLE EAST AND NORTH AFRICA A NEW STATE OF MIND: GREATER TRANSPARENCY AND ACCOUNTABILITY IN THE MIDDLE EAST AND NORTH AFRICA PART II: THE LEARNING STATE
Wood discusses two priorities for reform if the MENA region is to reap the full benefits of the digital economy.
The first is building trust in government institutions and the financial system. Increasing that trust requires reforming regulations to strengthen consumer protection in e-commerce transactions, strengthening data governance, and protecting data privacy—all areas in which MENA countries trail their income comparators. An increased reliance on e-government mechanisms—such as using digital payments in cash transfer programs and other public services and shifting to e-procurement by governments—can increase confidence in digital payments more broadly.
The second is fostering competition in telecom markets and establishing independent regulatory authorities for the telecom sector. Countries that already have a telecom regulatory authority should ensure that it operates independently. Furthermore, telecom sector policies should allow for the entry of new firms. Enhanced openness and contestability of telecom and banking sectors and updated sector regulations that are implemented independently of political influence are likely needed to achieve the rapid expansion of digital payments in a more cost-effective manner. A more dynamic telecom sector could spur innovations in the development and use of mobile broadband services and mobile money accounts, leading to more equitable access, better quality, and increased affordability of broadband services.
Governance and Fiscal Policies
Ì …over time
It seems that governance also has a lot to do with fiscal policy—one of the key policy tools for managing aggregate demand to smooth fluctuations in consumption. To do so, fiscal expenditures should rise in recessions and fall (or at least rise more slowly) during boom times. The countercyclical nature of fiscal expenditure is an indicator of how well a country manages its fiscal policy. In Chapter 12, Nguyen and Lotfi examine the cyclicality of fiscal expenditure in MENA countries compared with the rest of the world. In MENA there is room to do better: fiscal policy remained procyclical between 2000 and 2020, more so than in the rest of their income peers around the world—although procyclicality in MENA was lower than it was during 1980–99. There is a much stronger role of accountability, especially horizontal accountability, in the cyclicality of government expenditure in MENA than in the rest of the world. The finding highlights the oversized importance of intra-government checks and balances in helping MENA countries develop countercyclical fiscal policies.
Ì …and across space
Not only is fiscal policy important to smoothing consumption during the booms and busts of an economy, but it is also an important redistributive tool. In Chapter 13, Lall explores how fiscal transfers affect spatial disparities depending upon the region within a country. As discussed above, spatial disparities in MENA run deep and are multi-dimensional, affecting, among other things, consumption and access to services. For many reasons, including social cohesion, governments in the region have made convergence of living standards a priority. Yet, spatial disparities in MENA are, if anything, rising. While many mechanisms might be at the root of this divergence, excessive centralization of public resources, of decision-making, and of service delivery mechanisms are some of the distinctive features of MENA that stand in the way of spatial convergence.
48 CHAPTER 1: TOWARDS A LEARNING STATE: TRANSPARENCY AND ACCOUNTAB ILITY AS THE KEY TO SUSTAINABLE RECOVERY IN THE MIDDLE EAST AND NORTH AFRICA MIDDLE EAST AND NORTH AFRICA REGION | ECONOMIC UPDATE OCTOBER 2022
In MENA, the default mode for planning and allocating public resources often is top down—and sizeable public infrastructure investments have been a hallmark of several governments. Decisions regarding the geographic allocation of investment expenditure are taken by sectoral ministries within the central government, with little agency left to the local level. Not only is planning centralized, so are mechanisms for delivery of services. While several MENA countries have recently made important advances in implementing a decentralization agenda—including Tunisia and Lebanon—frontline service providers still have little real agency, as was noted in the discussion of water management. Notwithstanding some progress towards decentralization, local government systems in MENA still have little room for independent action, especially in the Mashreq region.
Central transfers continue to be the main source of local finance, because the share of local expenditures in total government spending remains low. But the budget processes governing sectoral and subnational resource allocations for public investment in MENA commonly lack transparency and predictability, potentially skewing resource flows toward areas with greater bargaining power. This pattern compounds existing regional imbalances in terms of local government staffing and human resource capacity, which disproportionately affect poorer areas. For example, in Tunisia, regional imbalances are massive in terms of staffing and human resource capacity between the northern and coastal municipalities and the less-well-off interior and rural ones.
Policies to reduce spatial inequity are often undermined by a lack of local authority and resources—whether to raise revenues, to make investment decisions and allocate expenditures, or to deliver local services. Lagging areas are often the least able to mobilize and manage local revenues because the central government wields more fiscal control over smaller municipalities than over larger ones. Further, transfers to these localities are often insufficient and lack objective standards, transparency, and predictability. This lack of budget authority, together with the lack of local control over provision of services, can undermine the local execution and maintenance of place-based investments—the very investments that are supposed to reduce spatial disparities.
Effectively meeting citizens’ demands for quality public services requires shifting from the monumental to the incremental: away from top-heavy, state-centric planning and delivery of services toward placing greater agency, capacity, and resources at the local level. Enhancing contestability for service delivery at the local level is a key part of this agenda. In other words, empowerment and accountability are essential to addressing the rising spatial inequalities that in other countries have caused significant political disruptions.
6. Turning the tide
The MENA region is facing important vulnerabilities, which the current crises—first the pandemic, then the Russian invasion of Ukraine—have exacerbated. Prices of food and energy are higher, hurting the most vulnerable, and rising interest rates from the global tightening of monetary policy are making debt service more burdensome. Moreover, no country is fully out of the pandemic and how and whether the virus will continue to mutate is unknowable. In previous issues of the MENA Economic Update, we argued that these shocks caught the MENA region ill-prepared to face them.21 Indeed, today’s vulnerabilities are deeply rooted in a decades-long history of low growth, in public debts that were already growing to worrisome levels before 2020, and in public services that continue to disappoint people.
21 Gatti et al. (2021) and Gatti et al (2022). 49CHAPTER 1: TOWARDS A LEARNING STATE: TRANSPARENCY AND ACCOUNTAB ILITY AS THE KEY TO SUSTAINABLE RECOVERY IN THE MIDDLE EAST AND NORTH AFRICA A NEW STATE OF MIND: GREATER TRANSPARENCY AND ACCOUNTABILITY IN THE MIDDLE EAST AND NORTH AFRICA PART II: THE LEARNING STATE
Albeit without presenting causal evidence, the contributions to this report align in arguing that different aspects of poor governance are at the root of the region’s development failings—including low growth, exclusion of the most disadvantaged and women, and overuse of such precious natural resources as land and water.
Governance can mean different things. It encompasses the architecture of institutions, the processes of policymaking and decision-making, the mechanisms of institutional compliance, and the strategies that shape public choice. Yet all definitions of good governance, including those directly adopted by countries in the region, refer to some form of transparency and accountability. Lack of transparency—whether in data openness, regular learning assessments, or clear and predictable fiscal transfers—prevents the state, policymakers, and citizens from getting clear signals about what is happening in the economy or on the effectiveness of policies. A still nascent culture of accountability—in which teachers and principals have limited agency on pedagogy and local authorities have limited agency to enforce a responsible use of water and payment of bills—fails to align incentives for action towards progress.
The upside of improving transparency and accountability is enormous for MENA—particularly in improving the effectiveness of the state. A state in which outcomes are measured and accountability is well structured is a governing body that can learn from what works and what does not—and why. Being connected to the literature on institutional capacity and on the role of experimentation and evaluation, the idea of a “learning state” is built on the contribution of many scholars.22 But a learning state has never been more essential than today. When times are uncertain, experimenting, learning, and course-correcting are essential to progress. Improving governance, and transparency and accountability in particular, are fiscally cheap reforms, and, as such, they are especially appealing now for countries with limited fiscal space. But they are essential to oil-exporting countries too, since they can support an efficient allocation of public resources, while helping to prepare for leaner times ahead.
However painful, there is no better time than during this crisis to tackle these reforms, which not only will chart a path to sustainable growth but will also develop a more resilient infrastructure to deal with the inevitable shocks to come.
References
Aberra, A., and Chemin, M. (2021). “Does legal representation increase investment? Evidence from a field experiment in Kenya.” Journal of Development Economics, 150(c). https://doi.org/10.1016/j.jdeveco.2020.102612 Acemoglu, D., Johnson, S., and Robinson, J. A. (2001). “The colonial origins of comparative development: An empirical investigation.” American Economic Review, 91(5), pp. 1369-1401.
Andrews, M., Pritchett, L., and Woolcock, M. (2017). Building State Capability: Evidence, Analysis, Action. Oxford University Press. Batista, C., McIndoe-Calder, T., and Vicente, P.C. (2017). “Return Migration, Self-selection and Entrepreneurship.” Oxford Bulletin of Economics and Statistics, 79(5), pp. 797-821. Belhaj, F., and Gatti, R. (2021) “The Political Economy of Reform in Post-Covid MENA.” In Thinking MENA Futures: The Next Five Years and Beyond. Middle East Institute.
22 See, among others, Andrews et al. (2017), Ogden (2017) and the vast literature cited therein. 50 CHAPTER 1: TOWARDS A LEARNING STATE: TRANSPARENCY AND ACCOUNTAB ILITY AS THE KEY TO SUSTAINABLE RECOVERY IN THE MIDDLE EAST AND NORTH AFRICA MIDDLE EAST AND NORTH AFRICA REGION | ECONOMIC UPDATE OCTOBER 2022
Blattman, C., Hartman, A. C., and Blair, R. A. (2014). “How to promote order and property rights under weak rule of law? An experiment in changing dispute resolution behavior through community education.” American Political Science Review, 108(1), pp. 100–120.
Boubtane, E., Dumont, J.C., and Rault, C. (2016). “Immigration and economic growth in the OECD countries 1986–2006.” Oxford Economic Papers, 68(2), pp. 340-360.
Cai, L., and Thissen, D. (2014). “Modern approaches to parameter estimation in item response theory.” In S. P. Reise and D.A. Revicki (Eds.), Handbook of item response theory modeling (pp. 41-59). Routledge.
Chakraborty, T., Mukherjee, A., Saha, S., and Shukla, D. (2018). “Caste, courts and business.” IZA Discussion Paper No. 15037. Institute of Labor Economics, Bonn, Germany.
Chemin, M. (2012). “Does the quality of the judiciary shape economic activity? Evidence from a judicial reform in India.” Journal of Law, Economics, and Organization, 28(3), pp. 460–485.
Coppedge, M., Gerring, J., Knutsen, C. H., Lindberg, S. I., Teorell, J., Altman, D., Bernhard, M., Cornell, A., Fish, M.S., Gastaldi, L., Gjerløw, H., Glynn, A., Grahn, S., Hicken, A., Kinzelbach, K., Marquardt, K.L., McMann, K., Mechkova, V., Paxton, P., Pemstein, D., von Römer, J., Seim, B., Sigman, R., Skaaning, S., Staton, J., Tzelgov, E., Uberti, L., Wang, Y., Wig, T., Wilson, S. and Ziblatt, D. (2022). V-Dem Codebook v12. https://www.v-dem.net/static/website/ img/refs/codebookv12.pdf.
Crawford, R., Klein, B., and Alchian, A. (1978). “Vertical integration, appropriable rents, and the competitive contracting process.” Journal of Law and Economics, 21(2), pp. 297–326.
Cusolito, A.P., Gévaudan, C., Lederman, D., and Wood, C.A. (2022). The Upside of Digital for the Middle East and North Africa: How Digital Technology Adoption Can Accelerate Growth and Create Jobs. Washington, DC: World Bank.
Cuthbert, R. W., and Stevens, J. B. (1981). “The Net Economic Incentive for Illegal Mexican Migration: A Case Study.” The International Migration Review, 15(3), pp. 543–550.
Demirgüç-Kunt, A., Klapper, L., Singer, D., Ansar, S., and Hess, J. (2018). The Global Findex Database 2017: Measuring Financial Inclusion and the Fintech Revolution. Washington, DC: World Bank.
Devarajan, S., and Ianchovichina, E. (2018). “A broken social contract, not high inequality, led to the Arab Spring.” Review of Income and Wealth, 64(s1), pp. S5-S25.
Diwan, I., Malik, A., and Atiyas, I. (2019). Crony Capitalism in the Middle East: Business and Politics from Liberalization to the Arab Spring. Oxford Academic.
Dustmann, C., Fadlon, I., and Weiss, Y. (2011). “Return migration, human capital accumulation and the brain drain.” Journal of Development Economics, 95(1), pp. 58-67.
Ekhator-Mobayode, U. E., and Hoogeveen, J. (2021). “Microdata Collection and Openness in the Middle East and North Africa: Introducing the MENA Microdata Access Indicator”. World Bank Policy Research Paper No. 9892. World Bank, Washington, DC.
Elmallakh, N., and Wahba, J. (2021). “Return Migrants and the Wage Premium: Does the Legal Status of Migrants Matter?” Journal of Population Economics, 35(4), pp. 1-55.
Evans, D. S., and Schmalensee, R. (2016). Matchmakers: The New Economics of Multisided Platforms. Boston, MA: Harvard Business Review Press.
Falkenmark, M. (1989). “The massive water scarcity now threatening Africa: why isn't it being addressed?” Ambio, 18(2), pp. 112-118.
Fasani, F., Frattini, T., and Minale, L. (2021). “Lift the Ban? Initial Employment Restrictions and Refugee Labour Market Outcomes.” Journal of the European Economic Association, 19(5), pp. 2803-2854.
Flabbi, L., and Gatti, R. (2018). “A Primer on Human Capital.” Policy Research Working Paper No. 8309. World Bank, Washington, DC.
51CHAPTER 1: TOWARDS A LEARNING STATE: TRANSPARENCY AND ACCOUNTAB ILITY AS THE KEY TO SUSTAINABLE RECOVERY IN THE MIDDLE EAST AND NORTH AFRICA A NEW STATE OF MIND: GREATER TRANSPARENCY AND ACCOUNTABILITY IN THE MIDDLE EAST AND NORTH AFRICA PART II: THE LEARNING STATE
Gatti, R., Angel-Urdinola, D. F., Silva, J., and Bodor, A. (2014). “Striving for Better Jobs: The Challenge of Informality in the Middle East and North Africa.” Directions in Development-Human Development. World Bank, Washington, DC.
Gatti, Roberta, Daniel Lederman, Rachel Yuting Fan, Arian Hatefi, Ha Nguyen, Anja Sautmann, Joseph Martin Sax, and Christina A. Wood. (2021). Overconfident: How Economic and Health Fault Lines Left the Middle East and North Africa Ill-Prepared to Face COVID-19. MENA Economic Update. Washington, DC: World Bank. October.
Gatti, Roberta, Daniel Lederman, Asif Mohammed Islam, Christina A. Wood, Rachel Yuting Fan, Rana Lotfi, Mennatallah Emam Mousa, and Ha Nguyen (2022). Reality Check: Forecasting Growth in the Middle East and North Africa in Times of Uncertainty. MENA Economic Update. Washington, DC: World Bank. April.
Gosling, S.N., and Arnell, N.W. (2016). “A global assessment of the impact of climate change on water scarcity.” Climatic Change, 134(3), pp. 371-385.
Iqbal, F., and Kiendrebeogo, Y. (2015). “Public spending and education attainment in the Middle East and North Africa.” Review of Middle East Economics and Finance, 11(2), pp. 99-118.
Islam, A. M., Moosa, D., and Saliola, F. (2022). Jobs Undone. Reshaping the Role of Governments toward Markets and Workers in the Middle East and North Africa. World Bank, Washington, DC. https://openknowledge.worldbank. org/handle/10986/37412.
Islam, A.M., and Lederman, D. (2020). “Data Transparency and Long-Run Growth.” Policy Research Working Paper No. 9493. World Bank, Washington, DC.
Jasso, G., Rosenzweig, M. R. and Smith, J. P. (1998). “Determinants of Immigrants’ Economic Gains from Immigration.” Working paper, University of Pennsylvania.
Jovanovic, B., and Rousseau, P.L. (2005). “General Purpose Technologies.” NBER Working Paper w11093, National Bureau of Economic Research, Cambridge, MA. https://ssrn.com/abstract=657607.
Kaufman, D, Kraay, A., and Mastruzzi, M. (2010). “The Worldwide Governance Indicators Methodology and Analytical Issues.” Policy Research working paper No. WPS 5430. World Bank.
Kazem, A. (2019). “Egypt: Why collaboration matters for the success of education reform.” World Bank Blogs. https:// blogs.worldbank.org/arabvoices/egypt-why-collaboration-matters-success-education-reform#comments
Laeven, L., and Woodruff, C. (2004). “The quality of the legal system, firm ownership, and firm size.” Policy Research Working Paper No. 3246. World Bank, Washington, DC.
Levi-Faur, D. (Ed.). (2012). The Oxford handbook of governance. Oxford University Press.
Lichand, G., and Soares, R.R. (2014). “Access to justice and entrepreneurship: Evidence from Brazil’s special civil tribunals.” The Journal of Law and Economics, 57(2), pp. 459–499.
Litschig, S., and Zamboni Y. (2018). “Audit risk and rent extraction: Evidence from a randomized evaluation in Brazil.” Journal of Development Economics, 134, pp. 133–149.
Lührmann, A., Marquardt, K. L., and Mechkova, V. (2020). “Constraining governments: New indices of vertical, horizontal, and diagonal accountability.” American Political Science Review, 114(3), pp. 811-820.
Marchetta, F. (2012). “Return migration and the survival of entrepreneurial activities in Egypt.” World Development, 40(10), pp. 1999-2013.
Massey, D.S., Alarcón, R., Durand, J., and González, H. (1990). Return to Aztlan: The social process of international migration from western Mexico. Studies in Demography, 1. Univ of California Press.
Mayr, K., and Peri, G. (2009). “Brain drain and brain return: theory and application to Eastern-Western Europe.” The BE Journal of Economic Analysis & Policy, 9(1), pp. 1-52.
52 CHAPTER 1: TOWARDS A LEARNING STATE: TRANSPARENCY AND ACCOUNTAB ILITY AS THE KEY TO SUSTAINABLE RECOVERY IN THE MIDDLE EAST AND NORTH AFRICA MIDDLE EAST AND NORTH AFRICA REGION | ECONOMIC UPDATE OCTOBER 2022
Melde, S., Milan, A., Shivakoti, R., Roy, S.Y., Martineau, D., and Laczko, F. (2019). Migration governance indicators: a global perspective. International Organization for Migration. Retrieved from https://publications.iom.int/system/ files/pdf/mgi-a-global-perspective.pdf
North, D., Acemoglu, D., Fukuyama, F., and Rodrik, D. (2008). Governance, Growth and Development Decision-Making Washington, D.C.: World Bank Group.
OECD. (2012). “Renewing the skills of ageing workforces: The role of migration.” In International Migration Outlook 2012, OECD Publishing, Paris. https://doi.org/10.1787/migr_outlook-2012-7-en.
Ogden, T. (Ed.). (2017). Experimental conversations. MIT Press.
Rodrik, D. (2010). “Diagnostics before prescription.” Journal of Economic Perspectives, 24(3), pp. 33–44.
Sandefur, J., and Siddiqi, B. (2013). “Delivering justice to the poor: Theory and experimental evidence from Liberia.” Working Paper.
Schiffbauer, M., Sy, A., Hussain, S., Sahnoun, H., and Keefer, P. (2015). “Jobs or Privileges: Unleashing the Employment Potential of the Middle East and North Africa.” MENA Development Report. Washington, DC: World Bank.
Shvets, J. (2013). “Judicial institutions and firms’ external finance: Evidence from Russia.” The Journal of Law, Economics, and Organization, 29(4), pp. 735–764.
Taheripour, F., Tyner, W.E., Sajedinia, E., Anguiar, A., Chepeliev, M., Corong, E.L., de Lima, C. Z., and Haqiqi, I. (2020). Water in the Balance: The Economic Impacts of Climate Change and Water Scarcity in the Middle East Washington, D.C.: World Bank Group.
Testaverde, M., and Pavilon, J. (2022). Building Resilient Migration Systems in the Mediterranean Region: Lessons from COVID-19. World Bank, Washington, DC.
UNHCR (United Nations Higher Commissioner for Refugees). (2021). UNHCR Refugee Population Database. Data extracted on: March 31, 2022. Available from https://www.unhcr.org/refugee-statistics/.
UNDESA (United Nations, Department of Economic and Social Affairs, Population Division). (2019). World Population Prospects 2019, Online Edition. Rev. 1. Data extracted on: July 8th, 2022. Available from https://population. un.org/wpp/Download/Standard/Population/
World Bank. (2018). World development report 2018: Learning to realize education's promise. Washington, DC: World Bank.
World Bank. (2019). “Implementation Completion Report for the First and Second Programmatic Energy and Water Sector Reforms Development Policy Loans to the Hashemite Kingdom of Jordan.” Report No: ICR00004657, https://documents1.worldbank.org/curated/en/222301546546705732/pdf/icr00004657-12282018636818041906584165.pdf
World Bank. (2020a). Insights from disaggregating the human capital index. https://documents1.worldbank.org/curated/ en/306651578290912072/pdf/Insights-from-Disaggregating-the-Human-Capital-Index.pdf
World Bank. (2020b). Arab Republic of Egypt: Human Capital Index 2020. World Bank, Washington, DC. https://databank. worldbank.org/data/download/hci/HCI_2pager_EGY.pdf
World Bank. (2020c). Convergence: Five Critical Steps toward Integrating Lagging and Leading Areas in the Middle East and North Africa. Washington, DC: World Bank.
World Bank. (2021). The Human Capital Index 2020 Update: Human Capital in the Time of COVID-19. World Bank, Washington, DC.
World Bank. (2022). Lebanon Economic Monitor, Fall 2021: the Great Denial. World Bank, Washington, DC.
Yousef, T. M. (2004). “Development, Growth and Policy Reform in the Middle East and North Africa since 1950.” Journal of Economic Perspectives, 18(3), pp. 91–116.
53CHAPTER 1: TOWARDS A LEARNING STATE: TRANSPARENCY AND ACCOUNTAB ILITY AS THE KEY TO SUSTAINABLE RECOVERY IN THE MIDDLE EAST AND NORTH AFRICA A NEW STATE OF MIND: GREATER TRANSPARENCY AND ACCOUNTABILITY IN THE MIDDLE EAST AND NORTH AFRICA PART II: THE LEARNING STATE
Chapter 2: Accountability in the Middle East and North Africa: Concept and Measurements by Hoda Assem
MIDDLE EAST AND NORTH AFRICA REGION | ECONOMIC UPDATE OCTOBER 2022
1. Introduction
There are many definitions of governance. Kaufmann and Kraay (2008) define governance as “the traditions and institutions by which authority in a country is exercised,” which includes “the process by which governments are selected, monitored, and replaced.” The Organization for Economic Cooperation and Development (OECD 2006) describes good governance as characterized by “participation, transparency, accountability, rule of law, effectiveness, equity, etc.” The International Monetary Fund (2007) defines governance as “the process by which public institutions conduct public affairs and manage public resources” and refers to good governance as “the management of government in a manner that is essentially free of abuse and corruption, and with due regard for the rule of law.” These definitions, among others, emphasize the importance of accountability as a cornerstone of good governance. Accountability is essential to combat threats to the rule of law in the developing world due to misuse of public office for private gain (Ackerman 2005). Additionally, accountability ensures that citizens and public institutions have oversight over the government and its actions and is therefore central to the quality of democratic rule and the legitimacy of and trust in public institutions.
This chapter focuses on accountability and how it is defined and measured, relying heavily on the work of Lührmann, Marquardt, and Mechkova (2020), who provide a novel conceptual framework to define and measure accountability. Accountability is defined as de facto constraints on the government’s use of power and can be divided into three sub indicators: vertical accountability, which captures elections; horizontal accountability, which refers to checks and balances between state institutions; and diagonal accountability, which measures oversight by informal institutions such as the media and civil society organizations. This chapter uses the latest data on accountability provided by the V-Dem dataset (Coppedge et al. 2022a) to benchmark the extent of accountability observed in the Middle East and North Africa against other regions.
The Middle East and North Africa has had the lowest accountability score of all regions over the last 20 years, considerably underperforming its income peers, although there is substantial heterogeneity across countries in the region. The region scores better in horizontal than in vertical and diagonal accountability, but some aspects of horizontal accountability, such as oversight by independent public agencies need to be improved. A key objective of this chapter is to assess the correlation between the dimensions of accountability and trust in institutions. It was found that vertical and horizontal accountability are positively associated with trust in institutions, whereas diagonal accountability is not. These results also hold for the Middle East and North Africa, although trust in institutions is lower in the region than in the rest of the world.
2. Defining and measuring accountability
Defining Accountability
Defining accountability is challenging. The concept of accountability itself is ambiguous and overlaps with many closely related terms, including democracy,1 but accountability is different from democracy. Democracy is concerned with how citizens use elections to hold government officials accountable (Schmitter and Karl 1991), but state institutions and
1 The Polity IV dataset, a prominent data set used in political science research to measure democracy and autocracy defines democracy as including three interdependent elements: “the presence of institutions and procedures through which citizens can express effective preferences about alternative policies and leaders, the existence of institutionalized constraints on the exercise of power by the executive, and the guarantee of civil liberties to all citizens in their daily lives and in acts of political participation (Marshall, Jaggers, and Gurr 2002).” These three elements are close to the three dimensions of accountability used herein (vertical, horizontal, diagonal).
55C HAPTER 2: A CCOUNTABILITY IN THE M IDDLE E AST AND N ORTH A FRICA : C ONCEPT AND M EASUREMENTS A NEW STATE OF MIND: GREATER TRANSPARENCY AND ACCOUNTABILITY IN THE MIDDLE EAST AND NORTH AFRICA PART II: THE LEARNING STATE
citizens can each exercise accountability, and it can exist even in nondemocratic regimes (Lindberg 2013). Another close concept is responsiveness, which means responding to citizen demands. Although accountability differs from responsiveness, a government accountable to its citizens must also respond seriously to their interests and demands (Ackerman 2005).
Schedler (1999) defines accountability as a relationship between an accounting party and an accountable party, with the latter required to inform and justify its actions to the former and suffer possible punishment in case of misconduct. Based on this definition, accountability has two main dimensions: answerability (which refers to the accountable party’s obligation to inform and explain its decisions to the accounting party) and enforcement (which refers to the ability of the accounting party to punish misconduct) (Schedler 1999). Behn (2001) also incorporates punishment into his definition of accountability, saying that “accountability means punishment.” Examples of accountability can include answerability, enforcement, or both. For example, in many countries, the legislative body can question government members and hold a vote of no confidence to remove them from office, whereas citizens are not able to question and investigate public officials but can punish them by voting them out of office (Schedler, Diamond, and Plattner 1990). Lindenberg (2013) defines accountability as constraints on the use of power.
Building on these definitions, Lührmann, Marquardt, and Mechkova. (2020) focus on the accountability of the executive branch of the government or political accountability and define it as de facto constraints on the government’s use of political power through requirements for justification of its actions and potential sanctions. They conceptualize accountability by identifying to whom the government should be accountable. They organize accountability into three subtypes (see Figure 1):
• Vertical accountability refers to the ability of citizens to hold their government accountable through elections.
• Horizontal accountability refers to checks and balances between state institutions.
• Diagonal accountability refers to oversight by civil society organizations and the media.
Vertical accountability captures how citizens hold their government accountable through formal political participation, which involves fair and free elections and freedom to organize political parties. Lührmann, Marquardt, and Mechkova (2020) measure vertical accountability as electoral accountability and freedom of political parties. Electoral accountability captures the existence and quality of elections, the percentage of the population with the right to vote, and whether the head of executive is directly or indirectly elected. The quality of elections is modeled as a function of having an electoral regime, as well as seven variables measuring various aspects of the electoral process, including the autonomy of the election commission, the accuracy of the voter registry, and a measure of how free and fair elections are. Vertical accountability also captures whether it is possible to organize political parties, barriers to forming parties, and how independent opposition parties are from the government (Lührmann, Marquardt, and Mechkova 2020; Coppedge et al. 2022b). Vertical accountability in the form of free and fair elections is a necessary but not sufficient condition to achieve
Figure 1. Types of accountability
Government Voters and Parties Oversight
Bodies
Media and CSOs V ertical Horizontal Diagonal Diagonal Source: Lührmann, Marquardt, and Mechkova 2020. 56 C HAPTER 2: A CCOUNTABILITY IN THE M IDDLE E AST AND N ORTH A FRICA : C ONCEPT AND M EASUREMENTS MIDDLE EAST AND NORTH AFRICA REGION | ECONOMIC UPDATE OCTOBER 2022
good governance. Electoral accountability has important deficiencies such as asymmetry of information between citizens and elected officials, and elections as an accountability mechanism operate ex-post and external to public institutions (Ackerman 2005). Therefore, accountability from within public institutions or horizontal accountability must accompany accountability by voters.
Horizontal accountability refers to the ability of other state institutions to monitor the government’s activities by demanding information, questioning officials, and punishing improper behavior. This form of accountability reflects the existence of checks and balances between public institutions and prevents the abuse of power (Lührmann, Marquardt, and Mechkova 2020; O’Donnell 1998). Horizontal accountability includes oversight by the judiciary, the legislature, and other government agencies (Lührmann, Marquardt, and Mechkova 2020). Judicial oversight captures whether the government respects the legitimate authority of the judiciary, which is measured according to whether the executive power complies with the courts’ decisions and how independent the courts are. Legislative oversight captures the legislative constraints on the executive, reflected by how often the legislative power questions the government and how likely it is for it to sanction the government’s illegal actions. Oversight by other public agencies measures how other public agencies such as the comptroller general, general prosecutor, or ombudsman investigate the executive branch (Coppedge et al. 2022b; Lührmann, Marquardt, and Mechkova 2020). The previous two types of accountability reflect the role of formal political institutions—elections, political parties, parliament, and the courts—but there is a third type of accountability—diagonal accountability—which operates through informal channels.
Diagonal accountability captures the role that citizens, civil society organizations, and the media play in holding the government accountable. Their role involves use of informal tools such as social mobilization and investigative journalism to improve vertical and horizontal accountability (Lührmann, Marquardt, and Mechkova 2020; Mechkova, Lührmann, and Lindberg 2017). The media and civil society organizations have no direct authority or power to punish misconduct by government officials, but they play a key role by providing information to other actors such as voters and other public institutions, which increases vertical and horizontal accountability. They can also directly pressure the government through social mobilization campaigns (Goetz and Jenkins 2001). Diagonal accountability includes measures of media freedom, freedom of expression, civil society characteristics, and the extent of citizen engagement in politics. Media freedom captures such things as media censorship by the government, harassment of journalists, and whether the media can criticize the government. Freedom of expression includes variables measuring the degree to which citizens are free to discuss different topics and indicators of freedom of expression. The third measure is whether the civil society holds public discussions before major policy changes. The final measure captures whether citizens are interested in participation in civil society and the restraints that the government places on civil society organizations (Coppedge et al. 2022b; Lührmann, Marquardt, and Mechkova 2020).
Measuring Accountability
Lührmann, Marquardt, and Mechkova (2020) construct the accountability index and its three sub indicators using variables from the V-Dem dataset,2 which is considered the most comprehensive and granular dataset on democracy measures. It offers a multidimensional, disaggregated approach to measuring democracy and includes more than 400 indicators of democracy, covering more than 200 countries from 1789 to 2019. Country experts are asked to rate various
2 The V-Dem Dataset. https://www.v-dem.net/vdemds.html 57C HAPTER 2: A CCOUNTABILITY IN THE M IDDLE E AST AND N ORTH A FRICA : C ONCEPT AND M EASUREMENTS A NEW STATE OF MIND: GREATER TRANSPARENCY AND ACCOUNTABILITY IN THE MIDDLE EAST AND NORTH AFRICA PART II: THE LEARNING STATE
dimensions of democracy, and each country has a minimum of 25 experts, each of whom codes indicators in their area of expertise. The V-Dem project uses more than 3,500 country experts who provide expert information via online surveys. Country experts are usually academics or professionals with detailed knowledge in one or more areas; approximately two-thirds are nationals or residents of the country on which they provide information, so they are familiar with the political and institutional developments in these countries (Coppedge et al. 2022c). Nevertheless, expert-coded data can be problematic because rating complex concepts requires judgment, which can vary between experts (Maxwell, Marquardt, and Lührmann 2018). Variation between experts, especially in scale perception and reliability, can lead to measurement errors (Marquardt 2020). The V-Dem project uses an item response theory model3 to convert ordinal answers by experts to continuous estimates. These models have been found to outperform simple averages when experts’ answers vary in reliability or exhibit differential item functioning (Marquardt and Pemstein 2018). The V-Dem dataset also uses other methodological tools to ensure rating reliability and provide confidence intervals in the experts’ ratings (Coppedge et al. 2022c).
Lührmann, Marquardt, and Mechkova (2020) operationalize accountability as a composite of multiple indicators from the V-Dem dataset. These indicators are aggregated using a Bayesian hierarchical model4 to estimate the accountability index and its three subtypes (Coppedge et al. 2022c; Lührmann, Marquardt, and Mechkova 2020). The accountability indices are normalized to range between 0 and 1, with higher scores indicating greater accountability. Lührmann, Marquardt, and Mechkova’s (2020) new measure of accountability has several advantages. First, it offers a novel conceptual framework with which to define accountability. Second, it uses a Bayesian hierarchical structural modelling strategy to construct the aggregate accountability index and its three subtypes, which addresses the data’s nested structure and missing observations. Third, it has very good coverage globally. The indices cover almost all countries from 1900 to the present. Fourth, it differentiates between sub-types of accountability (vertical, horizontal, diagonal). Fifth, Lührmann, Marquardt, and Mechkova (2020) show that the new measure of accountability demonstrates content,5 convergent,6 and construct7 validity, following Adcock and Collier’s (2001) framework.
The accountability indices that Lührmann, Marquardt, and Mechkova (2020) developed fill an important gap in the literature. The only previously existing accountability index with global coverage is the worldwide governance voice and accountability indicator (Box 1), which is an aggregation of perception-based indicators from various sources (Kaufmann and Kraay 2008). It has been criticized for lack of a conceptual framework (Lührmann, Marquardt, and Mechkova 2020; Thomas 2010) and only goes back to 1996. Other accountability indices cover accountability for only a limited number of countries and years. For example, the accountability index that Williams (2015) developed measures accountability and transparency for 190 countries from 1980 to 2010, with variable coverage across countries. Democracy indices have also been used to measure accountability, but they are conceptually different from accountability measures (Lührmann, Marquardt, and Mechkova 2020).
the new measure
a
the new measure is correlated
the new measure produces the theoretically expected
3 An item response theory model is a type of statistical model that explains the relationship between unobservable characteristics and observed outcomes (Cai & Thissen, 2014). 4 A Bayesian hierarchical model is a type of statistical model written in hierarchical form (multiple levels) and estimated using Bayesian methods (Allenby, Rossi, and McCulloch. 2005). 5 Whether
is
good representation of the proposed conceptual framework of accountability. 6 Whether
with other related measures. 7 Whether
results. 58 C HAPTER 2: A CCOUNTABILITY IN THE M IDDLE E AST AND N ORTH A FRICA : C ONCEPT AND M EASUREMENTS MIDDLE EAST AND NORTH AFRICA REGION | ECONOMIC UPDATE OCTOBER 2022
Box 1. The Worldwide Governance Voice and Accountability Index
The Worldwide Governance Voice and Accountability Index captures the ability of a country’s citizens to elect their government, as well as freedom of expression, freedom of association, and presence of an independent media. It covers all countries worldwide from 1996 to the present and is constructed using perception-based indicators from 21 sources, including Freedom House, Gallup World poll, and the V-Dem project. The number of sources varies per observation. The various indicators are rescaled to range from 0 to 1 and then combined using an unobserved components model to construct an aggregate index for voice and accountability, which is a weighted average of the indicators, with weights reflecting the correlation between the different data sources (Kauffman and Kraay 2008; Kauffman, Kraay, and Mastruzzi 2011). The main disadvantage of the Voice and Accountability Index, which is bounded between -2.5 and 2.5, is that it lacks a conceptual framework (Lührmann, Marquardt, and Mechkova 2020; Thomas 2010).
The Voice and Accountability Index uses indicators from the V-Dem dataset: expanded freedom of expression, freedom of association, and clean elections, so it correlates more strongly with the aggregate, vertical, and diagonal accountability measures and less with horizontal accountability because it does not include elements of checks and balances between state institutions.
Figure B.1.1 shows the average score of the Worldwide Governance Indicators’ Voice and Accountability Index from 2000 to 2020 according to geographic region. The Worldwide Governance Indicators show the same regional ranking in accountability as the Lührmann, Marquardt, and Mechkova (2020) accountability scores. The Middle East and North Africa has had the lowest accountability scores since 2000. Figure B.1.2 shows the evolution of Worldwide Governance Voice and Accountability Index regional scores over the same period. The accountability scores for South Asia and the Middle East and North Africa have improved over the last 20 years, but the Middle East and North Africa still has the lowest accountability, as with its score on Lührmann, Marquardt, and Mechkova’s (2020) index.
Figure B. Voice and accountability index according to geographical region (2000–20)
B.1.1
B.1.2
Figure
Figure
Voice and accountability index Voice and accountability index 1.5 1.0 0.5 0 -0.5 -1.0 NorthAmerica ECA MENA EAP LAC SA SSA 1.5 1.0 0.5 0 -0.5 -1.0 20002002200320042005200620072008200920102011201220132014201520162017201820192020 North America ECA MENA LAC EAP SA SSA Source: Based on data from World Governance Indicators. Note: The graphs display average voice and accountability scores according to geographic region. 59C HAPTER 2: A CCOUNTABILITY IN THE M IDDLE E AST AND N ORTH A FRICA : C ONCEPT AND M EASUREMENTS A NEW STATE OF MIND: GREATER TRANSPARENCY AND ACCOUNTABILITY IN THE MIDDLE EAST AND NORTH AFRICA PART II: THE LEARNING STATE
3. Comparing the Middle East and North Africa with the rest of the World
Regional Comparison
We begin by comparing the accountability scores of regions. Figure 2 shows the average aggregate accountability score and the three subtypes (vertical, horizontal, diagonal) for each geographic region and for the whole sample. Accountability scores cover 178 countries from 2000 to 2020 and are normalized to range between 0 and 1. The Middle East and North Africa has the lowest aggregate accountability score (0.48, vs an average score of 0.7, one standard deviation lower than the average).
All regions except North America perform worse on horizontal accountability than on aggregate, vertical, and diagonal accountability, although horizontal accountability has been declining in North America since 2015. Horizontal accountability captures checks and balances between state institutions.
Evolution of Accountability Over Time
Figure 2. Accountability according to region, 2000–20
ECA MENA EAP LAC SA SSA Allcountries
Aggregate accountability scores have not changed substantially over the last 20 years. Figure 3 presents the evolution of accountability scores from 2000 to 2020, focusing on aggregate accountability, defined as de facto constraints on the government’s use of political power. South Asia and the Middle East and North Africa had notable improvement in accountability scores. Accountability scores improved gradually for South Asia from 2000 to 2007 and then increased dramatically in 2008 because of democratic transitions in Afghanistan, Bhutan, and the Maldives. The Middle East and North Africa also had a small improvement in accountability after the Arab Spring in 2010/11 because of improvements in accountability scores for Egypt, Libya, and Tunisia.
Increases in vertical accountability scores in South Asia and the Middle East and North Africa were steeper than for other types of accountability because the democratic transitions in these regions involved holding free and fair elections, often for the first time. Vertical accountability captures the ability of citizens to hold the government accountable mainly through elections. Lührmann et al. (2019) explain that vertical accountability is the first type of accountability to develop after political transitions.
Horizontal accountability reflects the ability of state institutions to monitor the government. Scores are lower than for vertical and diagonal accountability for all regions except North America. Progress in horizontal accountability depends on the presence of strong institutions that can oversee the government and hold it accountable. For example, free and fair legislative elections mean that legislators have incentives to create the institutions necessary to oversee and monitor governments actions. The presence of free and independent media provides voters with important information
Accountability index 1.0 0.9 0.8 0.7 0.6 0.5 0.4 0.3 0.2 0.1 0 NorthAmerica
J Aggregate accountability J Vertical accountability J Horizontal accountability J Diagonal accountability Source: Lührmann, Marquardt, and Mechkova 2020; V-Dem Dataset v12 (Coppedge et al. 2022a). 60 C HAPTER 2: A CCOUNTABILITY IN THE M IDDLE E AST AND N ORTH A FRICA : C ONCEPT AND M EASUREMENTS MIDDLE EAST AND NORTH AFRICA REGION | ECONOMIC UPDATE OCTOBER 2022
to hold the executive and legislative branches accountable (Mechkova, Lührmann, and Lindberg 2019). Improvements in horizontal accountability for South Asia and The Middle East and North Africa have been gradual and have not reached the levels of vertical and diagonal accountability.
Accountability has improved in 81 countries over the last 20 years and declined in 97 according to Figure 4. The accountability scores of 10 Middle Eastern and North African countries improved from 2000 to 2020, whereas scores of nine declined. Figure 4 shows the change in aggregate accountability score over the last 20 years. The y-axis shows scores for 2020, and the x-axis shows scores for 2000. Scores of countries above the 45-degree line improved from 2000 to 2020, and those of countries below the line declined. In the Middle East and North Africa, the biggest positive change happened in Iraq, Libya, and Tunisia, with more than a 0.5-point increase. These changes are mainly due to political change and the organization of elections. The worst-performing countries are Iran, West Bank and Gaza, and Yemen, with a 0.2-point decrease.
Relationship between Accountability Indices
Figures 5, 6 and 7 show more closely the relationships between the accountability subindices. The horizontal dashed line displays the global average score of the accountability index on the y-axis, and the vertical dashed line gives the average score of the accountability index on the x-axis, dividing the graph into four quadrants, which indicates whether a country has higher- or lower-than-average accountability scores. The fitted line shows the correlation between the indices. As Figures 5 and 6 show, most Middle Eastern and North African countries have lower-than-average accountability scores because they are situated in the lower left quadrant, but they perform better on horizontal than vertical and diagonal accountability. Figure 7 also shows that most Middle Eastern and North African countries underperform other countries on vertical and diagonal accountability, but they perform better on vertical than diagonal accountability.
Figure 3. Aggregate accountability index according to geographic region, 2000–20 Figure 4. Aggregate accountability index between 2000 and 2020 Accountability index Aggregate accountability index in 2020 1.0 0.9 0.8 0.7 0.6 0.5 0.4 200020012002200320042005200620072008200920102011201220132014201520162017201820192020 1.0 0.9 0.8 0.7 0.6 0.5 0.4 0.3 0.2 0.1 0 0 0.1 0.2 0.3 0.4 0.5 0.6 0.7 0.8 0.9 1.0 ARE BHR DJI DZA EGY IRN IRQ JOR KWT LBN LBY MAR OMN PSE QATSAU SYR TUN YEM Aggregate accountability index in 2000 ▬ North America ▬ ECA ▬ LAC ▬ EAP ▬ SA ▬ SSA ▬ MENA Source: Lührmann, Marquardt, and Mechkova 2020; V-Dem Dataset v12 (Coppedge et al. 2022a). Source: Lührmann, Marquardt, and Mechkova 2020 and V-Dem Dataset v12 (Coppedge et al. 2022a). Note: The scatter plot shows accountability scores in 2000 on the x-axis and in 2020 on the y-axis. The red dots represent Middle Eastern and North African countries, and the gray dots represent non-Middle Eastern and North African countries. 61C HAPTER 2: A CCOUNTABILITY IN THE M IDDLE E AST AND N ORTH A FRICA : C ONCEPT AND M EASUREMENTS A NEW STATE OF MIND: GREATER TRANSPARENCY AND ACCOUNTABILITY IN THE MIDDLE EAST AND NORTH AFRICA PART II: THE LEARNING STATE
Diagonal
Figure 5. Vertical and horizontal accountability
Figure 6. Horizontal and diagonal accountability
Figure 7. Vertical and diagonal accountability
Horizontal Accountability
Middle Eastern and North African countries perform better on horizontal than other dimensions of accountability. This section focuses on horizontal accountability and attempts to identify how the region performs on various aspects of horizontal accountability. Horizontal accountability captures the extent to which public institutions investigate the government and punish illegal activities. Lührmann, Marquardt, and Mechkova (2020) operationalize it as a composite indicator of variables measuring constraints on the executive by the judicial, legislative, and other public agencies, as well as constraints by the executive on itself. Judicial oversight measures courts’ independence and executive compliance with courts’ decisions. Legislative oversight measures the likelihood that the legislature would investigate the executive
accountability has the highest correlation with the aggregate accountability index and with vertical and horizontal accountability because it acts as an intermediary mechanism that reinforces the other types of accountability (Lührmann, Marquardt, and Mechkova 2020). Vertical and horizontal accountability are the least correlated with each other.
Horizontal accountability index Horizontal accountability index 1.0 0.9 0.8 0.7 0.6 0.5 0.4 0.3 0.2 0.1 0 0 0.1 0.2 0.3 0.4 0.5 0.6 0.7 0.8 0.9 1.0 ARE BHR DJI DZA EGY IRN IRQ JOR KWT LBN LBY MAR OMN PSE QAT SAU SYR TUN YEM 1.0 0.9 0.8 0.7 0.6 0.5 0.4 0.3 0.2 0.1 0 0 0.1 0.2 0.3 0.4 0.5 0.6 0.7 0.8 0.9 1.0 ARE BHR DJI DZA EGY IRN IRQ JOR KWT LBN LBY MAR OMN PSE QAT SAU SYR TUN YEM Vertical accountability index Diagonal accountability index
Diagonal accountability index 1.0 0.9 0.8 0.7 0.6 0.5 0.4 0.3 0.2 0.1 0 0 0.1 0.2 0.3 0.4 0.5 0.6 0.7 0.8 0.9 1.0 ARE BHR DJI DZA EGY IRN IRQ JOR KWT LBN LBY MAR OMN PSE QAT SAU SYR TUN YEM Vertical accountability index Source: Based on data from Lührmann, Marquardt, and Mechkova (2020) and V-Dem Dataset v12 (Coppedge et al. 2022a). Note: The scatter plot represent the average accountability scores by geographical region. The red dots represent Middle Eastern and North African countries, and the gray ones represent non-Middle Eastern and North African countries. The horizontal dashed line displays the global average score of the accountability index on the y-axis and the vertical dashed line gives the average score of the accountability index on the x-axis. The solid line represents the correlation between the accountability index on the y-axis and the accountability index on the x-axis.
62 C HAPTER 2: A CCOUNTABILITY IN THE M IDDLE E AST AND N ORTH A FRICA : C ONCEPT AND M EASUREMENTS MIDDLE EAST AND NORTH AFRICA REGION | ECONOMIC UPDATE OCTOBER 2022
and find that it engaged in illegal activities. Oversight by other public agencies involves entities such as comptroller general, general prosecutor, and ombudsman. Executive oversight measures how well the government respects the constitution (Coppedge et al. 2022b; Lührmann, Marquardt, and Mechkova 2020). Figure 8 shows how different regions perform on aspects of horizontal accountability. The Middle East and North Africa performs worse than other regions on all aspects of horizontal accountability, particularly oversight by independent public agencies and the executive branch.
4. Accountability and per capita GDP
Figure
Horizontal accountability,
Table 1 shows the results of an ordinary least squares regression of accountability measures on log per capita GDP. All measures of accountability are positively associated with log per capita GDP, PPP. The correlation with log per capita GDP is highest for horizontal accountability and lowest for diagonal accountability. The R-squared, which measures the proportion of the variation in accountability measures that is explained by log per capita, is low for all accountability measures. Per capita income explains between 5 percent and 12.5 percent of the variation in accountability measures.
Table 1. Correlation between accountability and log per capita Gross Domestic Product (GDP)
Dependent Variable: accountability measure
Aggregate accountability Vertical accountability Horizontal accountability Diagonal accountability Log GDP per capita, PPP 0.059 (0.003)*** 0.063 (0.003)*** 0.077 (0.004)*** 0.042 (0.003)***
Constant 0.170 (0.035)*** 0.121 (0.030)*** -0.066 (0.039)* 0.345 (0.036)***
Year fixed effects Yes Yes Yes Yes Observations 3,490 3,490 3,490 3,490 R-squared 0.083 0.127 0.110 0.043
Countries in the Middle East and North Africa significantly underperform their income peers in all dimensions of accountability. Figure 9 is a scatter plot of accountability scores and log per capita gross domestic product (GDP). The solid line corresponds to the regression of average accountability score and log per capita GDP. The dashed line represents the average accountability score in the sample. All Middle Eastern and North African countries have lower vertical accountability scores than their per capita income would predict. Some countries have higher horizontal accountability scores (Iran, Iraq, Jordan, Kuwait, Morocco). All Middle Eastern and North African countries except Lebanon have lower diagonal accountability scores than their per capita income would predict.
Figure
presents the residuals of the aggregate accountability scores and the three subtypes. The residuals are obtained as the difference between observed accountability scores
fitted
that accountability
on average higher than what income
accountability scores on log per capita GDP. Positive residuals
Note: This table shows an ordinary least squares regression of accountability scores on per capita GDP covering 168 countries, including 17 Middle Eastern and North African countries, from 2000 to 2020. Syria and Yemen are not included because of lack of data on per capita GDP. Standard errors in parentheses and *** p<0.01, ** p<0.05, * p<0.1.
10
and
values from the regression of
signify
scores are
8.
2020 East Asia Pacificand Europe Central Asiaand Latin America and the Caribbean Middle East North Africaand North America South Asia Sub-Saharan Africa 0 2 4 6 8 1.0 1.2 1.4 Judicial oversight Legislative oversight Oversight by other bodies Executive oversight Source: Lührmann, Marquardt, and Mechkova 2020; V-Dem Dataset v12 (Coppedge et al. 2022a). Note: The figure shows regional scores for various aspects of horizontal accountability. 63C HAPTER 2: A CCOUNTABILITY IN THE M IDDLE E AST AND N ORTH A FRICA : C ONCEPT AND M EASUREMENTS A NEW STATE OF MIND: GREATER TRANSPARENCY AND ACCOUNTABILITY IN THE MIDDLE EAST AND NORTH AFRICA PART II: THE LEARNING STATE
Figure 9. Aggregate accountability index and per capita Gross Domestic Product (GDP)
levels would predict and vice versa. North America, Latin America and the Caribbean, and Europe and Central Asia have higher accountability scores than their income levels predict; South Asia and Sub-Saharan Africa’s scores are close to what would be predicted by their per capita income; and East Asia and the Pacific and the Middle East and North Africa have negative residuals.
The Middle East and North Africa has the highest negative residuals for all measures of accountability. Residuals in the Middle East and North Africa are less than onetenth (one standard deviation lower than) the residuals of non-Middle Eastern and North African countries. The Middle East and North Africa performs better on horizontal accountability and worse on diagonal accountability compared to vertical accountability. There is significant heterogeneity in all accountability dimensions across
Middle Eastern and North African countries, which with few exceptions, perform worse on accountability than what their income level would predict. Some countries, such as Iraq, Jordan, Kuwait, Lebanon, and Morocco, have very small residuals, which means that their accountability scores are close to those of their income peers. Higher-income and resource-rich Middle Eastern and North African countries (Bahrain, Oman, Qatar, Saudi Arabia, United Arab Emirates) have higher residuals than
residuals
Middle East and North Africa for 2000, 2010, and 2020
for all types of accountability have decreased over the period, which signifies that
show the evolution of
Africa’s accountability scores are approaching what their income levels
Middle East and
the rest of the region. Figure 11 presents the
of the accountability scores for the
to
the residuals over time. The residuals
the
North
would predict between 2000 and 2020.
Aggregate accountability index 1.0 0.9 0.8 0.7 0.6 0.5 0.4 0.3 0.2 0.1 0 7.0 7.5 8.0 8.5 9.0 10.0 10.5 11.0 11.5 12.09.5 ARE BHR DJI DZA EGY IRN IRQ JOR KWTLBN LBY MAR OMN PSE QATSAU TUN Log GDP per capita, PPP Source: Lührmann, Marquardt, and Mechkova (2020); V-Dem Dataset v12 (Coppedge et al. 2022a); World Development Indicators. Note: The scatter plot shows average accountability scores according to the geographic region from 2000 to 2020. The red dots represent Middle Eastern and North African countries, and the gray dots represent nonMiddle Eastern and North African countries. The solid line represents an ordinary least squares regression of accountability score on log per capita gross domestic product, and the dashed line represents the average accountability score in the sample. Figure 10. Residuals of accountability measures across regions, 2000–20 Figure 11. Evolution of residuals of accountability indices for the Middle East and North Africa, 2000–20 Residuals of accountability index 0.2 0.1 0 -0.1 -0.2 -0.3 -0.4NorthAmerica ECA MENA EAP LAC SA SSA 0 -0.05 -0.10 -0.15 -0.20 -0.25 -0.30 -0.35 -0.40 Aggregate accountability Vertical accountability Horizontal accountability Diagonal accountability J Aggregate accountability J Vertical accountability J 2000 J 2010 J 2020 J Horizontal accountability J Diagonal accountability Source: Lührmann, Marquardt, and Mechkova 2020; V-Dem Dataset v12 (Coppedge et al. 2022a); World Development Indicators. Note: Bars represent residuals of accountability scores regressed against log per capita gross domestic product for 2000 to 2020. 64 C HAPTER 2: A CCOUNTABILITY IN THE M IDDLE E AST AND N ORTH A FRICA : C ONCEPT AND M EASUREMENTS MIDDLE EAST AND NORTH AFRICA REGION | ECONOMIC UPDATE OCTOBER 2022
5. Accountability and trust in government
To validate their index, Lührmann, Marquardt, and Mechkova (2020) investigate the relationship between their aggregate accountability measure and a key human development outcome—infant mortality—and find a strong negative association between the two measures. They find similar results using the three sub indicators of accountability. The results are robust to inclusion of democracy measures—signifying that the accountability indicators capture something different from democracy measures—and inclusion of several controls identified in the literature as important determinants of infant mortality. They conclude that accountability explains significant variation in infant mortality measures.
This section extends Lührmann, Marquardt, and Mechkova’s (2020) analysis by examining the relationship between accountability and a key political measure—trust in institutions. The OECD (2017) defines trust as “a person’s belief that another person or institution will act consistently with their expectations of positive behavior” and identifies two types of trust: trust in others and trust in institutions. Trust in institutions refers to trust in political institutions such as the government and the parliament; law-and-order institutions such as the courts, police, and military; and nongovernmental institutions such as political parties and nongovernmental organizations (OECD 2017).
Trust in public institutions is a cornerstone of effective governance. It forms the basis of the relationship between citizens and their representatives. Trust in institutions is also essential for officials to be able to implement public policies effectively and ensure compliance by the people. Murphy (2004) finds that higher levels of trust in institutions reduce instances of tax avoidance and Marien and Hooghe (2011) find that a lower level of political trust is associated with a lower level of compliance with the law. Other studies find that trust is important for economic development. Algan and Cahuc (2007) find that trust has a significant impact on per capita income for 30 countries from 1949 to 2003, and observe that developing countries would have doubled their per capita income for that period if they had the same levels of trust as Scandinavian countries. They explain that higher levels of trust promote cooperation between individuals, which has a positive impact on productivity and provides incentives to accumulate physical and human capital. The recent pandemic has highlighted how trust in public institutions is essential for effective decision making. Governments were tasked with making difficult, unpopular decisions involving health regulations, mask mandates, and vaccinations during the COVID-19 pandemic. Trust in governments meant that people were more likely to believe the government and comply with its orders and recommendations. Bollyky et al. (2022) find that countries with greater trust in the government and in others had lower infection rates during the pandemic, greater compliance with COVID-19 regulations, and higher vaccination rates.
We use data on trust in institutions from Gallup World Poll for a sample of 151 countries for 2006 to 2020. Individuals were asked how much confidence they have in certain institutions, including the government, courts, police, and military. Answers to these questions capture the level of trust citizens have in public institutions. Gallup World Poll was used because it provided the greatest coverage of countries and years with an average of 120 countries annually and a total of 1,804 observations. The dependent variable measures the average share of respondents who answer yes to questions on whether they have confidence in the government, courts, police, and military. The other responses are no and I don’t know. Accountability is measured using the aggregate accountability index and its three sub indicators from Lührmann, Marquardt, and Mechkova (2020) and V-Dem dataset (Coppedge et al. 2022a).
We also include several controls identified in the literature as potential determinants of trust in institutions. The literature on trust in institutions identifies two main drivers: social trust and economic performance (Coleman 1994; Netjes 2005;
65C HAPTER 2: A CCOUNTABILITY IN THE M IDDLE E AST AND N ORTH A FRICA : C ONCEPT AND M EASUREMENTS A NEW STATE OF MIND: GREATER TRANSPARENCY AND ACCOUNTABILITY IN THE MIDDLE EAST AND NORTH AFRICA PART II: THE LEARNING STATE
Putnam 1993). Institutional trust can be viewed as a byproduct of social trust. People trust institutions because they trust most people in the society. Trust in public institutions is also a function of the economic and political performance of these institutions. Therefore, citizens’ trust in institutions depends on obtaining material benefits such as economic growth, political stability, and security (Netjes 2005). OECD (2017) finds declining levels of trust in the government in OECD countries after the 2008 financial crisis and attribute the decrease in trust to concerns about lack of economic growth, corruption, and increasing economic inequalities. We include a variable measuring trust in neighbors as a proxy for social trust and variables measuring perceptions of current economic conditions and corruption in the government as a proxy for performance of institutions. These three measures are taken from Gallup World Poll. We also control for level of democracy using the Freedom House/Polity score, because the concepts of accountability and democracy are closely related (Lührmann, Marquardt, and Mechkova 2020), and log of per capita GDP, PPP to proxy for the level of development.
The results show that vertical and horizontal accountability are both positively associated with trust in institutions, which suggests that countries with greater vertical and horizontal accountability have higher levels of trust in institutions. More specifically, column 2 of Table 2 shows that a 1–standard deviation increase in vertical accountability is associated with a 2.8 percent increase in the share of respondents who have confidence in institutions, whereas a similar increase in horizontal accountability is associated with a 6.1 percent increase in trust in institutions. Vertical accountability relates to electoral accountability and the ability of political parties to hold government officials accountable, and horizontal accountability captures how state institutions monitor the government and sanction misbehavior. This suggests that these two channels, particularly horizontal accountability, are important in increasing transparency and therefore increasing citizens’ trust in their institutions.
Diagonal accountability is negatively correlated with trust in institutions. Column 2 of Table 2 shows that a 1–standard deviation increase in diagonal accountability is associated with an 11.5 percent decrease in the share of respondents who trust institutions. Diagonal accountability measures how informal institutions such as the media and civil society monitor the government and hold it accountable to the public. The media and civil society can publish information on government corruption, but they cannot sanction the government and must depend on vertical and horizontal accountability to punish misbehavior. The results suggest that, in the absence of vertical and horizontal accountability, diagonal accountability alone reduces people’s trust in state institutions. This is in line with previous research which finds that countries with greater press freedom have less trust in institutions because of higher coverage of government corruption (Färdigh, Andersson, and Oscarsson 2011; Yakovlev and Gilson 2015). Our results suggest that accountability is a key element in improving citizens’ trust in institutions, but it requires improvement in all dimensions of accountability, particularly vertical and horizontal.
Column 3 introduces a Middle Eastern and North African dummy that is equal to 1 for countries in the Middle East and North Africa and interaction terms between the Middle Eastern and North African dummy and the three dimensions of accountability (vertical, horizontal, diagonal). The Middle Eastern and North African dummy is negative, which suggests that trust in institutions in the region is lower than in the rest of the world.8 Comparing the Middle East and North Africa with other regions shows that trust in institutions in the region is on average lower, although the differences are not
8 The Middle East and North Africa has the second lowest level of trust
with countries such as Egypt,
levels
would
in institutions after Latin America and the Caribbean, although there is significant heterogeneity across the region,
Jordan, and Kuwait having higher levels of trust in institutions than their income peers, and countries such as Iraq, Lebanon, and Libya having lower institutional trust
than their income
predict. 66 C HAPTER 2: A CCOUNTABILITY IN THE M IDDLE E AST AND N ORTH A FRICA : C ONCEPT AND M EASUREMENTS MIDDLE EAST AND NORTH AFRICA REGION | ECONOMIC UPDATE OCTOBER 2022
Table 2. Correlation between trust in state institutions and accountability
Dependent Variable: Trust in institutions (1) (2) (3) (4) Aggregate Accountability Dimensions of Accountability MENA More Controls
Accountability index -0.119 (0.019)***
Vertical accountability index 0.127 (0.042)*** 0.081 (0.049)*** 0.155 (0.064)**
Horizontal accountability index 0.212 (0.020)*** 0.231 (0.022)*** 0.146 (0.023)***
Diagonal accountability index -0.442 (0.033)*** -0.452 (0.035)*** -0.265 (0.042)***
MENA dummy -0.081 (0.052)
MENA dummy * Vertical accountability index 0.034 (0.108)
MENA dummy * Horizontal accountability index -0.056 (0.087)
MENA dummy * Diagonal accountability index 0.072 (0.103)
Log per capita GDP 0.015 (0.003)*** 0.001 (0.004) 0.003 (0.004) -0.041 (0.005)***
Perception of Economic Conditions (SE) 0.295 (0.025)***
Trust Neighbors 0.195 (0.032)***
Perception of Corruption in Government -0.259 (0.024)***
Level of Democracy (Freedom House/Polity) -0.001 (0.004)
Year Fixed Effects Yes Yes Yes Yes
Observations 1,782 1,782 1,782 755
R-squared 0.037 0.131 0.137 0.534
table
to
including 16 Middle Eastern and North
statistically significant.9 Only trust in the military is higher in the Middle East and North Africa (75% of respondents), and the difference is statistically significant at the 95% confidence level. Column 3 of Table 2 also shows that the correlation between accountability and trust in the Middle East and North Africa does not differ significantly from the overall sample; greater vertical and horizontal accountability is associated with higher levels of trust in institutions, and diagonal accountability has a negative association with trust in institutions.
9 Overall, 48 percent of respondents have confidence in the government and the courts, 68 percent trust the military, and 63 percent trust the police.
Note: This
shows an ordinary least squares regression of trust in institutions on accountability scores and several control variables covering 151 countries for 2000
2020,
African countries. Standard errors in parentheses and *** p<0.01, ** p<0.05, * p<0.1. 67C HAPTER 2: A CCOUNTABILITY IN THE M IDDLE E AST AND N ORTH A FRICA : C ONCEPT AND M EASUREMENTS A NEW STATE OF MIND: GREATER TRANSPARENCY AND ACCOUNTABILITY IN THE MIDDLE EAST AND NORTH AFRICA PART II: THE LEARNING STATE
Accountability is a cornerstone of good governance. It is also key for enhancing societal trust in public institutions. This chapter focuses on accountability in the Middle East and North Africa using the definition and measurement of accountability proposed by Lührmann, Marquardt, and Mechkova (2020). Accountability is defined as de facto constraints on the government’s use of power and can be divided into three sub indicators: vertical accountability, which captures electoral accountability and freedom to organize political parties; horizontal accountability, which refers to checks and balances between state institutions; and diagonal accountability, which measures oversight by informal institutions such as the media and civil society organizations. The Middle East and North Africa has had the lowest accountability score of all regions over the last 20 years, although there is significant heterogeneity across countries in the region. Some countries, such as Jordan and Morocco, are close to their income peers, whereas the richer oil-exporting countries have the largest underperformance of the region. In addition, the region scores better in horizontal than in vertical or diagonal accountability, but it must improve some aspects of horizontal accountability such as oversight by independent public agencies and by the executive branch. We also find that vertical and horizontal accountability are positively associated with trust in institutions, whereas diagonal accountability is not. These results hold for the Middle East and North Africa, although trust in most institutions is lower in the region compared to other regions.
References
Ackerman, J. M. (2005). Social accountability in the public sector: A conceptual discussion and learning module. World Bank, Washington, DC. Adcock, R., and Collier, D. (2001). “Measurement validity: A shared standard for qualitative and quantitative research.” American political science review, 95(3), pp. 529-546. Algan, Y., and Cahuc, P. (2007). “Social attitudes and economic development: an epidemiological approach.” IZA Discussion Papers No. 2935. Institute for the Study of Labor (IZA), Bonn, Germany.
Allenby, G. M., Rossi, P. E., and McCulloch, R. E. (2005). “Hierarchical bayes models: A practitioners guide.” SSRN scholarly paper id 655541. Social Science Research Network, Rochester, NY. http://dx.doi.org/10.2139/ssrn.655541.
Behn, R. D. (2001). Rethinking democratic accountability. Brookings Inst Press, Washington, DC.
Bollyky, T. J., Hulland, E. N., Barber, R. M., Collins, J. K., Kiernan, S., Moses, M., ... and Dieleman, J. L. (2022). “Pandemic preparedness and COVID-19: an exploratory analysis of infection and fatality rates, and contextual factors associated with preparedness in 177 countries, from Jan 1, 2020, to Sept 30, 2021.” The Lancet, 399(10334), pp. 1489-1512.
Cai, L., and Thissen, D. (2014). “Modern approaches to parameter estimation in item response theory.” In Handbook of item response theory modeling (pp. 41-59). Routledge.
Coleman, J. S. (1994). Foundations of social theory. Harvard university press, Cambridge, MA.
Coppedge, M., Gerring, J., Knutsen, C. H., Lindberg, S. I., Teorell, J., Alizada, N., Altman, D., Bernhard, M., Cornell, A., Fish, M.S., Gastaldi, L., Gjerløw, H., Glynn, A., Grahn, S., Hicken, A., Hindle, G., Ilchenko, N., Kinzelbach, K., Krusell, J., Marquardt, K.L., McMann, K., Mechkova, V., Medzihorsky, J., Paxton, P., Pemstein, D., Pernes, J., Rydén, O., von Römer, J., Seim, B., Sigman, R., Skaaning, S., Staton, J., Sundström, A., Tzelgov, E., Wang, Y., Wig, T., Wilson, S. and Ziblatt, D. (2022a). V-Dem Dataset v12.
6. Conclusion
68 C HAPTER 2: A CCOUNTABILITY IN THE M IDDLE E AST AND N ORTH A FRICA : C ONCEPT AND M EASUREMENTS MIDDLE EAST AND NORTH AFRICA REGION | ECONOMIC UPDATE OCTOBER 2022
Coppedge, M., Gerring, J., Knutsen, C. H., Lindberg, S. I., Teorell, J., Altman, D., Bernhard, M., Cornell, A., Fish, M.S., Gastaldi, L., Gjerløw, H., Glynn, A., Grahn, S., Hicken, A., Kinzelbach, K., Marquardt, K.L., McMann, K., Mechkova, V., Paxton, P., Pemstein, D., von Römer, J., Seim, B., Sigman, R., Skaaning, S., Staton, J., Tzelgov, E., Uberti, L., Wang, Y., Wig, T., Wilson, S. and Ziblatt, D. (2022b). V-Dem Codebook v12.
Coppedge, M., Gerring, J., Knutsen, C. H., Lindberg, S. I., Teorell, J., Marquardt, K.L., Medzihorsky, J., Pemstein, D., Alizada, N., Gastaldi, L., Hindle, G., Pernes, J., von Römer, J., Tzelgov, E., Wang, Y. and Wilson, S. (2022c). V-Dem Methodology v12
Färdigh, M. A., Andersson, E., and Oscarsson, H. (2011). “Reexamining the relationship between press freedom and corruption.” Working Paper Series No. 2011:13. University of Gothenburg, Göteborg, Sweden. Gallup. (2021). Gallup World Poll. [Data set]. https://www.gallup.com/analytics/318875/global-research.aspx.
Goetz, A. M., and Jenkins, R. (2001). “Hybrid forms of accountability: citizen engagement in institutions of public-sector oversight in India.” Public Management Review, 3(3), pp. 363-383.
Integrity, G. (2011). Global integrity report 2011. Methodology white paper, Global Integrity. International Monetary Fund. (2007). Manual on Fiscal Transparency. IMF, Washington DC.
Kaufmann, D., and Kraay, A. (2008). “Governance indicators: where are we, where should we be going?” The World Bank Research Observer, 23(1), pp. 1-30.
Kaufmann, D., Kraay, A., and Mastruzzi, M. (2011). “The worldwide governance indicators: methodology and analytical issues1.” Hague journal on the rule of law, 3(2), pp. 220-246.
Lindberg, S. I. (2013). “Mapping accountability: core concept and subtypes.” Revue Internationale des Sciences Administratives, 79(2), pp. 209-233.
Lührmann, A., Marquardt, K. L., and Mechkova, V. (2020). “Constraining governments: New indices of vertical, horizontal, and diagonal accountability.” American Political Science Review, 114(3), pp. 811-820.
Mechkova, V., Lührmann, A., and Lindberg, S. I. (2019). “The accountability sequence: from de-jure to de-facto constraints on governments.” Studies in Comparative International Development, 54(1), pp. 40-70. Marien, S., and Hooghe, M. (2011). “Does political trust matter? An empirical investigation into the relation between political trust and support for law compliance.” European Journal of Political Research, 50(2), pp. 267-291.
Marquardt, K. L. (2020). “How and how much does expert error matter? Implications for quantitative peace research.”
Journal of Peace Research, 57(6), pp. 692-700.
Marquardt, K. L., and Pemstein, D. (2018). “IRT models for expert-coded panel data.” Political Analysis, 26(4), pp. 431456.
Marshall, M. G., Jaggers, K., and Gurr, T. R. (2002). Polity IV project: Dataset users’ manual. University of Maryland, College Park.
Maxwell, L., Marquardt, K. L., and Lührmann, A. (2018). The V-Dem Method for Aggregating Expert-Coded Data. V-Dem Policy Brief No. 17, V-Dem Institute. https://www.v-dem.net/static/website/files/pb/pb_17.pdf
Mechkova, V., Lührmann, A., and Lindberg, S. I. (2019). “The accountability sequence: from de-jure to de-facto constraints on governments.” Studies in Comparative International Development, 54(1), pp. 40-70.
Murphy, K. (2004). “The role of trust in nurturing compliance: A study of accused tax avoiders.” Law and human behavior, 28(2), pp. 187-209.
Netjes, C. E. (2005). “Institutional Trust in Central and Eastern Europe: Barometer of Democracy or Performance Thermostat?” Working Papers Political Science No. 2005/02.
O'Donnell, G. A. (1998). “Horizontal accountability in new democracies.” Journal of democracy, 9(3), pp. 112-126.
69C HAPTER 2: A CCOUNTABILITY IN THE M IDDLE E AST AND N ORTH A FRICA : C ONCEPT AND M EASUREMENTS A NEW STATE OF MIND: GREATER TRANSPARENCY AND ACCOUNTABILITY IN THE MIDDLE EAST AND NORTH AFRICA PART II: THE LEARNING STATE
OECD (Organization for Economic Cooperation and Development). (2006). DAC Guidelines and Reference Series Applying Strategic Environmental Assessment: Good Practice Guidance for Development Co-operation. OECD, Paris.
OECD (Organization for Economic Cooperation and Development). (2017). OECD guidelines on measuring trust. OECD Publishing, Paris.
Putnam, R. (1993). “The prosperous community: Social capital and public life.” The American prospect, 13(4), pp. 3542.
Schedler, A. (1999). “Conceptualizing accountability.” In A. Schedler, L. J. Diamond, and M. F. Plattner (Eds.), The selfrestraining state: Power and accountability in new democracies (pp. 13-28). Lynne Rienner Publishers, Boulder, CO. https://works.bepress.com/andreas_schedler/22/.
Schedler, A., Diamond, L. J., and Plattner, M. F. (Eds.). (1999). The self-restraining state: power and accountability in new democracies. Lynne Rienner Publishers, Boulder, CO.
Schmitter, P. C., and Karl, T. L. (1991). “What Democracy Is... and Is Not.” Journal of democracy, 2(3), pp. 75-88.
Thomas, M. A. (2010). “What do the worldwide governance indicators measure?” The European Journal of Development Research, 22(1), pp. 31-54.
Williams, A. (2015). “A global index of information transparency and accountability.” Journal of Comparative Economics, 43(3), pp. 804-824.
Yakovlev, P., and Gilson, D. (2015). “Public trust and press freedom.” Economics Bulletin, 35(1), pp. 214-225.
70 C HAPTER 2: A CCOUNTABILITY IN THE M IDDLE E AST AND N ORTH A FRICA : C ONCEPT AND M EASUREMENTS MIDDLE EAST AND NORTH AFRICA REGION | ECONOMIC UPDATE OCTOBER 2022
Chapter 3: The Evolving Case for Investing in Official Statistics and Data Transparency in the Middle East and North Africa by Johannes G. Hoogeveen
1. Introduction
This chapter seeks an explanation for the limited production and public release of official statistics in the Middle East and North Africa. It argues that certain regimes may be letting official statistics wither to avoid public dissent. Not producing statistical information hampers decision making but also limits the ability of citizens to rally against their authorities. To the degree that this reasoning explains past behavior, the calculation in favor of not producing and releasing official statistics has changed over the last two decades. Various regimes have become increasingly adept at controlling the media and with it the data that are allowed to inform public discourse. In a parallel development, production of statistics has democratized. In combination, this suggests that production of official statistics has become less risky from a public relations perspective and more desirable as economies have become more complex and the economic value of trusted, unbiased statistics greater.
In their book, “The Narrow Corridor,” Daron Acemoglu and James Robinson illustrate the limited capacity of the state of Lebanon by highlighting its inability to conduct a population census (the most recent was in 1932). Every country needs basic information on its residents for purposes of planning, development, and improvement of residents' quality of life, and population censuses are the go-to source for such data. Absence of reliable, up-to-date, accurate, detailed information on inhabitants limits the ability of any state to provide services. In the absence of detailed population data, bureaucrats fly blind, and public services are hard to organize; providing social protection and health and education services, developing budgets, running elections, estimating gross domestic product (GDP), and making growth estimates require recent population data. It is difficult to imagine how a state can function effectively and efficiently in the absence of up-to-date census data.
Acemoglu and Robinson explain that the absence of a census in Lebanon is not because of lack of the ability to implement a census but due to the failure of the authorities to convince the population of its necessity. In their explanation, the country’s powerful factions prefer an ineffective state over a capable one. Fear that one faction might end up dominating the public sector and, through it, other factions is behind this. Acemoglu and Robinson conclude that the revealed preference of Lebanon’s civil society is for a weak government that is unable to make informed decisions and monitor its services over a government that is capable and a potential threat.
With this illustration, Acemoglu and Robinson draw attention to various ties between governance and official statistics that will be explored in this chapter; official statistics are necessary for decision making, the quality of statistics reflects the ability of a state to serve its citizens, and the absence of timely and accurate statistics is costly but is more likely the consequence of a policy choice than the result a lack of technical capacity or financial resources. The chapter investigates plausible reasons explaining this policy choice and argues that, since the onset of the digital revolution, the costs and benefits of not producing and publicly disseminating statistics have changed in favor of greater data transparency. Decision makers in the region must still internalize this new reality, although some countries, Iran and West Bank and Gaza in particular, appear to have done so.
The chapter starts in section 2 by investigating how the availability and quality of statistics correlate with other indicators of economic policy and welfare. It reports high levels of correlation and argues that the quality of statistics is a plausible proxy for the state of the social contract. Keeping this concept in mind, the section evaluates how the quality of statistics (read the social contract) has evolved in the region since 2004—the first time statistical capacity was measured. In Sections 3 and 4, key issues identified in Islam (2022)—the limited production of statistics in the Middle East and North Africa and low degrees of data transparency in the region—are revisited. Section 3 explores production of core statistics. It focuses on collection of microdata and concludes that many data sets are outdated and that even the relatively well
72 CHAPTER 3: THE EVOLVING CASE FOR INVESTING IN OFFICIAL STATISTI CS AND DATA TRANSPARENCY IN THE MIDDLE EAST AND NORTH AFRICA MIDDLE EAST AND NORTH AFRICA REGION | ECONOMIC UPDATE OCTOBER 2022
performing countries face major data gaps in their core statistics. In Section 4, the focus shifts to public availability of the microdata sets that are collected. It concludes that most countries in the region publish very few of them, a point that Islam (2022) also makes—with West Bank and Gaza and Iran being exceptions. Section 5 seeks to determine why statistics in the region underperform to the degree they do. It argues that lack of resources and inadequate capacity to produce statistics do not explain the data gaps observed. Instead, it is hypothesized that statistics have been allowed to wither to limit the information available for public discourse and that decision makers are apparently ready to pay the non-negligible cost (also emphasized in Islam (2022)) of doing so in terms of less-informed decision making, limited ability to monitor service provision, and foregone growth and economic development. The costs and benefits of this trade-off have changed over the past two decades, with the cost of not producing relevant official statistics having increased, largely because of availability of unofficial alternatives that the digital revolution has made possible. Meanwhile, the benefits of limiting (public) availability of statistics have declined because of changes in the ability to shape and monitor public discourse. Section 6 concludes that this appears to be the right moment for the Middle East and North Africa to reconsider its stance on statistics production and transparency in favor of increasing investments in production and dissemination of accurate, timely official data.
2. Governance, official statistics, and the social contract
Official statistics are the eyes and ears of decision makers. They are needed for allocating resources, monitoring and evaluating projects, validating conclusions derived from economic theories, searching for inter-relationships of different factors, identifying areas where program interventions are needed, and forecasting through the use of statistical models. Many papers consider the link between quality of statistics and policy making. Rodrik (2010) stresses the importance of high-quality data for evidence-based policy development. Manski (2015) worries that imprecise estimates may lead to bad policy decisions if policy makers fail to account for measurement error. Binswanger and Oechslin (2015) argue that better statistics can reduce disagreements and promote economic reforms by making evaluations of past policy changes more reliable. Islam and Lederman (2020) demonstrate that data transparency has a positive effect on real per capita GDP, and Gatti and others (2021) show that because good-quality data were lacking, health systems were judged to be better prepared to manage the COVID-19 crisis than they turned out to be.
As societies grow and become more complex and interrelated, the share of GDP allocated through public spending tends to increase (Afonso et al. 2020) and with it the need for statistics to inform decision makers. Development of official statistics is intricately related to the development of European states starting in the 17th century, along with the development of probability theory, which put statistics on a firm theoretical basis. The close association between economic development and statistics is illustrated in Figure 1, which plots the Statistical Performance Index, a measure of the maturity and performance of national statistical systems,
with the Economic Complexity Index, a measure of the productive capabilities of countries explaining the knowledge accumulated in a population that is expressed in economic activity in a country.
Statistical Performance Index and Economic Complexity Index,
along
Figure 1.
2019 Statistical Performance Index 100 90 80 70 60 50 40 30 20 10 0 -2.5 -1.5 -0.5 0.5 1.5 2.5 DEU EGY KWT TUN SAUQAT JOR ARE IRNMAR DZA YEM IRQ LBY Economic Complexity Index Source: World Bank 2022; Observatory of Economic Complexity 2022. 73CHAPTER 3: THE EVOLVING CASE FOR INVESTING IN OFFICIAL STATISTI CS AND DATA TRANSPARENCY IN THE MIDDLE EAST AND NORTH AFRICA A NEW STATE OF MIND: GREATER TRANSPARENCY AND ACCOUNTABILITY IN THE MIDDLE EAST AND NORTH AFRICA PART II: THE LEARNING STATE
association between the maturity of statistical systems
socioeconomic outcomes holds across a broad range of developmental
performance
per
delivery of public services
capacity to generate income (proxied
starting
business, financial
Figure 2. Statistical Performance Index and economic development Statistical Performance Index (2019) Statistical Performance Index (2019) 100 80 60 40 20 68 10 12 DJI PSE MAR JOR IRQ TUN DZA EGY IRN LBN LBY SAU KWT ARE QAT 100 80 60 40 20 50 60 70 9080 YEM DJI IRQ EGY SYR LBY PSE JOR SAU KWT IRN MAR TUN DZA ARE LBN QAT Per capita GDP (2019, log, PPP) Life expectancy (2019, years) Predicted spi2019 Predicted spi2019 Statistical Performance Index (2019) Statistical Performance Index (2019) 100 80 60 40 20 20 40 60 12080 100 DJI JOR MAR DZA EGY KWT PSE QAT ARE SAU 100 80 60 40 20 050 100 200150 IRN KWT TUN MAR SAU QAT SYR DZA EGY JOR LBY DJI YEM PSE LBN Lower secondary completion rate (2019, percent) Cost of starting a business (percent of GNI per capita) ▬ Predicted spi2019 ▬ Predicted spi2019 Statistical Performance Index (2019) Statistical Performance Index (2019) 100 80 60 40 20 05 10 2515 20 KWT SAU PSE ARE LBN DJI IRQ 100 80 60 40 20 0 0.0005 0.004 0.00250.0015 0.002 YEM DJI SYR LBY PSE DZA EGY MAR IRQ KWT LBN JOR SAU ARE TUN QAT IRN Nonperforming loans (2019, percent of total gross loans) Scientific articles published (2018, per capita) Predicted spi2019 Predicted spi2019 Source: World Development Indicators, accessed April 22, 2022, https://data.worldbank.org/indicator/. The
and
indicators. Figure 2 presents correlations between statistical
and
by
capita GDP), ability to lead a healthy life (proxied by life expectancy),
(educational attainment), ability to create a conducive economic environment (cost of
a
74 CHAPTER 3: THE EVOLVING CASE FOR INVESTING IN OFFICIAL STATISTI CS AND DATA TRANSPARENCY IN THE MIDDLE EAST AND NORTH AFRICA MIDDLE EAST AND NORTH AFRICA REGION | ECONOMIC UPDATE OCTOBER 2022
system performance), and ability of a society to generate knowledge (number of published scientific articles per capita). In all instances, the maturity of a country’s statistical system is closely correlated with better outcomes.
With its close association with development outcomes, the Statistical Performance Index not only reflects the state of a country’s statistical system, but it may also serve as proxy for the state of the social contract—the agreement between members of a society and its rulers about the rights and duties of each. Official statistics are critical to informing decision makers and monitoring the delivery of services, so more-developed social contracts require more-mature, better-performing statistical systems. Social contracts are complex and have been difficult to define and consequently to measure. The Organization for Economic Cooperation and Development Assistance Committee defines the social contract as a process for bargaining, articulating, and mediating society’s expectations of the state.
The social contract emerges from the interaction between a) expectations that a given society has of a given state; b) state capacity to provide services, including security, and to secure revenue from its population and territory to provide these services (in part a function of economic resources; and c) élite will to direct state resources and capacity to fulfil social expectations. It is crucially mediated by d) the existence of political processes through which the bargain between state and society is struck, reinforced and institutionalized. Finally, e) legitimacy plays a complex additional role in shaping expectations and facilitating political process. Legitimacy is also produced and replenished—or, conversely, eroded—by the interaction among the other four factors... Taken together, the interaction among these factors forms a dynamic agreement between state and society on their mutual roles and responsibilities—a social contract. (OECD 2008, 17).
This multifaceted definition offers no obvious approach to measuring the quality of the social contract, yet the maturity of a statistical system is closely associated with the core elements of this definition. Statistics are a critical element of a state’s capacity to provide services, whereas the presence of a high-quality statistical system evidences élite will to direct state resources and capacity to fulfill social expectations. Statistics are crucial for informing the various trade-offs that define the bargain between state and society, whereas statistical transparency enhances state legitimacy. Consequently, although the Statistical Performance Index is not a direct measure of the state of a country’s social contract, it could arguably proxy for it (Hoogeveen 2018).
Figure 3 presents the evolution of the Statistical Capacity Index (a precursor to the Statistical Performance Index, which measures the extent to which a country’s statistical system adheres to international technical standards deemed essential for the quality of economic data). Figure 3 shows the evolution of statistical capacity across the Middle East and North Africa since 2004. After an initial increase, the indicator has been declining. Particularly since 2008 (the financial crisis) and 2011 (the Arab Spring), the indicator has declined consistently, a decline that deterioration in statistical capacity in countries with active conflicts (Libya, Syria, Yemen) largely explains. In non-fragile countries, defined here as Algeria, Djibouti, Egypt, Iran, Jordan, Morocco, and Tunisia, statistical capacity stagnated and remained largely unchanged. The right panel of Figure 3 shows how statistical capacity in Egypt and Tunisia has been declining since 2015 and shows the dramatic drop in statistical capacity in Lebanon preceding the country’s economic crisis, the decline and subsequent restoration of statistical capacity in Iran, and the rapid increase in statistical capacity in West Bank and Gaza. A complete overview of statistical capacity by country is provided in Annex Table 3.1.
75CHAPTER 3: THE EVOLVING CASE FOR INVESTING IN OFFICIAL STATISTI CS AND DATA TRANSPARENCY IN THE MIDDLE EAST AND NORTH AFRICA A NEW STATE OF MIND: GREATER TRANSPARENCY AND ACCOUNTABILITY IN THE MIDDLE EAST AND NORTH AFRICA PART II: THE LEARNING STATE
key finding of this section is that statistical capacity in the Middle East and North Africa is below what would be expected given the degree of economic complexity. Figure 1 shows how countries in the region typically find themselves below the regression line. This relative underperformance is associated with stagnation in statistical development over the past decade and a half in the nonfragile countries in the region and rapid declines in fragile countries despite the Middle East and North Africa’s GDP growth (increasing 60 percent from US$4.44 trillion in 2004 to US$7.07 trillion in 2020)1 and despite becoming economically more complex. An exception is West Bank and Gaza where statistical capacity can be increased quickly. When the Statistical Capacity Index is interpreted as reflective of the quality of the social contract, it indicates that the social contract deteriorated in countries with an active conflict or economic crisis and remained largely unchanged everywhere else (Annex 3). The Arab Spring brought to the fore the strains on social contracts in various countries, and the Statistical Capacity Index suggests that, more than a decade later, these strains remain largely unaddressed.
3. Availability of microdata in the Middle East and North Africa
Every country needs basic information on its residents and their well-being and economic activities for purposes of planning, development, improvement of residents' quality of life, and economic decision making. Good planning is based on reliable, up-to-date, accurate, detailed information on the state of the society and the economy. This information makes it possible to plan better services, improve quality of life, maintain a healthy business environment, and solve problems.
Population and establishment censuses are special data-collection activities which should take place with some regularity in all countries. Their purposes are to gather information about the general population (population census) and business establishments (economic census) to obtain a full, reliable picture of the population and the enterprises operating in a country. Information on housing conditions and demographic, social, and economic characteristics is typically collected in a population census, including data on age, sex, country of origin, year of immigration, marital status, housing conditions, marriage, number of children, education, employment, or modes of transport. An establishment census considers firm demographic characteristics (age, location), type and sector of activity, size, and employment.
Figure 3. Evolution of Statistical Capacity Index since 2004 y-axis y-axis 75 70 65 60 55 502004 ornearest 2006 20082009201020112012201320142015201620172018201920202005 2007 67 72 73 72 70 71 70 70 69 69 70 71 73 70 69 71 67 57 63 63 63 64 62 61 62 61 60 60 62 61 59 57 56 52 100 90 80 70 60 50 402004 ornearest 2006 20082009201020112012201320142015201620172018201920202005 2007 MENA MENA nonfragile PSE LBN EGY TUN IRN Source: World Development Indicators, accessed 22 April 2022. https://data.worldbank.org/indicator/IQ.SCI.OVRL One
1 Expressed in 2017 PPP values. World Development Indicators, accessed 6 May 2022. https://data.worldbank.org/indicator/NY.GDP.PCAP.PP.CD 76 CHAPTER 3: THE EVOLVING CASE FOR INVESTING IN OFFICIAL STATISTI CS AND DATA TRANSPARENCY IN THE MIDDLE EAST AND NORTH AFRICA MIDDLE EAST AND NORTH AFRICA REGION | ECONOMIC UPDATE OCTOBER 2022
Establishment censuses collect information from formal and informal enterprises and include agricultural enterprises, unless there is a separate agricultural census.
Population and establishment censuses are the most detailed information sources on the population and on economic activities at the level of small localities. They provide key demographic information on the population and firms and, through this, core information for planning services such as education, housing, and pensions while also identifying the sectoral composition of the economy and sectors of employment. Population and establishment censuses form the basis for statistical population and business registries, which in turn provide the sampling frames needed for representative surveys. Censuses are so critical to statistical systems that they are considered foundational. The standard frequency for censuses is typically every decade, although establishment censuses may be implemented more frequently, particularly when the economy undergoes rapid changes.
To investigate this how countries in the Middle East and North Africa are faring in implementing population and establishment censuses, Ekhator-Mobayode, Eseosa, and Hoogeveen (2021) turned to the websites of national statistical offices (NSOs). When a website evidences an establishment or population census, this is reflected in Table 1, along with the year for which the census is reported. Of 20 NSOs in the region, 14 reported completion during the past 10 years of a population census and nine of an establishment census. Approximately 58 percent of the total population in the region lives in a country with an up-to-date population census and 48 percent with an up-to-date establishment census. In other words, about half of the population resides in a country where decision makers do not have access to current information about their populations and the enterprises in their country.
Table 1. Availability of population and establishment census administered since 2011 according to national statistical office websites
Population census since 2010 Establishment census since 2010
Population census year Establishment census year
Algeria 0 1 2011
Bahrain 1 0 2020
Djibouti 1 0 2011
Egypt 1 1 2017 2017/18
Iran 1 0 2016 Iraq 0 0
Jordan 1 1 2015 2018
Kuwait 0 0 2005
Lebanon 0 0 2004
Libya 1 0 2012
Malta 1 0 2011
Morocco 1 0 2014 Oman 1 1 2020 2020 Qatar 1 1 2015 2015
Saudi Arabia 0 0 2010 2010
Syria 0 1 2019
Tunisia 1 0 2014
United Arab Emirates 0 0 West Bank and Gaza 1 1 2017 2017 Yemen 1 1 2014 2014 13 8
Source: Adapted from Ekhator-Mobayode and Hoogeveen 2021.
77CHAPTER 3: THE EVOLVING CASE FOR INVESTING IN OFFICIAL STATISTI CS AND DATA TRANSPARENCY IN THE MIDDLE EAST AND NORTH AFRICA A NEW STATE OF MIND: GREATER TRANSPARENCY AND ACCOUNTABILITY IN THE MIDDLE EAST AND NORTH AFRICA PART II: THE LEARNING STATE
Surveys offer critical complementary information to that provided by censuses for production of statistics. Whereas censuses provide the scaffolding for statistical systems, by offering a description of the core characteristics of the population and enterprise sector and forming the basis for sampling frames, surveys offer greater depth and fill in details that censuses do not cover. This is illustrated in Figure 4 for establishment censuses; whereas an establishment census can provide the information in the inner ring of, the statistics in the outer ring can be generated only when combined with surveys.
Figure 4. Statistical products informed by economic censuses Economic Census Gross Domestic Product (GDP) Consistent, comparable, comprehensive measures Data to understand business competitiveness Information on business location and sizes Characteristics of businesses Producer Price Index (PPI) and productivity Retail sales and other indicators Statistics by industry Statistics by geopgraphy Employment, payroll,locationssales and firms Promoting small businessEmergency imapcts Transportation uses Owner sex, race, ethnicity,and Veteran status Franchising Industry concentration by firm share Business marketing performanceand metrics Business investment planning Local economic development Accurate benchmarks for economic indicators Source: Adapted from US Census Bureau, Purposes and Uses of Economic Census data. 78 CHAPTER 3: THE EVOLVING CASE FOR INVESTING IN OFFICIAL STATISTI CS AND DATA TRANSPARENCY IN THE MIDDLE EAST AND NORTH AFRICA MIDDLE EAST AND NORTH AFRICA REGION | ECONOMIC UPDATE OCTOBER 2022
There are many different types of sample surveys. For instance, on its website, the Central Bureau of Statistics of the Netherlands lists 32 surveys that it administers to individuals and 75 to firms.2 These range from supplier price surveys and perception surveys, which many statistical offices administers, to highly context-specific surveys, undoubtedly developed in response to requests by decision makers on, for example, availability of electric chargers for trucks or on union membership. Leaving such demand-driven surveys aside, at a minimum, one finds that statistical systems around the globe field surveys covering issues of labor (labor force surveys), which are indispensable for monitoring employment, developing labor market policies, and formulating social policies regarding unemployed people; health and demographic surveys; income and expenditure surveys, to measure poverty, assess the effectiveness of the social protection system, and simulate revenue and redistributive implications of fiscal proposals and enterprise surveys.
Table 2. Availability of consumption, labor force, health, and enterprise surveys since 2015 according to national statistical office websites
Consumption survey Labor force survey Health survey Establishment survey
Algeria 0 0 0 0
Bahrain 1 0 1 0
Djibouti 1 0 0 0
Egypt 1 1 0 0
Iran 1 1 0 0
Iraq 1 0 1 0
Jordan 1 1 1 0
Kuwait 1 1 0 1 Lebanon 0 1 0 0 Libya 0 0 0 0
Malta 1 1 0 1 Morocco 0 1 0 0 Oman 0 0 0 1 Qatar 0 1 0 0
Saudi Arabia 1 1 1 1 Syria 0 0 0 0
Tunisia 1 1 1 0
United Arab Emirates 1 0 0 0 West Bank and Gaza 1 1 1 1 Yemen 0 0 0 0 12 11 6 5
Source: Adapted from Ekhator-Mobayode and Hoogeveen 2021.
Ekhator-Mobayode and Hoogeveen (2021) report recent consumption surveys in 12 of 20 countries in the Middle East and North Africa. Labor force surveys are more popular, with half (11) of the countries in the region having administered one in the past 5 years. Six of 20 countries in the region fielded a Demographic and Health Survey or Multiple Indicator Cluster Survey in the past 5 years. Establishment surveys are even less frequent, with only five NSOs reporting having completed one in the past 5 years.
2 https://www.cbs.nl/nl-nl/deelnemers-enquetes/deelnemers-enquetes/personen and https://www.cbs.nl/nl-nl/deelnemers-enquetes/deelnemers-enquetes/bedrijven accessed April 8, 2022.
79CHAPTER 3: THE EVOLVING CASE FOR INVESTING IN OFFICIAL STATISTI CS AND DATA TRANSPARENCY IN THE MIDDLE EAST AND NORTH AFRICA A NEW STATE OF MIND: GREATER TRANSPARENCY AND ACCOUNTABILITY IN THE MIDDLE EAST AND NORTH AFRICA PART II: THE LEARNING STATE
Because of the low frequency of surveys, two-thirds of the Middle East and North Africa’s population are covered by a recent consumption survey, about 56 percent by a recent labor force survey, one-third by a recent demographic and health survey, and less than 10 percent by a recent establishment survey.
4. Public availability of microdata in the Middle East and North Africa
It is one thing to collect microdata, it is another to make the data, once collected, available to the public. Whether to publicly release microdata requires resolving an apparent conflict between the 10 Fundamental Principle of Official Statistics to which every statistician adheres and that emphasize data accessibility, impartiality, transparency, accuracy, relevance, cost-effectiveness, confidentiality, professionalism, coordination, and cooperation. The principles of accessibility, impartiality, transparency, and cost-effectiveness support public release of microdata. Moreover, once data are made available, public feedback enhances its relevance and accuracy. Still, public release seems to conflict with the principle of the confidentiality of data, which prevents direct or indirect disclosure of data on persons, households, businesses, and other individual respondents. To overcome this conflict, good practices guide statisticians. With respect to public release of microdata, statisticians follow “a framework describing methods and procedures to provide sets of anonymous microdata for further analysis by bona fide researchers, maintaining the requirements of confidentiality.”3
This framework tends to be operationalized in one of two ways. Some agencies make anonymized microdata directly available to the public. Sources of downloadable microdata sets include the World Bank microdata library; the Demographic and Health Survey and Multiple Indicator Cluster Survey websites; the labor force surveys curated by the International Labor Organization; and the Integrated Public Use Microdata Series, which publishes (samples of) population censuses. Others, such as Eurostat, make microdata available in two formats: public and scientific use. Public use files (PUFs) can be downloaded immediately. They are subsamples of scientific use files (SUFs), which allow researchers to explore data sets and build their code. PUFs cannot be used for publications, for which SUF files are needed. SUFs are made available but require a stricter two-step application process in which a researcher’s organization must be recognized as a research entity (e.g., university, research institution or research department in a public administration, bank, statistical institute), after which the researcher can submit an application to receive the full microdata set.
Having established that statistical principles support public release of microdata, how does the Middle East and North Africa fare? To explore this, Ekhator-Mobayode and Hoogeveen (2021) examined the accessibility of the microdata sets that NSO websites indicated that they had (reported in Tables 1 and 2). When the research is limited to data accessible on NSO websites, of 55 microdata sets (21 censuses, 34 surveys), 11 are publicly accessible, and another nine can be accessed through international repositories that the World Bank, International Household Survey Network, Integrated Public Use Microdata Series, and Eurostat maintain or from the Demographic and Health Survey and Multiple Indicator Cluster Survey websites (Figure 5). Only five of the data sets that can be accessed through NSO websites can be downloaded immediately: the 2018–19 Lebanon Labor Force and Household Conditions Survey; the 2014 Morocco National Survey on Household Consumption and Expenditures; the 2015 Tunisia national survey on budget, consumption, and household living standards; the 2017 Tunisia National Population and Employment Survey; and a subset of the 2014 population census microdata for Morocco. All others require prior registration.
3 Principles Governing International Statistical Activities, accessed May 2, 2022, https://unstats.un.org/unsd/methods/statorg/Principles_stat_activities/principles_stat_activities.asp 80 CHAPTER 3: THE EVOLVING CASE FOR INVESTING IN OFFICIAL STATISTI CS AND DATA TRANSPARENCY IN THE MIDDLE EAST AND NORTH AFRICA MIDDLE EAST AND NORTH AFRICA REGION | ECONOMIC UPDATE OCTOBER 2022
Iraq Jordan Kuwait Lebanon
Morocco Oman Qatar Saudi Arabia
Tunisia United Arab Emirates West Bank and
Yemen
5. Discussion: Governance, statistics, and data transparency
This chapter has established that capable governments require up-to-date, good-quality statistics to inform decision making and that statistical capacity in the Middle East and North Africa is below what is expected given the complexities of the economies in the region (Islam (2022) made similar observations.) Some of the most essential source data (censuses and surveys) are not collected or are out of date, raising questions about the accuracy of important statistical aggregates, including estimates of total population, unemployment, national income, inflation, and economic growth. How the quality of statistics is associated with the state of the social contract has also been discussed, and the conclusion was drawn that the social contract is under strain in the Middle East and North Africa, an interpretation that the limited data transparency found when assessing the websites of statistical agencies reinforces.
What explains the current states of affairs, why is the production of official statistics lacking, and why are so few of the data sets that are produced disseminated publicly? There are various possible explanations. Resource-constrained governments may lack the means to invest in statistics. Trained statisticians may be hard to find and employ. Although plausible as explanations, it seems unlikely that countries in the region cannot afford or lack the human capital to produce up-to-date statistics. The investments needed are a tiny fraction of overall public spending, and regions at
Figure 5. Public accessibility of microdata sets Countries/data category Establishment survey Consumption survey Labor force survey Health survey Population census Economic census Algeria Bahrain Djibouti Egypt Iran
Libya Malta
Syria
Gaza
Total surveys with microdata publicly accessible (indicated accessible on NSO website)/microdata collected 1 (1)/5 7 (4)/12 4 (3)/11 3 (0)/6 3 (1)/14 2 (2)/9 J Microdata not collected J Microdata collected but not publicly shared J Microdata collected and publicly shared Source: Adapted from Ekhator-Mobayode and Hoogeveen, 2021. Note: Total surveys and censuses with some degree of microdata accessibility on national statistical office (NSO), World Bank, International Household Survey Network, Integrated Public Use Microdata Series, Eurostat, Demographic and Health Survey, and Multiple Indicator Cluster Survey websites.
81CHAPTER 3: THE EVOLVING CASE FOR INVESTING IN OFFICIAL STATISTI CS AND DATA TRANSPARENCY IN THE MIDDLE EAST AND NORTH AFRICA A NEW STATE OF MIND: GREATER TRANSPARENCY AND ACCOUNTABILITY IN THE MIDDLE EAST AND NORTH AFRICA PART II: THE LEARNING STATE
similar levels of development (South Asia, East Asia and the Pacific, Latin America and the Caribbean) do better (Stacey and Dang 2021; Islam 2022). Governments that can afford to subsidize energy consumption can certainly afford the data collection efforts needed to keep statistics up to date. Capacity to produce statistics is unlikely to be a constraint either; the region has ample trained statisticians. If there were capacity gaps, they could easily be filled out of the pool of qualified international consultants that has emerged since National Statistical Strategies and the Millennium Development Goals put the strengthening of statistics at the core of the development agenda.
Another explanation for the poor performance of the Middle East and North Africa’s statistical systems might be lack of appreciation for evidence-based decision making, which may be rooted in the strained social contract identified earlier. The Middle East and North Africa’s social contract is stunted in that it is rooted in an insider-outsider economy in which few people have good formal public or private sector jobs, and the majority aspires to such jobs but finds themselves at the fringes of the labor market. These are economies characterized by bloated public sectors (including state-owned enterprises), low female labor force participation, and high levels of youth unemployment and informality. Growth is constrained because competitiveness is low. (One privilege of being an insider is being shielded from competition.) Life satisfaction is low and diverging increasingly from the global average (Figure 6). Popular dissatisfaction is managed through a combination of state largesse in the form of subsidies for housing, food, and fuel; transfer schemes; and (the possibility of landing an attractive) public sector jobs, yet the actual degree of dissatisfaction is hard to gauge because states limit space for public dialogue and expression. Electoral (70 percent of the population) and closed (30 percent of the population) autocracies govern Middle Eastern and North African countries (Boese et al. 2022) and the people cannot generally express themselves freely, but why would people in leadership positions around the world consider statistics essential and the Middle East and North Africa’s autocrats not? Like others, they need data to inform their decisions and to monitor the impact of their activities. Moreover, if there is little interest in official statistics, why bother with their production at all?
A third reason might be that leaders are concerned that statistics, once released, might be used to criticize the leadership or organize dissent. Leaders, particularly autocratic ones, might be willing to trade their ability to use evidence in decision making for the reduction in risk associated with public release of statistics. If this explanation holds, there
Figure 6. Life satisfaction in the Middle East and North Africa and the World Figure 7. Statistical Performance Index and the Diagonal Accountability Index, 2019 Statistical Performance Index 2010 2011 2012 2013 2014 2015 2016 2017 2018 2019 2021 5.8 5.6 5.4 5.2 5.0 4.8 4.6 4.4 4.2 4.0 2020 5.50 5.42 5.44 5.39 5.39 5.40 5.40 5.46 5.50 5.55 5.51 5.53 5.40 5.36 5.18 5.28 5.35 5.30 5.36 5.10 5.11 5.09 4.61 4.57 100 90 80 70 60 50 40 30 20 10 0 -2.0 -1.5 -1.0 -0.5 0 0.5 1.0 1.5 2.0 2.5 Syria China Saudi Arabia UAE Qatar Oman Egypt Yemen Iran Vietnam Singapore Algeria Morocco Jordan Iraq Libya Lebanon Tunisia Germany Jamaica Norway Denmark V-Dem Diagonal Accountability Index ▬ MENA ▬ World Source: Helliwel et al. 2022. Note: On a scale from 1 to 10, with 10 being highest. Source: World Bank 2022; Boese et al. 2022. 82 CHAPTER 3: THE EVOLVING CASE FOR INVESTING IN OFFICIAL STATISTI CS AND DATA TRANSPARENCY IN THE MIDDLE EAST AND NORTH AFRICA MIDDLE EAST AND NORTH AFRICA REGION | ECONOMIC UPDATE OCTOBER 2022
might be an interest in atrophying the production of statistics, like there might be interest in limiting press freedom, conducting online surveillance, or blocking content or conducting other forms of censorship. If this is correct, one would expect statistical performance and public accountability to be correlated, and as Figure 7 shows, the Statistical Performance Index is positively correlated with the Diagonal Accountability Index, an index that V-Dem compiles that assesses oversight by civil society organizations and media activity.
Why would countries sacrifice the production and relevance of their official statistics when it is possible to produce them for internal use only but not release data or be transparent? Some countries appear to be following just this strategy. Selected countries who lie above the regression line in Figure 7 produce official statistics primarily for use by public authorities. Statistics may be selectively released to the public, but data transparency is not embraced wholeheartedly despite the limitations that lack of data transparency has in the form of, for example, foregone research by academics, unavailability of statistics for the private sector, lack of incentive for students to learn to work with microdata relevant for decision making, absence of feedback needed to enhance the quality and relevance of statistics. From a public decision-making perspective, statistics production without data transparency is better than production of no, low-quality, or outdated statistics, yet the cost of not releasing statistics can be substantial. Moreover, it is difficult to produce independent, high-quality statistics consistently in an environment in which there may be incentives to produce certain results in the absence of public scrutiny. Plekhanov 2017 illustrates what is likely to happen when transparency is limited, targets are clearly communicated, and bureaucrats have strong incentives to achieve them.
With the digital revolution, the trade-offs associated with limiting production of official statistics, producing official statistics but not releasing them, and being fully data transparent have shifted because of two different developments; the downside risk associated with releasing statistics, particularly in authoritarian regimes, has declined while the cost of not producing relevant official statistics has risen.
Over the past two decades, authoritarian governments have moved away from brute force to more subtle forms of repression (Guriev and Treisman 2022). To avoid dissent, governments focus more on propaganda methods such as spin, disinformation, and keeping their populations in fear than on overtly brutal forms of repression. Pro regime media and think tanks are lavishly favored and funded and receive wide media coverage. By tolerating some independent voices, authoritarian governments can claim to support a free press and free public discourse while the power of the state (tax demands, media outlets being controlled by trusted affiliates, court cases, new powers granted by advancing technology) ensures that critical voices are barely audible. This approach has been so successful that, according to Guriev and Treisman (2022), most of today’s autocrats follow the spin playbook.
In an environment in which public officials are able largely to control public discourse, production and release of statistics is no longer risky. Statistics attract a selective audience, outside the mainstream, that can, if necessary, be controlled. Such is unlikely to be needed, though because researchers will self-censor, and offer constructive criticism as outlets for controversial messaging are few, yet by producing and releasing up-to-date statistics, politicians have an argument to underpin the claim that they support good governance and data transparency, and constructive feedback will strengthen reforms and adjustments and ultimately help underpin the legitimacy of the regime. In this way, the political and economic use value of statistics is maximized (in public and private decision making). Meanwhile, feedback from data users ensures that statistics that are produced are relevant and of high quality. In the Middle East and North Africa, Iran and West Bank and Gaza already appear to embrace this approach.
83CHAPTER 3: THE EVOLVING CASE FOR INVESTING IN OFFICIAL STATISTI CS AND DATA TRANSPARENCY IN THE MIDDLE EAST AND NORTH AFRICA A NEW STATE OF MIND: GREATER TRANSPARENCY AND ACCOUNTABILITY IN THE MIDDLE EAST AND NORTH AFRICA PART II: THE LEARNING STATE
There is an associated argument for why to invest in official statistics. Before the digital revolution, data alternatives were limited, and unless statistical agencies produced and released information, few others had the means or ability to do so. If certain types of information were not produced, the public had no means of knowing about them. With the digital revolution, this is no longer the case. The cost of data collection has dropped to a point where almost anyone can run an Internet survey. Physical access is no longer needed because phone surveys can be implemented from anywhere. Big data are widely available and offer unexpected insights. As a consequence, controlling the narrative by not producing data is no longer an option, although as data sources multiply, there is a premium on trusted, unbiased, nonpartisan data. Official statistics, when produced and released, have become as valuable as ever.
6. Conclusion
In the Middle East and North Africa, appreciation for official statistics by decision makers is limited. At least this is the conclusion one is bound to draw when inspecting the limited production and release of microdata sets that are at the core of any statistical system, as well as statistical performance index scores, which are less than one would expect for the level of income and economic complexity.
There are significant economic and social costs associated with underproduction of reliable, relevant, up-to-date statistics, so it is puzzling that countries with the financial means and capacity to produce them do not do so. In this chapter, it has been hypothesized that, for certain autocratic regimes, the decision to let official statistics wither might be made to avoid public dissent. Not producing statistical information hampers decision making but also limits the ability of citizens to rally against the regime.
To the extent that this is correct, the calculation in favor of not producing and releasing official statistics has changed over the past two decades. Various regimes have become increasingly adept at controlling the media and with it the messages that are presented for public discourse (see Guriev and Treisman, 2022). In a parallel development, production of statistics has democratized. In combination, this suggests that production of official statistics is less risky from a public relations perspective and more desirable as economies have become more complex and the demand for trusted, unbiased statistics greater. In the Middle East and North Africa, this warrants reconsideration of the use of official statistics and justifies investments that bring statistical systems to the desired level of performance.
References
Acemoglu, D., and Robinson, J. A. (2019). The Narrow Corridor: states, societies, and the fate of liberty. Penguin Random House, New York, NY.
Afonso, A., Schuknecht, L., and Tanzi, V. (2020). “The Size of Government.” REM Working Paper No 2020/0129, Research in Economics and Mathematics, Lisboa.
Binswanger, J., and Oechslin, M. (2015). “Disagreement and learning about reforms.” Economic Journal, 125(584), pp. 853–886.
Boese, V. A., Alizada, N., Lundstedt, M., Morrison, K., Natsika, N., Sato, Y., Tai, H., and Lindberg, S. I. (2022). Autocratization Changing Nature? Democracy Report 2022. Varieties of Democracy Institute (V-Dem).
84 CHAPTER 3: THE EVOLVING CASE FOR INVESTING IN OFFICIAL STATISTI CS AND DATA TRANSPARENCY IN THE MIDDLE EAST AND NORTH AFRICA MIDDLE EAST AND NORTH AFRICA REGION | ECONOMIC UPDATE OCTOBER 2022
Ekhator-Mobayode, U. E., and Hoogeveen, J. (2021). “Microdata Collection and Openness in the Middle East and North Africa: Introducing the MENA Microdata Access Indicator.” World Bank Policy Research Paper No. 9892. World Bank, Washington, DC.
Gatti, Roberta, Daniel Lederman, Rachel Yuting Fan, Arian Hatefi, Ha Nguyen, Anja Sautmann, Joseph Martin Sax, and Christina A. Wood. (2021). Overconfident: How Economic and Health Fault Lines Left the Middle East and North Africa Ill-Prepared to Face COVID-19. MENA Economic Update. Washington, DC: World Bank. October.
Guriev, S., and Treisman, T. (2022). Spin Dictators: The Changing Face of Tyranny in the 21st Century. Princeton University Press.
Helliwell, J. F., Layard, R., Sachs, J. D., De Neve, J.-E., Aknin, L. B., and Wang, S. (Eds.). (2022). World Happiness Report 2022. Sustainable Development Solutions Network, New York.
Hoogeveen, J. (2018). “A social contract indicator for sub-Sahara Africa.” Mimeo. Islam, A. M. (2022). “Data Transparency in the Middle East and North Africa.” Mimeo. Islam, A. M. and Lederman, D. (2020). “Data Transparency and Long-Run Growth.” Policy Research Working Paper No. 9493. World Bank, Washington, DC.
Manski, C.F. (2015). “Communicating uncertainty in official economic statistics: An appraisal fifty years after morgenstern.” Journal of Economic Literature, 53(3), pp. 631–653. Observatory of Economic Complexity. (2022). Economic Complexity Index https://oec.world/ OECD (Organization for Economic Cooperation and Development). (2008). Concepts and Dilemmas of State-building in Fragile Situations: From Fragility to Resilience. OECD, Paris. Plekhanov, D. (2017). “Quality of China's Official Statistics: A Brief Review of Academic Perspectives.” The Copenhagen Journal of Asian Studies, 35(1), pp. 76-101. Rodrik, D. (2010). “Diagnostics before prescription.” Journal of Economic Perspectives, 24(3), pp. 33–44. Stacy, B., and Dang, H. (2021). The Statistical Performance Indicators: A Fresh Way to Gauge a Nation’s Statistical Performance. WDI Story accessed May 6th, 2022. https://datatopics.worldbank.org/world-developmentindicators/stories/statistical-performance-indicators.html.
US Census Bureau. (2022). Purposes and Uses of Economic Census Data, access April 18th, 2022. https://www.census. gov/programs-surveys/economic-census/guidance/data-uses.html.
World Bank. (2022). Statistical Performance Indicator.
85CHAPTER 3: THE EVOLVING CASE FOR INVESTING IN OFFICIAL STATISTI CS AND DATA TRANSPARENCY IN THE MIDDLE EAST AND NORTH AFRICA A NEW STATE OF MIND: GREATER TRANSPARENCY AND ACCOUNTABILITY IN THE MIDDLE EAST AND NORTH AFRICA PART II: THE LEARNING STATE
Annex 3A. Statistical Capacity Indices
Table
2005 2006 2007 2008 2009 2010 2011 2012 2013 2014 2015 2016 2017 2018 2019 2020
Algeria 54 63 63 60 59 58 59 62 59 51 52 53 56 61 50 52 50
Djibouti 50 50 52 43 40 40 44 44 47 47 46 47 53 54 54 59 58
Egypt 78 88 91 88 87 88 86 89 87 90 90 91 88 83 87 86 82
Iraq 32 40 40 46 51 41 41 47 50 50 47 52 50 52 38 34 37
Iran 64 72 73 80 80 81 71 69 70 70 73 73 79 76 80 79 76
Jordan 69 71 71 71 73 74 77 74 76 74 74 74 71 76 79 82 78
Lebanon 42 49 49 49 54 54 57 63 67 67 62 66 63 67 51 44 44
Libya 29 42 39 41 41 39 41 36 37 28 29 22 22 22 34 28 26
Morocco 80 79 82 82 80 82 78 76 72 79 79 81 84 77 73 67 67
West Bank and Gaza 40 42 68 74 83 82 80 70 80 73 77 78
Syria 58 61 61 57 62 54 57 60 52 43 44 48 38 32 30 27 22
Tunisia 72 78 77 77 74 77 79 78 74 73 72 77 77 62 60 71 59
Yemen 57 57 62 66 64 56 49 48 47 52 56 56 48 44 42 39 28
Source: World Development Indicators, accessed April 22, 2022. https://data.worldbank.org/indicator/IQ.SCI.OVRL
3A.1. Statistical capacity index 2004–2020 2004
86 CHAPTER 3: THE EVOLVING CASE FOR INVESTING IN OFFICIAL STATISTI CS AND DATA TRANSPARENCY IN THE MIDDLE EAST AND NORTH AFRICA MIDDLE EAST AND NORTH AFRICA REGION | ECONOMIC UPDATE OCTOBER 2022
Chapter 4: Building for Peace: Reconstruction for Security, Sustainable Peace, and Equity in the Middle East and North Africa
by Francesca Recanatini, Ellen Hamilton, Mahi Elattar, Sergio de Cosmo, Joseph Saba and Katrin Heger
Nine years after the Arab Spring, people in Iraq, Libya, Syria, and Yemen face tragic levels of death, destruction, displacement, and disorder. The breakdown of state governance coupled with the economic and social losses inflicted by conflict in these four countries have had a major impact on regional and international security, humanitarian, social, and economic affairs. From 2013 to 2017, the Middle East and North Africa (MENA) region alone accounted for 68 percent of global battle-related deaths. Yemen is facing the world’s largest humanitarian crisis, with close to 80 percent of the population in need. In Syria, the cumulative losses in gross domestic product have been estimated at $226 billion through 2017, about four times the Syrian GDP in 2010. The majority of the more than 5.6 million people who have left Syria since 2011 sought refuge in Jordan, Lebanon, and Turkey, where the disproportionate influx of people has had significant negative fiscal impacts, widened the service provision deficit, and strained the socioeconomic fabric of each country. The absence of the state in conflict areas has opened space for nonstate actors, including extremists, terrorists, and armed groups, competing for power and resources. The four conflicts have also drawn in various international and regional powers competing either directly or through proxies and spinning a complex web of intersecting conflicts that threaten regional stability.
These unprecedented levels of conflict and violence pose new challenges to practitioners and policymakers. In light of armed conflict, the systems that promised order—state structures, institutions, economic networks, and social fabrics— are fragile, fragmented, and stressed. State authorities struggle to provide even the minimum level of security to engender the trust and stability to end conflict or build sustainable peace. Where violence and displacement continue, people fearing anarchy and distress have sought security and basic services in informal networks with ever-shifting dynamics. New elite configurations—war lords, often armed, with strong and tangled vested interests in the conflictdriven informality—compete for power and resources nationally and locally. Competition among international and regional states only adds to the pressure. Urban areas have come under particular stress as targets of violence in a highly urbanized region—and locations of refuge for the millions of displaced.
The conflicts in Iraq, Libya, Syria, and Yemen in many ways epitomize a type of conflict that has been evolving since the end of the Second World War. These conflicts have become increasingly fluid in their unpredictable evolution—often localized in parts of a country, while creating regional and international spillovers. They have fractured relationships within and between communities, undermining social cohesion, and have drawn in multiple regional and global actors with different interests. They have also reconfigured the political economy in war-torn societies and their neighboring countries, with illicit and informal undertakings and economic activities flourishing domestically and regionally, prompting not just a change in the workforce but also feeding into the establishment of war economies. Last, they are protracted with no clear end and continuing cycles of violence, thus leading to ever more fragile situations
State
1. Introduction 1
(Figure 1). 1 Reprint from the Executive Summary of the Report “Building for Peace: Reconstruction for Security, Equity, and Sustainable Peace in MENA” (World Bank 2020). Figure 1. Fragile
Index for Iraq, Libya, Syria, and Yemen, 2006–19 Total country score 120 100 80 60 40 20 0 2006 2007 2008 2009 2010 2011 2012 2013 2014 2015 2016 2017 2018 2019 2020 Worsening Improving ▬ Iraq ▬ Libya ▬ Yemen ▬ Syria Source: Fragilestateindex.org Note: An increase in a country’s Fragile State Index means the situation is worsening. 88 C HAPTER 4: B UILDING FOR P EACE : R ECONSTRUCTION FOR S ECURITY , S USTAINABLE P EACE , AND E QUITY IN MENA MIDDLE EAST AND NORTH AFRICA REGION | ECONOMIC UPDATE OCTOBER 2022
Spawning insecurity, mass displacement, and disorder—these conflicts are testing the limits of reconstruction and peacebuilding approaches centered on state-building. Over the past 30 years, reconstruction and peacebuilding efforts have tended to follow state-building models, with a consolidated state centrally administering resource mobilization and allocation. The protracted conflicts in MENA, characterized by prolonged fragility, call this central state-building approach into question. In the four conflict countries, a presumed social consensus favoring a central state may have no basis, given an absence of trust that such a state would be accountable and inclusive. In fact, the 2011 uprisings across the Arab region were in many ways a protest against the existing social contracts and a symptom of growing fractures among different social groups (Figure 1). The eroding legitimacy of reform and the ruling elites in MENA countries fueled the outbreak of civil wars, since the long--established power distribution excluded a large part of the population from economic opportunity and political participation. Moreover, the persistence of informal armed networks only reinforces the centrifugal forces opposing a strong central state apparatus and facilitating civil and intrastate conflict. Given the regional and international dimensions of these conflicts, approaches failing to engage beyond the territory of individual states will struggle to contribute to sustainable peace.
The Building for Peace report (World Bank, 2020) aims at strengthening the existing approach to sustainable peace by applying global knowledge in conflict prevention and reconstruction to the specific challenges and opportunities of reconstruction and recovery. Transitioning toward sustainable peace is a prolonged journey to remove violence and insecurity and to build social cohesion, equitable economic opportunities, and accountable institutions for all individuals. The report is grounded on the new FCV (Fragility, Conflict, and Violence) strategy for the World Bank and on past analytical and operational experiences. It combines recent development thinking with original research to propose a multidisciplinary approach to reconstruction and the transition to sustainable peace for conflict countries in the MENA region and globally.
The approach emerging from the report calls for first recognizing the multidimensional and idiosyncratic characteristics of each conflict context. It calls for new criteria and calculations for risk and results, for substantial tolerance for compromise and potential failure, and for necessary or expedient tradeoffs. The approach begins with an overarching focus on the people most affected and most vulnerable. It seeks to understand how to build their sense of security and trust, and how to create time and space for building inclusive institutions. It aims to shed light on the need to address grievances and conflict drivers, creating zones of accountability to replace informal, fluid zones of impunity, and to limit opportunities for spoilers while supporting the drivers of resilience. Grounded on an understanding of the structure and incentives of the actors affected and involved in reconstruction, the approach aspires to become specific in time and place—about the where, what, who, and how.
The report recognizes the difficulties of moving from abstract aspirational prescriptions to active engagement in very difficult and fluid environments. It is not an evaluation of all existing tools for peacebuilding and reconstruction but an inquiry into whether those tools are used to full advantage. To this end, the first step suggested is a more comprehensive and dynamic assessment process to planning interventions. The process emphasizes the use of existing tools and any modifications necessary to gain greater understanding of all actors, institutions, and structural factors on the ground. This understanding is critical because local reactions to ill-conceived interventions could prove counterproductive and undermine future peacebuilding. Further, the infusion of resources into a fluid, fractured, and informal environment could reinforce past power structures or informal and illicit networks, providing them resources to undermine the transition toward sustainable peace.
89C HAPTER 4: B UILDING FOR P EACE : R ECONSTRUCTION FOR S ECURITY , S USTAINABLE P EACE , AND E QUITY IN MENA A NEW STATE OF MIND: GREATER TRANSPARENCY AND ACCOUNTABILITY IN THE MIDDLE EAST AND NORTH AFRICA PART II: THE LEARNING STATE
The report proposes an approach that forges partnerships to identify entry points and builds, incrementally, on the assets present. It calls for greater flexibility in engaging counterparts and key stakeholders, which in turn depends on effective partnerships and convening powers, and much broader outreach to a wide range of stakeholders and informants. In a global environment fatigued by wars and displacement, traditional financing models continue to have their place. But today’s fluid, fractured, and informal contexts call for innovative resource mobilization and deployment with more calculated risk management. Meeting the new challenges of conflict and violence requires an integrated and comprehensive assessment of existing assets and opportunities, strategies focused on the people most affected, new technologies and innovations, more effective partnerships between different actors, and informed interventions driven by international commitment and backed by predictable resources.
2. Conflict traps and lessons from peacebuilding in MENA
Violence in MENA has erupted as a result of an accumulation of many unaddressed grievances. As the transitions to either peace or violence are gradual processes—rather than one-time breaking points—the persistence of underlying grievances such as exclusion of some segments of the population, injustice, or inequality and people’s strategies for coping with instability pushes a country to move into and out of violence. These cycles of violence sustain “conflict traps” that cannot be escaped until these underlying dynamics are addressed. In MENA, the most recent violence expresses the explosion of unaddressed grievances that have been accumulating for decades, leading to the protracted and often localized conflicts in the aftermath of the Arab Spring.
The track record of previous reconstruction and peacebuilding efforts shows that they have rarely managed to permanently break conflict traps, particularly in MENA. Breaking the cycle of violence can be achieved only if policymakers avoid rebuilding the institutions, networks, and dynamics responsible for and benefiting from the conflict, and instead focus on the key drivers and enablers of sustainable peace. The traditional reconstruction approach—applied after the clear ending of a conflict and focused primarily on a clear and stable central government as the key counterpart for implementing a top-down approach to reconstruction—cannot ensure sustainable peace in today’s conflict situations. Complementing top-down approaches with local and community-based bottom- up approaches will enhance the likelihood of achieving peace in the long term. While it may lead to a temporary stabilization, it does not address fully or effectively the conflict’s dynamics, causes, and consequences, which is crucial in building sustainable peace.
The example of Iraq illustrates the mismatch between a country’s needs as it seeks to transition out of conflict and the priorities identified by the international and local actors. Nearly US$ 60 billion was spent on reconstruction after 2003, according to the Special Inspector General for Iraq Reconstruction’s final report in 2013, mostly targeting the oil sector, which employed 1–2 percent of Iraq’s labor force, thus failing to diversify the Iraqi economy and create jobs outside the large public sector. Yet, in an anonymous online survey of 3,000 random internet users in Iraq
Figure 2. Listening to voices of people in Iraq, Libya, and Yemen
Trust
segments of society
government
in
between arties involvedp Inclusion of all
Efficient, accountable
Job opportunities Initiatives to develop communities Sense of vision Women’s group involvement Youth involvement 01015202530 5 Percentage of responses J Iraq J Libya J Yemen Source: RIWI online survey. Iraq, March 2019; Libya and Yemen, June–July 2019. 90 C HAPTER 4: B UILDING FOR P EACE : R ECONSTRUCTION FOR S ECURITY , S USTAINABLE P EACE , AND E QUITY IN MENA MIDDLE EAST AND NORTH AFRICA REGION | ECONOMIC UPDATE OCTOBER 2022
March 2019, 25 percent of the respondents cited “job opportunities” as the main issue lacking in previous peacebuilding work that could have guaranteed a better transition toward peace (Figure 2). In retrospect, this mismatch between local needs and the focus of the reconstruction programs seems to have left the drivers of conflict and fragility unaddressed for more than a decade.
The main motivation for the Building for Peace report is therefore to ask how to begin to meet these complex challenges and support countries in their transition toward sustainable peace. What can we learn from the past, for use in the present, that will improve outcomes in the future for all citizens? This question is of particular relevance to development actors such as the World Bank, which have been engaging with increasing frequency in conflict settings in roles complementary to the main humanitarian actors. This question also cuts to the core of the objectives of the development actors in their mandates to improve people’s lives as each new conflict further erodes past development gains.
By focusing on sustainable peace as the final objective, the report speaks to humanitarian and development practitioners and policymakers and nests at the Humanitarian-Development-Peace nexus. Sustainable peace is a more encompassing concept than stability or development: It ensures physical, economic, and social security in the long run for all individuals and communities; rebuilds the social fabric and human capital destroyed by war addressing past and existing grievances; creates economic opportunities for all, while establishing inclusive and accountable institutions; and encompasses all actors—local, national, and international, both formal and informal, looking beyond national borders. In situations of protracted conflicts, there is a need to bridge short-term imperatives with long-term goals, requiring humanitarian, security, and development actors to work together as they seek to support transitions to sustainable peace. To do so, the report adopted a multisector and multidisciplinary methodology that combines insights and advances from numerous academic fields.
The World Bank’s efforts to improve outcomes in situations of Fragility Violence, and Conflict (FCV) over the past decade has culminated in the new strategy for engagement in these situations. Not only are past development gains eroded by conflict, sustainable development is not possible unless built on a foundation of sustainable peace. Going beyond the MENA region, it is estimated that around half the world’s extreme poor will be living in fragile and conflict-affected situations by 2030. To better position itself to tackle this challenge, the new FCV strategy articulates a framework for World Bank interventions in FCV situations. The report is anchored on the strategy and—more specifically—on two areas of engagement: remaining engaged during crisis situations and escaping the fragility trap. Applying this framework to the MENA context, it uses the cases of Iraq, Libya, Syria, and Yemen to develop an approach to World Bank engagement in situations of violent crisis and fragility.
3. The building for peace integrated approach: Linking past, present and future
In supporting transitions to sustainable peace, the report puts forward a dynamic and integrated approach linking the past, present, and future and actors’ incentives over time. Understanding the past and current political, social, and economic dynamics at the local, national, and regional level is the starting point to inform any intervention seeking to promote sustainable peace. Making sense of the past is crucial to tackling long-lasting grievances, while understanding the present allows for the identification of entry points. This approach goes beyond the past and the present by also taking into account individuals and their incentives in the future. It factors in how the design of policies today may affect the future shape of institutions and society, which is key for ensuring sustainability. Along this time continuum,
91C HAPTER 4: B UILDING FOR P EACE : R ECONSTRUCTION FOR S ECURITY , S USTAINABLE P EACE , AND E QUITY IN MENA A NEW STATE OF MIND: GREATER TRANSPARENCY AND ACCOUNTABILITY IN THE MIDDLE EAST AND NORTH AFRICA PART II: THE LEARNING STATE
it explicitly takes into consideration the different actors involved in and affected by the conflict on all levels, the way their incentives change over time, and how these changes affect the transition toward sustainable peace (Figure 3). The approach seeks to:

• Understand the past. The past allocations of power and resources among actors, past dynamics, and economic interests that may have contributed to conflict, institutional distortions, and unaddressed grievances.
• Make sense of the present. The power and incentives of existing actors, the existing allocation of resources, and the political and economic interests revolving around war. This requires assessing existing assets, including not only physical assets but also institutional, human, and social capital, in order to build on them—and to see them as starting points, not gaps.
• Map the future. Developing a shared long-term vision that maps out alternative policy options and specifies how these policy options today could affect actors’ incentives, power, resource distribution, and institutions in the future. This requires identifying the spoilers and enablers of sustainable peace, their political and economic incentives, and their values, norms, and commitments.
Understanding past, present, and future actors and their incentives offers an effective way to avoid rebuilding the past structures and to create stronger incentives for peace. To manage fluidity, heal fractures, and address informality, interventions should focus on three main entry points: (1) building legitimate and inclusive institutions at all levels,
Figure 3. Focusing on people and their changing incentives in space and time
92 C HAPTER 4: B UILDING FOR P EACE : R ECONSTRUCTION FOR S ECURITY , S USTAINABLE P EACE , AND E QUITY IN MENA MIDDLE EAST AND NORTH AFRICA REGION | ECONOMIC UPDATE OCTOBER 2022
(2) creating sustainable economic opportunities for all, and (3) building on resilient assets while addressing damages. The prewar and wartime arrangements that allowed predatory access to resources and rents to a small group of actors should shift toward an inclusive and open system that allows for the creation of more equitable economic and social opportunities. An integrated long-term vision and a flexible approach must be accompanied by efforts to restore or preserve functioning social and economic activities and spaces for formal exchange among all individuals. This has to be done in ways that support security and livelihoods for all and promote inclusive prosperity rather than exclusion, informality, and private rent-seeking.
Understanding the patterns of continuity and change in institutional structures in the wake of conflict, and those that can emerge from the peace process is crucial. Violent conflicts are likely to accentuate or alter the power balances between the different actors and especially the formal and informal institutional arrangements in place before the onset. As the MENA conflicts continue, a pattern of persistence and change coexist: most civil war contexts witness varying degrees of persistence of pre-conflict institutional features, even as other elements change radically to give rise to alternative social orders with new contenders for power. There are powerful echoes of this in the Middle East, where in Yemen and to some extent in Libya the current institutional realities represent both a capture and a reinforcement of the past institutional arrangements.
Interventions supporting sustainable economic opportunities should focus both on the actors benefiting from peace and on those losing from it. Creating economic opportunities in a fluid, fractured, and informal situation may require redistributing existing resources and adding more resources, inevitably leading to “winners and losers.” To avoid undermining the path toward sustainable peace at the hands of the potential “losers,” the interventions should provide incentives or alternative opportunities for those currently benefiting from the war economy, while supporting the emergence of new or expanded economic opportunities for those excluded. These economic interventions need to be grounded in a deep understanding of local systems. Without such understanding, efforts to transition toward sustainable peace are doomed, and initial stabilization efforts can be reversed. If such local economic opportunities cannot be credibly created and sustained, then (international) efforts are needed to find ways to reduce opportunities for profiting from the war economy. Only through the creation of viable economic opportunities for all can the existing allocation of economic resources and powers move toward greater equity and inclusion.
Last, the report proposes complementing the state-centered approach with a focus on local interventions that build on and strengthen the resilience of local assets and institutions. These assets should include not only infrastructure but also formal and informal institutions as well as human and social capital. A transition toward sustainable peace requires moving beyond physical damages, to also include the destruction of the social fabric of the country and its communities. It also requires a change in focus toward existing assets that have survived the conflict or that have emerged as coping mechanisms in response to the conflict. Local communities and their social and human capital are assets that can support the transition toward sustainable peace, especially as they grew accustomed to surviving without the state, whether before or during the conflict, as in Libya or Yemen, or as the conflict cools off, as in Iraq and Syria.
The operationalization of this approach requires an engagement that is flexible and oriented toward a long-term vision for the war-torn countries’ transition toward sustainable peace. At each level, there is a similar set of questions to answer beginning with the simplest, should development actors engage at all? The answer to this first question will be unique to the different contexts and will also reflect the different mandates of the different actors. If the decision is to engage, a series of questions follows. Where to engage—across the country or in selected regions, cities, and towns? Whom
93C HAPTER 4: B UILDING FOR P EACE : R ECONSTRUCTION FOR S ECURITY , S USTAINABLE P EACE , AND E QUITY IN MENA A NEW STATE OF MIND: GREATER TRANSPARENCY AND ACCOUNTABILITY IN THE MIDDLE EAST AND NORTH AFRICA PART II: THE LEARNING STATE
to engage with—external actors? state actors? nonstate actors? local communities? What are the short and long-term objectives? And importantly, how should development actors work with each other and with counterparts in conflict contexts to develop and implement integrated strategies. Those strategies should be based on a good understanding of past grievances and situated within a shared long-term vision to address and overcome these grievances. They should also be based on an understanding of the tradeoffs that can arise between policies aimed at short-term stability and those addressing the long-term resolution of underlying grievances.
4. Understanding paths taken and not taken
Identifying the right policies, measures, and interventions in FCV environments is subject to serious constraints. Policymakers on all levels—local, national, and international—are forced to take decisions based on imperfect information, despite recent technological advances. Realities on the ground can change quickly, making it difficult to keep the available information up to date. Some areas may not be easily accessible, and the formal or informal lines of communication between authorities and the population may be impaired. A lack of information on actors’ incentives, needs, and interests makes anticipating their future evolution a challenge, aggravated by the multiplicity of actors involved in conflicts, particularly in the MENA region. Further, when the incentives of various actors are misaligned, or when a common planning horizon is lacking, garnering consistent and lasting support for a shared vision can be extremely complex.
Specifically, decisionmakers in fragile environments face tradeoffs when balancing the quest for immediate stability with long-term efforts to generate structural changes conducive to sustainable peace. As local, national, and international policymakers and practitioners seek a path toward sustainable peace, they face a dual challenge: They need to ensure stability by mitigating violence and by addressing its immediate consequences for the population. They also need to tackle the underlying structural and institutional causes of conflict, promoting long-term prosperity, social cohesion, and inclusive institutions to ensure sustainable peace (Figure 4).
Any short-term recovery efforts must be complemented by long-term strategies, which creates tradeoffs. As previous peacebuilding experiences have shown, promoting equitable economic opportunities, supporting inclusive institutions, and fostering social cohesion may take 30 to 50 years. Recovery efforts, by contrast, are targeted at ceasing violence, tackling immediate needs, introducing some level of security and stability, and generating quick wins. It is essential to understand how these two objectives are inextricably intertwined. The policies supporting one of them may at times undermine the other. From this tension arises a potential tradeoff: Pursuing the short-term objective of stability may at times come at the cost of the long-term objective of sustainable peace, as activities aimed at creating stability and meeting immediate needs often fail to address or even exacerbate the underlying structural issues causing grievances and conflict in the first place.
This time-specific tradeoff is associated with significant risks, as policy choices today create path dependencies that either steer the country on course—or veer it off course—to sustainable peace. When choosing between different policy options today, policymakers must be aware that each intervention introduced along a country’s path redistributes resources among actors, thereby altering the balance of power between these actors. Any intervention is thus likely to affect the evolution of actors’ interests and incentives and create path dependencies that may either create unintended consequences and lock a society into cycles of conflict and violence or set it on a path to sustainable peace. Even a
94 C HAPTER 4: B UILDING FOR P EACE : R ECONSTRUCTION FOR S ECURITY , S USTAINABLE P EACE , AND E QUITY IN MENA MIDDLE EAST AND NORTH AFRICA REGION | ECONOMIC UPDATE OCTOBER 2022
Figure 4. An opportunity to plan for a different future
seemingly impartial intervention such as humanitarian aid can skew the incentives among actors, for example, by partly relieving the government of its responsibility to serve citizens through its own formal service delivery systems and institutions, which may hamper the development of these institutions over the long term.
For policymakers and practitioners, the potential tradeoff between achieving short-term stability and setting the ground for achieving long-term sustainable peace manifests itself in the decisions they face today. When identifying priorities and flexibly seizing entry points, decisionmakers need to carefully evaluate options—with and for whom to engage, where and how, and in which sectors. Such an evaluation needs to consider the opportunity costs and potential negative consequences of each choice, the long-term vision of sustainable peace, and the fact that today’s policy choices could affect actors’ incentives and the distribution of power that ultimately shape a country’s future. Only when practitioners evaluate alternative paths can they manage the risks associated with their choices and—at a minimum—follow the “do no harm” principle.
5. How to choose the way forward
Engaging in today’s fluid conflicts requires an informed assessment of local, subnational, and regional differences in actors and their incentives, institutions, and structural factors, and how they interact with political and economic dynamics
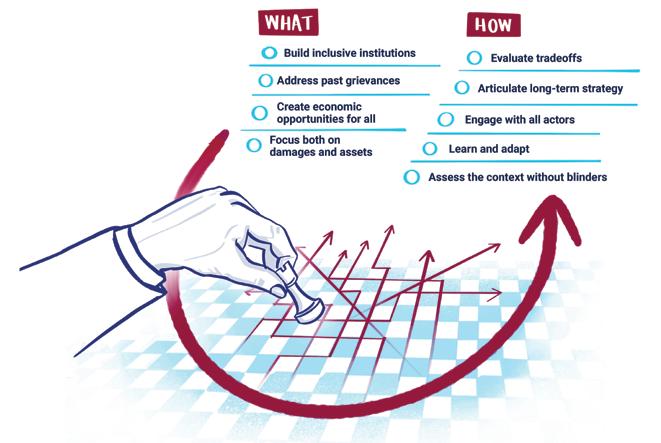
95C HAPTER 4: B UILDING FOR P EACE : R ECONSTRUCTION FOR S ECURITY , S USTAINABLE P EACE , AND E QUITY IN MENA A NEW STATE OF MIND: GREATER TRANSPARENCY AND ACCOUNTABILITY IN THE MIDDLE EAST AND NORTH AFRICA PART II: THE LEARNING STATE
over time. The assessment should go beyond a snapshot of conditions at one point in time and should be an ongoing, multi-dimensional process of analysis, a living narrative. It should focus not only on the pre-conflict conditions and the roots of conflict, but also on the dynamics of changes brought by conflict and how, in response, people and institutions adapt to the distribution of economic and political power. A viable strategy and effective implementation plan require a continuing understanding of the priorities of actors and communities, their incentives, their coping mechanisms, and their aspirations—and how these may change going forward. The assessment should seek to understand the political economy, the security dimensions, and the contingent risks and tradeoffs at different levels for successful humanitarian, development, and peacebuilding interventions.
Based on this context, the assessment should then identify policy options and entry points for the transition to sustainable peace. A strategy for identifying these policies and entry points can be likened to the strategy of playing a game of chess—a continuous and dynamic evaluation of the players, the board space, and the pieces on it (Figure 5). That
Figure 5. Looking at the entire chessboard of players, spaces, and times

96 C HAPTER 4: B UILDING FOR P EACE : R ECONSTRUCTION FOR S ECURITY , S USTAINABLE P EACE , AND E QUITY IN MENA MIDDLE EAST AND NORTH AFRICA REGION | ECONOMIC UPDATE OCTOBER 2022
includes their relative positions, capabilities, and power relationships, to guide each move in the short and medium term, maintaining flexibility, while anticipating the consequences of each move for the longer term. Well-informed policy options and entry points are essential to implementing operations for a transition to secure stability and security in the short term and to strengthen and sustain peace for the medium and long term.
Applying the most recent advances in assessment methodology in the field to inform policy dialogue and operational design has been challenging. For decades, the international community has relied on assessments to understand the context and take the first steps in providing joint support for planning, mobilizing resources, and engaging in interventions geared to reconstruction and development in conflict-affected countries. Over time, assessment methodologies, processes, tools, and available information have broadened significantly with greater methodological complexity and depth. But “blinders” on assessment practice—restrictions or limitations that can prevent the full picture of the situation on the ground from emerging—can lead to information gaps and misinformed interventions.
Building on the integrated and dynamic approach introduced here, a complete assessment of the situation on the ground should seek to:
• Understand the past by developing an account of the historical grievances and institutional factors that have determined a country’s path to the present.
• Make sense of the present at all levels including the local context.
• Map the future through a careful understanding of the populations’ coping mechanisms.
Removing the assessment’s blinders could widen the humanitarian and security perspectives, recognizing that focusing on bottom-up people’s security (physical, economic, and social) will yield greater stability and results. And identifying possible entry points for a peaceful process at different levels and the associated incentives to draw stakeholders in may provide opportunities to begin establishing enduring public service delivery institutions and foster trust between local communities and the central and local governments (Table 1).
To identify opportunities, mapping should bring together different partners and sources of information and tools. Much information and data for structural factors can be gleaned from international and national sources, including the World Bank (infant mortality rates, labor force participation rates), while other information is collected through qualitative interviews and focus group discussions with actors. During conflict in all or part of a country, completing the mapping may not be feasible, but new tools are available to remotely collect the voices of actors we cannot reach. The map would become a framework for a dynamic assessment process to underpin operational flexibility and adaptation and would help all actors and policymakers identify their comparative advantages and potential areas of partnership and coordination.
For the World Bank, the Building for Peace report (World Bank, 2020) is a regional complement to the newly adopted Strategy for Fragility, Conflict, and Violence, which will enhance the organization’s effectiveness in conflict contexts by guiding decisions on policies, programming, personnel, and partnerships. How other policymakers, practitioners, and development actors will translate the findings of the report into their activities ultimately depends on their mandates, priorities, policies, and the governance structures. However, what is clear is that strategic partnerships that bring together humanitarian, developmental, and security actors are indispensable for achieving results. Only when siloed project-driven approaches are left behind and peacebuilding efforts are united behind one holistic vision, can people’s dignity and security take center stage.
97C HAPTER 4: B UILDING FOR P EACE : R ECONSTRUCTION FOR S ECURITY , S USTAINABLE P EACE , AND E QUITY IN MENA A NEW STATE OF MIND: GREATER TRANSPARENCY AND ACCOUNTABILITY IN THE MIDDLE EAST AND NORTH AFRICA PART II: THE LEARNING STATE
Table 1. Removing the blinders on assessments
Blinder Specific information gap
Collecting information only from accessible areas
Assuming that a peace agreement ends a conflict
Omits relevant and up-to-date information
Omits key factors that could perpetuate instability or cause resurgence of conflict/ violence
Considering people’s physical security only
Missing key actors
Ignoring structural factors
Omits security factors that drive diverse affected stakeholders’ incentives and coping mechanisms
Omits key (internal/external, informal/ illicit/nonstate) stakeholders that could perpetuate instability or cause resurgence of conflict/violence. It could also compromise the understanding of the parameters of people’s security undermining stabilization and sustainable peacebuilding.
Omits factors that influence the overall context (such as climate, geography, resources, demography, and political and cultural heritage).
Way to remove the blinder
Use intermediaries, partners, and proxies with access
Use advanced technological tools
Adopt during-conflict tactics to map out possible entry points for interventions and opportunities for early recovery, taking into account the actors and incentives for continued conflict/violence
Adopt a comprehensive security lens and use a bottom-up people’s security orientation that accounts for all aspects of their security environment
Build selective partnerships to leverage comparative advantage
Focus on conflict-affected individuals, institutions, and the economy at the local level, taking a holistic view of how individuals and communities assess their present and future security in their day-today lives
Assessment design should be based on a thorough analysis of structural factors prepared as an assessment threshold that would begin an asset mapping exercise
Reference
World Bank. (2020). Building for Peace Reconstruction for Security, Equity, and Sustainable Peace in MENA. World Bank, Washington D.C.
98 C HAPTER 4: B UILDING FOR P EACE : R ECONSTRUCTION FOR S ECURITY , S USTAINABLE P EACE , AND E QUITY IN MENA MIDDLE EAST AND NORTH AFRICA REGION | ECONOMIC UPDATE OCTOBER 2022
Chapter 5: Transforming Justice in the Middle East and North Africa through Data by Daniel Chen and Manuel Ramos Maqueda
1. Introduction: The judicial context in the Middle East and North Africa 1
This chapter summarizes the role of justice in development, the importance of the data revolution in justice, and the opportunities for countries in the Middle East and North Africa to improve judicial effectiveness and unlock the power of justice systems for economic development. Empirical evidence shows that effective justice systems facilitate economic development through multiple mechanisms. A strong justice system enforces contractual agreements, resolves legal disputes, promotes social cohesion, and builds trust between market players and government institutions. However, in the Middle East and North Africa, citizens’ trust in public institutions remains low, and the region faces significant challenges in justice and the rule of law in terms of judicial independence, quality, efficiency, and accessibility. As more Middle Eastern and North African countries embark upon efforts to digitize justice and make judicial services more accessible, this chapter discusses how to use the data generated by digital technologies to improve justice institutions. The examples show that data-driven decision-making may reduce adjournments and improve the accountability of justice systems, encouraging economic growth; identify and reduce gender and ethnic biases to improve the quality of justice; and enhance the effectiveness of alternative dispute resolution mechanisms by leveraging algorithms to optimize case assignment, an improvement that can be extended to other types of public services. Notwithstanding the different contexts in the Middle East and North Africa—high income, low income, and fragile and conflict affected— the examples may apply to the common set of justice challenges that Middle Eastern and North African countries face, which include inefficiencies, suboptimal quality, and lack of access by marginalized groups. The chapter concludes by exploring future avenues for research and innovation. Whether by providing citizens with access to courts via WhatsApp, embedding human-centric artificial intelligence in court decisions, applying principles of the share-riding economy in the distribution of cases across courts, or providing personalized training for judges, the data revolution brings ample opportunities for the Middle East and North Africa.
The justice system is a key pillar of governance institutions along four dimensions. First, as a structure, the justice system is a formal institution that provides an essential service to citizens and corporations: the capacity to resolve disputes independently according to the law. This function is especially important for vulnerable populations, who need the justice system to counter informal power asymmetry. Second, as a process, the judiciary is responsible for holding the executive and legislative branches of government accountable, serving as an independent, autonomous branch that ensures impartial, fair resolution of legal conflicts. As this chapter will soon discuss, Middle Eastern and North African countries have challenges in building strong and independent judiciaries. Third, as a mechanism of governance, the judiciary shares the characteristics of any bureaucracy. As such, it functions through a set of formalistic institutional procedures through which matters proceed and decisions follow. Finally, as a strategy, the design of the justice system is a conscious or subconscious policy choice, because procedural aspects of the law can have substantive impacts on citizens. For instance, a marginal increase in the cost of filing—monetarily or doctrinally—disproportionately burdens marginalized people who lack financial resources and legal expertise. In short, designing justice is an art of governance.
Overall, there is a strong association between economic development and rule of law, as cross-country indicators show. For instance, a well-functioning judiciary promotes economic growth by enforcing contracts and securing property rights (Chemin 2009; Lichand and Soares 2014; Ramos-Maqueda and Chen 2021; Shvets 2013). An effective justice system further promotes social cohesion and deters violence that undermines economic productivity (Acemoglu et.al 2018; Blattman, Hartman, and Blair 2014; Mocan, Bielen, and Marneffe 2018).
1 We are grateful to Klaus Decker, Roberta Gatti, and Ha Nguyen for detailed comments and feedback, and to xiantao Wang for excellent research assistance. 100 C HAPTER 5: T RANSFORMING J USTICE IN THE M IDDLE E AST AND N ORTH A FRICA THROUGH D ATA MIDDLE EAST AND NORTH AFRICA REGION | ECONOMIC UPDATE OCTOBER 2022
The Middle East and North Africa faces significant challenges in justice and the rule of law that hinder development. The region’s rule of law as measured by Worldwide Governance Indicators outperforms South Asia and Southern Africa but trails Europe and Central Asia, East Asia and the Pacific, and Latin America and the Caribbean (Decker 2022, Kaufman and Kraay 2021). There is an urgent need to improve service delivery in the public sector and rebuild the public’s trust in government institutions. Specifically, regarding the justice sector, Middle Eastern and North African countries have substantial room for improvement in judicial independence and constraints on executive power, as well as the quality, efficiency, and accessibility of justice.
Before delving into each of the four areas, it is important to recognize that the Middle East and North Africa consists of a diverse set of countries that may be divided into three categories (Decker and Ebeid 2019). First, fragile and conflictaffected countries, such as Iraq, Libya, and Yemen, lack basic state institutional capacity to deliver justice services, and marginalized communities are especially vulnerable. Second, middle-income countries, such as Egypt and Jordan, although not directly affected by fragility and conflict, face spillover effects from neighboring countries in the region. Finally, in high-income countries, namely, the countries in the Gulf Cooperation Council and Malta, justice challenges remain in the form of weak institutional capacity, low levels of inclusion, and corruption, among others.
Despite the diversity, Middle Eastern and North African countries share many challenges in the four areas outlined above. First, data from the V-Dem Dataset used by Lührmann, Marquardt, and Mechkova (2020) offer some useful insights into judicial independence and constraints on the executive branch. The side-by-side boxplots in Figure 1 suggest that, although there is wide variation, Middle Eastern and North African countries on average underperform countries in other regions on all justice and rule-of-law indicators. The region is on par with Sub-Saharan Africa but lags behind all other regions on indicators of independence, compliance with the judiciary, and judicial constraints on the executive branch.
Second, the quality of justice systems across the region is suboptimal (Decker and Ebeid 2019). In fragile and conflictaffected countries, justice services are fundamentally biased against the opposition and marginalized populations, and there are high levels of judicial corruption. In middle-income countries, historically underfunded justice institutions struggle to obtain financial, human, and technical resources to deliver on 21st-century citizen expectations. Highincome countries face similar challenges, including a lack of resources.
Third, the efficiency of legal and judicial systems in settling disputes compiled in the World Economic Forum Global Competitiveness Index (Schwab 2019) sheds some light on the situation across regions. Middle Eastern and North African countries in general perform better than the median country with available data2 but have ample space for improvement (Figure 2).
Fourth, accessibility is a challenge in all Middle Eastern and North African countries (Decker and Ebeid 2019). In fragile and conflict-affected countries, civil, commercial, and administrative justice services are hardly available. For example, since the Yemeni civil war that started in 2014, Yemen has reached a point of institutional collapse, with successive governments unable to protect private property or basic public security. In middle-income countries, underfunded justice institutions are unable to deliver justice to citizens and businesses, not to mention large swaths of refugees who are excluded and discriminated against. For example, the influx of Syrian refugees into Lebanon has added complexity to this country troubled by weak government and institutional capacity, as well as regional and local polarization. High-
are available for only 139 countries. Data are more likely to be
the
East, South America, and Central Asia. Thus, the median country in the data set may not be the median country
2 Data
missing in Central Africa, West Africa,
Middle
in the world. 101C HAPTER 5: T RANSFORMING J USTICE IN THE M IDDLE E AST AND N ORTH A FRICA THROUGH D ATA A NEW STATE OF MIND: GREATER TRANSPARENCY AND ACCOUNTABILITY IN THE MIDDLE EAST AND NORTH AFRICA PART II: THE LEARNING STATE
Figure 1. Justice and rule of law across regions: Judicial independence and constraints on the executive a. High court independence b. Compliance with judiciary 4 3 2 1 0 -1 -2 -3 -4 SA ECA LAC EAP North AmericaSSA MENA 4 3 2 1 0 -1 -2 -3 -4 SA ECA LAC EAP North AmericaSSA MENA c. Judicial constraints on the executive d. Executive respect of constitution 1.2 1.0 0.8 0.6 0.4 0.2 0 SA ECA LAC EAP North AmericaSSA MENA 4 3 2 1 0 -1 -2 -3 -4 SA ECA LAC EAP North AmericaSSA MENA Source: V-Dem Dataset produced by Varieties of Democracy, used in Lührmann, Marquardt, and Mechkova 2020. Figure 2. Efficiency of legal framework in settling disputes Count Efficiency of legal framework in settling disputes, 1–7 (best) 50 45 40 35 30 25 20 15 10 5 0 <1 or (blank) 2–3 3–4 4–5 5–6 6–71–2 Non-MENA MENA 7 6 5 4 3 2 1 0 Efficiency of legal framework in settling disputes, 1–7 (best) J MENA J Non-MENA Source: World Economic Forum Global Competitiveness Index 2019. 102 C HAPTER 5: T RANSFORMING J USTICE IN THE M IDDLE E AST AND N ORTH A FRICA THROUGH D ATA MIDDLE EAST AND NORTH AFRICA REGION | ECONOMIC UPDATE OCTOBER 2022
to justice
other
Access to
by
the Middle East
vulnerable groups, who face discrimination in
North Africa
been stagnant for decades, with the
(Varieties of Democracy
hurt women disproportionately, with the Middle East and North Africa being the worst-performing region on gender inequality in terms of “going to court” and “protecting women from violence,” trailing behind the second worst on both indicators by a large margin (Decker and Ebeid 2019; World Bank 2018).
these challenges, the World Bank identifies four justice and rule-of-law priorities in the region: addressing challenges to private sector development by promoting a level playing field for all market actors in the courts; improving justice service delivery in terms of efficiency, quality, and access; enhancing transparency, accountability, and inclusion; and strengthening justice and the rule of law in the context of fragility, conflict, and violence (Decker 2022). As the literature review and the case study of Kenya later in this chapter suggest, accountable, scalable technological solutions powered by data help further these priorities.
can countries do to improve the justice system? Why does improving justice systems matter for economic development? The following section reviews the evidence from the academic literature on how judiciaries affect development outcomes. The third section examines the power of administrative data in governments and presents the justice system as a unique example of untapped potential to improve the rule of law in the Middle East and North Africa. The fourth section presents an illustrative case study in Kenya, focusing on how data can be leveraged to increase the efficiency, quality, and accessibility of justice. Finally, the concluding section discusses potential areas for research and policymaking.
3
The V-Dem Dataset produced by Varieties of Democracy has a slightly different definition of the Middle East and Northern Africa than the World Bank. V-Dem definition: Algeria, Bahrain, Egypt, Iran, Iraq, Israel, Jordan, Kuwait, Lebanon, Libya, Morocco, Oman, Palestine-Gaza, Palestine-West Bank, Qatar, Saudi Arabia, Syria, Tunisia, Turkey, United Arab Emirates, and Yemen. World Bank definition: Algeria, Bahrain, Djibouti, Egypt, Iran, Iraq, Israel, Jordan, Kuwait, Lebanon, Libya, Malta, Morocco, Oman, Qatar, Saudi Arabia, Syria, Tunisia, United Arab Emirates, West Bank and Gaza, Yemen.
income countries have high levels of inequality with low levels of voice for
the legal system. Overall, access
in
and
has
region lagging behind all
regions in this dimension by 2021 (Figure 3)
20223). Figure 3.
justice
region, 1946–2020 Access to justice, average of country-specific values 1.0 0.9 0.8 0.7 0.6 0.5 0.4 0.3 0.2 0.1 0 19461948195019521954195619581960196219641966196819701972197419761978198019821984198619881990199219941996199820002002200420062008201020122014201620182020 EAP Europe LAC MENA North America SA SSA Source: Varieties of Democracies 2022. These challenges
Recognizing
What
103C HAPTER 5: T RANSFORMING J USTICE IN THE M IDDLE E AST AND N ORTH A FRICA THROUGH D ATA A NEW STATE OF MIND: GREATER TRANSPARENCY AND ACCOUNTABILITY IN THE MIDDLE EAST AND NORTH AFRICA PART II: THE LEARNING STATE
2. Role of justice in development
This section discusses the evidence of the role of justice in development, with a focus on impacts on economic growth, conflict and violence, and governance. This section’s discussion on the role of justice in development suggests new policy and research opportunities.
There is a strong association across the world between the economic development of a country and its rule of law. Judiciaries matter not only for their intrinsic value but also for development outcomes. The macroeconomic literature documents that institutions, rather than geography or openness to trade, are key drivers of economic growth and development (Rodrik 2000), although systematic reviews also find weak empirical evidence of the impact of contract enforcement on investment (Aboal, Noya, and Rius 2014). Is the relationship between better judiciaries and economic outcomes causal? If so, why?
Quasi-experimental evidence using microdata has highlighted the potential mechanisms through which judiciaries affect economic outcomes. One mechanism is firm-to-firm trade, because trust in contract enforcement is necessary for trade (Chemin 2012). Another mechanism is the increase in investment and making production decisions that rely on contracts (Chakraborty et al. 2018; Crawford, Klein, and Alchian 1978). A final mechanism is lending, facilitated by the formal enforcement of loans (Shvets 2013). Furthermore, entrepreneurship and firm size can also increase with stronger justice systems and greater access to justice (Laeven and Woodruff 2004; Lichand and Soares 2014).
The empirical literature has found that (1) better contract enforcement reduces risk in contracting and enhances firms’ productivity and business creation (Ahsan 2013; Sequeira 2016); (2) judicial institutions increase credit availability and spur development of credit markets by reducing risk and moral hazard (Chemin 2009); (3) and access to justice increases productivity and protects citizens at risk of conflict or when laws are biased against them (Aberra and Chemin 2021; Blattman, Hartman, and Blair 2014; Sandefur and Siddiqi 2013). (4) A more limited but growing area of research has found that a strong justice system can lower corruption (Litschig and Zamboni 2018). These four claims are based on quasi-experimental studies and provide a basis for future research into how the justice system affects economic outcomes. A review of the literature revealed that mechanisms (3) and (4), related to the need for stronger judiciaries to address corruption and increase access to justice, may be particularly relevant for the Middle East and North Africa. Likewise, a more reliable and accountable judiciary may also increase firm-to-firm trade and foreign direct investment.
The following studies represent examples of some of the methods and findings that support the four relationships. First, the creation of special tribunals in Brazil—simple, agile, safe, and effective—increased the geographic presence of the justice system and access to justice (Lichand and Soares 2014), which increased entrepreneurship and new business formation, in particular for individuals with higher levels of education. Second, an earlier study found that a judicial reform that provided judges with training in case management techniques in Pakistan led to greater case resolution and higher entry rates for new firms (Chemin 2009). Surveyed individuals were more confident in their ability to obtain credit, which increased entrepreneurship. The author’s estimates suggest that this reform increased Pakistan’s gross domestic product by 0.5 percent (Chemin 2009). A third study in Senegal found that a policy reform requiring judges to complete pre-trials within four months increased the speed of justice (Kondylis and Stein 2018). It halved the negative financial impact of case delay, and surveyed firms valued this reform.
104 C HAPTER 5: T RANSFORMING J USTICE IN THE M IDDLE E AST AND N ORTH A FRICA THROUGH D ATA MIDDLE EAST AND NORTH AFRICA REGION | ECONOMIC UPDATE OCTOBER 2022
Mediation and conciliation also play an important role in providing effective, accessible dispute resolution mechanisms in developing countries, especially by resolving violent disputes and protecting vulnerable populations (Blattman, Hartman, and Blair 2014). In one randomized controlled trial, targeted communities participated in eight days of training in alternative dispute resolution. In one year, dispute resolutions increased. In three years, treated communities witnessed substantial drops in threats and violence associated with disputes. Survey data suggest that part of the mechanism was promoting norms and skills related to managing emotions and avoiding violence. In a study in Peru, the introduction of Women Justice Centers (WJCs)—specialized institutions that provide police, medical, and legal aid services for vulnerable women who experience gender-based violence—curbed violence, improved children's educational outcomes, and reduced child labor (Sviatschi and Trako 2021). Furthermore, the presence of a WJC in a district is associated with 7 percent fewer female deaths due to aggression and 10 percent fewer mental health hospitalizations, suggesting that conciliation, mediation, and legal aid are important support mechanisms for protecting women at risk and effectuating justice and rule of law.
Effective justice systems may ultimately reduce corruption and cultivate trust in governments. In one study of Brazilian local governments, the physical presence of state judicial institutions reduces rent extraction, measured as irregularities related to waste or corruption, by about 10 percent (Litschig and Zamboni 2015). In another randomized study, simply providing information about the faster speed of justice in rural Punjab in Pakistan led to greater citizen willingness to use state courts and allocate funds to the state and enhanced overall trust in formal institutions (Acemoglu et al. 2018).
In short, the literature provides ample evidence that effective rule of law facilitates economic development through multiple mechanisms. A stronger justice system enforces contractual agreements, resolves legal disputes, promotes social cohesion, and builds trust among market players and in government institutions.
3. Data revolution in justice systems
Having demonstrated why justice matters for economic development, this chapter now shifts gears and turns to how data and technology can improve governance and justice. Digital technologies are transforming the work of governments worldwide, and COVID-19 has accelerated this transformation. Digital systems generate a wealth of microdata— including in the areas of taxation, justice, procurement, and public administration—that is often underused. These digital technologies enable data collection that creates invaluable opportunities to measure and improve the performance of governments and justice systems.
How can the power of these rich administrative data be leveraged to improve justice institutions? What is the downstream impact of improved institutions on economic growth and poverty reduction? Judiciaries collect vast amounts of data, but even though fair administration of justice relies on tracking what happens at each instance of a case, judiciaries have rarely used these data to improve decision-making. Thus, judiciaries are data rich but information poor.
Using cutting-edge research and analytical techniques, judiciaries can leverage big data to increase the efficiency, quality, and accessibility of justice (Ramos-Maqueda and Chen 2021). E-filing and case management systems in judiciaries around the world have generated a vast amount of administrative data and expanded data availability. Recent research demonstrates that simply sharing and seeing data can improve decision-making and court performance. For instance,
105C HAPTER 5: T RANSFORMING J USTICE IN THE M IDDLE E AST AND N ORTH A FRICA THROUGH D ATA A NEW STATE OF MIND: GREATER TRANSPARENCY AND ACCOUNTABILITY IN THE MIDDLE EAST AND NORTH AFRICA PART II: THE LEARNING STATE
Carrillo et al. (2022) demonstrate that data dashboards providing simplified information to court managers increase the overall productivity of courts, particularly for more senior officers who are less skillful with data and technology. Beyond court officials, information on expected outcomes may help litigants make better decisions about their cases. In the context of Mexican labor courts, Sadka, Seira, and Woodruff (2020) show that personalized outcome predictions for litigants doubled their settlement rates in mediation, and improved the overall welfare of workers.
Beyond data itself, simple technological solutions powered by data can improve justice institutions and participants’ well-being. For example, Cooke et al. (2018) noticed that text message reminders decreased failure to appear in courts in New York City by up to 26 percent, avoiding 3,700 arrest warrants. Machine learning applications may also improve the decisions of court actors. Kleinberg et al. (2017) found that applying predictive machine learning in bail decisions has the potential to reduce crime by 25 percent without increasing the number of people in jail, highlighting in a simulated scenario how data may support decision-making and address important challenges in the justice sector.
Three stages underlie the effective use of data. The first stage has to do with the data itself: improving case management systems and data quality, creating structured data from unstructured text that allows for new opportunities to improve justice systems, and investing in platforms for data collection. The second stage concerns data analysis: identifying core problems in justice systems, measuring and documenting the impacts of justice reforms, and leveraging machine learning to identify and reduce biases. The third stage involves testing new innovations and approaches through experimentation and developing a policy feedback mechanism to inform decisions by governments and judiciaries in real-time. The effective implementation of these stages, nonetheless, requires governments' willingness to use the data and make it accessible. Without data availability and transparency, the opportunities for data revolution to improve justice systems are severely undermined. As discussed later in this chapter, this component represents a key barrier to unleashing this potential across Middle Eastern and North African countries.
Opportunities to transform the justice system are particularly relevant in the midst of the global justice gap. According to the World Justice Project (2019), some 5.1 billion people lack meaningful access to justice, and an estimated 1.5 billion people cannot resolve their administrative claims, criminal or civil justice needs, and disputes. As explained in the introduction, this gap in access to justice is particularly acute in the Middle East and North Africa. What if the power of high-frequency data can be harnessed to identify precisely which sectors of the population lack access to justice and provide dispute resolution mechanisms to resolve their grievances? Can these data even be used to evaluate the impact of a new law on citizens and businesses and then create knowledge for sharing good practices of regulations across countries? The advent of big data and machine learning in governments opens a wide range of opportunities.
Creating a Data Ecosystem
To understand how to leverage the power of data systems, this chapter defines a rich judicial data ecosystem as follows. First, there should be an integrated justice system, which means that case-level data should be associated with each milestone in the process, from filing to appeal. The text of court rulings, sentences, and human resources data should also be integrated to facilitate text analysis. The benefits are multifold. For instance, if analysts want to evaluate changes in recruitment and training policies, they can follow these integrated data to evaluate how such policies affect actual judicial decision-making. Automation of indicators as part of a results framework while tracking court-level reforms and
106 C HAPTER 5: T RANSFORMING J USTICE IN THE M IDDLE E AST AND N ORTH A FRICA THROUGH D ATA MIDDLE EAST AND NORTH AFRICA REGION | ECONOMIC UPDATE OCTOBER 2022
innovations augments the capacity to learn from best practices. A rich data ecosystem also enables the implementation of A/B testing4 and exploration of how small changes can have meaningful impacts on the delivery of justice.
Second, if policymakers and researchers want to understand how the justice system affects people’s lives, they can combine judicial data with data from related agencies. Ideally, the case data can be linked to those of firms and users through national identification or tax data. If possible, the case data should also be combined with data from the police, prosecutors, and prisons so that the court administration can follow the entire justice process from when a crime is committed to the resolution of the case.
Finally, it is important to assess the experience not only of users but also of non-users—that is, those who do not access justice. This involves combining court user surveys with legal needs questionnaires administered to the general population to understand who is not accessing justice and why.
The Challenge for the Data Revolution in the Middle East and North Africa: Lack of Data and Transparency
Despite the opportunity that the data revolution provides presented in this chapter, it is crucial to understand the unpalatable truth on the ground: administrative data tend to be lacking in Middle Eastern and North African countries. Sometimes existing workflows based on paper and manual filing—which the case management system and data ecosystem discussed above can replace—lack the capacity to organize data in a structured, automated, and scalable manner. Other times, the unitary top-down political structure favors data opacity over transparency. The result is that the Middle East and North Africa often appears as a data desert in cross-country administrative data sets, and academic literature on justice in the region is mostly norm-based and written by lawyers. Thus, one important step in leveraging the potential of the data revolution is for Middle Eastern and North African countries to ensure sustained institutional resources, infrastructure, and data transparency. As discussed throughout this chapter, this will open invaluable opportunities to improve the functioning of the justice system and foster economic prosperity and inclusion.
4. Case study: Kenya
The following case study in Kenya showcases how data-driven interventions increase the efficiency, quality, and accessibility of justice. In terms of efficiency, it exemplifies how data-driven, useable information can improve court performance. In terms of quality, the case study examines gender and ethnic biases in judicial decisions. Finally, in terms of accessibility, the case study addresses how technological innovations can increase access to and the quality of justice for vulnerable populations by providing good alternative dispute resolution mechanisms.
As summarized in the introduction, Middle Eastern and North African countries—high-income, low-income, and fragile and conflict-affected—share a broad set of justice challenges, including inefficiencies, suboptimal quality, and lack of access by marginalized groups, albeit in different contexts. The case study in Kenya, a developing country in the Global South, highlights how data and technology can help address these challenges. As of 2020, Kenya’s rule of law, as measured by Worldwide Governance Indicators (Kaufman and Kraay 2021) was below the average and median of Middle
A/B test refers
randomized
4 An
to a
experiment that compares two or more versions of a product, process, etc. A major benefit of A/B testing is that randomization evens out external factors and supports strong causal inference. 107C HAPTER 5: T RANSFORMING J USTICE IN THE M IDDLE E AST AND N ORTH A FRICA THROUGH D ATA A NEW STATE OF MIND: GREATER TRANSPARENCY AND ACCOUNTABILITY IN THE MIDDLE EAST AND NORTH AFRICA PART II: THE LEARNING STATE
Eastern and North African countries, below Egypt and West Bank and Gaza but above Algeria and Iran (Figure 4). Thus, examples from Kenya may be useful to countries in the Middle East and North Africa that are interested in transitioning to digital technologies and data-driven decision-making.
Figure 4. Rule of law in worldwide governance indicators in Kenya and other Middle Eastern and North African countries
Percentile
on rule of law,
United Arab Emirates
Kuwait Saudi Arabia
Arab Rep. West Bank and Gaza Kenya Algeria
Islamic Rep. Lebanon
Yemen, Rep.
The following case study provides examples of how to use rigorous data-driven innovations to guide judicial reforms. It started off during a World Bank lending operation with the Kenyan judiciary, the Judicial Performance Improvement Project,5 one of the components of which consisted of financing the development of a digital case management system, creating a performance management division to make productive use of these data, and standardizing the data system throughout the judiciary. This shift toward a data-driven culture within the judiciary brought improvements in monitoring and performance. For instance, objectives could be measured in real time, incentives could be provided for the best-performing courts, and promotion decisions could be based on performance metrics derived from the data.
As part of this process, the project engaged with various actors in the Judiciary to implement and evaluate the impact of data-driven innovations. In the first example, the World Bank’s Data and Evidence for Justice Reform (DE JURE) program partnered with the Kenyan Judiciary’s Directorate of Planning and Operational Performance and McGill University to evaluate whether existing judicial data could be used to increase the efficiency of the justice system. In this context, adjournments were causing large backlogs in courts. The partnership decided to leverage existing data systems to diagnose the key metrics of the performance of each court and identify the top three reasons for adjournments affecting each court. Typical reasons for adjournments included the parties or witnesses not being ready or not showing up to court. Because this information was captured in the administrative data, the judiciary could use it to design an intervention that would reduce adjournments.
Chemin et al. (2022) developed a personalized, one-page feedback report including the top reasons for adjournments and making this information useable by predicting the overall efficiency gain if the top reasons for adjournments were reduced to zero. The project evaluated the impact of this intervention in a randomized controlled trial with two treatment arms in all 124 courts in Kenya. The feedback report was shared only with judges in some courts and with judges and court user committees, which consist of prosecutors, police, lawyers, and civil society organizations, in other courts— thus creating an accountability mechanism. The project tested whether this intervention affected the efficiency of justice.
Preliminary results show that providing useable information with accountability can significantly increase efficiency. When this feedback report highlighting the reasons for court delays was shared with judges and court user committees, adjournments decreased by 20 percent. In addition, wages in contract-intensive industries that the judiciary most affects increased in the regions where the information and accountability intervention took place. Thus, this intervention reveals an empirical link between a more efficient judicial system and citizens’ economic outcomes.
5 See Judicial Performance Improvement. World Bank, Washington, DC. https://projects.worldbank.org/en/projects-operations/project-detail/P105269
rank
0–100 (best) Qatar
Oman Bahrain
Jordan Tunisia Morocco Egypt,
Iran,
Djibouti Iraq
Libya S rian Arab Re ypublic 020406080 100 Source: Kaufman and Kraay 2021. 108 C HAPTER 5: T RANSFORMING J USTICE IN THE M IDDLE E AST AND N ORTH A FRICA THROUGH D ATA MIDDLE EAST AND NORTH AFRICA REGION | ECONOMIC UPDATE OCTOBER 2022
Another example of digital transformation in the Kenyan judiciary consists of a collaboration between a research team at World Bank’s Development Economics Vice Presidency and the Court-Annexed Mediation program in the Kenyan Judiciary. This partnership has developed a data management platform that provides court officers with analytical insights, streamlining administrative workflows. By creating this data-driven platform, new opportunities to improve the quality of mediation arise. For instance, the team aims to test, conditional on funding, a Machine Learning tool that assigns cases to mediators based on their prior (relative) performance. The goal of this assignment system is to improve current mediation systems, which mostly assign cases to mediators based on their availability or random assignment. Existing systems rarely consider the previous performance of mediators when assigning a case, which might affect whether the parties reach an agreement in mediation and whether they do so efficiently. Thus, by leveraging existing data systems and algorithmic tools, new opportunities may arise to improve the allocation of cases to mediators, increase access to justice, and reduce the backlog of cases through mediation.
In a final example of the Kenya case study, Chen et al. (2022) evaluate, using publicly available data on more than 130,000 published judgments on the Kenya Law website, whether there are gender and ethnic biases in judicial decisions. They find that judges are more favorable to defendants of the same gender and ethnicity, an example of ingroup bias. Leveraging the text of the written decisions by the judges using natural language processing techniques, the project found an association between judges’ stereotypical gender biases in writings and adverse rulings against female defendants. The team is exploring whether technological tools can also help reduce such biases.
Thus, the case study of Kenya demonstrates that the data revolution in justice can bring important benefits to the efficiency, quality, and accessibility of justice. Such improvements can transform how judiciaries work, catalyzing a cycle of change that contributes to more effective institutions that promote economic growth and protect the well-being of citizens. This transition may reduce some of the challenges Middle Eastern and North African countries face in their justice systems.
The Kenyan experience cannot be applied mechanically to Middle Eastern and North African countries, and there is no one-size-fits-all solution for justice reform, which is inextricably tied to a nation’s history, tradition, and social environment. As alluded to earlier, lack of data infrastructure and transparency is a severe challenge in many Middle Eastern and North African countries. Beyond data, there is much progress to be made in strengthening legal institutions and making them more inclusive. For example, it was not until 2021 that Egypt appointed female judges (Malekian and Maher 2021).
5. Avenues for future research and policy
As this chapter has tried to convey, justice matters for development. It is a key pillar of governance, and it promotes economic development by enforcing contracts, resolving legal disputes, and promoting social cohesion and trust. Middle Eastern and North African countries face various shortfalls—lack of quality, accountability, and accessibility—in the justice system. The data revolution provides an opportunity to address some of these shortfalls. The case study of Kenya demonstrates that the shift toward a data-driven culture within the judiciary has leveraged previously underused administrative data to increase the efficiency and accountability of the justice system, as well as the overall performance of mediators. Moreover, regions where courts received the intervention saw wages increase in contract-intensive industries, confirming the link between justice and the economic well-being of citizens.
109C HAPTER 5: T RANSFORMING J USTICE IN THE M IDDLE E AST AND N ORTH A FRICA THROUGH D ATA A NEW STATE OF MIND: GREATER TRANSPARENCY AND ACCOUNTABILITY IN THE MIDDLE EAST AND NORTH AFRICA PART II: THE LEARNING STATE
The COVID-19 pandemic has exacerbated the global challenge of unmet justice. In the wake of the pandemic, technologybased innovations are no longer just auxiliary instruments but have become increasingly necessary avenues to seeking justice, as new social norms aimed at preventing further the spread of the virus become the new normal.
Some Middle Eastern and North African countries have embarked upon efforts to make judicial services more accessible as part of their broader initiatives to digitize government data. For example, in Egypt, on the user-facing front end, the government has launched the “Digital Egypt” platform that is designed to provide automated services for justice affairs (World Bank 2021). Egypt is working toward a whole-of-government approach, which entails expanding digital solutions to various core government functions. So far, the results as measured by GovTech have been modest, indicating that Egypt’s digitization efforts have yet to materialize fully (World Bank 2020; 2021). Another example is the UAE, which has been pushing for digital justice (UAE, n.d.). For instance, the Case Management System enables litigants to file documents electronically and reduces delay. Since the COVID-19 pandemic, remote litigation has become the mainstream in public court sessions.
Studies and examples highlighted in this chapter are but a handful of important studies that suggest the need for policies to increase access to justice and further randomized control trials for more rigorous evidence.
There are three prominent areas where data and technology, if coupled with sufficient infrastructure automating data flow, institutional support, and political will, can be particularly useful for improving the rule of law in upcoming years: increasing access to justice for citizens; improving court performance by providing support tools for court actors; and enhancing legal knowledge for judges and legal professionals, citizens, and firms (Ramos-Maqueda and Chen 2021).
First, e-justice tools for increasing access to justice can make it easier for citizens to access the courts. For instance, in response to the COVID-19 pandemic, the Chilean Administrative Corporation of the Judiciary opened a virtual platform for communication, Conecta, on which litigants could access courts through various channels, such as WhatsApp, videoconferences, and internal chat. By integrating various remote means of communication, Conecta enabled citizens to access family courts and resolve cases related to, among others, family disputes, child support, and domestic violence. The data generated in this platform on the number of inquiries, waiting time, and user satisfaction can be used to improve the service. Thus, Conecta not only provided a lifeline for families at risk during the pandemic but also can play an essential role in enhancing access to justice well beyond pandemic times.
Another possible way to increase access to justice is through digital phenotyping. Public health researchers have validated smartphone use as a proxy for mental health and used the possibility of sending information on services to support vulnerable populations. The DE JURE program is supporting Bangladeshi academics working with the Ministry of Women to address missing cases—i.e., cases that were never filed but should have—and reduce gender-based violence.
Second, access to justice can synergize with unbiased court services. The phenomenon of refugee roulette—by which results of asylum decisions depend on the hearing order—is an empirical example of judicial bias, which undermines the notion of equal treatment before the law. Research on how human-centric artificial intelligence can reduce biases while respecting judges’ autonomy and discretion provides a framework that can be applied in data-driven apps to provide decision support for judges (Babic et.al 2020; Chen n.d.). The human-centric approach begins by showing judges their predicted selves, which they are free to deviate from in their decision-making. Decisions predicted to lead to error get a nudge to pay attention or spend more time. Judges can even see the predictions of others to learn how others decide.
110 C HAPTER 5: T RANSFORMING J USTICE IN THE M IDDLE E AST AND N ORTH A FRICA THROUGH D ATA MIDDLE EAST AND NORTH AFRICA REGION | ECONOMIC UPDATE OCTOBER 2022
This decision support can also help speed justice because judges may be able to better allocate their attention and bandwidth. This framework can be evaluated through decision support apps and randomized trials.
Another way to speed justice is to use principles of the ride-sharing economy. In many countries, some courts are extremely congested, whereas others are not busy. Can Uber-like algorithms address court backlog and increase welfare in the public sector? Unlike the usual ride-sharing platform, where a driver takes one rider at a time, this matching problem has judges who can take multiple cases simultaneously. Algorithms embedded in decision-support apps like this can include randomized controlled trials to help efficiently allocate cases. This is an area that should be examined to showcase the opportunities for machine learning to boost judicial efficiency.
Third, enhancing knowledge of laws and regulations can support economic growth. In South Africa, Bertrand and Crépon (2021) evaluate whether imperfect knowledge of labor regulation hinders job creation at small and medium-sized enterprises. In a context in which there was a misunderstanding of labor laws, the researchers partnered with a labor law organization to provide information about labor regulation via newsletters and access to a specialized website. In a randomized controlled trial with 1,824 small and medium-sized enterprises, the authors tested the impact of improving knowledge of labor laws. Six months later, they found that providing this information increased employment by 12 percent, demonstrating that better knowledge of legal rules is another mechanism through which enhanced rule of law through e-justice interventions can boost economic growth and productivity.
Case management and training can improve the resolution of disputes. Increasing knowledge about one’s rights can make justice systems more equitable. The examples described in this section are theoretical and practical. There is more to understand about how the speed and fairness of justice can be increased. This matters not only for economic development, but also for fragility, conflict, violence, and corruption.
The benefits of the data revolution do not mean that promoting this transformation is effortless. Three prerequisites are crucial for reform. First, national lawmakers must make or change laws to allow digital justice. As an example, the UAE (2021) changed its federal law to allow remote communication technology in criminal procedures. Second, court staff and justice actors must receive adequate training on new technologies. Court systems are meant to be consistent rather than adaptive to large-scale changes. Thus, preparation and readiness are crucial to reducing the upfront cost of switching to a new set of technical solutions. Finally, as mentioned in Section 3.2, national governments and institutions should be engaged as stakeholders to ensure sustained institutional resources, infrastructure, and data transparency.
We consider greater diversity in study sites to be paramount to better research and policymaking. The Middle East and North Africa, with a population of more than 464 million,6 is underrepresented in studies related to justice and the rule of law. Automated technological infrastructure and an institutional culture that favors transparency over opacity would increase data availability in the region, push the frontiers of research, and bring knowledge and innovation to the forefront of justice systems. This would help address the challenge that countries that stand to gain the most from data-driven technologies tend to lack the resources and data infrastructure to take advantage of them (Ramos-Maqueda and Chen 2021). Equipped with resources and interdisciplinary expertise, a variety of actors—including governments, international organizations, and the private sector—may continue to transform the justice system through technology and data-driven interventions.
6
(accessed),
See Population, total - Middle East and North Africa (database), World Bank, Washington, DC
https://data.worldbank.org/indicator/SP.POP. TOTL?end=2020&locations=ZQ&start=1982 111C HAPTER 5: T RANSFORMING J USTICE IN THE M IDDLE E AST AND N ORTH A FRICA THROUGH D ATA A NEW STATE OF MIND: GREATER TRANSPARENCY AND ACCOUNTABILITY IN THE MIDDLE EAST AND NORTH AFRICA PART II: THE LEARNING STATE
References
Aberra, A., and Chemin M. (2021). “Does legal representation increase investment? Evidence from a field experiment in Kenya.” Journal of Development Economics, 150(102612). https://doi.org/10.1016/j.jdeveco.2020.102612
Aboal, D., Noya, N., and Rius A. (2014). “Contract enforcement and investment: A systematic review of the evidence.” World Development, 64, pp. 322–338. https://doi.org/10.1016/j.worlddev.2014.06.002.
Acemoglu, D., Cheema, A., Khwaja, I. A., and Robinson, J. A. (2018). “Trust in state and non-state actors: Evidence from dispute resolution in Pakistan.” Working Paper No. 24611. National Bureau of Economic Research, Cambridge, MA.
Ahsan, R. N. (2013). “Input tariffs, speed of contract enforcement, and the productivity of firms in India.” Journal of International Economics, 90(1), pp. 181–192.
Babic, B., Chen, D. L., Evgeniou, T., and Fayard, A. L. (2020). “A better way to onboard ai understand it as a tool to assist rather than replace people.” Harvard Business Review, 2020(July-August), pp. 2-11.
Bertrand, M., and Crépon B. (2021). “Teaching labor laws: Evidence from a randomized control trial in South Africa.” American Economic Journal: Applied Economics, 13(4), pp. 125–149.
Blattman, C., Hartman, A. C., and Blair, R. A. (2014). “How to promote order and property rights under weak rule of law? An experiment in changing dispute resolution behavior through community education.” American Political Science Review, 108(1), pp. 100–120.
Carrillo, P., Chen, D., Ramos-Maqueda, M., and Silveira, B. 2022. “Information provision and court performance: Experimental evidence from Chile.” Mimeo. Chakraborty, T., Mukherjee, A., Saha, S., and Shukla, D. (2018). “Caste, courts and business.” IZA Discussion Paper No. 15037. Institute of Labor Economics, Bonn, Germany.
Chemin, M. (2009). “The impact of the judiciary on entrepreneurship: Evaluation of Pakistan’s Access to Justice Programme.” Journal of Public Economics, 93(1-2), pp. 114–125. Chemin, M. (2012). “Does the quality of the judiciary shape economic activity? Evidence from a judicial reform in India.” Journal of Law, Economics, and Organization, 28(3), pp. 460–485. Chemin, M., Chen, D., Di Maro, V., Kimalu, P., Mokaya, M., and Ramos-Maqueda, M. (2022). [Forthcoming]. “Data Science for Justice: Evidence from a Randomized Judicial Reform in the Kenyan Judiciary.” World Bank, Washington, DC. https://users.nber.org/~dlchen/papers/Data_Science_for_Justice.pdf
Chen, D. (2020). “Incremental AI.” Mimeo. https://users.nber.org/~dlchen/papers/Incremental_AI.pdf.
Chen, D., Graham, J., Ramos-Maqueda, M., and Singh, S. (2022). “Do judges favor their own ethnicity and gender?” Policy Research Working Paper No. 9956. World Bank, Washington, DC.
Cooke, B., Diop, B. Z., Fishbane, A., Hayes, J., Ouss, A., and Shah, A. (2018). Using behavioral science to improve criminal justice outcomes. ideas 42 and University of Chicago Crime Lab. https://www.ideas42.org/wp-content/ uploads/2018/03/Using-Behavioral-Science-to-Improve-Criminal-Justice-Outcomes.pdf.
Crawford, R., Klein, B., and Alchian, A. (1978). “Vertical integration, appropriable rents, and the competitive contracting process.” Journal of Law and Economics, 21(2), pp. 297–326.
Decker, K. (2022). “MENA justice and rule of law.” Concept Note. World Bank, Washington, DC.
Decker, K., and Ebeid, O. (2019). “MENA rule of law and justice policy note.” World Bank, Washington, DC.
Kaufmann, D., and Kraay, A. (2021). The Worldwide Governance Indicators [Data set]. World Bank. http://info.worldbank. org/governance/wgi/
112 C HAPTER 5: T RANSFORMING J USTICE IN THE M IDDLE E AST AND N ORTH A FRICA THROUGH D ATA MIDDLE EAST AND NORTH AFRICA REGION | ECONOMIC UPDATE OCTOBER 2022
Kleinberg, J., Lakkaraju, H., Leskovec, J., Ludwig, J., and Mullainathan, S. (2018). “Human decisions and machine predictions.” The Quarterly Journal of Economics, 133(1), pp. 237-293.
Kondylis, F., and Stein, M. (2018). “The speed of justice.” Policy Research Working Paper No. 8372. World Bank, Washington, DC.
Laeven, L., and Woodruff, C. (2004). “The quality of the legal system, firm ownership, and firm size.” Policy Research Working Paper No. 3246. World Bank, Washington, DC.
Lichand, G., and Soares, R. R. (2014). “Access to justice and entrepreneurship: Evidence from Brazil’s special civil tribunals.” The Journal of Law and Economics, 57(2), pp. 459–499.
Litschig, S., and Zamboni, Y. (2015). “Judicial presence and rent extraction.” Working Paper No. 796. Barcelona GSE Working Paper Series. Barcelona Graduate School of Economics. https://bse.eu/sites/default/files/working_ paper_pdfs/796.pdf.
Litschig, S., and Zamboni, Y. (2018). “Audit risk and rent extraction: Evidence from a randomized evaluation in Brazil.” Journal of Development Economics, 134, pp. 133–149.
Lührmann, A., Marquardt, K., and Mechkova, V. (2020). “Constraining Governments: New Indices of Vertical, Horizontal, and Diagonal Accountability.” American Political Science Review, 114(3), pp. 811–820.
Malekian, S., and Maher, H. (2021, October 22). What the appointment of 98 female judges to Egypt’s State Council means for women’s rights. ABC News. https://abcnews.go.com/International/appointment-98-female-judgesegypts-state-council-means/story?id=80685728
Mocan, N. H., Samantha, B., and Wim, M. (2018). “Quality of judicial institutions, crimes, misdemeanors, and dishonesty.” Working Paper No. 24396. National Bureau of Economic Research, Cambridge, MA. Ramos-Maqueda, M., and Chen, L. D. (2021). “The role of justice in development: The data revolution.” Policy Research Working Paper No. 9720. World Bank, Washington, DC. Rodrik, D. (2000). “Institutions for high-quality growth: What they are and how to acquire them.” Studies in Comparative International Development, 35(3), pp. 3–31. Sadka, J., Seira, E., and Woodruff, C. (2020). “Information and bargaining through agents: Experimental evidence from Mexico’s labor courts.” Working Paper No. 25137. National Bureau of Economic Research, Cambridge, MA. Sandefur, J., and Siddiqi, B. (2013). “Delivering justice to the poor: Theory and experimental evidence from Liberia.” Working Paper. https://haushofer.ne.su.se/ec2303/Lecture%209%20-%20Institutions/Non-required%20 papers/Sandefur_Siddiqi_2015.pdf. Schwab, K. (2019). The global competitiveness report: 2019. World Economic Forum. https://www3.weforum.org/docs/WEF_TheGlobalCompetitivenessReport2019.pdf
Sequeira, S. (2016). “Corruption, trade costs, and gains from tariff liberalization: Evidence from southern Africa.” American Economic Review, 106(10), pp. 3029–3063. Shvets, J. (2013). “Judicial institutions and firms’ external finance: Evidence from Russia.” The Journal of Law, Economics, and Organization, 29(4), pp. 735–764.
Sviatschi, M. M., and Trako, I. (2021). “Gender violence, enforcement, and human capital: Evidence from Women’s Justice Centers in Peru.” Policy Research Working Paper No. 9624. World Bank, Washington, DC.
UAE (United Arab Emirates Government). n.d. Digital justice. The official portal of the UAE Government. https://u.ae/en/ about-the-uae/digital-uae/digital-justice.
UAE (United Arab Emirates Government). (2021). Virtual litigation. The official portal of the UAE Government. https://u. ae/en/information-and-services/justice-safety-and-the-law/litigation-procedures/virtual-litigation.
Varieties of Democracy. (2022). The V-Dem Dataset (Version 12) [Data set]. https://v-dem.net/vdemds.html.
113C HAPTER 5: T RANSFORMING J USTICE IN THE M IDDLE E AST AND N ORTH A FRICA THROUGH D ATA A NEW STATE OF MIND: GREATER TRANSPARENCY AND ACCOUNTABILITY IN THE MIDDLE EAST AND NORTH AFRICA PART II: THE LEARNING STATE
World Bank. (2018). Women, business, and the law 2018. https://wbl.worldbank.org/content/dam/sites/wbl/ documents/2021/02/WBL2018_ENG_v2.pdf.
World Bank. (2020). Digital Government/GovTech Systems and Services Dataset. [Data set]. https://datacatalog. worldbank.org/search/dataset/0037889/GovTech-Dataset
World Bank. (2021). Egypt economic monitor: The far-reaching impact of government digitization. https://documents1. worldbank.org/curated/en/754121644245654929/pdf/Egypt-Economic-Monitor-December-2021-The-FarReaching-Impact-of-Government-Digitalization.pdf.
World Justice Project. (2019). Measuring the Justice Gap. World Bank. https://worldjusticeproject.org/sites/default/files/ documents/WJP_Measuring%20the%20Justice%20Gap_final_20Jun2019.pdf.
114 C HAPTER 5: T RANSFORMING J USTICE IN THE M IDDLE E AST AND N ORTH A FRICA THROUGH D ATA MIDDLE EAST AND NORTH AFRICA REGION | ECONOMIC UPDATE OCTOBER 2022
Chapter 6: Playing Catch-up: Education Governance in the Middle East and North Africa Region by Robert Prouty
1. Introduction
At first glance, the development of the education sector in the MENA Region over the past half-century appears to be a remarkable success story. Between 1970 and 2010, the average number of years that children remain in school increased at a faster rate than in any other region.1 The Gross Enrolment Ratio for primary schooling rose from 72 percent in 1970 to 104 percent in 20192, with even greater gains for girls, who saw an increase from 55 percent to 103 percent. Most MENA countries are now at or near universal primary enrolments, with Djibouti, Syria, Jordan and Yemen as the exceptions, although each of these has also shown significant gains. A similar pattern holds for secondary education as well, where gross enrolment ratios increased from only 27 percent in 1970 to 82 percent by 2019. The secondary school gross enrolment ratio for girls increased by 62 percentage points over this same period, from 18 percent in 1970 to 80 percent in 2019. MENA countries also have lower average class sizes than comparator countries (17 students per classroom compared to a global average of 24) and until the mid-2010’s showed the highest rate of public spending on education among all developing countries3.
Yet these positive gains mask a host of challenges. MENA countries show weak results on international assessments of learning. Private and social returns to education in the region are among the lowest in the world. Five of the six countries in the region that participated in the 2018 Programme for International Student Assessment (PISA), scored in the bottom one-third among the 79 participating countries and the other scored only marginally better. The ten MENA countries participating in the 2016 Progress in International Reading Literacy Study (PIRLS) all ranked among the lowest 25 percent among 50 participating countries. All 11 MENA countries that participated in the 2019 Trends in International Mathematics and Science Study (TIMSS) similarly scored in the bottom 25 percent of the 64 participating countries. A recent report (World Bank, 2022) estimated that across countries of the Middle East and North Africa (MENA), 63 percent of children are in learning poverty—they cannot read and understand an age-appropriate text by age 10—and the number is projected to have increased further because of the school closures of the past two years.
This chapter argues that the underperformance of the education sector throughout the MENA region can be attributed in part to a failure of governance and a lack of accountability for results. The unique nature of the education sector makes governance a particular challenge. This is a sector where 80 percent (and often more) of the budget goes for salaries, leaving a very small margin for other expenditures. This means that improvements in workforce performance through careful attention to governance are a pre-requisite for better results.
The three main components of education governance considered in this chapter are i) setting standards, (ii) assessing progress, and (iii) ensuring accountability. MENA countries have generally done well at setting standards, although there is often a lack of clarity around specific, quantifiable goals. Most MENA countries also have a relatively well-developed assessment system although these tend to focus on high-stakes assessment rather than on formative approaches and there is limited capacity to use assessment for informing policy. Of greater concern, examples abound throughout the region showing that accountability has been widely neglected: mechanisms for communicating results are weak; there is little ability to harness data in order to identify needed action or to identify and support those who should follow up on needed actions, and follow-through implementation lacks systematic political support.
1
for instance, World Bank (2015). See also Narayan et al (2018).
2 UNESCO Institute for Statistics. Data as of September 2021.
3 Iqbal and Kiendrebeogo (2015).
See
116 C HAPTER 6: P LAYING C ATCH UP : E DUCATION G OVERNANCE IN THE M IDDLE E AST AND N ORTH A FRICA R EGION MIDDLE EAST AND NORTH AFRICA REGION | ECONOMIC UPDATE OCTOBER 2022
The MENA region has a wide range of socio-economic contexts, from the high-income Gulf states to low-income countries and those that have been enduring long-term humanitarian crises. There are wide disparities in spending on education in the region. In 2021, Saudi Arabia spent almost 19 percent of its budget on education, while Kuwait was spending around 12 percent and Bahrain and Qatar, under 9 percent4. There are also major socioeconomic disparities within countries, and political unrest that has contributed to the largest displacement and refugee crisis since World War II. About one in five children in MENA is in need of humanitarian assistance, and more than 12 million children in the region are internally displaced or refugees5. Many of these children are not in school.
Jordan typifies the paradoxes built into many education systems across the MENA region. It is very close to achieving universal primary school enrollment and has a remarkably high completion rate for secondary schooling (90 percent) that is on par with, or ahead of, many OECD countries6. It has achieved these levels despite immense pressures on the education system from the presence of large numbers of refugee children. Jordan has also shown intermittent signs of learning progress. Between 1997 and 2007, it showed greater gains on the Trends in International Mathematics and Science Study (TIMSS) science test than any other participating country, albeit from a very low base.7 Yet Jordan’s 2011 and 2015 TIMSS results were very disappointing, with the country again scoring in the bottom tier of countries for both science and mathematics, before rebounding modestly in 2019. This low level of learning achievement comes despite expenditures on education that rival OECD countries as a share of total government expenditure.
Throughout the world, increases in educational attainment are almost invariably a precursor to increases in both economic development and personal income. This is emphatically not the case in MENA where both the private and social returns to education are among the lowest in the world (Rizk, 2019; Psacharopoulos and Patrinos, 2018), almost certainly due in large part to the large number of children who remain in learning poverty. More education does not translate easily into more jobs in MENA, and it has less impact than anticipated on citizenship measures such as overall civic engagement and participation in community issues.
So, what is going on in MENA, and how can it begin to catch up with the result of the world? Why has it not been able to convert its success in recruiting teachers, building schools, and increasing the number of children in school, into gains into learning gains? What would it take for its investments in the education sector to produce tangible results in terms of learning outcomes and greater economic mobility for its citizens? How can MENA countries move onto a new growth trajectory, one in which the education sector makes a far greater contribution to economic growth and overall stability?
Definition of Terms
Education governance means how the education sector gets things done. It can be examined from a structural perspective, i.e., what are the institutions that are responsible for education delivery; what mechanisms may be brought to bear for achieving sectoral goals? It can also be examined from a procedural perspective, i.e., what is the process by which policies are established and implemented? Who gets a seat at the table and who is left out? How are decisions taken? Who is responsible for following up on decisions? How is compliance determined and enforced? What strategies are available for shaping choices and influencing the course of action?
4 World Bank (2022). https://data.worldbank.org/indicator/SE.xPD.TOTL.GB.ZS; latest available data are cited: Saudi Arabia and Qatar (2021), Kuwait (2020), and Bahrain (2019).
5 UNICEF (2020).
6 World Bank (2016).
7 Mullis et al. (2020).
117C HAPTER 6: P LAYING C ATCH UP : E DUCATION G OVERNANCE IN THE M IDDLE E AST AND N ORTH A FRICA R EGION A NEW STATE OF MIND: GREATER TRANSPARENCY AND ACCOUNTABILITY IN THE MIDDLE EAST AND NORTH AFRICA PART II: THE LEARNING STATE
In this chapter, we will focus on governance as it relates to the learning objectives within the sector, although other goals such as students’ safety and wellbeing are also important. We will look at each of the three aspects of education governance, with particular attention to accountability frameworks: how expectations and strategic directions are set and communicated, how roles and responsibilities for reaching those expectations are distributed, and how key actors and institutions are held responsible or accountable for improving student achievement.
Accountability will generally be used in this chapter to refer to the various processes and policies that are established to assign responsibility for achieving goals in terms of learning outcomes. Within the MENA region, this includes a range of mechanisms such as supervisory cadres and inspectorate systems, results-based monitoring and evaluation and local/ school management committees. Each of these mechanisms is intended to provide rewards or sanctions, depending on performance; in practice, however, few countries in the MENA region have effective follow through. We will also explore the implications of ‘reciprocal accountability’ Elmore (2006). This is an acknowledgement that accountability is best understood as a two-way street: the accountability of school personnel to achieve specified results must be matched by the accountability of district or central government officials to provide the means/resources to achieve those results.
Transparency is the timely sharing of information about each of the three steps in governance: how objectives are chosen and how standards are set, how learning outcomes are measured, and how well institutions and individuals perform in support of better learning outcomes. Its purpose is to ensure that the education system is accountable to its stakeholders, including students and their parents.
Quality assurance in education means to review the extent to which the provision of education services is achieving its goals of quality, equity and efficiency. Its primary purpose is to ensure that the conditions for achieving learning objectives are in place; it also serves as an important mechanism for ensuring transparency.
Corruption in the education sector may be defined as any dishonest behavior that seeks personal gain at the expense of children’s learning and overall well-being. The opposite of corruption is education governance that operates on the basis of merit to give children equal opportunities in life. Corruption may involve a wide range of activities including the misuse of funds, interference with teacher recruitment and deployment, and the withholding of grades in order to receive personal benefit. Corruption may occur at different administrative levels, including within ministries, districts and schools. It often results in resources being channeled from schools in need to those that are already privileged. Anticorruption efforts are a part of good governance.
2. Principles of accountability and quality assurance within the education sector
Good governance within the education sector does not happen by chance. Nor does it happen in a vacuum. It cannot be willed into existence by donors or even by Ministers of Finance or Ministers of Education. It requires a supportive environment and must follow clear principles of planning and implementation, with a shared sense of purpose. Yet it is not a creature of myth. There are many examples of good governance within the sector, both globally and within the MENA region, that with thoughtful adjustments for differences in context and capacity, can be drawn upon to underpin efforts within MENA countries to establish stronger governance mechanisms.
118 C HAPTER 6: P LAYING C ATCH UP : E DUCATION G OVERNANCE IN THE M IDDLE E AST AND N ORTH A FRICA R EGION MIDDLE EAST AND NORTH AFRICA REGION | ECONOMIC UPDATE OCTOBER 2022
Setting Standards in the Education Sector
Setting standards means to establish easily understood, measurable goals for teaching and learning8. This should be done on an evidence-based approach, taking into account existing levels of learning and teacher competencies. Goals should be developed through a participative process, widely communicated to all teachers and other sectoral personnel, and used as the basis for decision-making, resource allocation, and personnel management. Within education systems, curriculum standards must be set for each grade level to define the skills and knowledge each child is expected to acquire at that level. Standards are not the same as the curriculum, but they establish the basis on which the curriculum is developed, and they inform instruction.
A recent World Bank publication (Gregory et al., 2021) about Arabic language learning stresses the need for education systems to develop explicit statements of intended learning outcomes. The report calls for “specific, quantifiable goals for children’s Arabic language learning outcomes in the short and long term”. It also calls for the development of detailed standards for reading progression. This is presented as a way ‘to assist MENA countries in their efforts to eliminate learning poverty—and to help children move from “learning to read” to "reading to learn". The report acknowledges that each country in the region would need its own national dialogue for this purpose. It calls for countries to develop specific, quantifiable goals for children’s Arabic language learning outcomes, to set detailed standards for reading progression based on the science of learning to read, to add classroom experience and effective planning to pre- and in-service Arabic language teacher education programs, to ensure that every school has a robust early grade Arabic instructional program with sufficient time allocated, aligned school leader responsibilities, and support for teachers, and to identify, monitor and support struggling readers.
A growing number of countries have demonstrated a willingness and a capacity to develop strong evidence-based standards, and there are many examples of good practice. The Teacher Improvement Project supported by the World Bank in West Bank and Gaza saw the development of the first teacher competency-based index in the MENA region, referred to as the Palestinian Teacher Professional Development Index. It aimed to promote a culture of good teacher performance and has since been used as a model by other countries in the region and elsewhere.
The Second Lebanon Education Development Project established a national competency framework, setting the professional standards for educators that was to underpin the curriculum for pre-service teacher training. Egypt is another example of thoughtful design of standards as it established transparent criteria for teacher promotion and for the merit-based selection of school principals. It is also one of several countries in the region to have developed an evidence-based curriculum framework. Lebanon, UAE and West Bank and Gaza have developed clear frameworks for school accreditation and one is under preparation in Saudi Arabia.
Ten MENA countries took part in the Systems Approach for Better Education Results (SABER) Teacher Survey. Of these, 8 were rated as “established” or above regarding their ability to communicate effectively to teachers what students should learn (World Bank, 2019a). Nonetheless, the goals were not always stated with sufficient clarity to be immediately useful for accountability purposes and not all teachers may have fully assimilated the goals. Indeed, many countries continue to take the textbook as the de facto definition of the curriculum and of standards rather than develop standards as the
8 Education systems will also need to establish standards for infrastructure, teaching and learning materials, etc. This chapter focuses on curriculum standards and teacher competencies as core elements of accountability for learning.
119C HAPTER 6: P LAYING C ATCH UP : E DUCATION G OVERNANCE IN THE M IDDLE E AST AND N ORTH A FRICA R EGION A NEW STATE OF MIND: GREATER TRANSPARENCY AND ACCOUNTABILITY IN THE MIDDLE EAST AND NORTH AFRICA PART II: THE LEARNING STATE
basis for establishing the curriculum. Djibouti’s Education Sector Plan (2010–2019), for instance, called for all students to “learn at least 75 percent of the skills defined by the language, mathematics, science, and life skills curriculum”.9
As important as it is to establish curriculum standards, the process is not without its risks in terms of governance. An over-emphasis on a narrow set of standards may make it difficult to hold schools accountable for addressing students’ individual needs, a particular concern for at-risk or otherwise vulnerable students. Curriculum standards that are set at too high a level are like a carrot dangled out of a donkey’s reach—if noticed at all, they will lead to frustration. More likely, they will simply be ignored.
A further challenge to curriculum innovation in the MENA region is the lack of continuity. A study of curriculum reform efforts in Jordan and the UAE10 found frustration with constant reshuffling and restarting of review processes, and insufficient attention to actual implementation, teacher training and implementation. Indeed, few countries have been able to move consistently from adoption of curriculum standards to changes in instructional practice, development of appropriate teaching and learning materials, and updating of assessment practices.
Assessing Progress in the Education Sector
Monitoring and evaluation systems are intended to inform efforts to improve student achievement by providing information to students, parents, teachers and administrators about progress toward standards-based goals. Various forms of testing are used throughout MENA for this purpose, including both summative and formative evaluations.
Qatar was the first country in the region to implement a truly standards-based assessment starting as far back as 2002 with support from the Rand corporation. The system that was developed over the next 5 years had many features that could be considered best practice: results were communicated to stakeholders in a transparent fashion, test items were clearly linked to the curriculum, test items assessed higher-order learning skills and problem-solving skills and critical thinking.11 The Qatar Student Assessment System (QSAS) was first implemented in the experimental schools known as Independent Schools. It was intended to be implemented in all government-supported schools and private Arabic schools, but when this decision was reversed in the face of considerable pushback, much of its value as a tool for accountability was lost. The Independent Schools reform was eventually curtailed as it ran into political pushback, but it nonetheless demonstrated for the first time in the region the potential value added of a world class assessment system.
Unlike in most OECD countries, evaluation and assessment systems in MENA generally focus only on students, and not on teachers and school leaders (OECD, 2013). Nonetheless, a number of countries in the region have undertaken initial efforts to increase their capacity to conduct school assessments and assessments of school leadership. Many of these efforts are nascent, or limited in scope. The UAE (Dubai) publishes the results of its annual inspection of private schools through Dubai’s Knowledge and Human Development Authority (KHDA).12 Similar programs are being implemented in Bahrain, Kuwait, Qatar and Saudi Arabia.13 Saudi Arabia conducts an evaluation of school principals but it is widely seen
9 This is hardly surprising. The Millennium Development Goals of 2000 simply called for children to receive ‘a full course of primary education’. It wasn’t until agreement on the Sustainable Development Goals in 2015 that clear targets for learning were established, and the education sector globally can be seen as having taken an important step in support of meaningful governance.
10 al-Dakkak (2011).
11 Gonzalez et al., (2009).
12 https://www.edarabia.com/khda-school-ratings-dubai
13 https://www.educationdevelopmenttrust.com/our-research-and-insights/commentary/using-evaluation-and-accountability-as-tools-for-s
120 C HAPTER 6: P LAYING C ATCH UP : E DUCATION G OVERNANCE IN THE M IDDLE E AST AND N ORTH A FRICA R EGION MIDDLE EAST AND NORTH AFRICA REGION | ECONOMIC UPDATE OCTOBER 2022
as ineffective, partially due to a lack of clear performance expectations.14 The lack of effective programs to evaluate the role of school leaders in the region is a significant hindrance to effective governance.
Most MENA countries rely on high-stakes assessments to measure student progress. A sample of school-leaving tests from Egypt, Iran, Jordan, Lebanon, Morocco, and Tunisia found heavy reliance on traditional content and memorization (Valverde, 2005). Such assessments create high pressure on students, while doing little to measure progress toward learning goals. In Egypt, a culture of testing includes a battery of exams at the end of grade 6 and the thanawiyya ‘amma, a secondary school-leaving exam that tests students on a battery of subjects.15 These tests, whose many critics see them as adding little value to the education system and steering university entrants into subject areas for which they may have little interest, are currently the subject of review as the ministry considers other options that would support development of problem-solving capacity and encourage creativity.
Several pilots are ongoing as countries consider alternatives to traditional pen-and-paper exams. Lebanon has conducted studies on the use of a task-based assessment to identify students for gifted education programs (Sarouphim 2015), although this brings its own challenges in that many countries in the region provide significant support for highly capable students while overlooking students not achieving minimum proficiency. Oman has revised grading systems to combine scores from written tests with classroom-based assessment tasks (World Bank 2013). A new World Banksupported project in West Bank and Gaza aims to reduce the high stakes of the end-of-secondary Tawjihi exam and to support measurement of more higher-order thinking skills and fewer recall and knowledge-based questions. It would include introduction of school-based assessments. Saudi Arabia has already replaced its Tawjihi exam with school-based assessment.
This is part of a growing world-wide trend as education systems around the world look for approaches to assessment that can promote goals around deeper learning and more complex skills development (Darling-Hammond 2017; Guha et al. 2018).
The use of international assessments of student achievement has grown rapidly in the region. They have the advantage of providing international points of comparison, as well as detailed within-country analysis that can show who is learning and who is not, helping to target policy responses. However, they also have the disadvantage that they are not specifically targeted to country-specific standards and objectives. In 1995, the Islamic Republic of Iran and Kuwait were the only countries in the region to participate in TIMSS; 11 MENA countries participated in 2019. No MENA countries participated in the first round of PISA in 2000, and only Tunisia participated in the second round in 2003. But this has changed rapidly: six MENA countries participated in PISA 2018 and seven are expected to participate in PISA 2022. The results from these assessments have stimulated widespread discussions across the region. Indeed, Breakspear (2012) found that ‘PISA results have had an influence on policy reform in the majority of the participating countries/economies’. Several countries in the MENA region, including Saudi Arabia and Morocco, have responded in part by creating independent education evaluation units.
14 Alajlan (2018). 15 Muasher and Brown, 2022. 121C HAPTER 6: P LAYING C ATCH UP : E DUCATION G OVERNANCE IN THE M IDDLE E AST AND N ORTH A FRICA R EGION A NEW STATE OF MIND: GREATER TRANSPARENCY AND ACCOUNTABILITY IN THE MIDDLE EAST AND NORTH AFRICA PART II: THE LEARNING STATE
Ensuring Accountability in the Education Sector
Accountability is the expectation of action. If standards tell what students should achieve, and assessments tell whether they’re achieving it, accountability tells how to keep it happening if they are, and what to do if they’re not. MENA countries are improving their ability to set evidence-based standards. They are investing in internal and external assessments of learning. But accountability systems are widely overlooked and, indeed, are rarely thought of as a system.
Accountability systems must accomplish three tasks. First, they must ensure that all stakeholders understand whether learning goals are being met. This means that stakeholders must both understand the goals and receive regular information about progress toward those goals. Second, accountability systems must identify the actions needed to improve student learning, and the role of each stakeholder in achieving these actions. This will require systematic stakeholder reviews in response to information about learning progress. Third, accountability systems must ensure that the needed actions are, in fact, undertaken, that stakeholders carry out their identified roles, and that actions inconsistent with student learning are corrected or prevented. The failure to take action may be a result of a lack of capacity—when individuals don’t have the skills to support student learning. It may reflect a failure to communicate—individuals may not understand the roles they are expected to play. It may also be a result of corruption, when individual or group interests are placed before student interests, hindering learning and student wellbeing. In the first case, accountability systems should determine whether training and other forms of support are likely to correct the lack of capacity. In the second case, they may also identify training and other forms of support to develop an appropriate flow of communications. And in the third case, accountability systems should identify appropriate sanctions or punishments needed to protect student interests and appropriate incentives to encourage rules-based behavior. Each accountability task places a premium on transparency, good communication and political will.
Ì Accountability Step 1: Communicating Progress Toward Goals
UNICEF’s Data Must Speak program, for example, is active in 13 countries, though none within the MENA region. It provides information to communities about student performance factors and their school’s access to resources as a way to improve accountability within education systems. The core principle is that by providing information to school districts, schools and parents, these stakeholders will be empowered and better able to influence decisions that affect their children’s schooling, including teacher quality and resource allocation.
Four MENA countries (Morocco, Jordan, Kuwait, Dubai/UAE) have developed school accountability initiatives in the form of school reports that address school performance. These reports are made public in Dubai and Jordan while in Kuwait, they are only provided to local stakeholders such as school principals and vice-principals. Morocco has used the report cards to support social accountability. The approach appears to have strengthened school-based management and the participation of parents and communities in school life. In Dubai, there is evidence that the school accountability initiative has led to better performing schools16.
As of this writing, Saudi Arabia was scheduled to conduct its first nationwide assessment of student learning aimed at supporting decision-making and encouraging “competition among schools, education offices and directorates, as well as giving accurate measurements of some key performance indicators for the human capacity development program, which
16 World Bank (2016). 122 C HAPTER 6: P LAYING C ATCH UP : E DUCATION G OVERNANCE IN THE M IDDLE E AST AND N ORTH A FRICA R EGION MIDDLE EAST AND NORTH AFRICA REGION | ECONOMIC UPDATE OCTOBER 2022
is part of the Kingdom’s Vision 2030 reform plan.”17 The results of the national tests were to be published on platforms accessible to parents with the goal of providing information to them about the performance of the schools their children attend.
Ì Accountability Step 2: Identifying Actions and Responsibilities to Improve Learning
Quality assurance mechanisms are commonly used to identify actions needed to improve learning and to recognize good practice. The most common form of quality assurance in the MENA region consists of supervisory visits to teachers. According to PISA 2015 analyses, the MENA region has a comparatively strong record in terms of the proportion of students who attend schools where teachers receive supervisory support—ranging from 61 percent in Tunisia to 96 percent in Qatar (OECD 2016). This support, however, focuses on teachers’ progress through the curriculum, not on student learning results. Reports may influence the career paths of teachers and school administrators (World Bank, 2019a), but there is little evidence to show a correlation between supervision visits and student learning. School selfevaluation processes and external school assessments are at early stages of development throughout the region.
Along with identifying the actions needed to improve learning, it is important to assign responsibility for carrying out these actions. The purpose of a stakeholder accountability review is to identify the roles needed to support learning and to see who should play each of these roles. It also provides an opportunity to develop effective communications with stakeholders. There will be two broad groups of stakeholders: those to whom accountability is due (rights-holders) and those who have responsibility for achieving sectoral goals (duty-bearers).
Accountability systems are most effective when the roles and responsibilities of stakeholders are clearly defined and understood. Teachers are responsible for monitoring and assessing students’ progress and for giving parents regular feedback. School leaders are responsible for creating a school environment conducive to learning and for monitoring and empowering teachers to ensure that they are delivering on learning. Policy makers have overall responsibility for providing vision and strategy. They develop, lead, and support the implementation of education policies, develop curricula and standards, introduce national information systems that monitor learning, and allocate resources at the national and regional levels (human, physical, and financial).18
The World Bank has argued that greater citizen engagement can improve outcomes by ‘shortening the route of accountability by establishing robust participatory mechanisms that engage citizens in holding service providers accountable’ (World Development Report, 2003). The logic of this participatory approach is that governments put institutions in place to allow citizens to play an active role in monitoring and sanctioning providers when their performance is unsatisfactory.
Citizen Engagement (CE) can be expected to bring a number of development dividends, and is best fostered at local levels through inclusive processes.19 It contributes to a wide range of development priorities including better poverty targeting, improved service delivery, and increased demand for good governance, among others. CE also provides an opportunity for increased participation during the preparation, implementation, and monitoring and evaluation stages of programs and policy development. In the context of decentralization, CE can help local authorities and service providers to be more responsive.
17 https://www.arabnews.com/node/2097036/saudi-arabia 18 World Bank (2019a). 19 Bousquet et al (2013). 123C HAPTER 6: P LAYING C ATCH UP : E DUCATION G OVERNANCE IN THE M IDDLE E AST AND N ORTH A FRICA R EGION A NEW STATE OF MIND: GREATER TRANSPARENCY AND ACCOUNTABILITY IN THE MIDDLE EAST AND NORTH AFRICA PART II: THE LEARNING STATE
Citizen Engagement to increase accountability to parents and communities has become a prominent trend in several countries in Africa and Asia. This has often taken the form of citizen-led assessments that seek to gather evidence on children's learning outcomes. ASER in India and UWEZO in East Africa have each carried out multiple large-scale assessments under the theory that information about low learning outcomes will promote discussion among stakeholders and create pressures that will lead to improvements in the quality of education service delivery and learning outcomes. These assessments are generally conducted on an annual basis and target acquisition of foundational skills in the early grades. Citizen-led assessments have not yet been adopted within the MENA region.
Critics of the push for social accountability mechanisms in the field of education make the point that the multiplicity of actors in the sector makes it difficult to identify who is responsible for key decisions and that such approaches tend to assume that teachers are the main actors responsible for educational outcomes, without considering other associated factors, such as student characteristics and socio-economic factors (Hevia and Vergara-Lope, 2019). Nonetheless, social accountability approaches have been quite successful in stimulating a dialogue about education outcomes and creating greater transparency around differences across schools and regions.
Ì Accountability Step 3: Actions to Improve Learning
An important function of an accountability system is to follow up on identification of needed improvements with specific actions intended to improve learning: providing rewards or recognition for good performance, and sanctions or support for poor performance. In a well-performing accountability system, additional resources would then be channeled to lowperforming schools, which are required to take action to improve. Typically, if improvements are not achieved within a specified period of time, district level management would be obligated to take additional measures such as evaluating the school’s instructional team and making changes as warranted, upgrading the availability of school materials, etc.
This is consistent with Elmore’s definition of reciprocal accountability—the state has the obligation to provide additional resources; the school has the obligation to use those resources to improve learning outcomes. In simplest terms, reciprocal accountability means that for education system leadership to hold teachers and school directors accountable for improving student learning outcomes, then system leadership has an equal responsibility to ensure that teachers and school directors have the resources and skills to carry out those responsibilities. This means that educational accountability must go hand in hand with the organizational capacity-building that gives teachers and leaders the expertise they need to support high achievement for all students, along with adequate resources.
Yet in virtually every country in MENA, examples abound showing a remarkable lack of accountability at all levels. There is no teacher in the classroom about 10 percent of the time in Morocco, Egypt, Lebanon, Yemen and Tunisia20. Although teachers in Jordan are expected to mark all pages of students’ copybooks, a study found that only one in five teachers actually do so, and 3.4 percent do not mark even a single page. Teachers are expected to provide follow-up support for students who are unable to answer a question, but the same study found that as many as 70 percent of teachers do not do so, and only one in four teachers reported using classroom assessments to inform lesson planning (Rabie et al., 2017).
20 World Bank, 2018. 124 C HAPTER 6: P LAYING C ATCH UP : E DUCATION G OVERNANCE IN THE M IDDLE E AST AND N ORTH A FRICA R EGION MIDDLE EAST AND NORTH AFRICA REGION | ECONOMIC UPDATE OCTOBER 2022
In several MENA countries, teachers hire themselves out to give private lessons for a fee, where they coach students for the test. In the absence of accountability mechanisms, this creates an incentive not to teach thoroughly, and leaves families feeling compelled to spend money to guarantee their children’s success. In a number of MENA countries, inefficiencies abound and repetition rates remain very high. In Lebanon, for instance, repetition rates for primary and secondary education were over 10 percent at the time of appraisal of the Second Education Development Project (World Bank, 2019b).
Efforts to address these challenges have often been stymied by instability within the region. In the case of Lebanon, for instance, the Second Education Development Project targeted a 25 percent reduction in repetition rates. Yet this provision was ultimately dropped in the face of other, more urgent priorities at the time of the Syrian refugee crisis. The Syrian refugee population was close to one-third of Lebanon’s total population. More than 500,000 Syrian students entered the education system in a very short period. The goal of reducing repetition, and generally improving governance and efficiency, was seen as no longer possible given the need to enroll large numbers of Syrian refugee children.
In Egypt, the government goes to great lengths to prevent cheating, deploying police to guard examination papers, which are transported in boxes sealed with wax. However, this has not prevented cheating, as questions and answers have been uploaded on social media and openly discussed. Students have justified their cheating by saying that the exams are too difficult21 .
3. Emerging governance considerations within the MENA region
COVID-19 and Education Governance
The COVID-19 pandemic resulted in unprecedented school closures, reaching over 40 weeks in Saudi Arabia, Syria and Kuwait, with an average of 28 weeks across the region, compared to a worldwide average of 22 weeks. The closures created significant learning loss, as well as unique governance challenges for which MENA countries were generally not well prepared. It led to a series of setbacks as described below, including a widening digital divide. Yet the investments in edtech also created unexpected momentum for improved governance in many countries. They have increased transparency and information-sharing, as most MENA countries created virtual platforms for sharing information with educators and families.
On the negative side, the effects of the COVID-19 school closures and disruptions were felt most acutely by those who were already vulnerable. Across the MENA region, an estimated 40 percent of all students were left without support during the pandemic22. Most of these students, 37 million in number, were already vulnerable and at risk before the pandemic began. In some MENA countries, remote learning initiatives were only available at certain grade levels. In other countries, there were remote learning options but they were unavailable for those who didn’t have the digital devices and internet connections to access them. In Libya, Sudan, Syria and Yemen, for example, less than 35 percent of the population has access to the internet. This pre-existing digital divide resulted in a disproportionate lack of access to remote learning for children in pre-primary and primary school, and for children in rural areas. Fewer than
21 Youssef 2016. 22 Data in this section are drawn from Nannyonjo et al. (2021). 125C HAPTER 6: P LAYING C ATCH UP : E DUCATION G OVERNANCE IN THE M IDDLE E AST AND N ORTH A FRICA R EGION A NEW STATE OF MIND: GREATER TRANSPARENCY AND ACCOUNTABILITY IN THE MIDDLE EAST AND NORTH AFRICA PART II: THE LEARNING STATE
half of the MENA countries supported home-based learning in any way, and most children were cut off from other school-based services such as school feeding (consistently offered only by Saudi Arabia during the pandemic). Even the wealthier countries within the region showed very significant disparities in access to learning based on socioeconomic considerations. In Saudi Arabia23, for instance, while 74 percent of students reported having a computer they could use for school work, only 43 percent of students from the bottom quintile reported having a computer they could use for school work. This gap of 31 percent was almost three times higher than in the OECD , where it was 11 percent.
On the positive side, the investments in edtech have led a number of countries in the region to create or strengthen Learning Management Systems, which are platforms for hosting and tracking online learning content. Oman, the UAE and Qatar removed a ban on the use of VOIP (Voice over Internet Protocol) to facilitate the organization of virtual classes.24 In Morocco, communications firms provided free internet access to students. Virtually all countries in the region have seen improvements in digital data management and information sharing and use within the public sector, providing a platform for improved decision-making and information-sharing information by educators and giving families access to previously unavailable information about learning outcomes in the schools attended by their children.
It is estimated that learning poverty25 in the MENA region will increase from 63 percent to 70 percent (intermediate scenario) as a result of the pandemic closures (against an SDG target of 30 percent by 2030).26 Restoring lost learning, and making progress toward the SDG target will require organization of remedial ‘catch-up’ classes. This presents a number of immediate governance challenges: upgrading EMIS to provide real-time data on learning achievement, recruiting and deploying sufficient teachers for the remedial classes, preparing additional teaching and learning materials, providing in-service training for teachers, engaging with parents to provide home-based support, and allocating sufficient budget resources. At the same time, education systems should be strengthening their resilience (including through technological advances) to prepare for future crises and to address inequalities in access and engagement.
The magnitude of the challenge means that governments will need to give schools the opportunity and the incentive to innovate. Changing approaches to teaching so that lessons are aligned with students’ levels and needs while raising teacher performance by (for example) providing sample scripted lesson plans and training teachers to use them, will be necessary to recover from the learning losses experienced during the pandemic. This is above all a governance challenge that, if addressed effectively, can be turned into an opportunity for long-term improvements in learning outcomes.
Governance in Centralized Contexts
Responsibility for education governance in most MENA countries is highly centralized. This is unlikely to change dramatically in a short- to medium-term perspective, but it does have consequences for student learning that need to be understood and mitigated to the extent possible. A study conducted in the context of PISA 2015 considered student learning outcomes in science when responsibilities for school governance were assigned to the school principal, to teachers, to a governing body, or to regional or national authorities. The conclusions were striking—when the principal was responsible for decisions around resources, curriculum, discipline, assessment and admission, student learning
23 Mann et al. (2020) based on 2018 PISA data.
Khan (2020).
Share of 10-year-olds unable to read.
World Bank (2022).
24
25
26
126 C HAPTER 6: P LAYING C ATCH UP : E DUCATION G OVERNANCE IN THE M IDDLE E AST AND N ORTH A FRICA R EGION MIDDLE EAST AND NORTH AFRICA REGION | ECONOMIC UPDATE OCTOBER 2022
outcomes in science were much higher (see
Roughly similar results were found when teachers were responsible for governance in the areas of curriculum, discipline and assessment. But when direct responsibility for these factors
removed from the school instructional team (principal or teachers), the drop in learning outcomes was dramatic. Learning outcomes were lowest when responsibility for decision-making around resources, curriculum discipline, assessment and admission
authority, as is the case in most MENA countries.
Figure 1. Correlations between the responsibilities for school governance and science performance
ResourcesCurriculumDisciplinarypoliciesAssessmentpoliciesAdmissionspoliciesResourcesCurriculumDisciplinarypoliciesAssessmentpoliciesAdmissionspoliciesResourcesCurriculumDisciplinarypoliciesAssessmentpoliciesAdmissionspoliciesResourcesCurriculumDisciplinarypoliciesAssessmentpoliciesAdmissionspoliciesResourcesCurriculumDisciplinarypoliciesAssessmentpoliciesAdmissionspolicies
Emerging Reform Initiatives
Yousef and others have argued that the MENA Region as a whole has made very little progress in improving governance over the past decade or so. Challenges include a notable lack of accountability mechanisms in most countries and proliferating conflicts. Some ambitious efforts at education governance reform in the region have foundered. Kuwait’s National Learning Standards Project, launched in 2010 with World Bank support, was largely abandoned after several years due in part to a lack of capacity on the part of educational institutions to manage the complex reform process.27 In Tunisia, in the aftermath of the revolution, a large number of NGOS have emerged within the education sector, advocating and working toward a wide range of education goals from good governance to inclusive education, but there has been little progress in strengthening decentralization or administrative decision-making processes.28
Yet there are also promising developments within the education sector that point to a renewed effort to improve education governance. A major reform of teacher management in Saudi Arabia, just underway, will adopt a decentralized approach, with a focus on team learning. A new school evaluation framework will establish for the first time clear national standards for schooling and procedures for external and self-evaluations of schools.29 Morocco has implemented a set of reforms including a transparent, competitive process for teacher recruitment that has already resulted in a significant upgrading of the qualifications of teacher candidates. World Bank support to Morocco also seeks to support performance contracts which will help regional and provincial entities set performance targets and improve service delivery.
Alhashem and Alhouti (2021).
della Ragione (2020).
OECD (2020).
Figure 1 below).
was
was assigned to a national
Results based on system-level analyses 0.6 0.4 0.2 0 -0.2 -0.4 -0.6 -0.8 Higher science performance Lower science performance Correlation coe fficient with science performance
School
principal Teachers School governing board Local or regional education authority National education authority Students score lower in science when the school governing board holds more responsibilityfor admissions policies Source: OECD, PISA 2015 Database.
27
28
29
127C HAPTER 6: P LAYING C ATCH UP : E DUCATION G OVERNANCE IN THE M IDDLE E AST AND N ORTH A FRICA R EGION A NEW STATE OF MIND: GREATER TRANSPARENCY AND ACCOUNTABILITY IN THE MIDDLE EAST AND NORTH AFRICA PART II: THE LEARNING STATE
A reform initiative introduced in 2019 in Egypt seeks to refocus the education system on learning rather than credentialing. It introduces changes to student assessments and examinations; enhances the capacity of teachers, education leaders, and supervisors; and supports development of a new curriculum framework. A reform initiative supported by the World Bank in West Bank and Gaza will strengthen the national assessment framework and prepare a reform of the secondary school leaving examination. It will also support participation in two international large-scale assessments to obtain highquality learning data.
4. Conclusion
Education governance in the MENA region is well behind where it is in comparator countries. Playing catch-up will require strong political will, better information, and contributions from a wide range of stakeholders, including teachers and supervisors who often have little say in key decision-making processes, and civil society, whose voice is comparatively weak in the region.
Conclusion 1. Countries in the MENA region have been unable to translate increases in educational coverage and spending into economic development; good education governance is needed to tackle the wide range of factors that contribute to poor learning outcomes. The region has made significant gains in coverage and, with several notable exceptions, spending levels for education remain relatively high. Yet by many measures, the MENA region has had the least success worldwide in translating these achievements into better learning outcomes, a stronger human capital base and ultimately, economic development.
Conclusion 2. A number of MENA countries have shown progress on two of the three dimensions of governance— setting standards and assessing progress—but embedding the standards within the day-to-day functioning of the education system remains a significant challenge. Many countries have established robust mechanisms for setting standards regarding student learning outcomes and teacher qualifications. Many have also significantly improved the measurement of student learning, including through participation in international testing. Yet most countries have not yet developed a shared consensus around teaching and learning, and do not have the institutional capacity for evidence-based analysis and decision-making that is needed to sustain reform processes.
Conclusion 3. MENA countries have shown little progress on the third dimension of governance—improving accountability. Measures of accountability within the region generally show little improvement in recent years. This holds for all three elements of accountability: ensuring that stakeholders understand learning goals, and know whether they are being met; identifying actions to improve learning and assigning responsibility; and effectively ensuring that needed actions are in fact carried out. A number of recent governance reform initiatives hold promise for providing new momentum for these efforts.
Conclusion 4. Weak education governance exacerbates existing socioeconomic disparities in learning outcomes. When governance is weak, the most vulnerable groups will not have full participation. This can further widen disparities across social groups in terms of access to learning. An example is that many countries seeking to expand Early Childhood Development do so in ways that give initial preference to children from the wealthiest families. A further example can be seen in measures to address the COVID-19 pandemic—children from the wealthiest families had disproportionate access to the devices used for distance education.
128 C HAPTER 6: P LAYING C ATCH UP : E DUCATION G OVERNANCE IN THE M IDDLE E AST AND N ORTH A FRICA R EGION MIDDLE EAST AND NORTH AFRICA REGION | ECONOMIC UPDATE OCTOBER 2022
Conclusion 5. The COVID-19 pandemic has resulted in a unique set of governance challenges for MENA countries if they are to restore lost learning and rebuild momentum towards achieving SDG 4. The pandemic resulted in a number of specific challenges on each of the three dimensions of governance. Most countries had no standards for what students should be learning in a distance education context, no way of measuring progress, and no effective means of holding anyone accountable. The pandemic exacerbated existing equity challenges. These challenges were not unique to the MENA region, but they do present unique challenges in that restoring lost learning requires the ability to differentiate and respond to student learning needs in a way that most country assessment systems are not able to accommodate. At the same time, the renewed focus on learning and learning recovery can provide opportunities for countries to try new approaches. Edtech innovations introduced as part of the pandemic response already appear to be stimulating greater support for real-time availability and use of data on student learning. Learning Management Systems that were introduced or strengthened over the course of the pandemic have, in many cases, improved or provided a new way to communicate with teachers, parents, and students, creating new opportunities for the sort of transparency and availability of information that can strengthen overall governance and accountability within the education sector.
Countries in the region will be playing catch-up for some time. But they can accelerate that process by taking concrete steps to put accountability systems in place that have clear standards, good measurement capacity, and rigorous accountability mechanisms. Accountability will itself require that learning goals are communicated and understood, that needed steps for improvement are identified and responsibilities are assigned, and that enforcement mechanisms are put in place. The extent to which agreement is reached on each of these steps, and actions are taken to follow through, will determine ultimate success in catching up or falling further behind.
References
Alajlan, K. (2018). “Evaluation of School Principals: Responses from education leaders in Saudi Arabia.” Simon Fraser University (Canada). http://summit.sfu.ca/item/17983.
al-Dakkak, N. (2011). “Obstacles towards curriculum reform in the Middle East, using Jordan and the UAE as case studies.” Dubai School of Government Policy Brief 28, Dubai, UAE.
Alhashem, F., and Alhouti, I. (2021). “Endless education reform: The case of Kuwait.” In A. W. Wiseman (Ed.), Annual Review of Comparative and International Education 2020 (International Perspectives on Education and Society, 40, pp. 345-367). Emerald Publishing Limited, Bingley. Bousquet, F., Bhatt, N., Yamouri, N., Agarwal, S., Grandvoinnet, H., Thindwa, J., Fall, M., Singh, J., Ahuja, P., and Manroth, A. (2013). Mainstreaming Citizen Engagement in the Middle East and North Africa Region: A Briefing Note. MNA Knowledge and Learning Fast Brief No. 97. World Bank, Washington, DC.
Breakspear, S. (2012). “The Policy Impact of PISA: An Exploration of the Normative Effects of International Benchmarking in School System Performance.” OECD Education Working Papers No. 71. OECD, New York. http://dx.doi. org/10.1787/5k9fdfqffr28-en
Darling-Hammond, L. (2017). “Teacher Education around the World: What Can We Learn from International Practice?” European Journal of Teacher Education, 40(3), pp. 291–309. https://doi.org/10.1080/02619768.2017.13153 99.
della Ragione, T. (2020). “Education Reform in Post-Revolutionary Tunisia: Between Covid-19 and a Divided Civil Society.” Tel Aviv Notes, 14(8). Tel Aviv University, MDC.
129C HAPTER 6: P LAYING C ATCH UP : E DUCATION G OVERNANCE IN THE M IDDLE E AST AND N ORTH A FRICA R EGION A NEW STATE OF MIND: GREATER TRANSPARENCY AND ACCOUNTABILITY IN THE MIDDLE EAST AND NORTH AFRICA PART II: THE LEARNING STATE
Elmore, R. (2006). “Leadership as the Practice of Improvement.” Paper prepared for the International Conference on Perspectives on Leadership for Systemic Improvement, sponsored by the Organization for Economic Cooperation and Development (OECD), July 6, London, UK.
Gonzalez, G. C., Le, V. N., Broer, M., Mariano, L. T., and Froemel, J. E. (2009). Lessons from the Field: Developing and Implementing the Qatar Student Assessment System, 2002-2006. Rand Corporation.
Gregory, L., Taha Thomure, H., Kazem, A., Boni, A., Elsayed, M.A. A., and Taibah, N. (2021). Advancing Arabic Language Teaching and Learning— A Path to Reducing Learning Poverty in the Middle East and North Africa. World Bank, Washington, DC.
Guha, R., Wagner, T., Darling-Hammond, L., Taylor, T., and Curtis, D. (2018). The Promise of Performance Assessments: Innovations in High School Learning and College Admission. Learning Policy Institute, Palo Alto, CA.
Hevia, F. J., and Vergara-Lope, S. (2019). “Educational Accountability or Social Accountability in Education? Similarities, Tensions, and Differences.” Accountability Working Paper No.5.
Iqbal, F., and Kiendrebeogo, Y. (2015). “Public Spending and Education Attainment in the Middle East and North Africa.” Review of Middle East Economics and Finance, 11(2), pp. 99-118. https://doi.org/10.1515/rmeef-2015-0020
Khan, S. (2020). “COVID-19 Impacts on Education in Middle-East and North Africa.” EdTech Review.
Mann, A., Schwabe, M., Fraser, P., Fülöp, G., and Ansah, G. A. (2020). How the COVID-19 Pandemic is Changing Education: A Perspective from Saudi Arabia. OECD, Paris.
Ministry of Education and Higher Education (Palestine). (2018). Palestinian Teacher Professional Development Index: Competency Framework to Support the Professional Development of the Teaching Profession.
Muasher, M., and Brown, N.J. (2022). Engaging Society to Reform Arab Education: From Schooling to Learning. Carnegie Endowment for International Peace.
Mullis, I. V. S., Martin, M. O., Foy, P., Kelly, D. L., and Fishbein, B. (2020). TIMSS 2019 International Results in Mathematics and Science. Retrieved from Boston College, TIMSS & PIRLS International Study Center website: https://timssandpirls.bc.edu/timss2019/international-results/.
Nannyonjo, H., Azevedo, J. P., Akmal, M., Wong, Y. N., Yoshimoto, H., Ligao, M., Menchini, L., Ouedraogo, A., Shimizu, T., and Dalling, E. (2021). COVID-19 Learning Losses: Rebuilding Quality Learning for All in the Middle East and North Africa (English). World Bank Group, Washington, DC.
Narayan, A., Van der Weide, R., Cojocaru, A., Lakner, C., Redaelli, S., Mahler, D. G., Ramasubbaiah, R. G. N., and Thewissen, S. (2018). Fair progress?: Economic mobility across generations around the world. World Bank, Washington, DC.
OECD (Organization for Economic Cooperation and Development). (2013). Synergies for Better Learning: An International Perspective on Evaluation and Assessment. OECD Reviews of Evaluation and Assessment in Education, OECD Publishing, Paris. http://dx.doi.org/10.1787/9789264190658-en.
OECD (Organization for Economic Cooperation and Development). (2016). PISA 2015 Results (Volume II): Policies and Practices for Successful Schools. OECD Publishing, Paris. https://doi.org/10.1787/9789264267510-en.
OECD (Organization for Economic Cooperation and Development). (2020). “Improving school quality through better governance, leadership and support.” In Education in Saudi Arabia. Reviews of National Policies for Education, OECD Publishing, Paris. https://doi.org/10.1787/76df15a2-en
Psacharopoulos, G., and Patrinos, H. A. (2018). “Returns to Investment in Education: A Decennial Review of the Global Literature.” Policy Research Working Paper 8402. World Bank, Washington, DC. https://openknowledge. worldbank.org/handle/10986/29672.
Rabie, T. S., Towfighian, S. N., Clark, C., and Camrnett, M. (2017). The Last Mile to Quality Service Delivery in Jordan. Directions in Development—Human Development. World Bank, Washington, DC.
130 C HAPTER 6: P LAYING C ATCH UP : E DUCATION G OVERNANCE IN THE M IDDLE E AST AND N ORTH A FRICA R EGION MIDDLE EAST AND NORTH AFRICA REGION | ECONOMIC UPDATE OCTOBER 2022
Rizk, R. (2019). “Returns to education in MENA countries: a continuing story of under-achievement.” International Journal of Education Economics and Development, 10(4), pp. 427-448.
Sarouphim, K. M. (2015). “Slowly but Surely: Small Steps toward Establishing Gifted Education Programs in Lebanon.” Journal for the Education of the Gifted, 38(2), pp. 196–211.
UNICEF. (2020). Humanitarian Action for Children in the Middle East and North Africa. https://reliefweb.int/report/ yemen/humanitarian-action-children-middle-east-and-north-africa-2021
Valverde, G. (2005). “Curriculum Policy Seen Through High-Stakes Examinations: Mathematics and Biology in a Selection of School-Leaving Examinations from the Middle East and North Africa”. Peabody Journal of Education, 80(1), pp. 29-55. https://doi.org/10.1207/S15327930pje8001_3.
World Bank. (2003). World Development Report 2004: Making Services Work for Poor People. World Bank, Washington, DC.
World Bank. (2013). Oman Student Assessment: SABER Country Report 2013. Systems Approach for Better Education Results. World Bank, Washington, DC. https://openknowledge.worldbank.org/handle/10986/24481.
World Bank. (2015). “The Rise in Education Attainment in MENA: A Comparative Perspective.” MENA Quick Notes Series, January 2015, No. 139.
World Bank. (2016). Accountability, the Last Mile on the Route to Quality Service Delivery: Evidence from Jordanian Schools and Primary Health Centers. World Bank, Washington, DC. https://openknowledge.worldbank.org/ handle/10986/25407
World Bank. (2018). World Development Report: Learning to Realize Education’s Promise. World Bank, Washington DC. World Bank. (2019a). Expectations and Aspirations: A New Framework for Education in the Middle East and North Africa: Overview. World Bank Group, Washington, DC.
World Bank. (2019b). Implementation Completion and Results Report. Second Education Development Project (Lebanon). World Bank. (2022). The State of Global Learning Poverty. Update. https://www.worldbank.org/en/topic/education/ publication/state-of-global-learning-poverty.
Yousef, T. (2020). “MENA policymakers must launch a new governance reform agenda.” In The Middle East and North Africa over the next decade. Key challenges and policy options, edited by Yousef, T.M., Aboueldahab, N., Abdel Ghafar, A., Zoubir, Y.H., Fathollah-Nejad, A., and Kabbani, N. Brookings Institution, Washington DC. https:// www.brookings.edu/opinions/the-middle-east-and-north-africa-over-the-next-decade-key-challenges-andpolicy-options/.
Youssef, N. (2016, June 19). Leaks of answers before Egypt’s national exams embarrass government. New York Times. https://www.nytimes.com/2016/06/19/world/middleeast/leaks-of-answers-before-egypts-national-examsembarrass-government.html.
131C HAPTER 6: P LAYING C ATCH UP : E DUCATION G OVERNANCE IN THE M IDDLE E AST AND N ORTH A FRICA R EGION A NEW STATE OF MIND: GREATER TRANSPARENCY AND ACCOUNTABILITY IN THE MIDDLE EAST AND NORTH AFRICA PART II: THE LEARNING STATE
Chapter 7: Governance for Jobs in the Middle East and North Africa by Asif M. Islam and Federica Saliola
MIDDLE EAST AND NORTH AFRICA REGION | ECONOMIC UPDATE OCTOBER 2022
1. Introduction
A decade after the first spark of the Arab Spring, large shares of healthy, capable, working-age populations remain excluded from the labor force and from employment altogether in the Middle East and North Africa. Many youth are idle; others are unemployed and underemployed, including among the better educated; women are excluded from economic activity; and informal, hence unprotected, employment is still prevalent. The repercussions of the coronavirus (COVID-19) pandemic have amplified these conditions. Governments in the region must avoid another lost decade for current and future generations and attain the economic potential of a growing, competent, ambitious labor force.
This chapter focuses on the dimensions of governance that are linked to the role of governments as facilitators of the formation, growth, and exit of private firms in the economy through market contestability—the ease of entry and exit and the pressure of potential competition. For countries with abundant labor like the Middle East and North Africa, raising investment and output by competitive firms and increasing their demand for labor is a priority. The chapter argues that most Middle Eastern and North African economies lack market contestability because they have a governance model that is drenched in favoritism, with special interest groups receiving rents because of biased public policy. Particularly in the Middle East and North Africa, politically connected firms, whether privately or state owned, gather sizeable economic rents long after they are finished playing any useful role in encouraging new investments and risk taking. The access to privileges that politically connected firms have deters entry of new firms and inhibits unconnected firms from growing, which slows job creation.
Specifically, this chapter reveals new evidence of governance distortions that the presence of the state in product markets induce, which hinders market contestability. Through new data on product market regulations (PMRs) in the Middle East and North Africa available for the first time, this chapter shows that the region has a much higher prevalence of state-owned enterprises (SOEs) than in comparable middle- and high-income countries. SOEs operate not only in sectors with a natural monopoly or other intractable market failures, but also in sectors where private firms could generate better outcomes (subject, as appropriate, to adequate regulation). The region’s SOEs typically benefit from competition exemptions and extensive state support, and in many countries, government agencies act as regulators and operators, flouting the basic principles of separation of functions and undermining competitive neutrality. At the same time, instead of providing targeted assistance to poor and vulnerable populations, governments continue to control retail prices for some products, subsidizing non-poor populations while potentially undermining firms’ activities and consequently jobs creation in the goods’ industries. In addition, the chapter highlights two areas of complementary regulatory reforms: labor regulations and the gendered laws that treat men and women differently. Reforms in these areas would reshape the relationship between governments and workers.
2. Contestable markets and creation of more and better jobs 1
Contestable markets are those in which there is costless entry and exit of firms and the pressure of potential competition always exists. Contestable markets encourage higher productivity among firms and workers and efficient allocation of resources, which can allow wages to increase and more, better, and inclusive jobs to be created (Amable and Gatti 2001; Blanchard and Giavazzi 2003; Nicoletti and Scarpetta 2003; Spector 2004).
1 This section is based on the literature review presented in Dauda 2020 and in Dauda et al. 2022 (the latter was prepared for the Jobs Undone flagship report). 133C HAPTER 7: G OVERNANCE FOR J OBS IN THE M IDDLE E AST AND N ORTH A FRICA A NEW STATE OF MIND: GREATER TRANSPARENCY AND ACCOUNTABILITY IN THE MIDDLE EAST AND NORTH AFRICA PART II: THE LEARNING STATE
The theoretical and empirical literature identifies three channels through which reforms and policies that boost product market contestability can create more and better jobs. First, competition encourages firms to upgrade their capabilities and innovate to become more efficient, contributing to productive efficiency. Second, it shifts the market toward moreefficient producers, contributing to allocative efficiency. Third, it forces less-efficient firms to exit the market and moreefficient ones to enter and grow, encouraging market selection. There has been ample theoretical and empirical work on these mechanisms in various countries around the world (e.g., Aghion et al. 2005; Cusolito and Maloney 2018; Eslava et al. 2013; Geroski 1990; Jovanovic 1982; Kitzmuller and Licetti 2012; Nickell 1996; Sekkat 2009; Vives 2008).
As firms become more productive, the jobs they create also become more productive. This induces the reallocation of labor toward more productive jobs within firms, across firms, and eventually across sectors (structural change). Lowproductivity firms are pushed out of the market, and high-productivity firms and their jobs remain, inducing productivity growth and structural transformation at the macro level (Amable and Gatti 2001; Blanchard and Giavazzi 2003; Boeri, Nicoletti, and Scarpetta 2000; Ebell and Haefke 2003; Krueger and Pischke 1997; Nicoletti and Scarpetta 2005; Nicoletti et al. 2001; Nickell and Layard 1999; Pissarides 2001). More-productive jobs generally command better wages and are a better source of stable income and decent working conditions, especially as producers transmit some of their productivity gains to their workers.
Competition can indirectly create more and better jobs in two additional ways. The first is when the cost savings from productivity gains are passed on to consumers in the form of lower prices (Dauda 2020). In more-competitive markets, firms are forced to align prices with marginal costs, so prices tend to be lower than they would be in less-competitive markets. Lower prices allow consumers (workers and their families) to spend less of their disposable income on the same products2 and more on other goods and services elsewhere in the economy. This consequent rise in demand can indirectly induce job creation. Second, when firms invest their cost savings to expand their businesses, they increase the supply of goods and services, which ultimately increases their demand for labor. Consequently, competitive pressure can create new pockets of demand. These new pockets could come from an expansion of the market—domestically and abroad. The degree of competition in the domestic market is also a key determinant of international competitiveness (Goodwin and Pierola 2015).
Dynamic, fair competition can also ensure that income-earning opportunities are available to all people, including the poor, youth, women, and other disadvantaged groups. Research suggests that competition reduces the gender wage gap and the level of informality in an economy, which tends to be associated with lower wages (Anand and Khera 2016; Ashenfelter and Hannan 1986; Belfield and Heywood 2006; Charlot, Malherbet, and Terra 2015).
Nevertheless, although dynamic markets are necessary for creation of more and better jobs, it is likely that, in the short term (the transition phase), competition may entail initial job losses as it weeds out low-productivity firms (Bouis et al. 2012; Bouis, Duval, and Eugster 2016). Hence, it is critical that labor market and social protection systems support workers and their families during these transitions to ensure welfare and inclusiveness. In the longer term, new innovative firms, induced by greater competition, may lead to net positive job creation.
2 This depends on the products’ price elasticity of demand. 134 C HAPTER 7: G OVERNANCE FOR J OBS IN THE M IDDLE E AST AND N ORTH A FRICA MIDDLE EAST AND NORTH AFRICA REGION | ECONOMIC UPDATE OCTOBER 2022
3. The Middle East and North Africa’s “sclerotic” private sector
Figure 1. Young firms
younger) as share of all firms
A thriving private sector is the cornerstone of good jobs. Entrepreneurship and innovation can propel economies toward prosperity. Youth are energized as they participate in the private sector, learn valuable skills, and gain a sense of purpose as they become stewards of their own destiny. For far too long, this has not been the case for the Middle East and North Africa. The private sector has been a poor job creator. The growth rate of employment between 2012 and 2019 was only 1 percent per year on average—markedly lower than the 5 percent on average in lower-middle-income peers and 3 percent for upper-middle-income economies. The lack of private sector dynamism also manifests in the small share of young firms in the region, which is lower than in respective income peers. Furthermore, young firms as a share of all firms has fallen between 2012 and 2019 (Figure 1).3 This could be due to low entry of firms, or high exit of young firms as they are unable to stay in the market. The role of young firms as the largest source of jobs has been well documented in advanced economies as well as in the Middle East and North Africa (Adelino, Ma, and Robinson 2017; Gatti et al. 2013; Heyman, Norback, and Persson 2018; Huber, Oberhofer, and Pfaffermayr 2017; Rijkers et al. 2014).
TunisiaLebanon
WestBankandGaza
incomeUpper-middleincome
The challenge is that few firms are engaging in the types of activities that generate jobs. Firms in the region are less likely to invest than their income peers. Only onequarter firms on average invested in physical capital over the last fiscal year. The percentage of firms that invest also fell between 2012 and 2019. Similarly, a smaller share of firms offer formal training in the region than income peers. About 22.8 percent of firms in the Middle East and North Africa provide formal training, far lower than middleincome economies (34 percent). Lack of investment by firms is one factor, but type of investment matters too. Firms that operate in economies with the right structure and incentives are more likely to experiment with new ideas and then implement them. Research and development spending is low in the region. The percentage of firms that spend on research and development is lower than in income peers, and the share of firms that spend on research and development declined between 2012 and 2019.
Using a measure of political connection available for the first time in the World Bank Enterprise Surveys, about 8 percent of firms in the Middle East and North Africa affirmed that the owner, chief executive officer, or top manager (or any board member) had been elected or appointed to a political position in the country (much higher than in middle-income countries peers), with the highest share recorded in Tunisia, with about 28 percent of firms. See section 4 for a detailed discussion.
3 The analysis using cross-sectional data entails several caveats. It is not possible to account for firm entry and exit, so the sample is biased toward firms that have survived. The lack of firm-level panel data that follows firms over time is an impediment to rigorous analysis. The existence of panel data allows for the possibility of capturing firm dynamics across multiple dimensions that provide a clearer picture of the state of the private sector. An illustration is the case of Tunisia, where panel data have been harnessed to produce high-quality empirical work on entry and exit rates and the dynamics of high growth firms (Rijkers, Arouri, Freund, and Nucifora, 2014).
(5 years or
Share of firms 5 years or younger, percent 35 30 25 20 15 10 5 0 Morocco
Jordan
Egypt,ArabRep. MaltaMENA2019Lower-middle
J 2012 J 2019 Source: World Bank Enterprise Surveys. Note: Young firms are defined as those five years old or younger. Income group averages consist of economies surveyed between 2014 and 2019. 135C HAPTER 7: G OVERNANCE FOR J OBS IN THE M IDDLE E AST AND N ORTH A FRICA A NEW STATE OF MIND: GREATER TRANSPARENCY AND ACCOUNTABILITY IN THE MIDDLE EAST AND NORTH AFRICA PART II: THE LEARNING STATE
Finally, the region’s private sector is not gender inclusive. Women are empowered when they attain high-level positions in companies. Recent data on top managerial positions show that on average only 6 percent of firms in the Middle East and North Africa ES economies have a woman top manager. This is less than half the average of low-income economies and less than one-third of the high-income average.
4. Political connections and market contestability
Politically connected firms have access to privileges that deter entry of new firms and inhibit unconnected firms from growing. The number of jobs that politically connected firms create is unlikely to compensate for the larger loss in jobs due to enervated competitive forces. Moreover, the presence of politically connected firms in certain sectors may be indicative that such sectors face barriers to entry given that such firms may self-select into sectors where they can exercise their influence. Furthermore, politically connected firms may be capital intensive given that they have privileged access to credit. Thus, when they grow, they may create fewer jobs as they substitute labor for physical capital.
The degree of political connections in the private sector is high in the region. Approximately 23,000 firms across Central Asia, Europe, the Middle East and North Africa, and Mongolia were asked in the Enterprise Surveys, “Has the owner, CEO, top manager, or any of the board members of this firm ever been elected or appointed to a political position in this country?" This is the first time such a measure of political connection has been taken in a broad range of countries, allowing for cross-country comparisons.
2. Politically connected firms as share of
firms
TunisiaLebanon JordanWestBankandGaza Egypt,ArabRep. Malta MENA2019Lower-middleincomeUpper-middleincome
TunisiaLebanonJordan WestBankandGazaEgypt,ArabRep. Malta
percent of firms in the region responded “yes” to this question, compared with much lower percentages in middle-income countries. The highest share was in Tunisia, with about 28 percent of firms responding “yes,” and the lowest was in Lebanon, with only 1 percent (Figure 2a). Larger firms in the region are more likely to be politically connected (Figure 2b).
Figure
all
a. Share of politically connected firms b. Share of politically connected firms, by firm size Share of all firms, percent Share of all firms, percent 30 25 20 15 10 5 0 Morocco
35 30 25 20 15 10 5 0 Morocco
J SME J Large Source: World Bank Enterprise Surveys. Note: The sample includes firms in Europe and Central Asia, Mongolia, and the Middle East and North Africa surveyed in 2019. The question of political connectivity asks, ”Has the owner, CEO, top manager, or any of the board members of this firm ever been elected or appointed to a political position in this country?” SME = small and medium enterprises. About 8
136 C HAPTER 7: G OVERNANCE FOR J OBS IN THE M IDDLE E AST AND N ORTH A FRICA MIDDLE EAST AND NORTH AFRICA REGION | ECONOMIC UPDATE OCTOBER 2022
At the same time, surveyed firms in Central Asia, Europe, the Middle East and North Africa, and Mongolia that are politically connected are less likely to claim to have too many competitors and more likely to be part of a business organization, use external sources of finance, be part of a business organization, and have access to external finance than the rest of the sample.
Studies of the region have documented that the presence of politically connected firms can decrease job creation. In Egypt, sectors that experienced entry of politically connected firms between 1996 and 2006 had lower aggregate employment growth than sectors that did not. Such politically connected firms enjoyed fiscal and regulatory privileges, including trade protection and energy subsidies, and reduced competition and investment by unconnected firms (Diwan, Keefer, and Schiffbauer 2020). In Lebanon, although data from 2005 to 2010 show that politically connected firms create more jobs than politically unconnected firms, the presence of politically connected firms is correlated with lower aggregate job creation overall. This implies that the lack of contestability that politically connected firms bring hurts unconnected firms such that overall employment growth falls. For every additional politically connected firm in a sector, 9.4 percent fewer net jobs were created (Diwan and Haidar 2020). In Tunisia, using data from 2000 to 2010, politically connected firms abused entry regulation for private gain, reducing competition (Rijkers, Freund, and Nucifora 2017). Politically connected firms were also more likely to avoid paying import tariffs (Rijkers, Baghdadi, and Raballand 2017). In Morocco, sectors with politically connected firms received higher levels of nontariff protection than unconnected sectors (Ruckteschler, Malik, and Eib 2019).
5. Better governance for jobs: Leveling the playing field in the pr oduct market
The high presence of governments through SOEs and politically connected firms can stifle private sector development, especially in markets where competition is viable but SOEs do not compete on a level playing field. There is some indication of a negative correlation between presence of SOEs in various sectors and average growth of labor productivity in private sector firms in countries for which data are available (Islam, Moosa, and Saliola 2022).
Between 2020 and 2021, extensive data were collected and analyzed on key features of PMRs for eight middle- and high-income countries in the Middle East and North Africa for the Jobs Undone report: Egypt, Jordan, Kingdom of Saudi Arabia, Kuwait, Morocco, West Bank and Gaza, Tunisia and the United Arab Emirates (Islam, Moosa, and Saliola 2022). The analysis was built on the methodology of the Organization for Economic Cooperation and Development (OECD)–World Bank Group PMR indicators (OECD n.d.).
The collected data allowed several indicators that capture economywide distortions that the presence of the state in product markets induces to be compared with two sets of comparators: 37 high-income countries and 14 upper middleincome countries included in the 2018 PMR database.4
4 Data used and collected for these comparator countries are based on the Organization for Economic Cooperation and Development (OECD)–World Bank Group 2018 PMR methodology. The following income classification of the World Bank Group is used for comparison: high income (Australia, Austria, Belgium, Canada, Chile, Croatia, Cyprus, Czech Republic, Denmark, Estonia, Finland, France, Germany, Greece, Hungary, Iceland, Ireland, Israel, Italy, Japan, Korea, Latvia, Lithuania, Luxembourg, Malta, Netherlands, New Zealand, Norway, Poland, Portugal, Romania, Slovak Republic, Slovenia, Spain, Sweden, Switzerland, United Kingdom); upper middle income (Albania, Argentina, Brazil, Bulgaria, Colombia, Costa Rica, Indonesia, Kazakhstan, Mexico, Peru, Russia, Serbia, South Africa, Turkey). For Middle Eastern and North African countries, high income consists of Kuwait, Saudi Arabia, and United Arab Emirates; 9pper middle income consists of Egypt, Jordan, Morocco, and Tunisia; and lower middle income consists of the West Bank and Gaza (https://datahelpdesk.worldbank.org/ knowledgebase/articles/906519-world-bank-country-and-lending-groups; (accessed March 1, 2021).
137C HAPTER 7: G OVERNANCE FOR J OBS IN THE M IDDLE E AST AND N ORTH A FRICA A NEW STATE OF MIND: GREATER TRANSPARENCY AND ACCOUNTABILITY IN THE MIDDLE EAST AND NORTH AFRICA PART II: THE LEARNING STATE
Among the areas measured are the scope of SOEs (ownership and control), governance of SOEs, public procurement, government involvement in business operations (price controls), command and control regulations, and simplification and evaluation of regulations that relate to contestability (assessment of impact on competition and complexity of regulatory procedures).5
Results from PMR analysis reveal three factors that weaken the private sector and reduce market contestability for most countries in the Middle East and North Africa. First, state presence through SOEs is visible and significant, even in sectors where there is unclear economic rationale for it. Second, there is little competitive neutrality that would level the playing field between SOEs and their private sector peers. Third, price controls are prevalent and often seen as a pillar of the welfare state, reducing incentives for more productivity and efficiency, whereas mechanisms to assess harm from regulations are limited (Dauda et al. 2022).
(i) State Presence in Product Markets
SOEs in the Middle East and North Africa play a dominant role in many sectors, including those that that the private sector typically serves in other countries around the world. In Egypt, the government controls at least one SOE in all 29 sectors analyzed (Figure 3). The state has at least one SOE in 23 sectors in Saudi Arabia, 22 sectors in the United Arab Emirates, and 18 sectors in Morocco. This is much higher than the average for high-income countries (12) and upper-middle-income countries (15). What is more striking is that, in the Middle Eastern and North African economies examined, there is an unusual SOE presence in subsectors that would benefit from private sector involvement, such as manufacturing, accommodation, trade, and even construction.
Governmental bodies in most Middle Eastern and North African economies analyzed heavily influence SOE decision making. Specialized agencies that are closely linked to the government typically exercise ownership rights. Public authorities, as opposed to the board of directors, as in most high-income countries, often appoint sector regulators and chief executive officers (CEOs). This implies greater control over firm decision making and greater risk of potential conflict of interest. In Egypt, the National Telecommunications Regulatory Authority is under the authority of the Ministry of Communications and Information Technologies, which owns 80 percent of Telecom Egypt. These governance and ownership structures create incentives to favor SOEs over private competitors. The governments of Egypt and Kuwait control the national air carriers, which benefit from preferential treatment in terms of time slots in Egypt and fuel (kerosene) prices in Kuwait.6 A key recommendation is for governments in the region to focus on improving the performance and oversight of SOEs while adopting safeguards to ensure equal treatment with private sector firms where they are present.
5 More details on the PMR data collection methodology can be found in Appendix A. Additional data were collected and analyzed but not presented in this report, including administrative burdens (licensing), barriers in service and network sectors, barriers to trade and investment (barriers to foreign direct investment, tariff barriers, deferential treatment of foreign suppliers, barriers to trade facilitation), sectoral analysis covering the energy sector, e-communication sector (focusing on government involvement in the sector, vertical integration, third-party access and pricing policy), the legal, accounting, engineering, and architectural service sectors (focusing on conduct regulations), and the retail services (focusing on price regulations).
6 In Kuwait, Chapter 25 of the 2020/21 budget stipulates subsidies for public corporations and nonfinancial public corporations, support to locally marketed refined products and liquefied gas, and a fuel subsidy for Kuwait Airways. (MoF 2019). For Egypt, Decree no. 934/2001 stipulates that regular domestic and international flights shall not be operated in the same operating time of Egypt Air.
138 C HAPTER 7: G OVERNANCE FOR J OBS IN THE M IDDLE E AST AND N ORTH A FRICA MIDDLE EAST AND NORTH AFRICA REGION | ECONOMIC UPDATE OCTOBER 2022
Figure 3. State-Owned Enterprises (SOEs) operating in various sectors in the Middle East and North Africa and income peers
Water collection, treatment and supply
Railways - operation of railroad infrastructure
Electricity transmission
Electricity distribution
Air transport - operation of airports
Gas transmission
Operation of terminal facilities - (such asharbors and piers)
Gas distribution
Railways - passenger transport
Electricity generation
Other urban, suburban and interurban passenger transport
Financial service activities, except central banking,insurance and pension fund
Railways - freight transport
E-Communications
Sea, coastal and inland passenger transport
Air transport - international passenger transport
Gas production
Air transport - domestic passenger transport Sea, coastal and inland freight water transport
Gambling and betting activities
Motion picture distribution and projection
Manufacture of fabricated metal products, machinery and equipment
Accomodation, food and beverage service activities
Building and repairing of ships and boats
Manufacture of refined petroleum products
Construction
Manufacture of aircraft and spacecraft Manufacture of motor vehicles and their partsand accessories
Manufacture of chemicals and chemical products
Manufacture of basic metals Manufacture of pharmaceuticals, medicinal chemical and botanical products
Wholesale trade, including of motor vehicles Manufacture of railway and tramway locomotives and rolling stock
Manufacture of computer, electronic and optical products Road Freight Transport
Manufacture of tobacco products
(ii) Lack of Competitive Neutrality
The framework of competitive neutrality can help level the playing field between private enterprises and governmentrun businesses. Competitive neutrality is a principle according to which all enterprises—public or private, domestic or foreign—face the same set of rules. The government’s contact, ownership, or involvement in the marketplace, in practice or in law, should not confer an undue competitive advantage on any actual or potential market participant. Effective
0 0.2 0.4 0.6 0.8 1.0 Natural monopoly Contestable sector Commercial sector Probability of having at least one SOE operating in each subsector, percent J MENA (8) J Upper-middle income (14) J High income (37) Source: Islam, Moosa, and Saliola 2022. Note: In the legend, the numbers in parentheses indicate the number of observations available per income or country group. The flagship team collected data for Middle Eastern and North African countries using the 2018 Organization for Economic Cooperation and Development product market regulation methodology. 139C HAPTER 7: G OVERNANCE FOR J OBS IN THE M IDDLE E AST AND N ORTH A FRICA A NEW STATE OF MIND: GREATER TRANSPARENCY AND ACCOUNTABILITY IN THE MIDDLE EAST AND NORTH AFRICA PART II: THE LEARNING STATE
implementation of this principle is important to decrease the risk of anticompetitive behavior and economic distortions due to participation of SOEs in markets.
Most Middle Eastern and North African economies lag in key components that can help ensure competitive neutrality. They lack the separation (and identification and allocation) of costs related to commercial and noncommercial activities of SOEs. Their SOEs have cumbersome structures. They provide subsidies (and loans) to support provision of public services that give advantages to SOE commercial activities and cause ripple effects for private participants in those markets. They also have regulations that facilitate operation of SOEs such as statutory monopolies, exemptions from competition law, and preferences in public procurement—all of which distort the environment further and affect the ability of private firms to remain competitive and expand.
The closeness of these SOEs to governments results in favoritism and exemptions. In Saudi Arabia, SOEs do not fall within the scope of the application of competition law. Egypt, Kuwait, Tunisia, and the United Arab Emirates all have several exemptions in their competition regulatory frameworks that make things easier for SOEs: targeted exemptions in Egypt and Tunisia based on case-by-case assessments related to market effects;7 exemptions granted to certain categories of SOEs, such those providing utilities in Egypt, Kuwait, and Tunisia; and exemptions for certain sectors altogether, such as telecommunications, financial services, and oil and gas in the United Arab Emirates.8 Bankruptcy laws in Kuwait also exempt SOEs but apply to their peers. These exemptions greatly hinder competitive neutrality, resulting in an uneven playing field between SOEs and their peers in the same sectors and markets.
The fact that many Middle Eastern and North African countries also have agencies that act as regulators and operators further weakens competitive neutrality. SOEs in the Middle East and North Africa operate in all transportation subsectors except in the West Bank and Gaza, and also sometimes hold regulatory powers. In some sectors, SOEs enjoy legal monopolies, as in the case of port operations in Kuwait and air transport in Egypt. SOEs in Morocco manage infrastructure in ports, road transport, and airports (World Bank 2020). For example, the SOE in charge of developing and managing highways also has many roles and responsibilities as owner, administrator, manager, and supplier. The United Arab Emirates has a publicly owned provider for generation, transmission, and distribution of electricity that also sets prices and connection fees.
Procurement policies should be transparent and nondiscriminatory to allow for competitive pressure—foreign and domestic—and not provide any preferences for SOEs. Although public procurement laws in Middle Eastern and North African economies are transparent and base the adjudication of tenders or bids on objective criteria, some exemptions or preferences exist. In Egypt, for example, agency-to-agency contracts remain possible, and Jordanian SOEs have specific tender rules. Moreover, procurement laws include a wide range of provisions to benefit domestic firms that may affect the competitive nature of tenders. For instance, Egypt, Kuwait, Tunisia, and West Bank and Gaza reserve a share of the contract for domestic firms, and most Middle Eastern and North African economies analyzed require domestic content (personnel, goods, or both). Most Middle Eastern and North African countries, except Kuwait and Morocco, also explicitly permit access discrimination in favor of local firms.
7 The latter is the case in Egypt in relation to hard-core cartels, where an exemption can be granted to certain agreements provided that they would achieve economic efficiencies that have a clear benefit to consumers that exceed the effects of reducing competition (Article 6 of the Competition Law no. 3 of 2005), and Tunisia, where the relevant minister may set prices for a time not to exceed 6 months to address market irregularities such as sudden excessive increases or collapses in prices (Articles 2-4 of Law 36 of 2015). 8 Article 4 of Federal Law 4 of 2012. 140 C HAPTER 7: G OVERNANCE FOR J OBS IN THE M IDDLE E AST AND N ORTH A FRICA MIDDLE EAST AND NORTH AFRICA REGION | ECONOMIC UPDATE OCTOBER 2022
Although SOEs are theoretically subject to the same tax system as private companies in Egypt, Jordan, Kuwait, Saudi Arabia, and Tunisia, some exemptions from corporate income taxes persist. In Egypt and Kuwait, unincorporated government operations9—for example, when the state offers services directly through a ministry—are tax exempt. In Morocco, although SOEs are subject to value added tax, some are not subject to corporate tax and may receive parafiscal tax10 revenues.11
The advantages that SOEs reap enjoy being close to the government also appear in the form of preferential access to finance and subsidies. In Egypt, explicit guarantees are provided to some SOEs or the public body engaged in commercial activity.12 In Jordan, the government provides support to the National Electrical Power Company and the Water Authority and has guaranteed corporate bonds since 2011 (U.S. Department of State 2020). In the United Arab Emirates, where debt guarantee is possible for wholly government-owned SOEs,13 some have received capital infusions and preferential treatment from the government, such as the national air carrier, which has benefited from initial capital injections and regular loans on concessional terms (OECD 2012). In Kuwait,14 Morocco,15 and Tunisia,16 the state provides financing to or guarantees SOE debt. In Saudi Arabia, the budget law states that government agencies whose budgets are attached to the state’s general budget can borrow or issue any type of debt instrument with the approval of the Minister of Finance.17 None of the Middle Eastern and North African economies in the study require SOEs to show a positive rate of return— whether calculated in terms of net present value or internal rate of return.18
(iii) Price Controls and Limited Mechanisms to Assess the Negative Impact of Regulations
Retail price controls also remain prevalent in many Middle Eastern and North African economies. For instance, all the economies analyzed control the price of staples (e.g., milk and bread) and liquefied petroleum gas, and almost all control prices of gasoline and medicine (Figure 4). This is far higher than the share upper-middle-income (40 percent) and high-income (10 percent) countries that do so. Although these prices can help secure most needed foods for poor and vulnerable people, they are not targeted to them. Middle Eastern and North African economies have long used these price controls and subsidies as a pillar of the welfare state, especially in the absence of rigorous, targeted social assistance programs for those who need it the most. An upcoming World Bank report on the future of social protection in the region emphasizes the importance of streamlining and targeting support for the poor and vulnerable. Alternatively, Middle Eastern and North African economies do not have as much control over digital operators in the taxi business as upper-middle-income and high-income peers. In Jordan, for example, ridesharing companies are obliged to set prices 15 percent higher than taxis.19
9 Unincorporated operations refer to business undertakings
that are not
10 Parafiscal taxes are essentially the charges that the state levies without necessarily providing
11 Article 6 of the General Tax Code exempts certain SOEs from income tax.
thus lack
include some non-tax fees.
12 According to a 2019 report by the Egyptian Ministry of Finance, subsidies extended to the public sector (including electric subsidies) amounted to Egyptian pounds (LE) 32,178.9 million, loans amounted to LE 73.8 million, and participation in SOEs amounted to LE 2,633.9 million (total LE 34,886.5 million) for fiscal 2018. The report also disclosed the amounts of the guarantees of external loans that the Ministry of Finance has granted and the refinancing and restructuring extended through the Ministry of Finance to SOEs. Ministry of Finance, Financial Relation between SOEs and the Government, available at http://www.mof.gov.eg/MOFGallerySource/Arabic/Financial-Egypt-report2018/Relationship_between_companies_ treasury.pdf (last accessed September 2, 2019).
13 Article 77 of Law 26 of 2019 addresses requirements to issue government guarantees to federal entities, the definition of which does not seem to include SOEs (Article 3), but Article 11 of Law 9 of 2018 regarding public debt includes wholly government-owned SOEs under the definition of government entities for which debt can be guaranteed.
14 See “Kuwait—Competition from State-Owned Enterprises”.
15 The total amount of subsidies paid to Moroccan public entities and enterprises amounted to Moroccan dirham (DH) 30,792 million by the end of 2018, of which 44 percent was for investment (capital
of entities
formed into a legal corporation and
corporate status.
a service. They
and equipment) and 56 percent for operating expenses. Public entities and enterprises of a commercial nature benefited by DH 2,988 million. The transport and energy sector benefited by more than DH 900 million (MoEF 2020). 16 Publicly controlled companies may receive financing guaranteed by the state. The amount of the state guarantee is decided each year as stipulated in Article 9 of 2013 Finance Law. 17 Article Four C, the State Budget 1441-1442 AH (2020). https://www.mof.gov.sa/financialreport/budget2020/Pages/default.aspx 18 For a detailed explanation of net present value and internal rate of return, see the EU Commission: Guide to Cost-Benefit Analysis of Investment Projects, Structural Funds, Cohesion Fund and Instrument for Pre-Accession, 2008. 19 Article 10 of the Regulations on Transportation Services through the Use of Smartphone Applications. 141C HAPTER 7: G OVERNANCE FOR J OBS IN THE M IDDLE E AST AND N ORTH A FRICA A NEW STATE OF MIND: GREATER TRANSPARENCY AND ACCOUNTABILITY IN THE MIDDLE EAST AND NORTH AFRICA PART II: THE LEARNING STATE
and
and income
In addition, systematized regulatory impact assessments have not been adopted, especially regarding competitive effects of regulations and policies. Ninety-five percent of high-income countries and half of upper-middle-income countries have adopted regulatory impact assessment frameworks because they offer a critical filter to evaluate the costs and benefits of new regulations and policies. The impact on competition is a critical aspect to cover in the regulatory impact assessment. Although Morocco and the United Arab Emirates have adopted regulatory impact assessment frameworks,20 no other Middle Eastern and North African country analyzed currently analyzes the competitive impact of regulations. This omission presents higher risks for those economies with no independent agency to advocate for competition, including Jordan, the United Arab Emirates, and West Bank and Gaza.
In summary, the high government presence in the market continues to influence the governance of most Middle Eastern and North African countries, including in economic sectors where the private sector could thrive and where there are no obvious market failures justifying the government’s presence. Through a type of governance that favors SOEs over private competitors, most Middle Eastern and North African countries have fostered an uneven playing field, hindering competition in multiple ways and slowing job creation. Better governance requires promoting corporatization of SOEs and separating costs and revenues of their commercial and noncommercial activities; fostering regulatory neutrality by eliminating exclusions and exceptions from laws applied to private operators, especially competition, procurement, and tax laws; and limiting SOEs’ preferential access to financial and nonfinancial support, including subsidies. Governments should reconsider price controls where possible. Lastly, Middle Eastern and North African countries should enforce effective competition policies through systematized assessment of the potential for negative market impacts of laws and regulations.
Figure 4. Retail price controls and regulations in the Middle East
North Africa
peers Share of economies with price controls/regulations on retail prices, percent Staple goods(e.g. bread,milk,corn) Gasoline All nonprescription medicine A subset of non-prescription medicine Prescription medicine Pre-booked taxi rides Taxi rides hailed in the street Books LPG petroleum(liquifiedgas) 100 90 80 70 60 50 40 30 20 10 0 UAE TUN PSE MAR KWT SAU JOR EGY UAE UAE UAE UAE UAE UAE UAE TUN TUN TUN TUN TUN PSE PSE PSE MARMAR MAR MAR MAR MAR MAR KWTKWT KWTKWT KWT SAU SAU SAU SAU SAU SAU SAU JOR JOR JOR JOR JOR JOR JOR EGY EGY EGY EGY EGY J MENA J High income J Upper-middle income Source: Islam, Moosa, and Saliola 2022. Note: The eight Middle Eastern and North African economies are Egypt (EGY), Jordan (JOR), Kuwait (KWT), Morocco (MAR), Saudi Arabia (SAU), Tunisia (TUN), United Arab Emirates (UAE), and West Bank and Gaza (PSE). The economies shown in the Middle Eastern and North African group have retail price controls.
20 Article 19 of Law No. 13-065 relating to the organization and conduct of government affairs and the legal status of its members. "Twenty-five economies worldwide, including the European Union, the United Arab Emirates and Taiwan (China) measure all of these impacts [spectrum of the impacts covered by regulatory impact assessment]." World Bank Global Indicators of Regulatory Governance: Worldwide Practices of Regulatory Impact Assessments, available at http://documents1.worldbank.org/curated/en/905611520284525814/GlobalIndicators-of-Regulatory-Governance-Worldwide-Practices-of-Regulatory-Impact-Assessments.pdf. The Emirate of Dubai has an established legislative committee to review laws and existing legislation: link 142 C HAPTER 7: G OVERNANCE FOR J OBS IN THE M IDDLE E AST AND N ORTH A FRICA MIDDLE EAST AND NORTH AFRICA REGION | ECONOMIC UPDATE OCTOBER 2022
6. Complementary policy dimensions to reshape the relationship between the government and workers
Two additional policy dimensions can help create a level playing field for private businesses and more and better jobs for workers: labor regulations and related taxes and gendered laws.
(i) Labor Regulations
Some Middle Eastern and North African economies have limiting labor regulations (Islam, Moosa, and Saliola 2022). Several countries have high severance pay; in some middle-income countries, the share of labor taxes in the larger tax obligations of firms and workers is substantial, whereas others have limited the use of fixed-term contracts and the coverage and updating of the minimum wage. Moreover, reforms in labor market regulations have been more limited in the region than in others. Whereas 29 OECD countries have implemented reforms in labor regulations since 2006, only nine the Middle East and North Africa have done so. Meanwhile, some Middle Eastern and North African countries have made labor laws more rigid and more costly for employers. Countries like Bahrain, Kuwait, and Saudi Arabia have added more provisions for redundancy and advance notice requirements. The United Arab Emirates has reduced the duration of the single fixed-term contract from 48 to 24 months.
Strict regulations can unnecessarily reduce labor mobility and increase unemployment and informality. More importantly, they apply to workers who work formally, who are a minority of workers in many countries in the region, especially when considering private sector employment alone. They can also create a significant insider-outsider problem whereby informal workers remain outside the system, unable to influence policy decisions that might affect their chance of obtaining a better job (Lindbeck and Snower 1984).
Instead of focusing on labor regulation restrictions that protect the few, governments in the region should reconsider the role of social protection and active labor market programs. Social protection, which includes noncontributory social assistance and contributory social insurance, can play an important role in transitioning workers and their households out of poverty and into sustainable livelihoods, as well as supporting them in the event of labor market shocks. Such policies have grown in importance as the region has experienced the repercussions of COVID-19, which has affected all workers.
Transforming Middle Eastern and North African economies toward more productive jobs necessitates effective labor market systems that improve human capital and align workers with the shifting patterns of technological change. The 2019 World Development Report emphasizes that an effective, modern system of social protection and labor market institutions requires three coordinated components: an anti-poverty safety net mechanism (with noncontributory social assistance at its core), universal social insurance to manage long term and short-term risks (with significant elements of fiscal financing), and modern labor market institutions that support a dynamic private sector and better jobs (World Bank 2018a).
Compared with this paradigm, the social protection system in the Middle East and North Africa is outdated and insufficient. Before the pandemic, fewer than half of the households in the poorest quintile were estimated to receive some form of social assistance. Spending on social assistance in the region was equivalent to only 1 percent of gross domestic product,
143C HAPTER 7: G OVERNANCE FOR J OBS IN THE M IDDLE E AST AND N ORTH A FRICA A NEW STATE OF MIND: GREATER TRANSPARENCY AND ACCOUNTABILITY IN THE MIDDLE EAST AND NORTH AFRICA PART II: THE LEARNING STATE
lower than the global average of 1.5 percent and lower than all other regions except South Asia (World Bank 2018b). Middle Eastern and North African countries spend little on targeted social assistance and much more on universal and regressive subsidies (mainly for food and fuel), which have sat for many years at the heart of the region’s social contract, although things are starting to change in the face of fiscal constraints and the rise in food prices, with some countries reducing subsidies of electricity and gas (Verme 2016), including some countries in the Gulf Cooperation Council, such as Bahrain and Saudi Arabia, although to a lesser extent.
The COVID-19 pandemic has laid bare the inadequacies of existing social protection systems, triggering a rapid response by many countries. For most countries, including Algeria, Egypt, Iraq, Jordan, Lebanon, Morocco, and Tunisia, this rapid response has been in the form of cash transfers to vulnerable people, mainly households that rely on the informal sector for their livelihoods. Some Gulf Cooperation Council countries have also provided support to vulnerable households (Gentilini et al. 2021), although except for countries where a targeted social assistance system already existed, such as Egypt, Jordan, and Tunisia, much of this support has not been targeted to those most in need. It has also been limited in terms of recipient households or has been temporary. Some countries in the region have provided some support to social insurance contributors (formal workers), such as subsidizing or suspending social insurance contributions for a period of time (e.g., Bahrain, Islamic Republic of Iran, Jordan, Morocco, West Bank and Gaza). Other countries have supported paid sick leave for workers affected by the virus. Nevertheless, these measures have generally been marginal and temporary.
Meanwhile, governments have provided little by way of labor-specific remedies, such as wage support and furloughs, which have been the central COVID-19 policy response in many European and Asian countries. Few Middle Eastern and North African countries have effective unemployment insurance and unemployment assistance systems, so there was little to support workers who were laid off or whose paid working hours were reduced. In 2020, only nine countries in the region had an unemployment insurance scheme at all, and only four had noncontributory unemployment assistance programs, mostly targeted to new graduates or new labor market entrants.
Well-designed programs can improve labor market outcomes, particularly in the long term (Romero and Kuddo 2019), but active labor market policies were limited in the Middle East and North Africa before the pandemic, meaning that programs such as wage subsidies could not be quickly deployed. Only two countries in the region—Egypt and Tunisia— offer a full set of employment services. Although many economies have some vacancy databases and some job placement services and training programs, there is little evidence of their impact. Moreover, other key services that are crucial for labor market entrants, such as counseling, apprenticeship and internship programs, and support for geographic mobility that ease work transitions, are uncommon. The region has ample scope to improve the quality and quantity of active labor market policies.
As Middle Eastern and North African countries consider options for reshaping the relationship between governments and workers, there is ample scope to modernize labor regulations while strengthening social protection and labor market support systems. Areas for labor regulatory reform include moving from severance pay to unemployment insurance as the central way to protect workers who have lost their jobs, making it easier for workers and employers to agree on fixedterm contracts, reducing labor taxes, and adopting and enforcing realistic minimum wages. This suite of reforms would help increase labor market dynamism, facilitate private sector job creation, and support workers’ transitions between jobs.
144 C HAPTER 7: G OVERNANCE FOR J OBS IN THE M IDDLE E AST AND N ORTH A FRICA MIDDLE EAST AND NORTH AFRICA REGION | ECONOMIC UPDATE OCTOBER 2022
Because these reforms can also come at a cost to workers, three key reforms are needed to improve the social protection system. First, social assistance to the poor in general needs to be improved to include more coverage, better targeting, and sufficient payment. Second, more and better support is needed for informal workers, including expanding contributory social insurance coverage with innovative saving schemes.21 Third, well-designed, well-targeted, well-evaluated labor market programs must be established to build human capital and facilitate labor market transitions, especially for the young.
(ii) Gendered Laws and Regulations
Women's labor force participation in the Middle East and North Africa is the lowest in the world, averaging about 20 percent in 2019. Younger women, who are better educated than older women, have a greater aptitude for work, yet despite some improvements, the region’s private sector is not gender inclusive. Only 6 percent of firms in the Middle Eastern and North African economies surveyed in the World Bank Enterprise Survey have a top female manager, compared with an average of 23 percent for lower-middle-income countries and 20 percent for upper-middle-income countries.
There are several possible explanations for the exclusion of women from the private sector. Social norms that assign women the role of caregiving or do not restrict harassment in public spheres discourage women from participating in the private sector—or outside the home in general. Lack of market contestability may also hurt women by reducing available job opportunities (Elson 1999; Hellerstein, Neumark, and Troske 2002; Heyman Svaleryd, and Vlachos 2013; Weichselbaumer and Winter-Ebmer 2007). Finally, legal restrictions prevent women from working (Islam, Muzi, and Amin 2019).
There is ample scope to reform the laws that affect women’s relationship to market activities. As a result of the multiple layers of legal restrictions that women face, the region stands at the bottom of the Women, Business, and the Law index of legal equality. Women are restricted from working in some industries or on night shifts and must have spousal permission to obtain a job or will suffer legal ramifications should there be marital conflict. Once they have a job, they face additional restrictions in the workplaces, such as limited working hours. They also face unequal pay; for example, in Egypt, Jordan, and Tunisia, the gender pay gap ranges from 13 percent and 28 percent (ILO 2019).
Removal of legal restrictions is positively correlated with the share of women in managerial positions globally. The same pattern is apparent within the Middle East and North Africa; countries with fewer legal restrictions on women have a larger share of firms with female managers (Figure 5).
Nevertheless, there are positive signs. Findings from the World Bank Enterprise Surveys analyzed in this report show that the few firms led by women in the private sector perform well. They invest more in physical capital, in training their workers, and in research and development. Firms that are managed by women had higher employment growth over the past few years than their male counterparts and are more likely to employ women. They are also more likely to be digitally connected than firms led by men.
21 An upcoming regional report on the Future of Social Protection in the region, to be published in 2022, will explore these issues more fully. 145C HAPTER 7: G OVERNANCE FOR J OBS IN THE M IDDLE E AST AND N ORTH A FRICA A NEW STATE OF MIND: GREATER TRANSPARENCY AND ACCOUNTABILITY IN THE MIDDLE EAST AND NORTH AFRICA PART II: THE LEARNING STATE
Recent legal reforms have removed some barriers for women; some countries in the region now appear as top reformers on the Women, Business, and the Law index. There are signs that these efforts are bearing fruit. For instance, Saudi Arabia has implemented bold reforms, and its female labor force participation rose from 17 percent in 2007 to 27 percent in 2019.
On the downside, the COVID-19 pandemic is threatening to undo some of these gains. Many women have left their jobs to assume the burden of family care. In the private sector, small and medium enterprises—where most women work— have been hit hardest. Even more troubling, domestic violence has been on the rise as people shelter in place (Aguero 2021; Leslie and Wilson 2020). It is crucial that governments and international organizations and act urgently to protect recent gains and give a renewed impetus to including women in the labor market and taking advantage of the huge asset that female human capital represents in the Middle East and North Africa.
7. Conclusion
The labor market potential of young people, better educated people, and women is largely untapped in the Middle East and North Africa. The labor force in the region faces exclusion, unemployment, and informality. Meanwhile, limited dynamism and job creation characterize the private sector, which is not gender inclusive and does not invest much in human and physical capital or innovation. It also remains more politically connected than in other countries around the world.
A year and a half into the pandemic, these outcomes have undoubtedly worsened. Output has contracted, and the poverty rate has increased significantly, exacerbated by job losses in an already anemic private sector riddled with informality. Growing fiscal constraints also hamper Middle Eastern and North African governments’ ability to address this challenge.
Figure 5. Legal restrictions on women and share of firms with female top manager a. All economies b. MENA Share of firms with woman top manager, percent Share of firms with woman top manager, percent 60 50 40 30 20 10 0 20 40 60 80 100 JOR PSE EGY LBN TUN MAR MLT 10 8 6 4 2 0 20 40 60 80 100 JOR PSE EGY LBN TUN MAR MLT WBL index lagged (higher values more equal) WBL index lagged (higher values more equal) MENA MENA Source: World Bank Enterprise Surveys; Women, Business and the Law (WBL) database. Note: Economies marked with green diamonds are within the Middle East and North Africa: Egypt (EGY), Lebanon (LEB), Jordan (JOR), Kuwait, Malta (MLT), Morocco (MAR), Tunisia (TUN), West Bank and Gaza (PSE).
146 C HAPTER 7: G OVERNANCE FOR J OBS IN THE M IDDLE E AST AND N ORTH A FRICA MIDDLE EAST AND NORTH AFRICA REGION | ECONOMIC UPDATE OCTOBER 2022
The tremendous impact of COVID-19 is likely to be long lasting, paired with waves of young and increasingly educated populations that will continue to come of age and enter the labor force. It is time for the region to shake the sclerotic labor market and private sector and harness the economic potential of a growing, competent, ambitious labor force.
To address this huge, urgent challenge, this chapter provides new evidence of the need to focus on labor demand and lack of market contestability, which influence job creation through several direct and indirect channels.
To make markets more contestable, the governance model in the region should shift from one that supports the state’s role as a competitor in the private sector to that of a guardian of equity and welfare and from a governance model that favors politically connected firms to one that ensures a level playing field for public and private sector firms.
References
Adelino, M., Ma, S., and Robinson, D. (2017). “Firm Age, Investment Opportunities, and Job Creation.” Journal of Finance, 72(3), pp. 999–1038.
Aghion, P., Bloom, N., Blundell, R., Griffith, R. and Howitt, P. (2005). “Competition and Innovation: An Inverted-U Relationship.” Quarterly Journal of Economics, 120(2), pp. 701–728.
Agüero, J. M. (2021). “COVID-19 and the Rise of Intimate Partner Violence.” World Development, 137: 105217. Amable, B., and Gatti, D. (2001). “The Impact of Product Market Competition on Employment and Wages.” IZA Discussion Paper No. 276. Institute of Labor Economics (IZA), Bonn, Germany. Anand, R., and Khera, P. (2016). “Macroeconomic Impact of Product and Labor Market Reforms on Informality and Unemployment in India.” IMF Working Paper No. 16/47. International Monetary Fund, Washington, DC. Ashenfelter, O., and Hannan, T. (1986). “Sex Discrimination and Product Market Competition: The Case of the Banking Industry.” Quarterly Journal of Economics, 101(1), pp. 149–174.
Belfield, C., and Heywood, J. S. (2006). “Product Market Structure and Gender Discrimination in the United Kingdom.”
In J. S. Heywood and J. H. Peoples (Eds.), Product Market Structure and Labor Market Discrimination: The Moral and Political Implications of Skepticism (pp. 39-58). State University of New York Press, Albany, NY.
Blanchard, O., and Giavazzi, F. (2003). “Macroeconomic Effects of Regulation and Deregulation in Goods and Labor Markets.” Quarterly Journal of Economics, 118(3), pp. 879–907.
Boeri, T., Nicoletti, G., and Scarpetta, S. (2000). "Regulation and Labour Market Performance." CEPR Discussion Papers No. 2420. Center for Economic and Policy Research, Washington, DC.
Bouis, R., Causa, O., Demmou, L., Duval, R., and Zdzienicka, A. (2012). “The Short-Term Effects of Structural Reforms: An Empirical Analysis.” OECD Economics Department Working Paper No. 949. Organisation for Economic Cooperation and Development, Paris.
Bouis, R., Duval, R. A., and Eugster, J. (2016). “Product Market Deregulation and Growth: New Country-Industry-Level Evidence.” IMF Working Paper No. 16/114. International Monetary Fund, Washington, DC.
Charlot, O., Malherbet, F., and Terra, C. (2015). “Informality in Developing Economies: Regulation and Fiscal Policies.” Journal of Economic Dynamics and Control, 51 (February), pp. 1–27. https://doi.org/10.1016/j.jedc.2014.09.031. Cusolito, P., and Maloney, W. F. (2018). Productivity Revisited: Shifting Paradigms in Analysis and Policy. World Bank, Washington, DC.
147C HAPTER 7: G OVERNANCE FOR J OBS IN THE M IDDLE E AST AND N ORTH A FRICA A NEW STATE OF MIND: GREATER TRANSPARENCY AND ACCOUNTABILITY IN THE MIDDLE EAST AND NORTH AFRICA PART II: THE LEARNING STATE
Dauda, S. (2020). The Effects of Competition on Jobs and Economic Transformation. Equitable Growth, Finance & Institutions Insight—Trade, Investment and Competitiveness. World Bank, Washington, DC.
Dauda, S., Murciego, G. M., Pop, G., and Raslan, A. (2022). “Restrictive Regulation as a Challenge for Competition, Productivity, and Jobs in the Middle East and Northern Africa: Closing the Gap.” World Bank, Washington, DC. Mimeo. Background paper for Jobs Undone: Reshaping the Role of Governments toward Markets and Workers in the Middle East and North Africa. World Bank, Washington, DC.
Diwan, I., and Haidar, J. I. (2020). “Political Connections Reduce Job Creation: Firm-level Evidence from Lebanon.” Journal of Development Studies, 57(8), pp. 1373–1396.
Diwan, I., Keefer, K., and Schiffbauer, M. (2020). “Pyramid Capitalism: Political Connections, Regulation, and Firm Productivity in Egypt.” Review of International Organizations, 15(1), pp. 211–246.
Ebell, M., and Haefke, C. (2003). “Product Market Deregulation and Labor Market Outcomes.” Economics Working Paper No. 726. Department of Economics and Business, Universitat Pompeu Fabra, Barcelona, Spain.
Elson, D. (1999). “Labour Markets as Gendered Institutions: Equality, Efficiency and Empowerment Issues.” World Development, 27(3), pp. 611–627.
Eslava, M., Haltiwanger, J. C., Kugler, A. D., and Kugler, M. (2013). “Trade and Market Selection: Evidence from Manufacturing Plants in Colombia.” Review of Economic Dynamics, 16(1), pp. 135–158.
Gatti, R., Morgandi, M., Grun, G., Brodmann, S., Angel-Urdinola, D., Moreno, J. M., Marotta, D., Schiffbauer, S., Lorenzo, E. M. (2013). Jobs for Shared Prosperity: Time for Action in the Middle East and North Africa. World Bank, Washington, DC. https://openknowledge.worldbank.org/handle/10986/13284.
Gentilini, U., Almenfi, M., Blomquist, J., Dale, P., Giuffra, L. D., Desai, V., Fonteñez, M. B., Galicia, R., Lopez, V., Marin, G., Mujica, I., Natarajan, H., Newhouse, D., Palacios, R., J., Quiroz, A. P., Alas, C. R., Sabharwal, G., and Weber, M. (2021). “Social Protection and Jobs Responses to COVID-19: A Real Time Review of Country Measures." Living Paper Version 15. World Bank, Washington, DC. https://documents1.worldbank.org/curated/ en/281531621024684216/pdf/Social-Protection-and-Jobs-Responses- to-COVID-19-A-Real-Time-Review-ofCountry-Measures-May-14-2021.pdf.
Geroski, P. A. (1990). “Innovation, Technological Opportunity, and Market Structure.” Oxford Economic Papers, 42(3), pp. 586–602.
Goodwin, T., and Pierola, M. D. (2015). “Export Competitiveness: Why Domestic Market Competition Matters.” Viewpoint No. 348. World Bank, Washington, DC.
Hellerstein, J. K., Neumark, D., and Troske, K. R. (2002). “Market Forces and Sex Discrimination.” Journal of Human Resources, 37(2), pp. 353–380.
Heyman, F., Svaleryd, H., and Vlachos, J. (2013). “Competition, Takeovers, and Gender Discrimination.” ILR Review, 66(2), pp. 409–432.
Heyman, F., Norback, P., and Persson, L. (2018). “Who Creates Jobs and Who Creates Productivity? Small versus Large versus Young versus Old.” Economics Letters, 164 (C), pp. 50–57. https://doi.org/10.1016/j.econlet.2017.12.034.
Huber, P., Oberhofer, H., and Pfaffermayr, P. (2017). “Who Creates Jobs? Econometric Modeling and Evidence for Austrian Firm Level Data.” European Economic Review, 91(C), pp. 57–71. https://doi.org/10.1016/j. euroecorev.2016.09.008.
ILO (International Labour Organization). 2019. Global Wage Report 2018/19. International Labour Organization, Geneva. Islam, A. M., Moosa, D., and Saliola, F. (2022). Jobs Undone. Reshaping the Role of Governments toward Markets and Workers in the Middle East and North Africa. World Bank, Washington, DC.
Islam, A. M., Muzi, S., and Amin, M. (2019). “Unequal Laws and the Disempowerment of Women in the Labour Market: Evidence from Firm-Level Data.” Journal of Development Studies, 55(5), pp. 822–844.
148 C HAPTER 7: G OVERNANCE FOR J OBS IN THE M IDDLE E AST AND N ORTH A FRICA MIDDLE EAST AND NORTH AFRICA REGION | ECONOMIC UPDATE OCTOBER 2022
Jovanovic, B. (1982). “Selection and the Evolution of Industry.” Econometrica, 50(3), pp. 649–670.
Kitzmuller, M., and Licetti, M. M. (2012). “Competition Policy: Encouraging Thriving Markets for Development.” Viewpoint Note 331. World Bank Group, Washington, DC.
Krueger, A. B., and Pischke, J. (1997). "Observations and Conjectures on the U.S. Employment Miracle." NBER Working Paper No. 6146. National Bureau of Economic Research, Cambridge, MA. Leslie, E., and Wilson, R. (2020). “Sheltering in Place and Domestic Violence: Evidence from Calls for Service during COVID-19.” Journal of Public Economics, 189: 104241.
Lindbeck, A., and Snower, D. J. (1984). “Involuntary Unemployment as an Insider-Outsider Dilemma.” Seminar Paper No. 309. Institute for International Economic Studies, University of Stockholm, Sweden.
MoF (Ministry of Finance of Kuwait). (2019). The General Budget: The Fiscal Year 2019/2020. https://www.mof.gov.kw/ MofBudget/PDF/Budget20-19eng.pdf
MoEF (Ministry of Economy and Finance). (2020). Report on Public Entities Establishments and Enterprises. https://www. finances.gov.ma/en/Pages/finance-act-2020.aspx
Nickell, J. (1996). “Competition and Corporate Performance.” Journal of Political Economy, 104(4), pp. 724–746. Nickell, S., and Layard, R. (1999). “Labor Market Institutions and Economic Performance.” In O. C. Ashenfelter and D. Card (Eds.), Handbook of Labor Economics (pp. 3029–3084). Elsevier.
Nicoletti, G., and Scarpetta, S. (2003). “Regulation, Productivity and Growth: OECD Evidence.” Economic Policy, 18(36), pp. 9–72. https://doi.org/10.1111/1468-0327.00102
Nicoletti, G., and Scarpetta, S. (2005). "Product Market Reforms and Employment in OECD Countries." OECD Economics Department Working Paper No. 472. OECD Publishing, Paris. https://doi.org/10.1787/463767160680
Nicoletti, G., Bassanini, A., Ernst, E., Jean, S., Santiago, P., and Swaim, P. (2001). “Product and Labour Market Interactions in OECD Countries.” OECD Economics Department Working Paper No. 312. OECD Publishing, Paris. https://doi. org/10.1787/814240442882.
OECD. (Organization for Economic Cooperation and Development). n.d. “OECD Indicators of Product Market Regulation.” https://www.oecd.org/economy/reform/indicators-of-product-market-regulation/.
OECD (Organization for Economic Cooperation and Development). (2012). Towards New Arrangements for State Ownership in the Middle East and North Africa. OECD Publishing, Paris.
Pissarides, C. (2001). “Employment Protection.” Labour Economics, 8(2), pp. 131–159
Rijkers, B., Arouri, H., Freund, C., and Nucifora, A. (2014). “Which Firms Create the Most Jobs in Developing Countries? Evidence from Tunisia.” Labour Economics, 31(C), pp. 84–102.
Rijkers, B., Baghdadi, L., and Raballand, G. (2017). “Political Connections and Tariff Evasion: Evidence from Tunisia.” World Bank Economic Review, 31, pp. 459–482.
Rijkers, B., Freund, C., and Nucifora, N. (2017). “All in the Family: State Capture in Tunisia.” Journal of Development Economics, 124(C), pp. 41–59.
Romero, J. M., and Kuddo, A. (2019). “Moving Forward with ALMPs: Active Labor Policy and the Changing Nature of Labor Markets.” Social Protection and Jobs Discussion Paper No. 1936. World Bank, Washington, DC.
Ruckteschler, C., Malik, A., and Eib, F. (2019). “The Politics of Trade Protection: Evidence from an EU-Mandated Tari Liberalization in Morocco.” CSAE Working Paper No. 2019-12. Centre for the Study of African Economies, University of Oxford.
Sekkat, K. (2009). “Does Competition Improve Productivity in Developing Countries?” Journal of Economic Policy Reform, 12(2), pp. 145–162.
Spector, D. (2004). “Competition and the Capital-Labor Conflict.” European Economic Review, 48(1), pp. 25–38.
149C HAPTER 7: G OVERNANCE FOR J OBS IN THE M IDDLE E AST AND N ORTH A FRICA A NEW STATE OF MIND: GREATER TRANSPARENCY AND ACCOUNTABILITY IN THE MIDDLE EAST AND NORTH AFRICA PART II: THE LEARNING STATE
U.S. Department of State. (2020). 2020 Investment Climate Statements: Jordan. https://www.state.gov/reports/2020investment-climate-statements/jordan/.
Verme, P. (2016). “Subsidy Reforms in the Middle East and North Africa Region: A Review.” Policy Research Working Paper No. 7754. World Bank, Washington, DC.
Vives, x. (2008). “Innovation and Competitive Pressure.” Journal of Industrial Economics, 56(3), pp. 419–469. Weichselbaumer, D., and Winter-Ebmer, R. (2007). “The Effects of Competition and Equal Treatment Laws on Gender Wage Differentials.” Economic Policy, 22(50), pp. 235–287.
World Bank. (2018a). World Development Report 2019: The Changing Nature of Work. World Bank, Washington, DC. World Bank. (2018b). The State of Social Safety Nets 2018. World Bank, Washington, DC. World Bank. (2020). Morocco Infrastructure Review. World Bank. World Bank, Washington, DC.
150 C HAPTER 7: G OVERNANCE FOR J OBS IN THE M IDDLE E AST AND N ORTH A FRICA MIDDLE EAST AND NORTH AFRICA REGION | ECONOMIC UPDATE OCTOBER 2022
Chapter 8: Governance, Migration, and Forced Displacement in the Middle East and North Africa by Nelly Elmallakh
Introduction
Governance is shorthand for exercise of authority within a particular sphere, pursuit of collective interest, and steering and coordination of society (Pierre and Peters 2000; Peters and Pierre 2005). As such, the concept of governance can be understood in a variety of ways and lends itself to a multitude of interpretations. This chapter adopts a governance approach to the study of migration in the Middle East and North Africa. Relying on a multi-dimensional framework to capture linkages between governance and migration from the perspectives of sending and receiving countries, this chapter focuses on governance-related push and pull factors in both origin and receiving countries.
First, this chapter considers how governance in origin countries affect migration flows. It addresses challenges related to poor governance and institutions in origin countries that drive migration flows and lead to forced displacement from highly affected areas or countries—including weak economic institutions, limited political freedoms and civil liberties, and economic underperformance coupled with unfavorable demographic trends, weak climate response, and generalized violence and conflicts. Second, this chapter examines linkages between governance and migration from the perspective of receiving countries. Migrants’ and refugees’ socioeconomic and legal rights in destination countries have important implications for their welfare, labor market integration, and overall well-being.
Why does governance in origin Middle Eastern and North African countries matter for migration? There are several reasons why governance at origin matters for migration. First, emigration and forced displacement from the region account for a significant proportion of global mobility. In 2020, Middle Eastern and North African countries accounted for 11 percent of the total international migrant stock, one-third of all refugees and asylum seekers, and one-quarter of total internal displacement (UN DESA 2020; UNHCR 2021).
Second, as will be shown in Section 4, Middle Eastern and North African countries face a multitude of governance challenges, including weak economic institutions, lack of political freedoms and civil liberties, and high population growth, coupled with poor economic prospects, climate change with a lack of appropriate policy responses, and intensification of conflicts and state-based violence. Unless these countries address these underlying governance challenges, the region is likely to experience an even larger increase in international migration and forced displacement, and with the region’s large population, no receiving countries’ labor markets would be able to absorb and integrate such large flows of migrants and refugees.
Third, these mobility patterns are likely to have important implications for origin countries’ development and human capital accumulation. Depending on selection patterns of migrants and refugees, Middle Eastern and North African countries might lose highly skilled, well-educated people. Although high-skilled emigration may have positive impacts on origin countries through human capital formation (Beine, Docquier, and Oden-Defoort, 2011), brain drain is becoming a dominant pattern of international migration, as highlighted by Docquier and Rapoport (2012). Several studies have underscored the harms of high-skilled migration in origin countries (Beine, Docquier, and Rapoport 2008; Fan and Stark 2007), including long-run increases in inequality in global distribution of income, with skilled migration from poor to rich countries (Mountford and Rapoport 2011).
Lastly, some of the governance challenges that these countries face could generate important flows of forced displacement within Middle Eastern and North African countries. Unless addressed with proper policy responses, climate shocks are likely to become more frequent, severe, and extreme in the years and decades to come. With the aggravation of these
1.
152 C HAPTER 8: G OVERNANCE , M IGRATION , AND F ORCED D ISPLACEMENT IN THE M IDDLE E AST AND N ORTH A FRICA MIDDLE EAST AND NORTH AFRICA REGION | ECONOMIC UPDATE OCTOBER 2022
shocks, large segments of the population might face internal forced displacement, escaping from highly affected areas. These large population movements will exert additional pressure on existing poor infrastructure, public services, and local labor markets in the region. Addressing these challenges is therefore of utmost importance for these countries and their populations.
Governance in origin countries matters directly and indirectly. There are endogenous and reinforcing relationships between governance, migration, and development. As shown in Section 3, which reviews the literature on governance in origin countries as a determinant of migration, poor governance in origin countries—whether in the form of lack of economic and political freedoms, poor institutional quality, economic underperformance, or political violence—is an important determinant of migration and forced displacement. Although these determinants can directly drive migration and forced displacement, they may also have indirect impacts on the flow of migrants and forcibly displaced people from origin countries. For instance, poor governance in origin countries may be associated with stunted job creation and poor economic prospects, which may also drive emigration. Islam, Moosa, and Saliola (2022), who emphasize the role of poor governance in Middle Eastern and North African countries in explaining low job creation in the private sector, highlight the latter indirect channel. Likewise, conflict and generalized violence are more likely to occur when governance fails (Hegre and Nygård 2015; Wig and Tollefsen 2016), leading to higher incentives for people to move out. The loss of human capital, associated with high-skilled emigration from poor countries, would in turn reinforce governance failures, as it may result in slower improvement or even deterioration of governance in origin countries.
Adopting a governance-centered approach to the study of migration involves expanding the scope of the analysis to governance challenges in destination and not only origin countries. The current chapter underscores that better migration institutions in destination countries are crucial to achieving better labor market integration, enhancing human capital accumulation, and improving the welfare of migrants and refugees. Given that a large fraction of Middle Eastern and North African emigrants migrate to other Middle Eastern and North African countries—in particular to Gulf Cooperation Council (GCC) countries—this chapter highlights much-needed reforms to the sponsorship system, governing the relationship between employers and migrant workers. According to this system, the immigration status of a migrant worker is legally bound to a sponsor, or an employer, for their contract period. The chapter highlights how reforming the sponsorship system would benefit migrants and destination countries. With a new migration governance policy framework in the GCC, migrants would have higher degrees of labor mobility and, consequently, greater labor market integration. Benefits of reforming the sponsorship system would not be limited to migrant workers but will also benefit GCC countries. Indeed, GCC countries are likely to benefit economically from incremental reforms to the system and better enforcement of newly established regulations in countries that have already undertaken reforms in this direction. The chapter also reviews the legal framework governing hosting of refugees in major host countries in the Middle East and North Africa, such as Jordan and Lebanon, and presents some policy recommendations to improve refugees’ lives through better refugee governance policy.
The remainder of this chapter is organized as follows. Section 2 provides some background information on international migration and forced displacement in the Middle East and North Africa. Section 3 provides a literature review on linkages between governance at origin, emigration, and forced displacement flows. Section 4 highlights governance shortfalls in Middle Eastern and North African origin countries. Section 5 discusses governance in destination countries. Section 6 provides some concluding remarks.
153C HAPTER 8: G OVERNANCE , M IGRATION , AND F ORCED D ISPLACEMENT IN THE M IDDLE E AST AND N ORTH A FRICA A NEW STATE OF MIND: GREATER TRANSPARENCY AND ACCOUNTABILITY IN THE MIDDLE EAST AND NORTH AFRICA PART II: THE LEARNING STATE
2. Background information on migration and forced displacement in the Middle East and North Africa
International Migrant Stocks from Middle Eastern and North African countries
The number of international migrants from Middle Eastern and North African countries, including registered refugees, reached 29.7 million in 2020, triple the number in 1990 (9.8 million), whereas the number of international migrants worldwide increased by only 83 percent between 1990 to 2020. In the broad picture of international migration, international migrants from Middle Eastern and North African origin countries account for approximately 11 percent of total international migrants in 2020, versus 6 percent in 1990. Approximately 45 percent of international migrants from Middle Eastern and North African countries are women, a share that has remained roughly constant between 1990 and 2020 (UN DESA 2020).
Figure 1 presents the evolution in the number of international emigrants (in millions) from each Middle Eastern and North African country at mid-year between 1990 and 2020.1 Across all Middle Eastern and North African countries, the number of international emigrants has increased between 1990 and 2020. The share of international migrants from Syria, which include registered refugees, has increased by 14 times, from 0.62 million in 1990 to 8.46 million in 2020. Even though the number of international emigrants from Bahrain is smaller than from other Middle Eastern and North African countries, it ranks second, after Syria, in increase in number of international emigrants between 1990 and 2020, roughly five times as many. In absolute numbers, Algeria, Egypt, Iran, Iraq, Morocco, West Bank and Gaza, and Yemen were all major origin countries of international emigrants from the Middle East and North Africa in 2020, with roughly 18 million emigrants originating from these countries.
Figure 1. International migrants in the Middle East and North Africa, according to origin country
Djibouti
jibouti Qatar Qatar Oman Oman Bahrain Bahrain Libya Libya United Arab Emirates United Arab Emirates Kuwait Kuwait SaudiArabia SaudiArabia Jordan Jordan Yemen Yemen Tunisia Tunisia Lebanon Lebanon Syrian Arab Republic
Arab Republic Islamic Republic of
Islamic Republic of Iran Iraq Iraq Algeria Algeria Egypt Egypt Morocco Morocco West Bank and
West Bank and
Millions
D
Syrian
Iran
Gaza
Gaza 00 11 22 33 44 55 66 77 88 99 0.01 0.02 0.01 0.03 0.01 0.03 0.01 0.06 0.08 0.19 0.08 0.20 0.08 0.21 0.11 0.30 0.31 0.81 0.46 1.30 0.47 0.90 0.51 0.86 0.62 8.46 0.63 1.33 0.64 2.08 0.92 2.02 1.32 3.61 1.75 3.26 1.81 4.02 1990 2020 Source: UNDESA 2020 (https://www.un.org/development/desa/pd/content/international-migrant-stock), accessed March 25, 2022. Figure 2 shows the changes in Middle Eastern and North African emigrants’ destinations between 1990 and 2020. The figure shows major destination countries, those with at least 2 percent of total international emigrants from the region in each year. Other countries are those with fewer than 2 percent of total international emigrants from the Middle East and 1 Immigrants include all foreign-born residents in a country regardless of when they entered the country, based on official statistics on the foreign-born or foreign population from population registers and nationally representative surveys. For countries where data on the foreign-born population are not available, the United Nations Department of Economic and Social Affairs (UNDESA) uses data on foreign citizens. As such, the number of international migrants may not include second-generation migrants born in the country but have parents who migrated. In addition, the UNDESA data on international migrant stocks include information on the number of registered refugees from most Middle Eastern and North African countries. 154 C HAPTER 8: G OVERNANCE , M IGRATION , AND F ORCED D ISPLACEMENT IN THE M IDDLE E AST AND N ORTH A FRICA MIDDLE EAST AND NORTH AFRICA REGION | ECONOMIC UPDATE OCTOBER 2022
North Africa in each year. Although France was the most important destination country for emigrants from the region in 1990 (19 percent), Turkey appears to have been the top destination country in 2020 (14 percent). This is probably because UNDESA data include information on registered refugees and economic emigrants, capturing many Syrian refugees being hosted in Turkey. France became the second most important destination in 2020 (11 percent). Several Middle Eastern and North African destinations remained popular in both years including Jordan, Lebanon, Saudi Arabia, and the United Arab Emirates. The United States was the destination choice for approximately 6 percent of international emigrants from the Middle East and North Africa
1990 and 2020. In addition to France, several European countries, including Germany and Italy, were popular choices in both years, with 6 percent of Middle Eastern and North African emigrants choosing these two destinations in 1990 and 8 percent in 2020. Spain became an important E.U. destination country in 2020, whereas Belgium no longer ranks among the top destination countries for Middle Eastern and North African emigrants.
Destination countries
and
African emigrants
Refugees, Asylum Seekers, and Internally Displaced Persons from the Middle East and North Africa
This section relies on data from the United Nations High Commission for Refugees (UNHCR) Refugee Population Database, providing disaggregated information on refugees and asylum seekers from the Middle East and North Africa and information on internally displaced persons (IDPs). According to UNHCR, refugees are individuals who live outside their country or territory of origin and face protection risks, asylum seekers as individuals who have sought international protection and whose claims for refugee status have not been determined,2 and IDPs as persons who have been forced or obliged to flee or leave their homes or places of habitual residence, in particular as a result of or to avoid the effects of armed conflict, situations of generalized violence, and violations of human rights or natural or human-made disasters, and who have not crossed an internationally recognized state border.3 In 2020, according to UNHCR, one-third of all refugees and asylum seekers were from Middle Eastern and North African countries (15.9 million), with 91 percent of
2 Refugees include individuals recognized under the 1951 Convention relating to the Status of Refugees, its 1967 Protocol, the 1969 Organization of African Unity Convention Governing the Specific Aspects of Refugee Problems in Africa, the refugee definition contained in the 1984 Cartagena Declaration on Refugees as incorporated into national laws, those recognized in accordance with the UNHCR statute, individuals granted complementary forms of protection, and those enjoying temporary protection. The refugee population also includes people in refugee-like situations who are outside their country or territory of origin and face protection risks similar to those of refugees but for whom refugee status has, for practical or other reasons, not been ascertained.
3 For the purposes of UNHCR’s statistics, this population includes only conflict-generated IDPs to whom the office extends protection or assistance. The IDP population also includes people in an IDP-like situation who are inside their country of nationality or habitual residence and who face protection risks similar to those of IDPs but who, for practical or other reasons, could not be reported as such.
in
Figure 2.
of Middle Eastern
North
Belgium 4% Canada 2% Jordan 11% Kuwait 2% Lebanon 5% Libya 2% Saudi Arabia 12% Spain 3% Syria 3% Turkey 14% UAE 3% USA 6% Other 20% France 19% Germany 3% Iran 3%Israel 4% Italy 3% France 11% Germany 5% Italy 3% Jordan 11% Kuwait 2% Lebanon 6% Saudi Arabia 10% Syria 3% UAE 5% USA6% Other 19% 1990 2020 Source: UNDESA 2020 (https://www.un.org/development/desa/pd/content/international-migrant-stock), accessed March 25, 2022.
155C HAPTER 8: G OVERNANCE , M IGRATION , AND F ORCED D ISPLACEMENT IN THE M IDDLE E AST AND N ORTH A FRICA A NEW STATE OF MIND: GREATER TRANSPARENCY AND ACCOUNTABILITY IN THE MIDDLE EAST AND NORTH AFRICA PART II: THE LEARNING STATE
these from Syria, followed by Iraq (4.5 percent), Iran (1.8 percent), and West Bank and Gaza (1.4 percent). Internal displacement affected 24.46 million people in the Middle East and North Africa in 2020, accounting for approximately 25 percent of total displacement.
Figure 3 plots the evolution of the total number of refugees and asylum seekers, as well as IDPs, focusing on those originating from Middle Eastern and North African countries, between 1990 and 2021. As shown in Figure 3, Middle Eastern and North African countries witnessed in recent years a large increase in the number of refugees, asylum seekers, and IDPs because of conflict and generalized violence. In 1990, 1.23 million individuals from the Middle East and North Africa were refugees or asylum seekers in a country other than their country of origin; approximately 8 million are in 2021. Likewise, internal displacement was nonexistent in the Middle East and North Africa until 1990 but affected 12.3 million individuals in 2021. The number of IDPs was even larger in 2015 after the Syrian war.
Figure 3. Refugees, asylum seekers, and internally displaced persons from Middle Eastern and North African countries
Refugees and asylum seekers
displaced persons
asylum
this chapter also examines
North African origin countries.
North African
Middle Eastern
Internally
0.00 0.00 0.00 0.00 0.00 0.00 0.03 0.0 4 0.00 0.00 0.00 0.00 0.00 0.00 0.00 1.20 2.03 2.53 2.75 1.80 1.56 1.77 3.59 7.84 11 .9 3 13.9 3 12.13 10.9 6 10.3 0 11 .54 12.2 1 12.2 5 9 8 7 6 5 4 3 2 1 0 16 14 12 10 8 6 4 2 0 1.23 1.53 1.58 0.99 1.02 0.95 0.94 0.92 0.88 0.8 6 0.83 1.0 7 1.1 2 0.97 0.90 0.84 2.02 2.8 3 2.42 2.07 1.9 7 1.73 1.79 3.22 4.73 5.97 6.72 7.5 5 7.94 7.90 7.89 8.01 1990 1991 1992 1993 1994 1995 1996 1997 1998 1999 2000 2001 2002 2003 2004 2005 2006 2007 2008 2009 2010 201 1 2012 2013 2014 2015 2016 2017 2018 2019 2020 2021 1990 1991 1992 1993 1994 1995 1996 1997 1998 1999 2000 2001 2002 2003 2004 2005 2006 2007 2008 2009 2010 201 1 2012 2013 2014 2015 2016 2017 2018 2019 2020 2021 Source: UNHCR 2021 (https://www.unhcr.org/refugee-statistics/), accessed March 31, 2022. Figure 4. Countries of asylum of refugees and asylum seekers from the Middle East and North Africa in 2020 Austria 1%Egypt 3% Germany 11% Iraq 3% Jordan 9% Lebanon 11% Sudan 1% Sweden 2% Turkey 49% Other 10% MENA 27% Other countries 73% Source: UNHCR 2021 (https://www.unhcr.org/refugee-statistics/), accessed March 31, 2022. Relying on information on
countries from the UNHCR Refugee Population Database,
countries of asylum of refugees and asylum seekers from Middle Eastern and
Figure 4 features the share of refugees and asylum seekers from Middle Eastern and
countries in 2020 in each country of asylum. The left pie chart presents major host countries where at least 1 percent of
156 C HAPTER 8: G OVERNANCE , M IGRATION , AND F ORCED D ISPLACEMENT IN THE M IDDLE E AST AND N ORTH A FRICA MIDDLE EAST AND NORTH AFRICA REGION | ECONOMIC UPDATE OCTOBER 2022
and North African refugees and asylum seekers are hosted (the other category therefore refers to countries hosting less than 1 percent of total Middle Eastern and North African refugees and asylum seekers in 2020), while the right pie differentiates between Middle Eastern and North African countries and other countries as countries of asylum for refugees and asylum seekers from Middle Eastern and North African origin countries.
Because of the presence of many Syrian refugees in Turkey, 49 percent of total refugees and asylum seekers from the Middle East and North Africa were hosted in Turkey in 2020. Lebanon and Jordan, Syria’s neighboring countries, hosted an additional 20 percent of refugees and asylum seekers in 2020. Iraq and Egypt each hosted 3 percent of total refugees and asylum seekers from the Middle East and North Africa, and Austria, Germany, and Sweden hosted 14 percent of refugees and asylum seekers. Overall, in 2020, 27 percent of refugees and asylum seekers are hosted in Middle Eastern and North African countries.
3. A Review of the literature: Effect of governance at origin
The migration literature identifies several push and pull factors that affect migration flows. This section focuses primarily on governance-related push factors that could affect migration flows and forced displacement in origin countries. It discusses related literature on the role of demographic factors, economic and political freedoms, economic underperformance, climate change, and conflict in shaping migration flows from highly affected countries or geographic areas.
Demographic Factors
Demographic fundamentals are among the most important drivers of international migration. Several papers have examined the impact of demographic factors in origin countries such as population size, share of urban population, share of youth population, and growth of the labor force on migration flows. For instance, Karemera, Oguledo, and Davis (2000) and Poprawe (2015) find that larger populations at origin increase migration, with the former focusing on migration to North America and Canada and the latter on bilateral flows covering 230 countries. Apart from population size, structure, and composition of the population at origin also seem to matter. Vogler and Rotte (2000), who study migration flows from 86 Asian and African countries to Germany, find that a 1 percent rise in the share of the urban population increases the number of migrants by 2.7 percent. Likewise, Bertocchi and Strozzi (2008), who study the determinants of 19th century mass migration, find that countries with a higher share of young people have larger emigration flows.
Economic, Political, and Institutional Freedoms
Another strand of the literature examines the role of economic and political institutions in origin countries and economic and institutional differentials between origin and destination countries in driving migration flows. Ashby (2010) finds that economic freedom differentials between origin and destination countries are associated with bilateral migration. Likewise, Nejad and Young (2016) find that migrants are attracted to destinations with sounder currencies, lessburdensome regulations, and stronger property rights and legal systems.
157C HAPTER 8: G OVERNANCE , M IGRATION , AND F ORCED D ISPLACEMENT IN THE M IDDLE E AST AND N ORTH A FRICA A NEW STATE OF MIND: GREATER TRANSPARENCY AND ACCOUNTABILITY IN THE MIDDLE EAST AND NORTH AFRICA PART II: THE LEARNING STATE
Nejad and Young (2016) show that differences between destination and origin institutional scores and political freedoms are also significant determinants of migration decisions. Ariu, Docquier, and Squicciarini (2016) further disentangle the effects of the quality of domestic and foreign institutions on migrant inflows and outflows. They show that countries with better institutions have fewer emigrants, whereas better institutions at destination attract highly skilled emigrants. Poprawe (2015) shows that countries with more corruption have higher emigration rates and lower immigration rates.
Economic Underperformance and Income Differentials
The literature has also shown that income differentials—usually captured by a measure of the wage gap—have a large impact with richer countries attracting larger migration flows. Focusing on migration to Germany, Vogler and Rotte (2000) find that a 1 percent increase in the difference between origin and destination countries increases migration by 1.6 percent. Ariu, Docquier, and Squicciarini (2016) find that, the larger the skill-specific wage gap between a pair of origin-destination countries, the greater the net migration flow from the latter to the former. Nejad and Young (2016) corroborate these findings by highlighting that the per capita income gap between origins and destinations has different effects on low- and high-skilled migration flows. They show that income differentials matter more for high-skilled migration—probably because of the higher expected returns to human capital associated with destination-origin income differences that college-educated individuals might experience.
Climate Change
Natural disasters and climate change are important factors driving human mobility, in the form of international migration, internal migration, and forced displacement. Several studies provide evidence that international migration flows increase with higher temperatures (Backhaus, Martinez-Zarzoso, and Muris 2015; Cai et al. 2016). Consistent with these studies, Cattaneo and Peri (2016) found that higher temperatures increased internal and international migration rates but only in middle-income countries, where migration is an important margin of adjustment to global warming. They found that the relationship was negative in poor countries—consistent with the presence of severe liquidity constraints. Abel and colleagues (2019) found that drought severity has been an important determinant for asylum seeking in recent years, and Beine and Parsons (2015) and Drabo and Mbaye (2015) found that natural disasters such as epidemics and hydrological disasters also spurred international migration.
Political Violence and Conflict
Several papers have shown that political violence and conflict serve as a main push factor for migration and forced displacement. An increase in the incidence of international violence and the occurrence of civil war were found to be associated with higher migration flows (Beine and Parsons 2015; Drabo and Mbaye 2015). Conflict can also be a cause of displacement. Vogler and Rotte (2000) find that asylum seeker inflows to Germany from African and Asian countries were larger the higher the level of terror in origin countries. Likewise, Moore and Shellman (2004) and Abel and colleagues (2019) found that countries experiencing war tended to have a greater probability of sending asylum-seeking applications to the rest of the world and to be at the origin of forced migrant flows (refugees and IDPs).
158 C HAPTER 8: G OVERNANCE , M IGRATION , AND F ORCED D ISPLACEMENT IN THE M IDDLE E AST AND N ORTH A FRICA MIDDLE EAST AND NORTH AFRICA REGION | ECONOMIC UPDATE OCTOBER 2022
Focusing on Syria, Schon (2020) and Seven (2020) provide evidence of the role of violence in driving civilian migration decisions and forced displacement. Relying on structured interviews of Syrian refugees in Turkey, Schon (2019) showed that exposure to violence early in the conflict predicted earlier migration from Syria, in particular among better-connected people from advantaged social positions. Likewise, Seven (2020) showed that exposure to violence was an important determinant of internal displacement in Syria and that refugee movements from Syria to neighboring countries were linked to the gradual increase in structural violence.
4. Governance challenges in Middle Eastern and North African origin countries
Data Sources
This chapter reviews Middle Eastern and North African countries’ performance on the governance dimensions presented in Section 3. The dimensions included in the analysis are those directly related to underlying governance challenges in Middle Eastern and North African countries. For instance, this section tackles the role of demographics as it relates to governance of family planning; the role of economic freedoms and economic underperformance as they relate to weak economic institutions; the role of political freedoms, conflict, and political violence, as they relate to weak political institutions; and, finally, the role climate shocks, as they relate to inadequate climate policies.
First, this section relies on data from the United Nations World Populations Prospects (UN 2019) to examine the age distribution of the population and population projections and on data on annual percentage GDP growth from the World Bank’s World Development Indicators to compare Middle Eastern and North African countries’ economic performance, according to income group, with the average country in the same income bracket. Second, to assess Middle Eastern and North African countries’ performance in terms of economic and political freedoms and institutional quality, this chapter relies on four data sources: Fraser Institute’s Economic Freedom of the World Index in 2019, which assesses economic institutions based on size of government, legal structure and property rights, access to sound money,4 freedom to trade internationally, and regulation of credit, labor, and business; Transparency International’s Corruption Perception Index in 2021, which measures how corrupt each country’s public sector is perceived to be according to experts and businesspeople; the Freedom House’s ratings of political rights and civil liberties in 2021, which rate people’s access to political rights and civil liberties in 210 countries and territories; and the World Bank’s World Governance Indicators in 2020, which rank more than 200 countries and territories on voice and accountability, political stability and absence of violence, government effectiveness, regulatory quality, rule of law, and control of corruption.
Third, to examine the incidence of conflict and political violence, this chapter relies on data from the Uppsala Conflict Data Program’s Georeferenced Event Database, which provides disaggregated information covering individual events of organized violence, and data from the Political Terror Scale dataset, which measures violations of physical integrity rights by states and their agents.5 Lastly, this chapter studies the incidence of climate shocks using the Emergency Events Database from the Centre for Research on the Epidemiology of Disasters, which has compiled data on more than 22,000 mass disasters in the world since 1990. It also examines climate policy decisions undertaken in Middle Eastern and North African countries between 1990 and 2020 using data from the NewClimate Institute’s Climate Policy Database.
4 Sound money refers to money with relatively stable purchasing power across time. The EFW index measures the extent to which people in different countries have access to sound money. In order to earn a high rating in this area, a country must
to use alternative currencies.
5 See Gibney and colleagues (2021) for more information on the PTS dataset.
follow policies and adopt institutions that lead to low (and stable) rates of inflation and avoid regulations that limit the ability
159C HAPTER 8: G OVERNANCE , M IGRATION , AND F ORCED D ISPLACEMENT IN THE M IDDLE E AST AND N ORTH A FRICA A NEW STATE OF MIND: GREATER TRANSPARENCY AND ACCOUNTABILITY IN THE MIDDLE EAST AND NORTH AFRICA PART II: THE LEARNING STATE
Key Governance Challenges in the Middle East and North Africa
Governance of Family Planning and Economic Underperformance
Population growth, combined with lack of economic opportunities, is one of the main challenges facing countries in the region. The Middle East and North Africa’s overall population was 455 million in 2020 and is projected to grow by 42 percent by 2050 (to 648 million) according to the 2019 World Population Prospects. Figure 5 shows the age distribution of the population in 2020 (red) and in 2050 (orange). The population aged 15 to 29 is highlighted in a darker shade.
Despite an overall increase in population size across all age groups, distribution of the population according to age groups is projected to change over time. Examining the age distribution of the region’s population according to age between 2020 and 2050, the data show that the share of individuals aged 30 and older will rise to 56 percent in 2050 from 46 percent in 2020. The share of people aged 15 to 29 will remain roughly the same (24 percent in 2020; 22 percent in 2050), and the share of the population younger than 15 will drop from 30 percent in 2020 to 22 percent in 2050.
Figure 5. Middle Eastern and North African population in 2020 and 2050 according to age group
90–94 85–89 80–84 75–79 70–74 65–69 60–64 55–59 50–54 45–49 40–44 35–39 30–34 25–29
6. Gross Domestic Product growth rates in Middle Eastern and North African countries
population aged 15 to 29 will grow between 2020 and 2050 in all Middle Eastern and North African countries except Jordan, Libya,
(where
population
remain roughly constant) and Lebanon, Qatar, and UAE (where the youth population is projected to decline by 31 percent, -9 percent, and 6 percent, respectively). Middle Eastern and North African countries that will witness the largest growth in the population aged 15 to 29 are Iraq (58 percent), Syria (55 percent), Egypt (49 percent), the West Bank and Gaza (47 percent), Kuwait (42 percent), and Yemen (37 percent).
Improving family planning and reducing fertility are important governance challenges for the Middle East and North Africa, especially because the region faces a “low-growth syndrome,” as highlighted in the April 2020 Middle Eastern and North African Economic Update (Arezki et al. 2020). Figure 6 shows average annual percentage GDP growth at market
Ì
Figure
Age groups 50 40 30 20 10 050 95+
20–24 15–19 10–14 05–09 00–04 10 20 30 40 High income Uer iddle ncomepp -m i Lower iddle ncome-m i High income Uer iddle ncomepp -m i Lower iddle ncome-m i 0123456 2.16 1.89 2.62 3.04 4.55 4.87 Population in millions Average GDP growth (2015–2019) J 2020 (youth 15–29) J 2020 (other) J 2050 (youth 15–29) J 2050 (other) J MENA countries J All countries Source: World Population Prospects 2019 (https://population.un.org/wpp/Download/Standard/Population/), accessed on April 21, 2022. Source: World Bank World Development Indictors (https://data.worldbank.org/indicator/NY.GDP.MKTP. KD.ZG), accessed May 17, 2022. The
and Tunisia
the youth
will
160 C HAPTER 8: G OVERNANCE , M IGRATION , AND F ORCED D ISPLACEMENT IN THE M IDDLE E AST AND N ORTH A FRICA MIDDLE EAST AND NORTH AFRICA REGION | ECONOMIC UPDATE OCTOBER 2022
prices based on constant local currency in all countries (top panel) and in Middle Eastern and North African countries (lower panel), according to income group, between 2015 and 2019 (the 5 years before the pandemic). Regardless of income group (high, upper middle, lower middle), Middle Eastern and North African countries have lower growth rates than their income peers.6 Coupled with high population growth, income differentials are important determinants of emigration from origin countries, constituting another governance challenge given the underlying distortions in regulatory quality and cumbersome credit, labor, and business regulations, as will be highlighted later in this section. Nonetheless it is important to note that almost all countries in the region are going through rapid demographic transition. Some have already completed it, while others are experiencing rapidly declining fertility rates. According to the World Bank’s World Development Indicators, average fertility rates in Middle East and North African countries have declined from 7 to 2.5 births per women between 1960 and 2020. In 2020, the countries with the highest fertility rates in the region are Yemen (3.6), Iraq (3.5), West Bank and Gaza (3.5), and Egypt (3.2).
Ì Economic Freedom and Corruption
Weak economic institutions and corruption are other important governance issues facing the Middle East and North Africa. According to the most recent Economic Freedom of the World index in 2019—which ranked 165 countries on a scale from 1 (least free) to 10 (most free) based on size of government; legal structure and property rights; access to sound money; freedom to trade internationally; and regulation of credit, labor, and business—many Middle Eastern and North African countries are among the bottom 20 performers worldwide (Figure 7).
Figure 7. Lowest 20 countries on Economic Freedom of the World Index in 2019 and Corruption Perception Index in 2021
a. Economic Freedom of the World Index, 2019
Sudan Libya Algeria Zimbabwe Iran, Islamic Rep. Congo, Rep. Syrian Arab Republic Congo, Dem. Rep. Central African Republic Yemen, Rep. Argentina Angola Chad Equitorial Guinea Burundi Egypt, Arab Rep. Iraq Gabon Mali
b. Corruption Perception Index, 2021 Venezuela RB, South Sudan Somalia Syrian Arab Rep. Venezuela, RB Afghanistan Korea, North Yemen, Rep. Equatorial Guinea Libya Burundi Congo, Dem. Rep. Turkmenistan Chad Comoros Haiti Nicaragua Sudan Congo, Dem. Rep. Guinea Bissau Eritrea
0 01 52 103 1545 6 207 25 2.8 4.2 4.8 4.9 4.9 5.1 5.1 5.2 5.4 5.4 5.5 5.5 5.5 5.6 5.6 5.7 5.7 5.7 5.8 5.8 11 13 13 14 16 16 16 17 17 19 19 19 20 20 20 20 20 21 21 22 Source: Fraser Institute’s EFW index (https://www.fraserinstitute.org/studies/economic-freedom), accessed April 18, 2022; Transparency International (https://www.transparency.org/en/cpi/2021), accessed May 16, 2022. Ì Accountability and Political Stability Relying on the World Governance Indicators Project, which ranks more than 200 countries and territories on six dimensions of governance (voice and accountability, political stability and absence of violence, government effectiveness, regulatory quality, rule of law, control of corruption), this chapter explores how Middle Eastern and North African countries perform in terms of governance (Figure 8). This indicator ranges roughly between -2.5 and 2.5, with lower values reflecting 6 Average annual percentage growth rate of GDP at market prices are based on constant local currency. Aggregates are based on constant 2015 prices, expressed in U.S. dollars. In the Middle East and North Africa, high-income countries include Bahrain, Kuwait, Oman, Qatar, Saudi Arabia, and United Arab Emirates. Upper-middle-income countries include Algeria, Iran, Iraq, Lebanon, and Libya. Lower-middle-income countries include Djibouti, Egypt, Jordan, Morocco, Syria, Tunisia, the West Bank and Gaza, and Yemen. 161C HAPTER 8: G OVERNANCE , M IGRATION , AND F ORCED D ISPLACEMENT IN THE M IDDLE E AST AND N ORTH A FRICA A NEW STATE OF MIND: GREATER TRANSPARENCY AND ACCOUNTABILITY IN THE MIDDLE EAST AND NORTH AFRICA PART II: THE LEARNING STATE
poorer performance. Middle Eastern and North African countries rank poorly on these institutional quality indicators. Libya, Syria, and Yemen are consistently found to be among the worst performers on all dimensions of governance. Political stability appears to be the most challenging governance dimension, with seven Middle Eastern and North African countries among the lowest 20 countries. Improving regulatory quality and the Middle East and North Africa’s performance in terms of voice and accountability is necessary to achieve overall better governance performance, as analysis by the Freedom House Index in 2021—which classifies countries as free, partially free, and not free based on indicators for political rights and civil liberties—confirms, showing that no Middle Eastern and North African country was ranked as free in 2021.7
Figure 8. Lowest 20 Countries, World Governance Indicators in 2020
Voice and accountability
Eritrea Turkmenistan Syrian Arab Republic Equatorial Guinea South Sudan Somalia Lao PDR Tajikistan Yemen, Rep. China Saudi Arabia Azerbaijan Burundi Uzbekistan Venezuela, RB Egypt, Arab Rep. Iran, Islamic Rep. Belarus Bahrain
Political stability
Government effectiveness
Korea Dem. Re ,p South Sudan Yemen, Rep. Somalia Haiti Libya Venezuela, RB Syrian Arab Republic Congo, Dem. Rep. Central African Republic Eritrea Comoros Afghanistan Sudan Equatorial Guinea Korea, Dem. Rep. Chad Congo, Rep. Guinea-Bissau Liberia Marshall Islands
-2.1 -2.0 -1.9 -1.8 -1.8 -1.8 -1.8 -1.8 -1.8 -1.6 -1.6 -1.5 -1.5 -1.5 -1.5 -1.5 -1.5 -1.5 -1.5
Korea, Dem. Rep. Eritrea Libya Venezuela, RB South Sudan Somalia Turkmenistan Syrian Arab Republic Yemen, Rep. Sudan Equatorial Guinea Congo, Dem. Rep. Central African Republic Cuba Iran, Islamic Rep. Congo, Rep. Zimbabwe Afghanistan Iraq Algeria
Syrian Arab Republic Afghanistan Yemen, Rep. Iraq Somalia Libya Central African Republic South Sudan Mali West Bank and Gaza Nigeria Pakistan Sudan Niger Ethiopia Congo, Dem. Rep. Iran, Islamic Rep. Lebanon Burkina Faso Cameroon
Regulatory quality Rule of law
-2.2 -2.3 -2.3 -2.1 -2.0 -2.0 -1.8 -1.7 -1.7 -1.7 -1.6 -1.6 -1.5 -1.5 -1.5 -1.5 -1.5 -1.4 -1.4 -1.4 -1.4
-2.7 -2.7 -2.5 -2.5 -2.5 -2.2 -2.2 -2.1 -2.0 -1.9 -1.9 -1.8 -1.6 -1.6 -1.5
-1.7
-3.0
-2.0
-1.0
00
-2.3 -2.3 -2.3 -2.2 -2.2 -2.1 -1.9 -1.8 -1.6 -1.5 -1.5 -1.5 -1.5 -1.5 -1.4 -1.4 -1.4 -1.4 -1.3
-2.0
Venezuela, RB Somalia Syrian Arab Republic Libya South Sudan Afghanistan Congo, Dem. Rep. Yemen, Rep. Iraq Central African Republic Korea, Dem. Rep. Eritrea Turkmenistan Guinea-Bissau Burundi Chad Zimbabwe Guinea Equatorial Guinea Nicaragua
-2.3 -2.3 -2.1 -2.0 -1.9 -1.8 -1.8 -1.8 -1.8 -1.7 -1.6 -1.5 -1.4 -1.4 -1.3 -1.3 -1.3 -1.3 -1.3 -1.2
Political Violence and Conflict
South Sudan Syrian Arab Republic Equatorial Guinea Korea, Dem. Rep. Yemen, Rep. Somalia Libya Congo, Dem. Rep. Venezuela, RB Turkmenistan Burundi Afghanistan Chad Congo, Rep. Sudan Eritrea Tajikistan Haiti Guinea-Bissau Iraq
-1.9 -1.7 -1.7 -1.7 -1.7 -1.7 -1.6 -1.6 -1.6 -1.5 -1.5 -1.5 -1.4 -1.4 -1.4 -1.3 -1.3 -1.3 -1.3 -1.3
Control of corruption -3.0 -3.0-3.0 -2.0 -2.0-2.0 -1.0 -1.0-1.0 000
The Middle East and North Africa has witnessed an intensification of violence and armed conflicts over the past few decades. Using data from the Uppsala Conflict Data Program, Figure 9 shows the total number of conflicts on the primary Y-axis and the total number of fatalities on the secondary Y-axis across all Middle Eastern and North African countries in a given year (for all types of conflicts, state-based conflicts, non-state conflicts, and one-sided violence) between 1990
House Index
-3.0
-3.0 -2.0
-2.0 -1.0
-1.0
0
-2.7
-1.7 -1.7 -1.7
Source: WGI project data (http://info.worldbank.org/governance/wgi/), accessed May 16, 2022. Ì
7 The Freedom
assigns countries a score from 1 to 7, with 1 representing the greatest degree of freedom and 7 the least degree of freedom. Scores are based on indicators of political rights (electoral process, political pluralism and participation, functioning of government) and civil liberties (freedom of expression and belief, associational and organization rights, rule of law, personal autonomy and individual rights). These scores are mapped into the classifications free, partially free, and not free. 162 C HAPTER 8: G OVERNANCE , M IGRATION , AND F ORCED D ISPLACEMENT IN THE M IDDLE E AST AND N ORTH A FRICA MIDDLE EAST AND NORTH AFRICA REGION | ECONOMIC UPDATE OCTOBER 2022
and 2020.8 State-based violence has engulfed many Middle Eastern and North African countries. State-based violence accounts for most conflicts in the region. These conflicts have also been associated with many fatalities, as shown on the secondary Y-axis. For all types of conflicts, the number of conflicts and the number of fatalities follow the same trends over time, which signals not only a rising level of violence in the Middle East and North Africa, but also a positive association between incidence of conflicts and of fatalities. The analysis likewise shows an increase in the early 2010s, which coincides with the Arab Spring and the beginning of the Syrian war.
Figure 9. Conflicts and fatalities in Middle Eastern and North African countries
All conflicts State-based conflicts
20,000 15,000 10,000
100,000 80,000
90,000 80,000 70,000 60,000 50,000 40,000 30,000 20,000 10,000
Non-state conflicts One-sided conflicts
1,500
6,000 5,000 4,000 3,000 2,000 1,000
Total number of conflicts Total number of fatalities Total number of conflicts Total number of fatalities 1990199219941996199820002002200420062008201020122014201620182020 25,000
5,000 0 120,000
60,000 40,000 20,000 0 1990199219941996199820002002200420062008201020122014201620182020 20,000 15,000 10,000 5,000 0
0
Total number of conflicts Total number of fatalities Total number of conflicts Total number of fatalities 1990199219941996199820002002200420062008201020122014201620182020 2,500 2,000
1,000 500 0 14,000 12,000 10,000 8,000 6,000 4,000 2,000 0 1990199219941996199820002002200420062008201020122014201620182020 900 800 700 600 500 400 300 200 100 0
0 ▬ Conflicts ▬ Fatalities ▬ Conflicts ▬ Fatalities Source: Uppsala Conflict Data Program Georeferenced Event Database (https://ucdp.uu.se/downloads/), accessed May 19, 2022. Ì Climate Change Governance Shortfalls The analysis has shown that Middle Eastern and North African countries fall short in terms of economic freedom, institutional quality, political rights, and civil liberties. All these factors have been associated with higher emigration rates from underperforming origin countries because migrants are attracted to countries with greater government effectiveness; better, less-burdensome regulations; better rule of law; lower levels of corruption; higher levels of political 8 A conflict is defined as an incident during which an organized actor used armed force against another organized actor or civilians resulting in at least one direct death at a specific location on a specific date. The number of fatalities refers to the most reliable estimate of deaths identified in the source material. One-sided violence events refer to events that involve armed actors (government or formally organized non-state group) attacking civilians. State-based violence involves use of armed force between two parties (one of which is the government), and non-state-based violence refers to use of armed force between two parties (neither of which is the government). 163C HAPTER 8: G OVERNANCE , M IGRATION , AND F ORCED D ISPLACEMENT IN THE M IDDLE E AST AND N ORTH A FRICA A NEW STATE OF MIND: GREATER TRANSPARENCY AND ACCOUNTABILITY IN THE MIDDLE EAST AND NORTH AFRICA PART II: THE LEARNING STATE
and greater political freedoms and civil liberties.
section further examines the region’s climate change governance shortfalls, since climate shocks constitute important determinants of migration and forced displacement as highlighted in Section 3.
shocks are more frequent in the Middle East and North Africa than in the rest of the world. More-frequent and -intense climate-related natural disasters such as droughts, floods, storms, landslides, extreme temperature events, and wildfires harm people’s livelihoods and have been shown to affect emigration from highly affected areas. Relying on the Emergency Events Database, Figure 10a plots the frequency of climate shocks, normalized according to geographic area (in million square kilometers), in Middle Eastern and North African countries versus the rest of the world. As shown in Figure 10a, climate shocks are more frequent in the Middle East and North Africa than in the rest of the world and increasingly so in recent years.9
Figure 10. Climate shocks and climate policies in Middle Eastern and North African countries
acknowledging that the countries that emit the largest amounts of greenhouse gases are the most responsible for global climate change, it is important for Middle Eastern and North African countries to be proactive, because they are among the most vulnerable to climate change. According to the Emergency Events Database, which provides information on estimated costs associated with these shocks, climate shocks have higher costs (as a percentage of GDP) in the Middle East and North Africa than in the rest of the world.
The typical climate shock generated damages with an associated cost of 0.31 percent of GDP in the Middle East and North Africa, versus 0.02 percent in the rest of the world between 1990 and 2020.
response to climate change has been lower in the Middle East and North Africa than in the rest of the world. Figure 10b plots the average number of climate policies per country in major emitters (China, EU countries, India, Russia, United States), the Middle East and North Africa, and the rest of the world on the y-axis.11 A value of 1 means that, on average, each country in a group (major emitters, the Middle East and North Africa, rest of the world) enacted one new
9 The Climate shocks considered include droughts, floods, storms, landslides, extreme temperature events, and wildfires.
10 This information is available for 26 percent of total events in the Middle East and North Africa and 38 percent of total events in the rest of the world.
11 Climate policies include policies related to energy efficiency, energy service demand reduction and resource efficiency, non-energy use, other low-carbon technology and fuel switch, and renewables. Year refers to the year of decision for a given policy.
stability;
This
Climate
a. Climate shocks b. Climate policies Climate shocks per million sq.km 0.07 0.06 0.05 0.04 0.03 0.02 0.01 0 1990199219941996199820002002200420062008201020122014201620182020 6 5 4 3 2 1 0 1990199219941996199820002002200420062008201020122014201620182020 MENA ROW Major emitters MENA ROW Source: Data on climate shocks from the Centre for Research on the Epidemiology of Disasters Emergency Events Database (https://www.emdat.be/). Data on land area from World Bank World Development Indicators (https://data.worldbank.org/indicator/AG.LND.TOTL.K2). Data on climate policies from Climate Policy Database (https://climatepolicydatabase.org/). All accessed April 7, 2022. While
10
The
164 C HAPTER 8: G OVERNANCE , M IGRATION , AND F ORCED D ISPLACEMENT IN THE M IDDLE E AST AND N ORTH A FRICA MIDDLE EAST AND NORTH AFRICA REGION | ECONOMIC UPDATE OCTOBER 2022
energy transition policy in a given year. Despite the urgent need for energy transition, the average number of climate policies in the Middle East and North Africa, depicted by the red line, is lower than in major emitters and the rest of the world.12
There is need for adaptation and mitigation policies, adoption of which will be a function—among others—of good governance. Studies have shown that poor governance may undermine capacity to adapt to climate change, whereas good local governance is critical for climate change adaptation. Focusing on 10 Asian cities, Tanner and colleagues (2009) found that good urban governance was necessary to reduce vulnerability to climate shocks. They identify characteristics that form the basis of a climate-resilient governance framework, including decentralization and autonomy, accountability and transparency, and responsiveness and flexibility. Williams and colleagues (2020) also argue that local governance matters for climate change adaptation at the subnational level and highlight that lack of capacity for climate change adaptation at the subnational level is a key barrier to implementing the United Nations Framework Convention on Climate Change national adaptation plans. Focusing on Bangladesh, Rahman (2018) empirically examined the impacts of bribery and extortion on adaptive capacity in the face of climate change and found that corruption significantly reduces the ability to respond to climatic stressors.
Ì Emigration Policies and Migrants’ Rights
Finally, better migration governance in Middle Eastern and North African countries should consider another piece of the migration governance puzzle: emigration policies aimed at protecting the rights of citizens. A recent report published by the International Organization for Migration highlights some of these policies, which include mechanisms to protect the rights of citizens working abroad through contacts with their embassies and consulates for support, formal agreements with destination countries to protect migrant workers, pre-departure training to inform potential migrants about their rights in destination countries and procedures to follow in case their rights are violated, and efforts to combat human trafficking and smuggling of migrants (Melde et al. 2019).
As highlighted in the International Organization for Migration report, a comprehensive approach should cover immigration and emigration, but few datasets provide information on “emigrant policies.” Information on Middle Eastern and North African countries’ emigrant policies is sparse. In recent years, the International Organization for Migration developed the Migration Governance Indicators, which offer information on policy levers that countries can use to develop their migration governance. Only two Middle Eastern and North African countries, Iraq and Kuwait, are covered in these indicators. Middle Eastern and North African countries should have specific policies and strategies to combat human trafficking and minimize risks that their citizens might incur during migration. For instance, the Migration Governance Indicators data show that Iraq does not have procedures or policies to minimize risks for migrants in transit or at the border, and Kuwait does not publish official information about counter-trafficking activities.
12 In the Middle East and North Africa, 41 percent of climate policies are related to energy efficiency, followed by renewables (34 percent), energy service demand reduction and resource efficiency (16 percent), non-energy use (5 percent), and other low-carbon technologies and fuel switch (4 percent). Top reformers (total number of policies since 1990) include the United Arab Emirates (31), Saudi Arabia (29), Morocco (27), Tunisia (20), and Algeria and Egypt (approximately 15 each). 165C HAPTER 8: G OVERNANCE , M IGRATION , AND F ORCED D ISPLACEMENT IN THE M IDDLE E AST AND N ORTH A FRICA A NEW STATE OF MIND: GREATER TRANSPARENCY AND ACCOUNTABILITY IN THE MIDDLE EAST AND NORTH AFRICA PART II: THE LEARNING STATE
5. Governance at destination countries
Migration Governance Policy: International Perspectives and the GCC
This section examines linkages between governance and migration from the perspective of receiving countries. Migrants’ socioeconomic and legal rights in destination countries have important implications for their welfare, labor market integration, and overall well-being. Understanding how governance in destination countries affects migrants and refugees is crucial to ease their integration into labor market, enhance their human capital accumulation, and improve their overall well-being. Several aspects of governance in destination countries, including employment rights, legal status, access to services, and citizenship paths, might shape immigration flows to the destination and migrants’ welfare.
The literature documents the attractiveness of better migration institutions in destination countries and the benefits of granting citizenship on migrants’ integration into the labor market. Several studies have also shown the detrimental labor market effects associated with restricted employment rights for refugees and asylum seekers. Focusing on mass migration to Australia, Canada, the United States, and Western European countries in the 19th century, Bertocchi and Strozzi (2008) find that migrants are attracted to countries with positive migration policies, including laws regulating ascension to citizenship and other proxies for the quality of migration policies in areas such as land distribution and public education and attitudes toward immigration policy.
More recent studies such as those of Govind (2021) have shown that granting citizenship to migrants can catalyze labor market integration. Exploiting a quasi-experimental setting induced a recent change in the law of naturalization through marriage in France; Govind (2021) found that citizenship increases annual earnings by increasing labor supply and hourly wages. Relatedly, Testaverde and colleagues (2017) highlight that more generous employment terms, including lengthier employment passes may benefit destination countries through productivity improvements. For instance, Chung, Choi, and Lee (2015) found that, in Korea, the productivity of migrant workers tends to be about 50 percent of their local counterparts in the first year of employment, 80 percent in the second year, and 100 percent in the third. Alternatively, Fasani, Frattini, and Minale (2021) found that employment restrictions imposed on refugees entering European countries have long-lasting detrimental effects on their integration into the labor market, that exposure to a ban at arrival reduces the employment probability of refugees by 15 percent in the post-ban years, and that these effects can last for up to 10 years after arrival.
Better migration policies in destination countries are beneficial for migrants and refugees, as well as for the destination countries. As highlighted in the literature, reducing discrimination and informality through achievement of citizenship can catalyze migrants’ labor market integration, which benefits migrants and destination countries alike. Likewise, lifting employment restrictions imposed on refugees and asylum seekers is likely to improve labor market outcomes, as reflected by higher labor force participation and employment. As shown in Section 2.1, a large percentage of Middle Eastern and North African emigrants emigrate to the GCC, particularly to Kuwait, Saudi Arabia, and the United Arab Emirates (Figure 2). The GCC countries hire migrant labor under the sponsorship system, which governs the relationship between employers and migrant workers.13 According to this system, citizenship and permanent residency are precluded to foreign nationals, and the immigration status of a migrant worker is legally bound to a sponsor or employer for their contract period. A migrant worker therefore remains tied to a sponsor throughout their stay in the destination country.
13 See Damir-Geilsdorf and Pelican (2019) for more information on the sponsorship system. 166 C HAPTER 8: G OVERNANCE , M IGRATION , AND F ORCED D ISPLACEMENT IN THE M IDDLE E AST AND N ORTH A FRICA MIDDLE EAST AND NORTH AFRICA REGION | ECONOMIC UPDATE OCTOBER 2022
The sponsorship system has long been subject to condemnation, with international organizations and civil society calling for replacement by an alternative labor migration governance policy. The system may be impeding internal labor market mobility and sustaining situations of forced labor, as highlighted in the International Labor Organization’s (2017) report on employer-migrant worker relationships in the Middle East. The sponsorship system inherently emphasizes the temporary nature of contract labor, which might discourage social cohesiveness. Furthermore, citizenship rights are unavailable to migrant workers even if the worker lives in the country for a long time. These unfavorable migration policies are found, in some instances, to be associated with migrants over-staying in destination countries and development of undocumented migration and irregular forms of employment. As shown in Elmallakh and Wahba (2021), undocumented migration experiences are not only associated with worse labor market conditions in destination countries, as reflected by lower-ranked occupations and lower wages and savings, but also with long-term penalties that persist even after migrants return to their home country, as reflected by lower wages upon return.
Alternative labor migration governance policies are needed, in particular, when it comes to reforming admission system and bolstering protection of migrant workers. Some GCC countries have started to incrementally reform the sponsorship system in recent years. For instance, under the sponsorship system, workers could not transfer employment or leave the country without obtaining a written approval from their sponsor. In recent years, these mobility restrictions were lifted in Saudi Arabia and the United Arab Emirates. Likewise, the United Arab Emirates is currently implementing new regulations to attract specialists and exceptional talents for long-term residency under updated Golden Visa and Green Visa rules. These changes would allow workers to stay longer in the country since employment will no longer be tied to employer sponsorship (Fragomen, 2022). Other GCC countries should also seek new governance frameworks aiming to protect migrant workers against forced labor and abuse by ensuring implementation and enforcement of labor laws (Khan and Harroff-Tavel 2011), and facilitate assimilation of migrant workers by granting employment rights, residency permits, and potential citizenship paths.
Refugee Governance Policy: Improving the Lives of Refugees in Jordan and Lebanon
Better governance in destination countries should focus on improving migrants’ and refugees’ welfare. As highlighted in Section 2.2, 27 percent of refugees and asylum seekers from Middle Eastern and North African countries were hosted in other Middle Eastern and North African countries in 2020 (UNHCR 2021). Jordan and Lebanon, neighbors to Syria, hosted 11 percent and 9 percent of total refugees and asylum seekers from Middle Eastern and North African countries in 2020, respectively. Lenner and Schmelter (2016) provide an excellent review of Jordan’s and Lebanon’s policies in hosting Syrian refugees and analyze the condition of Syrian refugees in both countries. The analysis highlights that both countries could improve their refugee governance framework across multiple dimensions.
First, a legal framework governing hosting of refugees needs to be developed in both countries. Neither Jordan nor Lebanon has signed the 1951 Geneva convention, and neither has specific asylum laws (Lenner and Schmelter 2016). Therefore, cooperation with UNHCR is based on a memorandum of understanding. In Jordan, UNHCR registers Syrians as refugees, and there is a process of status verification that requires all Syrians to register with the closest police station to obtain a Jordanian identity card, but the Lebanese government does not recognize UNHCR registration as a type of legal status for refugees because of the lack of an updated memorandum of understanding pertaining to Syrian refugees. In Lebanon, this has placed most Syrian refugees in a precarious position.
167C HAPTER 8: G OVERNANCE , M IGRATION , AND F ORCED D ISPLACEMENT IN THE M IDDLE E AST AND N ORTH A FRICA A NEW STATE OF MIND: GREATER TRANSPARENCY AND ACCOUNTABILITY IN THE MIDDLE EAST AND NORTH AFRICA PART II: THE LEARNING STATE
Likewise, it is important to improve the housing and mobility conditions of Syrian refugees in Jordan and Lebanon. In Jordan, the government attempted to channel all displaced Syrians into refugee camps, but exit from the refugee camp system was made possible through a sponsored bailout procedure. This led very large Syrian refugee populations to live outside camps in Jordan—an estimated 80 percent according to Lenner and Schmelter (2016)—which in turn led to tightened controls over camp residents and suspension of the bailout procedure in 2015. These regulations strongly curtailed the mobility of Syrian refugees residing in camps in Jordan. Meanwhile, for security reasons, the Lebanese government maintained a strong position against establishment of refugee camps. This decision was associated with widely different living conditions for refugees in Lebanon. Approximately half of the Syrian refugees in Lebanon lived in regular accommodations, whereas others lived in informal tented settlements and other precarious housing situations. Since this evidence was published in 2016, the situation of refugees in Jordan has improved significantly both in terms of the number of refugees that live in camps and with regards to their mobility.
Finally, improving the refugee governance framework in destination countries would also entail eliminating barriers that refugees face in accessing formal work opportunities. In Jordan and Lebanon, difficult access to the labor market led refugees to work in the informal sector as a highly exploitable workforce receiving low wages (Lenner and Schmelter 2016). It is therefore of utmost importance that host countries commit to facilitating formalized access to the labor market for refugees, while supporting employers who face increased fees and social security contributions by regularizing the refugee workforce. Jordan took some steps in this direction in 2016 by waiving fees and easing requirements to obtain work permits, yet most refugees continue to have limited access to the formal economy, because the number of work permits issued is very low relative to the size of the refugee population.
6. Concluding remarks
Adopting a governance-centered approach to the study of migration is crucial because it allows for a more-informed understanding of governance failures in origin countries and of the effects of migration policy in destination countries on migrants’ welfare.
The analysis provided in this chapter shows that governance matters for migration from the perspectives of sending and receiving countries. The chapter underscores the urgency for Middle Eastern and North African countries to improve governance in multiple dimensions, including restoring trust in economic institutions and improvement of their performance, ensuring higher levels of political freedom and civil liberties for citizens, maintaining political stability, and proactively engaging in the global climate change policy response. The chapter also highlights the important role that migration institutions in destination countries play in terms of better labor market integration for migrants, greater social cohesiveness and assimilation, and better migrant welfare.
Improving governance in origin and destination countries is beneficial not only for migrants and refugees, but also for origin and receiving countries. If governance challenges remain unaddressed in Middle Eastern and North African origin countries, the region is likely to experience even larger migrant and forcibly displaced flows (refugees, asylum seekers, IDPs). Given the region’s large population, destination countries’ labor markets will not be able to absorb these massive inflows, and people in the Middle East and North Africa are likely to face the consequences of internal forced displacement—leaving these countries unprepared to face these internal massive shocks. Better governance in destination countries would benefit migrants and refugees, who would have better labor market conditions and greater
168 C HAPTER 8: G OVERNANCE , M IGRATION , AND F ORCED D ISPLACEMENT IN THE M IDDLE E AST AND N ORTH A FRICA MIDDLE EAST AND NORTH AFRICA REGION | ECONOMIC UPDATE OCTOBER 2022
degrees of labor mobility and be subject to less abuse and forced labor. Destination countries will likewise directly benefit from greater immigrant and refugee assimilation associated with a stronger rule of law and better labor migration and refugee governance schemes.
References
Abel, G. J., Brottrager, M., Cuaresma, J. C., and Muttarak, R. (2019). “Climate, Conflict and Forced Migration.” Global Environmental Change, 54, pp. 239-249. https://doi.org/10.1016/j.gloenvcha.2018.12.003.
Arezki, Rabah, Daniel Lederman, Nelly El-Mallakh, Asif Mohammed Islam, Amani Abou Harb, Ha Ming Nguyen, and Marwane Zouaidi. (2020). How Transparency Can Help the Middle East and North Africa. MENA Economic Monitor. Washington, DC: World Bank. April.
Ariu, A., Docquier, F., and Squicciarini, M. P. (2016). “Governance Quality and Net Migration Flows.” Regional Science and Urban Economics, 60, pp. 238-248. https://doi.org/10.1016/j.regsciurbeco.2016.07.006.
Ashby, N. J. (2010). “Freedom and International Migration.” Southern Economic Journal, 77(1). pp. 49-62.
Backhaus, A., Martinez-Zarzoso, I., and Muris, C. (2015). “Do Climate Variations Explain Bilateral Migration? A gravity model analysis.” IZA Journal of Migration, 4(1), pp. 1-15.
Beine, M., Docquier, F., and Rapoport, H. (2008). “Brain Drain and Human Capital Formation in Developing Countries: Winners and Losers.” Economic Journal, 118(528), pp. 631-652.
Beine, M., Docquier, F., and Oden-Defoort, C. (2011). “A Panel Data Analysis of the Brain Gain.” World development, 39(4), pp. 523-532.
Beine, M., and Parsons, C. (2015). “Climatic Factors as Determinants of International Migration.” Scandinavian Journal of Economics, 117(2), pp. 723-767.
Bertocchi, G., and Strozzi, C. (2008). “International Migration and the Role of Institutions.” Public Choice, 137(1), pp. 81-102.
Cai, R., Feng, S., Oppenheimer, M., and Pytlikova, M. (2016). “Climate Variability and International Rigration: The Importance of the Agricultural Linkage.” Journal of Environmental Economics and Management, 79, pp. 135151. https://doi.org/10.1016/j.jeem.2016.06.005
Cattaneo, C., and Peri, G. (2016). “The Migration Response to Increasing Temperatures.” Journal of Development Economics, 122, pp. 127-146. https://doi.org/10.1016/j.jdeveco.2016.05.004
Chung, K., Choi, S., and Lee, C. W. (2015). “Analysis on Employment and Work Life of Skilled Migrant Workers Transited from EPS Visa.” IOM MRTC Policy Report 2015-01
Damir-Geilsdorf, S., and Pelican, M. (2019). “Between Regular and Irregular Employment: Subverting the Kafala System in the GCC Countries.” Migration and Development, 8(2), pp. 155-175.
Docquier, F., and Rapoport, H. (2012). “Globalization, Brain Drain, and Development. Journal of Economic Literature, 50(3), pp. 681-730.
Drabo, A., and Mbaye, L. M. (2015). “Natural Disasters, Migration and Education: An Empirical Analysis in Developing Countries.” Environment and Development Economics, 20(6), pp. 767-796.
Elmallakh, N., and Wahba, J. (2021). “Return Migrants and the Wage Premium: Does the Legal Status of Migrants Matter?” Journal of Population Economics, 35(4), pp. 1631–1685.
169C HAPTER 8: G OVERNANCE , M IGRATION , AND F ORCED D ISPLACEMENT IN THE M IDDLE E AST AND N ORTH A FRICA A NEW STATE OF MIND: GREATER TRANSPARENCY AND ACCOUNTABILITY IN THE MIDDLE EAST AND NORTH AFRICA PART II: THE LEARNING STATE
Fan, C. S., and Stark, O. (2007). “The Brain Drain, ‘Educated Unemployment’, Human Capital Formation, and Economic Betterment 1.” Economics of Transition, 15(4), pp. 629-660.
Fasani, F., Frattini, T., and Minale, L. (2021). “Lift the Ban? Initial Employment Restrictions and Refugee Labour Market Outcomes.” Journal of the European Economic Association, 19(5), pp. 2803-2854.
Fragomen. (2022). “United Arab Emirates: Expanded Entry and Residency Visa Rules Forthcoming.” https://www. fragomen.com/insights/united-arab-emirates-expanded-entry-and-residency-visa-rules-forthcoming.html
Gibney, M., Cornett, L., Wood, R., Haschke, P., Arnon, D., Pisanò, A., Barrett, G., and Park, B. (2021). “The Political Terror Scale 1976-2020.” https://www.politicalterrorscale.org/
Govind, Y. (2021). “Is Naturalization a Passport for Better Labor Market Integration? Evidence from a Quasi-Experimental Setting.” Working Paper No. 2021 – 42. Paris School of Economics, Paris, France.
Hegre, H., and Nygård, H. M. (2015). “Governance and Conflict Relapse.” Journal of Conflict Resolution, 59(6), pp. 984-1016.
International Labor Organization. (2017). Employer-Migrant Worker Relationships in the Middle East: Exploring Scope for Internal Labour Market Mobility and Fair Migration. International Labor Organization, Geneva.
Islam, A. M., Moosa, D., and Saliola, F. (2022). Jobs Undone: Reshaping the Role of Governments Toward Markets and Workers in the Middle East and North Africa. World Bank, Washington, DC.
Karemera, D., Oguledo, V. I., and Davis, B. (2000). “A Gravity Model Analysis of International Migration to North America.” Applied Economics, 32(13), pp. 1745-1755.
Khan, A., and Harroff-Tavel, H. (2011). “Reforming the Kafala: Challenges and Opportunities in Moving Forward.” Asian and Pacific Migration Journal, 20(3-4), pp. 293-313.
Lenner, K., and Schmelter, S. (2016). “Syrian Refugees in Jordan and Lebanon: Between Refuge and Ongoing Deprivation.” IEMed Mediterranean Yearbook, pp. 122-126.
Melde, S., Milan, A., Shivakoti, R., Roy, S. Y., Martineau, D., and Laczko, F. (2019). “Migration Governance Indicators: A Global Perspective.” International Organization for Migration. https://publications.iom.int/system/files/pdf/mgia-global-perspective.pdf
Moore, W. H., and Shellman, S. M. (2004). “Fear of Persecution: Forced Migration, 1952-1995.” Journal of Conflict Resolution, 48(5), pp. 723-745.
Mountford, A., and Rapoport, H. (2011). “The Brain Drain and the World Distribution of Income.” Journal of Development Economics, 95(1), pp. 4-17.
Nejad, M. N., and Young, A. T. (2016). “Want Freedom, Will Travel: Emigrant Self-Selection According to Institutional Quality.” European Journal of Political Economy, 45, pp. 71-84. https://doi.org/10.1016/j.ejpoleco.2016.06.002.
Pierre, J., and Peters, B. G. (2000). Governance, Politics and the State. Basingstoke: Macmillan.
Peters, B. G., and Pierre, J. (2005). “Governance, Government and the State.” In C. Hay, M. Lister and D. Marsh, The State: Theories and Issues (pp. 209-222). Red Globe Press, New York.
Poprawe, M. (2015). “On the Relationship Between Corruption and Migration: Empirical Evidence from a Gravity Model of Migration.” Public Choice, 163(3), pp. 337-354.
Rahman, M. (2018). “Governance Matters: Climate Change, Corruption, and Livelihoods in Bangladesh.” Climatic Change, 147(1), pp. 313-326.
Schon, J. (2019). “Motivation and Opportunity for Conflict-Induced Migration: An Analysis of Syrian Migration Timing.”
Journal of Peace Research, 56(1), pp. 12-27.
Seven, Ü. (2022). “Armed Conflict, Violence, and the Decision to Migrate: Explaining the Determinants of Displacement in Syria.” Migration and Development, 11(3), pp. 1-17. https://doi.org/10.1080/21632324.2020.1859177.
170 C HAPTER 8: G OVERNANCE , M IGRATION , AND F ORCED D ISPLACEMENT IN THE M IDDLE E AST AND N ORTH A FRICA MIDDLE EAST AND NORTH AFRICA REGION | ECONOMIC UPDATE OCTOBER 2022
Tanner, T., Mitchell, T., Polack, E., and Guenther, B. (2009). “Urban Governance for Adaptation: Assessing Climate Change Resilience in Ten Asian Cities.” IDS Working Papers, 2009(315), pp. 1-47.
UNDESA (United Nations Department of Economic and Social Affairs, Population Division). (2019). World Population Prospects 2019. Online Edition, Rev. 1 (accessed April 21, 2022), https://population.un.org/wpp/Download/ Standard/Population/.
UNDESA (United Nations Department of Economic and Social Affairs, Population Division). (2020). International Migrant Stock 2020. https://www.un.org/development/desa/pd/content/international-migrant-stock.
UNHCR (United Nations High Commissioner for Refugees). (2021). UNHCR Refugee Population Database, (accessed March 31, 2022). https://www.unhcr.org/refugee-statistics/.
Vogler, M., and Rotte, R. (2000). “The Effects of Development on Migration: Theoretical Issues and New Empirical Evidence.” Journal of Population Economics, 13(3), pp. 485-508.
Wig, T., and Tollefsen, A. F. (2016). “Local Institutional Quality and Conflict Violence in Africa.” Political geography, 53, pp. 30-42. https://doi.org/10.1016/j.polgeo.2016.01.003.
Williams, D. S., Celliers, L., Unverzagt, K., Videira, N., Máñez Costa, M., and Giordano, R. (2020). “A Method for Enhancing Capacity of Local Governance for Climate Change Adaptation.” Earth's Future, 8(7): e2020EF001506. https:// doi.org/10.1029/2020EF001506
171C HAPTER 8: G OVERNANCE , M IGRATION , AND F ORCED D ISPLACEMENT IN THE M IDDLE E AST AND N ORTH A FRICA A NEW STATE OF MIND: GREATER TRANSPARENCY AND ACCOUNTABILITY IN THE MIDDLE EAST AND NORTH AFRICA PART II: THE LEARNING STATE
Chapter 9: The Land Sector in the Middle East and North Africa Governance Challenges and Opportunities
by Harris Selod, Anna Corsi, Myriam Ababsa, and Caleb Johnson
MIDDLE EAST AND NORTH AFRICA REGION | ECONOMIC UPDATE OCTOBER 2022
1. Introduction
The Middle East and North Africa is the most land-scarce region in the world, and this scarcity is expected to become a major problem soon, considering that demand for land is projected to increase because of demographic trends, whereas supply is expected to shrink because of climate and governance factors. These trends are happening at the same time the region is facing a dramatic social and political transformation, and businesses and people, especially women, face substantial barriers to accessing land. Inefficient allocation of land and heavy control by the state of the land sector reduce the effectiveness of local economic development policies of Middle East and North Africa countries in responding to the current crises.
In the region, the land sector faces entrenched social, institutional, and political hurdles that restrict access to land and prevent its efficient use, exacerbating broader development challenges such as social inequality and climate change. These hurdles originate in formal and informal norms that are ubiquitous in the region and shape social expectations, define rules, and influence individual and collective behaviors. More generally, formal and informal norms in the Middle East and North Africa have wide-ranging implications for governance of the land sector, affecting the architecture of institutions, or the overall structure that governs land, starting with the definition and enforcement of property rights specific to the region and the functions that various stakeholders in the land sector perform (branches of central and local governments, customary institutions, courts, financial institutions, professional and civil society organizations). The norms regarding land also affect the mechanisms whereby land is managed, accessed, and developed, including through public and private land management practices and land use regulations that prevail in the region. Norms are also reflected in the central role that governments play in land ownership and management and in the policy objectives or strategies that those governments pursue.
The objective of this chapter, largely drawing from the recent report Land Matters (Corsi and Selod 2022), is to discuss the origin and specificity of the norms that govern the land sector in the Middle East and North Africa and to highlight how these norms shape and influence economic contexts and behaviors regarding land. The chapter also discusses the economic and social implications of such norms and behaviors in the land sector, stressing their contribution to inefficient land allocation and ineffectiveness of economic development policies. Finally, the chapter presents directions for policy reform to improve land governance.
2. Norms about land in the Middle East and North Africa
To a large extent, Middle Eastern and North African countries share a common history with roots in Mesopotamia and the Arabian peninsula that various empires, colonization, and finally the emergence of independent states shaped over centuries. This common history shaped culture in general, and norms in particular, and continues to play an important role that affects social and economic relations. As far as land is concerned, four broad sets of norms have influenced and continue to influence collective attitudes, legal frameworks, and practices by individuals, firms, and public institutions: religious principles, customary norms, attitudes toward women, and the role of the state.
173CHAPTER 9: THE LAND SECTOR IN THE MIDDLE EAST AND NORTH AFRICA GOVERNANCE CHALLENGES AND OPPORTUNITIES A NEW STATE OF MIND: GREATER TRANSPARENCY AND ACCOUNTABILITY IN THE MIDDLE EAST AND NORTH AFRICA PART II: THE LEARNING STATE
Islamic Principles and Land Tenure Categories
In a region where societies have been governed under different forms of an Islamic Empire since the emergence of Islam in the mid-7th century until the Ottoman Empire ended in the early 20th century, core Islamic principles have largely influenced land systems and land relations. Although norms and practices governing the land sector have evolved and adapted throughout history as the empire expanded and absorbed new territories or with regime changes, they have retained consistency around fundamental Islamic principles that still exert influence on land legislation. These principles were codified during the Ottoman Empire into the Ottoman Land Code (1858), which incorporated them into legislation whose objective was to modernize the Ottoman legal framework while maintaining consistency with shari'a law (the rules by which Islamic societies are governed). The code, which was intended to be uniformly applied throughout the Ottoman Empire, encouraged individual ownership and established a registration system (tapu) to facilitate investment, enable greater state control, and increase revenues from taxes. Most notably, it created five broad land tenure categories that originated in shari'a law that are still in use to some degree in the region: privately own land (mulk); religiously endowed land held in charitable trust (waqf); state-owned land (miri) that provides usufruct rights to landholders who can use, exploit, and dispose of the land; collective or public domain land (matruka); and unclaimed or “dead” land (mawat). A sixth category of land tenure, musha', was not included into the Land code. It corresponds to commonly held land (for agriculture) which tenure and usufructuary rights were held in collective ownership by villagers and was not subject to taxation.
The relative importance of each of these six categories has changed over the past two centuries, with the post-Ottoman period emphasizing privatization over collective or communal forms of tenure and property registration. During the colonial period, the British and French introduced various forms of registration systems of formal rights and further eroded collective forms of tenure by promoting private property to accommodate appropriation of land by settlers and reward local clienteles. The idea was to convert musha' land into privately owned land to increase yields (Fischbach, 2000). In contrast, during the post-independence period, state land ownership was encouraged through nationalization of colonial properties and incorporation of tribal lands into public land. In parallel, many governments attempted to incorporate the principles of shari'a through “bureaucratization” (incorporation into state laws). This was particularly applied to the management of waqf—with attempts to limit or eliminate private waqf—and appropriation of nonprivate land (miri, mawat, matruka, musha'). Understanding these categories and how they have changed over time is crucial to understanding the complexity of today’s land tenure systems throughout the region and many of the current challenges and debates regarding tensions between and recognition of the different types of tenure situations.
Customary Land Relations and Tribal Land
Norms governing land do not reflect only Islamic principles because other traditions rooted in Middle Eastern and North African societies have also retained a role. Throughout history and from the very beginning of Islam, shari'a law was not meant to replace preexisting tenure systems. Instead, it accommodated them as long as they did not contradict core Islamic principles. As a consequence, many land tenure arrangements for tribal communities remained largely the same and maintained the same degree of legitimacy as before the advent of Islam. These customary forms of tenure (‘urf) often specified how land could be used (e.g., for cultivation, grazing) and who could use land. In general, such tenure arrangements were confined to specific communities and served to avoid loss of land to external actors. The concept of musha' land, although an Islamic land tenure category, is almost entirely based on customary law of tribes and villages
174 CHAPTER 9: THE LAND SECTOR IN THE MIDDLE EAST AND NORTH AFRICA GOVERNANCE CHALLENGES AND OPPORTUNITIES MIDDLE EAST AND NORTH AFRICA REGION | ECONOMIC UPDATE OCTOBER 2022
applied to collective ownership. Even though ambiguity may exist in today’s legal frameworks regarding the official status of such land, a significant portion of rural land can still be considered musha' because it is governed under such rules of collective ownership. In Lebanon, for instance, it is estimated that musha' land makes up approximately 20 percent of the country’s total land area. In Morocco, collective land is believed to represent more than 40 percent of the land mass. It is also very common in Jordan.
Attitudes Regarding Women’s Access to Land
Other norms that play a significant role in land relations are the entrenched attitudes in Middle Eastern and North African countries that restrict women’s access to and control over land assets. Even though there are variations between countries, all legal frameworks in the region tend to favor men over women, reflecting Islamic inheritance principles whereby men and women are ascribed different roles in society and thus different inheritance shares.1 These imbalances are reflected in the World Bank Women, Business, and the Law index, which assesses legal constraints on women’s economic independence using eight indicators, including the assets indicator, which measures gender differences in property and inheritance. Figure 1 plots the regional average of the Women, Business, and the Law assets indicator since 1970, showing that the Middle East and North Africa has consistently ranked at the bottom, with no improvement over time, contrary to other regions. The fact that reforms are often seen as a challenge to jurisprudence and to widely accepted social norms is a likely explanation for the lack of reform. Of 10 countries surveyed by the Arab Barometer (2020), only in Lebanon did most people believe that women’s inheritance share should be equal to that of men.
to Women, Business, and the
been considered a major source of income
to take care of their family. Families are thus often reluctant to give land shares to women who, once married, would pass valuable assets to their husband’s family. In contradiction to the law, women are often denied their right to inherit land or are not paid fair compensation for not receiving their share of the land. In all countries in the region, it is common that women are simply excluded from inheritance and pressured to renounce their rights voluntarily in favor of other male heirs—a practice known as takharruj
Figure 1. Favorability of legal frameworks governing asset management to women according
Law Indicator and region, 1970–2020 Average WBL score in asset management 1970 1972 1974 1976 1978 1980 1982 1984 1986 1988 1990 1992 1994 1996 1998 2000 2002 2004 2006 2008 2010 2012 2014 2016 2018 2020 100 90 80 70 60 50 40 ▬ EAP ▬ ECA ▬ High income OECD ▬ LAC ▬ MENA ▬ SA ▬ SSA Source: World Bank 2020. Note: OECD = Organization for Economic Cooperation and Development. Traditionally, land has
for men
. 1 The share of a daughter is half of that of a son, although in Islam, spouses can inherit. In the case of inheritance from a spouse, only the United Arab Emirates grants equal inheritance rights to men and women. 175CHAPTER 9: THE LAND SECTOR IN THE MIDDLE EAST AND NORTH AFRICA GOVERNANCE CHALLENGES AND OPPORTUNITIES A NEW STATE OF MIND: GREATER TRANSPARENCY AND ACCOUNTABILITY IN THE MIDDLE EAST AND NORTH AFRICA PART II: THE LEARNING STATE
The Role of the State
Attitudes concerning land also affect the role given to the state (or that governments perceive to be the legitimate role of the state) regarding land. Because Middle Eastern and North African societies have very strong governments, states exert considerable control over land and land matters. Looking back at history, one sees that states have usually been heavily involved in the land sector, whether through direct ownership of public land or through policies designed to change the nature of land rights or to redistribute land to serve social objectives or in some cases to reward political allies. The omnipresence of states in land affairs, along with involvement of numerous institutions, is still a key feature of the land sector in most Middle Eastern and North African countries.
3. How norms affect land governance in Middle Eastern and North African countries
The norms that govern land in the region have far-reaching impacts because they define important characteristics of the legal and institutional frameworks relevant to land. To some extent, they also determine the constraints that state actors, firms, and households face and that influence their behaviors.
Legal Pluralism and Outdated Legal Frameworks
Layers of customary and statutory regimes have accumulated throughout history, stemming in particular from the succession of nineteenth-century Ottoman laws, early twentieth-century colonial laws, and post-independence laws. This accumulation of layers has resulted in complex legal frameworks governing land and continuation of the use of fragmented land tenure categories. It has also led to legal pluralism and resulting ambiguities. Generally, land-related laws are not only complex, but also outdated and disconnected from current contexts. This renders recognition and enforcement of property rights particularly ineffective. To make things worse, instead of completely overhauling these legal frameworks to meet current challenges, most countries have introduced amendments to address challenges as they have emerged. For example, Lebanon still relies on legislation that dates to the French mandate period, including a real estate registration law that was enacted in 1926. Because the law was formulated a century ago, it is not in line with the current context, which requires digitized land services and e-government.
Centralized and Nontransparent Control of Land
Because of a strong tradition of state intervention in the postindependence period, states have become omnipresent— and in some cases omnipotent—in land affairs, which has many implications for how the land sector functions. Throughout the region, central state institutions have significant control over land, including valuable land in urban and rural areas. State ownership and public use of land are more common in the region than in anywhere else in the world. This accompanies centralized management of land, with central state institutions tending to be the primary authorities in land matters and local authorities usually having narrow mandates over land. In some cases, the limited mandate of local authorities can undermine development responses tailored to the local environmental and social contexts.
176 CHAPTER 9: THE LAND SECTOR IN THE MIDDLE EAST AND NORTH AFRICA GOVERNANCE CHALLENGES AND OPPORTUNITIES MIDDLE EAST AND NORTH AFRICA REGION | ECONOMIC UPDATE OCTOBER 2022
In a context in which states have a strong grip on land resources, and state actors exert nontransparent control over land, corruption, elite capture, and cronyism are common. Analyzing recent country reports from the Bertelsmann Transformation Index project reveals that corruption, political interference, or cronyism invaded property rights in 16 of the 17 Middle Eastern and North African countries that the project covered. Figure 2 highlights the negative correlation between the strength of property rights (measured by the Bertelsmann Transformation Index) and perceptions of corruption (measured by the Transparency International Corruption Perceptions Index). Although no causality can be inferred from this correlation, it suggests that weak land governance is fertile ground for corruption. Discretionary state land allocation practices and opaque processes of land conversion, especially regarding conversion to urban use, are particularly ripe for corruption.
Institutional Fragmentation and Overlaps in Mandates
Corruption and lack of protection of property rights in the Middle East and North Africa
State control over land is also reflected in the multiplicity of institutions with land mandates, which leads to institutional fragmentation at the central level, which combined with unreliability of the land administration infrastructure, complicates information sharing and makes coordination across central state institutions ineffective. Countries in the region have up to 10 institutions competing for responsibilities regarding management of state land—an obstacle to efficient management land and implementation of land policies.
Failure to Provide Land-Related Services and Limits on Credit and Mortgage Markets
With the exception of Gulf countries, most countries in the Middle East and North Africa face severe challenges in providing registration services. An important challenge stems from legal pluralism and the absence of adequate legal provisions to recognize customary uses and rights whose legal status often remains ambiguous. Another challenge results from lack of transparency and vested interests that prevent clear definition and strong protection of rights. Limited capacity and insufficient funding also prevent significant improvement of registration services. The low levels of land registration that ensue have trickle-down effects that limit credit and mortgage markets. The inability to use nonregistered land as a collateral, which in turn restricts firm and household access to funds for investment, further compounds this.
Figure 2.
Corruption Perceptions Rank (TI, 2019) 200 150 100 50 0 24 68 10 ARE SAU OMN QAT JOR TUN MAR BHR KWT LBN EGYDZA DJI IRQ IRN LBY YMNSYR Property rights (BTI, 2020) Source: Bertelsmann Stiftung 2020; Transparency International 2019. Note: This graph plots the country rank for Transparency International’s Corruption Perceptions Index against the Bertelsmann Transformation Index property rights score, which measures the extent to which government authorities ensure well-defined rights of private property and regulate acquisition, benefits, use, and sale of property (range 0 (poor) to 10 (excellent)). 177CHAPTER 9: THE LAND SECTOR IN THE MIDDLE EAST AND NORTH AFRICA GOVERNANCE CHALLENGES AND OPPORTUNITIES A NEW STATE OF MIND: GREATER TRANSPARENCY AND ACCOUNTABILITY IN THE MIDDLE EAST AND NORTH AFRICA PART II: THE LEARNING STATE
Failure to Provide Land to the Economy Appropriately
Overall, Middle Eastern and North African governments do not supply the economy appropriately with land. In several countries, urban development has long relied on public authorities providing land, but such land is often no longer available in suitable locations. When public land is mobilized, it is often done through allocations that do not follow market principles: Land is not transferred at market value—which redistributes rents and wealth to the beneficiaries of such allocations—or it is not transferred to the most productive users, who should be willing to pay more for the land. Policy makers often justify their mistrust in markets and the practice of below-market allocation by claiming that it is necessary to maintain equity of access and affordability of land for lower- and middle-income individuals, although whether these are the actual outcomes is usually not monitored.
Factors including lack of clear property rights, inappropriate infrastructure for market valuation of land, and speculative behavior that results in large quantities of land in urban areas being idle also limit the provision of formal land to Middle Eastern and North African economies. This exerts upward pressure on formal land prices that are often unaffordable to a large fraction of the population.
Public authorities often lack comprehensive records of the land and property that they own and do not know the true value of these assets, which affects their ability to make informed decisions about land use and disposal. Despite high levels of state ownership, inventories of state-owned land tend to be inaccurate or incomplete, and the boundaries of public land are often not delineated. Because many governments throughout the region do not know what land they own, they cannot leverage public land to provide adequate services or implement social programs.
Failure to Leverage Revenues from the Land Sector
Municipalities tend to lease their land at low prices to the private sector for private development, without receiving sufficient development fees or betterment levies that would benefit residents. Land value capture mechanisms are outdated or very simple and, in most cases, municipalities do not have the legislative power to impose land value capture.
Moreover, there is no tradition of property taxation in the region. Although Gulf Cooperation Council windfall economies may not perceive the need to use property taxation to generate revenue, there are obstacles to establishing property taxation systems throughout the region because of social norms, lack of political acceptance, and technical difficulties due to low coverage of registries. Numerous exemptions that were progressively introduced to placate vested interests or avoid social discontent, which ultimately defeats the purpose of a property tax, can explain in part these low levels of property taxation. This said, all countries in the region have some kind of tax on real estate transactions, which is easier to implement than property taxation and politically more acceptable. The weakness or absence of property taxation and inadequate management of land result in governments not optimizing revenue from land, even from land and property assets that they own. In Middle Eastern and North African economies, property tax rates range from 0.02 percent to 1.6 percent of gross domestic product, which is much lower than in Organization for Economic Cooperation and Development countries, where revenues from property tax can reach 4 percent of gross domestic product.
178 CHAPTER 9: THE LAND SECTOR IN THE MIDDLE EAST AND NORTH AFRICA GOVERNANCE CHALLENGES AND OPPORTUNITIES MIDDLE EAST AND NORTH AFRICA REGION | ECONOMIC UPDATE OCTOBER 2022
Policy Challenges
In the Middle East and North Africa, the implicit social contract requires that the state be a provider of welfare, with important expectations regarding access to land. Many policies regarding land have involved some form of land redistribution (in particular after nationalization of land that settlers previously owned and the state now controls). The objectives have been to support development of agriculture or social stability and fulfill expectations of governments’ role. Although these objectives are laudable, in most countries where they were implemented, redistributive reforms soon fell into cronyism and patrimonialism, with land distributed to political allies or stakeholders with vested interests. Autocratic regimes in particular used these patronage systems of governance to confiscate land and favor supporting groups. In some cases, redistribution policies handing small plots to recipients have resulted in fragmentation of agricultural land, a pervasive problem in the region.2
Use of land to pursue food sovereignty and food security objectives is not exempt from challenges. In a context of diminishing food self-sufficiency (because of demographic growth and scarce agricultural land) and increasing vulnerability to rising volatility in commodity prices, some countries have tried to reduce food import dependence by providing incentives to increase or intensify cultivation of land for domestic agricultural production. These policies—which only very partially mitigate the trend toward greater food dependency—have been implemented with little consideration of environmental impacts. Incentives to increase the quantity of land moved to cultivation and to shift crop choices toward water-intense varieties have exacerbated water depletion and land degradation.
Land Access Constraints
In addition to their impact on the institutional context and the behavior of state actors, norms governing land limit access to land of firms and people. Analyzing data from the World Bank Enterprise Surveys shows that 23 percent of manufacturing firms in the Middle East and North Africa find that access to land is a major or severe constraint on their business operations, which is likely to reduce their productivity and profitability. Confirming the role of state favoritism and cronyism, further analysis of the same data shows that firms with political connections (with top officers that have been elected or appointed to a political position) have better access to land.
Finally, the high levels of tenure informality that prevail in Middle Eastern and North African countries reflect not only poverty and inequality, but also poor land governance, social norms, and perceptions. To some extent, it can be argued that low levels of registration in the region partly stem from the limited trust that populations have in their governments—with a noticeable decline in trust since the Arab Spring
to
Slums and cost of property registration in Middle Eastern and North African countries
according
the Arab Barometer surveys 2 Other factors contributing to land fragmentation include subdivision of land after inheritance and obstacles to land transfers and consolidation of unregistered land. Figure 3.
Share of urban population in slums 100 80 60 40 20 0 0102030 SYR JOR MARTUN EGY SAU IRN IRQ LBN DJIYEM Cost of registration z MENA z Rest of the world Source: World Bank. “Population living in slums (% of urban population) (database), https://data. worldbank.org/indicator/en.pop.slum.ur.zs; World Bank. “Doing Business 2004–2020 (database). https:// archive.doingbusiness.org/en/doingbusiness 179CHAPTER 9: THE LAND SECTOR IN THE MIDDLE EAST AND NORTH AFRICA GOVERNANCE CHALLENGES AND OPPORTUNITIES A NEW STATE OF MIND: GREATER TRANSPARENCY AND ACCOUNTABILITY IN THE MIDDLE EAST AND NORTH AFRICA PART II: THE LEARNING STATE
(Teti et al., 2018). Unreliable, nontransparent land services; complex formalization procedures; lack of incentives to maintain formal property rights; and lack of perception of benefits arising from formal tenure all contribute to a high prevalence of informal land transactions. Lack of capacity of local governments to plan formal urban development and lack of clear processes to integrate customary rights into the statutory system exacerbate this. In addition, the restricted supply of formal land in cities and the high costs of registration make formal land and housing unaffordable for a large fraction of the population, as Figure 3 below, which plots the share of urban slums in Middle Eastern and North African countries against the cost of property registration (measured as a percentage of property value) illustrates.3 The positive association suggests that financial barriers to registration are an important driver of urban informal housing.4
4. Economic and social implications of weak land governance in the Middle East and North Africa
Weak land governance in the Middle East and North Africa results in inefficient, unsustainable, inequitable access to and use of land, which has severe implications for the economy.
Inefficient Allocation and Use of Land (Misallocation)
In the Middle East and North Africa, governance constraints and mistargeted land policies introduce distortions to the economy that may lead to suboptimal use of land, which in turn can have economic, environmental, and social costs. Such distortions may stem from nonmarket pricing of land, high land transaction costs, land tenure insecurity, or credit constraints, which are all important characteristics of the land sector in the region. For example, when land is held informally, it reduces access to credit, which in turn can lead to underinvestment in land, low agricultural production, and limited job creation. Incentives for investment in agriculture that do not account for environmental impacts can lead to water pollution and depletion, land degradation, and less capacity to respond to the challenges of climate change. The policies and social processes that lead to land fragmentation can also result in lower productivity by preventing economies of scale from land consolidation.
For firms, difficult or biased access to land can result in misallocation of land as a factor of production if nonproductive firms and sectors disproportionately use land at the expense of more productive firms and sectors. If this is the case, the aggregate output is lower than would have been possible if land had been more efficiently allocated within the economy.
The economy can also organize spatially in ways that are inefficient and unsustainable. This is likely to occur when land is poorly managed, mechanisms governing land allocation do not follow market principles, access to land is constrained, or there are perverse institutional or regulatory constraints. Examples of such practices include laws and regulations that produce adverse outcomes (e.g., floor area ratio ceilings or minimum lot size requirements that produce sprawl in cities). Several cities in the Middle East and North Africa have vacant land and vacant residential units, which reflects suboptimal use of urban space. This may have various explanations ranging from practices of speculative landholding to obstacles that hinder construction or exemptions of vacant residential units from property taxation that give owners an incentive to maintain their properties empty.
3 The ratio of property registration costs to property value is from the Doing Business database, which the World Bank recently discontinued because of irregularities that do not affect the data used in this chapter.
4 It is estimated that more than 24 percent of the urban population in the region lives in slums and that the proportion of the urban population residing informally—a larger category than slums—is significantly greater.
180 CHAPTER 9: THE LAND SECTOR IN THE MIDDLE EAST AND NORTH AFRICA GOVERNANCE CHALLENGES AND OPPORTUNITIES MIDDLE EAST AND NORTH AFRICA REGION | ECONOMIC UPDATE OCTOBER 2022
Unsustainable Land Use
Urban and agricultural land use in the region lead to sustainability problems that weak land governance can exacerbate. Global figures on urban population and built-up growth show that Middle Eastern and North African cities tend to grow in ways that are less dense than the world average, which makes service delivery more difficult and strains transport systems, giving rise to harmful environmental impacts. Likewise, agriculture in the Middle East and North Africa tends to be highly subsidized—including indirectly through water subsidies—with harmful environmental consequences such as water depletion in a context of already diminishing water reserves.
One of the most important consequences of the misuse of land in the region—residential, industrial, or agricultural—is the impact on water. A major dilemma for the region is how best to use land for housing, industry, commercial activities, or agricultural production while preserving water and pursuing food self-sufficiency and food security goals. This implies that governments must make strategic trade-offs regarding how land should be used. An interesting example of such a trade-off is the concern of several governments in the Middle East and North Africa that cities expand into prime agricultural land surrounding cities—often after informal land conversion processes outside urban plans. Satellite imagery analysis shows that an average of 24 percent of urban growth in the region occurs on cropped land. Although this is not that different from the world average, the figure is much higher in some Middle Eastern and North African countries, with 47 percent of urban expansion in Egypt occurring on cropped land.5 Although planned urban expansion leapfrogging into the desert can help preserve scarce peri-urban agricultural land, it also has economic, social, and environmental costs. Whether conversion of agricultural land to urban land should be discouraged or left to markets is thus an important policy question that requires a comprehensive cost–benefit analysis.
Social Imbalances in Land Access
Inequitable access to land is also a root cause of social imbalances and poverty. Informal housing not only removes significant portions of cities from the formal land market and the fiscal base, but also increases insecurity and disputes over land, costs of service provision, and harmful housing environments with negative health and socioeconomic externalities.
Limited access to land harms vulnerable groups and women in particular, constraining their economic opportunities. In the Middle East and North Africa, formal and informal institutions and gender-imbalanced social norms and practices (especially in rural areas and in matters of inheritance and asset management) are detrimental to women’s rights. Because women primarily access land through marriage and inheritance, they are highly vulnerable in the case of divorce or death of a spouse. Under such scenarios, women may not be entitled to keep the land they owned or worked on, or they may be denied the right to reside on their marital property. Analysis of Jordanian shari'a court data over a decade shows that up to one-third of heirs fully relinquished their inheritance rights every year. Social norms may further prevent women from asserting their rights in court. If women refuse to waive their inheritance rights, they can be threatened with abandonment; ostracism; and in extreme cases, verbal abuse and physical violence. Different access to land and discriminatory practices lead to stark differences in land and housing ownership rates between men and women. In rural areas, gender gaps are often magnified, which results in the region having the lowest rate of women’s
5 Because Egyptian cities are located in the fertile Nile valley and on the banks of the Nile. 181CHAPTER 9: THE LAND SECTOR IN THE MIDDLE EAST AND NORTH AFRICA GOVERNANCE CHALLENGES AND OPPORTUNITIES A NEW STATE OF MIND: GREATER TRANSPARENCY AND ACCOUNTABILITY IN THE MIDDLE EAST AND NORTH AFRICA PART II: THE LEARNING STATE
agricultural land ownership in the world and in women in the region controlling smaller plots and facing greater restrictions on accessing finance for agricultural investments. Women rarely sign sharecropping contracts.6 Women are often not paid for their work on family farms, further increasing their vulnerability and economic dependency.
5. Options for reforms
In view of the above challenges and their root causes, we briefly discuss a set of core policy priorities for reform, including the need to modernize land administration, rethink the approach to land management, stimulate and leverage land markets, and revisit broader policy objectives.
Modernizing land administrations
A clear priority for intervention is modernization of land administration, including digitization and greater transparency of information on land. Technology offers opportunities for cost-effective solutions, data generation and sharing, service delivery, and transparency, all of which are crucially lacking in the region. Global experience in modernization of land administration has shown that a comprehensive approach and long-term political commitment are prerequisites for success, yet even with such an approach and commitment, hurdles often remain in the form of lack of adequate technical, financial, and operational capacity that must be addressed.
Reforms are also needed to integrate the currently fragmented main land administration and management functions, which would lead to more consistent land information (thanks to harmonization of records) and more efficient provision of services and use of government resources. Integration would also facilitate establishment of a self-funding model. This would thus result in strong gains to address institutional fragmentation in land administration and management, although in several countries in the region, institutional consolidation is a long-term goal that requires strong political commitment. In the short term, finding ways to streamline land management functions incrementally (e.g., simplifying procedures, establishing one-stop shops, and improving the interoperability of land information systems) can provide some gains.
Important challenges remain to bring legal frameworks in line with the need of modern economies, reduce the complexities of land tenure regimes, and promote a convergence of statutory and customary legal regimes.
Rethinking Land Management
Long-established practices that treat land as a free resource for redistribution or delivery of public services without considering the costs (economic, environmental, social) must be revisited. The recommended approach to land management requires treating public land and property as a portfolio of assets to be optimized. In the Middle East and North Africa, efficiently managing public land is especially important, given the high level of state ownership and scarcity of land. Countries that aim to improve public land management should prioritize establishing or completing
6 This finding may stem in part from women’s low literacy rates—particularly women in rural areas—which prevent them from accessing information about land rights or from reading, understanding, and signing equitable contracts.
182 CHAPTER 9: THE LAND SECTOR IN THE MIDDLE EAST AND NORTH AFRICA GOVERNANCE CHALLENGES AND OPPORTUNITIES MIDDLE EAST AND NORTH AFRICA REGION | ECONOMIC UPDATE OCTOBER 2022
public land inventories as part of the development of land information management systems while increasing the asset management capacity of institutions. They should also adopt market-driven, transparent mechanisms of land allocation such as public auctions. Lotteries and direct allocations are less efficient because they may fail to allocate land to the best use and because they diminish the potential to generate public revenue. In the long term, efficiently managing public land will require better coordination of the institutions that control land and its allocation, as well as some level of decentralization of land management functions.
Better land governance in general, and more-efficient mobilization of public land in particular, are needed to stimulate land markets and increase the formal supply of land to accompany urban development. Mobilizing public land will require a clear policy regarding public land management—identifying the best potential use of the stock of public land and efficient ways to make some of this stock available for investment.
Stimulating and Leveraging Land Markets
A large segment of the land market in Middle Eastern and North African economies is informal. Although addressing this is difficult, an important policy objective should be to bring informal transactions into the formal market while ensuring affordable access to land and housing. Modernizing land administration will strengthen trust in the system, which should encourage formal transactions. Increasing formal land supply should enable formal land markets to function more efficiently and reduce land prices, facilitating access to land for firms and households.
In Middle Eastern and North African countries, there is considerable scope to leverage land for revenue generation through property taxation, but attempts to do so have faced resistance, and moving forward will require addressing technical and political obstacles by completing registries, developing a valuation infrastructure, increasing tax administration capacity, and minimizing tax exemptions. Applying land market principles to land valuation and taxation would increase revenue generation and make the taxation system fairer, but many governments in the region are still basing taxation on book value. There is thus a need for reforms to align property valuation with market values and reduce distortions from taxation exemptions (particularly on vacant land). Such reforms are under consideration in only a few countries. Saudi Arabia is an interesting exception, with its progressive introduction of a vacant land tax since 2016 on the value of large plots of idle land in major cities.7
Revisiting Broader Policy Objectives
In addition to sector-specific interventions, a more-holistic approach to the land sector is needed in Middle Eastern and North African countries. Governments should seek to use land optimally to meet economic, social, and environmental sustainability objectives in the evolving context of climate change, population growth, and the many challenges facing economies in the region (e.g., unemployment, gender and economic inequality, obsolescence of the resource rent model). Careful consideration of what governments can achieve and what is better left to markets will thus be needed.
7 The tax was announced during the holy month of Ramadan and set at 2.5 percent annually, a rate that is reminiscent of the rate of the Zakat—the annual tax that Muslims are obligated to pay as a religious duty—, which could have facilitated its political acceptability.
183CHAPTER 9: THE LAND SECTOR IN THE MIDDLE EAST AND NORTH AFRICA GOVERNANCE CHALLENGES AND OPPORTUNITIES A NEW STATE OF MIND: GREATER TRANSPARENCY AND ACCOUNTABILITY IN THE MIDDLE EAST AND NORTH AFRICA PART II: THE LEARNING STATE
How Middle Eastern and North African governments can address the necessary trade-offs in terms of agricultural production and food sovereignty, water preservation, and urban expansion deserves careful consideration. Efforts to consolidate fragmented agricultural plots and move away from water-intensive crop varieties will be critical to hedge against cropland losses. Fulfilling sustainability objectives will require a shift from the paradigm of self-sufficiency to be achieved at all costs to one of food availability and food security.
There is also a need for governments to rethink how they should fulfill the implicit social contract. Although using land to fulfill the social contract may have laudable social objectives, it has resulted in land inefficiencies and appears to be an inefficient second-best approach to addressing the fundamental problems that lack of economic inclusion causes.
Efforts to reduce vulnerabilities in land access must be pursued. Improving women’s land and property rights should be an integral aspect of efforts to reduce poverty and empower women in the region. A few steps in the right direction have been taken in the recent years, including Iran’s reform of the Civil Code to allow women to inherit land; Morocco’s Soulalyat movement, which obtained formal recognition of women as beneficiaries of compensation after transfer of collective land; Algeria’s modification of its personal family code to allow women to confer their citizenship on their children—with implications for inheritance of land and property—and Jordan’s introduction of a 3-month “cooling-off period” after registration of inheritance shares during which inheritance rights cannot be waived.
The housing, land, and property rights of refugees and internally displaced people must also be addressed for reconstruction and recovery. Conflicts in the region and resulting population displacements have given rise to the need for urgent legislative reforms, including support for access to land and housing in destination areas; legal protections for land and property assets; and dispute resolution mechanisms to address issues of forced sales, abandoned properties, and destruction of property documents in origin areas of refugees and internally displaced people.
6. Conclusion
Weak land governance not only prevents efficient use of land, but is also costly, holds Middle Eastern and North African economies back, and inhibits strategic decisions about trade-offs needed to ensure sustainable land use while responding to population needs such as housing and food security. Current economic and social inequalities are mirrored in the persistent difficulties that women and vulnerable groups face in accessing land.
Reforming the land sector should thus be a top priority for the region. Although progress in land governance is undeniable in some countries and for some aspects of the land sector, there is a need to lay out clear paths for reform. Reforms needed in the land sector are not limited to land administration and governance. They should also address questions of sustainability, strategic use of land assets, and access to land for vulnerable groups.
All these policy interventions have distributional impacts, with potential winners, but also losers, which makes such reforms difficult to implement. Sometimes, those opposing reforms in the land sector are the institutions themselves, out of fear that they would lose power and influence (involving, in some instances, loss of opportunities to extract rents or possibility of job losses). Addressing the political economy bottlenecks and the vested interests that have long prevented reforms will thus be key to success. One of the most serious obstacles to reform could be the lack of trust in the administration (and the government in general) that prevails in Middle Eastern and North African countries. It is a serious
184 CHAPTER 9: THE LAND SECTOR IN THE MIDDLE EAST AND NORTH AFRICA GOVERNANCE CHALLENGES AND OPPORTUNITIES MIDDLE EAST AND NORTH AFRICA REGION | ECONOMIC UPDATE OCTOBER 2022
challenge with implications for the land sector because it partly explains why the public may be reluctant to register land and pay taxes. With few political checks and balances in Middle Eastern and North African economies, achieving greater transparency in land will be critical to restoring trust. At the same time, one of the greatest opportunities to elicit change might rely on civil society. Regarding women’s rights to land in particular, countries that have made progress have done so under pressure from civil society. More generally, a shift in social norms regarding land and property rights will be an essential aspect of reform efforts.
Sweeping reforms, although needed, may be impractical, and gradual approaches are likely to be more feasible. In a way, feasibility of reforms is not specific to the land sector, but addressing challenges in the context of a particular sector could prove more feasible than a simultaneous effort in all sectors.
References
Arab Barometer. (2020). “Women’s Agency and Economic Mobility in MENA: Examining Patterns and Implications.” February 13. https://www.arabbarometer.org/wp-content/uploads/Public_Opinion_Arab_Women_Economic_ Conditions_Presentation_2020.pdf
Bertelsmann Stiftung. (2020). Bertelsmann Transformation Index 2020 Country Reports, MENA. http://bti-project.org/. Corsi, A., and Selod, H. (2022). Land Matters: Can Better Governance and Management of Scarcity Prevent a Looming Crisis in the Middle East and North Africa? World Bank, Washington, DC. doi:10.1596/978-1-4648-1661-1. Fischbach, M.R. (2000). State, Society, and Land in Jordan. Leiden: Brill (Social, Economic and Political Studies of the Middle East 75). https://doi.org/10.1111/j.1949-3606.2001.tb00438.x.
Teti, A., Abbott, P., and Cavatorta, F. (2018). The Arab uprisings in Egypt, Jordan and Tunisia: Social, Political and Economic Transformations. Palgrave Macmillan Cham. https://doi.org/10.1007/978-3-319-69044-5
Transparency International. (2019). “Corruption Perceptions Index (dashboard), 2019.” https://www.transparency.org/ en/cpi/2019
World Bank. (2020). Women, Business and the Law 2020. World Bank, Washington, DC. https://openknowledge. worldbank.org/handle/10986/32639
185CHAPTER 9: THE LAND SECTOR IN THE MIDDLE EAST AND NORTH AFRICA GOVERNANCE CHALLENGES AND OPPORTUNITIES A NEW STATE OF MIND: GREATER TRANSPARENCY AND ACCOUNTABILITY IN THE MIDDLE EAST AND NORTH AFRICA PART II: THE LEARNING STATE
Water and Institutions in MENA: the Need for New Ideas to Tackle a Crisis by Stuti Khemani and Dominick Revell de Waal
Chapter 10:
MIDDLE EAST AND NORTH AFRICA REGION | ECONOMIC UPDATE OCTOBER 2022
1. Introduction
This chapter argues that the old institutions governing water in MENA are suffering from lack of legitimacy and trust to manage the 21st century problems of allocating water amidst drastic scarcity, induced by climate-change and population-growth. Institutions are unable to win voluntary compliance with restrictions on the quantity of water that can be used, or the tariff that needs to be paid to cover the costs of delivering water services. That is, water regulations and tariffs lack legitimacy. Lack of trust in and among utility staff and managers, that they can improve water service delivery performance, keeps utilities persistently inefficient and underfunded. Global capital is not flowing sufficiently to finance water infrastructure in MENA because investors are not assured of recouping steady returns. Returns to capital are risky because available evidence suggests that the infrastructure that would be financed is not well managed for cost efficiency and revenue raising potential. Attracting private investment, while representing citizens’ interests in the face of monopoly power, requires a legitimate or credible policy environment, trusted and creditworthy state agencies. But political conditions in the region are such that global markets worry about policy legitimacy, lack of transparency and creditworthiness. The chapter provides ideas for institutional reforms, using the crisis and emotive power of water in MENA as an opportunity.
Water has been at the core of the development of national identities and social contracts in the history of Middle East and North Africa (MENA) region. For example, the level of annual flooding of the Nile had a big impact on Egyptian agricultural productivity and the tax revenues that could be raised from agriculture. To assess taxes more ‘fairly’ later Ptolemaic rulers of Egypt (305–30 BC) built temples along the Nile and installed Nilometers in them that measured the level of the river. In turn these levels were used to determine the annual level of taxation. Throughout history, the institutions for investing and managing large-scale irrigation water have been linked to centralized forms of power: pharaohs, sultans, emperors, kings, colonial administrations and post-independence central governments (Wittfogel 1957).
When the modern nation states of the region came into being in the first half of the 20th century, they pursued a development model and a social contract which has been characterized as “interventionist-redistributive” (Yousef, 2004; Richards and Waterbury, 1996). States assumed a commanding role over the economy, investing in large infrastructure like dams as part of an economic plan for development. States also assumed a welfarist position of providing for the basic needs and well-being of their citizens in exchange for acquiescence with a closed political system (Brixi et al, 2015). Legitimacy of the state was shaped by the state managing economic and natural resources to deliver public services and the necessities of life—food, fuel, water—at low prices, subsidized below market or costs of production. Water infrastructure was crucial for both these roles—of intervening in the economy to promote development and of providing services for well-being.
For example, the building of the High Aswan Dam in Egypt, the Sefidrud and Karun dams in Iran, Mosul dam in Iraq and many other dams across the region were iconic symbols of nation building, enabling the expansion of both irrigated agriculture and electricity production. These dams were more than development projects within a rational planning framework, they symbolized modernity and command over nature. Between independence and the 1980s Morocco more than doubled the number of dams, expanded the irrigation area from 70,000 ha to over 800,000 ha, and added over 1000 MW of hydroelectric capacity (Bourblanc and Mayaux, 2016). States gained popular support, or legitimacy, from these mega-projects and the associated expansion of services.
187C HAPTER 10: W ATER AND I NSTITUTIONS IN MENA: THE N EED FOR N EW I DEAS TO T ACKLE A C RISIS A NEW STATE OF MIND: GREATER TRANSPARENCY AND ACCOUNTABILITY IN THE MIDDLE EAST AND NORTH AFRICA PART II: THE LEARNING STATE
This development model achieved some success in the 1950s and 1960s, delivering sustained economic growth and dramatic improvements in human capital (Elbadawi, 2002; Yousef, 2004). Various political economy analysts have argued that the early success, immediately post-independence, was aided by the geopolitics of oil and the access of states to external financing, allowing them to keep their part of an “authoritarian bargain” (Yousef, 2004; Desai et al, 2009). However, by the 1970s, macroeconomic conditions became adverse—states found they could not afford the fiscal burden of various subsidies. Furthermore, the myriad state-owned enterprises (SOEs) that had initially contributed to industrialization and employment, began to show signs of mismanagement and poor financial health (Yousef, 2004; World Bank, 2009). Economic reforms of market liberalization and privatization of SOEs were pursued as the solutions to rising problems of unemployment, low productivity and slow growth, but with ideological and vested-interests’ resistance (Dasgupta, Keller and Srinivasan, 2002).
The early institutions that were established to enable structural transformation of economies in MENA have been revealed to suffer from two, very different, problems: (1) too much state control, too little space for entrepreneurship and markets; and, on the other hand, (2) too little state control over the problem of environmental externalities, and too little state capacity to raise revenues to finance appropriate public investments. Water in MENA exemplifies the second problem. Water is a very different product than what is typically analyzed in economic markets. Its physical properties are such that no country in the world has relied entirely on market institutions for its allocation. Across the world, including in the most advanced market economies, water resources are owned by states, or public institutions. Significant sources of renewable water, such as rivers and lakes, are national property, or, a local common. Private property rights over water are limited and often linked to land ownership. Water utilities that supply water for drinking, sanitation and other household use, are typically state or municipality-owned, even in an advanced market economy like the United States (Masten, 2011). If and when private firms are invited to build and operate utilities, the process of “privatization” involves negotiation with state agencies or regulators over the terms of production, supply and pricing of water services (Galiani et al, 2005).
Institutions of state, government and local common property governance thus play inescapably significant roles, even when some parts of the production or supply of water services are privatized. Privatization of water services is not expected to automatically deliver the efficient outcomes as other markets in the logic of economic theory, because the conditions for those efficiency results are absent in water.1 States, or government agencies would need to purposefully design those market conditions and the property rights that the logic of economic theory identifies as the conditions for efficient allocation of scarce resources.
The 21st century experience with the impact of climate change and population growth has brought to the fore another reason for the inescapable role of state institutions in allocating water—a massive, unforeseen, “common-pool problem” where the equilibrium outcome of individual consumption by millions and billions of people involves rapid depletion of the resource. The problem of water scarcity in economies, including not only in MENA but in the most advanced market economies with otherwise strong institutions, is driven by lack of institutions to price the “externalities” associated with the consumption of water (Leonard et al, 2020). The world lacks sufficient understanding of how to design these institutions so that water use can be appropriately regulated, and fairly shared across its competing needs. This chapter
1 A powerful result from the logic of economic theory is that market institutions that enable decentralized and voluntary exchange among individuals are likely to allocate resources for greater net gains to society compared to allocation decisions made by a central planner. This logical argument has also found empirical support in variation across countries in economic growth and prosperity, with market-oriented reforms associated with more healthy economies (Rajan and Zingales, 2003, provide a review). However, water is a commodity with physical properties such that the private property rights needed for decentralized and voluntary exchange are not well established. For example, even in the case of delivery of water by private tankers to individual households, which may appear as a decentralized and voluntary exchange, access to the source of water is not, with property rights over the commodity being illdefined, violating a fundamental condition for market efficiency.
188 C HAPTER 10: W ATER AND I NSTITUTIONS IN MENA: THE N EED FOR N EW I DEAS TO T ACKLE A C RISIS MIDDLE EAST AND NORTH AFRICA REGION | ECONOMIC UPDATE OCTOBER 2022
argues that MENA can lead the world in understanding how to design these institutions to tackle the 21st century problems of water.
The chapter is organized as follows. Section 2 lays out the role of water in MENA’s economies throughout history, leading-up to the crisis of water scarcity in present times. Section 3 examines global experience and shows how prevailing institutions have failed to sufficiently tackle the problem of climate-change and population-growth induced scarcity, leaving wide-open the question of how to design institutions to manage water. Section 4 shows how economic analysis of institutions can be brought to bear on the problem, and outlines ideas for institutional reforms to manage water in MENA. Section 5 concludes with a call to action to pursue these institutional reforms, in an approach of “learning by doing”, in partnership between MENA’s governments and external development agencies.
2. Charting the course of water in MENA into the 21st century
The people of the Middle East and North Africa (MENA) have been tackling the endemic problem of water scarcity and variability for millennia through remarkable innovations. As long as 6000 years ago the Sumerians channeled and regulated the flow of water and silt from the Tigris and Euphrates using reed dams, palm trunks and mud to irrigate and fertilize their fields surrounding the ancient city of Ur. Investments on the Nile to regulate its flood waters go back at least 4,000 years.
Powerful technical bureaucracies emerged to manage the water such as the Egyptian Department of Public works and the Directorate General of Irrigation in Iraq. These technical agencies became schools of engineering practice greatly expanding capacity to design, develop and manage hydraulic infrastructure. The Egyptian Department of Public works constructed the major irrigation canals (Mahmoudiyah, Ismailia, and Ibrahimiya) and the Delta Barrages to expand and improve irrigation in the mid 19th century and then the Aswan Low Dam in the late 19th century to allow the growing of multiple crops per year in the Nile Delta. The Directorate General of Irrigation in Iraq, established in 1917, initially focused on flood control including diverting flood waters into the Tharthar and Habbaniyah depressions.
In the 20th century, particularly since World War II and against a worldwide uptick in dam building, these powerful technical institutions accelerated the expansion of dam construction and related irrigation infrastructure. Increasing hydroelectricity for industrialization was added to the list of state interventions to create a positive feedback loop— more water infrastructure, more agricultural output, more industrial output, more tax revenue. This feedback loop was accelerated with the ability of sovereign states to borrow finance against future tax revenues spurring a ‘hydrologic mission’ led by powerful centralized state institutions for water investment and management (Molle et al 2009). Geo-strategic linkages influenced dams by enabling access to finance and became a proxy for contesting geopolitical alignment between cold war powers. International financiers were not only important as dam enablers but also as key actors in the implementation process (Lavers and Dye 2019). A relatively small number of engineering firms dominated the construction of large dams. The rapid expansion of dams in MENA become a target of business for an influential set of private sector engineering companies in the west (Britain, France, Italy and the US) and SOEs in the east (Soviet Union, Yugoslavia). By the late 1990s the total investment in large dams globally had reached an estimated US$2 trillion (World Commission on Dams 2000) with around 5 percent of this being spent in MENA.2
2 Based on percentage of global dam storage capacity in MENA. 189C HAPTER 10: W ATER AND I NSTITUTIONS IN MENA: THE N EED FOR N EW I DEAS TO T ACKLE A C RISIS A NEW STATE OF MIND: GREATER TRANSPARENCY AND ACCOUNTABILITY IN THE MIDDLE EAST AND NORTH AFRICA PART II: THE LEARNING STATE
The completion of the High Aswan Dam in Egypt in the early 1970s, and the development of dams that followed, increased MENA’s total dam storage capacity by nearly four times between 1962 and 2017. The large public investments in dam storage supported expansion of supply for multiple consumptive uses including agriculture, industry and domestic water supply as well as the production of hydroelectricity.
freshwater withdrawals per
regional dam capacity and
water production capacity (desalination and
Along with the uptick in dam storage, a series of bulk water transport projects were developed to move water from sources to demand centers. For example, the first phase of what is in now known as the King Abdullah Canal in Jordan, was completed in 1961 to transport water from the Yarmouk River in the North for irrigation schemes along the Jordan valley and later became a source for the Greater Amman area. In Israel, in 1964 the 130 km long National Water Carrier (NWC) was completed to transfer water from the Sea of Galilee in the north of the country to the highly populated center and arid south. Most water infrastructure in Israel is integrated with the Carrier through a network of bulk water pipes that enables efficient use and regulation of the water supply in the country. These systems can also combine the use of large rivers, natural depressions and canal infrastructure to regulate huge variations in annual flows such as in the Euphrates/Tigris system. Over the intervening decades these and many other bulk water transport systems have been constructed across countries in MENA enabling a high degree of control and even trade in water with neighboring countries and territories.
Beginning in the 1970s and 80s investment in groundwater further extended supply-side interventions through combined public and private investment. In oil exporting countries public investment in groundwater has been for all uses including agriculture. In Libya the Great Man-Made River, built in the 1980s for an estimated US$25 billion, supplies 95 percent of the water used in the populated north of the country from the Nubian and other sandstone aquifers through a network of nearly 3,000 km of pipes. Spurred by the opportunity to expand agricultural production countries promoted groundwater exploitation providing subsidies for well drilling and cheap sources of energy for pumping water. Access to groundwater ‘liberated’ irrigators from the hierarchical state-controlled surface water irrigation systems and diminished reliance on traditional collective management systems (Kuper et al 2016). But it also led to centralized institutions losing control of agricultural water abstractions and the externalities they cause. For example, in Morocco’s Sahel of Doukkala, with its proximity to Casablanca and access to European markets, groundwater pumped from a coastal aquifer first drove development of an agricultural boom and then a bust as the overexploitation of groundwater caused saline intrusion that was irreversible (Molle et al 2008, 2016). By 2017 the continuous development of groundwater across MENA supplied over 106 billion m3 a year or a third of freshwater withdrawals. This second wave of irrigation investment was often to supplement supply of surface irrigation water due to:
the lack of maintenance in public irrigation
schemes.
publicly supplied surface water
the over expansion of public irrigation
i) annual variation in
availability; ii)
infrastructure; and, iii)
infrastructure
Figure 1. Total
year compared to
non-conventional
reuse) Cubic meters, billion 450 400 350 300 250 200 150 100 50 0 1960 1970 1980 1990 2000 2010 2020 High Aswan Dam completed Desalination and wastewater reuse begin to scale up Year Total freshwater withdrawals Desalination capacity Dam capacity Source: Aquastat and GWI Desalination Database. 190 C HAPTER 10: W ATER AND I NSTITUTIONS IN MENA: THE N EED FOR N EW I DEAS TO T ACKLE A C RISIS MIDDLE EAST AND NORTH AFRICA REGION | ECONOMIC UPDATE OCTOBER 2022
Led by countries with large agrarian populations (Figure 2) and supported green revolution technologies, gross agricultural output (by weight) grew by nearly four times over this same period and agriculture’s value added grew by over five times. Confirming the basic logic of policy makers, in 2018 the region’s irrigated area contributed nearly twice as much (US$98.5 billion) to agricultural valued added than did rainfed areas (US$50.5 billion).3
While agricultural output has grown and water productivity improved, structural transformation of the region’s economies means the contribution of agriculture to GDP has waned in relative terms—even in those economies with a significant agrarian population—while growth in the services and industrial sectors have increased driven by urbanization. In countries with large agrarian populations agriculture’s contribution to GDP is less than half of what it was in the 1970s when many of the dams and irrigation systems were being designed and constructed (Figure 2).4 Yet agriculture in these countries is still a key source of employment, an important part of rural cultural heritage and potentially a means of promoting spatial development.
By 2018 the proportion of total water withdrawals consumed by agriculture contributed only a modest 3 percent of regional GDP. Though more productive than rainfed agriculture, irrigated agriculture did not contribute more than 11 percent of GDP in any country in the region (Figure 3) even in countries where over 75 percent of total water withdrawals are by agriculture. Along with several countries in Central and South Asia, water withdrawals per unit of GDP in the agrarian middle-income countries of MENA, are some the highest in the world (Kochhar et al 2015).
3. The proportion of total water withdrawals
Water withdrawals
to agriculture
the relative contributions to GDP of irrigated and rainfed agriculture
Figure 2. Agriculture as percent of gross domestic product in countries with rural populations over 10 million Percent 1970 1980 1990 2000 2010 2020 35 30 25 20 15 10 5 0 ▬ ALG ▬ YEM ▬ EGY ▬ IRQ ▬ IRN ▬ MOR ▬ MENA ▬ World Source: World Bank Development Indicators (2015 constant prices).
Figure
allocated
and
in 2018 Figure 4.
by sector for each country Percent of GDP 100 90 80 70 60 50 40 30 20 10 0 DjiboutiQatarBahrainLebanonMaltaWestBankandGazaJordanKuwaitIsraelAlgeriaTunisiaEgyptSaudiArabiaLibyaUAEOmanMoroccoSyriaIraqYemenIran Re ublic of Yemenp Islamic Rep. of IranSaudi Arabia Oman Syrian Arab Republic Morocco Iraq Tunisia Arab Rep. of Egypt LibyaUnited Arab Emirates Jordan Israel Lebanon Algeria Kuwait Qatar West Bank and Gaza Bahrain World averageMENA average 020 10 4030 6050 8070 10090 J From rainfed agriculture J From irrigated agriculture Share of total water withdrawals, percent z Water withdrawals for agriculture, percent of total J Agriculture J Industry J Domestic Source: Aquastat. Source: World Bank 2017. 3 FAO Aquastat - author’s calculations. 4 The exception is Iran which has been subject to sanctions including of its oil exports. 191C HAPTER 10: W ATER AND I NSTITUTIONS IN MENA: THE N EED FOR N EW I DEAS TO T ACKLE A C RISIS A NEW STATE OF MIND: GREATER TRANSPARENCY AND ACCOUNTABILITY IN THE MIDDLE EAST AND NORTH AFRICA PART II: THE LEARNING STATE
While irrigated agriculture is still the dominant demand for water in most countries, cities’ water demand has grown steadily too. The consumptive uses of water for agriculture and water for cities compete for the same water resources (Figure 4). The urban population of MENA has grown from 40 million in 1962 to 300 million in 2020 (World Bank WDI). With this urban growth has come an increased demand for modern piped water services. Though data are only available for the past 25 years the demand for domestic water supply has increased from 19 BCM in the early 1990s to just over 32 BCM in 2018—which accounts for just over 10 percent
MENA’s total water withdrawals. Between 2000 and 2017 around 118 million people were connected to public utility provided water networks and an estimated 85 million were connected to sewer networks.
5. Desalination and reuse capacity in MENA
6. Global share of desalinated water capacity
As the opportunity to expand dam capacity and exploit ground water has slowed5 and as the demand for urban WSS has continued to rise (World Bank 2018), there has been a sharp increase in investment for non-conventional water (Figure 5)—desalinated water and wastewater reuse. The GCC countries were early adopters of desalination investing heavily in the 1980s, pausing in the 1990s, then ramping up investment again from 2000 onwards including the largest plant in the world—the Ras Al Khair, in Saudi Arabia. Israel initiated large investments in desalination from the early 2000s. In Algeria, following a series of violent protests over water shortages, between 2002 and 2004, the government signed a series of PPP contracts for large desalination plants that were constructed over the following decade.6 As of 2020, half of the installed capacity for water desalination in the world is in MENA (Figure 6). Starting later than investment in desalination, investment in wastewater reuse in MENA has seen a sharp increase since 2010. The cumulative capacity of non-conventional water sources across MENA amounts to over 30 billion m3 a year. The amounts to an investment of around US$86 billion7 with over 90 percent of this investment having been made in eight countries8 and over half of which was in Saudi Arabia and UAE. Around 60 percent by volume is desalination plants and 40 percent is wastewater reuse plants but wastewater reuse is expected to expand faster than desalination in future as it has become a widely accepted practice and regulation on standards and uses have been put in place in many countries. In the face of continued economic and population growth as well as climate impacts there are plans to invest in another 10 billion m3 of capacity by 2025.
of
Figure
Figure
Cubic meters, billion Percent 35 30 25 20 15 10 5 0 1960 1970 1980 1990 2000 2010 20302020 EAP ECA LAC MENA North America SA SSA Western Europe 13 4 1 8 15 3 10 46 Year Source: GWI Desalination Database. Source: GWI Desalination Database.
5 Most MENA countries have a large share of surface water stored in reservoirs but low volumes of water stored in dams per capita i.e., they have stored all there was to store (World Bank 2018). 6 Source: Pacific Institute Water Conflict Chronology and GWI database. 7 Current prices for 2020. 8 Saudi Arabia, United Arab Emirates, Kuwait, Qatar, Libya, Algeria, Oman, Israel. 192 C HAPTER 10: W ATER AND I NSTITUTIONS IN MENA: THE N EED FOR N EW I DEAS TO T ACKLE A C RISIS MIDDLE EAST AND NORTH AFRICA REGION | ECONOMIC UPDATE OCTOBER 2022
The expansion of investment in non-conventional water has been driven and overseen by central ministries across MENA. The private sector has dominated construction and manages a large share of the operation and maintenance of both desalination and wastewater treatment plants providing reuse. However, the ‘off-takers’ purchasing the nonconventional water are almost exclusively public sector SOEs. The exception is Saudi Arabia which has had a preference for awarding projects on an engineering, procurement and construction (EPC) basis so retaining state ownership and operation of plants through the Saudi Arabia’s Saline Water Conversion Corporation (SWCC).
Despite multiple waves of investment in the supply of water, countries across the MENA region face an acute lack of water for life and livelihoods. Countries in the region are grappling with unprecedented, ever-worsening water scarcity due to population growth, climate change and socioeconomic development. The region has seen its population grow from just over 100 million people in 1960 to over 450 million in 2018 with the medium forecasts of population in 2050 estimated at over 720 million. By 2030, average annual per capita water resource availability across MENA will fall below the absolute water scarcity threshold of 500 cubic meters per person per year.9
Figure 7. Sustainability
SaudiArabiaDjibouti
Oman Iran EgyptWestBankandGaza Jordan Bahrain IsraelUnitedArabEmirates
Syria Iraq Qatar Tunisia Kuwait Algeria Lebanon Morocco
withdrawals (Figure 7) are mainly of groundwater and in the extreme cases of Libya and Saudi Arabia are far greater than available renewable resources and are sourced from ‘fossil’ aquifers—sources of water that are not significantly replenished by current rainfall. The evidence for depletion is manifold, coming from global hydrological models, remote sensing from satellites and local reports of wells running dry and of streams/wetlands disappearing. Global hydrological and water resources models suggest that about 50% of the region’s water withdrawals are unsustainable and contributing to depletion (World Bank 2018). While these models do not provide locally-specific information, they unequivocally identify the MENA region as a global hotspot of depletion at present and also under future climate and population scenarios (Wada and Bierkens, 2014). Remote sensing from the Gravity Recovery and Climate Experiment (GRACE) satellite mission allow to detect areas where groundwater storage shows negative trends over multi-annual timescales. GRACE observations indicate decreasing water storage across the MENA region (Voss et al. 2013; Joodaki et al., 2014; Rodell et al. 2018). Observations from for the north-central Middle East (Syria, Northern Iraq, Iran) highlight a loss of groundwater storage of about 13 (+-1.6) km3/yr in volume (i.e., volume withdrawn unsustainably), over six
of water withdrawals by source as percentage of total withdrawals Share of total withdrawals, percent 100 80 60 40 20 0 -20 -40 -60 -80 -100 Libya
Sustainable Unsustainable J Groundwater (unsustainable) J Surface water (unsustainable) J Reuse of agricultural drainage water J Reuse of treated wastewater J Groundwater (sustainable) J Surface water (sustainable) J Desalination Source: World Bank (2017). Unsustainable
9 As defined by Falkenmark et al (1989). 193C HAPTER 10: W ATER AND I NSTITUTIONS IN MENA: THE N EED FOR N EW I DEAS TO T ACKLE A C RISIS A NEW STATE OF MIND: GREATER TRANSPARENCY AND ACCOUNTABILITY IN THE MIDDLE EAST AND NORTH AFRICA PART II: THE LEARNING STATE
years (2003–2009 (Voss et al. 2013)). In Northwest Sahara (Richey et al. 2015) observe a 2.7 km3/yr decline over 2003–2012. Finally, parts of the Arabian’s Peninsula Paleogene and Cretaceous Aquifers are experiencing depletion of -2.8 ± 0.8 km3/yr (Sultan et al. 2019). To put these numbers in context, these losses in groundwater storage are equivalent to 7 percent of the region’s annual water withdrawals and a little more than the current installed desalination capacity in the region.
In short, at the present moment in time, MENA is facing a crisis of water scarcity. Whole communities of farmers are seeing water sources, on which they have relied for their livelihoods for generations, rapidly deteriorating or disappearing. Urban residents have turned to the streets to demand basic services, while water utilities are unable to cover costs of operations and raise the financing needed to improve water and sanitation services. The current policy regimes in MENA for managing the allocation of water within and across agriculture and WSS have become unsustainable because the availability of water as a resource is being outstripped by its consumption (World Bank, 2022).
States in MENA have been responding to demand for water from various constituencies and in effect deciding how to allocate water through highly centralized national government agencies. However, this system of allocation appears unable to cope with the increasing competition for water from constituents, alongside declining water resources and increasing cost of augmenting the resource, such as through desalination. The following sections now turn to how the social contract of a century ago needs to be redrawn to tackle this crisis.
3. The need for new institutions to manage water in the 21st century
The crisis of water scarcity in MENA, along with the global crisis of climate change, has revealed the inadequacy of prevailing economic institutions to obtain welfare optimizing outcomes. Beyond the fiscal problems of MENA’s states and water utilities, the problem of water in the 21st century is one of the global environment. Climate change has made water uncertain, unpredictable and dramatically scarce, revealing a massive market failure in decades of modern industrial growth which creates inescapable roles for the state.
In traditional rural societies where water for both household use and agriculture is drawn from a common property resource, such as a river, or a community owned well, or, from groundwater on privately owned land, water is “priced” by the rules and norms governing local behavior10. In classic studies of local institutions that govern the “commons”, selfgoverning irrigation institutions are described (Ostrom, 2011, 1993). However, the rapid depletion of water resources because of unsustainable use by growing populations, and climate change, may not have been factored-in by prevailing local institutions, perhaps because this information is not available until it is “too late”.
Lab experimental studies (conducted with educated subjects in the United States, and hence a group which would have access to news and information) suggest that individuals are cognitively constrained in figuring out the “equilibrium” effects that arise by aggregating all individual behaviors (Dal Bo et al, 2018). That is, the externality in the consumption of water is “hidden”, such that Ostrom-style institutions of local collective action to price water appropriately, to account for the externality in its consumption, may not have emerged in societies. The scale of the externality problem of water,
10 It is important to note that a resource can be priced both through a fee charged for its use, as well as through restrictions on the quantity of the resource that is used. A quantity constraint generates what in economics is called a “shadow” price. This is the price which users of water in effect pay through the constraint on the quantity of water they can use. Although this “shadow price” does not generate an immediate revenue, it gets reflected in the value of the underlying property, such as the agricultural land, where water is being used, and thus shapes economic incentives to use water similar to how regular prices do.
194 C HAPTER 10: W ATER AND I NSTITUTIONS IN MENA: THE N EED FOR N EW I DEAS TO T ACKLE A C RISIS MIDDLE EAST AND NORTH AFRICA REGION | ECONOMIC UPDATE OCTOBER 2022
and its links to climate change, are non-marginal and global, which also makes it difficult to apply the Coasian insight of establishing private property rights. The environment is a global public good over which private property rights cannot be defined. Information about environmental consequences of outcomes aggregated in markets is also a global public good with a role for national and international government agencies in its compilation. The challenge for countries and their international development partners is that there is no ready template for how to build these state institutions and combine them with market institutions, especially in irrigated agriculture, which is the largest consumer of water (accounting for 70 percent) globally.
Market institutions have been applied in a few countries, most prominently in Australia, which has the world’s largest water market in irrigated agriculture. Even in Australia, water trade between farmers is dependent upon state-owned and managed physical infrastructure (river basin systems, dams, and reservoirs) to overcome hydrological constraints to storing and moving water (Rafey, 2020). In addition to the need for physical infrastructure to enable water to be moved for gains from, trade, there is also a need for legal infrastructure to reduce transactions costs. In the United States, the legal rights over water have created huge transaction costs that have prevented the trade of water, within agriculture and between agriculture and cities (Ayres et al, 2018; Libecap, 2008). The problem of transaction costs can be traced to the legal structure of Irrigation Districts, a form of farmer water user associations, which were institutions created in the 20th century to encourage irrigated agriculture in the western United States. These institutions are now unsuited to tackling the problem of water scarcity, and the gains from trade of water away from agriculture to cities during periods of drought (now increasingly frequent because of climate change).
Finally, even if functioning water markets could be established by securing property rights, reducing transaction costs, and building the physical infrastructure to enable water to be moved, there remains a unique role for state institutions to regulate the quantity of water. For example, China has pursued a variety of reforms to enable water trade among local jurisdictions, under an overarching national policy of the Three Red Lines establishing quantity targets on water use, efficiency, and pollution. Compliance with the Three Red Lines is monitored through a detailed reporting system, with local officials submitting regular updates to higher-level officials, and verification through regular inspections and audits by central government officials (Moore and Yu, 2020).
From the experience of contexts as varied as traditional self-governing irrigation institutions, to the formal institutional practices of countries as varied as Australia, China and the United States, the following two fundamental ideas emerge:
• The role of legitimacy in establishing compliance with regulations, such as how much water can be consumed or polluted
• The role of trust to adjudicate allocations from the perspective of fairness, such as how much water should be shared between agriculture and cities
Legitimacy is the ability of the state, or its leaders, to win voluntary compliance with laws or public orders, such as restrictions on the quantity of water that can be used, or the tariff that needs to be paid to cover the costs of delivering water services. States across MENA have tried to manage scarce water resources by regulating the amount of water that can be abstracted, for example in agriculture, but these regulations are difficult to enforce. Case studies of groundwater use in Morocco, for example, describe how farmers regularly flout public regulations because they do not believe the state should restrict their use of water, and they believe none of their neighbors in the community are following the rules. In Jordan, there are examples of water regulation officials being driven out of villages when they tried to tackle
195C HAPTER 10: W ATER AND I NSTITUTIONS IN MENA: THE N EED FOR N EW I DEAS TO T ACKLE A C RISIS A NEW STATE OF MIND: GREATER TRANSPARENCY AND ACCOUNTABILITY IN THE MIDDLE EAST AND NORTH AFRICA PART II: THE LEARNING STATE
illegal wells. Even if governments can enforce compliance by using the coercive power of the state, widespread lack of legitimacy is a threat to stability and can inhibit government policymakers from taking necessary, but difficult (because they imply loss of livelihoods for farmers, for example), decisions over the management of water.
Trust consists of beliefs or expectations among people about whether others are behaving in cooperative ways for mutually beneficially outcomes, versus the opposite—non-cooperative ways where each person’s actions results in losses on all sides. For example, corruption is one manifestation of lack of trust. If people believe that others are likely to be extracting rents in the public sector (low trust that others are behaving honestly), they are likely to behave in the same way, even though everyone realizes that corruption is bad for the economy. Trust can be examined in the water sector as the core of why utility reforms are so difficult—whether it is tariff reforms to cover utility operating costs; or reducing water leakages and wastage (non-revenue water); or attracting long-term financing to build infrastructure. If utility staff do not trust that their peers are performing their tasks professionally, such as by holding-up decisions, or not completing their assigned tasks on time or effectively, then they are likely to behave the same way, yielding outcomes of poor utility performance. If citizens believe that utilities are not pricing water services fairly, and cannot be trusted to use revenues to improve service delivery, then they are likely to protest tariff increases, contributing to a vicious cycle of low performing, bankrupt utilities.
These seemingly abstract concepts of legitimacy and trust have real implications for the most pressing economic questions facing not only MENA’s leaders but global financial markets. For example, why is global capital “frozen” and not flowing to finance much-needed, long-lived infrastructure for water in MENA? Global capital is not flowing sufficiently to finance water infrastructure in MENA because investors are not assured of recouping steady returns. Returns to capital are risky because available evidence suggests that the infrastructure that would be financed is not well managed for cost efficiency and revenue raising potential. “Privatization” is neither easy nor a panacea (nor proven to improve outcomes). Attracting private investment, while representing citizens’ interests in the face of monopoly power, requires a legitimate or credible policy environment, trusted and trustworthy state agencies. Legitimacy of the policy environment, and citizen trust in the state are low.
4. An approach for how MENA could lead the world in building new institutions to manage water scarcity
The problems of legitimacy and trust can be understood using an economic framework of interaction between thousands and millions of actors, from citizens and society, to political and national leaders, to senior managers of public utilities, to frontline staff engaged in managing water resources and water service delivery.11 Insights emerge from structuring the behavior and actions of these different types of actors into interdependent “principal-agent” problems in which one type of actor, the agent, takes actions on behalf of, or at the behest of another, the principal. Public policies, including for water, are selected and implemented by the state within the following principal-agent relationships illustrated in Figure 8: (i) between citizens, or society, or the sovereign in a MENA context, and political leaders, (ii) between political leaders and public officials who lead government agencies, and (iii) between public officials and frontline providers. These principal-agent relationships are a formal way of thinking about the social contract.12
its application to infrastructure
The framework draws upon recent advances in the economics
figure also shows citizen engagement,
service delivery cadres
11
of institution (reviewed in World Bank, 2016; World Bank, 2017, Khemani, 2019, Dal Bo and Finan, 2020), and
and environment (Estache, 2020; Somanathan, 2020). 12 This
to monitor frontline providers and participate in service delivery. Public officials in leadership positions can engage the help of citizens to pressure
to perform better. 196 C HAPTER 10: W ATER AND I NSTITUTIONS IN MENA: THE N EED FOR N EW I DEAS TO T ACKLE A C RISIS MIDDLE EAST AND NORTH AFRICA REGION | ECONOMIC UPDATE OCTOBER 2022
Figure 8. Principal-Agent relationships of government


A powerful insight emerging from this framework is the fundamental role of political contestation, and the communication that happens in society among citizens, and between citizens and leaders, in shaping beliefs about how others are behaving towards the state. Politics casts a long shadow on each of the principal-agent relationships—clearly, on what citizens expect from the state (legitimacy of tariffs and water regulations); and, on the incentives of managers and frontline officials in state agencies (such as, whether their appointments and careers are derived from patronage or wasta, or whether they are held accountable by political leaders for performance). Even reform-oriented and well-intentioned leaders, who are authorized by the ultimate sources of political power to improve performance, will struggle with prevailing low levels of legitimacy and trust.
New ideas emerging from economic research, on how changes come about from low to higher levels of legitimacy and trust, can be applied to the context of MENA. Specifically, existing forces of local political contestation—at subnational levels such as districts, municipalities or communes—can be used to change beliefs and expectations about how others are behaving. Decentralization of certain tasks of water services, management and allocations to locally elected government agencies, and communication campaigns about how local leaders can improve outcomes, could work within a national policy framework to change how people behave throughout the chain of principal-agent relationships.
Local government agencies contain the potential for building legitimacy through local political processes. This potential could be harnessed through a national water strategy, including strategically designed local communication campaigns around current water allocations and water balance, and complementary policies of social protection for distressed farmers. A large body of evidence has shown that communication can work to nourish forces of local political contestation to strengthen incentives and norms in government for public good policies (World Bank, 2016). Communication is a key complement to enable existing forms of local political contestation to move away from patronage, tribalism or vote buying, to issues of the public good.
Communication to nourish local political contestation can enable good quality local-level leaders to emerge who help with utility-level outreach to citizens. Such outreach can be combined with tariff structure reforms that attend to equity and justice considerations, such as block tariffs where the first block of minimum water quantity to sustain basic living conditions is ensured at low tariff and can be financed through generalized taxation. This is simply an example of a variety of tariff options, and how utilities can be financed through a combination of tariffs, fiscal transfers and debt, that could help overcome the problems of legitimacy and trust (World Bank, 2022).
In addition to the insight about the fundamental, cross-cutting role of political contestation for winning legitimacy and trust across a swathe of policies, in water and beyond, institutional reforms in water can be approached by thinking about the “tasks” assigned to different government agents within the interdependent principal-agent framework of Figure 8. The key idea is to assign the responsibility and authority over these tasks based on variation in informational advantages across agents. Table 1 lays out this task-based approach to institutional reforms, and the role of decentralization to locally elected governments.


 Citizens
Political leaders
Political leaders Public officials Public officials Frontline providers
Principal Agent
Citizens andmonitoringfeedback
Sovereign
Citizens
Political leaders
Political leaders Public officials Public officials Frontline providers
Principal Agent
Citizens andmonitoringfeedback
Sovereign
197C HAPTER 10: W ATER AND I NSTITUTIONS IN MENA: THE N EED FOR N EW I DEAS TO T ACKLE A C RISIS A NEW STATE OF MIND: GREATER TRANSPARENCY AND ACCOUNTABILITY IN THE MIDDLE EAST AND NORTH AFRICA PART II: THE LEARNING STATE
With regard to tasks of managing the allocation of water as a resource, the basic principle is the same as the one being used in carbon emission abatement policies of “cap and trade”: that is, to enable those agents who have more information and expertise on how to reduce carbon emissions to do it in least cost ways. However, the execution of the principle—of giving decision-making power to agents according to their information advantage—would be substantially different in the case of the water sector. In water, and especially in the institutional context of MENA, the proposed policy relies on agents within government as representatives of the people to both devise the caps using climate and water science, and to decide whether and where to engage in trade/exchange of water.
Local governments, as representatives of the communities they serve, would employ decentralized information about the relative value of water to farmers and urban residents within their jurisdiction to identify potential gains from trade, while national government agencies would set the “caps” to which each local government would need to adhere. Aggregate “macro” calculations about the status of water resources in a country, and the science of its sustainability into the future, can be used to set limits, or caps, on the amounts of water that can be consumed, abstracted, and polluted by different local jurisdictions. These caps would be enshrined in a national water strategy, through which national ministries would hold local government authorities accountable for adhering to national regulations over water use. Local government authorities, in turn, would be empowered to enter into trades with each other, using their water entitlement under the national strategy as a starting point. Local governments would be held accountable by their constituents over their performance in managing these water entitlements, including for identifying any opportunities for gains from trade in water between and within local government areas.
As with the principle of “cap and trade” that is applied in practice of carbon abatement policies, the idea proposed above is rooted in economic logic. Just as the application of cap and trade in energy markets has resulted in both successes and failures, and depends upon a variety of conditions in energy markets, so too is variation to be expected in the application of the logic to water. Outcomes of water management under a local government cap and trade framework proposed here would depend upon the actual behavior and performance of local government agents. The key to whether good outcomes are obtained depends upon the capacity of local government officials, and the functioning of the local political market. If local political contestation yields leaders who protest the caps imposed, or who capture the water entitlements to benefit local elites while leaving their constituents impoverished and insecure, the state would remain in its existing predicament. Even with well-intentioned local leaders, local governments can lack the basic capacity to undertake new tasks assigned to them. The idea is that focused policy attention can go towards harnessing the potential of local political markets, where forces of contestation are already at play, to yield high quality local leaders who can employ local information to win legitimacy and economic efficiency. Focused policy attention would also be needed to build capacity of local government organizations.
For the tasks of water service delivery, trusted and trustworthy WSS and irrigation utilities may be built through complementary reforms in wage contracts, career paths, and management. Growing evidence suggests that giving greater autonomy to staff managing complex organizations can improve outcomes, consistent with economic research on the productivity and performance of complex organizations (Khemani, 2019 provides a review). Communication is, once again, a key complement to strengthen professional norms and peer pressure for better performance within organizations.
While the ideas presented above are new in the sense that they are drawn specifically from recent research advances on how government institutions function, and on a constructive role for politics, many aspects of these ideas have been
198 C HAPTER 10: W ATER AND I NSTITUTIONS IN MENA: THE N EED FOR N EW I DEAS TO T ACKLE A C RISIS MIDDLE EAST AND NORTH AFRICA REGION | ECONOMIC UPDATE OCTOBER 2022
debated and experimented with in the policy corridors of MENA. Iraq, for example, has been debating decentralization for decades, and has engaged provincial and local governments in different ways to manage water resources (Fleet, 2019; World Bank, 2020). Morocco, too, has been considering and actively moving towards greater empowerment of elected bodies at both regional and municipal levels (Ben-Meir, 2021). Apart from decentralization, reforms of utilities to improve their performance and enable them to access external financing, are being tried out in the UAE (Dubai Electricity and Water Authority 2019).
Table 1. Assigning tasks of water allocation according to informational advantage of different types of government agencies
Task Information needed to perform task Type of government agency with informational advantage Output expected
Understanding the “water balance”, and what overall restrictions on water consumption are needed to sustain the resource into the future.
Highly specialized scientific information about climate, temperature, precipitation patterns, and other external conditions that shape the availability of water.
Autonomous national technical agency.
Credible information about the state of water resources. Credibility would be derived from the extent to which the agency functions according to technical expertise, and is not tasked with allocation decisions (which is inherently political).
Task of developing a national water strategy— how much the country would invest in water infrastructure, how it would finance the infrastructure, where the infrastructure would be located, how the country would negotiate transboundary water treaties.
National information about internal budgets, ability to borrow in international markets, attract foreign assistance, geo-politics of transboundary negotiations.
National water ministry, drawing authority from the highest source of political power.
Caps—water entitlement—available to each local government area within a country. Selection of level of local government to be specific to country context. Selection on the principle of the lowest level existing local government jurisdiction which encompasses at least one city and at least some agricultural areas. Selection matches local government with the infrastructure nodes through which water can reach the places and people they represent. Caps assigned in the context of those nodes. That is, national ministries can design the water “market” tailored to their institutional context of where local governments exist, and where water infrastructure exists for local government caps to be established and monitored, and any trade between local governments to be effected.
Delegation to technical agency (described above) of the task of monitoring and measuring local government compliance with caps. Delegation to local governments of the tasks of managing the allocation of water within their caps.
Communication of the strategy to the people through media and local government townhall meetings.
199C HAPTER 10: W ATER AND I NSTITUTIONS IN MENA: THE N EED FOR N EW I DEAS TO T ACKLE A C RISIS A NEW STATE OF MIND: GREATER TRANSPARENCY AND ACCOUNTABILITY IN THE MIDDLE EAST AND NORTH AFRICA PART II: THE LEARNING STATE
Table 1 (continued)
Task Information needed to perform task
Task of deciding how the water from available sources (ground water, surface water and nonconventional water) is distributed across places and people in the reach of that node.
Local information about the relative value of water across competing uses.
Local information about whether others are likely to comply with restrictions (information pertinent for legitimacy).
Type of government agency with informational advantage Output expected
Local governments representing the places and people in the reach of that node.
Local decisions about water allocation to farmers, industries and cities through local political processes and townhall meetings.
Local decisions about selling any part of water entitlement to another local government, or buying additional water from another.
Quantity restrictions (quotas) on water supply for irrigation and across different farms devised by agriculture ministry—monitored and enforced by local government.
Quantity restrictions on water supply to households devised by utilities— local government to win compliance of citizens.
Task of managing water service delivery in utilities.
Utility-specific technical information.
Greater autonomy to utility managers and staff.
Service delivery performance indicators through consumer surveys, testing of water quality, and monitoring of non-revenue water.
5. Conclusion: A call to action
Just as MENA has led the world in building the hard infrastructure for harnessing water (eg. dams and desalination plants), now it needs to lead the world in building the soft infrastructure of institutions that may be equally important to manage the common pool problem of water. MENA’s starting point of centralized state control over the management and allocation of water can be an advantage because it enables moving incrementally towards the intermediate institutions where market forces and state control can be balanced. For example, there is less ideological resistance in MENA to an appropriate role for the state than in a country like the United States, where political polarization and knee-jerk reactions against government is preventing solutions to acute water problems.
Going forward, this chapter makes a call for more “learning by doing” through country-context-specific projects, using the tools of economics to help reform leaders and their external partners design policies, try out reforms, evaluate impact, and iterate towards those reforms that show evidence of success13. That is, projects and reforms do not need to “wait” until research is done, but rather, can use ideas emerging from an economic approach to institutions and try them, learning to do better from both success and failure. Policy experimentation and impact evaluation are needed on:
• how to design water tariffs and how/whether to combine revenues from tariffs with general budget transfers for the financial sustainability of utilities (regardless of whether they are operated by private partners, corporate structures, or as arms of government ministries). Survey evidence is needed on citizen attitudes to different tariff structure (some of which may resonate with ideas of fairness of justice), and evaluating impact of outreach and different tariff structure on willingness to pay and actual revenues. Investing in such survey evidence and
13 This is how other sectors—such as health, education, social protection—have been building new, concrete policies for improved outcomes.
200 C HAPTER 10: W ATER AND I NSTITUTIONS IN MENA: THE N EED FOR N EW I DEAS TO T ACKLE A C RISIS MIDDLE EAST AND NORTH AFRICA REGION | ECONOMIC UPDATE OCTOBER 2022
policy experimentation is not research for research sake but rather the kind of work that is needed for policy breakthroughs.
• how to improve the technical performance of utilities—whether through private sector management, through corporatization, or through existing forms of state ownership in which ministerial power is exercised over utilities. Survey evidence on utility managers and staff is needed to help design contracts with utility management and staff which improve their incentives and professional norms, building trust among staff and managers that each person is working to improve utility performance. Again, these kinds of surveys are not research for research sake, but what a variety of complex organizations, in the private and public sector across the world, regularly undertake and especially when they worry there is a management or performance problem.
• how to decentralize water management and allocation tasks to local governments in existing contexts of local political contestation. Survey evidence on the citizens who contest for leadership in local government, and the impact of communication campaigns on the quality of local leaders and the performance of local government, can yield policy breakthroughs on how to redraw the social contract, and build legitimacy of states for the difficult decisions of managing water scarcity.
Strengthening local political contestation using the critical sector of water in MENA can be potentially transformative, by shifting how the state functions not only in devising and implementing water policies, but more broadly. It has the potential of addressing the general problem of state institutions—changing the social contract to one where the state supports rather than supplants market-led growth, while performing its roles in addressing problems like water for the greater public good.
References
Ayres, A. B., Edwards, E. C., and Libecap, G. D. (2018). “How transaction costs obstruct collective action: The case of California's groundwater.” Journal of Environmental Economics and Management, 91, pp. 46-65. https://doi. org/10.1016/j.jeem.2018.07.001
Ben-Meir, Y. (2021). “Moroccan Decentralization: Towards Community Development and National Solidarity.” The SAIS Review of International Affairs. https://saisreview.sais.jhu.edu/moroccan-decentralization/. Bourblanc, M., and Mayaux, P. L. (2016). “Comparing hydrocracies in Morocco and South Africa: Water reform and bureaucratic restructuring in a neo-liberal context.” In: Water regimes questioned from the 'Global South': Agents, practices and knowledge, edited by Poupeau, F., Henry, O., De Bercegol, R., Richard-Ferroudji, A., Zérah, M. H., and Dasgupta, S. CPR India. CPR India, New Delhi. Workshop Water Regimes Questioned from the Global South, New Delhi, India, 15 January 2016/17 January 2016.
Brixi, H., Lust, E., and Woolcock, M. (2015). Trust, voice, and incentives: Learning from local success stories in service delivery in the Middle East and North Africa (No. 295). World Bank Publications.
Dal Bó, E., Dal Bó, P., and Eyster, E. (2018). “The demand for bad policy when voters underappreciate equilibrium effects.” The Review of Economic Studies, 85(2), pp. 964-998.
Dal Bó, E., and Finan, F. (2020). “At the intersection: a review of institutions in economic development.” In J. M. Baland, F. Bourguignon, J. P. Platteau, and T. Verdier (Eds.), Handbook of Economic Development and Institutions. Princeton University Press.
201C HAPTER 10: W ATER AND I NSTITUTIONS IN MENA: THE N EED FOR N EW I DEAS TO T ACKLE A C RISIS A NEW STATE OF MIND: GREATER TRANSPARENCY AND ACCOUNTABILITY IN THE MIDDLE EAST AND NORTH AFRICA PART II: THE LEARNING STATE
Dasgupta, D., Keller, J., and Srinivasan, T. G. (2002). “Reform and Elusive Growth in the Middle East: What Has Happened in the 1990s?” MENA Working Paper No. 25. World Bank, Washington, D.C.
Desai, R. M., Olofsgård, A., and Yousef, T. M. (2009). “The logic of authoritarian bargains.” Economics & Politics, 21(1), pp. 93-125.
Dubai Electricity and Water Authority. (2019). Consolidated financial statements for the year ended 31 December 2018. https://www.rns-pdf.londonstockexchange.com/rns/1837S_1-2019-3-7.pdf
Elbadawi, I. A. (2002). “Reviving Growth in the Arab World.” Working Paper No. 206, Arab Planning Institute.
Estache, A. (2020). “Institutions for infrastructure in developing countries.” In J. M. Baland, F. Bourguignon, J. P. Platteau, and T. Verdier (Eds.), Handbook of Economic Development and Institutions. Princeton University Press. Falkenmark, M., Lundqvist, J., and Widstrand, C. (1989). “Macro-scale water scarcity requires micro-scale approaches.” Natural Resources Forum, 13(4), pp. 258–267.
Fleet, M. (2019). “Decentralization and its Discontents in Iraq.” POLICY. Middle East Institute. http://iraqieconomists.net/ en/wp-content/uploads/sites/3/2019/09/Decentralization-and-its-Discontents-in-Iraq.pdf
Galiani, S., Gertler, P., and Schargrodsky, E. (2005). “Water for life: The impact of the privatization of water services on child mortality.” Journal of political economy, 113(1), pp. 83-120.
Joodaki, G., Wahr, J., and Swenson, S. (2014). “Estimating the human contribution to groundwater depletion in the Middle East, from GRACE data, land surface models, and well observations.” Water Resources Research, 50(3), pp. 2679–2692.
Khemani, S. (2019). “What is state capacity?” Policy Research Working No. 8734, The World Bank. https://openknowledge. worldbank.org/handle/10986/31266.
Kochhar, K., Pattillo, C., Sun, Y., Suphaphiphat, N., Swiston, A., Tchaidze, R., Clements, B., Fabrizio, S., Flamini, V., Redifer, L., Finger, H., and an IMF Staff Team (2015). Is the Glass Half Empty or Half Full? Issues in Managing Water Challenges and Policy Instruments. IMF Staff Discussion Note. IMF, Washington, DC.
Kuper, M., Faysse, N., Hammani, A., Hartani, T., Marlet, S., Hamamouche, M. F., and Ameur, F. (2016). “Liberation or anarchy? The Janus nature of groundwater use on North Africa’s new irrigation frontiers.” In A. J. Jakeman, O. Barreteau, R. J. Hunt, J. D. Rinaudo, and A. Ross (Eds.), Integrated groundwater management (pp. 583-615). Springer, Cham.
Libecap, G.D. (2008). “Transaction costs, property rights, and the tools of the new institutional economics: water rights and water markets.” In O. E. Williamson, E. Brousseau, and J. M. Glachant (Eds.), New institutional economics: a guidebook (pp .272-291). Cambridge University Press. https://doi.org/10.1017/CBO9780511754043.016
Masten, S. E. (2011). “Public utility ownership in 19th-century America: the “aberrant” case of water.” The Journal of Law, Economics, & Organization, 27(3), pp. 604-654.
Moore, S., and Yu, W. (2020). “Environmental politics and policy adaptation in China: the case of water sector reform.” Water Policy, 22(5), pp. 850-866.
Molle, F., Mollinga, P. P., and Wester, P. (2009). “Hydraulic bureaucracies and the hydraulic mission: Flows of water, flows of power.” Water Alternatives, 2(3), pp. 328-349.
Molle, F. (2008). “Why enough is never enough: The societal determinants of river basin closure.” International Journal of Water Resource Development, 24(2), pp. 247-256.
Molle, F., and Closas, A. (2016). Groundwater governance in the Middle East and North Africa. Project report of the Groundwater Governance in the Arab World - Taking Stock and Addressing the Challenges. International Water Management Institute (IWMI) Project Report No.1, Colombo, Sri Lanka. https://hdl.handle.net/10568/93251
Lavers, T., and Dye, B. (2019) “Theorising the political economy of dams: towards a research agenda.” FutureDAMS Working Paper No. 001. The University of Manchester, Manchester
202 C HAPTER 10: W ATER AND I NSTITUTIONS IN MENA: THE N EED FOR N EW I DEAS TO T ACKLE A C RISIS MIDDLE EAST AND NORTH AFRICA REGION | ECONOMIC UPDATE OCTOBER 2022
Leonard, B., Costello, C., and Libecap, G. D. (2020). “Expanding water markets in the western United States: barriers and lessons from other natural resource markets.” Review of Environmental Economics and Policy, 13(1), pp. 43-61.
Ostrom, E. (2011). “Reflections on some unsettled problems of irrigation.” American Economic Review, 101(1), pp. 4963.
Ostrom, E. (1993). “Design principles in long-enduring irrigation institutions.” Water Resources Research, 29(7), pp. 1907-1912.
Rafey, W. (2020). Droughts, deluges, and (river) diversions: Valuing market-based water reallocation. Working paper. https://rafey.io/files/2k20_09_07_sMDB.pdf
Rajan, R., and Zingales, L. (2003). Saving Capital from the Capitalists: unleashing the power of financial markets to create wealth and spread opportunity. Crown Business, New York.
Richards, A., and Waterbury, J. (1996). A Political Economy of the Middle East. Westview Press, Boulder, Colo.
Rodell, M., Famiglietti, J. S., Wiese, D. N., Reager, J. T., Beaudoing, H. K., Landerer, F. W., and Lo, M.-H. (2018). “Emerging trends in global freshwater availability.” Nature, 557, pp. 651–659. https://doi.org/10.1038/ s41586-018-0123-1.
Somanathan, E. (2020). “Institutions, the environment and development.” In J. M. Baland, F. Bourguignon, J. P. Platteau, and T. Verdier (Eds.), Handbook of Economic Development and Institutions. Princeton University Press.
Sultan, M., Sturchio, N. C., Alsefry, S., Emil, M. K., Ahmed, M., Abdelmohsen, K., AbuAbdullah, M. M., Yan, E., Save, H., Alharbi, T., Othman, A., and Chouinard, K. (2019). “Assessment of age, origin, and sustainability of fossil aquifers: A geochemical and remote sensing-based approach.” Journal of Hydrology, 576, pp. 325-341. ISSN 0022-1694. https://doi.org/10.1016/j.jhydrol.2019.06.017
Richey, A. S., Thomas, B. F., Lo, M., Famiglietti, J. S., Voss, K., Swenson, S., and Rodell, M. (2015) “Uncertainty in global groundwater storage estimates in a Total Groundwater Stress framework.” Water Resources Research, 51(7), pp. 5198–216.
Voss, K. A., Famiglietti, J. S., Lo, M., de Linage, C., Rodell, M. and Swenson, S. C. (2013). “Groundwater depletion in the Middle East from GRACE with implications for transboundary water management in the Tigris-Euphrates-Western Iran region.” Water Resources Research, 49(2), pp. 904-914. https://doi.org/10.1002/wrcr.20078
Wittfogel, K. A. (1957). Oriental despotism: A comparative study of total power. Yale University Press, New Haven, CT. World Bank. (2009). From Privilege to Competition: Unlocking Private-Led Growth in the Middle East and North Africa. MENA Development Report, World Bank, Washington, DC.
World Bank. (2016). Making Politics Work for Development. Policy Research Report. World Bank, Washington, DC. World Bank. (2017). Governance and the Law. World Development Report. World Bank, Washington, DC.
World Bank. (2018). Beyond Scarcity: Water Security in the Middle East and North Africa. MENA Development Series. World Bank, Washington, DC.
World Bank. (2020). Learning Review: World Bank Water Sector Technical Assistance to Iraq FY19-21 http://documents. worldbank.org/curated/en/633501609743555666/Learning-Review-World-Bank-Water-Sector-TechnicalAssistance-to-Iraq-FY19-21.
World Bank. (2022) [forthcoming]. The Economics of Water Scarcity in the Middle East and North Africa: Institutional Solutions. World Bank, Washington, DC.
World Commission on Dams. (2000) Dams and Development: A New Framework for Decision-Making. The Report of the World Commission on Dams, Earthscan Publications Ltd., London and Sterling.
Yousef, T. M. (2004). “Development, Growth and Policy Reform in the Middle East and North Africa since 1950.” Journal of Economic Perspectives, 18(3), pp. 91–116.
203C HAPTER 10: W ATER AND I NSTITUTIONS IN MENA: THE N EED FOR N EW I DEAS TO T ACKLE A C RISIS A NEW STATE OF MIND: GREATER TRANSPARENCY AND ACCOUNTABILITY IN THE MIDDLE EAST AND NORTH AFRICA PART II: THE LEARNING STATE
Chapter 11: Digital Technology Adoption in the Middle East and North Africa: Trust and the Digital Paradox by Christina A. Wood
MIDDLE EAST AND NORTH AFRICA REGION | ECONOMIC UPDATE OCTOBER 2022
1. Introduction
This chapter discusses key governance challenges pertinent to adoption of digital technologies for e-commerce purposes. The term “digital technologies” refers to data-driven, general-purpose technologies that significantly reduce the costs of economic and social interactions. For the purposes of this chapter, “digital technologies” comprises equipment and applications that enable connection to the Internet through high-speed fixed or mobile broadband to facilitate access to digital platforms (or apps, including payment systems) that serve as matchmakers between buyers and sellers of goods or services. In so doing, these apps allow distanced users to more easily connect with each other remotely to engage in economic transactions of goods or services (Evans and Schmalensee 2016). In this sense, digital technologies are what enable the transactional digital economy to flourish, facilitated by digital payment mechanisms that, understandably, play a central role.
The chapter is based on the analyses in Cusolito et al. (2022) that established that the socioeconomic upside impact of digital technology adoption in the Middle East and North Africa is huge for growth and job creation, when universal adoption of digital technologies is achieved. The region can obtain large economic gains from universal adoption of high-speed Internet, which will help reduce search, transaction, and intermediation costs between people engaging in economic activities.
Cusolito et al. 2022 presented evidence of the socioeconomic gains of fully digitalizing the economies of the Middle East and North Africa—the region’s gross domestic product (GDP) could increase by an estimated 46 percent, equivalent to US$1.6 trillion, and GDP per capita for middle-income countries in the region could increase by 71 percent, equivalent to US$7,000 per capita. At the firm level, manufacturing revenue per unit of factors of production could increase by 37 percent, and employment in manufacturing could rise by 7 percent (1.5 million new manufacturing jobs). Tourist arrivals could rise by 70 percent, creating jobs in the hospitality sector, and female labor force participation could double from 20 percent to 40 percent—adding 80 million women to the labor market each year.
To reap these socioeconomic gains, countries in the Middle East and North Africa must overcome challenges that result in the region’s greater use of digital technologies for social media purposes rather than for economic purposes. This characteristic of countries in the Middle East and North Africa is referred to in this report (per Cusolito et al. 2022) as the Middle East and North Africa’s digital paradox, which will be discussed further in the next section. To overcome this challenge, and bridge the gender digital divide, a big push to increase use of digital payments in the region is clearly needed; otherwise, the digital economy will remain slow-growing (relative to its potential growth), and its potential benefits will be foregone.
Increasing the use of digital payments requires strengthening the supply and demand sides of the digital payment ecosystem. On the supply side, the region must ensure a solid information and communication technology (ICT) infrastructure, specifically fixed and mobile broadband services, for coverage and quality of Internet connection services. Yet, coverage and quality are not enough on their own; telecom broadband services must also be reliable and, importantly, affordable. Ensuring quality mobile broadband is particularly important because it could enhance opportunities for countries in the Middle East and North Africa to leapfrog and catch up with economies that have higher digital payments use (e.g., Kenya). The region must also support human capital development, notably digital literacy and digital entrepreneurship to enable adaption or creation of digital payment tools and services (e.g., apps) for the context of the Middle East and North Africa region’s economies.
205CHAPTER 11: DIGITAL TECHNOLOGY ADOPTION IN THE MIDDLE EAST AND NORTH AFRICA: TRUST AND THE DIGITAL PARADO x A NEW STATE OF MIND: GREATER TRANSPARENCY AND ACCOUNTABILITY IN THE MIDDLE EAST AND NORTH AFRICA PART II: THE LEARNING STATE
On the demand side, the hypothesis is that greater trust in government and institutions is essential for increasing digital payments use, and that trust can be enhanced using a two-pronged approach. The first is to ensure a regulatory environment that enables secure digital transactions, effective data governance, and data privacy protections. The second is to create secure opportunities that induce people to use and become familiar with digital money—such as digital social protection payments in lieu of cash transfer payments and digital options for paying for government-provided services. Other e-governance mechanisms may also be available to increase use of digital payments.
The rest of the chapter is organized as follows. The second section presents the digital paradox that characterizes the Middle East and North Africa region’s economies. The third section discusses the role of trust as an important determinant of adoption of digital technologies. The fourth section discusses the regulatory environment as an enabler of digital technology adoption. The fifth section concludes with some reflections on policies.
2. The Middle East and North Africa’s digital paradox and why it matters
A digital paradox characterizes digital technology use in the Middle East and North Africa region: for its countries’ levels of development, measured according to per capita GDP, the region has an excess in the use of social media (defined as number of Facebook accounts) and a deficit in the use of digital payments (defined as the number of individuals who have made or received a digital payment). This is evident in econometric regressions that benchmark countries in the Middle East and North Africa region against countries in other regions. Although per capita social media use of countries in the Middle East and North Africa outperforms that of other countries at comparable levels of per capita GDP, the use of digital payments of countries in the Middle East and North Africa underperforms that of the comparator countries (Figure 1). The econometric estimations indicate that, on average, the Middle East and North Africa region’s excess number of active Facebook accounts relative to where it should be given the region’s per capita income level, is about 11 percent. In contrast, on average, the region’s deficit in terms of the population’s experience with making or receiving a digital payment is about 15 percent. Without wider diffusion of digital payments use, the Middle East and North Africa’s digital economies will progress slowly.
The Middle East and North Africa region’s characterization regarding its use of digital technology for social versus economic purposes, is unique to the region and applies to all countries in the region regardless of per capita GDP (with the exception of Iran). Whatever the reasons for slow growth of the Middle East and North Africa’s digital economy, it is not merely a question of insufficient ICT infrastructure coverage, slow Internet speed, or insufficient access to the Internet (Cusolito et al. 2022). Getting to the root causes of this paradox and overcoming them is the only way that countries in the Middle East and North Africa can expand their digital economies and reap the gains they offer.
Digital tools such as the Internet, associated user applications, and other ICTs, offer tremendous gains because they are general purpose technologies (GPTs). Like other GPTs such as electricity, telephones, and railroads, digital economy technologies are usable in all sectors and boost economic connectivity—whether physical or virtual. As GPTs improve, they reduce costs and spur innovations beyond their initially imagined applications in many sector products and processes (Jovanovic and Rousseau 2005). In so doing, they engender widespread gains throughout the economy. The economic benefits of GPTs tend to increase as they become widely adopted across the population. For example, digital platforms are viewed as having turbocharged GPT characteristics, particularly network externalities that serve as a driving force of efficiency and productivity gains (Evans and Schmalensee, 2016).
206 CHAPTER 11: DIGITAL TECHNOLOGY ADOPTION IN THE MIDDLE EAST AND NORTH AFRICA: TRUST AND THE DIGITAL PARADO x MIDDLE EAST AND NORTH AFRICA REGION | ECONOMIC UPDATE OCTOBER 2022
Employment creation of enterprises appears to be associated with digital technology adoption, even in traditional manufacturing industries and even when the job gains are biased in favor of skilled workers. Firm-level evidence from emerging markets in Latin America suggests that this is so (Dutz, Almeida, and Packard 2018). In addition, Hjort and Poulsen (2019) estimated that the arrival of high-speed internet submarine cables in Africa was associated with a significant increase in employment in local labor markets of 3 to 13 percent, depending on the country and dataset. Furthermore, the arrival of high-speed Internet was associated with an average increase in firm-level productivity of 12.7 percent in manufacturing firms in Ethiopia. Below, new empirical research indicating that such effects are similar in magnitude for countries in the Middle East and North Africa region and other developing countries is discussed.
In view of the scale effects of ICTs, combined with their general-purpose applicability, a bold policy approach is desirable to increase access to the Internet rapidly, increase the reliability and affordability of Internet access, and enable widespread diffusion and use of digital payment systems.
3. The trust hypothesis
Uptake of the use of digital technologies across society to conduct economic transactions requires that users trust the regulatory environment, financial and banking institutions, and the government itself. Without trust, societal uptake of digital payment systems might remain low even if the population has broad access to the Internet and mobile telephony services. In this light, the region’s digital paradox might be due to high gaps in societal trust. It is difficult to exaggerate that ensuring transparency, accountability, and trust in digital technologies and data use are the indispensable analog complements for realizing the promise of digital transformation. Trust is understood to be a key driver of digital payments use (Chakravorti et al. 2020), yet firm evidence from rigorous analysis that links trust to digital payments use is thin, given the challenges in measuring trust as it pertains to use of digital payments. For this reason, this chapter refers to the trust–payments relationship as a hypothesis while highlighting some of the relevant research. Figure 2 and Figure
Figure 1. Middle East and North Africa’s digital paradox Facebook account penetration rate, 2018 Use of digital payments, 2017 Percent age 15+ 100 80 60 40 20 0 68 10 12 100 80 60 40 20 0 68 10 12 Log of GDP per capita in 2018 (PPP, current international $) Log of GDP per capita in 2017 (PPP, current international $) J 95% CI ▬ Fitted values z Rest of the world z EAP z MENA excl. Israel and Malta z SSA J 95% CI ▬ Fitted values z Rest of the world z EAP z MENA excl. Israel and Malta z SSA Source: Cusolito et al. 2022. Note: The graphs show the empirical relationship between level of development (measured along the horizontal axis by the log of per capita gross domestic product (GDP) adjusted for purchasing power parity (PPP) in U.S. dollars) and number of active Facebook accounts per capita (graph on left) and the share of the adult population reporting use of the Internet to make payments (graph on right). The fitted curves in both graphs show the best-fitting estimate of the relationship, namely a quadratic function. Red dots correspond to observations for countries in the Middle East and North Africa. Econometric estimates—not reported—indicate that the average vertical distance between the red dots and the fitted line is approximately 8 percent on the left-hand graph and -16 percent on the right-hand graph.
207CHAPTER 11: DIGITAL TECHNOLOGY ADOPTION IN THE MIDDLE EAST AND NORTH AFRICA: TRUST AND THE DIGITAL PARADO x A NEW STATE OF MIND: GREATER TRANSPARENCY AND ACCOUNTABILITY IN THE MIDDLE EAST AND NORTH AFRICA PART II: THE LEARNING STATE
and trust in politicians—and digital
North Africa enjoy higher trust than expected for their transparency levels, whereas others underperform in terms of public trust in politicians relative to expectations based on their transparency levels. Consistent with the Middle East and North Africa’s digital paradox mentioned above, most countries in the region have fewer digital payments
showing that some countries in the Middle East
for their levels of public trust in politicians.
trust
factors that can shape
Societal trust—between citizens, between citizens and their governments, between citizens and key institutions such as banks—is important for the development of a digital economy. Distrust in government and the banking system can discourage citizens from adopting digital payments for transactions on digital platforms, and distrust can encourage citizens to adopt social digital tools as a vehicle of empowerment for expressing their dissatisfaction. Use of social media platforms often reduces the cost of collective action, thereby raising a society’s collective voice in the form of protests and other related phenomena (Arezki et al. 2020; Fergusson and Molina 2019; Yee and Fassihi 2021).
Using digital technologies also influences societal trust. Use of social media has been found to increase distrust in government. Huang et al. (2020) found a negative relationship between use of social media and trust in government based on survey data from 20,667 respondents in 14 East Asian countries and territories. You and Wang (2020), using World Values Survey data, found that distrust was greater in countries with more-authoritarian governments, reflecting a wider gap in those countries between the freedom of expression that individuals have in using the Internet and lack of freedom that they experience in interacting with their government. You and Wang (2020) argue that their results provide evidence that authoritarian governments, such as many in the Middle East and North Africa, face greater challenges than nonauthoritarian governments in overcoming the distrust of their citizens in the Internet age.
Trust and use of digital payments also affect each other favorably. The literature linking societal trust in government with use of e-government applications describes a multifaceted relationship that appears to be bidirectional, although
3 suggest evidence of a link between different proxies of trust—data transparency
payments,
and
than expected
The subsequent paragraphs provide a framework for thinking about policies and societal
as
coverage of digital services, use or adoption of digital tools such as digital payments, and consequent socioeconomic implications. Figure 2. Correlation between transparency and trust Figure 3. Correlation between trust and digital payments use Public trust in politicians Internet payments, percent 6 5 4 3 2 1 0 020406080 100 ARE QAT SAU BHR JOR MAR EGY TUN YEM LBN 12 34 56 100 80 60 40 20 0 ARE IRN BHR KWT SAU LBN JORTUNDZA EGY MAR Open data score Public trust in politicians Source: Cusolito et al, 2022. Note: Variables on the y- and x-axes are scores without units. Source: Cusolito et al, 2022. Note: Internet payments refers to “Used the Internet to pay bills or to buy something online in the past year (% age 15+)”, data are as of 2017.
208 CHAPTER 11: DIGITAL TECHNOLOGY ADOPTION IN THE MIDDLE EAST AND NORTH AFRICA: TRUST AND THE DIGITAL PARADO x MIDDLE EAST AND NORTH AFRICA REGION | ECONOMIC UPDATE OCTOBER 2022
the consensus leans toward a positive effect of trust on citizen use of e-government (Mensah and Adams 2020). The few studies that analyzed the reverse relationship found that e-government has a significant positive effect on trust but only if e-government services improve government performance and transparency (Mahmood, Weerakkody, and Chen 2020; Song and Lee 2016).
Alkhowaiter (2020) reports the finding from 46 studies of data from Gulf Cooperation Council countries that the best predictors of adoption of digital payment and banking are trust, perceived security, and perceived usefulness of the payment or banking tool. Factors linking low trust to low adoption of digital payments or low use of Internet banking include high perceived risk (Balakrishnan and Shuib 2021, on the willingness of Malaysian ride-share drivers to go cashless), tax avoidance (Ligon et al. 2019, on small and medium merchants in Jaipur, India), and concerns over privacy (Png and Tan 2020, on use of cash in retail transactions in 36 countries). Technology readiness and prior Internet knowledge were found to have a positive effect on adoption of digital payments in the Republic of Yemen, whereas risk did not have a significant effect (Alhakimi and Esmail 2020).
The digital trust component of the Digital Intelligence Index identifies two types of actors (givers and guarantors of trust) and four dimensions (attitudes, behavior, environment, experience) that determine the degree of trust in a digital economy (Chakravorti et al. 2020). Givers of trust are users, consumers, and citizens, whose degree of trust is reflected in their “attitudes" (how they feel about the digital environment, their comfort levels and confidence in the security of the digital payment system) and their “behavior” (how much they engage in digital payments). Guarantors of trust are businesses and institutions whose roles are to establish and affect the “environment” in which digital payments take place (how much accountability, privacy, security there is) and the “experience” that users have engaging in digital payments (e.g., user friendliness and efficiency of use of the technology). These components help understand potential points of entry for influencing trust in use of digital payments
Among the types of actors, the literature identifies a gender divide in use of digital payments and trust in digital solutions, as with traditional financial services such as having a bank account. Women have been found to be less trusting than men of more advanced payment systems (Szumski 2020) and hence to participate less in digital payments. The gender divide exists in almost every country, and controlling for country and individual characteristics or type of product offered does not fully explain it (Chen et al. 2021). According to the World Bank Global Findex database (Demirgüç-Kunt et al. 2018), men in developing countries are 9 percentage points more likely than women to own an account (Klapper and Goodwin-Groen 2015). Survey results indicate that women worry more about privacy concerns and are less willing to share their data with digital payment companies and less willing to adopt better or more-innovative products and technologies (Chen et al. 2021). Nonetheless, financial inclusion can be fostered when design of financial products and services considers what women value in a variety of settings, namely that payment solutions are convenient, reliable, secure, and private (Porter 2015). These attributes, some due to women’s own preferences and others due to social norms that disadvantage women, contribute to women’s trust about using digital payments.
4. Regulatory environment for digital technology adoption
One factor underlying trust in digital payments relates to the environment in which digital payments are used. Developing a digital economy requires setting the right enabling conditions (regulatory framework) to build the digital infrastructure, foster the supply of digital goods and services, and facilitate creation of digital marketplaces. Such a regulatory framework
209CHAPTER 11: DIGITAL TECHNOLOGY ADOPTION IN THE MIDDLE EAST AND NORTH AFRICA: TRUST AND THE DIGITAL PARADO x A NEW STATE OF MIND: GREATER TRANSPARENCY AND ACCOUNTABILITY IN THE MIDDLE EAST AND NORTH AFRICA PART II: THE LEARNING STATE
relies primarily on three pillars: competition policy to ensure coverage and quality of digital services; data governance to secure user data privacy and protection; and sound e-commerce regulations governing intermediate liability, protection of online consumer activity, e-documents, and e-signatures, which are needed to increase user confidence and trust in conducting transactions online. This section provides more discussion of e-commerce regulations in fostering societal trust in conducting transactions online.
This section discusses the regulatory environment that affects use of digital technologies for economic purposes and hence growth of the digital economy. First, the section discusses the enabling regulatory framework for e-commerce. Second is a discussion of telecom market regulations and contestability. Third, financial sector governance challenges are discussed. Lastly, the section discusses data governance and data privacy. Wherever possible, countries in the Middle East and North Africa are benchmarked against countries of similar per capita GDP levels.
E-Commerce Regulatory Environment
In the context of the digital economy, the regulatory environment enables digital technology adoption. It includes broad, diverse areas such as electronic transactions and signatures, consumer protection, antitrust, data protection, cybersecurity, and liability regulations. A more comprehensive regulatory environment can encourage use of digital transactions by instilling greater trust in digital services. Based on a comparison of 20 countries in the Middle East and North Africa with 20 countries in other regions to measure level of development of the enabling regulatory framework for e-commerce, middle-income countries (MICs) in the Middle East and North Africa are comparable with other MICs except in the areas of electronic signatures, data privacy protections, online consumer protections, and cybersecurity (Figure 4a). High-income countries (HICs) in the Middle East and North Africa, in contrast, compare well with other HICs in terms of electronic documents and e-signatures but lag other HICs with respect to all other regulatory areas (Figure 4b).
Figure 4. Benchmarking the regulatory framework for e-commerce
a. Middle-income countries
High-income countries
Data privacy
Data privacy
b.
Electronic documentation Electronic signature Online consumer protection
Cybersecurity Intermediary liability Electronic documentation Electronic signature Online consumer protection
Cybersecurity Intermediary liability MENA-MICs MICs (minus MENA) … MENA-HICs HICs (minus MENA) Source: Daza Jaller and Molinuevo 2020. Note: HICs, high-income countries; MICs, middle-income countries. 210 CHAPTER 11: DIGITAL TECHNOLOGY ADOPTION IN THE MIDDLE EAST AND NORTH AFRICA: TRUST AND THE DIGITAL PARADO x MIDDLE EAST AND NORTH AFRICA REGION | ECONOMIC UPDATE OCTOBER 2022
Table 1. Regulation on data privacy in the Middle East and North Africa
Data subjects’ rights Cross-border data transfers
Algeria
Iran,
Israel
Kuwait
Lebanon
Morocco
Oman
Qatar
Saudi
Tunisia
United
Liberalization and Competition in Telecom Markets
Development of information and communication technology (ICT) infrastructure varies across countries in the Middle East and North Africa region and has room to improve in absolute terms regarding coverage, quality, reliability, and affordability of Internet services in many countries.3 Fixed broadband coverage in the region is below expectations relative to countries’ per capita GDP levels. Yet the data also indicate that, for the region’s per capita income levels, network coverage is, on average, comparable with that of countries in other regions, mainly for 3G mobile networks for which there is at least 95 percent coverage (except for Djibouti and the West Bank and Gaza). In terms of highercapacity 4G networks, countries in the region (other than Djibouti and Iraq) are on par with their income group, with at least 75 percent coverage of the population, considered to be the minimum threshold for meaningful connectivity.4 Some countries (mainly Gulf Cooperation Council members) have even higher-capacity 5G networks. Regarding Internet costs for users, the Middle East and North Africa is within the average range for countries at similar income levels—on average, 1.7 percent of income per capita, which is less than the United Nation’s affordability target of 2 percent of gross national income per capita (Cusolito et al. 2022, Figure B.1d). Regarding Internet speeds, outcomes are more dispersed in the Middle East and North Africa than in other countries at similar income levels—some countries overperform; others
1
2
the
Algeria has some
Table 1 presents information on countries in the Middle East and North Africa that have introduced legislation on data governance to protect data privacy.1 Additional information may also be found in the World Bank Digital Government Readiness Assessments implemented in Lebanon, Tunisia, and the West Bank and Gaza.2
Country Sensitive data Legal bases for data collection and processing
Special treatment Consent Performance of a contract Legal obligation Legitimate interests Access or deletion Rules on transfers No data localization
Bahrain
Islamic Rep.
Arabia
Arab Emirates Source: Daza Jaller and Molinuevo 2020.
In a state of emergency such as the COVID pandemic, special rules could be temporarily enacted that may waive some of these restrictions on data protection.
Although
full results of these assessments may not yet be publicly disclosed, information on the assessments can be found in World Bank 2020. 3
of the lowest mobile speeds in the world, and Qatar and United Arab Emirates have some of the fastest, probably reflecting the advent of 5G services in the latter two countries. 4 See Cusolito et al. 2022, Appendix B, Figure B.1d; Figure B.3; and https://a4ai.org/meaningful-connectivity 211CHAPTER 11: DIGITAL TECHNOLOGY ADOPTION IN THE MIDDLE EAST AND NORTH AFRICA: TRUST AND THE DIGITAL PARADO x A NEW STATE OF MIND: GREATER TRANSPARENCY AND ACCOUNTABILITY IN THE MIDDLE EAST AND NORTH AFRICA PART II: THE LEARNING STATE
underperform (Cusolito et al. 2022, Figure B.5). Overall though, infrastructure access does not explain the region’s slower development of digital payments adoption than in other regions (Cusolito et al. 2022, Figures B.1 and B.3).
Prospects for growth of the digital economy are inextricably linked with development of the ICT sector, even though the latter is not a sufficient enabler of the former.5 Of particular relevance is the ICT sector’s ability to acquire and deploy the latest technologies, which can favorably affect the price, quality, and coverage of digital services offered via broadband and mobile telephony. Technology adoption is a firm-level decision, that is influenced not only by industry and market factors, but also by government policies, regulations, and actions, whether benevolent or captured by specific interests.
Much of the literature has focused on the evolution of regulations and competition policy after liberalization (see, e.g., Laffont, Rey, and Tirole 1997). Some studies (e.g., Cramton et al. 2011; Rey and Salant 2012) assess how best to design procedures for allocating spectrum, which are common in liberalized mobile telecommunications markets, to guarantee downstream competition among operators. Other studies assess the role of independent regulatory bodies on telecommunications performance after privatization and find few benefits. Faccio and Zingales (2017) revealed the positive effect of following regulatory best practices, measured by the International Telecommunication Union regulatory score, on various measures of market efficiency. They then questioned why countries do not systematically follow regulatory best practices and provide results supporting the regulatory capture theory.
Comin and Hobijn (2009) studied the effect of institutional variables that affect the cost of lobbying and erecting barriers to entry on the speed of technology diffusion. And Cervellati, Naghavi, and Toubal (2018) used the CHAT database (Comin and Hobijn 2009) to analyze links between democratization, openness to trade, and incentives for technology adoption. But few empirical studies have focused on the mobile telecommunications sector.6
A new study by Arezki et al. (2021) appears to be the first to exploit the sequenced launching of mobile telecommunications generations (1G to 5G) to explore the role of liberalization and independent regulatory agencies on adoption of technology in the ICT sector. The study draws on several databases to construct four ICT sector indicators—technology adoption, liberalization, foreign participation, regulatory independence (see Cusolito et al. 2022 Appendix C for information on construction of the indicators).
Figure 5 shows the evolution of the ranking for adoption of mobile telephony standards in the Middle East and North Africa and Sub-Saharan Africa. In contrast with North America, which jumped quickly to top rank and stayed there, some regions progressed much slowly up the technology ladder, while the Middle East and North Africa experienced swings in its trajectory, initially progressing prior to 2008 then declining. Sub-Saharan Africa’s ranking declined through 2006 but has since been improving.
Figure 6 shows that the share of middle-income countries with an independent regulatory authority is lower in Middle East and North Africa region than in middle-income countries in Sub-Saharan Africa. Whether this gap hampers the region’s ability to adopt the latest mobile telephony technologies is an empirical question, complicated by the fact that foreign entry into the mobile telephony market could be an alternative route for accelerating the pace of adoption.
5 This sub-section relies heavily on Arezki et al. 2021.
Wallsten (2001), focusing on Latin American and African countries from 1984 to 1997,
lower prices and better access. Ezzat and Aboushady (2018), studying the sequencing of reforms
before privatizing the
facilitates entry of competitors.
6
established that competition is associated with
in countries in the Middle East and North Africa, showed that creating an independent regulator
incumbent
212 CHAPTER 11: DIGITAL TECHNOLOGY ADOPTION IN THE MIDDLE EAST AND NORTH AFRICA: TRUST AND THE DIGITAL PARADO x MIDDLE EAST AND NORTH AFRICA REGION | ECONOMIC UPDATE OCTOBER 2022
Figure 7. Share of liberalized countries in Middle East and North Africa and in Sub-Saharan Africa, 2000–18
Figure 8. Foreign participation as share of the market in Middle East and North Africa and Sub-Saharan Africa, 2000–18
Middle East and North Africa and Sub-
the sector
the
2000.
Further liberalization of the
participation in the sector, might thus not be enough to help the region
other
and
gain access to the latest generations
mobile
Figure 5. Mobile technology adoption rankings in the Middle East and North Africa and Sub-Saharan Africa, 1981–2007 Figure 6. Information and communications technology regulatory authority independence index in the Middle East and North Africa and Sub-Saharan Africa, 2017 Ranking, reversed 0 20 40 60 80 100 120 140 16019811983198519871989199119931995199719992001200320052007200920112013201520172019 0.8 0.7 0.6 0.5 SSA MENA High income Lowermiddle income Uppermiddle income Low income Regions Income groups MENA Sub-Saharan Africa Source: Arezki et al. (2021). Note: Regional rankings reflect a simple average of rankings of all member countries in the indicated year. See Arezki et al. (2021) for more details of the technology adoption ranking. Source: Arezki et al. (2021). International Telecommunication Union, and World Bank staff calculations. Note: Bars represent independence of regulatory authority in the information and communications technology sector. Data is as of 2017, and scores are normalized to range between 0 and 1. Country groups scores reflect a simple average of member country scores.
Percent Percent of market share 100 90 80 70 60 50 40 30 20 10 0 2000200120022003200420052006200720082009201020112012201320142015201620172018 100 90 80 70 60 50 40 30 20 10 0 2000200120022003200420052006200720082009201020112012201320142015201620172018 MENA Sub-Saharan Africa MENA Sub-Saharan Africa Source: Arezki et al. (2021). Note: Lines show the share of countries with liberalized information and communications technology sectors. Regions reflect World Bank categories. See Arezki et al. (2021) for more details on telecom liberalization. Source: Arezki et al. (2021). Note: Regional shares are represented by a simple average of foreign participation rates of respective member countries. See Arezki et al. (2021) for more details of the foreign participation rate. Figure 7 shows the increasing liberalization of telecommunications sectors in the
Saharan Africa, and Figure 8 shows the corresponding upward trend in foreign participation in
since
These regions already have among the highest levels of foreign participation in
world.
telecommunications sector, in the sense of allowing foreign direct investment and
and
low-
middle-income countries to
of
telephony. 213CHAPTER 11: DIGITAL TECHNOLOGY ADOPTION IN THE MIDDLE EAST AND NORTH AFRICA: TRUST AND THE DIGITAL PARADO x A NEW STATE OF MIND: GREATER TRANSPARENCY AND ACCOUNTABILITY IN THE MIDDLE EAST AND NORTH AFRICA PART II: THE LEARNING STATE
Arezki et al. (2021) explored the determinants of technology adoption, providing a view of how foreign entry and domestic regulatory independence interact to create incentives for market participants to make the necessary investments to provide customers with access to the latest generation of mobile telephony. Specifically, the study finds that liberalization and regulatory independence together (not separately) increase the rate of mobile technology adoption. Liberalization on its own is not sufficient to spur technology adoption; neither is foreign participation or regulatory independence. Arezki et al. (2021) presented econometric estimations linking competition to technology adoption via liberalization and regulatory independence. They highlight the importance of liberalization and independence of the telecommunications regulatory authority, jointly, for increasing the rate of telecommunications technology adoption.7 The results show that neither liberalization nor regulatory independence alone is statistically significant, nor are they robust across different model specifications. However, the coefficient associated with the interaction of liberalization and regulatory independence is statistically significant across various regression specifications.8 For example, the results of the interaction indicate that an improvement in regulatory score by 0.3 units can boost technology adoption by 3—that is, it surpasses three countries in the ranking of mobile data technology adoption. Using foreign participation in the telecommunications sector (de facto liberalization) instead of de jure liberalization yields the same result, which is that the interaction coefficient of de facto liberalization with regulatory independence is positive (in this case with higher magnitudes) and statistically significant. In short, liberalization and regulatory independence appear to be jointly necessary for an economy to accelerate the pace of digital technology adoption. At least this seems to be the case for mobile data transmission technologies.9
Financial Sector Governance and Digital Payment Adoption
Digital payment systems are essential not only for the digital economy to function, but also for the emergence of other digital financial services such as e-lending and e-savings. Notwithstanding the region’s digital paradox, lags are also evident in traditional payment systems, which rely on access to bank accounts. Gévaudan and Lederman (2020) found that countries in the Middle East and North Africa region have less-well-developed payment systems than countries with similar income levels. Irrespective of type of payment (traditional or modern), on average, countries in the region appear below the fitted values, underperforming relative to other countries with similar income levels. Because this underperformance applies not only to digital payment methods but also to traditional payment systems, it is a sign that the Middle East and North Africa lacks access to financial services sector wide, which raises the question of why that is the case and suggests that sector regulations and corporate governance concerns may be at play.
The oversized role of the state in the economy, through state-owned enterprises and state-owned banks, is often thought to stifle private sector innovation and prevent advances in technology, ultimately hampering economic growth and employment creation (Arezki and Senbet 2020). In recent analysis, the impact of the state, also referred to as governance, is assessed obliquely using data on banking regulations and supervision and on digital payment use. The impact of
7 See Arezki et al. (2021, appendix Table 3) for the list of countries used in the regression analyses.
8 Both regressions control for country fixed effects, the logarithm of population, and the logarithm of per capita GDP. Separate regressions also control for year fixed effects and for the fixed effect of the generation of the mobile telecom standard adopted. Other specifications included in Arezki et al. (2021) also show statistically significant interaction coefficients.
9 There is a subtle difference between “coverage” of digital infrastructure services (e.g., access to the Internet) and “digital technology adoption” (e.g., use of the Internet to make digital payments or, in this case, adoption of the latest generation of mobile data transmission technology). The difference is subtle because of the practical overlap between service coverage and technology adoption—the latter can only occur when enterprises or individuals have access to digital telecommunications services that require building infrastructure. The case of mobile data transmission technologies includes elements of both concepts because adoption of a given generation of technologies—for example, 5G—requires some investments in physical infrastructure, but moving from 3G to 4G might require only minimum investments such as retrofitting existing infrastructure.
214 CHAPTER 11: DIGITAL TECHNOLOGY ADOPTION IN THE MIDDLE EAST AND NORTH AFRICA: TRUST AND THE DIGITAL PARADO x MIDDLE EAST AND NORTH AFRICA REGION | ECONOMIC UPDATE OCTOBER 2022
banking sector size (reflecting development of the banking sector) on digital payment use is also assessed. In the case of the banking sector, the Middle East and North Africa appears to have characteristics that differ from those of other regions regarding correlation of digital payments with banking regulations and with banking sector size. In analysis of the effects of banking regulations and the size of the banking sector on the incidence of digital payments,10 the Middle East and North Africa was found to have the highest level of banking sector regulatory restrictions11 (followed by East Asia and the Pacific) and the second largest banking sector in the world. The analysis examined the relationship between digital payments, bank regulations, and bank development to determine whether differences emerge in the effect of banking restrictions and banking system development on digital payments, stemming from varying the introduction (in the estimation model) of variables viewed as enablers of digital payment development.12
The analysis found that, in all but one model specification using all countries in the sample other than those in the Middle East and North Africa (rest of the world), increases in restrictions on banking activities are statistically significant and negatively correlated with development of digital payments. Likewise, in all but one specification using rest-of-theworld countries, further banking system development (i.e., increase in banking assets) is statistically significant, but in this case, the relationship is positively correlated with development of digital payments. For the three estimations in which the relationship was statistically significant, a 1-unit increase in the banking restrictions variable for the rest-ofthe-world group of countries decreased development of digital payments by a range of 1.8 to 2.9 percentage points, and a 1-unit increase in banking assets increased digital payments by a range of 0.15 to 0.31 percentage points. For the region, the reverse pattern was observed: more banking sector restrictions were associated with a higher incidence of digital payments (an effect of about 1 percentage point), whereas no correlation was found between size of the banking sector and incidence of digital payments (Cusolito et al. 2022, Appendix A, Table A.1). Impediments to development of digital payments were not discernable empirically, but they seem to be linked to structural features of the banking sector rather than being the result of stringent regulations or level of development of the banking system.
It is likely that banking sector constraints reflected in characteristics such as weakly-contestable markets, large share of the state-owned bank sector, and/or large share of banking sector loans to state-owned enterprises. As found in the case of Pakistan, delinking bank management and ownership control from the government usually creates competition and stimulates innovation in the banking sector in areas including digital banking products and services (di Patti and Hardy 2005). In the Middle East and North Africa, state banks were significantly weaker performers on key banking indicators than domestic and foreign private banks (Farazi et al. 2013). The result stemmed from larger holdings of government securities by banks, higher costs due to higher staff numbers, and larger loan-loss provisions reflecting weaker asset quality.
As mentioned above, countries in the Middle East and North Africa differ from countries in other regions in that, despite an ICT infrastructure comparable with that of its peers (particularly mobile broadband), the region lags with respect to an enabling regulatory environment for the digital economy and adoption of productive digital services such as mobile money. Regarding other indicators of the enabling environment, the Middle East and North Africa is on par with world averages on e-government development (Cusolito et al. 2022, Table B.4) yet slightly lags world averages on quality of institutions (Cusolito et al. 2022, Table B.5).
10 World Bank staff (Robert Cull, Daniel Lederman, and Davide Mare)
payments, banking regulations, and banking system development from the Findex survey (Demirgüç-Kunt et al. 2018), the Bank Regulation
Bank
11 World Bank staff computed the degree of regulatory
12 The common enablers of digital
compiled data on digital
and Supervision Survey (World Bank 2019a), and the Global Financial Development Database (World
2019b).
restrictions as an index that accounts for whether banks can participate in securities, insurance, and real estate financial activities.
payments introduced separately in the estimation model are secondary education enrollment, access to electricity, individuals using the Internet, and mobile cellular subscriptions (Cusolito et al. 2022, Appendix A). 215CHAPTER 11: DIGITAL TECHNOLOGY ADOPTION IN THE MIDDLE EAST AND NORTH AFRICA: TRUST AND THE DIGITAL PARADO x A NEW STATE OF MIND: GREATER TRANSPARENCY AND ACCOUNTABILITY IN THE MIDDLE EAST AND NORTH AFRICA PART II: THE LEARNING STATE
Stringent regulations in the financial sector do not seem to explain this underperformance of the Middle East and North Africa region. This effect is unique to the region, which further spotlights the digital paradox. Nonetheless, countries in the region need not be relegated to slow growth of digital payments that progresses gradually and linearly through the different stages of payments. Mobile payment systems may offer a workaround to possible governance challenges in the financial sector. Gévaudan and Lederman (2020) find evidence suggesting the possibility of leapfrogging from a cash-based to a digital payment system, regardless of level of banking system development. This leapfrogging could be achieved via growth in use of mobile money, which does not necessarily depend on access to a traditional bank account. Kenya, which is less developed than countries in the Middle East and North Africa, shifted quickly to a level of noncash transactions via its mobile-based M-PESA system that now dwarfs that of countries in the Middle East and North Africa in terms of value of digital transactions. A modernized regulatory framework or one that is flexible enough to adapt to new technologies, as was the case in Kenya, would help build the trust needed to induce consumers to shift from using cash.
Data Governance
The rise of digital technologies in the social and economic realms entails accumulation of massive amounts of information and data, which poses challenges and risks stemming from how data are accessed, safeguarded, processed, and deployed. Data generated from digital platforms and services have become a core asset fueling creation of additional economic value and potentially spurring social interactions and activism. Data governance frameworks and market regulations can help instill trust in digital information flows and mitigate risks posed by digital technologies such as anticompetitive practices of dominant firms, protection of individual privacy, and spread of disinformation through social media. Concerns regarding competition extend to the ICT infrastructure markets in addition to the digital services subsector.
An example is the use of big data in strategies for surveillance and prevention of COVID-19 infections, which requires voluntary adoption of technology (software or applications) by the population and an enabling digital infrastructure that can support the increase in bandwidth requirements as well as real-time information sharing between digital content providers and public authorities. Likewise, it requires trust from the public that the authorities will respect privacy laws and not abuse them now or in the future. It also requires transparent leadership to allow for responsible use of data and foster evidence-based assessments and policy making. Although there are tremendous opportunities in the Middle East and North Africa to bolster use of big data as a way to cope with the pandemic, Arezki et al. (2020) note that the lack of transparency on data governance may severely affect successful and sustainable realization of these approaches.
Establishing effective regulatory and data governance frameworks for the digital economy will be critical for managing the challenges associated with availability of, and access to, massive amounts of digital data. These frameworks will help foster data privacy, reduce antitrust market behaviors, and instill trust in digital information flows. The World Bank (2021) provides an extensive discussion of these issues.
A common view is that users generally own their personal data and give up this information in exchange for accessing a product or service from a digital provider, but data are also the result of a joint production effort between users and digital service providers and cannot be treated as personal property, because the information does not truly belong to any of those creating it but instead to the group generating it. An alternative to “data ownership” or “data management” therefore, is “data stewardship.” In this light, the digital provider (whether a public or a private entity) takes on the role of steward of the user’s data, entrusted with stewardship obligations regarding how the data are collected, processed, used, shared, stored, secured, and disposed of.
216 CHAPTER 11: DIGITAL TECHNOLOGY ADOPTION IN THE MIDDLE EAST AND NORTH AFRICA: TRUST AND THE DIGITAL PARADO x MIDDLE EAST AND NORTH AFRICA REGION | ECONOMIC UPDATE OCTOBER 2022
Data stewardship requires trust between users and providers and thereby strengthens nonprice competition for data privacy as firms face increasing pressure to offer data protection or transparency measures. Stewardship status delineates rights enshrined in privacy, consumer protection, bank secrecy, and data security laws. Data stewardship principles must be spelled out in specific privacy regulations, which are typically based on transparency, accountability, interoperability, and ability of the consumer to see the data collected about them, dispute their accuracy, and control how the information is used or shared. Table 2 depicts data stewardship as one dimension of a data governance framework conceptualized as a two-by-two matrix, with data categorized as private or public and, on the second dimension, as being “traditional” or “new.” Examples of data types are indicated in each of the four cells of the matrix.
Table 2. Data stewardship in data governance framework
Types of data
Data stewardship
Public Private
Traditional Census, household surveys, national accounts, enterprise surveys
New E-government digital platforms, digital identification, face recognition from public cameras, public procurement data, voter data, criminal records
Any survey conducted by private entities, including public opinion surveys deployed by private entities (e.g., Gallup)
Just-in-time data from private digital platforms, social media behavior, purchasing history, pricing algorithms, machine learning data sets
This framework is appealing because it allows regulation of digital platforms to highlight trade-offs in choices concerning data governance approaches, trade-offs in allocation of the gains from data sharing, and concerns over privacy and cybersecurity. Digital platforms create value, but they also aggregate a large amount of personal information, which raises privacy concerns. For example, when a private entity produces data—traditional or new—the public may have an interest in regulating its use, such as when there are concerns about privacy; however, there is a governance trade-off between allowing data sharing across private entities (which can bring about economic gains) and negative spillovers beyond privacy concerns, such as cybersecurity risks or disinformation. For this reason, an emerging legal literature argues that data regulations can borrow concepts from environmental protection regulations and laws (Ben-Shahar 2019). The concept of “data pollution” refers to negative externalities produced by excessive data sharing or lack of information privacy that consumers often experience with digital products. The large-scale aggregation of personal data could be both a threat to individuals’ integrity and a public good such as national security.
In the public sector, civil registration and digital identification are two of the most important enablers of digital services, but they should be governed with relevant data protection laws and regulations to ensure that only a minimum amount of data is shared. The laws governing digital identification should give people the ability to select the data they want to disclose, with simple means to correct inaccurate data and to know what data are being held about them and who has access to the information. The World Bank Identity for Development Initiative identifies several challenges that can affect development of digital identification systems, including risk of exclusion, security violations, vendor or technology lockin, weak civil registration systems, limited connectivity infrastructure, low literacy, low trust in government capacity and regulatory services, and insufficient national cybersecurity capacity (World Bank 2019c).
Efforts are under way in several countries to establish or update data governance frameworks. The Arab Republic of Egypt, for example, passed a law to adopt new data protection legislation to attract offshore data center businesses.
Source: Cusolito et al. 2022.
217CHAPTER 11: DIGITAL TECHNOLOGY ADOPTION IN THE MIDDLE EAST AND NORTH AFRICA: TRUST AND THE DIGITAL PARADO x A NEW STATE OF MIND: GREATER TRANSPARENCY AND ACCOUNTABILITY IN THE MIDDLE EAST AND NORTH AFRICA PART II: THE LEARNING STATE
Bahrain, Jordan, Lebanon, Morocco, Oman, Qatar, and Tunisia enacted or updated their data protection laws in 2018. Other countries in the region (e.g., Saudi Arabia and United Arab Emirates) have considered a more prudent approach characterized by sector-specific data protection directives. Implementation of such legal and regulatory frameworks remains a work in progress, and efforts to finalize and adopt those frameworks must continue in view of remaining regulatory gaps (Daza Jaller and Molinuevo 2020).
Data governance frameworks should avoid inward-facing approaches by accounting for the cross-border nature of digital technologies and digital data flows. Some positive foundational initiatives exist for a regional digital technology framework, such as the Arab Digital Economy Strategy, which is designed to establish common principles and alignment on legislative and technological infrastructure across the Arab League. Countries in the Middle East and North Africa could build on these initiatives and draw inspiration from already developed data governance paradigms (see Box 1 on paradigms in China, European Union, the United States, and Singapore), with suitable adaptation for the regional context.
Box 1. Four main data governance paradigms
Cybersecurity, artificial intelligence, and data are key components of all digital development projects. Fundamentally, legal frameworks are needed to protect privacy and allow for redress of harm. In the highly diverse global landscape of data governance, several paradigms of personal data governance are discernable (with some common elements), but no convergence to a global standard is expected in the foreseeable future. Four broad paradigms have emerged in different country contexts.
The European paradigm views data use as a liability and thus emphasizes protection of personal privacy rights. The European Union’s General Data Protection Regulation (GDPR), effective since May 2018, shifts the burden for maintaining the privacy and security of personal data to digital service providers by charging costs and imposing penalties if data collectors or processors allow data to be misused, lost, or stolen. The GDPR also limits the amount of personal data that businesses can collect, requiring that the information be “limited to what is necessary in relation to the purposes for which they are processed” (principle of data minimization). This model gives regulators unprecedented ability to penalize data abuses and authority over data collectors and processors.
The U.S. paradigm emphasizes data as an asset and is a more market-oriented approach that specifies limited rules for collection and selling of digital data outside the health and banking spheres. Businesses are permitted to own the data they have invested in collecting, whether by observing Internet browsing patterns or through a credit bureau. This offers data collectors an asset with economic value, although this asset cannot be valued on firms’ balance sheets. The U.S. focus on market behavior to determine data collection and use has fostered the growth of giant tech firms such as Google and Facebook but has also been criticized for its lack of regulation and shortsighted approach to competition and individual rights.
In China, the state has ultimate authority over data that users produce. Through strict control of companies operating in China (e.g. every entity doing business in China is required to host its data locally) and closed-circuit data sharing of camera footage, identity checks, WiFi connections, as well as health, banking, and legal records, China’s government has artificial intelligence systems that can recognize anyone in the country in real time and can link that identification to other data about them. Data flows freely to and within government departments and is designed to further the government’s social, political, and economic objectives.
continued on next page 218 CHAPTER 11: DIGITAL TECHNOLOGY ADOPTION IN THE MIDDLE EAST AND NORTH AFRICA: TRUST AND THE DIGITAL PARADO x MIDDLE EAST AND NORTH AFRICA REGION | ECONOMIC UPDATE OCTOBER 2022
Singapore’s paradigm revolves around the expectation of accountability of entities that manage personal data (data controllers) to all stakeholders (customers, regulators, suppliers, business partners). The regulatory framework extends beyond compliance obligations to attempt to instill a permanent sense of urgency in organizations that use personal data. This is accomplished through requirements outlined in a series of frameworks and guidelines emphasizing data security, risk-based data management, trusted data sharing, transparent and human-centric artificial intelligence decisions, and proactive response in case of data breaches. Data collaborations among private and public entities holding big data are also fostered within sandbox environments in which data sets are anonymized and then pooled to be analyzed to gain novel insights that can be beneficial for public policy or commercial interests. Once the analysis is complete, the pooled data set is destroyed. Companies assessed as being good data stewards (through in-depth external audit procedures, which include on-site visits and interviews with employees) are awarded the Data Protection Trustmark seal.
5. Policy priorities
In view of the scale effects of ICTs, combined with their general-purpose applicability, a bold policy approach is desirable to rapidly increase Internet access, reliability, and affordability to allow for widespread diffusion and use of digital payment systems. The Middle East and North Africa region could prioritize expansion of digital payments in addition to universal access to broadband. To reap the most rapid economic gains from digitalization, priority in access to digital broadband should be given to underserved populations. Although this chapter does not examine the costs of bringing digital infrastructure services to underserved populations within countries, existing evidence from high-income economies such as Australia and the United States indicates that reaching rural consumers can be more costly than reaching urban dwellers.
The analyses in this chapter suggest that improved governance in areas pertinent to digital technology adoption is important and should feature prominently among policy priorities for expanding the digital economy. In this regard, two priority reform areas are identified for increasing adoption of digital technologies to expand use of digital payments and hence expand the digital economy.
The first priority reform area is to build trust in government institutions and the financial system. Trust in use of digital payments appears to be a crucial factor. Further empirical analysis is needed to better understand the role of trust in the digital economy, yet it is valid to posit that insufficient trust underlies the persisting ubiquitous use of cash in the Middle East and North Africa. Even for online purchases, most people select “cash on delivery” as their payment option.
Trust could be increased by reforming e-commerce regulations, strengthening consumer protections in e-commerce transactions, and strengthening data governance and protect data privacy. Enabling people to become more familiar with using digital payments can also increase trust. Trust could be enhanced through use of government-to-person and other e-government mechanisms. Actions can be taken to widen use of digital payments by modernizing government programs, such as digitalizing payments of cash transfer programs and creating other e-government opportunities to use digital payments for public services. Evidence suggests that e-government options—such as digital transfer of social
Source: Cusolito et al. 2022, Box 7.1. Box 1 continued 219CHAPTER 11: DIGITAL TECHNOLOGY ADOPTION IN THE MIDDLE EAST AND NORTH AFRICA: TRUST AND THE DIGITAL PARADO x A NEW STATE OF MIND: GREATER TRANSPARENCY AND ACCOUNTABILITY IN THE MIDDLE EAST AND NORTH AFRICA PART II: THE LEARNING STATE
protection payments, digitized payment mechanisms for public services, and a shift to e-procurement—offer great promise for facilitating rapid expansion of digital money in a way that quickly builds trust and comfort in use of digital payments for commercial purposes. These could be through e-wallets and other mobile money options that do not require creation of a traditional bank account.
The chapter discussed the implications of the emergence of massive amounts of social and economic digital data and examined the challenges and risks stemming from how data are accessed, safeguarded, processed, and deployed. This is a third channel to increase trust among users. An effective data governance framework that instills trust in digital information flows and helps mitigate risks posed by digital technologies (such as anti-competition practices by dominant firms, breaching of individual privacy protection, and spread of disinformation through social media) must guide use of digital data.
The second priority reform area is to foster competition in telecom markets and establish independent regulatory authorities for the telecom sector. Countries that already have a telecom regulatory authority should ensure that it is authorized and allowed to operate independently. Telecom sector policies should also allow for entry of new firms.
Enhanced openness and contestability of the telecom and banking sectors and updated sector regulations implemented independent of political influence are needed to achieve rapid expansion of digital payments cost-effectively. Furthermore, a more dynamic telecom sector could spur innovations in development and use of mobile broadband services and mobile money accounts. Ensuring greater competition in telecom markets is important for achieving equitable access, quality, and affordability of broadband services.
References
Alhakimi, W., and Esmail, J. (2020). “The Factors Influencing the Adoption of Internet Banking in Yemen.” International Journal of Electronic Banking, 2(2), pp. 97–117.
Alkhowaiter, W. A. (2020). “Digital Payment and Banking Adoption Research in Gulf Countries: A Systematic Literature Review.” International Journal of Information Management, 53(August): 102102.
Arezki, R., Dama, A. A., Djankov, S., and Nguyen, H. (2020). “Contagious Protests.” Policy Research Working Paper No. 9321. World Bank, Washington, DC. https://openknowledge.worldbank.org/handle/10986/34130. Arezki, R., and Senbet, L.W. (2020). “Transforming Finance in the Middle East and North Africa.” Policy Research Working Paper Series No. 9301. World Bank, Washington, DC.
Arezki, R., Dequiedt, V., Fan, R.A., and Rossotto, C. M. (2021). “Liberalization, Technology Adoption, and Stock Returns: Evidence from Telecom.” Policy Research Working Paper Series No. 9561. World Bank, Washington, DC.
Balakrishnan, V., and Shuib, N. L. M. (2021). “Drivers and Inhibitors for Digital Payment Adoption Using the Cashless Society Readiness-Adoption Model in Malaysia.” Technology in Society, 65(May):101554. https://doi. org/10.1016/j.techsoc.2021.101554.
Ben-Shahar, O. (2019). “Data Pollution.” Journal of Legal Analysis, 11, pp. 104–159. https://doi.org/10.1093/jla/laz005 Cervellati, M., Naghavi, A., and Toubal, F. (2018). “Trade Liberalization, Democratization, and Technology Adoption.” Journal of Economic Growth, 23(2), pp. 145–73.
220 CHAPTER 11: DIGITAL TECHNOLOGY ADOPTION IN THE MIDDLE EAST AND NORTH AFRICA: TRUST AND THE DIGITAL PARADO x MIDDLE EAST AND NORTH AFRICA REGION | ECONOMIC UPDATE OCTOBER 2022
Chakravorti, B., Chaturvedi, R. S., Filipovic, C., and Brewer, G. (2020). “Digital in the Time of COVID: Trust in the Digital Economy and Its Evolution Across 90 Economies as the Planet Paused for a Pandemic.” Fletcher School, Tufts University, Medford, MA.
Chen, S., Doerr, S., Frost, J., Gambacorta, L., and Shin, H. S. (2021). “The Fintech Gender Gap.” BIS Working Papers No. 931. Bank for International Settlements, Basel, Switzerland. Comin, D., and Hobijn, B. (2009). “Lobbies and Technology Diffusion.” Review of Economics and Statistics, 91(2), pp. 229–44.
Cramton, P., Kwerel, E., Rosston, G., and Skrzypacz, A. (2011). “Using Spectrum Auctions to Enhance Competition in Wireless Services.” Journal of Law and Economics, 54(54), pp. S167–S188.
Cusolito, A. P., Gévaudan, G., Lederman, D., and Wood, C. A. (2022). The Upside of Digital for the Middle East and North Africa: How Digital Technology Adoption Can Accelerate Growth and Create Jobs. World Bank, Washington, DC. Daza Jaller, L. S., and Molinuevo, M. (2020). “Digital Trade in MENA: Regulatory Readiness Assessment.” Policy Research Working Paper No. 9199. World Bank, Washington, DC. https://openknowledge.worldbank.org/ handle/10986/33521
Demirgüç-Kunt, A., Klapper, L., Singer, D., Ansar, S., and Hess, J. (2018). “The Global Findex Database 2017: Measuring Financial Inclusion and the Fintech Revolution.” World Bank, Washington, DC. https://www.worldbank.org/en/ publication/gfdr/data/global-financial-development-database. di Patti, E. B., and Hardy, D. C. (2005). “Financial Sector Liberalization, Bank Privatization, and Efficiency: Evidence from Pakistan.” Journal of Banking and Finance, 29(8), pp. 2381-2406. Dutz, M. A., Almeida, R. K., and Packard, T. G. (2018). The Jobs of Tomorrow: Technology, Productivity, and Prosperity in Latin America and the Caribbean. Directions in Development. World Bank, Washington, DC. Ezzat, R. A., and Aboushady, N. (2018). “Do Restrictive Regulatory Policies Matter for Telecom Performance? Evidence from MENA Countries.” Utilities Policy, 53(August), pp. 60–72. https://doi.org/10.1016/j.jup.2018.05.003. Evans, D. S., and Schmalensee, R. (2016). Matchmakers: The New Economics of Multisided Platforms. Harvard Business Review Press, Boston, MA. Faccio, M., and Zingales, L. (2017). “Political Determinants of Competition in the Mobile Telecommunication Industry.” NBER Working Paper No. 23041. National Bureau of Economic Research, Cambridge, MA.
Farazi, S., Feyen, E., and Rocha, R. (2013). “Bank Ownership and Performance in the Middle East and North Africa Region.” Review of Middle East Economics and Finance, 9(2), pp. 159–196. https://doi.org/10.1515/rmeef-2012-0025.
Fergusson, L., and Molina, C. (2019). “Facebook Causes Protests.” Working Paper CEDE 018002. Centro de Estudios sobre Desarrollo Económico, Universidad de los Andes, Bogotá, Colombia. https://repositorio.uniandes.edu.co/ handle/1992/41105.
Gévaudan, C., and Lederman, D. (2020). “Stages of Development of Payment Systems: Leapfrogging Across Countries and MENA’s Place in the World.” Policy Research Working Paper No. 9104. World Bank, Washington, DC. https:// openknowledge.worldbank.org/handle/10986/33153.
Hjort, J., and Poulsen, J. (2019). “The Arrival of Fast Internet and Employment in Africa.” American Economic Review, 109(3), pp. 1032–1079.
Huang, Y. C., Lu, Y., Kao, L., Choy, C. H. Y., and Chang, Y. (2020). “Mainframes and Mandarins: The Impact of Internet Use on Institutional Trust in East Asia.” Telecommunications Policy, 44(2): 101912. https://doi.org/10.1016/j. telpol.2020.101912
Jovanovic, B., and Rousseau, P.L. (2005). “General Purpose Technologies.” NBER Working Paper w11093. National Bureau of Economic Research, Cambridge, MA. https://ssrn.com/abstract=657607.
221CHAPTER 11: DIGITAL TECHNOLOGY ADOPTION IN THE MIDDLE EAST AND NORTH AFRICA: TRUST AND THE DIGITAL PARADO x A NEW STATE OF MIND: GREATER TRANSPARENCY AND ACCOUNTABILITY IN THE MIDDLE EAST AND NORTH AFRICA PART II: THE LEARNING STATE
Klapper, L., and Goodwin-Groen, R. (2015, November 24). “How Digital Financial Services Boost Women’s Economic Opportunities,” Let’s Talk Development Blog. https://blogs.worldbank.org/developmenttalk/how-digitalfinancial-services-boost-women-s-economic-opportunities
Laffont, J.-J., Rey, P., and Tirole, J. (1997). “Competition Between Telecommunications Operators.” European Economic Review, 41(3-5), pp. 701–711.
Ligon, E., Malick, B., Sheth, K., and Trachtman, C. (2019). “What Explains Low Adoption of Digital Payment Technologies? Evidence from Small-Scale Merchants in Jaipur, India.” PLoS ONE, 14(7). https://doi.org/10.1371/journal. pone.0219450.
Mahmood, M., Weerakkody, V., and Chen. W. (2020). “The Role of Information and Communications Technology in the Transformation of Government and Citizen Trust.” International Review of Administrative Sciences, 86(4), pp. 708–728.
Mensah, I. K., and Adams, S. (2020). “A Comparative Analysis of the Impact of Political Trust on the Adoption of E-Government Services.” International Journal of Public Administration, 43(8), pp. 682–696. doi:10.1080/019 00692.2019.1645687.
Png, I. P. L., and Tan, C. H. Y. (2020). “Privacy, Trust in Banks, and Use of Cash.” National University of Singapore. http:// dx.doi.org/10.2139/ssrn.3526531.
Porter, B. (2015, March 2). “What’s Next: Digital Payments Can Empower Women,” Beyond the Transaction Mastercard Blog. https://newsroom.mastercard.com/2015/03/02/whats-next-digital-payments-can-empower-women/.
Rey, P., and Salant, D. (2012). “Abuse of Dominance and Licensing of Intellectual Property.” International Journal of Industrial Organization, 30(6). pp. 518–527.
Song, C., and Lee, J. (2016). “Citizens’ Use of Social Media in Government, Perceived Transparency, and Trust in Government.” Public Performance and Management Review, 39(2), pp. 430–453. https://doi.org/10.1080/153 09576.2015.1108798
Szumskia, O. (2020). “Technological Trust from the Perspective of Digital Payment,” Procedia Computer Science, 176, pp. 3545-3554.
Wallsten, S. J. (2001). “An Econometric Analysis of Telecom Competition, Privatization, and Regulation in Africa and Latin America.” Journal of Industrial Economics, 49(1), pp. 1–19.
World Bank. (2019a). Bank Regulation and Supervision Survey (database). World Bank, Washington, DC. http://www. worldbank.org/en/research/brief/BRSS.
World Bank. (2019b). “Global Financial Development Database.” World Bank, Washington, DC. https://databank. worldbank.org/source/global-financial-development.
World Bank. (2019c). ID4D Practitioner’s Guide. Version 1.0. World Bank Group, Washington, DC, ID4D (Identification for Development). http://documents.worldbank.org/curated/en/248371559325561562/ID4D-Practitioner-sGuide
World Bank. (2020). Digital Government Readiness Assessment Toolkit: Guidelines for Task Teams. World Bank, Washington, DC. https://openknowledge.worldbank.org/handle/10986/33674
World Bank. (2021). World Development Report: Data for a Better World. World Bank, Washington, DC.
Yee, V., and Fassihi, F. (2021, May 2). “Clubhouse App Creates Space for Open Talk in Middle East.” New York Times. https://www.nytimes.com/2021/05/02/world/middleeast/clubhouse-iran-egypt-mideast.html.
You, Y., and Wang, Z. (2020). “The Internet, Political Trust, and Regime Types: A Cross-National and Multilevel Analysis.” Japanese Journal of Political Science, 21(2), pp. 68–89. https://doi.org/10.1017/S1468109919000203
222 CHAPTER 11: DIGITAL TECHNOLOGY ADOPTION IN THE MIDDLE EAST AND NORTH AFRICA: TRUST AND THE DIGITAL PARADO x MIDDLE EAST AND NORTH AFRICA REGION | ECONOMIC UPDATE OCTOBER 2022
Chapter 12: Government Accountability and Fiscal Cyclicality in the Middle East and North Africa by Ha Nguyen and Rana Lotfi
Aggregate demand management is an important role of fiscal policy2. An effective fiscal policy smooths aggregate consumption over the ups and downs of the business cycle. That is, fiscal expenditures would rise in recessions and fall (or at least not rise as much) during boom times. The macro literature refers to this phenomenon as countercyclical fiscal expenditures. Thus, a useful metric for determining the effectiveness of fiscal policy’s demand management role is the cyclicality of fiscal expenditures, which refers to how responsive fiscal expenditures are to the business cycle. Rising fiscal expenditures in recessions can help the population cope with falling private income and can stimulate the economy, especially since fiscal multipliers tend to be larger in bad times. In other words, a $1 of government expenditure can generate more output in bad times than it does in good times (see Corsetti et al., 2012; Riera-Crichton et al., 2015; Auerbach and Gorodnichenko, 2012). Therefore, government spending is more powerful in stimulating the economy in bad times. Conversely, fiscal expenditure should be contained in boom times so as not to overheat the economy and to accumulate savings for a “rainy day.” Empirically, fiscal countercyclicality has been found to help growth (Woo, 2009).
Countercyclical fiscal expenditure policy is not easy to implement. Several factors can prevent governments from implementing countercyclical fiscal policies. Governments tend to be overly optimistic about their growth prospects (see for example Gatti et al., 2022), often treating temporary booms as permanent shifts. Therefore, governments may enact permanent spending programs based on temporary revenue windfalls (Vegh, Lederman, and Bennet, 2017). Political pressures from interest groups may force governments to spend more in good times (see Tornell and Lane, 1999 and Lane, 2003). In corrupt democracies, voters demand more public goods in good times to reduce potential political rents for corrupt politicians, leading to procyclical fiscal policy (Alesina et al., 2008). Income inequality also plays a role. Woo (2009) find that less equal countries run more procyclical fiscal policy, because heterogenous policymakers may have stronger incentives to pursue their preferred agendas, particularly in good times when resources are available. Finally, in bad times, governments may be unable to expand spending because of lack of access to affordable finance (Gavin and Perotti, 1997). They might even have to pay higher interest rates or cannot roll over their debt (forced to pay) in bad times. Empirically, Kaminsky et al. (2004) show that fiscal policy was procyclical for many developing countries, although some have become more countercyclical in recent years (Frankel et al., 2013).
This chapter examines the cyclicality of fiscal expenditure, focusing on Middle East and North Africa countries (Part II). It then examines how accountability can play a role in the cyclicality of fiscal expenditures (Part III). An important distinction is between the cylicality of fiscal expenditures in good versus in bad times, which will be investigated in this chapter. In bad times, fiscal expansion is argued to depend more on the population’s needs and on access to finance (Riascos and Végh, 2003), whereas in good times, fiscal cyclicality probably depends more on the checks and balances that help rein in fiscal spending.
This chapter reports three findings. First, fiscal expenditures in the Middle East and North Africa remained procyclical between 2000 and 2020, although it became less so than from 1980 to 1999. The Middle East and North Africa has been more procyclical than income peers in fiscal expenditures in the last two decades. Second, accountability of the government’s executive branch matters in the cyclicality of government expenditures. The chapter considers three measures of accountability from the V-DEM Institute’s Varieties of Democracy Dataset, discussed in Luhrmann et al.
1
1. Introduction 1
The authors are grateful to Roberta Gatti, Daniel Lederman, Kevin Carey and Hoda Assem for detailed comments and feedback. 2 Another important role of fiscal expenditures is their structural role. With investment in health, education and infrastructure, fiscal expenditures can enhance long-term productivity of the economy. 224 C HAPTER 12: G OVERNMENT A CCOUNTABILITY AND F ISCAL C YCLICALITY IN THE M IDDLE E AST AND N ORTH A FRICA MIDDLE EAST AND NORTH AFRICA REGION | ECONOMIC UPDATE OCTOBER 2022
(2020). They are vertical accountability, which refers to the ability of citizens to hold their government accountable through elections; horizontal accountability, which refers to checks and balances between state institutions; and diagonal accountability, which refers to oversight by civil society organizations and the media.3 This chapter finds that, in good times, greater vertical accountability is associated with more procyclical expenditure whereas in bad times, diagonal accountability can help reduce procyclicality. Third, there is a stronger role of accountability, especially horizontal accountability, in the cyclicality of government expenditure in the Middle East and North Africa than in the rest of the world.
The chapter contributes to the literature on two dimensions. First, it shows that not all types of institutions are alike. The literature treats the role of institutions or governance in fiscal cyclicality quite uniformly: associating better institutions with more countercyclical government expenditure (see Frankel et al., 2013; Céspedes and Velasco, 2014). This chapter unpacks the concept of institutions, and in particular, accountability, to show that vertical accountability, which refers to the ability of citizens to hold their government accountable through elections, can worsen the procyclicality of government expenditure. This finding is consistent with the notion of the political business cycle: under the pressure of elections, politicians can try to increase spending to win votes (see Nordhaus, 1975; Drazen, 2000). On the contrary, diagonal accountability can reduce the procyclicality of government expenditures. Second, the role of accountability matters differently to fiscal cyclicality in good versus in bad times.
While the global literature on fiscal cyclicality is rich, the literature on fiscal cyclicality in the Middle East and North Africa is scant. Abdih et al. (2010) examine cyclical properties of fiscal policy in the Middle East and North Africa, and the Caucasus and Central Asia. They find that in a sample of 28 countries in the two regions, fiscal policy was typically procyclical and was more procyclical in good than in bad times.
2. Cyclicality of fiscal expenditures in the Middle East and North Africa
This section assesses the cyclicality of fiscal expenditures in recent years. It examines fiscal expenditure cyclicality for countries with available data and focuses on the Middle East and North Africa region. The overall finding is that the Middle East and North Africa’s fiscal expenditures have been more procyclical than those of income peers in the last two decades. Fiscal expenditures have become less procyclical over time for the Middle East and North Africa and the rest of the world, a finding consistent with Frankel et al. (2013).
Following Frankel et al. (2013), the cyclicality of government expenditures is estimated as follows:
fiscal cylicality = corr[(g it − g it),(y it − y it)]
where: (git git) is the Hodrick-Prescott (HP)-filtered4 cyclical component of the log of real general government expenditures and (yit yit) is the HP-filtered cyclical component of the log of real gross domestic product (GDP).5 The idea is to see how the cyclical component of real general government expenditures (after removing the trend component)
3 See also Chapter 2 in this volume.
4 HP-filter separates short-term fluctuations from long-term trends (Hodrick
5 We take the log of real GDP
Prescott,
and
1997).
and real government expenditures and apply a HP filter to estimate the cyclical component (with the smoothing parameter λ=6.25) 225C HAPTER 12: G OVERNMENT A CCOUNTABILITY AND F ISCAL C YCLICALITY IN THE M IDDLE E AST AND N ORTH A FRICA A NEW STATE OF MIND: GREATER TRANSPARENCY AND ACCOUNTABILITY IN THE MIDDLE EAST AND NORTH AFRICA PART II: THE LEARNING STATE
correlated with the cyclical component of real output (after removing the trend component). A negative correlation between the two cyclical components would suggest that government expenditure is countercyclical (and vice-versa).
Annual data for real GDP are from the World Bank World Development Indicators. Annual data for real general government expenditures are derived from multiplying general government expenditure as a share of GDP (from the International Monetary Fund World Economic Outlook) by real GDP.
Figure 1. The cyclicality of fiscal expenditures, 2000–2020
In the last two decades, most world economies had procyclical fiscal expenditures. Figure 1 shows that most countries are indeed above the zero-horizontal line. The Figure also shows that, on average, poorer countries had more procyclical fiscal expenditures than rich countries did.
Middle East and North Africa countries, on average, have had more procyclical fiscal expenditure than income peers in the last two decades (see Figure 2). This was particularly the case of Iran, Lebanon, Libya, Qatar, and Yemen. Algeria, Bahrain, Egypt, Jordan, Kuwait, Saudi Arabia, Tunisia, and the United Arab Emirates have moderately more countercyclical fiscal expenditures than income peers. Only Morocco seems to have much more countercyclical fiscal expenditure than its income peers (Figure 2).
Figure 2. Fiscal cyclicality in the Middle East and North Africa compared to income peers (2000–2020)
Figure 3. Change in fiscal cyclicality over time for Middle East and North Africa
Yemen,Rep.
is
Fiscal cyclicality 2.0 2.5 3.0 3.5 4.0 4.5 5.0 5.5 1.0 0.5 0 -0.5 -1.0 ARE QAT KWT BHR OMN SAU LBN LBY IRQ IRN JORDZA TUN EGY PSE YEM MAR SYR Log of real GDP per capita (constant 2015 US$) in 2000 Source: General government expenditures, International Monetary Fund October 2021 World Economic Outlook, log of 2000 real per capita gross domestic product (GDP) (constant 2015 US$) from World Bank World Development Indicators. Note: Fiscal cyclicality is calculated as the correlation coefficient between the cyclical component of real per capita GDP (constant local currency unit (LCU) from World Development Indicators) and the cyclical component of real expenditures (constant LCU, using expenditures as share of GDP from International Monetary Fund World Economic Outlook multiplied by real per capita GDP from World Development Indicators). 2000–2020 sample covers 187 countries, of which 18 are in the Middle East and North Africa. Djibouti is excluded because of lack of 2000 real per capita GDP data.
Residuals: fiscal cyclicality regressed on log of 2000 real GDP per capita Fiscal cyclicality (2000–2020) minus fiscal cyclicality (1980–1999) SyrianArabRepublicMoroccoYemen,Rep. WestBankandGazaEgypt,ArabRep.TunisiaAlgeriaJordanIran,IslamicRep.IraqLibyaLebanonSaudiArabiaOmanBahrainKuwaitQatar UnitedArab Emirates 1.0 0.5 0 -0.5 -1.0 SyrianArabRepublic 1.5 1.0 0.5 0 -0.5 -1.0 -1.5 Morocco
TunisiaAlgeriaJordanIran,IslamicRep.LebanonSaudiArabiaOmanBahrainKuwait UnitedArab EmiratesMENARestoftheWorld -0.05-0.15 J MENA residuals MENA average Source: General government expenditures, International Monetary Fund October 2021 World Economic Outlook, Log of 2000 Real per capita gross domestic product (GDP) (constant 2015 US$) from World Bank World Development Indicators. Note: Residuals on y-axis are obtained by regressing fiscal cyclicality on log of 2000 real per Capita GDP (constant 2015 US$). 2000–2020 sample covers 187 countries, of which 18 are Middle East and North Africa countries. Djibouti is excluded because of lack of 2000 real per capita GDP data. Countries are ordered in ascending order of 2000 real per capita GDP. Source: General government expenditures, International Monetary Fund’s October 2021 World Economic Outlook, Log of 2000 Real per capita gross domestic product (GDP) (constant 2015 US$) from World Bank’s World Development Indicators. Note: Difference in cyclicality is defined as change in correlation of fiscal cyclicality from 1980–99 to 2000–20. A common sample of 149 countries—of which 13 are in the Middle East and North Africa—is selected to compare the periods. Djibouti, Egypt, Iraq, Libya, Qatar, and West Bank and Gaza are excluded because of lack of data during 1980 to 1999 to perform the correlation. Countries are ordered in ascending order of real per capita GDP in 2000. 226 C HAPTER 12: G OVERNMENT A CCOUNTABILITY AND F ISCAL C YCLICALITY IN THE M IDDLE E AST AND N ORTH A FRICA MIDDLE EAST AND NORTH AFRICA REGION | ECONOMIC UPDATE OCTOBER 2022
On average, fiscal expenditures for Middle East and North Africa countries became slightly more countercyclical from 1980–1999 to 2000–2020, as did the rest of the world (Figure 3). This is consistent with the finding reported in Frankel et al. (2013). The changes are clear and consistent for the Gulf Cooperation Council, suggesting the GCC countries have been more able to save in good times and spend in bad times. On the other hand, fiscal expenditure for Lebanon, Iran, and Yemen became more procyclical.
As discussed in the introduction, an important distinction is cyclicality of fiscal expenditures in good versus in bad times. In bad times, fiscal expansion probably depends more on the population’s need and access to finance (Riascos and Végh, 2003) whereas in good times, countercyclical fiscal expenditures indicate a voluntary restraint of government expenditure. This restraint requires fiscal discipline and hence probably depends more on the checks and balances that help rein in fiscal spending.
This chapter measures cyclicality in good times and bad times by calculating two correlations corr[(git git),(yit yit)] for each country between 1980 and 2000. The first correlation is when (yit yit) > 0, signaling good times. The second correlation is when (yit yit) < 0, signaling bad times.
The Middle East and North Africa, on average, is more procyclical in good than in bad times and so is the rest of the world. Figure 4 shows fiscal expenditure cyclicality in good times minus cyclicality in bad times. The two bars on the right side show the average differences for the Middle East and North Africa and the rest of the world. Both bars are above zero. This finding suggests that it is harder to reduce spending in good times than to increase spending in bad times. In the Middle East and North Africa, there is no clear association of income nor oil-exporting status with the difference in fiscal cyclicality between good and bad times (Figure 4).
Figure 4. Fiscal cyclicality (good times) minus fiscal cyclicality (bad times)
SyrianArabRepublicMorocco
Djibouti
Yemen,Rep. WestBankandGazaEgypt,ArabRep.TunisiaAlgeriaJordanIran,IslamicRep.IraqLibyaLebanonSaudiArabiaOmanBahrainKuwaitQatar
UnitedArab EmiratesMENA RestoftheWorld
3. Association between accountability and fiscal cyclicality
This section examines whether accountability of the executive branch correlates with fiscal cyclicality. The literature has established an association between institutions and fiscal cyclicality (Frankel et al., 2013; Céspedes and Velasco, 2014; Calderon and Nguyen, 2016). Frankel et al. (2013) show that property rights, the control of corruption, higher bureaucratic quality, and a strong rule of law allowed many developing countries to “graduate” from fiscal procyclicality. Céspedes and Velasco (2014) find similar evidence in a sample of 60 resource-rich countries. Calderon and Nguyen (2016) show that a better international country risk guide index6 is associated with more countercyclical fiscal expenditures.
6 The index comprises several aspects of economic institutions, including government stability, socioeconomic conditions and democratic accountability.
0.8 0.6 0.4 0.2 0 -0.2 -0.4 -0.6 -0.8
0.070.10 Source: General government expenditures, International Monetary Fund October 2021 World Economic Outlook, log of real per capita gross domestic product (GDP) (constant local currency unit) from World Bank World Development Indicators. Data period is from 2000 to 2020. Note: A common sample composed of 194 countries—of which 19 are in the Middle East and North Africa is selected to compare the periods. Countries are in ascending order of real per capita GDP in 2000. 227C HAPTER 12: G OVERNMENT A CCOUNTABILITY AND F ISCAL C YCLICALITY IN THE M IDDLE E AST AND N ORTH A FRICA A NEW STATE OF MIND: GREATER TRANSPARENCY AND ACCOUNTABILITY IN THE MIDDLE EAST AND NORTH AFRICA PART II: THE LEARNING STATE
Table 1. Summary statistics: Fiscal cyclicality, business cycles and accountability
Global Sample
HP-filtered cyclical component of log of real expenditures
Number of Observations
Mean Standard deviation
Median Minimum Maximum
3933 -0.000001 0.071 -0.002 -0.930 0.510
HP-filtered cyclical component of log real GDP 3933 -0.0002 0.030 -0.0004 -0.624 0.275
V-DEM accountability index normalized 0 to 1 3508 0.712 0.248 0.800 0.029 0.980
V-DEM vertical accountability index normalized 0 to 1 3508 0.725 0.217 0.785 0.055 0.964
V-DEM diagonal accountability index normalized 0 to 1 3508 0.725 0.248 0.819 0.034 0.982
V-DEM horizontal accountability index normalized 0 to 1 3508 0.641 0.282 0.732 0.028 0.991
Middle East and North Africa
HP-filtered cyclical component of log of real expenditures 361 -0.0003 0.097 -0.001 -0.715 0.436
HP-filtered cyclical component of log real GDP 361 -0.0004 0.050 -0.0001 -0.624 0.241
V-DEM accountability index normalized 0 to 1 361 0.442 0.226 0.444 0.093 0.927
V-DEM vertical accountability index normalized 0 to 1 361 0.491 0.243 0.571 0.055 0.895
V-DEM diagonal accountability index normalized 0 to 1 361 0.440 0.230 0.485 0.068 0.915
V-DEM horizontal accountability index normalized 0 to 1 361 0.452 0.251 0.401 0.097 0.976
Source: World Development Indicators from the World Bank and the Varieties of Democracy Dataset from the V-DEM Institute.
Note: The global sample also includes Middle East and North Africa countries. The sample covers 2000 to 2020 observations only. The global sample contains 194 countries, whereas the Middle East and North Africa sample contains 19.
This chapter focuses on the accountability of the executive branch. It uses an accountability measure from the V-DEM Institute’s Varieties of Democracy Dataset, which captures constraints on a government’s executive branch. It has three sub-components of accountability: vertical accountability, diagonal accountability, and horizontal accountability. They reflect the extent to which governments are accountable to citizens (vertical accountability), to other state institutions (horizontal accountability), and to the media and civil society (diagonal accountability).
When comparing the Middle East and North Africa region with the global average, the region is behind in terms of accountability (see Table 1). Economic business cycles are also more volatile in the region than in the rest of the world, as illustrated by higher standard deviations in the cyclical components of the log of per capita GDP.
Following Calderon and Nguyen (2016), the empirical framework is as follows:
where c is for country, t is for year,
is the (HP-filtered) cyclical component of log of real government expenditures, ẏc,t is the (HP-filtered) cyclical component of log of real GDP, LogAccc,t-1 is log of accountability of country c at year t-1, Logypcc,t-1 is log of per capita income of country c at year t-1. 7 Year fixed effects are included to control for common responses to global shocks. Country fixed effects are not included because this chapter aims to exploit the variation of
7 Other control variables were considered, such as being resource
The results remain robust.
ġ c,t = β 0 + β 1ẏ c,t + β 2ẏ c,t * LogAcc c,t-1 + β 3ẏ c,t * Logypc c,t-1 + yearFE + ϵ c,t (1)
ġc,t
rich.
228 C HAPTER 12: G OVERNMENT A CCOUNTABILITY AND F ISCAL C YCLICALITY IN THE M IDDLE E AST AND N ORTH A FRICA MIDDLE EAST AND NORTH AFRICA REGION | ECONOMIC UPDATE OCTOBER 2022
accountability across countries. The coefficient of interest is β2. It captures how procyclical fiscal expenditures are in response to accountability. The level of accountability determines the cyclicality of fiscal expenditures as follows, and note that a positive β implies more procyclicality.
Table 2 shows the association between accountability and the cyclicality of fiscal expenditures in all years, in good (i.e., HP-filtered GDP>=0) and bad (i.e., HP-filtered GDP<0) times for all countries. Table 3 shows the association for Middle East and North Africa countries only.
Table 2. Governance and fiscal cyclicality - all countries 2000–2020
All Years
Y = Cyclical Fiscal Expenditure
Good Times
Bad Times
Vertical Diagonal Horizontal Vertical Diagonal Horizontal Vertical Diagonal Horizontal (1) (2) (3) (4) (5) (6) (7) (8) (9)
Cyclical GDP 1.938** 1.994** 2.014* 1.691** 1.486* 1.578 2.405** 2.512*** 2.535** (0.836) (0.765) (1.040) (0.804) (0.774) (1.002) (0.979) (0.934) (1.136)
Cyclical GDP * Log real per capita GDP (t-1) -0.145 -0.168** -0.146 -0.102 -0.108 -0.106 -0.206** -0.232** -0.195* (0.090) (0.083) (0.105) (0.089) (0.078) (0.095) (0.100) (0.100) (0.116)
Cyclical GDP * Log vertical acc (t-1) -0.026 0.209** -0.121 (0.081) (0.085) (0.116)
Cyclical GDP * Log diagonal acc (t-1) -0.171 -0.128 -0.201* (0.115) (0.155) (0.117)
Cyclical GDP * Log horizontal acc (t-1) 0.045 0.023 0.070 (0.249) (0.260) (0.222)
Constant 0.021*** 0.021*** 0.021*** 0.028*** 0.029*** 0.029*** 0.017*** 0.016*** 0.018*** (0.005) (0.005) (0.005) (0.009) (0.009) (0.009) (0.006) (0.006) (0.006)
Number of observations 3,459 3,459 3,459 1,676 1,676 1,676 1,783 1,783 1,783
Number of countries 171 171 171 171 171 171 171 171 171
Year fixed effects yes yes yes yes yes yes yes yes yes Country fixed effects no no no no no no no no no Adjusted R2 0.111 0.115 0.111 0.094 0.093 0.091 0.133 0.138 0.132
Source: Fiscal expenditure (as a percentage of gross domestic product) data are obtained from the International Monetary Fund World Economic Outlook dataset, real per capita GDP (constant 2015 US$) and real per capita GDP (constant local currency unit (LCU)) are obtained from the World Bank World Development Indicators dataset, and the accountability indices (vertical, diagonal, horizontal) are obtained from the V-DEM Varieties of Democracy dataset.
Note: For level of significance in regressions, *** 1%; ** 5%; * 10%. Cyclical fiscal expenditures are obtained by applying a Hodrick–Prescott (HP) filter to isolate the cyclical component of log of real fiscal expenditures (constant LCU). Real fiscal expenditures are obtained by multiplying share of fiscal expenditures (as a percentage of GDP) by real per capita GDP (constant LCU). Cyclical GDP is obtained by applying an HP filter to isolate the cyclical component to the log of real per capita GDP (constant LCU). All accountability measures are normalized from 0 to 1. Good times are when the cyclical GDP is positive. Bad times are when the cyclical GDP is negative.
For all countries from 2000 to 2020, after controlling for the lagged log of per capita GDP, the associations between the three measures of accountability and fiscal cyclicality β2 are not statistically significant at the 10 percent level. Moreover, as will become clearer, the association between vertical accountability and fiscal expenditures has opposite signs in good and bad times.
In good times, from 2000 to 2020, countries with better lagged vertical accountability have more procyclical fiscal expenditures (column 4 of Table 2). The coefficient of 0.209 is statistically significant at the 5 percent level. The coefficient 0.209 implies that when the vertical accountability score increases by 1 percent, the cyclicality of government
ġ c,t / ẏ c,t = β 1 + β 2LogAcc c,t-1 + β 3 Logypc c,t-1 (2)
229C HAPTER 12: G OVERNMENT A CCOUNTABILITY AND F ISCAL C YCLICALITY IN THE M IDDLE E AST AND N ORTH A FRICA A NEW STATE OF MIND: GREATER TRANSPARENCY AND ACCOUNTABILITY IN THE MIDDLE EAST AND NORTH AFRICA PART II: THE LEARNING STATE
expenditures8 increases by 0.21 percent. This is a novel finding. Vertical accountability, which refers to the ability of citizens to hold their government accountable through elections, can increase the procyclicality of government expenditure in good times. This finding is consistent with the notion of the political business cycle: with the pressure of elections, politicians can try to increase spending to win votes (see Nordhaus, 1975 and Drazen, 2000). Better vertical accountability is associated with more countercyclical expenditures in bad times (although the association is not statistically significant at 10 percent level - see column 7). Electoral pressure still works to force government expenditures to rise in bad times. Because the association between vertical accountability and fiscal expenditures is positive in good times and negative in bad times, they offset each other and yield a close-to-zero association in all years (see column 1).
Table 3. Governance and fiscal cyclicality - Middle East and North Africa countries 2000–2020
All Years
Y = Cyclical Fiscal Expenditure
Good Times
Bad Times
Vertical Diagonal Horizontal Vertical Diagonal Horizontal Vertical Diagonal Horizontal (1) (2) (3) (4) (5) (6) (7) (8) (9)
Cyclical GDP 1.499 3.258 3.042 -1.310 0.786 0.483 2.749 3.261 3.243 (5.278) (4.030) (3.145) (6.255) (5.579) (4.218) (3.517) (2.924) (2.097)
Cyclical GDP * Log real per capita GDP (t-1) -0.102 -0.369 -0.375 0.301 -0.071 -0.077 -0.292 -0.384 -0.394* (0.570) (0.431) (0.339) (0.693) (0.615) (0.470) (0.339) (0.308) (0.209)
Cyclical GDP * Log vertical acc (t-1) -0.109 0.393** -0.375 (0.164) (0.143) (0.335)
Cyclical GDP * Log diagonal acc (t-1) -0.459*** -0.489*** -0.494** (0.126) (0.147) (0.214)
Cyclical GDP * Log horizontal acc (t-1) -1.222** -1.452** -1.193** (0.448) (0.523) (0.539)
Constant 0.061*** 0.056*** 0.059*** 0.082** 0.084** 0.078** 0.044** 0.033* 0.046* (0.019) (0.019) (0.019) (0.036) (0.035) (0.035) (0.019) (0.018) (0.022)
Number of observations 357 357 357 178 178 178 179 179 179
Number of countries 19 19 19 19 19 19 19 19 19
Year fixed effects yes yes yes yes yes yes yes yes yes
Country fixed effects no no no no no no no no no Adjusted R2 0.214 0.267 0.288 0.167 0.189 0.244 0.344 0.390 0.399
Source: Fiscal expenditure (as a percentage of gross domestic product) data are obtained from the International Monetary Fund World Economic Outlook dataset, real per capita GDP (constant 2015 US$) and real per capita GDP (constant local currency unit (LCU)) are obtained from the World Bank World Development Indicators dataset, and the accountability indices (vertical, diagonal, horizontal) are obtained from the V-DEM Varieties of Democracy dataset.
Note: For level of significance in regressions, *** 1%; ** 5%; * 10%. Cyclical fiscal expenditures are obtained by applying a Hodrick–Prescott (HP) filter to isolate the cyclical component of log of real fiscal expenditures (constant LCU). Real fiscal expenditures are obtained by multiplying share of fiscal expenditures (as a percentage of GDP) by real per capita GDP (constant LCU). Cyclical GDP is obtained by applying an HP filter to isolate the cyclical component to the log of real per capita GDP (constant LCU). All accountability measures are normalized from 0 to 1. Good times are when the cyclical GDP is positive. Bad times are when the cyclical GDP is negative.
Diagonal accountability, representing oversight by civil society organizations and the media, is associated with more countercyclical fiscal expenditures in both good and bad times. The interaction between diagonal accountability and cyclical fiscal expenditures in bad times is statistically significant at the 10 percent level (column 8). Horizontal accountability, representing intra-government checks and balances, does not significantly associate with fiscal cyclicality. The interaction has a small magnitude and is not statistically significant.
To be precise, cyclical government expenditures
cyclical
8
over
output (see equation 2). 230 C HAPTER 12: G OVERNMENT A CCOUNTABILITY AND F ISCAL C YCLICALITY IN THE M IDDLE E AST AND N ORTH A FRICA MIDDLE EAST AND NORTH AFRICA REGION | ECONOMIC UPDATE OCTOBER 2022
A larger log of per capita GDP is associated with more countercyclical fiscal expenditures. This finding is consistent with Figure 1. This association is more prominent in bad times. The coefficients of the interactions are much larger and more statistically significant in bad than in good times. This result suggests that richer countries can expand government expenditures in bad times more than poorer countries can.
Table 3 has the same structure but focuses on the Middle East and North Africa countries during 2000 to 2020. Overall, the same findings apply. Middle East and North Africa countries with better vertical accountability have more procyclical fiscal expenditures in good times (column 4 of Table 3). Diagonal and horizontal accountability are associated with more countercyclical fiscal expenditures in both good and bad times.
However, the associations between accountability measures and the cyclicality of fiscal expenditures are much higher and more statistically significant in the Middle East and North Africa than in the rest of the world. The coefficients 0.393 in column 4 of Table 3 imply that when vertical accountability increases by 1 percent, the cyclicality of government expenditure is larger by another 0.4 percent (i.e., more procyclical). This magnitude is larger than the magnitude in Table 2. Horizontal accountability also plays a bigger role. The coefficient -1.452 in column 6 of Table 3 states that when horizontal accountability increases by 1 percent, the cyclicality of government expenditures is smaller by 1.5 percent in good times. Similarly, the coefficient -1.193 in column 9 of Table 3 states that when horizontal accountability increases by 1 percent, the cyclicality of government expenditures is smaller by 1.2 percent in bad times. The findings are also robust to having country fixed effects, although the coefficients for vertical accountability are less statistically significant. The finding highlights the oversized importance of intra-government checks and balances in helping Middle East and North Africa countries develop countercyclical fiscal policies.
4. Conclusion
This chapter examines the cyclicality of fiscal expenditure in the last two decades, with a focus on the Middle East and North Africa countries. It reports three findings. First, fiscal expenditures in the Middle East and North Africa remained procyclical between 2000 and 2020, although it became less than between 1980 and 1999. Fiscal expenditures of Middle East and North Africa countries have been more procyclical than those of income peers in the last two decades. Second, accountability of a government’s executive branch matters in the cyclicality of government expenditures. We consider three measures of accountability, discussed in Luhrmann et al. (2020). They are vertical accountability, which refers to the ability of citizens to hold their government accountable through elections; horizontal accountability, which refers to checks and balances between state institutions; and diagonal accountability, which refers to oversight by civil society organizations and the media. This chapter finds that in good times, better vertical accountability is associated with more procyclical expenditures, an interesting new finding. In bad times, diagonal accountability help reduce procyclicality. Third, there is a much stronger role of accountability, especially horizontal accountability, in the cyclicality of government expenditure in the Middle East and North Africa than in the rest of the world. The finding highlights the oversized importance of intra-government checks and balances in helping Middle East and North Africa countries develop countercyclical fiscal policies.
231C HAPTER 12: G OVERNMENT A CCOUNTABILITY AND F ISCAL C YCLICALITY IN THE M IDDLE E AST AND N ORTH A FRICA A NEW STATE OF MIND: GREATER TRANSPARENCY AND ACCOUNTABILITY IN THE MIDDLE EAST AND NORTH AFRICA PART II: THE LEARNING STATE
References
Abdih, Y., Lopez-Murphy, P., Roitman, A., and Sahay, R. (2010). “The Cyclicality of Fiscal Policy in the Middle East and Central Asia: Is the Current Crisis Different?” IMF Working Paper 2010/068.
Alesina, A., Tabellini, G., and Campante, F.R. (2008). “Why Is Fiscal Policy Often Procyclical?” Journal of the European Economic Association, 6(5), pp. 1006–36.
Auerbach, A. J., and Gorodnichenko, Y. (2012). “Fiscal Multipliers in Recession and Expansion.” In A. Alesina and F. Giavazzi. (Eds.), Fiscal Policy after the Financial Crisis (pp. 63-98). University of Chicago Press.
Calderón, C., and Nguyen, H. (2016). “The Cyclical Nature of Fiscal Policy in Sub-Saharan Africa,” Journal of African Economies, 25(4), pp. 548-579.
Céspedes, L. F., and Velasco, A. (2014). “Was this time different? Fiscal policy in commodity republics.” Journal of Development Economics, 106, pp. 92-106. https://doi.org/10.1016/j.jdeveco.2013.07.012.
Corsetti, G., Meier, A., and Müller, G. J. (2012). “What Determines Government Spending Multipliers?” Economic Policy, 27(72), pp. 521-565.
Drazen, A. (2000). “The political business cycle after 25 years”. NBER Macroeconomics Annual, 15, pp. 75-117.
Frankel, J. A., Vegh, C. A., and Vuletin, G. (2013). “On graduation from fiscal procyclicality.” Journal of Development Economics, 100(1), pp. 32-47.
Hodrick, R., and Prescott, E. C. (1997). “Postwar U.S. Business Cycles: An Empirical Investigation”. Journal of Money, Credit, and Banking, 29(1), pp. 1–16.
Gatti, Roberta, Daniel Lederman, Asif Mohammed Islam, Christina A. Wood, Rachel Yuting Fan, Rana Lotfi, Mennatallah Emam Mousa, and Ha Nguyen (2022). Reality Check: Forecasting Growth in the Middle East and North Africa in Times of Uncertainty. MENA Economic Update. Washington, DC: World Bank. April.
Gavin, M. and Perotti, R. (1997). “Fiscal policy in Latin America.” In B. Bernanke and J. Rotemberg (Eds.), NBER Macroeconomics Annual (pp. 11-61). MIT Press, Cambridge and London. Lane, P. (2003). “The cyclical behaviour of fiscal policy: evidence from the OECD.” Journal of Public Economics, 87(12), pp. 2661–2675.
Kaminsky, G., Reinhart, C., and Végh, C. (2004). “When It Rains, It Pours: Procyclical Capital Flows and Macroeconomic Policies.” NBER Macroeconomics Annual, 19, pp. 11-53.
Lührmann, A., Marquardt, K., and Mechkova, V. (2020). “Constraining Governments: New Indices of Vertical, Horizontal, and Diagonal Accountability.” American Political Science Review, Cambridge University Press, 114(3), pp. 811820.
Nordhaus, W. (1975). “The Political Business Cycle.” The Review of Economic Studies, 42(2), pp. 169–90.
Riascos, A., and Vegh, C. A. (2003). “Procyclical Government Spending in Developing Countries: The Role of Capital Market Imperfections.” University of California, Los Angeles and Banco de la República, Bogota, Colombia.
Riera-Crichton, D., Vegh, C. A., and Vuletin, G. (2015). “Procyclical and Counter-cyclical Fiscal Multipliers: Evidence from OECD countries.” Journal of International Money and Finance, 52, pp. 15-31. https://doi.org/10.1016/j. jimonfin.2014.11.011.
Tornell, A., and Lane, P. (1999). “The Voracity Effect.” American Economic Review, 89(1), pp. 22–46.
Vegh, C., Lederman, D., and Bennett, F. (2017). “Leaning Against the Wind: Fiscal Policy in Latin America and the Caribbean in a Historical Perspective.” LAC Semiannual Report. World Bank, Washington, DC.
Woo, J. (2009). "Why Do More Polarized Countries Run More Procyclical Fiscal Policy?" The Review of Economics and Statistics, 91(4), pp. 850-870.
232 C HAPTER 12: G OVERNMENT A CCOUNTABILITY AND F ISCAL C YCLICALITY IN THE M IDDLE E AST AND N ORTH A FRICA MIDDLE EAST AND NORTH AFRICA REGION | ECONOMIC UPDATE OCTOBER 2022
Chapter 13: From Monumental to Incremental Development: Towards Economic and Social Convergence in the Middle East and North Africa by Somik Lall
Spatial inequalities within countries in the Middle East and North Africa are greater than in comparable countries in other parts of the world. To mitigate these disparities, governments are undertaking significant capital investments in large-scale infrastructure, public service facilities, and industrial zones. Centralized systems of decision making and execution translate the idea of leaving no area behind into doing the same thing everywhere, undermining local preferences and accountability. Furthermore, political bias in spatial allocation of resources and limited capacity for design and implementation in lagging areas exacerbates spatial inequalities. For governments in the Middle East and North Africa to facilitate economic and social convergence, there is an urgent need to shift from building monuments to fixing governance and taking into account local feedback and preferences in investment planning and service delivery.
Rising spatial disparities within countries pose a major risk for economic growth and social inclusion in the Middle East and North Africa. Around the world, as countries move from low to high income, the importance of differences between regions in explaining inequality decreases, and the importance of differences between people within regions increases. Household consumption in the most prosperous areas of today’s low- and middle-income countries is more than double that of similar households in the lagging areas, compared with 50 percent in high-income countries (Grover, Lall, and Maloney 2022), but in the Middle East and North Africa—a region composed largely of middle-income countries— differences in household consumption between subnational regions contribute 63 percent more to total inequality than in comparable countries elsewhere (World Bank 2020a).
Decision makers in the region are well aware of spatial disparities and have taken steps to respond to the needs of people left behind. The development strategies and national plans of most Middle Eastern and North African countries prioritize enhancing welfare, improving the quality and efficiency of service delivery, and increasing equality. The objectives and pillars of the Vision 2030 strategies that Algeria, Egypt, Iraq, Qatar, and the United Arab Emirates released all emphasize these aspects. Recent national plans and government programs for Jordan, Morocco, Saudi Arabia, and Tunisia highlight the importance of reducing spatial imbalances in living standards. This is in line with citizen priorities; recent perception data confirm that citizens in the Middle East and North Africa believe it to be the top priority for their states to enable job creation and provide public services, with some evidence that this preference is especially pronounced in rural areas and low-income households (World Bank 2020a). Toward this end, governments have made large capital investments in transport corridors and “new cities.” Wishing to provide jobs in places with little economic activity, governments have designated new industrial zones supported by spatially targeted business incentives and subsidized land and energy.
Even so, disparities between capital cities and lagging areas continue to grow or are closing more slowly than would be expected given the volume of investment that governments have directed to those locations. Why? Although challenges vary across the region, government interventions are getting one thing wrong: they attempt to treat inequity’s spatial and physical symptoms, not its causes. Thus, to add jobs in a country’s poorer areas, policy makers try to push new production facilities into these areas, and to meet the need for decent homes and amenities, funds support mass housing projects. Neither effort has succeeded widely—because the causes of spatial exclusion are not themselves spatial and physical but are related to institutional and governance challenges.
1. Introduction 1
1 The author thanks Roberta Gatti, Ernest Sergenti, and Ha Nguyen for their helpful comments. 234 CHAPTER 13: FROM MONUMENTAL TO INCREMENTAL INSTITUTIONS FOR EFFECTIVE SPATIAL DEVELOPMENT IN THE MIDDLE EAST AND NORTH AFRI CA MIDDLE EAST AND NORTH AFRICA REGION | ECONOMIC UPDATE OCTOBER 2022
Weak governance exacerbates spatial inequalities through two distinct but related channels. First, with investment decisions being centralized in most Middle Eastern and North African countries, the idea of leaving no area behind translates to doing the same thing everywhere, without adjusting programs and designs based on local preferences or needs or making local governments accountable to their residents and seeking feedback on what works and what does not. Consider basic services, where the dominant strategy has been top-down allocation and centralized planning of public investment. To promote convergence in living standard measures, such as household consumption expenditures, many Middle Eastern and North African governments have relied on massive public employment in lieu of povertytargeted social protection.
Second, politically driven investments in capital cities have favored economic concentration in leading areas, further widening the divide between leading and lagging areas. This is especially the case in the Mashreq region, where the excessive concentration of people and economic activity in the largest city and underdevelopment of secondary cities reflect the political bias.
These policies reflect the distinctively interventionist and redistributive social contracts established in the Middle East and North Africa, which have been marked by a preference for state planning and investment over free-market outcomes; the rise of a centralized, hierarchal bureaucracy or administration; and a preference for redistribution, with the state being perceived as responsible for providing welfare and social services, including to a great extent employment (Yousef 2004). Centralized governance structures are effective in building monuments—large public investments in infrastructure, mass housing, services, and economic zones but not in adjusting designs to meet varying needs and preferences of people living in different areas or creating incentives for frontline staff to use citizen feedback to improve the quality of services. Effectively meeting citizen demands for jobs and services would require moving from the monumental to the incremental—away from top-heavy, state-centric models toward more locally grounded, people-centric approaches to investment planning, service delivery, and accountability.
The rest of this chapter is organized as follows. Section 2 presents evidence showing the high level of spatial disparities in the Middle East and North Africa. Section 3 provides an overview and specific examples of the centralized system of governance. Section 4 illustrates the implications of centralized governance for spatial disparities, while Section 5 concludes.
2. Spatial disparities in the Middle East and North Africa
This section provides evidence of the magnitude of spatial disparities within Middle Eastern and North African countries. In recent years, the World Bank has harmonized household surveys from various sources to help calculate the Sustainable Development Goal (SDG) indicators and monitor progress toward achieving goals in terms of poverty (SDG1) and inequality reduction (SDG10). The resulting Global Monitoring Database makes it possible to calculate well-being indicators from surveys conducted in 103 countries on five continents since 2000. These include 51.5 million individuals from all income groups and cover all regions of the world. Harmonized indicators include welfare aggregates used to compute poverty rates at international U.S. dollar purchasing power parity levels and spatially deflated to account for price differences between subnational regions.
235CHAPTER 13: FROM MONUMENTAL TO INCREMENTAL INSTITUTIONS FOR EFFECTIVE SPATIAL DEVELOPMENT IN THE MIDDLE EAST AND NORTH AFRI CA A NEW STATE OF MIND: GREATER TRANSPARENCY AND ACCOUNTABILITY IN THE MIDDLE EAST AND NORTH AFRICA PART II: THE LEARNING STATE
Using data from these harmonized household surveys, the evidence suggests that, despite relatively low within-country inequality in the region, it is among the most spatially unequal regions in the world. Despite most countries being middle income, spatial inequality is high and rising in Middle Eastern and North African countries, unlike in other countries, where inequality has been observed to decrease with rising income and urbanization (Figure 1).2 Disparities between subnational regions account for a larger share (63 percent, or 6 percentage points, more) of inequality in consumption in the Middle East and North Africa than in the rest of the world. Djibouti, Egypt, Iran, and Yemen have the starkest regional inequalities.3
Figure 2 shows that inequality between the richest and poorest regions, measured according to median consumption expenditures at the regional level, increased in the Middle East and North Africa between the 2000s and the 2010s, unlike in other regions.
Given high regional inequality, people may be expected to migrate across regions in pursuit of better opportunities. Migration within countries is a fundamental process of socioeconomic change, but in the Middle East and North Africa, people are not moving as much as elsewhere. Data from census and surveys show that the internal migration rate, defined as having moved from place of birth, is 14 percent on average within the Middle East and North Africa, compared with 28 percent elsewhere (World Bank 2020a). People seem to be staying in the region where
2 The analysis uses the Theil index to capture spatial inequality as the share of inequality that can be attributed to between-region disparities (Cowell 2006; Shorrocks and Wan 2005; Theil 1967; 1972). 3 Controlling for income, population, share of urban population, and share of urban population in the largest city. Figure 1. Spatial inequalities within countries: Middle East and North Africa and the rest of the world a. By GDP per capita b. By urban share of population Between-region inequality, percent Between-region inequality, percent 30 20 10 0 0 10,000 20,000 30,000 YEM’14 IRQ’06 EGY’12 IRN’14 IRQ’12TUN’10 DJI’12 TUN’05YEM’05 IRN’09 MAR’00 JOR’08 JOR’10 MAR’06 JOR’06 LBN’11 30 20 10 0 020406080 100 YEM’14 IRQ’06 EGY’12 IRN’14 TUN’1IRQ’12 0 DJI’12TUN’05YEM’05 IRN’09MAR’00 JOR’08JOR’10 MAR’06 JOR’06 LBN’11 GDP per capita (PPP US$) Urban share of the population (percent) z MENA z Rest of the world z MENA z Rest of the world Source: MNAPOV TSD/World Bank 2018. GDP per capita in purchasing power parity terms. Note: Each point corresponds to a region. Inequality between regions was calculated based on the first administrative level of a country (e.g., governorate, province). Figure 2. Inequality between richest and poorest region has increased in the Middle East and North Africa Welfare ratio (max/min) median 3 2 1 0 EAP ECA LAC MENA SAR SSA J 2000s J 2010s Source: Global Monitoring Database, Team for Statistical Development, World Bank. Note: Surveys were pooled into two periods (before and after 2010). For a list of countries and survey years, see Table 1 in Appendix 4. Inequality between subnational regions was calculated based on a country’s first administrative level (e.g., governorate, province). 236 CHAPTER 13: FROM MONUMENTAL TO INCREMENTAL INSTITUTIONS FOR EFFECTIVE SPATIAL DEVELOPMENT IN THE MIDDLE EAST AND NORTH AFRI CA MIDDLE EAST AND NORTH AFRICA REGION | ECONOMIC UPDATE OCTOBER 2022
they were born, reducing potential gains for migrants and their families. In this context, regional policies aimed at improving economic conditions in lagging areas are important.
The concentration of people and economic activity in the largest cities offers another view of spatial disparities. Urban primacy, measured as the share of the urban population residing in a country’s largest urban area, is a defining characteristic of the Middle East and North Africa’s urban systems. On average, 25 percent of the urban population is concentrated in a Middle Eastern and North African country’s largest city (Figure 3). Other regions, such as Latin America and the Caribbean and Europe and Central Asia, have lower urban primacy, and in East Asia primacy is especially low (only 8 percent). The high average urban primacy in the Middle East and North Africa is largely due to the high concentration of urban population in the largest cities in the Mashreq (39 percent) and Gulf Cooperation Council (32 percent) subregions. It is far lower in the Maghreb, with the largest cities accounting for an average of about 19 percent of the urban population. Across countries within subregions, urban primacy varies significantly. In the Gulf Cooperation Council region, the concentration of the urban population in the largest city ranges from 24 percent in Saudi Arabia to 71 percent in Kuwait, in the Maghreb region, it ranges from 9 percent (Algeria) to 26 percent (Tunisia), and in the Mashreq region it ranges from 27 percent (Syria) to Egypt (46 percent).
Figure 3. Urban primacy in various regions of
Figure 4. Differences in access to public services between the primary city and other urban areas in
Iraq,
and
The primary city in each Middle Eastern and North African country is the main area of wealth production and has the largest population. In most countries, gross domestic product concentration is higher than population concentration, because agglomeration economies tend to increase residents’ productivity. In the Mashreq region, political bias appears to drive excess primacy and underdevelopment of secondary cities. High population growth; rapid, migration-driven urbanization; focus-oriented economic systems; nondemocratic, centralized governments, and colonial history have all been identified as factors driving urban concentration (Faraji 2016). Politically centralized regimes in developing countries tend to provide better services and safety in the capital city that in the hinterland. Primary cities that are also political capitals are on average 25 percent bigger than primary cities that do not concentrate political power (Henderson 2002). In addition, the large size of cities in the Arab world can be linked to several centuries of predatory state rule and low trade openness, which also contributed to them becoming consumer cities instead of producer cities (Bosker, Buringh, and Van Zanden 2013). These political biases seem to have affected development of urban systems
the world and subregions of the Middle East and North Africa
Jordan,
Tunisia,
Morocco Capital as percentage of urban population Gap in access to public services between the primary city and other urban areas (pp) 45 40 35 30 25 20 15 10 5 0 EAPECALACMENA Regions SSA Sub-regions Mashreq GCC Maghreb 60 50 40 30 20 10 0 Jordan Iraq Tunisia Morocco J Piped water J Networked sanitation Source: Oxford Economics. Note: SSA: Sub Saharan Africa; MENA: Middle East and North Africa; LAC: Latin America and the Caribbean. Source: DHS surveys; pp: percent point.
237CHAPTER 13: FROM MONUMENTAL TO INCREMENTAL INSTITUTIONS FOR EFFECTIVE SPATIAL DEVELOPMENT IN THE MIDDLE EAST AND NORTH AFRI CA A NEW STATE OF MIND: GREATER TRANSPARENCY AND ACCOUNTABILITY IN THE MIDDLE EAST AND NORTH AFRICA PART II: THE LEARNING STATE
the Mashreq region, resulting in high urban concentration and higher spatial inequality. Spatial disparities in access to basic services supports the idea that spatially biased public policies might be leading to imbalanced systems of cities (Figure 4).
3. State-led, centralized approach to enable convergence
Middle Eastern and North African governments have identified as a priority enhancing convergence in living standards by providing jobs and public services, although excessive centralization of resources, decision making, and service delivery mechanisms characterize the policies that Middle Eastern and North African governments deploy to meet these objectives. These approaches encourage a vertically unbalanced flow of resources and decision making, combined with weak human, financial, and technical capacity to respond to citizens’ needs and deliver quality services at the local level—particularly in lagging areas.
Top-Down Allocation and Planning of Public Capital Investments
Middle Eastern and North African governments have made sizeable public capital investments in recent years as a key tool for pursuing convergence in access to basic services. There is a functional imbalance in government spending on infrastructure (especially place based) at the expense of human capital (social services) and broad-based governance reforms in Middle Eastern and North African countries (Figure 5).
Figure 5. Government expenditures of Middle Eastern and North African countries and international comparators
in
Share of expenditure (percent) 100 80 60 40 20 0 Moroccoa Egyptb Jordanc Tunisiad Austria Spain Thailand South Africa Hungary Poland J Broad-based governance and institutional reforms J Basic health, education, and related human capital improvements J Provision of basic public services J Skill development, worker training, wage subsidies J Physical infrastructure of connectivity and to support local production J Subsidies and other incentives to capital J Growth poles, industrial districts, other location subsidies J Public sector industrialization and industrial location regulations Source: Government Finance Statistics (GFS) database, International Monetary Fund; government data for Middle East and North Africa countries (as described in notes below). Note: The GFS database does not include data for Middle East and North Africa countries except for partial data for the United Arab Emirates. For Middle East and North Africa countries, report team analysis was based on national data as described in notes a–d: a. Morocco information came from the 2017 Finance Law, specifically the “General Budget” and the “Public Establishments and Enterprises” segments. b. Egypt on-budget data came from the Financial Statement 2018 -19, and the total expenses of the 48 economic authorities were retrieved from their 2016 -17 financial statements from the Ministry of Finance website. c. Jordan information came from “Capital and Current Expenses (2018),” classified by all line ministries, reported by the General Budget Department of the Ministry of Finance. d. The Tunisia analysis considers the most recent five-year plan and the Development Plan 2016–20. 238 CHAPTER 13: FROM MONUMENTAL TO INCREMENTAL INSTITUTIONS FOR EFFECTIVE SPATIAL DEVELOPMENT IN THE MIDDLE EAST AND NORTH AFRI CA MIDDLE EAST AND NORTH AFRICA REGION | ECONOMIC UPDATE OCTOBER 2022
Expenditures on institutions account for less than 1 percent of public expenditures in Morocco and only 12 percent in Tunisia, whereas comparator countries’ shares of expenditures range from 15 percent (Poland) to 52 percent (South Africa). The greatest gap with respect to people-focused expenditure allocations is in basic health and education, with Morocco allocating 3 percent and Tunisia 19 percent, whereas the lowest percentage allocation in benchmark countries is in South Africa, with 30 percent, and the highest is in Austria, with 64 percent.
In Tunisia, for example, people-based policies such as skills development, basic public services, and basic health and education account for 19 percent of public expenditure allocation, compared with 44 percent to support local production and physical infrastructure for connectivity. Sizeable public infrastructure investments have been a hallmark of several Middle Eastern and North African governments in recent years, including recent major infrastructure projects in Egypt and mega projects in Saudi Arabia. A key pillar of Saudi territorial development policy is new cities—the estimated expenditure to develop the eight cities accounted for approximately 30 percent of the government’s 2017 expenditures. These large outlays follow the establishment of predecessor new desert cities, which remain unoccupied or have attracted a fraction of the targeted population.
This focus on infrastructure is prevalent even in social services, with recent evidence showing that the education budgets of many Middle Eastern and North African countries place a heavy emphasis on capital investments (e.g., construction of new schools and rehabilitation and expansion of existing facilities, procurement of school equipment) rather than on other learning inputs. Kuwait allocates 21 percent of public spending on education to capital investment; Lebanon and Morocco, 13 percent; and Qatar, 24 percent, all much higher than the Organization for Economic Cooperation and Development (OECD) average of 7.6 percent (World Bank 2018d).
In most countries in the region, sectoral ministries within the central government make decisions regarding geographic allocation of investment expenditures, with little agency left to the local level. For example, in Egypt in 2016, local administration expenditures on the purchase of nonfinancial assets for local development activities accounted for only 3 percent of total local administration spending (Amin 2016). Likewise in Jordan, sectoral investments are generally planned at the central level, with limited attention paid to optimizing across sectors or applying a territorial planning framework (World Bank 2018a). Even in Tunisia, which has decentralized more decision-making authority to local administrations, 5-year municipal development plans include all municipal investments but account for only 10 percent of total investment in urban infrastructure. The remaining 90 percent is based on national development plans and financed and implemented directly by line ministries and state-owned service enterprises. This can lead to sectorally fragmented or uncoordinated investment planning and funding decisions, without an integrated view of regional and local development priorities.
A related challenge is that Middle Eastern and North African governments have tended to increase the number of rather than consolidate their subnational government units, hindering their ability to take on a regional development planning role. In Saudi Arabia, for example, the historic region of Hejaz is now four governates. Iraq similarly took a simple pre-independence structure and increased the number of governates. Lebanon is an extreme case, with more than 1,100 municipalities (baladiyat) and some 53 unions of municipalities, many of which have fewer than 10-member municipalities. The small size of these subnational units, their lack of local identity, and their upwardoriented accountability pose significant obstacles to them being viable socioeconomic layers and removes what would otherwise be logical counterparts for spatially targeted interventions.
239CHAPTER 13: FROM MONUMENTAL TO INCREMENTAL INSTITUTIONS FOR EFFECTIVE SPATIAL DEVELOPMENT IN THE MIDDLE EAST AND NORTH AFRI CA A NEW STATE OF MIND: GREATER TRANSPARENCY AND ACCOUNTABILITY IN THE MIDDLE EAST AND NORTH AFRICA PART II: THE LEARNING STATE
Centralized Mechanisms of Service Delivery
In the pursuit of convergence in service quality, most Middle Eastern and North African countries have committed to decentralizing authority for service delivery to local bodies. In other regions, local authorities such as municipalities and city councils commonly provide basic services to citizens, and they are generally viewed as the first and best contact point between the citizenry and the government.
Several Middle Eastern and North African countries have made advances in decentralizing—including Lebanon and Tunisia, which each held long-awaited local elections in 2018. Nonetheless, local government systems in the Middle East and North Africa remain mostly deconcentrated rather than decentralized, mirroring the excessive concentration of the region’s urban systems. Decentralization refers to transfer of political, fiscal, and administrative powers from the central government to lower levels of government (through downwardly accountable actors, such as elected local authorities), whereas deconcentration refers to transfer of administrative responsibility for specific functions to lower levels within the central government bureaucracy (who are part of the central government and upwardly accountable to it). Deconcentrated entities are agents of the central government, not accountable to their local residents, and not able to tailor programs to local needs or preferences.
The public administration system is highly centralized in most of the region, with deconcentrated units of the central government providing some services directly, and field offices of line ministries or governorates, districts, and municipalities providing basic services (UCLG 2010). Staff working for these line ministries or deconcentrated (central) government offices are unlikely to have the incentives or motivation to heed local feedback to improve the quality of service delivery, but if their employment contract formally rewarded (or punished) certain actions—including acting on citizen feedback—they would likely be much more motivated to take (or avoid) actions that would lead to rewards (or punishments).
Policymakers in the Middle East and North Africa can learn from the Chinese experience—a country without electoral institutions or a free press that used incentives and motivation to enhance livability and economic performance. Chinese political institutions gave autonomy and incentives to municipal officials to invest in productive enterprises (Ang 2016). Dynamic, entrepreneurial leaders emerged as mayors of Chinese cities and towns and took advantage of these incentives, which presumably worked in China because it has a long history of strong state capacity—including local-level capacity and innovation—to accomplish national goals (Fukuyama 2011; 2014).
Although elected councils usually run local governments in the Middle East and North Africa, they typically have limited authority over the services they are mandated to provide. Their role mostly consists of implementing service delivery decisions that the central government makes and performing limited functions such as running libraries, paving streets, providing park services and street lights, and collecting garbage (UCLG 2010). Figure 6 summarizes the territorial governance structure typical of Middle Eastern and North African subregions. The fiscal decentralization indices that Ivanyna and Shah (2012) calculated suggest that the Mashreq region is significantly less decentralized than the Maghreb, particularly in the case of Egypt, Iraq, Jordan, and Syria (Figure 7).
Limited decentralization has resulted in a general mismatch between fiscal centralization and functional devolution of responsibility for delivering basic services. Financing for urban public services in the region is lower and more centralized than in OECD countries, with central government entities being primarily responsible for public investments
240 CHAPTER 13: FROM MONUMENTAL TO INCREMENTAL INSTITUTIONS FOR EFFECTIVE SPATIAL DEVELOPMENT IN THE MIDDLE EAST AND NORTH AFRI CA MIDDLE EAST AND NORTH AFRICA REGION | ECONOMIC UPDATE OCTOBER 2022
Figure 6.
Fiscal Decentralization
Arabia: regional councils
by
in
Eastern and North African subregions
(appointed
oversee governorates,
municipalities
Smaller GCC countries: municipalities
branches of the central government
of municipal
Centralized territorial structure
Source: Authors based on review of decentralization literature.
De-concentration
Mashreq, Egypt
Governorates focus mainly on public order and serve as the provincial seat through whichdeconcentrated units of line ministries plan and coordinate investments or provide services
Central governments largelymaintain control of financial resources
Functional decentralization
Maghreb
Countries divided into governorates; municipalities have elected councils legally enabled to approve plans, development projects, regulatory controls and local budgets, with varyingdegrees of political and administrative autonomy
Central control over finances but elected councils of municipalities can approve local budgets
Note: There are some notable exceptions to the categorizations, as indicated in Figure 7 (e.g., the United Arab Emirates has a significant degree of fiscal decentralization).
Functional and fiscal decentralization
West Bank and Gaza
Local governments are responsiblefor 27 functions including most public services commonlydelivered at the local level
Truly decentralized budgetary system
Administrative Decentralization
Figure 7. Fiscal decentralization in the Middle East and North Africa a. Decentralization by subregiona b. Decentralization, selected countries Fiscal decentralization Fiscal decentralization 0.30 0.25 0.20 0.15 0.10 0.05 0 Maghreb GCC Mashreq 0.6 0.5 0.4 0.3 0.2 0.1 0 SyrianArabRepublic MoroccoTunisiaAlgeria Jordan LibyaLebanon KuwaitEgyptSaudiArabiaOmanUnitedArab Emirates IraqQatar Source: Ivanyna and Shah 2012. Note: The fiscal decentralization index considers numerous variables: local government autonomy in rate and base setting for local revenues, self-financing of local expenditures, local responsibility for and control over municipal and social services, and many others. a. Maghreb refers to Algeria, Libya, Morocco, and Tunisia; Mashreq to the Arab Republic of Egypt, Iraq, Jordan, Lebanon, and the Syrian Arab Republic; and the Gulf Cooperation Council (GCC) to Bahrain, Kuwait, Oman, Qatar, Saudi Arabia, and the United Arab Emirates. Figure 8. Decentralized spending and own-source revenues in the Middle East and North Africa Figure 9. Persistent decline in subnational revenue and local taxes as percentage of total national revenue in Egypt SNG expenditure as a percent of total government expenditure Percent 01020304050 80 70 60 50 40 30 20 10 0 Iraq Egypt Morocco Jordan West Bank and Gaza Tunisia Djibouti 5 4 3 2 1 01992 1994 1996 1998 2000 2002 2004 2006 2008 2010 2012 2014 2016 2018 2020 Sources other than central government grants and subsidies as a percentage of total SNG revenue. Total local revenue Local taxes Source: OECDStat 2015 and World Bank country reports 2014–18. Note: SNG: subnational government; WB&G: West Bank and Gaza. Source: Egypt Ministry of Finance data collected by M. Nada et al. (World Bank Egypt country team) as part of Technical Assistance on fiscal decentralization and own-source revenue strategy.
Decentralization
Middle
GCC Saudi
headed
emirs
bythe king)
districts and
are
Quasi-totality
funding provided by central government through fiscal transfers
241CHAPTER 13: FROM MONUMENTAL TO INCREMENTAL INSTITUTIONS FOR EFFECTIVE SPATIAL DEVELOPMENT IN THE MIDDLE EAST AND NORTH AFRI CA A NEW STATE OF MIND: GREATER TRANSPARENCY AND ACCOUNTABILITY IN THE MIDDLE EAST AND NORTH AFRICA PART II: THE LEARNING STATE
in urban infrastructure and service delivery. Even in cases in which municipal governments invest in infrastructure and provide services, they largely rely on fiscal transfers from higher levels of government to do so—as seen in the much lower shares of own-source revenue in their total revenue streams than in OECD countries (Figure 8).
The main exceptions to this in the region are the West Bank and Gaza, where 90 percent of property taxes (collected directly in Gaza or indirectly through the Palestinian National Authority in the West Bank) goes to municipalities, which in turn depend on central transfers for only 15 percent of their total revenue (World Bank 2017a). Maghreb countries, particularly Morocco, also tend to have somewhat greater financial autonomy at the local level—including some extent of commercial subnational borrowing.
Subnational revenue and local tax collection as a share of total national revenue has declined, as seen in Egypt over the past three decades (Figure 9), and it is estimated that cities in Morocco need a capital investment budget that is 5 times as large as current levels or own-source revenue generation that is 2.5 times as high as current levels to meet their estimated financing needs for urban infrastructure investment over the medium term due to rising urbanization (World Bank 2020b).
This highly centralized administrative structure has contributed to an uneven form of spatial development. Econometric comparisons of spatial imbalances in the Middle East and North Africa with those in other regions confirm the implication of this centralizing approach for spatial disparity. The World Bank (2011) presents statistical evidence that countries with centralizing governance characteristics tend to follow a more spatially concentrated development path. This research concludes that greater political rights and greater sharing of political accountability across a territory favors a reduction in spatial imbalances. In related research, Mijiyawa, Kremer, and Whitmore (2012) find a strong negative correlation between a political rights index, on which the Middle East and North Africa is lower than other world regions, and a spatial agglomeration index (an indicator of the concentration of economic activities, which the authors use as a proxy measure for spatial imbalances), on which the Middle East and North Africa is higher than elsewhere. Not all spatial imbalances are negative; one of the major intellectual contributions of the 2009 World Development Report (World Bank 2009) was the argument that dispersing production more broadly does not foster prosperity, although this uneven spatial development is troubling because it contributes to spatial disparities in living standards, as discussed in the following section.
4. Centralized decision making and spatial disparities
This section highlights how the Middle East and North Africa’s top-down decision-making structures and centralized delivery mechanisms have contributed to spatial disparities.
Unpredictable and Regressive Subnational Resource Transfers
The budget processes governing sectoral and subnational resource allocation for public investment in the Middle East and North Africa commonly lack transparency and predictability, potentially skewing resource flows toward areas with greater bargaining power. Several econometric studies from the OECD find that political bias in spatial allocation of central government grants across regions is stronger as equalization systems become weaker and less transparent (Pitlik,
242 CHAPTER 13: FROM MONUMENTAL TO INCREMENTAL INSTITUTIONS FOR EFFECTIVE SPATIAL DEVELOPMENT IN THE MIDDLE EAST AND NORTH AFRI CA MIDDLE EAST AND NORTH AFRICA REGION | ECONOMIC UPDATE OCTOBER 2022
Schneider, and Strotmann 2006; Simon-Cosano, Lago-Peñas, and Vaquero 2014). To safeguard against political bias and provide local governments with greater predictability in resource flows, intergovernmental grant systems should be timely, transparent, and predictable (Boadway and Shah 2007; OECD 2013; UN Habitat 2009).
Lack of clear allocation criteria can lead to suboptimal spatial and economic outcomes. Take for example the Egyptian system, which illustrates how weaknesses in the subnational budget process can reinforce spatial disparities on several fronts, with fragmentation in planning and budgeting leading to a lack of accountability in public spending outcomes and favoring geographic areas with greater bargaining power. The system uses no official formula or consistently applied set of criteria for making resource allocation decisions and so serves no clear redistributive function. All horizontal and vertical resource allocations are determined through individual negotiations between the Ministry of Finance and each of the 324 budget entities (meaning that subnational entities with little bargaining power or negotiating skills—potentially those in lagging areas—may receive lower resource allocations). Furthermore, budgeting takes place throughout the fiscal year based on ad hoc circumstances, which prevents Parliament from recognizing and discussing geographical allocation of budgeting. Finally, deconcentrated implementing agencies can change the location of any assigned project with the approval of only the Minister of Planning.
Even in countries that apply formulas for subnational allocation of central government resources, the formulas are commonly biased toward leading areas (based on an area’s population or natural resource revenues). International experience and empirical research show that such fiscal equalization schemes can “deliver smaller spatial economic disparities across regions” (Henkel et al. 2018), although they can also have an uneven spatial incidence that reinforces territorial imbalances. For example, in Iraq, central government budget allocations to governorates are based primarily upon past spending, population, and a petro-dollar formula. The resulting allocations are a disincentive to economize and skew resources away from lagging governorates that tend to be less populated; the correlation between a governorate’s share of investment budget and its poverty rate is -0.125, and the correlation between a governorate’s poverty rate and its population is -0.15 (World Bank 2016a).
The use of the petro-dollar formula also rewards wealthier governorates; Basra and Karkouk have poverty rates of 14 percent and 9 percent, respectively, below the governorate average of 21 percent in 2012 based on the national poverty line, resulting in significant horizontal disparities in resource allocations (World Bank 2016a). Alhashemi and Mills (2018) show that the use of natural resource endowments as a basis for revenue sharing is widespread in the Middle East and North Africa’s fiscal transfer mechanisms and tends to reinforce resource regionalism and trigger separatist tensions (whereby resource-rich regions retain benefits from locally generated revenues). As such, the authors recommend that governments target spatial inequalities at the national level rather than through redistributive mechanisms that explicitly reward resource-rich regions and perpetuate resource reliance.
The excessively centralized allocation of central government resources for capital investment can directly enhance spatial disparities. The case of Lebanon is illustrative. Overall, public investment in infrastructure in Lebanon has been low and skewed toward the most developed districts, even after controlling for population. In per capita terms for 2017, the Council for Development and Reconstruction (national agency responsible for planning and coordinating donor funding and financing for rebuilding infrastructure at the national and local level, which reports directly to the Prime Minister) made the highest investments in Batroun, Beirut, Chouf, Jbeil, and Marjaayoun.
243CHAPTER 13: FROM MONUMENTAL TO INCREMENTAL INSTITUTIONS FOR EFFECTIVE SPATIAL DEVELOPMENT IN THE MIDDLE EAST AND NORTH AFRI CA A NEW STATE OF MIND: GREATER TRANSPARENCY AND ACCOUNTABILITY IN THE MIDDLE EAST AND NORTH AFRICA PART II: THE LEARNING STATE
There was limited investment in more peripheral districts such as Bint Jbeil, Jezzine, and Nabatiyeh in the south; Baalbeck and Rachaya in the Bekaa; and Akkar in the north (Figure 10). There may be economic efficiency reasons for allocating durable public infrastructure to economically dense prosperous areas, but these decisions widen the chasm between leading and lagging areas.
Several Middle Eastern and North African countries have reformed their subnational fiscal transfer frameworks toward the use of need- and performance-based formulas, which consider the economic and fiscal capabilities of individual regions. For example, Jordan’s system of grants to municipalities is reported to be clear, simple, and predictable; Article 23 of the Law on Municipalities provides guidelines for the distribution of total government revenue that include guidelines that can reduce spatial disparities, including distance from the center of the municipality to Amman, a nominal gross domestic product index, and municipal spending needs. In Morocco, financial transfers to municipalities are made through a value-added tax designated account, with explicit equalization objectives that are generally fulfilled (World Bank 2017b).
Figure
$157–$250
impact of such transfers
encouraged to build their
be further enhanced
making greater use of incentive structures so that municipalities
service
performance to access the
Government programs in Tunisia (PDUGL) and the West Bank and Gaza (Municipal Development Program) have successfully implemented such conditional transfers, which are typically paired with a capacity-building element that helps underperforming local authorities come up to speed to avoid entrenching existing capacity gaps, based on local government performance. These experiences increase financial sustainability, improve management practices in local governments, and illustrate how a country’s subnational fiscal architecture can be designed to become a powerful tool of spatial planning.
10. Council for Development and Reconstruction Public Investments per capita (2017) and poverty of Lebanese population (2004)
$109–$157 $83–$109 $7–$83 $0–$7 CDR investment per capita 2017 El MiniehDennie Marjaayoun West Bekaa El Nabatieh El Batroun Kesrwane El Hermel Bent Jbeil El Meten Hasbaya Rachaya El Koura Baalbek Zgharta Bcharre Baabda Jezzine Tripoli Beirut Akkar Chouf Zahle Saida Sour Jbeil Aley 80–100 60–80 40–60 20–40 0 Poverty Lebaneserates2004 El MiniehDennie Marjaayoun West Bekaa El Nabatieh El Batroun Kesrwane El Hermel Bent Jbeil El Meten Hasbaya Rachaya El Koura Baalbek Zgharta Bcharre Baabda Jezzine Tripoli Beirut Akkar Chouf Zahle Saida Sour Jbeil Aley Source: Council for Development and Reconstruction (September, 2017). The
could
by
are
technical capacity, financial sustainability, and
delivery
funds.
244 CHAPTER 13: FROM MONUMENTAL TO INCREMENTAL INSTITUTIONS FOR EFFECTIVE SPATIAL DEVELOPMENT IN THE MIDDLE EAST AND NORTH AFRI CA MIDDLE EAST AND NORTH AFRICA REGION | ECONOMIC UPDATE OCTOBER 2022
Uneven Quality of Investment Planning and Execution
Several countries have significant regional imbalances in terms of local government staffing and human resource capacity, which disproportionately affect lagging areas, as the case of Tunisia exemplifies. A 2018 study on public employment in the country’s local governments found regional imbalances in terms of staffing and human resource capacity between northern and coastal municipalities and interior and rural ones, confirming the role that spatial bias plays in human resource allocation (World Bank 2018b). Approximately 67 percent of local governments did not have a qualified engineer, 75 percent did not have an architect, and 24 municipalities did not have a qualified administrative or financial director. In total, the analysis estimated that more than 1,100 staff would need to be hired to ensure that at least one staff member filled each of these key managerial and technical functions in all local governments. To address these gaps, the government of Tunisia has begun piloting the use of financial incentives to encourage staff to move to local governments in lagging areas.
These capacity gaps translate into uneven planning and execution among local governments. In many countries, the systematic mismatch of planned budget and executed budget “tends to nullify the usefulness of budget planning and the prioritization of expenditures” (World Bank 2016b). In Jordan, few local authorities seem to prepare and regularly update local development and investment plans, with the result that capital expenditure allocations are often made on an ad hoc basis without a coherent strategic vision and only limited citizen engagement or public participation. In Morocco, the limited capacity of municipalities to execute their investment budgets is a major constraint on local service delivery, with municipalities often executing less than 50 percent of their investment plans (World Bank 2018c). Execution capacity also tends to be lower in lagging areas; a 2017 survey of local government infrastructure quality in Tunisia found that the execution rate of infrastructure projects was advancing faster in coastal (leading) areas, with 50 percent of projects from communes’ 2016 annual investment plans completed and another 25 percent underway, compared with 40 percent and 33 percent, respectively, in interior (lagging) areas. Execution of annual investment plans also tended to be higher in medium-sized cities (10,000 to 50,000 hectares) than in small towns (World Bank 2018b).
Limited Financial Capacity and Fiscal Autonomy of Local Governments
The revenue-raising capabilities of municipalities are also unevenly distributed, with weaker fiscal autonomy in smaller municipalities and lagging areas. In Jordan, the ability of municipalities to raise own-source revenues is directly related to their size. The two municipalities of Greater Irbid and Greater Zarqa mobilize 74 percent of their revenues from own sources, whereas the next eight municipalities in terms of population size split their reliance about 50:50, and the remaining 86 municipalities mobilize only 20 percent, relying heavily on intergovernmental transfers for the rest of their funding (Timofeev and Wallace 2017). Likewise, in Lebanon, analyses of municipal finances in two lagging regions (Akkar and Minnieh-Dannieh) find that these districts have a smaller tax base (due to small populations in each municipality) and much lower revenues than the national average (Atallah et al. 2018).
Geographic gaps in municipal revenue mobilization potential can thereby enhance spatial disparity in quality of services. In the case of Lebanon, below-average municipal revenue in the lagging Akkar and Minnieh-Dannieh regions “severely hinders the capacity of municipalities to provide necessary public services for which they are responsible” (Atallah et al. 2018). This is consistent with econometric findings from multiple developing, emerging, and advanced economies showing that decentralization increases the efficiency of public service delivery but only given a sufficient degree of expenditure decentralization accompanied by sufficient decentralization of revenue (Sow and Razafimahefa 2015).
245CHAPTER 13: FROM MONUMENTAL TO INCREMENTAL INSTITUTIONS FOR EFFECTIVE SPATIAL DEVELOPMENT IN THE MIDDLE EAST AND NORTH AFRI CA A NEW STATE OF MIND: GREATER TRANSPARENCY AND ACCOUNTABILITY IN THE MIDDLE EAST AND NORTH AFRICA PART II: THE LEARNING STATE
Increasing the fiscal autonomy of local governments can be a powerful tool to correct spatial disparities in service delivery. In the West Bank and Gaza, a recent household survey showed that, even after excluding differences due to size and location, “fiscal capacity can be identified as one, if not the strongest driver of local government performance” in access, quality, and reliability of local service delivery (World Bank 2017a). Economic models using proxy indicators of fiscal sustainability (satisfactory collection efficiency, own revenue sources, and basic surplus in operational and enterprise budgets) yield positive, statistically significant coefficients. Municipalities with satisfactory collection efficiency and own revenue sources on average have a 5.6 percent point higher performance score, and municipalities with a surplus in operational and enterprise budgets perform on average 5.4 percent points higher. Per capita revenues are strongly associated with better local government performance, and an even stronger relationship exists between per capita expenditures and local government performance (Figure 11).
Figure 11. Association between local government performance in West Bank and Gaza (measured according to access, quality, and reliability of local services) and local government fiscal sustainability

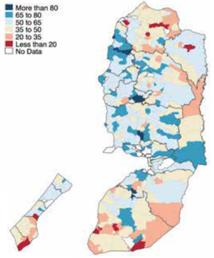
Local government Unit Performance Index Relationship to local government fiscal sustainability
Furthermore, geographic variation in Local Government (LGU) performance scores is closely linked to various measures of lagging regions—household wealth, remoteness from governorate, poverty—suggesting that increasing local capacity to mobilize and manage resources, particularly in lagging areas, can significantly reduce spatial disparities. In Saudi Arabia, increasing own-source revenues of municipalities has become a key performance indicator of the recently adopted National Transformation Program, reflecting the importance of doing so in achieving the Kingdom’s vision of “providing world-class government services that effectively and efficiently meet the needs of citizens” (Saudi Arabia Vision 2030).
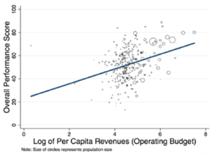
Overall performance score Log of per capita revenues (operating budget) Source: World Bank 2017. Note: Size of circles represents population size.
246 CHAPTER 13: FROM MONUMENTAL TO INCREMENTAL INSTITUTIONS FOR EFFECTIVE SPATIAL DEVELOPMENT IN THE MIDDLE EAST AND NORTH AFRI CA MIDDLE EAST AND NORTH AFRICA REGION | ECONOMIC UPDATE OCTOBER 2022
5. From monumental to incremental - Reforming governance to enable convergence
To accelerate the pace of convergence between leading and lagging areas within Middle Eastern and North African countries, policy makers can move away from large-scale capital investments (building monuments) and refocus efforts on identifying local needs and tailoring solutions to address local market and coordination failures. This is an incremental approach, which will require incorporating feedback, having local service providers accountable to the local residents, and building local governance capacity in human and financial resources. To use a cliché, for effective territorial development in the Middle East and North Africa, the hard stuff will be the soft stuff. Whereas building monuments is rather straightforward, listening to local residents and incrementally changing the incentives and motivation of service providers such that they are agents of local residents and not only of their line ministries will be challenging.
In taking a locally sensitive approach, scale economies and externalities must be seriously considered. Small local authorities tend to face capacity and efficiency challenges because of their size. This is particularly so in the Middle East and North Africa, where many local authorities have been subdivided (resulting in very small scale) and have experienced historic under-resourcing and weak institutional frameworks. They also tend to have less capacity to hire skilled, specialized staff and invest in planning processes. In addition, certain public facilities (e.g., major hospitals, universities, railways, industrial zones) are only efficient when undertaken at scale, given a need for specialized inputs or large capital investments and other fixed costs, making provision by small local units inefficient and infeasible.
Small local authorities may also fail to manage the external effects of their actions properly, to the detriment of wider regional and national development. Investments, policies, and economic activities in one area often have external impacts on other areas. Some are positive (e.g., a district that hosts a vibrant city, benefiting surrounding districts as a source of jobs and services), whereas others are negative (e.g., pollution, congestion, or a race to the bottom in local tax competition). In either case, fragmented local authorities without dedicated coordination frameworks often fail to control negative spillovers or to develop shared assets jointly and may engage in wasteful “beggar thy neighbor” competition.
In this context, effective decentralization must be incremental and asymmetric, tailored to the varying capacities and needs of different localities. Decentralization efforts must increase scale and capacity, coordination, and local accountability. A good example is the vertical coordination seen in France’s state-region contracts (Contrats de Projets Etat–Région; CPERs)—5- to 7-year agreements between the national and regional governments (the highest level of local government) to deliver the highest-priority projects for development of the region. They promote effective regionled planning while aligning efforts of the local and central government and have been implemented in France since the mid-1980s.
CPERs are coordination tools; they do not make new resources available but instead align preexisting resources (from the region and the state) around the priorities set. The central government delineates broad categories of projects that are eligible for CPERs, within which regional governments propose their own priority projects, increasing the coherence and complementarity of regional plans. The national and regional governments together engage legally to deliver the projects, agreeing on their financing, delivery modalities and agencies, beneficiaries, and results indicators. CPERs also coordinate actors beyond the region and central governments; sectoral line ministries, national transport agencies, cross-regional bodies (e.g., in river basin and mountainous regions, for which cross-regional CPERs are made and added as annexes to regional contracts), and subregional bodies (e.g., metropolitan areas, nature areas) often cosign CPERs.
247CHAPTER 13: FROM MONUMENTAL TO INCREMENTAL INSTITUTIONS FOR EFFECTIVE SPATIAL DEVELOPMENT IN THE MIDDLE EAST AND NORTH AFRI CA A NEW STATE OF MIND: GREATER TRANSPARENCY AND ACCOUNTABILITY IN THE MIDDLE EAST AND NORTH AFRICA PART II: THE LEARNING STATE
Another option is horizontal coordination for broad local planning and management. Consider England’s combined authorities; groups of local authorities can submit proposals to form joint combined authorities, which exist above the level of the local authorities and are often formed to improve management of major cities and their surrounding metro and rural areas, which otherwise spill across administrative boundaries. Combined authorities conduct functions that benefit from shared planning across the region, such as economic planning, oversight of transit services, and investments in innovation hubs or industrial parks. Based on their needs and performance, they negotiate for incrementally greater decentralized powers and responsibilities through a sustained dialogue with the central government.
Local authorities must be properly resourced to perform their decentralized functions. This includes own-source revenues and central–local transfers. Relevant areas for fiscal decentralization include raising local governments’ control over fees to cover service costs and decentralizing land and property tax regimes and administration. Central-local government transfers also require greater transparency, predictability, and more equitable formulas, particularly in the Mashreq. Transparency and predictability are important to counteract spatial biases in spending and outcomes, and in many cases, formulas also must be revised to reduce the bias toward resource-rich locations and better target poverty in lagging regions.
References
Alhashemi, F., and Mills, R. (2018). “Resource Regionalism in the Middle East and North Africa: Rich Lands, Neglected People.” Analysis Paper No. 20. Brookings Doha Center. Ang, Y. Y. (2016). How China Escaped the Poverty Trap. Cornell University Press, Ithaca, NY. Atallah, S., Sánchez, D. G., Hassan, N., Mahdi, D., and Mourad, J. (2018). “Introductory Chapter: Analytical Framework for Improving Urban Resilience in Lebanon’s Districts Impacted by the Syrian Refugee Crisis.” Unpublished report, Lebanese Center for Policy Studies, Beirut. Amin, K. (2016). Unpublished technical paper for the Upper Egypt Local Development Program-for-Results Project. World Bank, Washington, DC. Boadway, R., and Shah, A. (Eds.). (2007). Intergovernmental Fiscal Transfers: Principles and Practice. Public Sector and Accountability Series. World Bank, Washington, DC.
Bosker, M., Buringh, E., and Van Zanden, J. L. (2013). “From Baghdad to London: Unraveling Urban Development in Europe, the Middle East, and North Africa, 800–1800.” Review of Economics and Statistics, 95(4), pp. 14181437.
Cowell, F.A. (2006). "Theil, Inequality Indices and Decomposition." In Creedy, J. and Kalb, G. (Ed.), Dynamics of Inequality and Poverty (Research on Economic Inequality, Vol. 13), Emerald Group Publishing Limited, Bingley, pp. 341356. https://doi.org/10.1016/S1049-2585(06)13012-4.
Faraji, S. (2016). “Urban Primacy in Urban System of Developing Countries: Its Causes and Consequences.” HUMAN, Research in Rehabilitation, 6(1), pp. 34-45.
Grover, A., Lall, S. V., and Maloney, W. F. (2022). Place, Productivity, and Prosperity: Revisiting Spatially Targeted Policies for Regional Development. World Bank, Washington, DC.
Henderson, V. (2002). “Urbanisation in Developing Countries.” World Bank Research Observer, 17(1), pp. 89-112.
Henkel, M., Seidel, T., and Südekum, J. (2018). “Fiscal Transfers in the Spatial Economy.” CESifo Working Paper Series No. 7012, April 2018.
248 CHAPTER 13: FROM MONUMENTAL TO INCREMENTAL INSTITUTIONS FOR EFFECTIVE SPATIAL DEVELOPMENT IN THE MIDDLE EAST AND NORTH AFRI CA MIDDLE EAST AND NORTH AFRICA REGION | ECONOMIC UPDATE OCTOBER 2022
Fukuyama, F. (2011). The origins of political order: From prehuman times to the French Revolution. Farrar, Straus and Giroux, New York.
Fukuyama, F. (2014). Political Order and Political Decay. Farrar, Straus and Giroux, New York.
Ivanyna, M., and Shah, A. (2012). “How close is your government to its people? Worldwide Indicators on Localization and Decentralization.” World Bank Policy Research Working Paper No. 6138. World Bank, Washington, DC.
Mijiyawa, A. G., Kremer, A., and Whitmore, L. (2012). “Does Mena'S Governance Lead To Spatial Agglomeration?” Middle East Development Journal, 4(2), 1250010.
OECD (Organization for Economic Cooperation and Development). (2013). Fiscal Federalism 2014: Making Decentralisation Work. OECD Publishing, Paris.
OECD (Organization for Economic Cooperation and Development). (2015). OECD.Stat. Database. https://stats.oecd.org/.
Pitlik, H., Schneider, F., and Strotmann, H. (2006). “Legislative Malapportionment and the Politicization of Germany’s Intergovernmental Transfer System.” Public Finance Review, 34(6), pp. 637-662.
Shorrocks, A. and Wan, G. H. (2005) “Spatial Decomposition of Inequality.” Journal of Economic Geography, 5(1), pp. 59-81.
Simon-Cosano, P., Lago-Peñas, S., and Vaquero, A. (2014). “On the Political Determinants of Intergovernmental Grants in Decentralized Countries: The Case of Spain.” Publius: The Journal of Federalism, 44(1), pp. 135-156.
Sow, M., and Razafimahefa, M. I. F. (2015). “Fiscal Decentralization and the Efficiency of Public Service Delivery.” IMF Working Paper WP/15/59. International Monetary Fund, Washington, DC.
Theil, H. (1967). Economics and Information Theory. North-Holland Publishing Company, Amsterdam.
Theil, H. (1972). Statistical Decomposition Analysis. North-Holland Publishing Co, Amsterdam.
Timofeev, A., and Wallace, S. (2017). “An Assessment of the Subnational Fiscal Framework in Jordan: Draft.” International Center for Public Policy, Andrew Young School of Policy Studies, Georgia State University, Atlanta, GA.
UN Habitat. (2009). International Guidelines on Decentralisation and Access to Basic Services for all. UN Habitat, Nairobi.
UCLG (United Cities and Local Governments). (2010). Local Government Finance: The Challenges of the 21st Century. Second Global Report on Decentralization and Local Democracy (GOLD II). Edward Elgar Publishing, Cheltenham, U.K.
World Bank. (2009). World Development Report 2009: Reshaping Economic Geography. World Bank, Washington, DC. https://openknowledge.worldbank.org/handle/10986/5991
World Bank. (2016a). “Republic of Iraq: Decentralization and Subnational Service Delivery in Iraq: Status and Way Forward.” Working Paper, Report No. AUS17063, World Bank, Washington, DC.
World Bank. (2016b). West Bank and Gaza: Public Expenditure Review of the Palestinian Authority: Towards Enhanced Public Finance Management and Improved Fiscal Sustainability. Report No. ACS18454, World Bank, Washington, DC.
World Bank. (2011). “Poor Places, Thriving People: How the Middle East and North Africa Can Rise Above Spatial Disparities.” MENA Development Report. World Bank, Washington, DC.
World Bank. (2017a). The Performance of Palestinian Local Governments: An Assessment of Service Delivery Outcomes and Performance Drivers in West Bank and Gaza. World Bank, Washington, DC.
World Bank. (2017b). “Making Urbanization Work for Growth and Shared Prosperity in Morocco.” Urban and Regional Development Policy Note, World Bank, Washington, DC.
World Bank. (2018a). Jordan Urban and Municipal Program for Balanced and Inclusive Growth. Concept Note. World Bank, Washington, D.C.
249CHAPTER 13: FROM MONUMENTAL TO INCREMENTAL INSTITUTIONS FOR EFFECTIVE SPATIAL DEVELOPMENT IN THE MIDDLE EAST AND NORTH AFRI CA A NEW STATE OF MIND: GREATER TRANSPARENCY AND ACCOUNTABILITY IN THE MIDDLE EAST AND NORTH AFRICA PART II: THE LEARNING STATE
World Bank. (2018b). Tunisia—Urban Development and Local Governance Program Project: Additional Financing. World Bank Group, Washington, DC. World Bank. (2018c). “Maroc: Tirer avantage de l'urbanisation pour promouvoir un nouveau modèle de croissance et réduire les disparités territoriales.” [Morocco : Take advantage of urbanization to promote a new growth model and reduce territorial disputes]. Policy Note, World Bank, Washington, DC. World Bank. (2018d). “Unleashing the Potential of Education in the Middle East and North Africa.” MENA education flagship draft for decision meeting, World Bank, Washington, DC. World Bank. (2020a). Convergence: Five Critical Steps toward Integrating Lagging and Leading Areas in the Middle East and North Africa. World Bank, Washington, DC. World Bank. (2020b). “Unlocking Urban Development in Morocco: Can Urbanization Pay for Itself, and How to Make It Happen?” Report of PPIAF/World Bank Technical Assistance to the Kingdom of Morocco on Financing Urbanization. World Bank, Washington, DC.
Yousef, T. M. (2004). “Development, Growth and Policy Reform in the Middle East and North Africa since 1950.” Journal of Economic Perspectives, 18(3), pp. 91-116.
250 CHAPTER 13: FROM MONUMENTAL TO INCREMENTAL INSTITUTIONS FOR EFFECTIVE SPATIAL DEVELOPMENT IN THE MIDDLE EAST AND NORTH AFRI CA MIDDLE EAST AND NORTH AFRICA REGION | ECONOMIC UPDATE OCTOBER 2022


MIDDLE EAST AND NORTH AFRICA REGION ECONOMIC UPDATE OCTOBER 2022 A NEW STATE OF MIND: GREATER TRANSPARENCY AND ACCOUNTABILITY IN THE MIDDLE EAST AND NORTH AFRICA WORLD BANK GROUP