Making Devolution Work for Service Delivery in Kenya

Page 118

|

Making Devolution Work for Service Delivery in Kenya

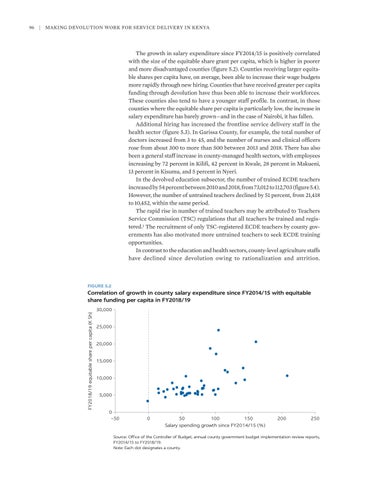
The growth in salary expenditure since FY2014/15 is positively correlated with the size of the equitable share grant per capita, which is higher in poorer and more disadvantaged counties (figure 5.2). Counties receiving larger equitable shares per capita have, on average, been able to increase their wage budgets more rapidly through new hiring. Counties that have received greater per capita funding through devolution have thus been able to increase their workforces. These counties also tend to have a younger staff profile. In contrast, in those counties where the equitable share per capita is particularly low, the increase in salary expenditure has barely grown—and in the case of Nairobi, it has fallen. Additional hiring has increased the frontline service delivery staff in the health sector (figure 5.3). In Garissa County, for example, the total number of doctors increased from 3 to 45, and the number of nurses and clinical officers rose from about 300 to more than 500 between 2013 and 2018. There has also been a general staff increase in county-managed health sectors, with employees increasing by 72 percent in Kilifi, 42 percent in Kwale, 28 percent in Makueni, 13 percent in Kisumu, and 5 percent in Nyeri. In the devolved education subsector, the number of trained ECDE teachers increased by 54 percent between 2010 and 2018, from 73,012 to 112,703 (figure 5.4). However, the number of untrained teachers declined by 51 percent, from 21,418 to 10,452, within the same period. The rapid rise in number of trained teachers may be attributed to Teachers Service Commission (TSC) regulations that all teachers be trained and registered.1 The recruitment of only TSC-registered ECDE teachers by county governments has also motivated more untrained teachers to seek ECDE training opportunities. In contrast to the education and health sectors, county-level agriculture staffs have declined since devolution owing to rationalization and attrition.

FIGURE 5.2

Correlation of growth in county salary expenditure since FY2014/15 with equitable share funding per capita in FY2018/19 FY2018/19 equitable share per capita (K Sh)

96

30,000 25,000 20,000 15,000 10,000 5,000 0 –50

0

50 100 150 Salary spending growth since FY2014/15 (%)

200

250

Source: Office of the Controller of Budget, annual county government budget implementation review reports, FY2014/15 to FY2018/19. Note: Each dot designates a county.


Turn static files into dynamic content formats.

Create a flipbook

Articles inside

A.4 Service delivery oversight, management, and systems

4min
pages 180-181

A.1 Functions and responsibilities

5min
pages 170-172

A.3 County resource allocation and use

5min
pages 177-179

Major achievements and challenges

10min
pages 154-157

Delivering the future promise of devolution

2min
pages 167-169

The role of development partners

2min
page 166

Policy options to make devolution work for service delivery

18min
pages 158-165

Introduction

1min
page 153

References

2min
pages 151-152

Conclusions

2min
page 149

6.6 Project management committees

2min
page 148

MCA elections

3min
page 145

the civil service

2min
page 143

communication

2min
page 140

Makueni County

3min
page 144

6.1 Elements of social accountability systems

4min
pages 136-137

Citizen engagement and service delivery

2min
page 135

Introduction

2min
page 134

Key Messages

1min
page 133

5.1 Categories of staff on county payrolls in Kenya, FY2018/19

2min
page 127

5.1 Initiatives to improve HRM in Makueni County

2min
page 128

References

1min
page 132

Overarching HRM frameworks

2min
page 126

Capacity building

2min
page 129

Staff performance

2min
page 125

with equitable share funding per capita in FY2018/19

1min
page 118

as a share of FY2019/20 total, by county

1min
page 117

Key messages

1min
page 115

allocation and use of resources

2min
page 112

4.14 Budget execution rates, by county, FY2014/15–FY2018/19

6min
pages 108-110

4.6 Postdevolution asset and liability management remains incomplete

2min
page 106

4.5 Participatory planning in public financial management

2min
page 105

FY2019/20

1min
page 104

expenditure in Kenya, by county, FY2018/19

1min
page 102

4.4 Weaknesses in the structure of budgets at the county level

5min
pages 100-101

4.3 County budget cycle in Kenya after devolution

2min
page 98

4.1 Performance-based conditional grants

2min
page 92

4.2 County creditworthiness

2min
page 95

counties in Kenya, FY2017/18

1min
page 91

Allocation and use of resources at the county level

2min
page 96

spending

2min
page 97

Key messages

1min
page 83

by county, FY2017/18

2min
page 89

3.7 Deficiencies in ECDE information management

2min
page 75

3.8 Quality assurance in the ECDE sector

2min
page 76

Conclusions

2min
page 80

Intergovernmental relations

2min
page 77

under devolution

2min
page 73

3.9 Intergovernmental coordination in the agriculture sector

2min
page 78

County management of sector service delivery

2min
page 69

3.6 Information management in the devolved health sector

2min
page 74

perspectives B3.1.1 Institutional arrangements in the urban water and sanitation

3min
page 66

delivery, by sector

2min
page 59

Disparities in county expenditure on devolved services

2min
page 54

References

1min
pages 31-32

FY2017/18

1min
page 57

Devolution of functions

2min
page 64

2.9 Total county per capita spending, FY2013/14–FY2017/18

1min
page 44

Context

1min
page 23

Kenya

2min
page 65
Issuu converts static files into: digital portfolios, online yearbooks, online catalogs, digital photo albums and more. Sign up and create your flipbook.
Making Devolution Work for Service Delivery in Kenya by World Bank Publications - Issuu