Making Devolution Work for Service Delivery in Kenya
A further success is that counties receiving higher allocations of the equitable share have used them to increase the number of staff to deliver those services. (For further discussion, see the section on staffing in chapter 5 of this report). Persistent challenges
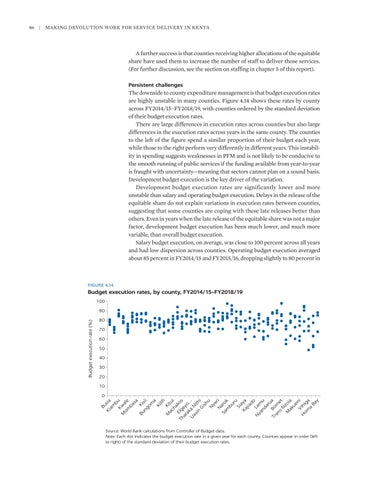
The downside to county expenditure management is that budget execution rates are highly unstable in many counties. Figure 4.14 shows these rates by county across FY2014/15–FY2018/19, with counties ordered by the standard deviation of their budget execution rates. There are large differences in execution rates across counties but also large differences in the execution rates across years in the same county. The counties to the left of the figure spend a similar proportion of their budget each year, while those to the right perform very differently in different years. This instability in spending suggests weaknesses in PFM and is not likely to be conducive to the smooth running of public services if the funding available from year-to-year is fraught with uncertainty—meaning that sectors cannot plan on a sound basis. Development budget execution is the key driver of the variation. Development budget execution rates are significantly lower and more unstable than salary and operating budget execution. Delays in the release of the equitable share do not explain variations in execution rates between counties, suggesting that some counties are coping with these late releases better than others. Even in years when the late release of the equitable share was not a major factor, development budget execution has been much lower, and much more variable, than overall budget execution. Salary budget execution, on average, was close to 100 percent across all years and had low dispersion across counties. Operating budget execution averaged about 85 percent in FY2014/15 and FY2015/16, dropping slightly to 80 percent in
FIGURE 4.14
Budget execution rates, by county, FY2014/15–FY2018/19 100 90 80 70 60 50 40 30 20 10 0
Bu Ki sia am b K u M wa om le ba sa Bu Ki ng sii om a Ki lifi M Kit ac u ha i k E Th lg os ar eyo ak … Ua a N sin ith G i ish u Ny er N i Sa aro m k bu ru Si ay Ka a jia do L Ny a an mu da ru Tr Bo a an m s et N M zoia ak ue Vi ni H hi om g a a Ba y
|
Budget execution rate (%)
86
Source: World Bank calculations from Controller of Budget data. Note: Each dot indicates the budget execution rate in a given year for each county. Counties appear in order (left to right) of the standard deviation of their budget execution rates.

