Editorial Committee
Peter Mosse, Editor peter.mosse@gmail.com
George Wall george@wioa.org.au
Direct mail to:
Peter Mosse WaterWorks Editor
c/o WIOA, 24 New Dookie Road
Shepparton, VIC 3630
Advertising & Production

Editorial Committee
Peter Mosse, Editor peter.mosse@gmail.com
George Wall george@wioa.org.au
Direct mail to:
Peter Mosse WaterWorks Editor
c/o WIOA, 24 New Dookie Road
Shepparton, VIC 3630
Advertising & Production
David Sheehan and Kim Mosse
By now, most water supply system operators would have heard about Microbial Health-Based Targets (HBTs).
Executive Media Pty Ltd
Level 6/185 Victoria Square, Adelaide, SA 5000
Tel: (08) 8231 4433 Fax: (08) 8231 3402
Email: adelaide@executivemedia.com.au Web: www.executivemedia.com.au
WaterWorks is the technical publication of the Water Industry Operators Association of Australia (WIOA). It is published twice yearly. Neither WIOA nor the publisher assume responsibility for opinions or statements of facts expressed by contributors or advertisers.
Contributions Wanted
WaterWorks welcomes the submission of articles relating to any operations area associated with the water industry. Articles can include brief accounts of one-o experiences or longer articles describing detailed studies or events. Submissions may be emailed to peter.mosse@gmail.com or info@wioa.org.au
Diffuser replacement at Westdale Wastewater Treatment Plant 11
ere is also the related term DisabilityAdjusted Life Year (DALY), and lots of talk about log reductions and other HBT jargon. But what do all these terms mean in relation to the day-to-day operation of a water treatment plant, lter performance targets and the supply of safe drinking water to customers?
e purpose of this article is to provide a plain English overview of what microbial HBTs are, why they have been developed for use in water supply systems, and what their introduction means for the day-today activities of operators.
As the name implies, a microbial HBT is simply a value that, if met, protects public health.
Everyone is familiar with the use of Health-Based Targets from their daily lives: speed limits to ensure public safety on the roads; body weight targets to protect against chronic health issues; and noise limits to protect hearing. In the water industry, we are also familiar with the HBT concept via the chemical guideline values in the Australian Drinking Water Guidelines (ADWG). ese guiding values are based on extensive toxicological studies in both animals and humans, using wellestablished research methods.
e challenge with determining HBTs is de ning the acceptable level of exposure; i.e. what concentration of a substance can you be exposed to, and for how long, before it starts to a ect your health.
For example, if you drink water with slightly elevated concentrations of arsenic for a couple of days, it is highly unlikely that this will cause signi cant health impacts; however, exposure to these elevated concentrations over a lifetime will. is is because the ADWG’s values for chemicals are based on long-term exposure and daily consumption of drinking water, which equates to 30–40 years of consuming two litres of drinking water per day. is means that a single slightly elevated result is not a major issue on its own, although it is important to investigate and determine the cause of the result so that it can be prevented in future. When it comes to pathogens, however, it gets more complicated! A single exposure to certain pathogens, even at low concentrations, can cause severe illness, or even death in extreme cases, i.e. it doesn’t need to occur over an extended period. erefore, a simple guideline value doesn’t work when assessing risk – but what does?
Although it’s acknowledged in the ADWG that pathogens are the biggest risk to drinking water supply, there is surprisingly little guidance available on how to measure and manage this risk. e only current health-based value guide related to pathogens in the ADWG is that for Escherichia coli (E. coli), which states: Escherichia coli should not be detected in any 100mL sample of drinking water. If detected in drinking water, immediate action should be taken including investigation of potential sources of faecal contamination.
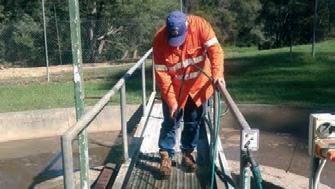
Our cover shot shows Paroo Shire Council’s Water and Sewer Supervisor, Paul Doyle, and Yowah’s Town Orderly, Scott Shorten, testing operation of the new bore at Yowah. Yowah is a small opal mining town in far South West Queensland. The bore sources water from the Great Artesian Basin at a depth of 550m and delivers that water under pressure and at 57°C at the surface.
However, the use of E. coli as the only microbiological target has signi cant limitations, for a number of reasons:
• E. coli has been shown to be a poor indicator of the presence of viruses and protozoa (for example Cryptosporidium) that are infectious to humans in water.
• ere is no rapid test for E. coli . It can
take up to 18 hours after the sample is taken to get a result, by which time the water may well have been consumed by customers.
• Only a small fraction of the drinking water supplied to customers is actually tested. For example, in a water supply where 5 ML of treated drinking water
Public health experts have always needed to prioritise their e orts and funding, in order to achieve the most useful health outcomes at a community level. To do this, they need to make decisions about the relative severity of di erent conditions, and take a scienti c approach to determining the impact of di erent diseases on community health.
e Disability Adjusted Life Year (DALY) was developed by the World Health Organization as a way of measuring the burden or impact of disease across a population. e DALY is made up of two components:
• YLL = Years of Life Lost due to premature death; and
• YLD = Years Lost due to Disability for people living with illness or disability.
Where:
DALY = YLL + YLD
One (1) DALY can be thought of as one lost year of “healthy” life. For example, if someone who would normally live to 80 dies suddenly of a heart attack at 79, then they have lost one year of healthy life, and the DALY in this instance is 1.
Within the YLD component, there are statistical probabilities of how likely an event is to occur, and how severe the levels of disability are. e level of disability was determined through a large-scale global survey of public health experts, to determine the relative severities of hundreds of di erent diseases.
Looking at a chronic disease example, if a person who would normally live to 80 is diagnosed with multiple sclerosis (MS) at 65, and the MS is categorised as mild (i.e. given a disability weight of 0.183), and the MS does not cause their
death at the age of 80, then the DALY calculation is as follows:
YLL = 0
YLD = 15 years x 0.183 weighting
DALY = 0 + (15 x 0.183)
DALY = 2.745
It is important to note that the relative DALY values do not represent the experiences of a person living with those conditions, but rather a populationwide estimate of the relative burden of di erent conditions. erefore, in this very simple example, the burden or impact of the sudden heart attack at 79 is 1 DALY; whereas, living with mild MS for 15 years is 2.745 DALY. Based on this assessment, health agencies may prioritise investment into MS, rather than sudden heart attacks, as MS has the higher disease burden for the community.
Pathogens, when present in drinking water, have the potential to result in acute gastrointestinal illness. Indeed some organisms can result in death, but most result in diarrhoea that varies from mild to severe. e relative disease burden that arises from this gastrointestinal illness can be calculated as shown in the example below for Cryptosporidium
is supplied per day, and two E. coli samples are collected per day, only 0.2 litres (2 x 100 mL) out of the 5 million litres supplied to customers is tested for the presence of E. coli. is equates to 0.000004% of the water being tested. e percentage of water tested is much, much lower if there is only one test per week or per month!
is information tells us that in a population of one million people, there will be around 1 case of diarrhoea caused by Cryptosporidium for every 1700 people per year (0.0017 x 1,000,000 = 1700). Put another way, in this population of one million people, Cryptosporidium creates a disease burden of 1700 DALY.
e WHO has set a drinking water target of 1 DALY per one million people, or 1 microDALY (micro = µ = 10 -6 ) per person per year. Based on the above information, which shows that Cryptosporidium infections result in 0.0017 DALYs, it can be calculated that a population of 1 million people can tolerate 588 cases of Cryptosporidium infection per year (or 588 ÷ 365 = 1.6 cases per day) and meet the 1 µDALY target.
Given that we know that, in Australia, about 2000 people in every million will have gastrointestinal illness on any one day, these extra 1.6 people account for a very small fraction of gastrointestinal disease in the community.
Note that this example has focused on Cryptosporidium only. However, the same calculations can be performed for enteroviruses and Campylobacter to determine their disease burdens, and what a 1 µDALY target means.
• ere is one additional problem. E. coli is easily killed by chlorine, but Cryptosporidium and Giardia are not. So, in a system where disinfection with chlorine has been carried out satisfactorily but, for example, the lters at the WTP have been performing poorly, there can be zero E. coli in samples from the distribution system, but the drinking water could still contain disease-causing Cryptosporidium or Giardia
Given all of these issues with the use of E. coli as an indicator, it is evident that there is a gap in the current drinking water guidelines and regulations, hence the need for a speci c microbial target.
It is important to acknowledge that supplying drinking water is not 100% risk-free. We don’t supply a sterile product, so there is always a small chance of a consumer receiving drinking water that contains one or more pathogenic organisms. erefore, the question becomes: how small should this chance be?
All of the pathogens of concern in drinking water result in some form of gastroenteritis, which is a reasonably common illness. It can be acquired in a number of ways, including from eating contaminated food, having contact with pets or farm animals, picking up highly contagious strains of the pathogens from childcare centres or cruise ships, or consuming contaminated water. It is estimated that, on any given day in a typical city of one million people, around 2,000 people will be su ering from gastroenteritis. If we accept that there will always be a level of background gastrointestinal illness in a community, and that some of this illness may come from drinking water, then it is possible to de ne an acceptable level of risk.
Microbial HBTs are based on a risk concept known as a Disability-Adjusted Life Year (DALY) (see DALY box below).
e DALY was developed by the World Health Organization (WHO) as a way of measuring the overall burden of disease across a population. Disease burden refers to the amount of illness caused by a particular disease and the impact that the disease has on those who are infected. Basically, how sick someone is, and for how long.
In the case of drinking water, the WHO has set the acceptable burden of disease
across a population from the presence of pathogens in drinking water at 1 µDALY (microDALY) per person per year per pathogen. Based on Cryptosporidum , a disease burden for drinking water of 1 µDALY per person per year equates to 588 cases of diarrhoea per million people per year, or 1 case of diarrhoea per 1700 people per year.
e key message here is that drinking water systems are not a 100% risk-free activity, but that it is possible to determine a target for how safe we want our systems to be. e next step is to determine how to meet those targets.
Now that we have a Health-Based Target, we need to relate the DALY value to treatment performance requirements.
To avoid unnecessary complications this article will only cover the calculations that relate to Cryptosporidium, but similar calculations can be performed for both bacteria (e.g. Campylobacter) and viruses (e.g. Enterovirus).
ere have been numerous epidemiological studies conducted over the years to test the infectivity of Cryptosporidium. Some of these tests were done in laboratories; others were done on humans for example in prisons and universities. ese studies have shown that the probability of becoming ill from swallowing a single Cryptosporidium is 0.16, or 16%. A simple way of thinking of about this is that if 100 people swallowed 1 Cryptosporidium, on average, 16 of those 100 people would become ill.
We also know that, on average, an adult drinks 2 litres of water per day, or 730 litres per year. So, now we can calculate the ‘acceptable’ number of Cryptosporidium in drinking water to achieve a target of 1 µDALY per person per year. is works out to be one
Cryptosporidium per 0.2ML (200,000L) of treated drinking water:
It is fairly obvious that it is impossible to test 200,000 litres of water looking for one Cryptosporidium. erefore, other ways of ensuring the safety of drinking water need to be used.
Now that we know what we’re aiming for in terms of treated water quality, we need to consider what quality of raw water we are starting with, and then determine the type and extent of treatment that is required to reliably produce safe drinking water.
Collecting enough Cryptosporidium data to accurately determine the average number of Cryptosporidium in each raw water source is expensive, time consuming, and beyond the budgets of all but the biggest Australian water Utilities. e way that this lack of data is managed is that the available data for the concentration of Cryptosporidium in raw water has been collated and reviewed. e results have been matched with the type of catchment areas where the samples were collected.
In addition, the concentration of Cryptosporidium has been compared with the amount of E. coli that was detected in the same samples. en, all this data has been compared with known sources of Cryptosporidium (i.e. dairy cattle, septic tanks, treated wastewater discharges), and from all this reviewing, average concentrations of Cryptosporidium in di erent catchment types have been determined. Using these average concentrations of Cryptosporidium, the log reduction (see Log Reduction Box) required to meet 1 µDALY per person per year can be set (Table 1).
ere is a whole lot of additional information that helps de ne each source water type, Table 1 shows the summary descriptions.
The term log refers to measuring numbers using a logarithmic scale. In water treatment, a logarithmic scale that can be related to the percent removal of pathogens is used. For example, a 90% (1 log) reduction means 90 out of every 100 pathogens have been removed or killed. The reduction achieved at different percentages of removal are:
1 log = 90% reduction
2 log = 99% reduction
3 log = 99.9% reduction
4 log = 99.99% reduction
For example, if you had 100 Cryptosporidium per 100 litres of water coming into a filter and the filter was capable of a 2 log reduction, 99 Cryptosporidium would be removed by the filter, leaving 1 Cryptosporidium per 100 litres of the final filtered water.
In most cases in Australia, where the catchment area is unprotected, and there are moderate levels of cattle and septic tanks in the catchment area, then the catchment will be at least a Category 3 source water type. e minimum log reduction for Cryptosporidium that is required to produce drinking water that meets 1 µDALY per person per year is 3.5 log (99.97%).
Finally – what does all of this mean in terms of water treatment processes? Rather than doing a whole lot of onsite testing that is a) expensive, and b) not sensitive enough anyway (remember we’re aiming for one Cryptosporidium per 200,000L of water), we rely on validated treatment processes, which have been extensively tested at pilot plants and laboratories.
As described above, if the water source is a Category 3 water source, then a 3.5 log reduction in Cryptosporidium is needed to achieve the microbial HBT of 1 µDALY per person per year.
So, what sort of treatment processes can be used to achieve the required log reduction of 3.5 log?
ere are two broad types of water treatment processes that can be used:


processes that that kill pathogens (e.g. treating with chlorine or chloramine) or processes that physically remove pathogens (e.g. ltration).
Table 2 summarises how e ective various treatment processes that kill pathogens are at killing Cryptosporidium
As the table shows, chlorine and chloramine do not kill Cryptosporidium, so would contribute no log reduction values. By comparison, UV light provides a 4 log reduction, provided the required UV dose, UVT (UV Transmissivity, i.e. how well the UV light penetrates into and through the water) and feedwater requirements are met.
e primary physical removal process used in Australia, and throughout the world, is media ltration. e performance of lters is typically assessed by looking at the turbidity of the water produced by the lter. Because Cryptosporidium are basically little egg-shaped particles oating in the water (Figure 1), they are very much like the particles that are measured when the turbidity of water is measured.
Numerous studies have been carried out to determine whether ltered water turbidity can be used to indicate the removal of Cryptosporidium across a lter. ese studies have been carried out both in the laboratory and using full size lters. Researchers have added Cryptosporidium to the test lters and measured the di erence between the number of Cryptosporidium they added to the raw water prior to the lter and the number of Cryptosporidium they measured coming out of the lter.
ey also measured the turbidity of the ltered water. From all that research, they have been able to come up with log reduction values based on the turbidity of the ltered water for the di erent types of lters.
e log reduction values for the removal of Cryptosporidium based on these experiments and the measured turbidity of the ltered water are shown in Table 3, which has been adapted from the National Health and Medical Research Council’s (NHMRC’s) 2016 discussion paper on microbial HBTs.
e log reduction values in the table only apply if the listed turbidity targets are rigorously met. Achieving these default values requires lters to be optimised and very well maintained. Coagulation also needs to be optimised for turbidity removal and removal of NOM (natural organic matter).
Many waterborne disease outbreaks have been caused by poorly operated lters, or lters that are in poor condition.
Taking the example of a conventional WTP, Table 3 shows that if each individual lter has a ltered water turbidity of <0.3 NTU for 95% of the month, and the turbidity is not greater than 0.5 NTU for 15 consecutive minutes during that month, then the lter is assumed to be removing 99.9% (3 log) of the Cryptosporidium from the raw water. erefore, using this log reduction information based on turbidity of the ltered water from individual lters, it is possible to work out what level of lter performance is required for a particular number of Cryptosporidium in the raw water. is then shows the link between the microbial HBT for Cryptosporidium and the post- lter turbidity performance of the lter.
It is important to note, however, that while these gures are convenient to use, studies using real WTP lters have shown quite an amount of variability in the log reduction values that have been achieved, even at the same ltered water turbidity. What this means is that all WTPs should be optimised and operated to achieve the absolute lowest possible turbidity out of each lter at all times.
If a raw water source were category 3 and therefore required 3.5 log removal of Cryptosporidium, then the WTP either needs to have lter performance such that the individual lter water turbidity ≤0.2 NTU for 95% of the month and not >0.5 NTU for 15 consecutive minutes, or an additional treatment step, such as UV, needs to be added to the water treatment plant in order to achieve the required microbial HBT. If it were a Category 4 source requiring log 5.5 reduction this cannot be achieved by media ltration.
Hopefully this article has helped to explain where all the numbers come from, so that you now have a basic understanding of DALYs, how online plant measurements such as UV dose and post- lter turbidity levels relate to microbial HBTs, and the acceptable risk to the community that people might become ill from drinking water.
Even if all the calculations are confusing, the really important message is that operating treatment processes to the targets that are set (for example, operating lters at or below <0.1 NTU
Individual filter water turbidity ≤0.3 NTU for 95% of the month and not >0.5 NTU for 15 consecutive minutes. 3.0
Individual filter water turbidity ≤0.2 NTU for 95% of the month and not >0.5 NTU for 15 consecutive minutes.
3.5
Individual filter water turbidity ≤0.15 NTU for 95% of month and not >0.3 NTU for 15 consecutive minutes.
Individual filter water turbidity ≤0.3 NTU for 95% of the month and not >0.5 NTU for 15 consecutive minutes.
3.5
Conventional Filtration(2) or Dissolved Air Flotation followed by media filtration (DAFF) 3.0
4.0
Individual filter water turbidity ≤0.2 NTU for 95% of the month and not >0.5 NTU for 15 consecutive minutes.
Individual filter water turbidity ≤0.15 NTU for 95% of month and not >0.3 NTU for 15 consecutive minutes.
(1) Direct filtration incorporates coagulation and flocculation without sedimentation/clarification followed by filtration
(2) Conventional filtration incorporates coagulation, flocculation and sedimentation/clarification followed by filtration
continuously) is extremely important for the production of safe drinking water, and this should be possible at most Australian WTPs (Figure 2).
Additional Reading
WSAA (2015). Manual for the application of health-based targets for drinking water safety. September 2015. Available at https://www.wsaa. asn.au/publication/health-based-targets-manual
e Authors
David Sheehan (david.sheehan@coliban. com.au) is General Manager, Water Quality Performance and Regulation at Coliban Water in central Victoria.
Kim Mosse (kim.mosse@melbournewater. com.au) is Team Leader, Quality and Process Improvement, Water Supply Operations at Melbourne Water.
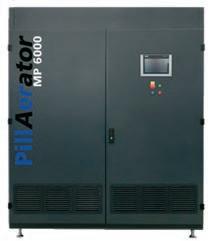
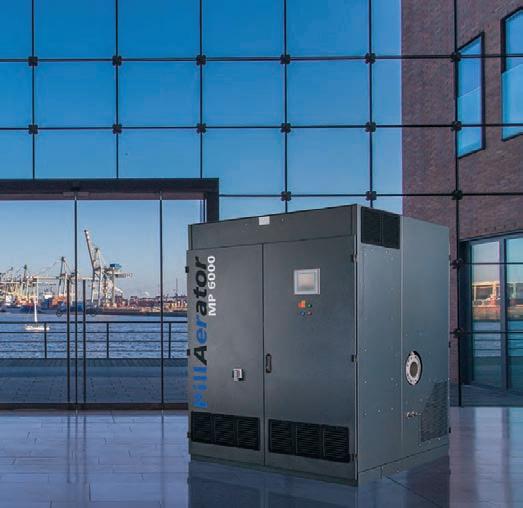
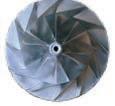
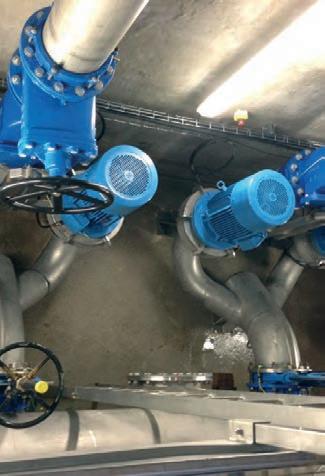
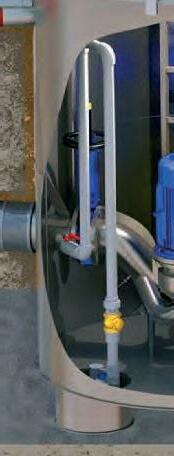
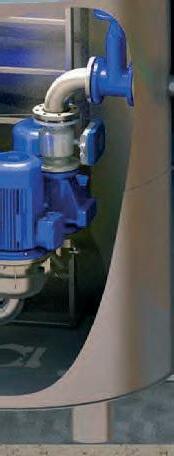
The aeration aspect of aeration tanks is a significant cost factor, due to its high energy demand; however, the use of state-of-the-art magnetic-bearing turbo compressors can drastically reduce power consumption and the associated operating costs.
Positive displacement blowers (PD blowers) were once widely used for the production of process air, as these types of blowers have been available for decades and exhibit robust technology; however, these technical dinosaurs are now completely outdated and their technology antiquated. Increasingly, they are being replaced by modern variable-frequency drive (VFD) controlled turbo compressors. e life cycle costs of a typical process air application can be reduced enormously compared to conventional PD blowers when using a PillAerator. ese savings in energy costs help to reduce your electricity bill and carbon footprint. e investment in a magnetic-bearing turbo will pay for itself within two to three years, despite an initial investment two to three times higher than that for a PD blower.
Turbos – same but different
In addition to magnetic-bearing compressors, there are also mechanical and air-bearing turbos on the market. ese turbos are also energy efficient, but come with technical disadvantages, such as frequent maintenance intervals. Intermittent operation is usually impossible.
Head of the PillAerator research and development department omas Abrams
describes what characterises a magneticbearing turbo compressor.
‘It’s like magic! Our vertically arranged drive shaft connected to the impeller levitates, contact-free, in a magnetic field. In order to achieve this, imagine a metal rod with annular permanent magnets and electromagnets arranged around it,’ Abrams says.
‘ ese magnets keep the shaft contactfree, and permit only one movement around the axis of rotation, so that wear-prone components are omitted. e motor is gastight and cannot be contaminated by the ambient air. is increases the machine’s operational safety, availability and operational life for the operator.’
What are the specific advantages?
‘ e advantages of a magnetic-bearing
compressor are evident, due to the fact that the shaft always runs at the centre of mass, and is therefore vibration-free. It requires no lubricant, since it is contactfree. Even frequent start-and-stop processes are possible without wear,’ Abrams says. ‘When shutting down, the shaft is guided to a standstill in the magnetic field. In the unlikely event that the magnetic-bearing electronics fail, the shaft is safely led to a standstill by safety bearings.
‘ is means that the plant operator is buying a wear-free and maintenancefree motor.
‘Only the air filters have to be replaced, depending on the degree of contamination of the air. And this is so simple that the customer can do it themselves.’ e PillAerator needs no more service than that!


Magnetic Bearing Turbo Compressors


Magnetic Bearing Turbo Compressors
Magnetic Bearing Turbo Compressors
EFFICIENCY
Up to 84%

PLUG & PLAY
Simplest integration
Magnetic
ECONOMICAL aintenance free motor Industry frequency sound
EFFICIENCY
EFFICIENCY
Up to 84%
Up to 84%
SAFE Intelligent control & diagnostics

PLUG & PLAY
PLUG & PLAY
ECONOMICAL
Simplest integration
Simplest integration
ALL IN ONE All-Inclusive
ALL IN ONE All-Inclusive
Oil & maintenance free motor
SAFE Intelligent control & diagnostics
SAFE Intelligent control & diagnostics
Industry 4.0-ready, IoT-ready, PLC, frequency converter, instrumentation, sound insulation, water cooling, ...
Industry 4.0-ready, IoT-ready, PLC, frequency converter, instrumentation, sound insulation, water cooling, ...
Ovivo may not be an easily recognisable brand name in the municipal market in Australia, but we know our heritage brands are.
Any company who owns Brackett Green, Jones + Attwood, Eimco Water Technologies, Goema, Copa, Christ Water Technology, UTS, Kennicott, Caird & Rayner and Enviroquip can claim to be one of the leading global suppliers to the municipal industry.
Ovivo’s expertise is applicable to all areas of municipal water treatment – both potable water and wastewater. is is evidenced by Ovivo’s recent supply of Brackett Green band screens to the Koorlong, Barwon and Gympie sewerage treatment plants.
Ovivo is capable of designing band screens specifically suited to clients’ requirements. Our local service team of engineers and trade-qualified personnel allows us to provide spares and service for all our equipment. Ovivo Australia also regularly refurbishes equipment such as
band screens in-house, as will be the case with Koorlong.
Ovivo’s extensive project records allow our service team to locate your installation
rapidly, and provide efficient appropriate spares and service. Ovivo can provide this service in every state and territory of Australia.


Bill Constable
e aeration system at the Tamworth Regional Council’s Westdale Wastewater Treatment Plant (WWTP) was nearing its life expectancy and performance was beginning to wane. With every minor failure in equipment, another bank of di users needed to be turned o , further reducing the plant’s aeration capacity.
e method of attaching the original di users with grommets had resulted in some di users detaching from the lateral pipes. is allowed activated sludge to ow into the lateral air pipes and then be pushed through other di users partially blocking them. e di users needed to be replaced.
Westdale WWTP services domestic and industrial wastewater customers and is a 14.8 megalitres (ML) per day ADWF plant. Industrial customers, mostly food processing, all have onsite treatment and contribute roughly 4ML per day to the total.
An upgrade was completed in 2011 and included 4 new Intermittently Decanted Aeration Lagoons (IDALs). Each IDAL consists of 5 banks of air, each bank has 10 lateral air pipes o the header pipe and every lateral pipe has 40 disk di users (Figure 1). In short, there are 50 lateral
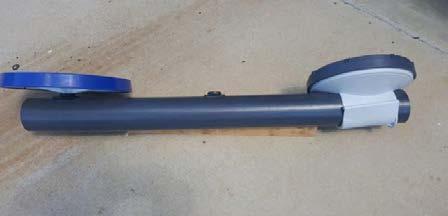
rows of pipes about 17 metres long with a total of 2000 di users in each tank. ese pipes are raised o the oor with roughly 140 mm clearance at the shallow sides to about 300 mm along the centre channel. e tender for the replacement of the di users called for a maximum Standard Oxygen Transfer Rate (SOTR) of 700 kg of oxygen per hour per IDAL and to remove the grommet method of attachment. e accepted tender uses a saddle type bracket for the di user, which locks around the pipe removing the risk the grommet type attachment presented (Figure 2).
It was decided that our operations team would install the new di users.
To carry out the replacement works, each IDAL was emptied and cleaned to allow easy access to the oor area. Before an IDAL was taken o ine, the Mixed Liquor Suspended Solids (MLSS) was reduced in the week before cleaning by sending extra Waste Activated Sludge (WAS) to the sludge lagoons. For the next 3 IDALs, the extra WAS was used to seed the previous IDAL now with new di users.
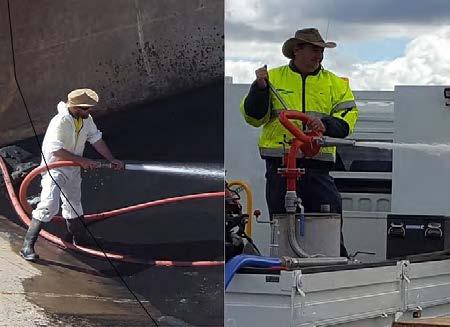
Each IDAL took around 2 weeks to clean adequately down to the oor with the use of lay at hoses and a ‘water cannon’ (Figure 3). e water cannon was purchased after the cleaning of the rst IDAL and made a huge di erence to the time of hosing out by helping operators control the angle and concentrate the ow of water. Sludge was hard to fully hose out between the brackets and pipes, so once the sludge levels were almost to the oor and all the di user pipes exposed, the focus shifted to pipe removal.
When all the lateral pipes had been removed, all remaining sludge was hosed down to the channel and sump. IDAL 1 was to be used for SOTR testing so extra time was spent with high-pressure hoses cleaning back to concrete to reduce any potential e ect on the testing. ere was a decent amount of rag build up on brackets through each IDAL. Most of this was removed by high-pressure jetting. A hoe was used to push larger build-ups o brackets and shovelling the material into a skip bin. On a side note, wet rag was heavier but easier to push and break o brackets, whereas dry rag seemed to cling a lot more.
Once most of the activated sludge was removed, and to make cleaning of the tank easier, we arranged for a local crane company to lift out the old di users and pipes as well as put in place our access steps. is involved wearing waders and undoing all the top brackets o the pipework and disconnecting the lateral pipes from the header pipes. For the rst 2 IDALs we lifted the pipes out as full lengths but as we progressed to IDAL 3 and 4 we cut them in half and then in thirds. Moving the full lengths (roughly 17 metres) was awkward and cumbersome. e shorter lengths were a lot easier for sta and the crane operators to manoeuvre and handle.
With the oor clean and the old pipes out of the way, all the new equipment could easily be installed. Each new lateral consisted of 4 lengths of PVC pipes with each pipe containing 10 already tted di users. e pre-assembled aeration pipework arrived in 5-metre-long pallet boxes and within a few hours of the boxes being lifted into the IDAL, all of the
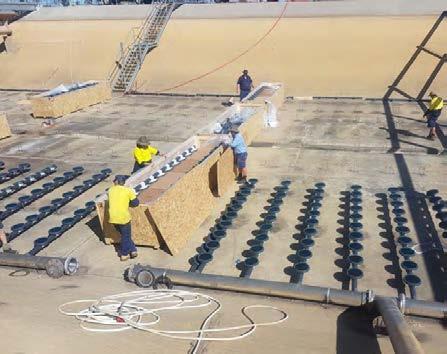
pipework was sitting in position on the existing brackets ready for the boxes to be removed out of the way (Figure 4).
e pipes were joined with PVC couplings that included rubber seals. With the new pipework, each lateral set of pipes was also joined by manifold piping at the tail end. Also, part of the new installation required more pipe brackets to reduce sag and bowing of pipes. In total there were 5 more brackets per lateral installed to distribute the load.
Drilling, tapping in the anchors and screwing in the threaded rods was very time consuming and chewed through many a rechargeable battery for our hammer drill. All of the brackets are supported on threaded rods so with downtime between IDALs a lot of these rods were prepared with nuts, washers and brackets saving time during the actual installation. All of the rods required tightening into the threaded anchors before adjusting the levels of the brackets.
A laser level was used to level the brackets by raising and lowering the bracket (unless lucky enough for it to be level to start) to level the di users across the IDAL. In many cases, 2 turns of a nut here and 3 there were juggled until all 680 sets of brackets per IDAL were level (13 sets per lateral – 8 old and 5 new plus 30 on the manifolds).
Once all the brackets were levelled, the di users were levelled so they were sitting at and then tightened down. Due
to the length of the new bracket rods an ‘extension’ socket was devised using PVC pipe and a normal socket to spin the nuts most of the way down the rod, saving a lot of time and fatigue.
When we got 2720 nuts per IDAL (and I’m sure hallucinations) down the track and it was all over – nearly.
One nal job was left: to check the tension of all the di users with a special di user tightening tool. 2000 adjustments later and we’re nished.
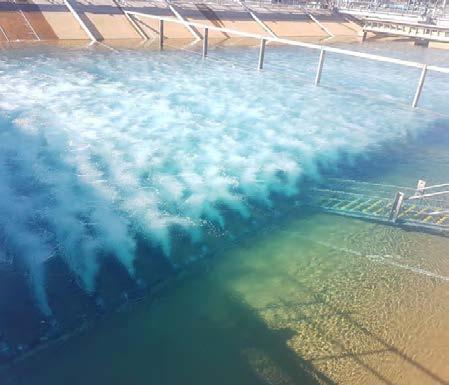
Now we get to test all the hard work we’ve done for the last 3–4 weeks. After running potable water into the rst IDAL, it’s time to crack open the air valve gently and just a little bit (Figure 5).
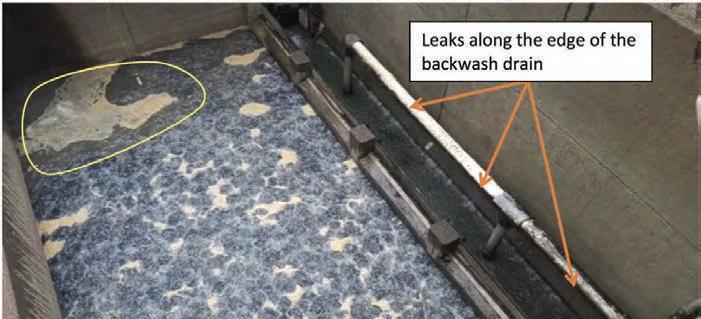
Alas there are a few leaks here and there, most xed with a gentle tap and adjustment of a joiner or occasionally the installation of a new di user unit, but there were a few bigger issues with some of the header pipes.
e biggest problem encountered during the installation was with the header pipes. e original pipes are heavy wall PVC and over the 6 years in service they were sagging a little in the middle between the brackets. While this didn’t cause much concern initially, it was discovered during bubble testing that many in fact had small leaks (Figure 6). When the header pipes were unbolted, it was found that the lip holding the welded uni- ange on was cracked, and in some cases was all but broken o the header pipe. On some, the spigots o the header pipes also had small leaks where they had been welded.
For the rst IDAL (not knowing the extent of the issue in the other 3 IDALs) this header pipe was repaired using the existing pipe and a new uni- ange.
In the second IDAL, one header pipe was replaced with a complete stainless steel pipe as the original couldn’t be repaired easily.
e third IDAL saw the worst 3, these were the most distorted header pipes that were replaced, but bubble testing later revealed more leaks on the remaining header pipes, so 4 more were replaced with stainless steel pipes.
e fourth IDAL saw all the PVC header pipes replaced with stainless steel.
All the remaining PVC header pipes are now programmed to be replaced with stainless steel if or when that particular IDAL is o ine and emptied. is will minimise pipe failure and increase the working life of the overall aeration system.
e Author
Bill Constable (w.constable@tamworth. nsw.gov.au) is the Process Operator at the Tamworth Regional Council’s Westdale Wastewater Treatment Plant in New South Wales.

In July–September 1998, Sydney experienced a water quality crisis involving suspected contamination by the pathogens Cryptosporidium and Giardia in the water supply system.
Following the crisis, many stakeholders came together to develop a comprehensive response to minimise the chance of such an event happening again. One of the recommendations was the adoption of the Hazard Analysis and Critical Control Points (HACCP) concept of water quality, which was already operating successfully in the pharmaceutical industry. HACCP is now rmly established in the water industry, and is driven by many passionate leaders to ensure that customers’ safety remains paramount. No-one wants to see a repeat of 1998.
e basic concept of the HACCP is that safety and quality are likely to be far more e ective when a proactive risk management approach is taken, rather than relying only on end-point testing when it may be too late to take corrective action.
One area of the water cycle that bene ts from this approach is the reticulation
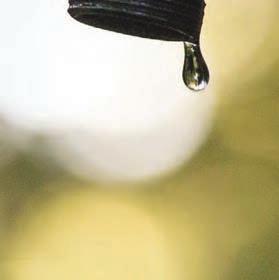
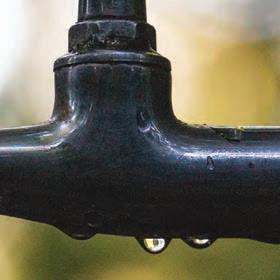
system, where there is the possibility of contamination of supply, either when a new mains line is being commissioned or in the event of a mains break.
In such situations, even though the system will have been disinfected beforehand, the available chlorine residual may be insu cient to manage signi cant microbiological contamination and may pose a risk to public health. To manage this risk, adequate chlorine residuals must be maintained across the entire system. To accomplish this, accurate onsite measurement of the chlorine residual is vital.
Turbidity is also very important in reticulation system monitoring; however, turbidity can have both water safety and aesthetic implications for drinking water supplies. Turbidity itself does not always represent a direct risk to public health. It can indicate the potential presence of pathogenic microorganisms, and be an e ective indicator of hazardous events throughout the water supply system. Turbidity measurement can provide a quick check of microbial ingress, which
could be later con rmed by a sample taken to a laboratory for pathogen analysis.
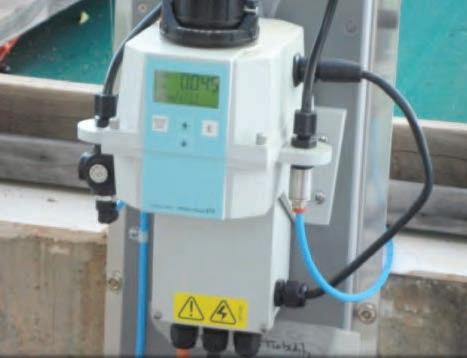
A novel instrument for reticulation monitoring
Hanna Instruments HI93414 combines turbidity and chlorine residual measurements in one meter.
e optical system follows the United States Environmental Protection Agency–approved method, measuring chlorine and nephelometric turbidity in the range required for potable water quality compliance.
Robust enough for eld measurements, this meter enables operators to meet the demands of a mains break or new main installation. Reagents and standard solutions are non-toxic and important in eld testing. e HI93414 has data logging and good laboratory practice (GLP) information that can be uploaded to a computer for traceability.
e real bene t to the operator is that, instead of carrying around two meters, all can be accomplished in one compact meter. For more information, contact Philip Edwards at Hanna Instruments on 03 9769 0666 or visit hannainst.com.au.


• Three Measurement Modes (Turbidity, Free, Total Chlorine)
• Non Toxic Primary Standards with long shelf life
• Data logging and data download via USB interface
• i-Buttons for easy ID location tagging

• EPA Compliant measurement for all parameters
• Ideal for Reticulation Mains Monitoring Applications
personnel involved in the operation and maintenance of rural and industrial water related infrastructure for the management, conveyance, treatment, discharge and reuse of and trade wastes should attend these conferences.
stages annual conference in NSW, Queensland and Victoria, providing a forum for individuals involved in water operations to:
Listen and learn from the experience of others through the latest “operational” technical and research based information provided in platform and presentations.
View and discuss the latest advances in technical equipment, products equipment manufacturers, suppliers and industry consultants
All personnel involved in the operation and maintenance of urban, rural and industrial water related infrastructure for the management, conveyance, treatment, discharge and reuse of water and trade wastes should attend these conferences.
WIOA stages annual conference in NSW, Queensland and Victoria, providing a forum for individuals involved in water operations to:
• Listen and learn from the experience of others through the latest “operational” technical and research based information provided in platform and poster presentations.

Update their knowledge and skills through interaction with fellow water
• View and discuss the latest advances in technical equipment, products and services with equipment manufacturers, suppliers and industry consultants
• Update their knowledge and skills through interaction with fellow water industry employees.


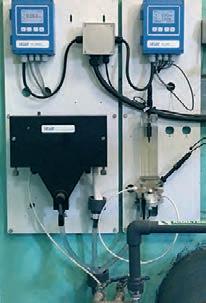
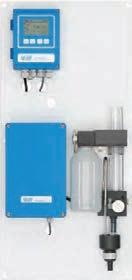
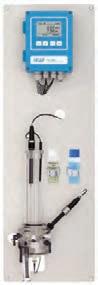
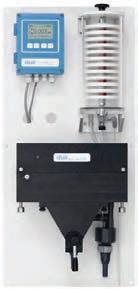
Trevor Wallace, a water treatment sales representative at Dowdens Pumping and Water, has the following insights into the SWAN Analytical Instruments products.
Installation
Installation and calibration are a dream. e turbidity meters are a simple plugand-play system, and the chlorine and pH units are very user-friendly to calibrate.
Programming e controller menu is also easy to navigate.
Maintenance
Maintenance is very quick and simple. e AMI Trides units take about three to five minutes to clean.
Once again, we have found the SWAN Analytical Instruments units very operatorfriendly. We have installed quite a number of units throughout the Isaac Regional Council districts, and have received great feedback from the operators in regard to the maintenance and operation of the units.
Dowdens has every confidence in the SWAN Analytical Instruments brand, and I would not hesitate to recommend them. For more information, call 07 4969 4949, email info@dowdens.com.au, or visit www.dowdens.com.au.


Greg Moxham is a long-time Simmonds & Bristow (S&B) operator, who wants to give you the inside scoop on what his job is really like. Greg supports a turn-key plant operate-and-maintain site. He is responsible for keeping it running, including carrying out repairs and maintenance.
When asked what sets S&B operators apart, Greg says, ‘On-the-ground knowledge. We come in with experience, knowing the ways that plants tend to behave. We’re able to foresee events and stop them – or at least get ahead of them’.
Greg knows he can rely on the S&B head office team to back him up and offer support. ‘ e trainers, the other
operators, the engineers, the scientists. We can ask them whatever we need to.’
To potential S&B operators, Greg says: ‘I want other operators to know that, at S&B, operators’ voices and ideas are respected. Our opinions are asked and we collaborate with the engineers, the scientists and the trainers. at isn’t always the case across the industry.’
As for potential clients, he says: ‘We will work hard to keep you happy. We understand that you’re the one that ultimately pays our wages and we want to do right by you’.
For more information, contact Greg and the team at info@simmondsbristow.com.au.


Kelly Newton, Claire McInnes and Gayle Newcombe
While treatment plants are often designed, or modi ed, to remove cyanobacteria (often termed blue-green algae) and their metabolites, it is di cult to pinpoint which unit processes are working e ectively, or not, their individual contribution to removal and in what modes, biological or physical, they are operating.
To address these issues and to better understand Water Treatment Plant (WTP) performance, a plant-testing procedure was developed. e procedure involves identifying points before and after each unit treatment process where samples can be taken for metabolites and other water quality parameters. Importantly, samples must be taken from the same batch of water as it passes through the treatment plant in order to obtain a true representation of what is occurring throughout the plant.
e e ectiveness of the plant-testing program is highlighted in a recent geosmin challenge to the Myponga WTP in South Australia. In early 2017, more than 200 ng/L of geosmin – 50–70 ng/L of which was extracellular (dissolved) – was entering the WTP, and, despite Powdered Activated Carbon (PAC) dosing of between 20 and 30 mg/L, 25–50 ng/L of geosmin was entering the distribution system. e detection threshold for human beings is around 10 ng/L. While no customer complaints were recorded, there was proactive noti cation of the community using social and traditional media channels, which elicited a strong customer response on social media.
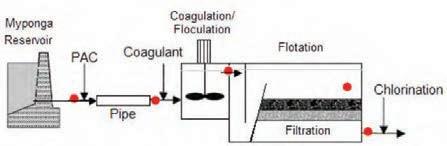
Initially, it was thought the PAC was not working e ectively, so laboratory testing was undertaken to determine whether this was the case. Ultimately, it proved the PAC was working e ectively. A detailed study of the Dissolved Air Flotation (DAF) plant was conducted over three days at the height of the event. Samples for total and dissolved geosmin, and the organism responsible for geosmin production, Dolichospermum circinale, were taken from the raw water and after each step in the treatment process (Figure 1).
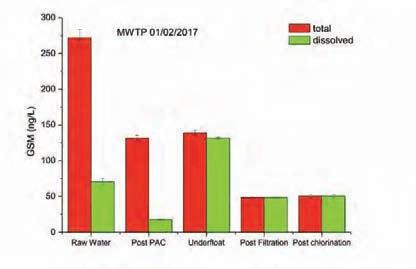
Testing revealed that most, 150– 200 ng/L, of the geosmin entering the plant was intracellular (inside the cells) with 50–70 ng/L extracellular (released outside the cells). e PAC was removing between 72–84% of extracellular geosmin (Figure 2). e large decrease in total geosmin indicates that intracellular geosmin was being released from the cells in the pipeline from the inlet to the plant where the PAC is dosed, thus bringing the reduction of geosmin by PAC up to 87–91%.
e plant was dosing PAC at a concentration of 30 mg/L. e di erence between the two column heights in Figure 2 represents the intracellular concentration. While the raw water concentration di ered between the three sampling dates, the trends in removal were identical.
Samples taken from the DAF under oat revealed 100% of remaining geosmin in the plant was extracellular, indicating that D. circinale cells were lysing in the otation tank resulting in the increase in geosmin in the oated water. is was interesting because it has long been held that DAF removes cells without releasing toxins or other intracellular compounds. e cause of the cell lysis was not clear; it may have been due to a number of factors, including turbulence, abrasion and overall cell health.
Samples taken after the lters showed a decrease in geosmin of 65%, indicating possible biological removal, where the microbial community present on the lter media is able to degrade algal metabolites. is had not been observed previously in the lters at the site.
Important to note is the combination of events occurring within the WTP, both positive (i.e. PAC e ectiveness combined with bio ltration) and negative (cell lysis), which led to high geosmin concentrations that would not have been discovered through routine sampling of the raw and outlet water only.
A simple-to-use, Excel-based tool has been developed to estimate removal of cyanobacterial metabolites through each individual unit process of a WTP. e Cyanobacteria Risk Assessment Support Tool (CRAST) was developed based on laboratory data and modelling of South Australian water and conditions. CRAST only requires knowledge of dissolved and intracellular metabolite concentrations, PAC dose and chlorine (Ct value) for toxins to be entered into the CRAST spreadsheet. As with any model, CRAST makes a number of assumptions.
• When PAC is used, there is a contact time of 30 minutes prior to the addition of coagulant.
• e removal of the metabolites by PAC is the same in all water quality.
• e PAC used is the equivalent of
Activated Carbon Technologies’ PS1000F for MIB and geosmin, and PS1000 for saxitoxins, cylindrospermopsin and microcystin LR and LA.
• PAC adsorption will achieve the same removal of metabolites as in the laboratory.
• PAC application removes only dissolved metabolites, and does not a ect the intracellular component.
• e removal of the cyanobacteria through coagulation is constant at 95% regardless of the type of cyanobacteria, coagulant or clari cation process.
• Coagulation and clari cation does not a ect the concentration of dissolved metabolites.
• Filtration does not remove dissolved metabolites or uncoagulated cells. It is assumed that any uncoagulated cells will lyse and add to the remaining dissolved component.
• Chlorination will achieve the same oxidation of toxins as in the laboratory.
• e removal of the cyanotoxins by chlorination are the same in all water quality.
Plant data obtained during the February 2017 event at Myponga WTP was used to test CRAST (Table 1).
e predictions from CRAST displayed larger deviation from the actual values recorded. is is likely due to the damage to the cells and the release of intracellular metabolites within the otation tank; however, the nal value was not too far removed due to the potential biological ltration occurring on the lters. CRAST was also applied to other plants where testing had occurred during metabolite challenges. CRAST was better able to predict geosmin concentrations (Table 2 and 3) in these other plants.
Figure 3 shows comparative data for 27 water treatment plants.
Where the ‘Predicted – actual (ng/L)’ value on the vertical axis is 0, this indicates no di erence between CRAST predictions and the measured metabolite concentrations taken during testing in that WTP. Where the ‘Predicted – actual (ng/L)’ value on the vertical axis is a positive value, this indicates the actual measured metabolite concentrations were better than CRAST predicted. Where the ‘Predicted – actual (ng/L)’ value on the vertical axis is a negative value, this indicates the actual measured metabolite concentrations were worse than CRAST predicted.
Analysis of the 27 plants and associated CRAST predictions showed good agreement between the results of the actual in-plant testing and the tool (Figure 3).
Table 3. Geosmin concentrations ng/L (average of duplicates) at strategic points of Camperdown WTP. Note that there was no sample point after the PAC dosing point so there is no data relating to that process step in the actual data measured at the plant.
v Metabolite
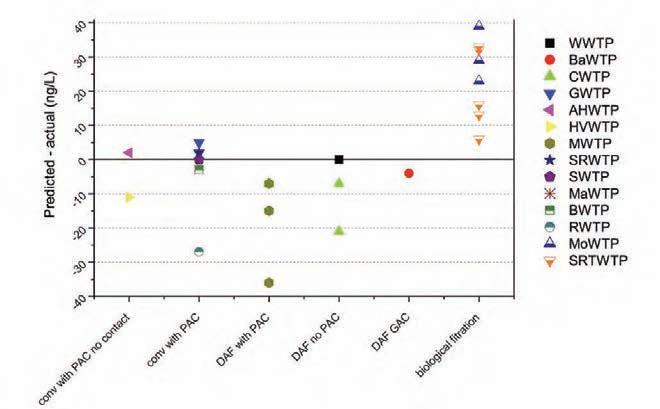
Figure 3. Representation of the difference between the measured metabolite concentrations in the treated water and the concentration predicted by the CRAST for 27 water treatment plants.
Plants known to achieve e ective removal by biological ltration (MoWTP and SRTWTP in Figure 3) displayed the greatest deviation from the predicted values in the nal product water as the values in the treated water were below detection regardless of the lter inlet concentration. When the concentrations in all of the plants were compared prior to the ltration stage, the results were in general very good, with a few exceptions. For example, Myponga WTP displayed a greater variation from predicted as the lters
appeared to remove a large percentage of the metabolites.
CRAST can be used as a good general guide at di erent locations, however, because of the assumptions listed above, CRAST may tend to overestimate the removal of metabolites. For more accurate predictions, the basic CRAST model can be modi ed for each WTP based on its speci c conditions and some speci c data from the plant.
CRAST can help the water industry by improving knowledge of WTP performance in this important area, and
thereby contribute to lower risk and better aesthetic water quality for customers.
A copy of the CRAST tool can be obtained from Water Research Australia.
e Authors
Claire McInnes (Claire.McInnes@waterra. com.au) is Senior Research Manager with Water Research Australia. Kelly Newton (Kelly.Newton@sawater.com.au) is a scientist with SA Water, and Gayle Newcombe, previously a Research Program Manager, has recently retired after 29 years with SA Water.
Winner of the Best Paper Overall at the 2018 WIOA NSW Operations Conference
omas
Lennox Head is located approximately 20 kilometres south of Byron Bay on the picturesque far north coast of New South Wales. During the early 1980s, the town received a reticulated sewerage system along with the construction of twin 4,000 EP Intermittent Decant Extended Aeration (IDEA) or ‘Bathurst Box’ plants. e plant discharges via an ocean outfall at the low tide mark of Boulders Beach. Constant population growth meant that, by the early 1990s, the capacity was increased with the installation of an additional 10,000 EP IDEA with UV disinfection pre-treatment added to the original ocean outfall.
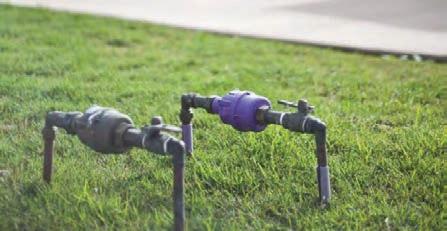
During Council’s master planning phase in the early 2000s, expansion of the existing ocean outfall was identi ed. However, due to public resistance to this proposal (Boulders Beach being a popular sur ng beach) and a community priority for better environmental outcomes, Council adopted a master plan that advocated the creation of two dual urban reticulated recycled water schemes in 2003 (Figure 1).
is master plan speci ed 80% water re-use within the Shire by 2026, with all future developments in Lennox Head and Ballina being built to accept dual urban reticulated recycled water as de ned by the Australian Guidelines for Water Recycling (AGWR). In terms of the e ects on the individual dwellings attached to the scheme, this meant that the laundry cold water washing machine tap, all toilet cisterns and all but one external tap were plumbed to the recycled water main through a separate recycled water meter.
e Ballina and Lennox Head Recycled Water Schemes were by far Ballina Shire Council’s largest capital works project and, at project completion, the schemes will supply approximately 7,200 houses with dual urban reticulated recycled water from two discrete recycled water treatment plants (Ballina and Lennox Head).
To meet the water quality requirements speci ed by the AGRW for dual urban reticulated recycled water (Table 1), a
major upgrade of the existing Lennox Head Wastewater Treatment Plant (WWTP) was required. ese works focused on the addition of a separate recycled water process train parallel to the existing ocean outfall stream. is was an important feature of the Lennox Head Treatment Plant design; allowing the balance between plant in ow and recycled water demand to be discharged through the existing ocean outfall.
e Lennox Head Recycled Water Process Train consists of an ultra- ltration
module (Pall Aria™ AP-6) followed by ultraviolet disinfection (TrojanUVFit™ 18AL40) and chlorine disinfection using sodium hypochlorite (125 kL Chlorine Contact Tank). e plant operates at a peak instantaneous ow of 40 L/s, with the log reduction performance described in Table 2.
e implementation of a Hazard Analysis Critical Control Point (HACCP) approach is suggested in the AGWR as a suitable risk management approach to ensuring continuous adherence to the required log reduction values.
Ballina Shire Council invested signi cant time and e ort streamlining the Critical Control Points and parameters to determine the fewest parameters able to ensure safe production (Table 3).
Too few critical control parameters can result in a lack of system control (plant performance cannot be guaranteed); with too many however, the process will become over-controlled resulting in unreliability and preventing the system from operating unnecessarily.
All control parameters that were identi ed as non-critical but were still required to operate the plant were de ned as Quality Control Parameters and are listed in Table 4.
ough Council had existing recycled water schemes operating for agricultural re-use and sporting elds, the higher exposure risks associated with dual urban reticulation meant a complete redevelopment of Council’s accompanying systems and policies.
is included the creation of a new Recycled Water Management System in keeping with the twelve elements outlined by the AGWR, an Incident Management Plan and also the implementation of an 88E Positive Covenant, requiring all new dwellings in dual reticulated areas to be compliant with Council’s Dual Water Supply Plumbing Policy.
is policy requires dual reticulated residential properties to ensure that:
• All plumbing works be conducted by a licensed plumber in accordance with the Plumbing and Drainage Act 2011 (NSW) and AS/NZS 3500.
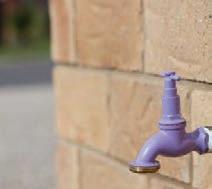
• Fixtures and ttings above and below ground must be clearly marked and labelled with ‘Recycled Water – DO NOT DRINK’ in accordance with AS/ NZS 3500 (Figure 2).
• Any underground recycled water pipeline must not be installed within 300 mm of a parallel drinking water supply pipeline. is separation can be reduced to 100 mm when pipes are located above ground.
• Above-ground recycled water hose taps must be lilac in colour (Figure 2), have approved ttings with left-handed threads on the outlets and removable handles as per AS/NZS 3500.
• Dual reticulated properties must have at least one external recycled water tap but can have more as desired.
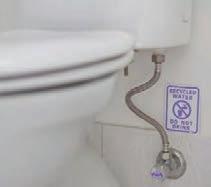
• All toilets (Figure 3) and cold water washing machine taps must be connected to the recycled water supply line.
Consistent with an equivalent drinking water process, the AGWR supports a riskbased framework for managing schemes and systems. e biggest risk for any dual reticulated recycled water scheme is the possible cross-connection between drinking water and recycled water, either within the reticulation or more likely within individual dwellings.
Satisfactorily managing this risk is one of the biggest ongoing operational challenges
faced by operators of these schemes. Ballina Shire Council addresses this risk through a number of complimentary strategies.
• Regulator plumbing audits (preoccupancy certi cate, every 5 years and upon sale of the property).
• Quarterly pressure testing of both recycled and drinking water mains in dual reticulated areas.
• Meeting Australian Drinking Water Guidelines (ADWG) requirements on the recycled water. Ballina Shire Council does not allow the use of recycled water outside of its approved uses, but instead treats the water to this level to mitigate risks associated with scheme cross-connections.
Prior to launch of the scheme, Council also developed a communication strategy to ensure that all key stakeholders were aware of the acceptable uses for dual urban reticulated recycled water. is was especially critical as at the time in far northern New South Wales there were no comparable schemes. is meant that required consumer behaviours were not well understood.
Council addressed this through the following methods:
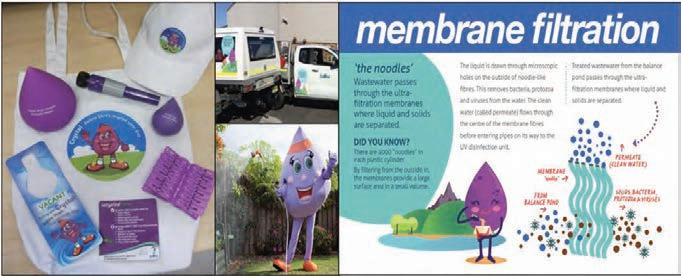
• Supplying new occupants with information packs (Figure 4).
• Supplying factsheets to key stakeholders.
• Development of a Ballina Water website.
• Installation of treatment plant tour signage and promotion of community, university and school tours.
• Development of FAQs for frontline sta .
Supply of recycled water into the scheme commenced on 1 July 2016. is date was chosen as it nicely coincided with a new billing quarter (recycled water is charged in Ballina Shire Council at 80% of the drinking water tari ), as well as the approval of Section 60(c) and the completion of all outstanding plumbing audits.
Operation of the scheme commenced with the removal of cross connections that had fed drinking water into recycled water mains. Barring a couple of minor issues,
within a couple of days all eligible dwellings were connected to the live scheme.
e transition from launch to businessas-usual operations has gone relatively smoothly. at said, there have been a number of water quality issues that Council has been managing over the rst 12 months.
1. Free Chlorine and Trihalomethanes (THMs)
Due to relatively few connections (only approximately 10% of the nal number) and elevated concentrations of Dissolved Organic Carbon (DOC) in the recycled water, managing free chlorine residuals has been the biggest issue with the scheme so far.
Some parts of the reticulation currently have hydraulic retention times in excess of 7 days. So, chlorination is a constant balance between maintaining adequate chlorine residuals in the extremities of the reticulation whilst meeting the ADWG requirements for THMs (chlorination by-products). is is currently managed through re-chlorination in select reservoirs and routine system ushing, especially in the under-utilised (high hydraulic retention times) parts of the reticulation.
2. Hardness
is is mostly due to the softness of the existing drinking water supply, typically 30–60 mg CaCO3/L. Even though the recycled water is only moderately hard at 80–110 mg CaCO3/L, the contrast is noticeable enough for some residences
to complain about white streaks left on glass. Council has managed this through promotion of hand drying rather than evaporation when using recycled water for window cleaning.
3. Demand Management
Even though approximately 700 dwellings were connected to the scheme at launch, the vast majority of demand comes from local sporting elds, especially the East Ballina Golf Course. is means that the demand on the scheme is still very weather dependent, ranging from less than 50 kL/d to 2.5 ML/day depending on rainfall. is is expected to stabilise over the coming years as more dwellings are connected to the scheme.
e successful introduction of the recycled water scheme in Lennox Head has been due to a number of factors.
• E ective management of the crossconnection risk through 88E Positive Covenant on scheme dwellings, regular plumbing audits and high waterquality requirements.
• Streamlined HACCP approach allowing for only ve critical control parameters.
• Supply redundancy through drinking water top-up facilities within the scheme to guarantee supply.
e Author omas Lees, ( omas.Lees@ballina. nsw.gov.au) is a Treatment Plant Process Engineer with Ballina Shire Council in New South Wales.
For many years, wastewater has been collected in wet wells, located throughout municipalities. e hours and equipment used in cleaning and disposing of wet well trash, unclogging pumps, and hauling debris is expensive. is does not have to be the case any longer. A lift-station pumping system was developed that no longer holds raw sewage in a neighborhood, doesn’t emit hydrogen sul de (H2S) or any odour, and doesn’t collect wet wipes or other debris. is is achieved by continuous and modulated pumping of gravity e uent at the point of entry. What used to be wet wells are now clean, dry equipment rooms. is new liftstation pumping method, which is patented and proven with years of use, will end the waste that plagues every wastewater treatment operator in the rest of the world. is solution is being used in more than 1600 applications worldwide. e DIP system stands for ‘direct in-line pumping’, and features pumps that automatically clean themselves, maintain high e ciency (IE3 premium motors), shred the trash (using the DIPCut® impeller), self-regulate the ow required, and can be managed with a web application.


Being proactive is challenging for water utilities
Most water utilities in Victoria usually experience an increase in workload after a speci c combination of events. For example, when a particularly dry summer is followed by heavy rains in March, network operators know that they can expect a high number of bursts due to ground dilatation placing mechanical constraints on the pipes. Experienced operators could even identify the most critical areas of the network. Even better, with enough data on pressure from supervisory control and data acquisition (SCADA) readings, work order history and weather forecasts, seasoned sta may even be able to pinpoint the exact places where issues are bound to happen.
In practice, however, going through all of this data manually is highly timeconsuming, and water utilities do not have any other choice but to operate their network in a reactive, rather than proactive, way.
A recent computational technique is now able to teach computers to replicate the intuition of experienced operators. is technique, rightfully called ‘machine learning’, has been used by several as a business-as-usual tool for years, the most

emblematic use being for social networks to better understand the habits of their users. More valuable examples include its use in medical research. Scientists have recently proven that machine learning can be used to diagnose certain forms of cancer based on the automatic analysis of patient information, reproducing the thinking of experienced doctors. Based on these very promising results, Veolia believes that such tools could be applied to the water industry, and it is currently exploring how machine learning can help to better operate water and sewer networks.
ere is no magic in machine learning: providing random data to an algorithm that predicts when and where the next burst will occur is unlikely to predict accurate results. Two things are actually necessary for machine learning to work:
• A record of past issues: machines will train on the reports written by experienced operators over the years, which are needed to gain su cient insight to predict issues. Training on such a high amount of information should not take more than a few minutes for computers.
• Some data pre-processing: machines must be provided with only the
most relevant data for the issue of interest. For example, the amount of sewer blockages is typically impacted by weather conditions due to root growth. Detailed analysis, however, reveals that the highest temperature recorded six months before was the main factor contributing to the number of blockages. Accounting for more weather variables would unnecessarily increase computational costs.
Machine learning tools can theoretically predict everything that an experienced operator can guess, provided he has access to multiple data sources (and lots of time to analyse it). Examples include:
• the prediction of the number of issues on water/sewer assets in any given area of the network in the near future
• the probability of a work order being ‘behind the meter’ and not the responsibility of the water utility
• the detection of erroneous water bills
• the prediction of water quality issues
• the estimation of work handling time.
For more information, email Quentin Bechet at quentin.bechet@veolia.com.


It’s with yesterday’s old That we build a new tomorrow.


We rethink water through reuse, rethink waste through recycling and rethink energy through regeneration. Commi ed to driving improved sustainability outcomes for ourselves, our customers and our communities, Veolia will succeed in our global mission to Resource the World.

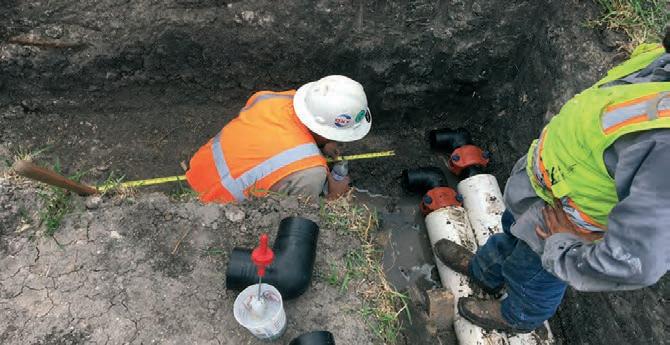
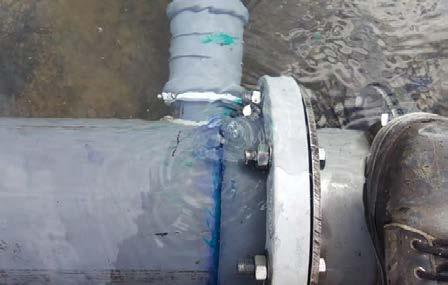
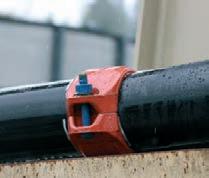
In response to the growth of highdensity polyethylene (HDPE) pipe across all markets, Victaulic™ has developed a mechanical system solution for HDPE piping. Strong and durable, the solution is starting to change the industry’s way of thinking about HDPE pipe joining. While mechanical joints are embraced in metallic piping applications, the market holds onto concerns about the performance and reliability of the technology for HDPE pipe.
While fusion has traditionally been seen as the ‘gold standard’ in strength and reliability, the integrity of fused joints is at the mercy of many variables. A fused joint is only as good as the technician operating the machinery, who is usually tediously following a detailed process that leaves little room for fluctuations in environmental conditions. Surface contamination; windy, hot, or cold conditions; heating plate temperature control; and fusion times can all impact the integrity of a fused joint – and there is no visual or effective non-destructive method to inspect the quality. Once completed, only time will tell how well the joint is fused.
Unlike fusion, Victaulic products use simple tools for installation, which can complete the job regardless of weather conditions, and provide visual verification of correct installation and joint integrity. By simply visually confirming metal-tometal contact at the bolt pad, the installer can verify a leak-free seal. Ultimately, highquality joints are not only easier to achieve using the Victaulic system, but also easier to verify than a fused joint.
Victaulic products for HDPE pipe have been proven to meet or exceed HDPE pipe pressure ratings, allowed tensile loads and bend-radius recommendations of a fused joint. is means that you can push, pull and drag your pipe like any fused solution.
Even in ideal conditions, fusing HDPE is a slow process. Variables can have an immense impact on the speed of joining, including weather conditions, uneven or muddy terrain, and the location of an installation, such as in narrow trenches or vertical orientations that a fusing machine simply cannot accommodate.
e Victaulic system can be installed up to 10 times faster than fusing. By using simple hand tools to tighten bolts and nuts, there is no need for expensive fusing
equipment, power sources or certified fusion installers. Installation is weather independent, and can be completed in any temperature, rain or shine.
Finally, without the need for complex equipment, mechanical joints can be quickly installed in tighter spaces, difficult terrain and locations with limited accessibility that traditional fusing gear can’t reach. Mechanical joints provide the ability for vertical spools to be constructed in place, reducing the cost of construction with HDPE pipe materials.
Victaulic system solution for HDPE poly pipe is now WaterMark™ certified and WSAA appraised for use in potable water systems, both above ground and buried.


Victaulic has developed a new joining method for high density polyethylene pipe (HDPE) that eliminates fusion.


Fusion requires perfect weather conditions to work. In Australia’s often unpredictable and volatile climate, fusion methods present many risks for operations.


The Refuse-to-Fuse range has been designed to make pipe joining faster, easier, more economical and more reliable.


Designed for buried, submerged or above ground applications, the Refuse-to-Fuse range is versatile and ideal for use in the water industry.


Arecent report from the US Government titled ‘Global Trends 2030’ identi ed a 40 per cent increase in water demand by 2030, at a time when severe droughts and extreme weather patterns are likely to get more frequent.
Australian-owned family business Redox has taken note of this and mobilised its 350-strong team to help its clients innovate their processes and use smarter materials to save the world’s most precious resources, all the while delivering lower costs.
A global emerging leader in the supply of water treatment chemicals and lter media, Redox grew by more than $108 million in the past 12 months, with sales in 2018 exceeding $653 million. e company has been involved with potable and wastewater treatment since its establishment in 1965, but in recent times has ratcheted up e orts and success.
Water treatment industry manager Trudy Kelly puts this success down to a number of factors: ‘We simplify and streamline our clients’ purchasing by supplying a large range of products, all sourced from the best manufacturers in the world, while maintaining the family business dedication to exemplary customer service’.
Marquee agencies include Jacobi Carbons
and its ion exchange resins; Prayon’s sodium silico uoride; American Natural Soda Ash Corporation’s soda ash; Carus Corporation’s potassium permanganate; and Rotem Industries and its hydro uorosilicic acid in Israel, among many others. For more information, or to talk to a team member, please visit our website at www.redox.com.

July 2016 was an exciting time for the Tamworth Region. e recently enlarged Cha ey Dam was lling up fast. No sooner had the construction contractors nished than the rains came, eventually lling the dam. With a capacity increase from 60 GL to a full 100 GL, this guaranteed the Tamworth Region ample water supply for years to come. However, the water treatment operations sta were struggling during this period treating the ‘changed’ Peel River raw water supply.
For example, water that ows through the Cha ey Dam is quite high in pH and alkalinity and now, with a bigger dam to ll, it was not contributing to ood ows downstream. is changed the water chemical characteristics leading to formation of a lighter oc and consequently the clari ers were not able to ‘settle’ the oc as well. is was leading to a settled water turbidity of 3 NTU when usually it would be below 1.8 NTU. e lters were removing the extra oc but were struggling with turbidity breakthrough during drain down for backwash. e problem was becoming very serious as the Water Treatment Plant (WTP) was struggling to meet the recently enacted Critical Control Point of 0.5 NTU maximum turbidity through the lters. To prevent the turbidity breakthrough, the operators either had to drain the lters to waste or manually drain the lters very slowly, leading to many ‘after hours’ of work.
During this period there were major concerns that unsafe water might be supplied to the Tamworth community. Research indicated the lters should have been able to treat settled water at a lot higher turbidity’s than 3 NTU. ere was de nitely a problem! What was wrong with the lters? What was the x and who would know? How long since the lters had been refurbished?
e Calala WTP was originally commissioned in 1980, with augmentation in 1992. It has a theoretical capacity of 80 ML/d. e plant currently supplies 40,000 people of Tamworth and Moonbi-
Adrian Cameron
Kootingal with drinking water. e lters at the plant are part of a multiple-barrier treatment process designed to remove particles, including waterborne pathogens such as Cryptosporidium and Giardia, from the raw water. ese microorganisms can cause diarrhoea and gastrointestinal illness in humans. As pathogenic oocytes are highly resistant to chlorine disinfection, their removal relies upon e ective coagulation, occulation, sedimentation and ltration processes. Failure of these can result in the organisms being released to the distribution network, posing a risk to the health of the Tamworth community and requiring a Boil Water Notice to be issued. is would be a disaster for public relations and for public health, the risk comes not just from waterborne illness but potentially scalding incidents.
As the lters had always performed well, there was an element of ‘out of sight out of mind’ with them. One sta member also commented there was an element of ‘black magic’ to the lters as they turned dirty water into clean water.
e starting point was to ascertain the condition of the lters. Consultations recommended the best way to observe a lter is to complete a manual backwash and take notes. As part of the investigation process, pressure gauges linked to SCADA were also installed into the backwash and air scour lines to monitor underdrain pressures.
Filter bed appearance
e lter bed was visually inspected for uniformity and media depth. When in service, lters may lose media, which reduces their ability to produce clean water and hold particles.
Uneven and lumpy beds are signs of problems with mud balls or underdrains.
Air scour pattern
is should be established evenly and gently across the entire lter. Violent
eruptions or disjointed appearance is cause for concern as this indicates blocked or missing rosettes.
Underdrain pressure
is is important as high pressures in an underdrain system can cause damage to the laterals and rosettes and may lead to total failure of the lter. High pressure in the underdrain system is generally due to sand that has migrated to the underdrain blocking the rosettes and laterals.
Underdrain leaks
ese are the result of air leaking through the damaged underdrain system. is will relieve excessive pressures to some extent but also indicates the structural integrity of the lter oor is failing.
Treatment of dirty water
A lter’s ability to maintain good water quality is tested vigorously when the treatment plant is dealing with ‘dirty’ water. Filter problems during this time can become especially evident.
Turbidity breakthrough during backwash drain down
When lter breakthrough occurs, the process can no longer be guaranteed to form an e ective barrier to pathogens, such as Cryptosporidium and Giardia, and may also compromise the e ectiveness of chlorine disinfection.
So, what was the condition of the lters?
Some lters had a considerable quantity of mud-balls
A lot of the mud balls were located at the inlet end of the lters and this zone of the bed typically appeared to be less agitated than the remainder of the bed during air scouring. is indicated blockages of the lateral system in this area. Air and backwash velocities in the remainder of the bed may be excessive, which can result in disruption of the support gravels and migration of lter sand to the level of the rosettes.
When rosettes are missing from the lter oor, bed sand will migrate into the underdrains of the lter. is leads to additional rosettes in those cells also being blocked and then the underdrains being over-pressurised. As these issues continue to worsen, the risk of signi cant over-pressure increases. is could eventually lead to a failure of the underdrain system and eventually failure of the lter.
Sand was observed in some of the ltered water chambers
Considerable quantities of sand were found in some of the ltered water chambers on the outlet of the lters. is indicates that there has been migration of sand from the lters into the underdrains, and from there into the ltered water chambers.
In some lters, air was observed boiling along the concrete edge of the washout channel during the backwash. is is a sign that excessive pressures have resulted in lifting of this section of the oor and complete failure of the underdrain may be imminent. Figure 1 shows an example of a poor air scour.
During the inspections, the lters were given a ranking from 0 to 10 for each of the key points described above, 0 being good and 10 bad. e results of the rankings are shown in Table 1. ere were obviously some big issues with the lters at Calala!
Filter 2 was in a very bad condition and could no longer be guaranteed to form an e ective barrier to pathogens such as Cryptosporidium . is lter was taken o ine.
Filters 11, 12 and 7 had very high underdrain pressure and these high pressures indicated a large amount of sand had migrated to the under oor. e lters needed remedial action urgently before the complete failure of the underdrains.
All lters were showing some signs of performance problems.
e decision was made to refurbish the lters, starting with the worst rst and the better ones last. e sta at the WTP had
not been involved in lter refurbishment, so this was to be a new experience.
e previous media con gurations for the lters at Calala and also the rosette information were obtained from Tamworth Council records. is really demonstrated the importance of good record keeping; some employees who had been involved in lter refurbishment had moved on and others who were still at Council had forgotten the details as the lters had last been refurbished nearly 15 years before.
Filter 2 was taken o ine, and the media removed with a large vacuum truck. When this was completed it was noted that the lter bed, which was quite shallow to begin with, had lost quite a lot of media.
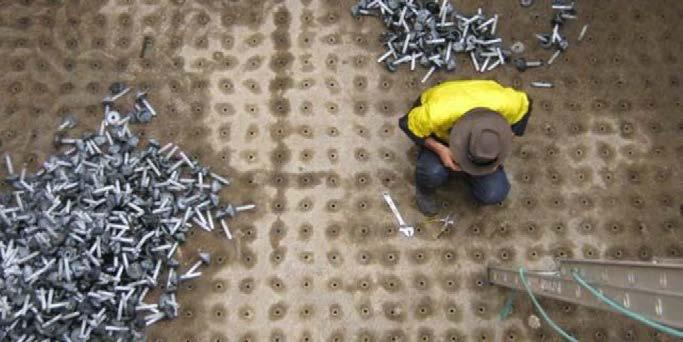
is would have been compromising the lters’ ability to remove particles. e 1200 rosettes were removed with damaged threads repaired (Figure 2).
Due to wear, all the rosettes were replaced. is required new rosettes to be fabricated by the same company that supplied the rosettes back in 1979 when the plant was commissioned. Luckily, they still had the original moulds.
e underdrain cleaning presented a problem as the only access was a 350mm inlet pipe. Workplace Health and Safety laws are much tighter now than 15 years ago when the smallest guy was sent in the hole with a dustpan and a brush. Cleaning the laterals was achieved with an air and water blaster made up to poke through the rosette holes and blasting the sand into the laterals and from there into the ltered water gullet situated below the backwash
drain. A small camera was used to check cleanliness of the laterals. e result at this stage was cleaned laterals but now, what about the ltered water gullet itself?
After various ideas were suggested, including boring large holes in the bottom of the backwash drain to let an operator into the ltered water gullet, a vacuum excavator was used with some pool cleaning poles and a vacuum cleaner end cleaning from the outside through the 350mm inlet pipe. Air leaks along the edge of the backwash drain were also repaired at this time. e area was cleaned up thoroughly and roughed up. Angle was placed along the edges with sealant placed under it and left to dry.
e opportunity was taken to replace the lter media with a new con guration. Dense garnet was used as support gravel allowing the total lter sand and coal
bed depth to be increased. e new con guration is shown in Table 2.
To date, another 5 lters have been refurbished, with 6 more to go.
After refurbishment, the lters have reduced underdrain pressures and have very even air scour patterns.
ere have been some dirty raw water events where the refurbished lters have not su ered any turbidity spikes at all. Generally, a better turbidity result is also being achieved by the new lters.
e exercise has been a success with the new lters reducing the risk to the Tamworth community of protozoan contamination.
e Author
Adrian Cameron (a.cameron@tamworth. nsw.gov.au) is a Water Engineer with Tamworth Regional Council in New South Wales.
Report
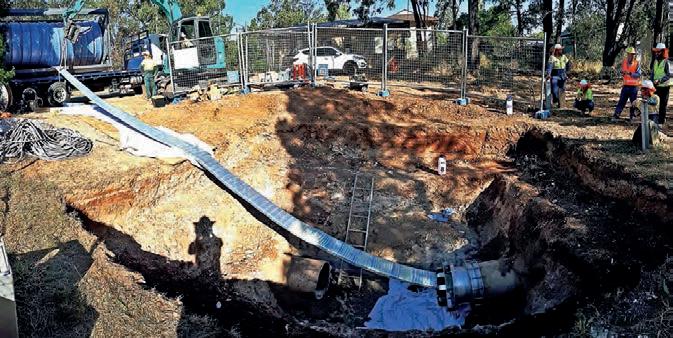
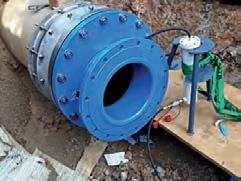
Client:
Queensland Urban Utilities
Year of Construction: 2018
Type of Construction Measure:
Rehabilitation of a DN 600 GRP water main at Redbank Plains in Ipswich, Australia
Our Services:
• Delivery of the flexible Primus Line® system DN 500
• Delivery of 16 customized connectors DN 500 with DN 600 AS 4087 PN 16 flange at the connector’s outer sleeve and DN 500 AS 4087 PN 16 flange at the connector’s core
• Training of Queensland Urban Utilities’ in-house installation crew and supervision of the works
Situation:
Queensland Urban Utilities is one of Australia’s largest water distributor-retailers, providing water and sewerage services to more than 1.4 million people across Brisbane, Ipswich, Lockyer Valley, Somerset and the Scenic Rim. Queensland Urban Utilities operates and maintains more than 9,000 km of water mains.
In late 2017, Queensland Urban Utilities began investigations to rehabilitate a DN 600 GRP water pipe at Redbank Plains to supply a nearby reservoir. The utility identified a 1.8 km section of pipe to be renewed, which had two scour valves, two air valves and two 45-degree bends (DICL) with r = 3 x D.
Queensland Urban Utilities opted to use trenchless technology to minimise disruption to the community and the environment, as the pipe ran through a residential area and a park. The utility also identified relining can be faster and more cost-effective than traditional open trench replacement.
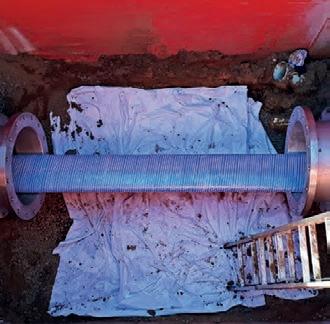
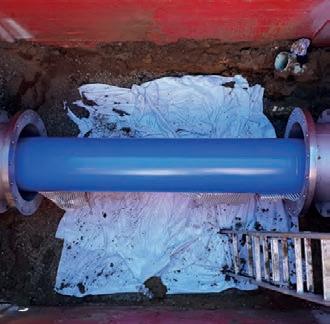
Technical Details:
Material of Host Pipe: GRP
Rehabilitation System:
Transported Fluid: Potable water
Diameter of Host Pipe: DN 600
Operating Pressure: 9 bar; test pressure: 12 bar
Primus Line® System: DN 500 PN 16
Total Length: 1,800 m
Number of Sections: 3 sections
Installation Time: 2 weeks
The Primus Line® system is referenced in EN ISO 11295:2018-06 and EN ISO 11298-1:2018 for the renovation of underground water supply networks and complies with AS/NZS 4020:2005. The system consists of a Kevlar® reinforced liner and specifically developed end fittings. The liner accommodates the operating pre ssure of the pipe, due to the reinforcement layer and because it does not bond to the host pipe. The liner is seamlessly manufactured at an ISO 9001 certified production plant in Germany and transported on reels to the site. Due to the flexibility of the m aterial, the liner can traverse angles of up to 45 degrees, can be installed in lengths of more than 1,000 m in one pull, and has an installation speed of up to 600 m per hour.
Project Description:
Rehabilitation System:
The Primus Line® system is referenced in EN ISO 11295:2018-06 and EN ISO 11298-1:2018 for the renovation of underground water supply networks and complies with AS/NZS 4020:2005. The system consists of a Kevlar® reinforced liner and specifically developed end fittings. The liner accommodates the operating pressure of the pipe, due to the reinforcement layer and because it does not bond to the host pipe. The liner is seamlessly manufactured at an ISO 9001 certified production plant in Germany and transported on reels to the site. Due to the flexibility of the material, the liner can traverse angles of up to 45 degrees, can be installed in lengths of more than 1,000 m in one pull, and has an installation speed of up to 600 m per hour.
Project Description:
To minimise the construction footprint, the relining was completed in three separate installations of approximately 600 m each This also reduced the amount of time needed to set up the transport reels and pulling winches. There was a total of eight excavation pits; two start pits (2.15 m x 1.80 m) where a 1.75 m section was cut out of the host pipe; four intra-pits (2.90 m x 1.80 m) where the valves and tees were located and a 2.5 m section of the host pipe was removed; and two destination pits, where the liner was pulled out at a flat exit angle of 10 degrees, to minimise the pulling forces. Custom fittings were used to avoid the need for tapers, with DN 500 connectors delivered with a DN 600 flange on the outer sleeve, which was mounted to a flange coupling adaptor DN 600 at the host pipe. After the excavation pits had been created, the host pipe was inspected with CCTV and cleaned. After the pipe had been re-inspected, the installation process began and the pre-folded liner was inserted using a pulling winch. Once in place, the liner was returned into its original round shape by applying 0.5 bar of compressed air. After the end connectors had been installed, the renovated section was pressure-tested with 12 bar and disinfected. The works were completed by Q ueensland Urban Utilities’ capital works team and will extend the life of the water main by at least 50 years.
To minimise the construction footprint, the relining was completed in three separate installations of approximately 600 m each. This also reduced the amount of time needed to set up the transport reels and pulling winches. There was a total of eight excavation pits; two start pits (2.15 m x 1.80 m) where a 1.75 m section was cut out of the host pipe; four intra-pits (2.90 m x 1.80 m) where the valves and tees were located and a 2.5 m section of the host pipe was removed; and two destination pits, where the liner was pulled out at a flat exit angle of 10 degrees, to minimise the pulling forces. Custom fittings were used to avoid the need for tapers, with DN 500 connectors delivered with a DN 600 flange on the outer sleeve, which was mounted to a flange coupling adaptor DN 600 at the host pipe. After the excavation pits had been created, the host pipe was inspected with CCTV and cleaned. After the pipe had been re-inspected, the installation process began and the pre-folded liner was inserted using a pulling winch. Once in place, the liner was returned into its original round shape by applying 0.5 bar of compressed air. After the end connectors had been installed, the renovated section was pressure-tested with 12 bar and disinfected. The works were completed by Queensland Urban Utilities’ capital works team and will extend the life of the water main by at least 50 years.
I was rst made aware of the Victorian Network Operator Development Program (NODP) via my Team Leader. It was sold to me as an opportunity, a development program for future leaders in network operations. It sounded interesting, and as far as the application criteria was concerned, I was ticking the right boxes. So I applied, and after the nomination process, I enrolled in the program. is is the second year that the program has been o ered in Victoria and I hear that WIOA is looking into the possibilities of o ering similar programs in other states as well. I joined 13 other network operators from around Victoria (Figure 1) in what has turned out to be an unforgettable and extremely valuable experience.
e purpose of this program is to identify, mentor, and develop future leaders in network operations. It aims to achieve this by exposing students to best practice, new developments, business management and leadership elds, both in class and through practical-based training. e network operations eld covers both water and wastewater and can be de ned as everything to do with operating and maintaining pipelines and associated infrastructure, from a water corporation’s treatment plant to the point where the
Justin Archibald
customer’s responsibility begins. So, if you are an operator and predominantly work in network operations, this is the program for you.
e program runs from February to September each year, with class sessions held at di erent water corporations and venues across the state of Victoria. e program itself is broken into seven sessions, as follows:
• Leadership – key aspects of being a leader in the water industry from the MD down.
• Water Main Repairs for Safe Drinking Water – best-practice systems and processes for safely repairing water mains.
• Network Management Issues – managing water loss and maintaining water quality in the distribution system.
• Wastewater Systems – managing the operation of sewer systems to reduce blockages and odour issues.
• Pumps and Pumping Systems Management – e cient operation of pumps and pump systems (Figure 2).
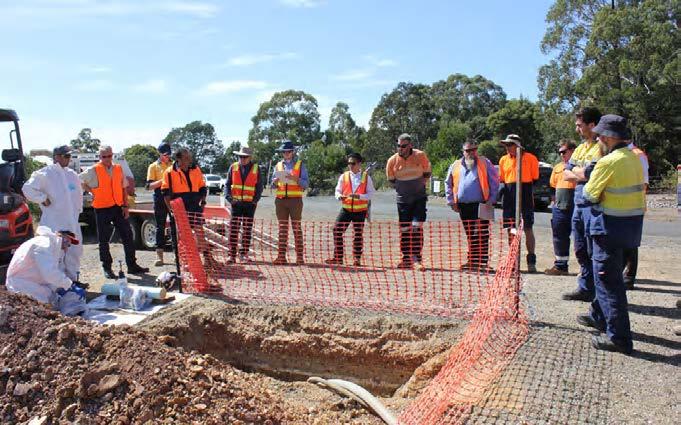
• Asset Management Issues – e cient asset management, including operation and replacement of network assets.
• Solid Waste Issues – management of waste material and end of NODP program participant feedback.
After, and in between each session, each participant was required to complete a workplace assignment relevant to the topic covered in that session. e assignments allowed us to investigate our own corporate policies, practices and procedures; we were then able to evaluate them against what was presented to us during the sessions. Although we weren’t provided individual feedback on our assignments, we did have a group debrief and discussion at the start of the next session. A copy of the sample answers for each assignment were provided and we were encouraged to compare our answers to the sample answers provided.
Participants were also required to prepare and deliver one presentation to the NODP group, on one of the session’s focus areas. My presentation was on water quality and water main repairs. It focused on best practice and how my business undertakes work in this eld. It also included identifying key learnings
from the session as well as developing an improvement recommendation for our organisation to consider.
e program culminated at a graduation Dinner on the Tuesday evening at the WIOA Victorian conference. All participants who successfully completed the program were recognised and presented with a certi cate of participation.
One lucky participant was also awarded the WIOA Victorian Network Operator of the Year at the Conference Awards Dinner on the ursday evening. e judges considered things like attendance and participation in the sessions, the quality of assignments and presentations delivered, engagement with the presenters and other participants, and supervisor feedback. Besides the accolades, the winner also received a sponsorship to the value of $3000, which can be used for any activity that allows further development of the leadership or technical skills of the winner.
ere was a lot I took away from this program, but there were two big learnings for me. e rst was networking. e name ‘network operator’ to me has a
double meaning. e program is aimed at network operators, but networking was one of the best things about this program. e program is structured in a way that makes you network both internally, within your own organisation and externally, with the various water corporations and WIOA members who are a part of the program.
What this meant for me within my organisation was that my mind was opened to parts of the business I had previously paid little attention to. is helped me look at the bigger picture and appreciate the role that these parts of the business play and how this relates to my team, which also helps foster better relationships. Ultimately though, it gave me a deeper understanding of my corporation’s inner workings and how I t into this.
Externally, networking with my classmates in the program, the business host representatives, as well as the WIOA advisory committee members and presenters was also fantastic. roughout the program you socialise, share ideas, re ect on di erences and ultimately, learn more about the water sector and all who are involved. e classroom environment is very supportive, and all classmates are encouraged to ask questions and share ideas and viewpoints.
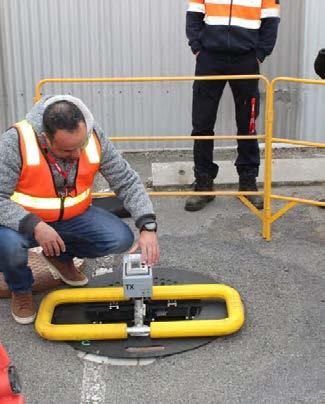
e second big learning for me related to best practices. In the program, you are exposed to best-practice initiatives, ideas and new technology. A standout point for me was what I learnt in the water quality and main repairs session (Figure 3), particularly around how to safely disinfect burst water mains along with best practice when storing water main spares. I also learnt heaps about the optimisation of distribution systems.
All participants were provided with a copy of WIOA’s Practical Guide to the Operation and Optimisation of Distribution Systems is is a great resource book that I will use and refer back to at my workplace.
roughout the program, I found myself re ecting on best practice and armed with this information, I could go back to the business and ask the question: are we applying best practice here? For me this meant questioning some of our practices and checking in with parts of the corporation on whether or not we are in line with best practice in this space. At one point, when I was back at work, I remember re ecting on a previous class’s material, and putting some of the lessons learnt into practice in the workplace.
ese are just a couple of standout learnings of many from this program and, as the title suggests, it’s a development program pitched at network operators. I can de nitely say that this program has helped me develop as a network professional. So, if you are ticking the boxes and are sold on my story, consider applying for the NODP intake next year. You won’t be disappointed!
e Author Justin Archibald (justin.archibald@melbournewater.com.au) is Lead Water Supply Operator with the Southern Operations, Peninsula at Melbourne Water in Victoria.
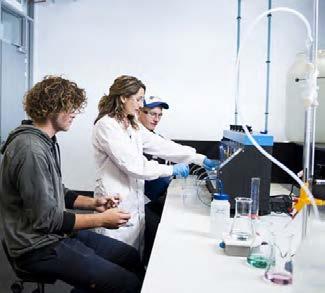
A TAFE SA water operations course can provide operators with the skills to measure and report on system performance and the decision-making tools necessary to make operational changes and meet relevant government requirements.
Training is based at Tonsley a world-class, energy ef cient, trade training infrastructure built for the building and construction industry.
OUR RANGE OF COURSES INCLUDE
• Certi cate III in Water Industry Operations (Networks) NWP30215
• Certi cate III in Water Industry Treatment (Drinking water) NWP30315
• Certi cate III in Water Industry Treatment (Wastewater) NWP30315
SHORT COURSES AND CUSTOMISED TRAINING
We also offer a range of short courses and can develop and deliver customised training in partnership with you to achieve your required outcomes.
FOR FURTHER INFORMATION CONTACT
TAFE SA Tonsley, 1284 South Road, Tonsley
T: (08) 8207 2800
E: wateroperations@tafesa.edu.au
tafesa.edu.au/waterops

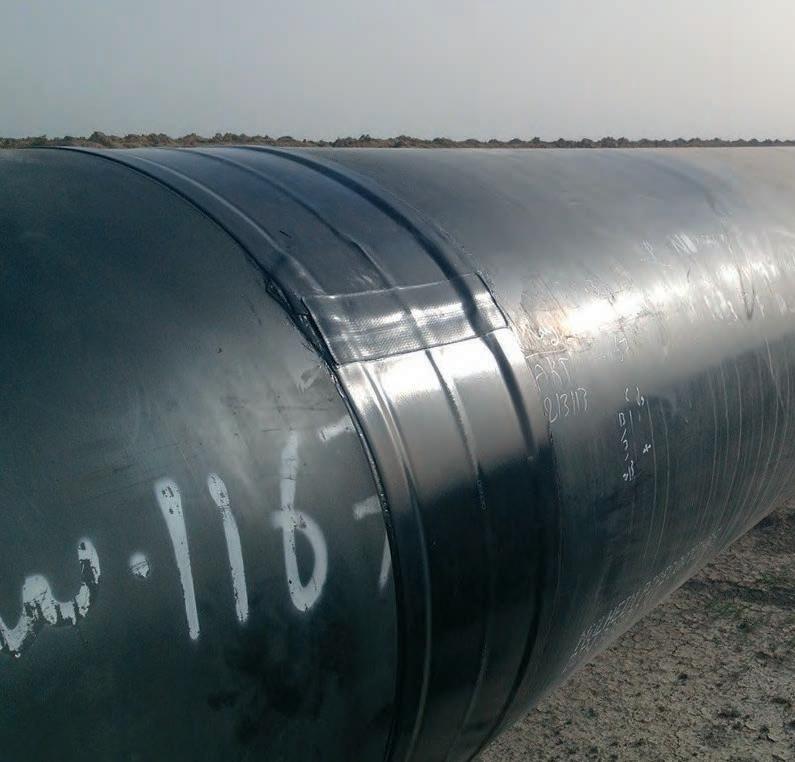
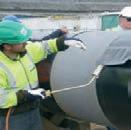
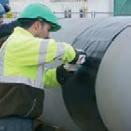
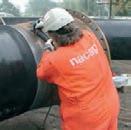
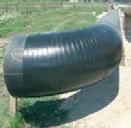
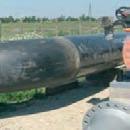
Christopher Pipe-Martin and John Winchester
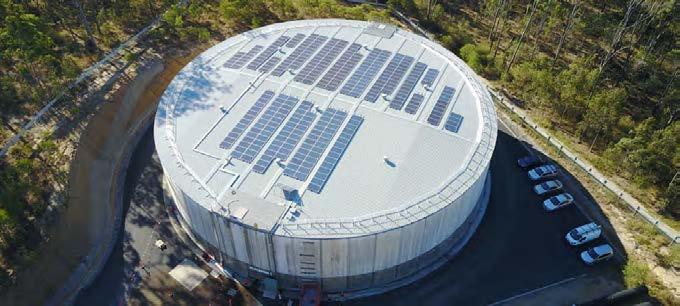
Chloraminated water is supplied to the Round Mountain Reservoir from the Mt Crosby Water Treatment Plant near Ipswich. e 20-megalitre reservoir was brought online in 2014 to provide drinking water for residents in the developing southern areas of the City of Logan. Water is retained in the network serviced by this reservoir for longer than is desirable because the population is still growing, and the demand is low. is results in no e ective chloramine residual in the network and an increased risk to consumers from contamination events.
Water quality analysis following the reservoir’s construction con rmed that over the summer months there was no e ective disinfectant residual across most of Logan South. An investigation considered how chlorine could be boosted in the supply zone. Water age modelling results for existing and future demand scenarios indicated that dosing at the reservoir outlet would provide the most signi cant improvement in water quality across the zone by adding free chlorine to the network during periods of low total chlorine exiting the reservoir.
e Round Mountain Reservoir is 3 kilometres from the nearest development and grid power.
e access road to the site is unsealed and not suitable for trucks in wet weather.
e cost of upgrading the road to a standard suitable for tanker delivery in all weather conditions was estimated at $1.6 million. e supply of mains power was estimated to cost up to $1 million.
A number of di erent chlorination options were considered, including sodium hypochlorite dosing of 10–12% solution; electrochlorination, which involves running an electrical current through a salt brine solution to produce a low strength hypochlorite solution; and use of calcium hypochlorite by spraying water on calcium hypochlorite briquettes to form a hypochlorite solution. Use of lique ed chlorine gas was excluded due to delivery challenges and site security constraints.
While sodium hypochlorite dosing with no road upgrade had the lowest capital cost, the electrochlorination options had
lower operation and maintenance costs over the 10-year design life of the system. Calcium hypochlorite had the highest cost.
e major advantage of electrochlorination was that it removed the need to have chemical delivered to the site on a regular basis, and as a result, it eliminated the requirement for Council to upgrade the road to allow delivery trucks access during adverse weather conditions. An added bonus was that the process produced low strength (<1%) hypochlorite, which is not classi ed as a hazardous material and is not subject to the high rates of chemical degradation of standard 12% sodium hypochlorite.
e Round Mountain Reservoir site will not have mains power to the site for at least 10 years, so a solar power system was installed. e installation consists of 323 solar panels in an 87 kW solar array installed on the roof of the reservoir (Figure 1). e roof of the reservoir was not originally designed to take the weight and wind load of solar panels, so careful planning of the panel layout and walkways was needed to ensure that the arrangement met structural design code requirements.
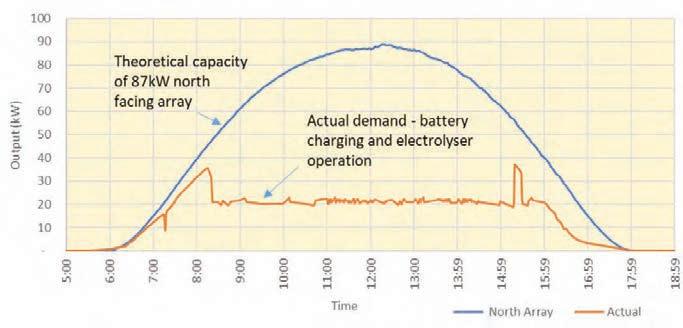
Power is also provided during times with no solar generation by a commercial battery with a capacity of 95 kWh.
e solar panel sizing produces enough power to generate the site’s daily sodium hypochlorite requirement during daylight hours (Figure 2) and maintain dosing through the night using battery storage.
e Tesla battery storage can supply a minimum of 3 days backup power for hypochlorite dosing and instrumentation.
e battery does not have su cient capacity to operate the electrolysers. Dosing relies on the chemical storage tank when power generation is not available from the solar panels.
Due to security and vandalism concerns at the site, all solar panels are mounted on the reservoir roof. e electrolysers, battery and dosing equipment are housed in a secure concrete building.
e electrolyser unit (Figure 3) converts brine solution into a weak (0.6%–0.8%) solution of sodium hypochlorite and hydrogen. e electrochlorination system consists of the following components:
• Water softener to reduce scaling of the electrolysis cells.
• Salt gantry loader to transfer 600 kg bags of salt to the brine tank.
• Brine tank where salt is dissolved in softened water.
• Brine pumps to transfer brine to the electrolysis cells.
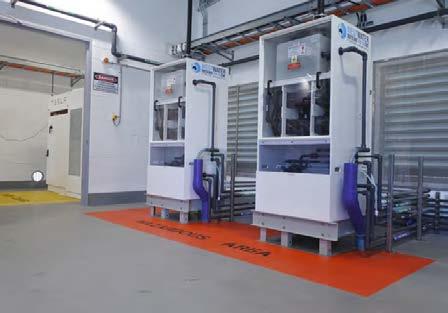
• Water chiller to reduce electrolyser temperature and improve e ciency.
• Electrolyser (including recti er) to convert salt to sodium hypochlorite.
• Hypochlorite tank to store the produced 0.6% Sodium hypochlorite solution.
• Blower to remove the hydrogen gas (byproduct of electrolysis).
• Gas sensor alarm to detect ammable hydrogen gas.
• Water quality analysers to control sodium hypochlorite dosing.
• Hypo dosing pumps to inject sodium hypochlorite into the reservoir outlet.
• Waste tank to store regeneration water from the softeners. e waste solution contains calcium released from the resin and salt from the regeneration process. To produce 1 kg of chlorine requires approximately 3.3 kg of salt and 5.0 kWh of electrical power. Two 2.2 kg/h Hyprolyser (electrolyser) units (Figure 3) were installed to produce a total of 32 kg of chlorine per day with the available solar power. At full production, the plant can use 143 kg of salt a day (1,000 kg/w). e brine tank (Figure 4) is sized to hold 28 days of brine. An extra 4 weeks of salt can be stored on site in 600 kg bags when required.
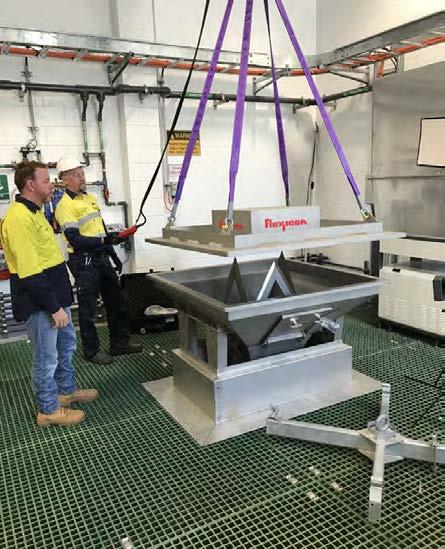
Dosing pumps inject sodium hypochlorite into a carrier water line that discharges into the reservoir outlet. e dosing pumps have a capacity of 412 L/hr into a line with up to 100 kPa back pressure. e dosage rate is calculated using a feed forward control loop based on the reservoir outlet total chlorine value upstream of the dosing point. e hypochlorite dosed must be su cient to break any remaining chloramine (measured as total chlorine) and then supply the required free chlorine residual.
Downstream free chlorine is monitored with an online analyser to ensure that the target level is achieved. A 45-minute detention tank is used to ensure reactions have been completed before free chlorine is measured. e hypochlorite storage tank holds enough chemical to continue dosing for 5 days if the electrolysers are not available.
e Round Mountain electrochlorination facility has been in operation since
October 2017. e facility was shut down temporarily in June 2018 due to a change in water supply to the reservoir. e facility restarted in October 2018. Other than some initial di culties with the chlorine analysers and a failed valve, the facility has run without problems. Operator experience to date has reported that:
• ere has been some minor dust build up on the solar panels and they may need cleaning once a year which is more often than predicted.
• e battery storage capacity is being monitored but there have been no issues with availability.
• Salt loading and unloading is straight forward and requires 30 minutes per month to load the bags. ere have been some cases of bags being split on delivery.
• e cutter spikes in the brine tank work well to open bags (the cutters are visible at the top of the hopper in
gure 4). e spreader bar is essential for an even bag lift.
• e electrolysers have had a few issues with the valves crusting up with leaking hypochlorite making them stick and requiring manual cleaning. is problem has now been recti ed.
• e hypochlorite tank has been adequate with no problems other than a valve that came loose during commissioning.
• e chlorine analysers have performed well after some initial problems with cabling. Multiple inlet and outlet analysers require the operator to be mindful of which is being tested or recorded.
• e hypochlorite dosing pumps have had no issues other than the usual crust that forms around ttings.
• e waste tank is being pumped out once a week due to higher volumes than anticipated. is could be a problem in wet weather due to truck access.
• e water softeners have performed well.
• Total operator input has been one visit per week with time on site being one hour maximum.
e electrochemical chlorination system at Round Mountain Reservoir has provided a reliable o -grid power supply and chlorination system to maintain drinking water quality. e reliability is due to the 28 days of brine storage capacity coupled with bagged salt storage, ve days of sodium hypochlorite storage onsite and battery backup power for the dosing equipment. e installation of the system saved the $1.9-million capital cost of upgrading the access track to the reservoir and saves operational costs of $50,000 a year due to reduced chemical costs and solar power providing 100 per cent of the energy needed to run the electrochlorinator. e facility so far has been a low-maintenance asset, which is safe to operate.
e Authors
Christopher Pipe-Martin (chrispipemartin@logan.qld.gov.au) is the Water Product Quality Program Leader and John Winchester ( johnwinchester@ logan.qld.gov.au) is a Leading Hand Water Network Operations, both with Logan City Council in Queensland.
Most of the safety issues and risks associated with surface aerators can be eliminated by using bank-mounted Venturi Aerators without performance reduction, according to Australian distributor Hydro Innovations.
With surface-mounted aerators, operators need to access them via oating walkways or some kind of vessel, requiring them to work over water. Alternatively, the aeration devices may need to be lifted out by the use of cranes or other lifting apparatus.
Venturi Aerators are powered by GormanRupp self-priming centrifugal pumps, so they can be mounted on the banks of the lagoons. is means that operators can perform all required servicing and maintenance without having to work over water, work at heights or work with heavy swinging weights.
When attempting to minimise risks associated with the aeration of ponds and
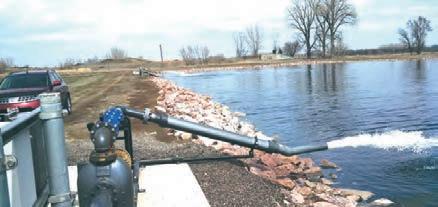
lagoons, designers can eliminate most of them by simply choosing Venturi Aerators over other technologies. is does not mean that e ciency has to su er. Venturi Aerators have been tested to produce as much as 1.86 kilograms of oxygen transferred per kilowatt per hour.
Maintenance of these units is relatively simple as well. With no moving parts in the
aerator, only the Gorman-Rupp pump will require any level of maintenance, and these pumps have a long track record of reliability and dependability. One operator can safely adjust clearances in minutes, and check and adjust seal and bearing oil levels.
For more information on this technology, email Hydro Innovations at info@hydroinnovations.com.au.


Eliminate the Safety Risks - Don’t throw money at them!


Spacers are used to separate the carrier pipeline from the casing, ensuring that the pipe is centralised to achieve even grouting. To do this and ensure that the pipe’s integrity is maintained, a durable spacer that complies with standards should be used.
e Water Services Association of Australia’s (WSAA) WSA PS – 324 product speci cation, which covers correct protection of carrier pipes when installed inside casing, outlines various requirements for spacers used in water pipeline installations, including use of materials. While this speci cation focuses on water pipelines, it can also be applied to oil and gas pipelines.
Metallic and makeshift wood spacers are commonly used for pipeline installations as they are cheap, but they do not comply with the WSAA speci cation and can have a negative e ect on the long-term integrity of a pipeline.
kwik-ZIP Managing Director Jason Linaker says, ‘If a spacer made from inappropriate material is used, such as metal or wood, there is a high chance of corrosion or rotting occurring, as well as overall wear on the casing during the installation process. ese factors can have a negative e ect on the longevity of the pipeline, create longterm rehabilitation or replacement costs, as well as cause reputational damage.
‘ at’s why contractors and asset owners should consider kwik-ZIP’s range of spacer systems. ey are the only spacers in Australia that comply with the WSAA speci cation, as they are made from an inert material (high-grade thermoplastic), and prevent many of the problems that are common in spacers manufactured from other types of material.’
kwik-ZIP systems are made from a highgrade thermoplastic, which is characterised by its high exural strength, high temperature resistance, low coe cient of friction, and high resistance to organic chemicals, oils and synthetic detergents – even when immersed for long periods of time.
‘While kwik-ZIP spacers are not as cheap as metallic or makeshift timber spacers, the long-term savings are worth the initial cost,’ Linaker says.
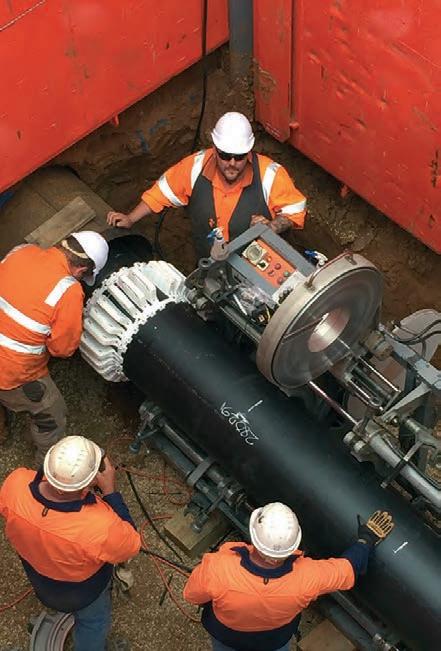
‘kwik-ZIP spacers are corrosive-free so they won’t corrode or transfer existing corrosion to the new pipe, and as they are resistant to installations involving water, the spacers themselves will not corrode or rot.’
Casing wear is also reduced, as the spacers have a low friction coe cient, making it easy for the pipe to be inserted without damaging it.
e exible design of the spacers also means that various runner heights can be
achieved, allowing for di erent pipe and casing combinations.
‘When selecting a spacer, consider the material that it is made from, and if there is an applicable speci cation. ese factors could be the di erence between a durable, long-lasting pipeline and a failing one that requires regular maintenance and rehabilitation or, in the worst case, replacement before it reaches the desired design life.’
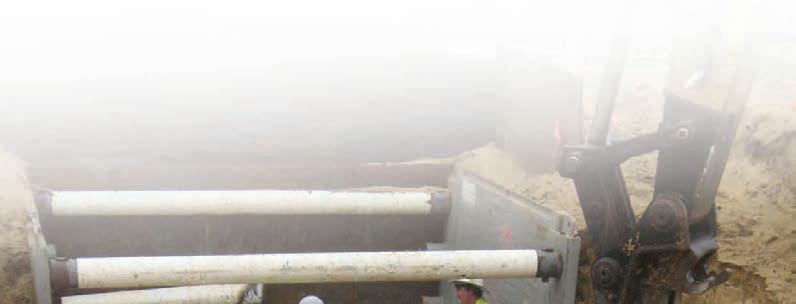

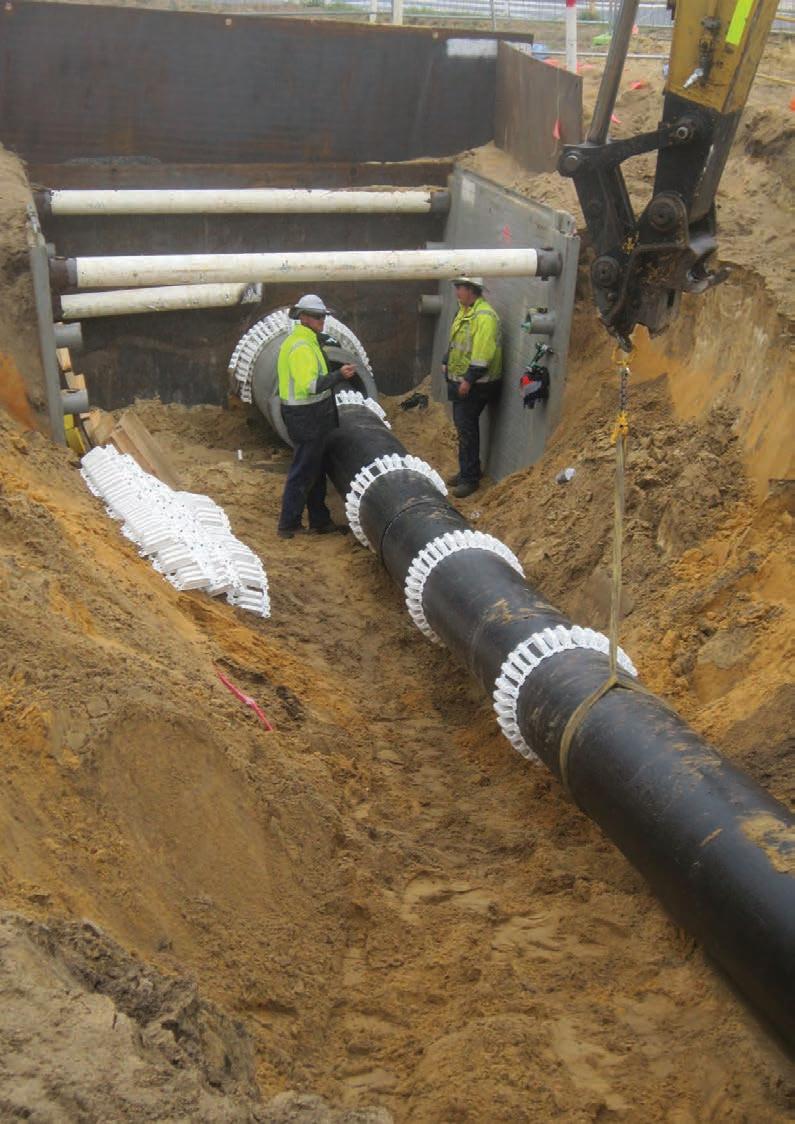


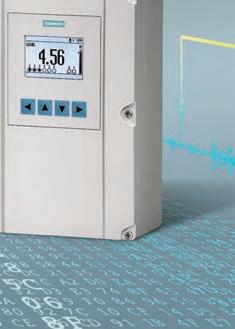
The Ultrasonic family has a successful history of providing accurate results while standing up to the toughest conditions. Take your pick: the improved HydroRanger 200, the feature-loaded MultiRanger 200, or the cost-effective, compact, and intelligent SITRANS Probe LU240 ‒ all of which can be set up in under a minute. From stringent accuracy to tough conditions, Siemens has the right ultrasonic level device for you.
Each can be fully integrated in your automation system, too ‒ an advantage offered by the entire Process Instrumentation family, be it flow, pressure, level, weighing, temperature measurement, or our positioner. Because we believe every business success begins with great measuring.


siemens.com/ultrasonic
Lee Marshall & Kathy Northcott
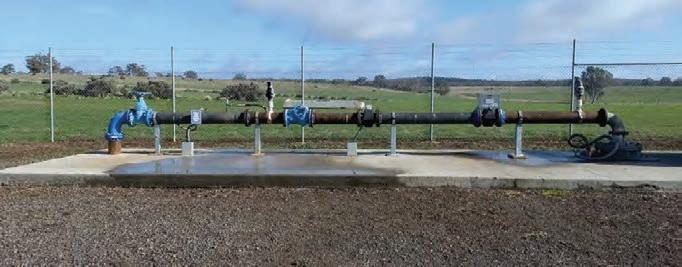
e town of Avoca is in the Central Highlands of Victoria, around 70 kilometres north-west of Ballarat. Originally a gold mining town, Avoca’s main industry is now agriculture and is home to around 1200 people. e Avoca Water Treatment Plant (WTP) was originally a direct ltration plant. e raw water supply was from the Sugarloaf Reservoir, with its catchment in the Pyrenees Ranges. However, due to protracted drought in the early 2000s and ongoing unreliable seasonal rainfall, the quality and quantity of water in local surface water supplies signi cantly deteriorated. is triggered a plan by Central Highlands Water (CHW) to build a Brackish Water Reverse Osmosis (BRWO) plant at Avoca to utilise the Bung Bong bore eld as an alternative water source and secure water supplies to the area.
e Avoca WTP upgrade project involved the construction of a new lamella clari er upstream of the existing granular media lter, a new reverse osmosis (RO) feedwater tank, a package BWRO plant, permeate tank and general chemical dosing system upgrades. e BWRO plant was commissioned in 2011. For a number of years the plant operated in two modes utilising conventional treatment (coagulation, settling, ltration) on surface
water supplies when available, and BWRO on bore water when surface water supplies were low.
Facing ever increasing challenges with the water quality and security of the local surface water reservoirs, more recently CHW has made the decision to operate solely on brackish water from the Bung Bong bore eld (Figure 1). is has ensured consistency of raw water supply and allowed operators to focus on ongoing operational performance and optimisation of the BWRO system to get the best possible outcomes both in operational costs and drinking water quality. e Avoca WTP is a classic example of the type of BWRO package plants that are being utilised across inland Australia, and hence allows for a good overview of the key operational principles in management of these processes.
Osmosis is a natural process that occurs when pure water ows from a dilute salty solution through a semi-permeable membrane into a higher-concentration salt solution. In a typical BWRO system, puri ed water (permeate) is separated from dissolved salts in the feedwater, by applying a pressure to overcome the natural osmotic pressure of the solution.
e percentage of the feed that does not pass through the membrane is called the concentrate (brine). e concentrate contains the dissolved salts that have been rejected by the membrane (i.e. concentrated salt solution). Dissolved salts rejected by the membrane need to be continuously ushed from the system to prevent excessive build-up.
e key terms used in the reverse osmosis process are:
• Feedwater – the water that is fed into the membrane system.
• Permeate – the water that passes through the membrane.
• Recovery – the percentage of feedwater that becomes permeate.
• Concentrate – the water containing the concentrated salts after permeate has passed through the membrane.
• Rejection – the percentage of salt concentration removed from the feedwater by the membrane.
• Passage – the opposite of ‘rejection’; passage is the percentage of salts in the feedwater allowed to pass through the membrane.
• Flux – the rate of permeate transported per unit of membrane area, usually measured in litres per square metre per hour (L/h/m 2).
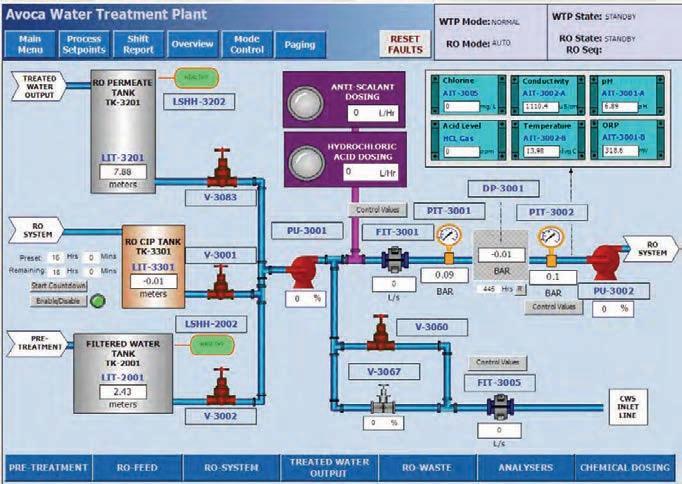
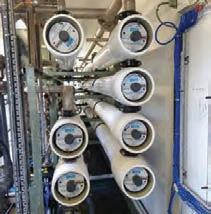
Membrane system design is based on feedwater quality and recovery is determined on this basis. Recovery is often aimed at maximising permeate ow, while avoiding precipitation of saturated salts within the membrane system.
In order to obtain the highest level of permeate production using the least amount of energy, the design con guration of a BWRO system is important. e simplest design of a reverse osmosis plant is a high pressure pump that feeds a single
bank (stage) of pressure vessels containing spiral wound reverse osmosis elements. Single stage systems are limited to between 35–50% recovery, to prevent precipitation of salts on the membrane. Hence for a single stage process, up to 65% of the feedwater could be rejected!
In BWRO, this recovery limitation is overcome by using multi-stage systems in a decreasing ratio (e.g. 4 vessels: 2 vessels: 1 vessel from rst to nal stage, for a three-stage system) (Figure 2). Depending on initial feedwater quality, three-stage BWRO has the potential to achieve up to 85% recovery of feedwater, as high quality permeate.
Other design considerations in BWRO are the use of either permeate recycle, to modify feedwater quality, and/or a feedwater bypass. e bene t of a feedwater bypass is the management of total dissolved solids (TDS) and alkalinity levels in the treated water, minimising the need for downstream pH and alkalinity adjustment. e downside of using a feedwater bypass
is that log reduction credits (LRCs) for the RO system can no longer be claimed as part of the drinking water quality management plan (DWQMP).
In the case of Avoca, the RO system consists of three banks of vessels in a 4:2:1 pressure vessel arrangement (Figure 2). e maximum operating ux is designed to be 24 L/h/m 2 after pre-treatment at maximum feed owrate of 16 L/sec. ere are 49 Hydranautics brackish water membranes, capable of producing permeate with a nominal TDS of 100 mg/L and a maximum recovery rate of up to 85% of the feedwater. e process is generally run with a more conservative recovery target of 75% and typical recovery of stages 1, 2 and 3 are 50%, 20% and around 5% respectively.
e process has a system design pressure of up to 18 bar, provided by a low pressure followed by a high pressure pump, with typical operating pressures of around 12–14 bar onto stage 1.
e system is designed to operate unattended 24 hours per day and features a PLC and SCADA system that displays and stores operating data for process control, troubleshooting and diagnostics. is includes:
• Pressures, ows, temperature, conductivity and levels in tanks (Figure 3).
• Membrane performance before and after cleaning.
• Membrane run-time and operator input.
• Alarm and alarm acknowledgement.
ere are a number of factors that a ect BWRO membrane operation. Concentrations of suspended solids, salts and organics in the feedwater, along with the water temperature and pH all play an important role in how the process performs.
Water temperature can have a signi cant impact on permeate ow and water quality. Lower viscosity of warm water makes it easier for the water to pass through the membrane. Hence, the higher the feedwater temperature, the higher the permeate ow. e downside of any temperature increase is reduced permeate water quality, since a little more salt also passes through the membrane. For better salt rejection, the water temperature needs to be lower.
Key operational parameters to monitor RO membrane performance include feed, permeate and concentrate pressures and conductivities. Feed and permeate ows and ux across each membrane stage, and the overall system recovery, are essential for managing system performance.
Feedwater salt concentration has a strong e ect on permeate ow. Higher salt concentration will decrease the permeate ow, because of the higher osmotic pressure of the solution. Higher salt concentration will also increase the rate of salt passage across the membrane. is is due to something called concentration polarisation.
Concentration polarisation is a function of the boundary layer at the surface of the membrane. e act of pushing water across the membrane results in an increased salt concentration at the membrane surface. e higher the ux rate through the membrane, the higher the salt concentration at the membrane surface, with TDS in solution near the membrane surface up to 13–20% higher than the concentration in the bulk stream.
ere are a number of operational parameters that are monitored at Avoca
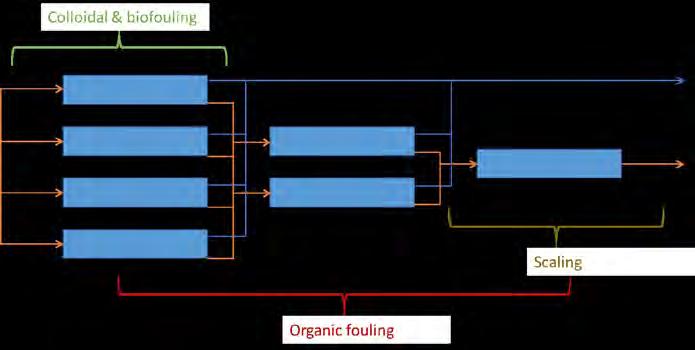
WTP to ensure that the process is meeting its performance and quality targets.
Important considerations are:
• Feed ow rate operated below the upper limit (maximum 16 l/s).
• Operating pressure drop across membranes below the upper limit (generally target less than 3 bar di erential pressure).
• Operating feed pressure below the upper limit (maximum 18 bar).
In order to minimise the e ect of concentration polarisation:
• Membrane element recovery for each stage below upper design limit.
• Concentrate ow rate above lower limit.
e quality of the feedwater can limit recovery, if it is not carefully managed.
A routine test used in RO operations to identify the risk of solids fouling the membranes is the Silt Density Index (SDI) test. It measures the time required to lter a xed volume of water through a standard 0.45 µm pore size micro ltration membrane with a constant given pressure of 30 psi (2.07 bar). e di erence between the initial time and the time of a second measurement after 15 minutes represents the SDI value. Ideally, an e ective pre-treatment system would aim to achieve a feedwater SDI of less than 3. is should allow for frequency of chemical cleaning of membranes no more than every 8–12 weeks.
Brackish water usually contains a range of sparingly soluble salts such as silica, which can cause scaling (Figure 4). So that the salt concentration does not exceed the saturation limit, brackish water recovery is normally limited to 70–85%. Even so, depending on the compounds present in
the water, softening treatment processes, or dosing with anti-scalants, is often required. Dissolved organics can also very quickly foul membranes (Figure 4). It is important that levels of organics be monitored to ensure that they are at a low enough concentration to prevent this. Accumulation of organics on the membrane can also encourage the growth of bacteria and hence the occurrence of biofouling. In order to control biofouling, it is fairly common practice to use a low dose of biocide, such as monochloramine, in the feedwater (around 1 mg/L). However, the chloramination dosing must be very carefully monitored to ensure that no free chlorine enters the system, as it will very quickly oxidise and destroy the membrane surface layer.
An example of the typical feedwater quality for Avoca is provided in Table 1. e feedwater supply comes from a 52 m deep bore, which was upgraded and sealed in 2010. Pre-treatment for the BWRO at Avoca is managed by dosing 0.7 mg/L (total chlorine) chloramination for biological growth control, antiscalant dosing to reduce the risk of silica fouling on the second and third stage membranes, and a 10-micron cartridge pre- lter to remove suspended solids.
When monitoring membrane performance over a period of time using online process data and trends, any change in feedwater quality and operating conditions must be considered. is can be done by ‘normalising’ the data. Data normalisation is a way of being able to measure current process performance against a baseline performance. at is, the performance of the process when operating with brand new membranes according to typical operating pressures, ows and a standard water temperature. Comparison of normalised process data against an operational baseline is the most e ective way of accurately identifying operational issues, such as fouling.
Membrane fouling and performance problems can be identi ed by monitoring changes to three key operational parameters:
• Permeate ow.
• Salt passage across membranes based on conductivity (EC) measurements.
• Pressure drop based on di erential Pressure (DP) measurements across each membrane stage.
Table 2 shows how the di erent parameters: permeate ow, salt passage and pressure drop; change in response to di erent problems associated with operation of a BWRO plant.
Symptoms
A general rule for optimal membrane performance and cost-e ective operations is to trigger a membrane clean when one or more of these deviates by 10% (permeate ow drop, salt passage and DP increase). Typically, in BWRO, colloidal and biofouling most commonly occur in the rst stage of the membrane process. Scaling generally occurs in the third and sometimes second stages as the concentration of salt increases in the concentrate, while organics fouling can be observed across all membrane stages (Figure 4).
As Avoca recently had a complete membrane changeout (August 2017), there has been little evidence of any noticeable membrane fouling. However, in the past, with the original membranes, and particularly towards the end of their operating life, the main fouling observed included silica scaling (2nd and 3rd stage), mild colloidal fouling (1st stage) and some organics fouling (all stages).
Unlike ultra ltration, RO membranes are not backwashed. Hence chemical cleaning is a critical means of controlling fouling. Once detected by any of the methods described above, foulants can be removed using the following methods:
• Biofouling: Biocide such as sodium metabisulphite at a dose of around 1000 ppm.
• Organics: Caustic clean (targeting a maximum pH) with or without additives. Some typical additives may include chelating agents (for example EDTA) or mild surfactants (detergents).
• Inorganic fouling and some scaling: Acid clean such as a hydrochloric acid (targeting a minimum pH).
• Silica fouling: is is particularly di cult to treat. In severe cases it may require cleaning with ammonium bi- uoride, an extremely hazardous activity as it produces hydro uoric acid.
Less severe cases may be addressed with a caustic-sodium lauryl sulphate clean. Important considerations for membrane cleaning include:
• Acid and caustic are usually dosed to achieve a target pH.
• Temperature of chemical solutions. Caustic cleans in particular need to be conducted with warm water (around 35ºC).
• Time of circulation and soaks. e soaks allow for foulants to be dissolved o the membrane and the circulation creates turbulence to ush the dissolved foulants away.
• Order of chemical cleaning – Never do caustic cleans last! is is because caustic cleaning solutions cause expansion of the membrane surface layer. is allows for better removal of foulants, but also greater salt passage across the membrane, and hence reduces permeate quality when the membrane is put back into service. Typical cleaning practice is to conduct an acid clean after a caustic clean. is allows the surface layer of the membrane to shrink back and restore the salt rejection capability.
e operators at Avoca generally aim for a preventative Clean In Place (CIP) regimen at around 8-week intervals. e most common CIP routines are:
• Sodium hydroxide at around 600 ppm to target a ph of 12 at a temperature of 35ºc, with a 30-minute circulation followed by at least a one hour soak.
• Hydrochloric acid, around 550 ppm to target a ph of 3 with a 30-minute circulation and at least 30-minute soak.
• Other cips may include a biocide clean with sodium metabisulphite. Rinsing with permeate is absolutely critical for the CIP cleaning, as well as for start-up and shutdown of the RO system. Failure to rinse and ush with permeate can cause a salt gradient across the membrane that can reduce performance and in extreme cases may even cause damage to the membrane.
e Authors
Lee Marshall (lee.marshall@chw.net. au) is Acting Water Treatment Team Leader with Central Highlands Water in Victoria and Kathy Northcott (kathy@ wioa.org.au) was the Technical Operations O cer with the Water Industry Operators Association of Australia (WIOA). Kathy is now with GHD in Victoria.
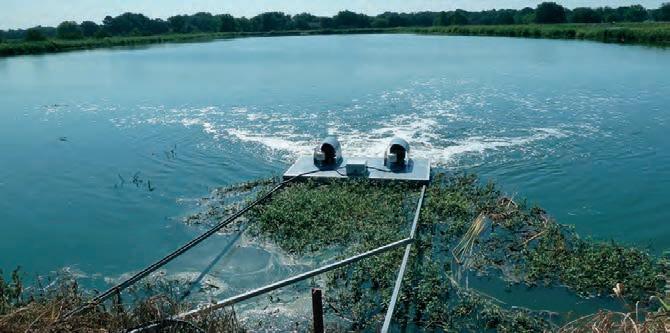
What is this aerator doing that no others can do?
It’s moving between one and two hectares of water with only 1.5 kilowatts of energy, and adding seven kilograms of dissolved oxygen (DO) per hour with only an additional 1.5 kilowatts of energy use!
e Lagoon Master™ water-moving aeration system from Royce Water Technologies is not just an aerator, it is also a water mover with the ability to deliver large amounts of DO using minimal energy. When compared to standard paddlewheel, vortex, hose diffusion, spray (fountain) or aspirating aerators, the Lagoon Master™ is more efficient, less costly to operate and requires less maintenance.
e Lagoon Master™ is a two-stage system that utilises two 1.5-kilowatt regenerative blowers. Stage 1, using one of the blowers, is the de-stratification phase, which involves continuously pushing every drop of water within one to two hectares (depending on water depth) of a pond or lagoon. Stage 2 is a second 1.5-kilowatt blower that can run continuously, or be initiated manually or automatically, to provide DO at a rate that is comparable to other aerators designed for shallow-water ponds or lagoons.
e use of this new aeration system will:
• provide better overall water quality
• eliminate the zero-oxygen deadzone on the lagoon bottom
• provide constantly moving water to assist in sludge organic breakdown
• provide dissolved oxygen at a controlled rate in order to save energy and oxidise waste gases.
One 2.4-metre Lagoon Master™ will move more than 34,100 cubic metres of water in a 24-hour period.
is is a lagoon or pond aerator that is designed for function, rather than power.
e Lagoon Master™ water-moving aerator provides the ability to rehabilitate wastewater lagoons by providing a cost-effective way to break down sludge naturally, using minimal energy, and putting aeration throughout the water column – where it is required. Algal blooms are reduced and DO is continuously provided to the bottom sludge to enhance natural organic digestion.
Features
• Only three kilowatts at maximum energy use.
• No propellers or shafts to foul.
• No belts or gearboxes to break or require maintenance.
• Non-corrosive materials of construction – anodised aluminum, high-density polyethylene (HDPE), stainless steel.
e Lagoon Master™ continuously moves the lagoon or pond water via vertical mixing for complete de-stratification, algal bloom reduction and natural sludge digestion.
It delivers more DO to the water per hour, lowers energy costs by up to 80 per cent and is practically maintenance-free for years.
e Lagoon Master™ eliminates trapped nitrogen and ammonia gases, and improves biochemical and chemical oxygen demand counts.
Lagoon Master™ applications include:
• sewage pond de-sludging
• recreational lakes and pond cleaning
• wastewater lagoon cleaning
• fish farming (grow-out pond cleaning)
• ornamental lake cleaning.


SELF CLEANING
IMPROVED PROCESS CONTROL
SIMPLE TO USE & INTUITIVE SOFTWARE
ROBUST BUILD QUALITY WITH STAINLESS STEEL & DELRIN OUTER CASING
EASY INTEGRATION
VIRTUALLY MAINTENANCE FREE

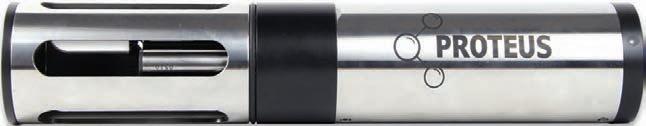


An award-winning multi-parameter, real-time sensor platform (portable or permanent) that accurately and reliably measures BOD, COD and faecal coliforms for permanent and temporary applications.

• BOD Loading to Wastewater Treatment Works (WWTWs)
• Combined Sewage Overflow (CSO) event monitoring
• Point Source Pollution monitoring
• Faecal Coliform monitoring
• Efficiencies of Wastewater Treatment Works
• Diffuse Pollution Monitoring
• Groundwater Water Quality Monitoring
• Survey tool combined with Bluetooth® APPLICATIONS

www.roycewater.com.au
PARAMETERS
• BOD
• Dissolved Oxygen
• Pressure
• Chloride
• pH
• Temperature
• Optical Brighteners
• Nitrate
• Faecal Coliforms
• ORP / REDOX
• Tryptophan
• Refined Oils
• Ammonium
• EC / Salinity / TDS
• Turbidity
• Crude Oils CDOM
• COD
• TOC