Managing Water Quality Risks During Extended Temporary Works At Griffith WTP
Cohuna Water Treatment Plant –How to treat the untreatable?
What in the world is WaterVal?
Best Practice Drinking Water Sampling for Microbial Testing
Moving forward on water operator competency in NSW
MESSAGE FROM THE EDITORIAL PANEL
Welcome to the May 2025 edition of WaterWorks, the technical publicationof theWaterIndustryOperationsAssociationof Australia (WIOA).
Included in this edition is an editorial by Matthew Brill (Wagga City Council and member of WaterWorks editorial panel), who provides his insights into biosolids management. This is from the perspective of his many years of practical experience in wastewater and solids management.
Josh Tickell and Lisa Andersons (NSW Department of Climate Change, Energy, the Environment and Water, DCCEEW) discuss how the Australian water industry continues to lag behind other technical industries when it comes to defining the key skills that operators need to do their jobs. They showcase the work being done by NSW DCCEEW, which has committed to continue working with utilities to implement an agreed state-wide training system, consistent with the Technical Competency Benchmark proposed by Water Research Australia (WaterRA).
Talking about WaterRA, and their latest research activities, the article ‘What in the world is WaterVal?’, describes how WaterRA is continuing to work towards a streamlined approach to water treatment process validation. This is to ensure water utilities can achieve compliance with the Australian Drinking Water Guidelines (ADWG), and Australian Guidelines for Water
Recycling (AGWR) microbial Health Based Targets (HBTs), and how to achieve optimum public health and environmental outcomes.
Additional operationally focused articles in this edition include: managing water quality risks during works at a water treatment plant, responding to water quality and process problems after a major flood event, and best practice techniques for the collection and transport of E. coli samples.
Finally, we are seeking three volunteers to join the WaterWorks editorial panel. Join the editorial team to help us get the latest technical and operational knowledge out to WIOA members. The editorial panel activities involve:
• attending editorial panel meetings and identifying articles for WaterWorks journal.
• editing one to two articles per edition.
• occasional editorial article writing.
• proof reading the WaterWorks journal prior to publication.
The panel will meet and welcome new members in July 2025, to commence work on the next edition of WaterWorks due for publication this November. We hope you enjoy the articles, happy reading.
David Sheehan, Senior Water Quality & Regulatory Advisor, Coliban Water
Matthew Brill, Water Reclamation Technical/Project Officer, Wagga Wagga City Council
Dean Barnett, CEO, WIOA
About this publication
WaterWorks is the technical publication of the Water Industry Operations Association of Australia (WIOA). It is published twice yearly. WIOA does not assume responsibility for opinions or statements of facts expressed by contributors or advertisers.
WaterWorks welcomes the submission of articles relating to any operations area associated with the water industry. Articles can include brief accounts of one-off experiences or longer articles describing detailed studies or events. Submissions may be emailed to: info@wioa.org.au
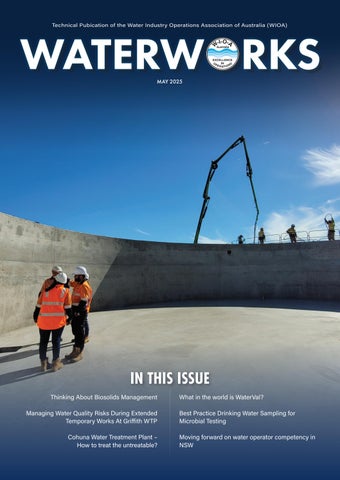
On the cover
Coliban Water operators onsite for the production of a new clear water storage tank at the Bridgewater Water Treatment Plant. Photo credit: Michael Tolhurst.
THINKING ABOUT BIOSOLIDS MANAGEMENT
Matthew Brill,WaggaWaggaCityCouncil,WaterReclamationProjectsOfficer
When talking about wastewater it is inevitable that eventually the conversation will turn to the back end of the plant and how we dewater waste sludge and dispose of the Biosolids. Over the last 17 years or so I have talked countless hours with colleagues about …. sludge and how we treat it. While it’s true we face an ongoing challenge of managing biosolids which, of course, is a by-product of our treatment processes, it is very interesting and exciting how processes and attitudes are changing. Instead of viewing them as waste, we have an opportunity to turn biosolids into valuable resources that benefit our facilities, the environment, and our communities. By embracing innovative approaches to biosolid management, we can enhance sustainability while supporting public health and economic growth.
One of the most beneficial uses of treated biosolids is land application.
When we ensure proper treatment, biosolids can be applied to agricultural lands, gardens, and landscaping projects. This practice enriches the soil with nutrients, reduces the need for chemical fertilisers, and promotes sustainable agricultural practices—something we can all feel good about. However, with emerging contaminants like PFAS and the fact that there isn’t unlimited land that is suitable for application, there needs to be alternatives.
To maximise the value of biosolids, we need to focus on effective treatment and stabilisation methods. Here are some approaches that can make a difference in our operations:
1. Anaerobic Digestion: This process breaks down organic matter in the absence of oxygen, producing biogas—a renewable energy source. Not only does this stabilise the biosolids, but it also generates energy that can power our facilities or be fed
back into the grid, helping to offset operational costs.
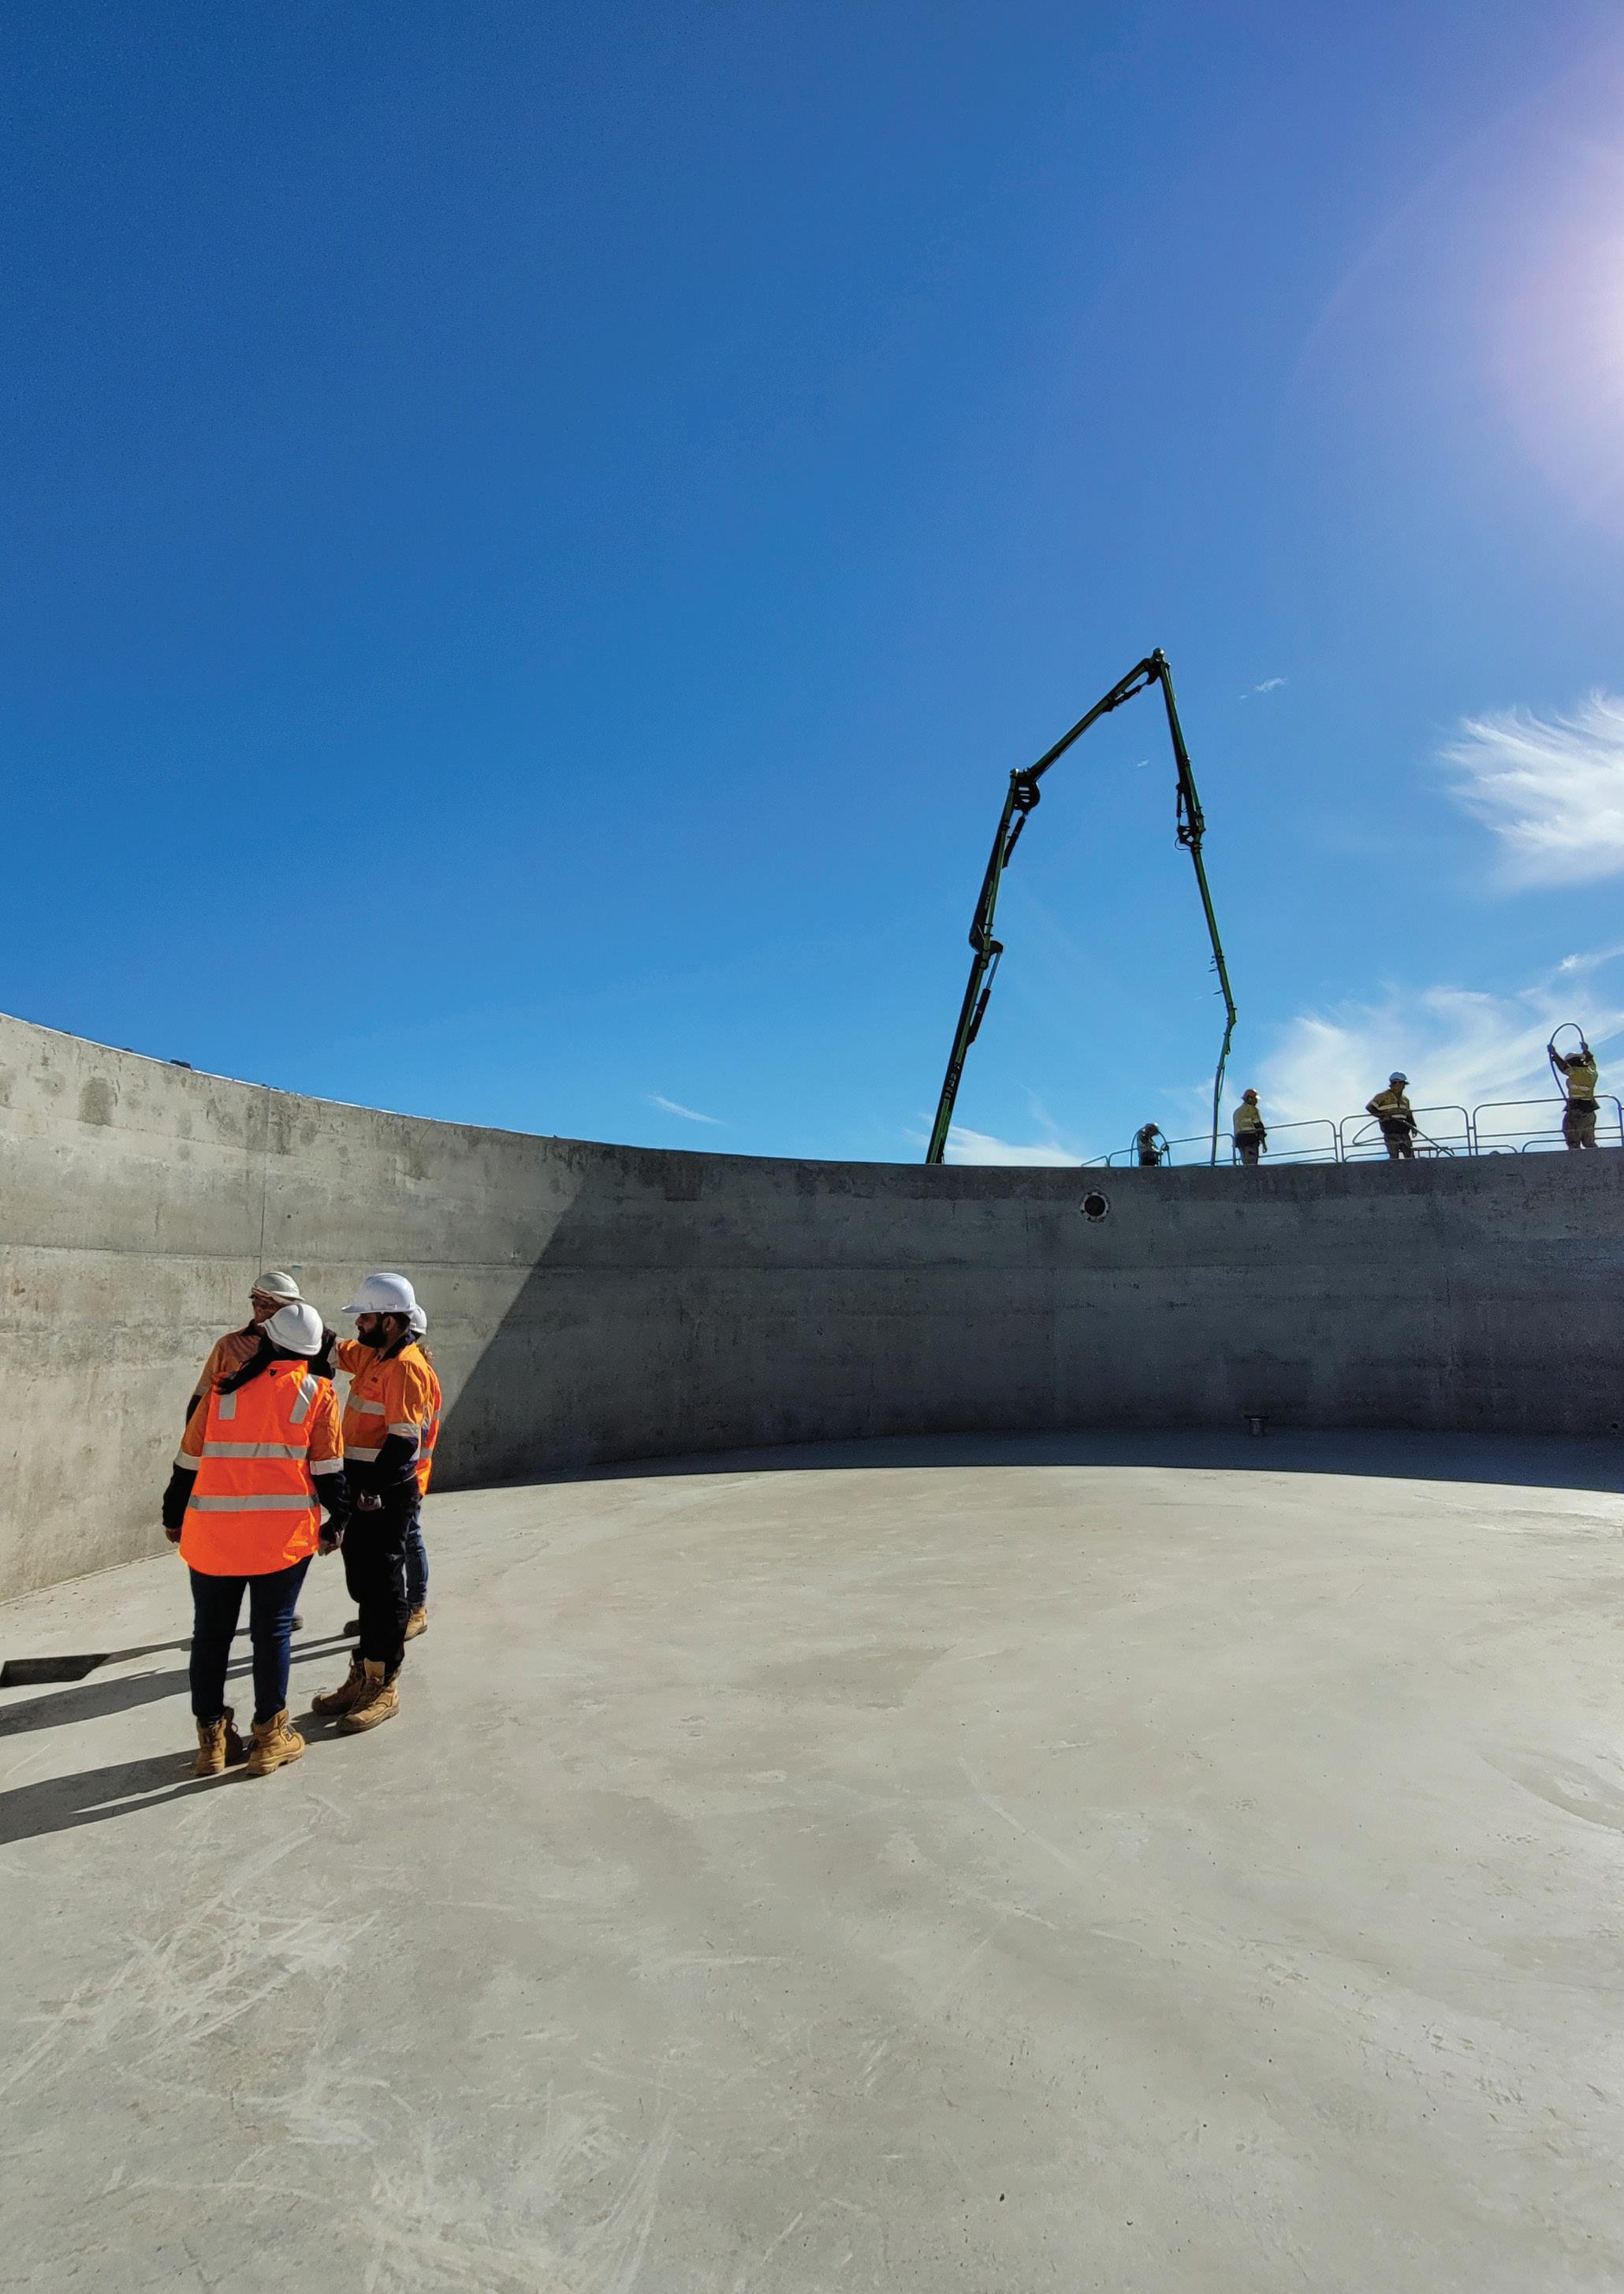
2. Gasification: An exciting technology in biosolid management, gasification converts organic materials into synthesis gas (syngas) through hightemperature processing with limited oxygen. This syngas can then be used to generate electricity or produce biofuels, significantly reducing the volume of waste while providing a sustainable energy source.
3. Composting: Composting biosolids with other organic materials creates high-quality soil additives that improve soil structure and provide essential nutrients for plants. This practice not only recycles nutrients but also supports local agriculture.
4. Thermal Drying: By reducing the moisture content of biosolids, thermal drying makes them easier to handle and transport. Dried biosolids can be used as a soil conditioner or processed into energy pellets for further use.
Figure 1: Biochar from gasification of biosolids.
Figure 2: Composting Windrows for organics and biosolids.
As operators, we have a unique opportunity to recover energy from biosolids. By harnessing the biogas produced during anaerobic digestion and the syngas generated from gasification, we can significantly reduce our reliance on fossil fuels. Additionally, processing biosolids to recover valuable nutrients closes the nutrient loop, allowing us to repurpose them as fertilisers.
Through technology and actions, we can transform biosolid management from a challenge into an opportunity. By embracing innovative treatment techniques like gasification and anaerobic digestion, promoting land application, and engaging our communities, we can turn biosolids into a sustainable asset. In my opinion, prioritising effective biosolid management will be key to building a more sustainable future for all of us in the water industry.
Water consultants
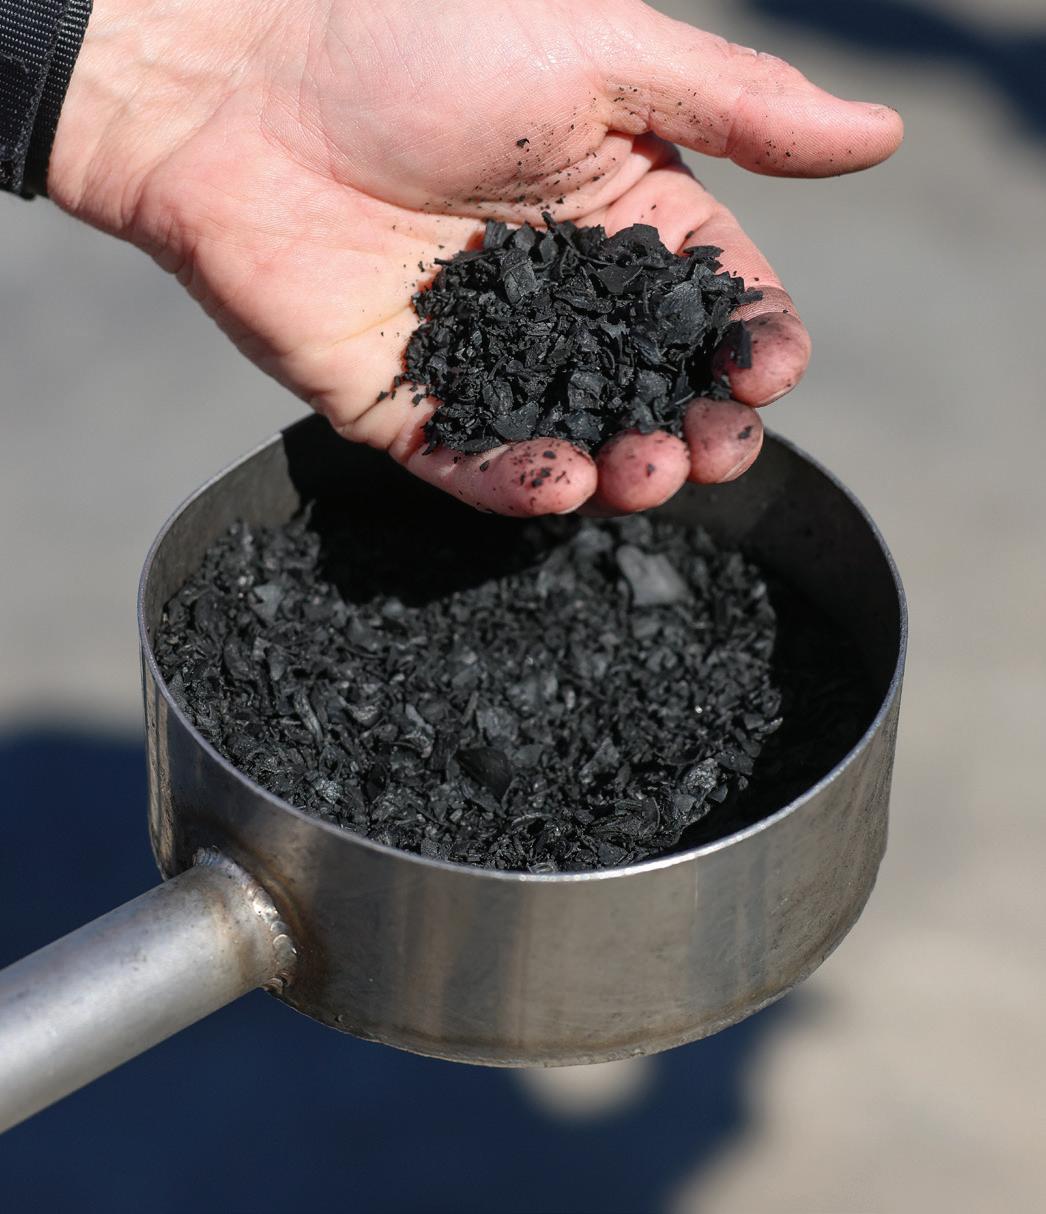
Figure 3: Biosolids Gasification Facility.
MANAGING WATER QUALITY RISKS DURING
EXTENDED TEMPORARY WORKS
AT GRIFFITH WTP
David Bartley,Headof OperationsSupport,AtomConsulting
Extended plant refurbishment or upgrade works at water treatment plants can introduce additional risks to drinking water quality, particularly when existing chemical dosing and treatment barriers require refurbishment or augmentation. Such refurbishment and upgrade works were required to be undertaken at Griffith Water Treatment Plant (WTP), which is owned and operated by Griffith City Council (GCC).
The first project involved a practical investigation of coagulant dosing and treatment configurations during the remediation of the flocculation and Dissolved Air Flotation (DAF) tanks. The second project involved planning for the remediation and upgrade of the existing Clear Water Tank (CWT), as well as replacing the existing 1-megawatt high voltage clearwater pumps.
GCC engaged Atom Consulting to assist with both these projects.
The following summarises how practical, bench-scale methods can be used alongside qualitative consideration of risk in one instance, and how existing risks can be recontextualised to inform the planning for extended temporary works and mitigate potential water quality impacts.
Griffith Water Treatment Plant
The Griffith WTP was commissioned in 1987, with a capacity of 60 ML/day, and currently supplies drinking water to more than 25,000 people. The Griffith WTP is the only water treatment plant in Griffith and, therefore, it cannot be offline for more than 3 days during winter.
Raw water for the Griffith WTP is sourced from the Murrumbidgee Irrigation Canal and is stored in an
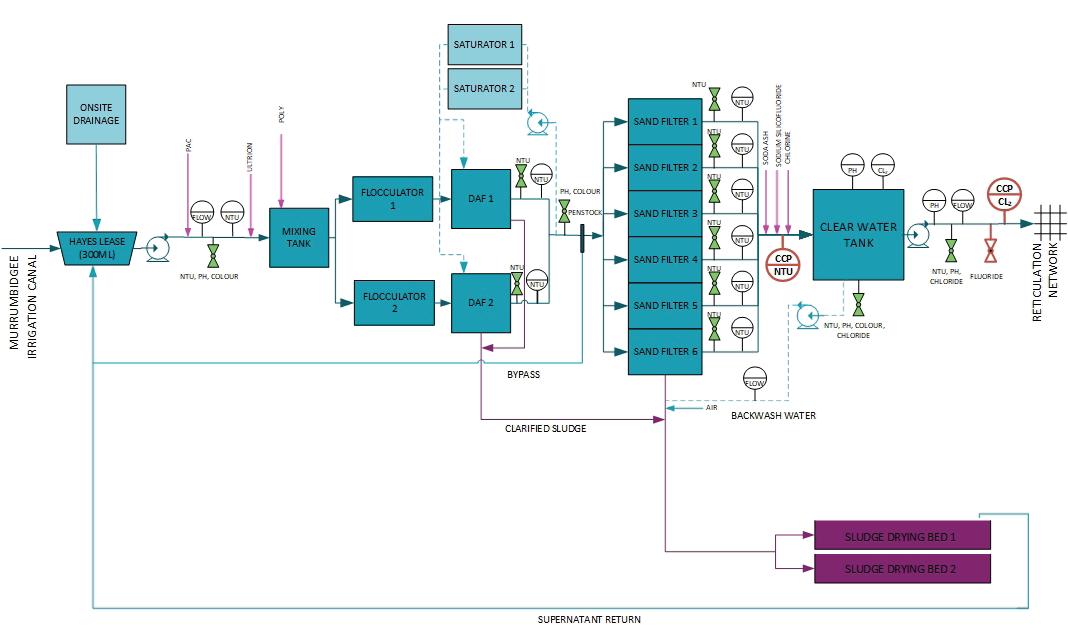
offline storage. The current treatment process consists of coagulation, rapid mixing, flocculation, DAF, dual media rapid filtration and chlorination (Figure 1).
Raw water that has been dosed with coagulant flows into a common rapid mix chamber before being split between two identical flocculation and DAF trains. DAF subnatant flows into the filter inlet channel, which distributes the water between six dual media filters. Filtered water then flows into the clear water tank (CWT). Chlorine and fluoride are dosed at the inlet to the CWT, as the filtered water flows over a weir into the CWT. The plant is operated to produce a maximum flow of 60 ML over 22 hours of continuous operation (i.e. 758 L/s).
Over the years GCC has undertaken refurbishments and upgrades, but more work is now needed on certain concrete
Figure 1: Griffith WTP process flow diagram.
structures due to asset age, soft water attack, water erosion and low pH (due to aluminium sulphate dosing).
GCC are currently progressing the Griffith WTP masterplan, which involves reviewing options for high priority works as well as developing a long-term plan for the Griffith WTP. We have also conducted a water quality risk assessment with NSW Health to assess the risks of extended temporary modifications to the plant’s treatment process and capacity as part of the Griffith WTP masterplan upgrade.
shutdown works
When planning for the extended shutdown of key treatment processes, water utilities can face the tension of maintaining their assets whilst causing minimal negative impact on levels of service for water quality and continuity of supply. Structural limitations, such as the age of the plant, or lack of redundancy in the design, can further complicate this task.
External factors, such as more conservative operational targets, tightening regulatory values, and raw water quality beyond the original design envelope can also complicate maintenance and upgrade planning
processes. These are all issues that GCC had to navigate in preparation for their projects.
GCC are currently planning for two periods of extended temporary works at Griffith WTP. The first project involves the draining and remediation of the concrete rapid mixing, flocculators and DAF outlet channel. These works are expected to take approximately 4 weeks and will be undertaken during winter 2025.
Normally, water quality risks during temporary works to either the flocculation or DAF processes can be mitigated by shutting down and draining one train at a time. In this instance, however, taking the common rapid mixing tank and the common DAF outlet channel offline would impact both trains simultaneously, and require the coagulant dosing point to be moved or the rapid mixing tank to be bypassed. GCC engaged Atom Consulting to conduct investigative jar testing to replicate potential dosing configurations and determine the water quality risks of potentially bypassing treatment barriers.
The second project involved planning for the remediation and upgrade of the existing CWT, as well as replacing the existing 1-megawatt high voltage
clearwater pumps. The upgrade work is needed due to the condition of the concrete in the CWT, but also due to the age of the high voltage pumps. Atom Consulting facilitated an options and water quality risk assessment workshop for the Griffith WTP masterplan, which would involve a temporary clear water storage and pumping arrangement while remediation works occur on the current tank.
In both instances, GCC has sought to find a cost-effective approach to safely take process units offline without compromising drinking water quality.
Jar testing investigation
Although jar testing is typically used to optimise chemical dosing, Atom Consulting and GCC utilised this bench-scale method to simulate several alternative treatment configurations and scenarios, including changing the coagulant dosing location and temporarily converting the plant to a direct filtration process.
GCC had originally proposed to bypass the rapid mixing, coagulation and DAF processes by supplying dosed raw water directly to the filter inlet channel. This was seen as a cost-effective solution; however, the potential water quality impacts were unknown. Several alternate options for the bypass were identified for testing including:
• Keeping the existing dosing location
• Moving the dosing location to the raw water pump station to provide additional mixing
• Using alternative coagulants
• Installing a temporary flocculation process
The coagulant used for the jar testing was aluminium chlorohydrate (Ultrion 44560). Alternative coagulants were used for two tests to determine if any of these alternatives would be more effective.
Key flow and mixing parameters for the existing process were calculated for each option, based on the rapid mixing and flocculation resident times and the mean velocity gradients of the mechanical mixers. For the testing of alternative dosing points and the use of a temporary flocculation tank, the mixing velocity gradient was estimated from typical design values.
Table 1: Jar testing scenarios.
At the time of jar testing, the dose rate of Ultrion 44560 was 9.1 mg/L, and this was used in all jar tests as a reference value. The jar testing scenarios are shown in Table 1.
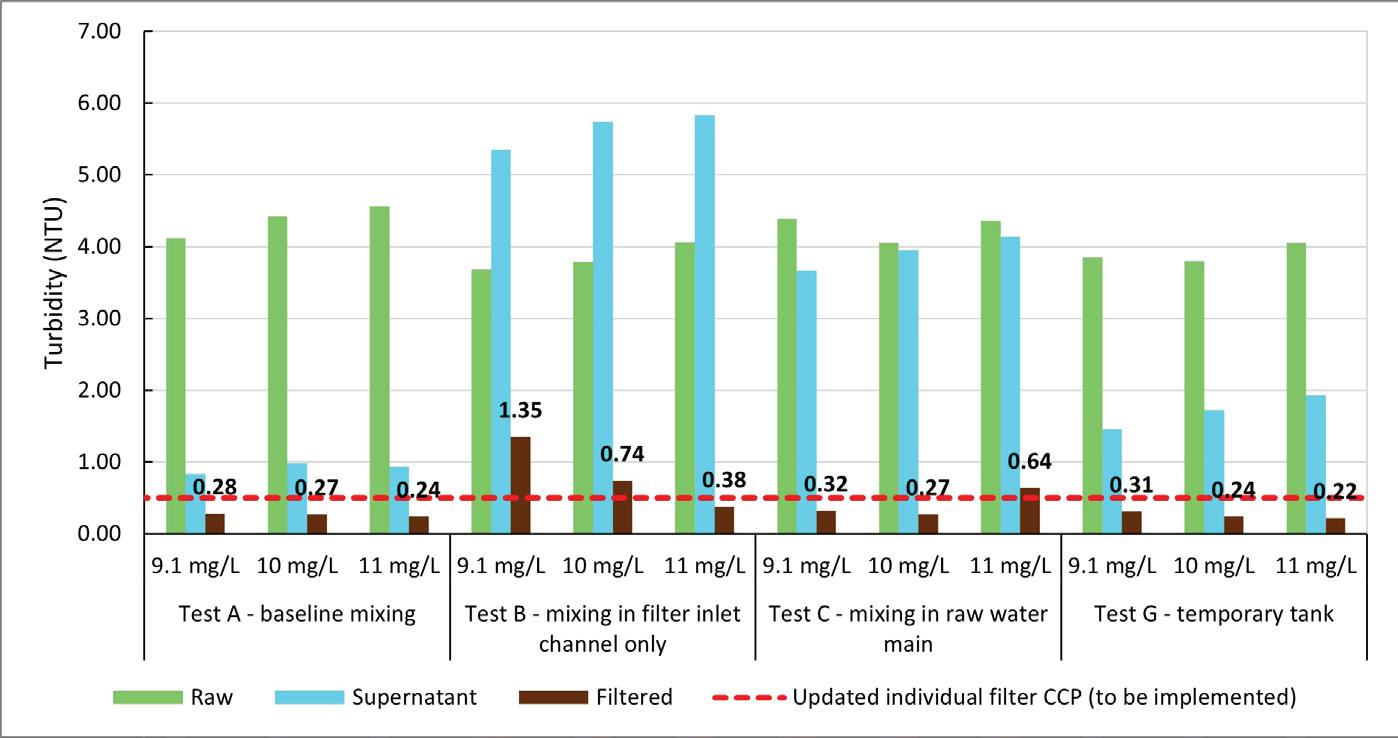
The results of the jar testing are shown in Figures 2 and 3.
The baseline performance in Test A (Figure 2) produced a medium floc of between 0.5-1.0 mm in size, which is optimal for a DAF process.
Test B (Figure 2) showed a higher sensitivity to coagulant dose, which is attributable to the short mixing time and low energy input from the hydraulic mixing in the filter inlet channel. Flocculation only in the filter inlet channel (Test B) provided very little opportunity for floc growth. Mixing produced suspended particulates, with no settling being evident.
Ultrion 44560, Ultrion 44697 and alum were used in Tests C (Figure 2),
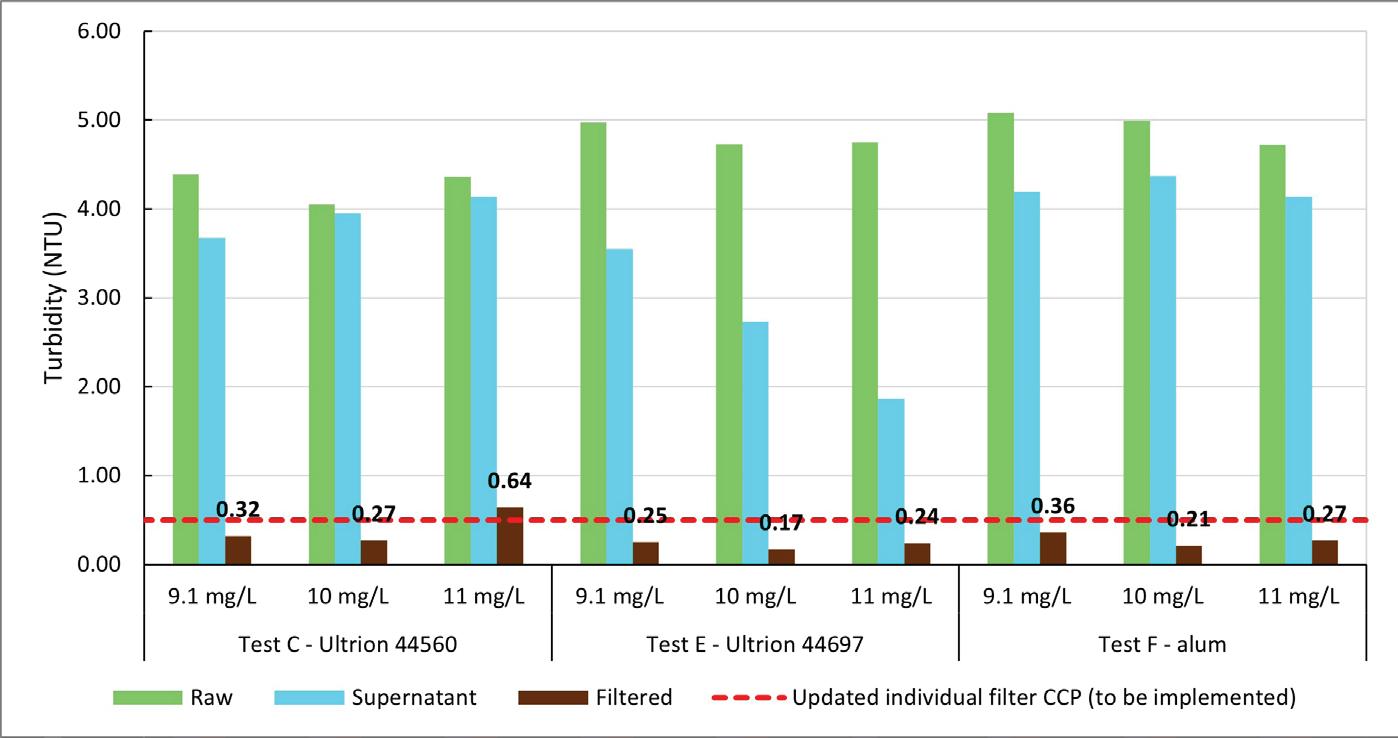
and E and F (not graphed), respectively. Turbidity results showed that the Ultrion 44697 tended to provide greater settling, which increased with dose. Alum tended to be less effective at true colour removal and lowered the pH with increasing dosage.
At the time of jar testing, the turbidity in the offline storage at Griffith WTP was low. To assess the performance of the different options with higher turbidity and colour, samples were collected from Yenda WTP, which collects raw water directly from the Murrumbidgee Irrigation Canal. The results of this jar testing are shown in Figure 3.
Tests C (Figure 2), and D and H (Figure 3) demonstrated the viability of dosing coagulant at the raw water pump station. After settling and filtering, Test H demonstrated that filtered water turbidity below the critical limit set for the post-filter CCP could be met.
The raw water main would provide considerably more residence time, and a higher degree of hydraulic mixing, compared to the filter inlet channel alone.
Floc sizes observed throughout the investigation were typically <0.3 mm during low raw water turbidity conditions (Tests C, D, E, F), and were around 1.0 mm for higher raw water turbidity conditions (Test H). The absence of large floc sizes (1.5 to 5 mm) for the pipe mixing option would indicate that the risk of large, dense floc settling on the filter media during this configuration is relatively low.
Pathogen considerations
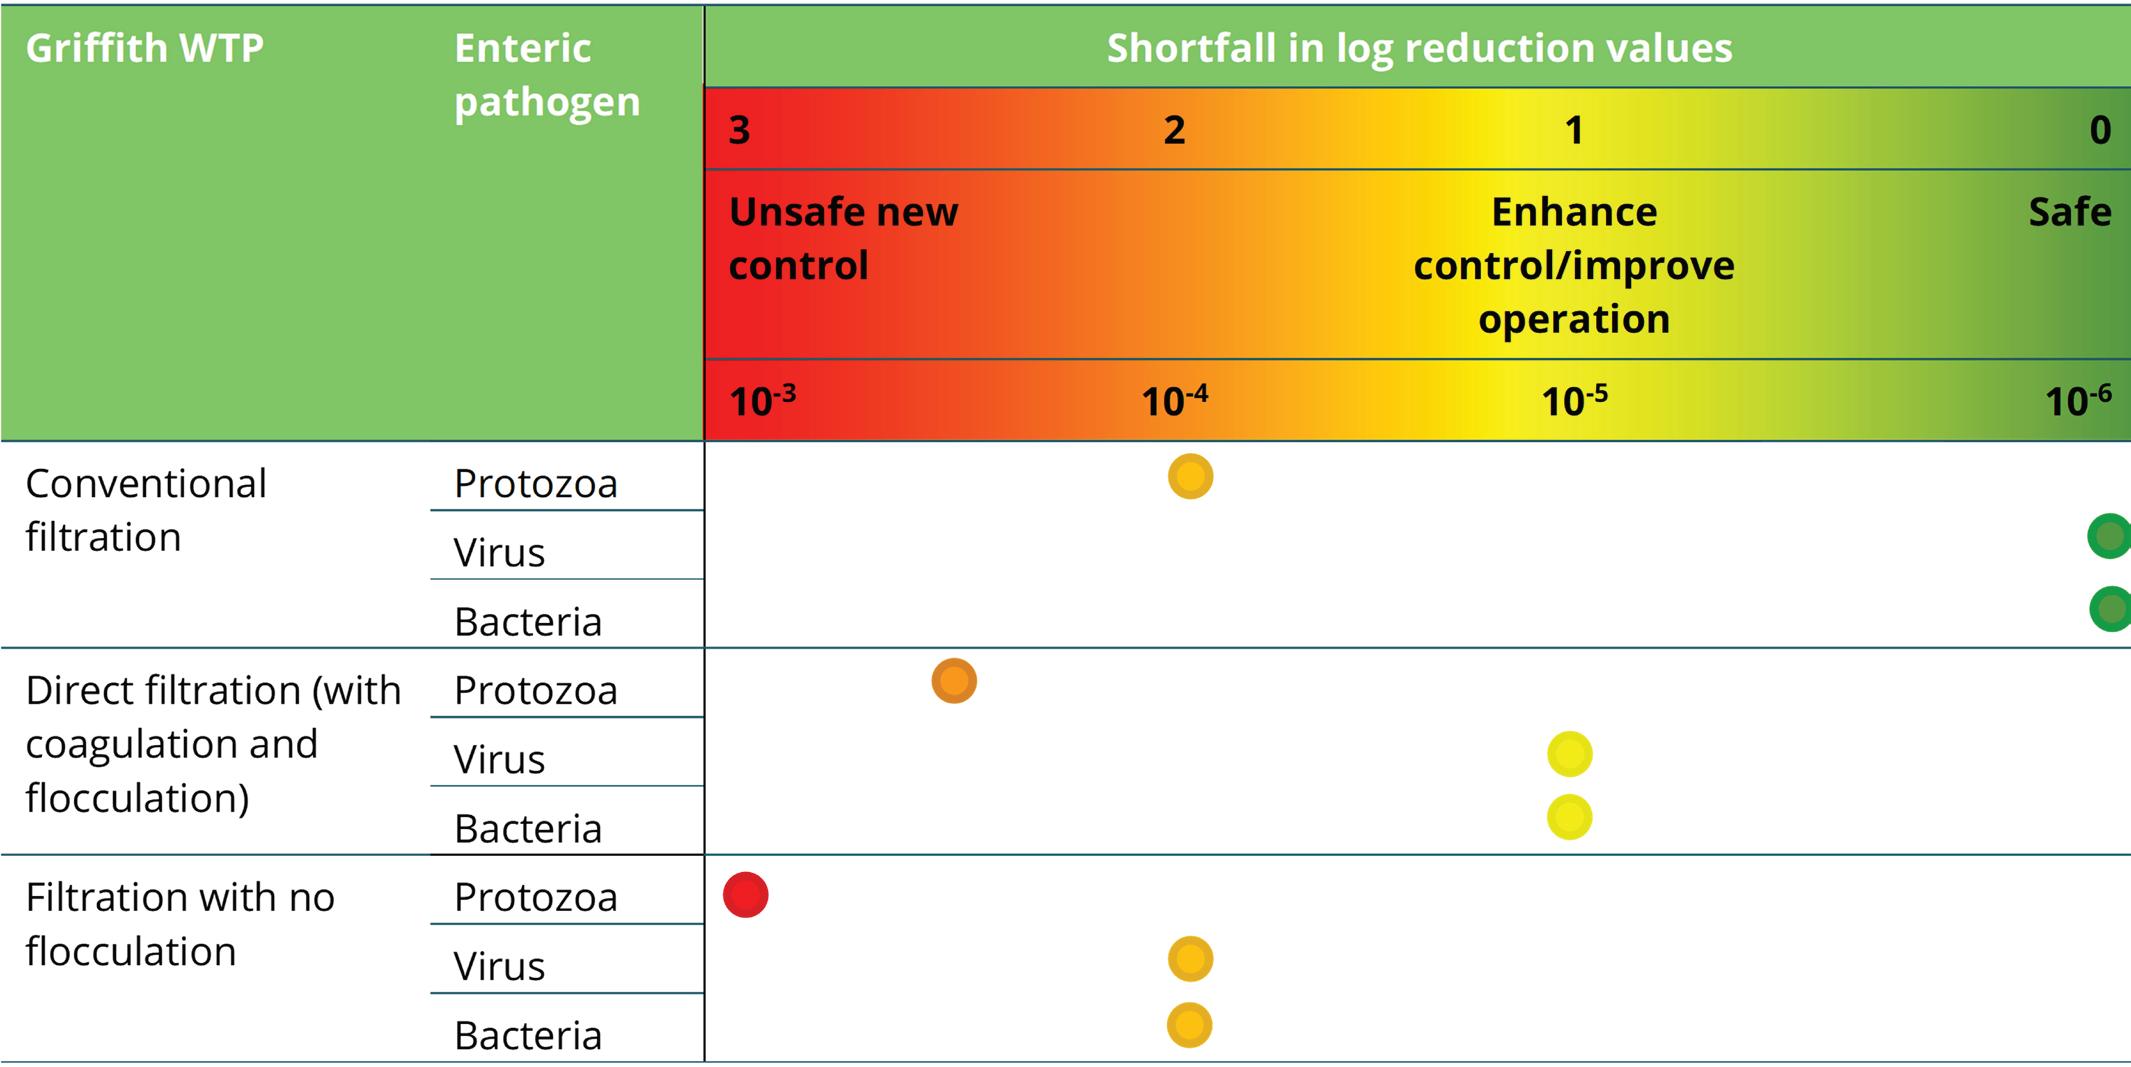
The shortfall in log reduction values (LRVs) for the proposed options for the temporary process modification are shown in Figure 4. Removing the flocculation and DAF processes introduces a 1 LRV shortfall for viruses and bacteria, and 2.5 LRV shortfall for protozoa. This puts the shortfall into the unsafe area of the water safety continuum that forms part of Chapter 5 of the Australian Drinking Water Guidelines (ADWG).
The jar testing showed that the critical limit for turbidity at the relevant CCP could be achieved if the flocculation and DAF processes are bypassed and coagulant is dosed at the raw water pump station. However, removal of the sedimentation process reduces the LRVs to an unsafe shortfall. This shortfall was a risk that GCC were not prepared to accept.
An alternative method to refurbish one flocculation train at a time was identified. This would require the rapid mix chamber and DAF outlet channel to be bypassed, which would require the temporary pipework and pumps. This cost to ‘buy out’ the water quality risk was preferred above the risk of supplying unsafe drinking water, or the cost to the community of having to put a boil water notice in place for the duration of the works.
Temporary clear water storage and pumping
Recent condition assessments revealed that concrete refurbishment is needed in the CWT at Griffith WTP. It was
Figure 2: Jar testing turbidity results.
Figure 3: Turbidity results from varying raw water quality.
proposed that temporary storage and pumping arrangements be put in place to allow the CWT to be taken offline while the concrete remediation work is conducted. As the CWT is used for chlorine contact time, any temporary works would need to ensure the C.t value of 15 mg.min/L could be met before supply to the first customer.
The high voltage existing clear water pumps are nearing the end of their life, and it is difficult to procure spares. As the high voltage pumps are fixed speed and operate intermittently, they are inefficient during startup and shutdown. It was therefore proposed to replace these pumps with low voltage pumps with variable speed drives at the same time that the CWT was offline for repair.
It was planned that the works would be undertaken during winter when the demand for drinking water is lower. This would allow the capacity of any temporary storage and pumping to be minimised.
These works were assessed as part of the masterplanning project for the Griffith WTP. This was to ensure that any immediate work that was undertaken was consistent with the long-term plan for the upgrade of the WTP, which is being designed to meet future capacity
and water quality standards.
During the planning phase, additional options were identified, including construction of a new CWT, new clear water pump station and different locations for new switchgear. These options are currently being assessed and have different costs, and some are more suited to the addition of UV disinfection in the future to meet microbial healthbased targets (HBTs).
A water quality risk assessment workshop was also held to ensure that the relative risk to drinking water quality of each option and the actions needed to mitigate the risks could be identified and incorporated into the options development and assessment.
Conclusion
Major asset maintenance that requires plant reconfiguration and the bypassing of the water treatment processes must be planned, including an understanding of the risks to drinking water quality during such maintenance. This assessment may include bench or full-scale trials before the maintenance is undertaken. Representatives of all operation and maintenance staff should be involved in this process.
The relative costs and risks of all
options should be assessed so that water utilities can make an informed decision on how much additional cost is acceptable to “buy out” the risks.
Asset maintenance work should also consider how the refurbished assets will fit into the long-term planning for the WTP.
Acknowledgements
The authors of this paper would like to thank Griffith City Council for their support and permission to publish the information and lessons learned from the projects that are presented in this paper.
Advertise in WaterWorks
We have advertising spots available in our next issue.
WaterWorks is WIOA's technical publication, produced bi-annually. It includes operationally focused articles and technical information and enjoys a wide distribution across the water industry.
Scan the QR code for more information, or email info@wioa.org.au
Figure 4: Water safety continuum – water supply system shortfalls in log reduction values (LRVs).
Introduction
COHUNA WATER TREATMENT PLANT –HOW TO TREAT THE UNTREATABLE?
Coliban Water experienced significant infrastructure impacts because of the 2022 floods in northern Victoria. As the floodwaters receded, and the clean-up commenced, a less visible risk emerged, a severe deterioration and huge variability in source water quality, including in the source water for the Cohuna WTP.
This article details how Coliban Water and its service delivery partner, Service Stream, worked together to respond to the incident. This includes a list of lessons learned from the incident, which may be of use to other water suppliers that are faced with treating extremely poor-quality source water.
Cohuna Water Treatment Plant
The township of Cohuna is located within the Gannawarra Shire, in northern Victoria. The Cohuna WTP is a conventional WTP and has a treatment capacity of 3.8 ML/d (operating 16 hrs/
day). The source water for the Cohuna WTP is Gunbower Creek, which is fed from the Murray River.
The WTP consists of the following processes:
• Chemical Dosing of:
- Powdered Activated Carbon (PAC) to help with the removal of residual cyanobacterial toxins, and taste and odour compounds.
- Caustic soda for pH correction (pre and post full treatment) to improve flocculation / coagulation and to reduce the corrosivity of the finished water.
- Aluminium sulphate for effective coagulation
- Sodium hypochlorite for the preoxidation of metals onto the dual media filters
- Gaseous chlorine for disinfection
- Sodium fluoride to improve oral health
• A sludge blanket clarifier for sedimentation
• Dual media filters for rapid gravity filtration
• Approximately 3.5 megalitres of combined Clear Water Storage
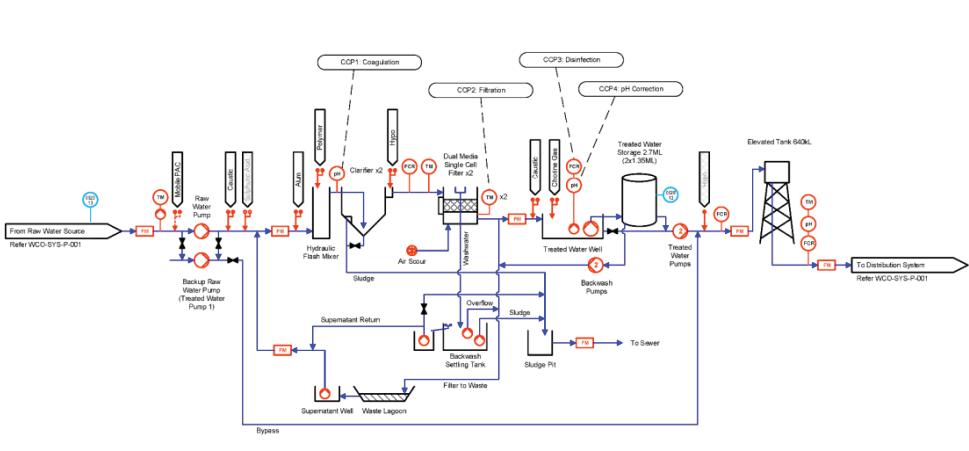
The process flow diagram for the WTP is shown in Figure 1.
There has been some form of water supply onsite at Cohuna WTP since 1901, but much of the major civil infrastructure was built in 1967, with older process equipment replaced, or much of currently available equipment added, in the early 2000s.
The raw water quality that is now seen post major flood events is well beyond the designed treatment envelope of the Cohuna WTP. As a result, the treatment operations team must rely on experience, innovation, and fast thinking to respond to the unknowns that occur during such events, to
Figure 1: Cohuna WTP Process Flow Diagram. Figure 1 - Cohuna WTP Process Flow Diagram
maintain the supply of safe drinking water to the Cohuna township.
Raw water quality impacts at Cohuna WTP post 2022 floods
Following a period of dry conditions, in late 2022 severe wet weather resulted in flooding across much of Northern Victoria. This led to significant surface water run-off into the Murray River catchment.
The storms washed dried organic matter into the river system that had been accumulating for up to a decade. This sudden influx in organic matter resulted in a notable change to raw water quality. Table 1 below compares raw water quality results in a typical November to January period (2021/2022) against raw water quality results experienced during the post flood period (2022/2023).
As can be seen in Table 1, the floods resulted in a noticeable increase in almost all raw water quality parameters, including a dramatic increase in colour. The only decrease observed was in turbidity. These
flood conditions proved challenging for the Cohuna WTP, with raw water quality being outside the designed treatment capacity envelope.
To ensure that the impact to treated water quality and production was minimised, a suite of changes had to be rolled out rapidly, and each of the sections below captures key issues and what was done to address them to keep the Cohuna township supplied with safe drinking water.
The ten learnings from the incident are shown in Table 2.
Issue 1 - site access and operator fatigue
During the 2022 floods, rapid action was taken across the Coliban Water region to protect critical infrastructure. This included building an earthen levee and sandbag walls around at-risk assets. Most treatment team personnel were also heavily involved in these flood protection efforts. As a result, when raw water quality issues began to emerge, we had a site with difficult access and an exhausted team.
Works were undertaken to restore safe access through the excavation of access points and the removal of sandbags, which had become a trip hazard. To improve the situation, operator assistance was provided by Veolia with temporary operators brought in to provide respite for the team.
Issue 2 - Raw water weeds
Goulburn-Murray Water (GMW) typically undertakes weed spraying along Gunbower Creek to keep aquatic weeds controlled. However, due to the floods, GMW could not safely access the area to undertake this routine spraying. The resulting weed growth was so thick in Gunbower Creek that birds could literally walk on water, the weeds clogged the entire water column (Figure 2). This resulted in regular blockage of the raw water pump inlets. Manual cleaning of the inlets had to be increased to three times daily, 7 days a week.
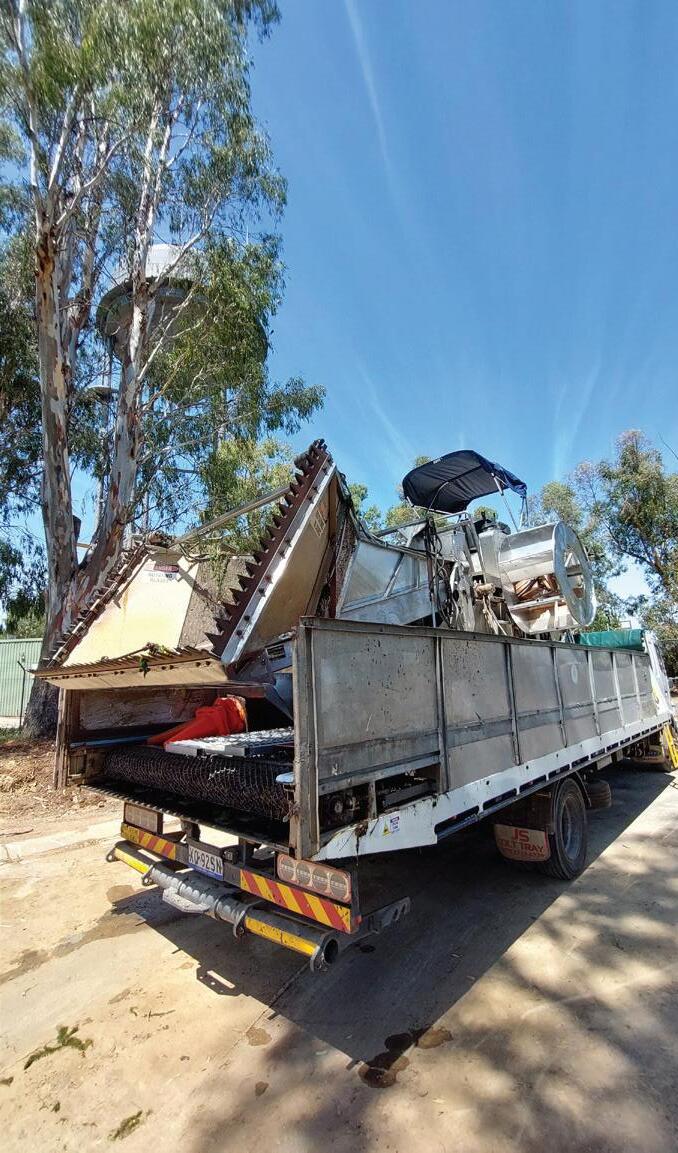
To minimise the impact to the treatment team, the networks team assisted in removing weeds from the inlet, and, after reaching out to GMW to see if they had any suggestions, GMW organised for a ‘weed muncher’(Figure 3) to attend site and clear out the creek.
Issue 3 - High organics and low turbidity
The raw water was found to be incredibly difficult to treat, particularly due to the combination of low turbidity and high dissolved organics. It was identified that standard coagulation was not working, and operator experience indicated that Enhanced Coagulation was a potential solution.
Enhanced Coagulation refers to the practise of dosing a coagulant, typically alum, at high concentrations and low pH, to increase the removal of Natural Organic Matter (NOM) during the coagulation process.
Table 1: Raw Water Quality Comparison Typical vs Post Flood.
Jar testing was undertaken, and the results for Enhanced Coagulation were positive. A new caustic line was installed to allow Enhanced Coagulation to be undertaken. The trial was a success.
Issue 4 - Light floc
Due to the low turbidity of the raw water, the floc in the clarifier was found to be extremely light. As a result, the sludge blanket in the clarifier would continually lift, break up and carry over into the filters. This quickly resulted in an exceedance of the critical limit for the clarifier at the turbidity Critical Control Point (CCP), which, when exceeded, shuts down the WTP.
When this occurs, it requires operator site attendance to restart the WTP. To manage the light, floating sludge blanket uplift, the following actions were undertaken:
• Jar testing to optimise chemical dosing.
• Poly dosing trials, followed by returning the poly dosing system to operation.
• Continual visual monitoring and stopping the plant to let the blanket settle.
• Installation of shade covers to reduce potential heat impacts.
• Increased PAC dosing to add extra weight to the formed floc to aid settling.
• WTP production reduced from 50 L/s to 25 L/s, as lower flows resulted in less uplift.
Issue 5 - Low plant throughput
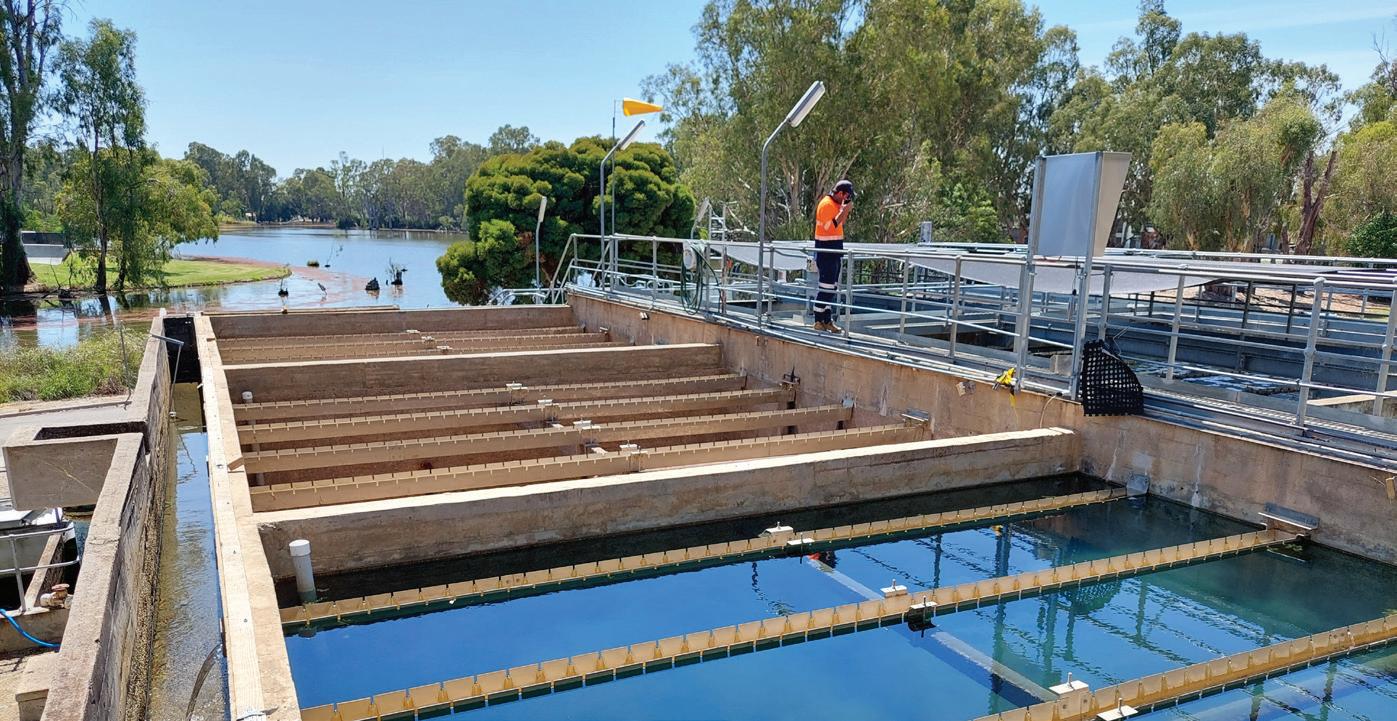
The WTP could not treat the water at a rate which allowed us to keep up with town demand. Therefore, to increase the clarification surface area we decided to reinstate three decommissioned clarifiers (Figure 4) that had been out of service for more than 20 years! Asset condition assessments and works included:
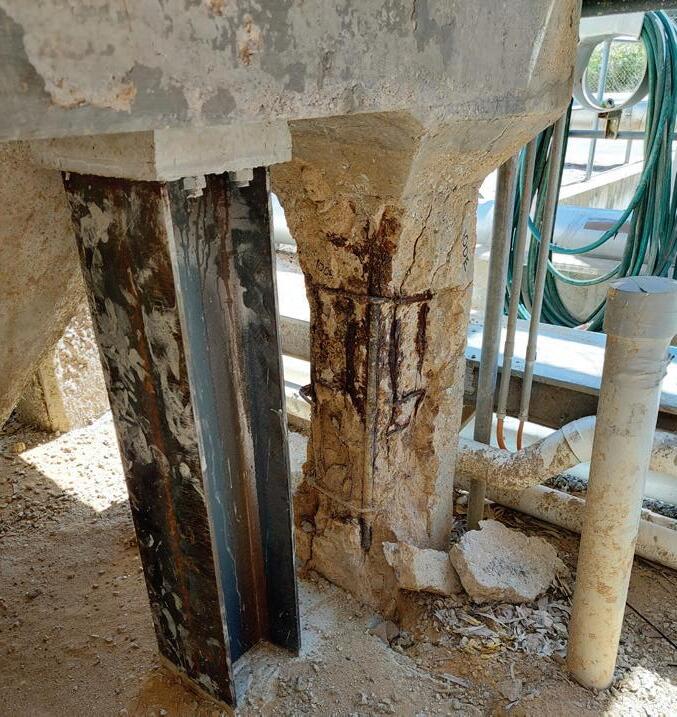
• Structural assessments. Footings were exposed and analysed, designs were drafted, and steel supports fabricated and installed (Figure 5).
• Redundant bypasses were removed, and new sludge pipework/valves installed.
• New inlets were designed and installed
• All debris / leaf litter was removed, and the clarifiers cleaned.
Following the completion of all the civil works, hydrostatic testing was undertaken, and it was identified that only one clarifier could be used due to leakage. This was still one more clarifier than we had before, so a positive outcome. The new clarifier was returned to service, which allowed the WTP flow rate to be increased to 35-40 L/s. All clarifiers have since been completely refurbished.
Issue 6 - High concentrations of metals
High concentrations of metals (specifically, iron and manganese) in the raw water required the dosing of sodium hypochlorite for pre-oxidation. However, due to the high organics in the raw water, there was high chlorine demand. Therefore, to effectively remove the metals, the chlorine dose had to be increased, however, high organics + high chlorine resulted in increased concentrations of THMs (a DBP). This became a balancing act, i.e., add only enough hypochlorite to remove metals, whilst being mindful of potential THM production.
Issue 7 - 24/7 Operation and fatigue management
Coliban Water’s WTPs are typically designed to operate around 16 hrs/day. However, during the poor raw water quality period, the Cohuna WTP was running 24/7. This resulted in both the plant and our team being pushed to the limit.
The greatest concern was fatigue management. Regular team rotation was undertaken, and on ground assistance was provided by outsourced operators, as well as ex-operators, where possible.
Figure 2: Gunbower Creek Weed Infestation.
Figure 3: The 'Weed Muncher'.
Issue 8 - Asset failure
Needing the WTP to operate 24/7 meant assets were running hot, and downtime was in short supply. This often led to asset failures, with minimal time for repair. Examples that occurred during the event included:
• The burn out of a unique duty only low lift pump. Thankfully, a local fabricator had a spare available from a previous job.
• Assets that were exposed to the sun were overheating and/or gassing off, e.g., the sodium hypochlorite system. We had to erect temporary shade structures.
Issue 9 - Demand exceeding supply
Even with all the above works completed, we still could not supply enough drinking water to keep up with demand. As a result, we undertook a staged demand management response:
a. Engaged with the community.
We worked with Gannawarra Shire to turn off watering systems and used communication channels, such as social media, to ask the community to limit water use.
Water Carting
We undertook a major water carting effort. This included:
• Installing fill points,
• Bringing in additional gravel to improve truck access.
• Erecting boom lighting and the establishment of traffic management.
• Working with many trucks/drivers from across the region.
b. Reduced pressure to town
We partially closed a valve entering the township to reduce pressure to reduce demand.
c. Last Resort - Reducing customers.
As a last resort, to ensure that the supply to Cohuna’s urban system customers was maintained, Coliban Water had to restrict flow to ‘Supply by Agreement’ customers in the majority of Cohuna’s rural supply system. Forward notice was provided to customers via door knocking. As such, these schemes were depressurised, and a Boiled Water Advisory put in place. A Section 22 notification to the Department of Health under Victoria’s Safe Drinking Water Act 2003 was also undertaken. Supply was returned once raw water quality improved.
Conclusion
Events like this challenge an organisation, and place staff under enormous pressure to deliver results in circumstances where there is no rule book to follow. Each event is unique, but we would like to provide this summary of what we learned out of this event (Table 2), which may be useful for others who may face similar challenges.
Key learning
1 Raw water quality is deteriorating; storms exacerbate the issue, be ready.
2 This is a marathon not a sprint, maintain a safe environment and ensure adequate periods of rest.
3 Reach out for assistance, you never know what others can offer.
4 Issues have often been overcome before, learn from operator experience.
5 Minor issues can result in major headaches. Go hard and go early.
6 Identify potential contingencies, you never know when you may need them.
7 Water treatment is a balancing act; every action has a consequence.
8 Fatigue management should always be front of mind. Help each other out.
9 Carry critical spares, maintain assets, and incorporate weather protection.
10 Work with your community, face to face is always best.
Acknowledgements
The authors would like to thank and acknowledge all their colleagues at both Coliban Water and Service Stream who went above and beyond for their community, to ensure the supply of safe drinking water to Cohuna, despite the challenging condition.
We would also like to acknowledge Veolia for volunteering to assist in a time of need.
Figure 5: steel supports for returned to service clarifiers.
Figure 4: Decommissioned clarifiers back in operation.
Table 2: Ten key learnings from Cohuna WTP incident.
David Sheehan,SeniorWaterQuality&RegulatoryAdvisor,ColibanWater
Some of you may have heard the term WaterVal, and many of you may never have heard of it. The purpose of this article is to give an overview of WaterVal and how it is contributing to the management of water treatment processes.
How does WaterVal help with operating a treatment plant?
Treatment plants are designed to remove contaminants to an acceptable level. The amount of contaminant that needs to be removed by a particular treatment process is determined by the concentration of the contaminant in the source water that is being treated, and this is typically expressed as a Log Reduction Value (LRV), which
can be thought of as the percentage of the contaminant that is removed.
The WaterVal validation protocols provide the detail on the operational requirements that need to be followed to ensure that the required LRV is achieved. So, if you operate a treatment process in line with the requirements of the relevant WaterVal protocol, you can be confident that you are protecting public health or the environment.
What is WaterVal?
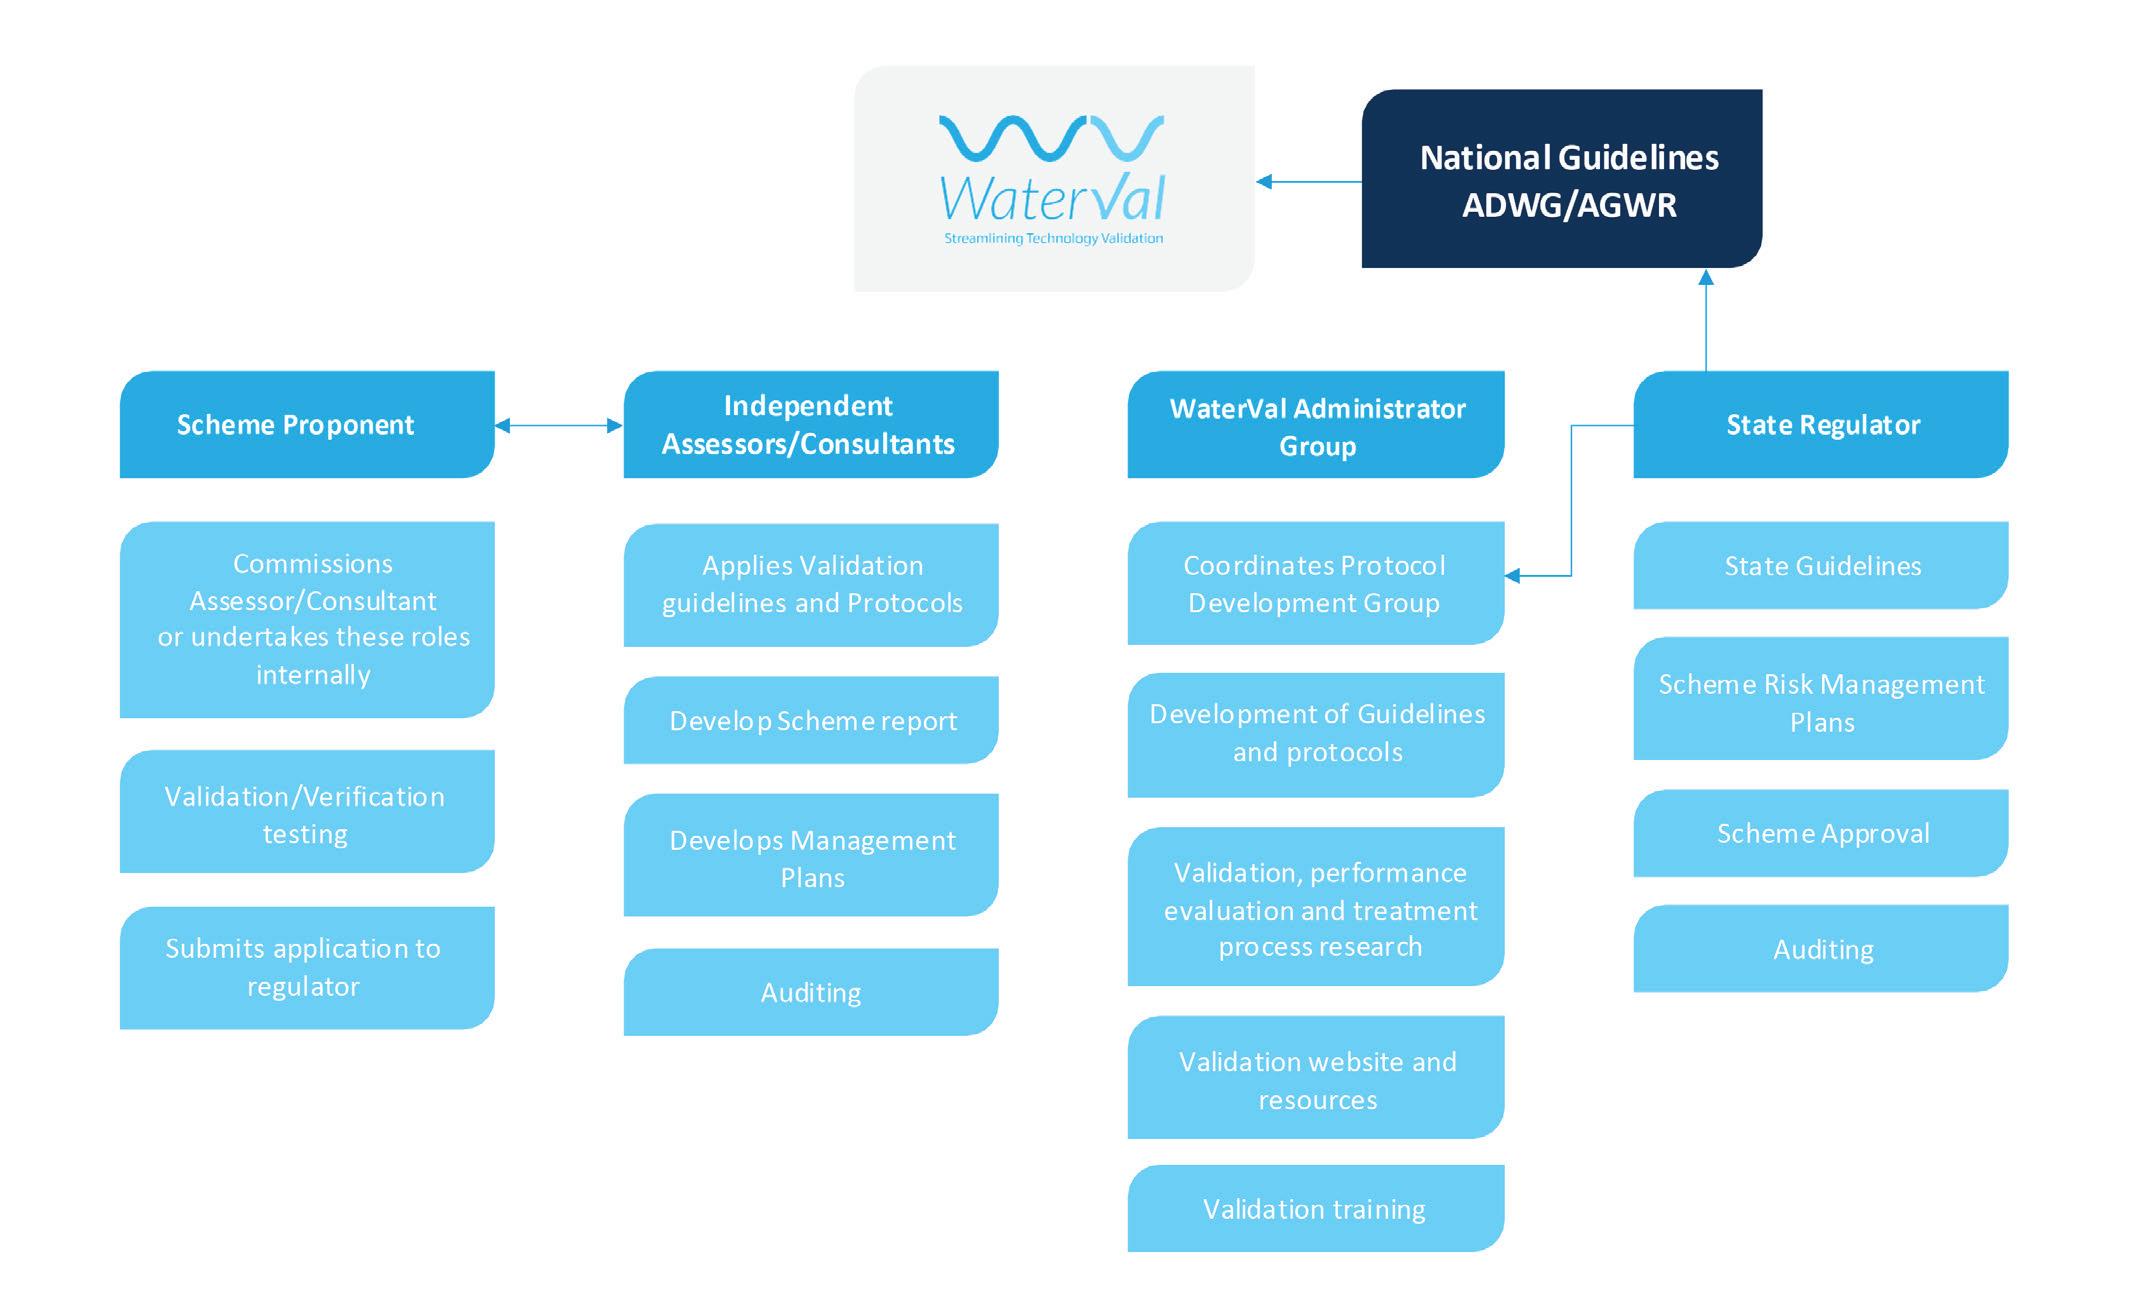
In a nutshell, WaterVal is a nationallydeveloped Validation Framework (Figure 1) for water treatment processes in Australia. Developed through a collaborative effort between researchers, water utilities, regulatory bodies, and the private sector,
WaterVal aims to streamline the validation process and ensure the effective removal of contaminants from water sources.
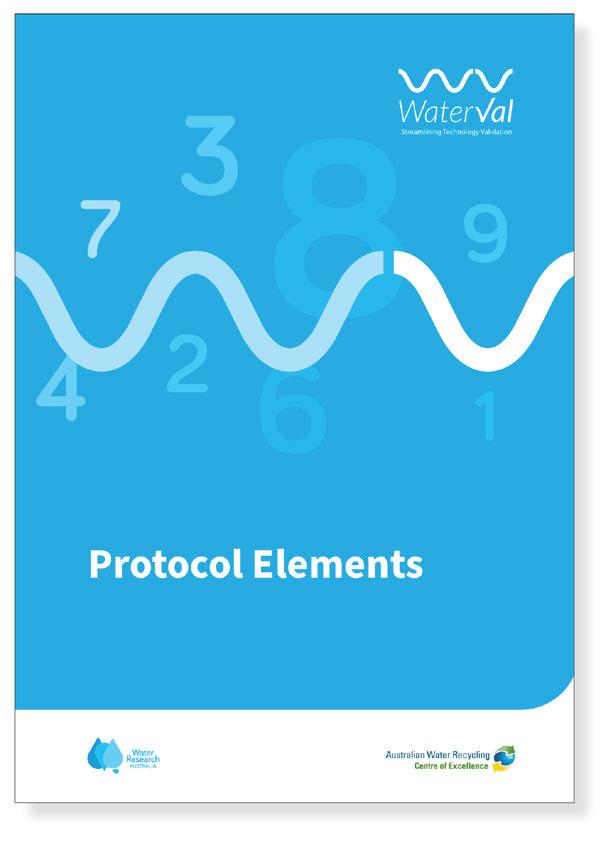
The WaterVal Validation Framework is underpinned by Validation Protocols, which are independently developed and agreed methodologies to assess contaminant removal for a range of treatment processes. Each Validation Protocol follows a standard format which is based on nine Protocol Elements, ensuring consistency and uniformity for users (Figure 2). The Framework and Protocols are applicable to a broad range of water sources and complement the risk frameworks and objectives of the Australian Guidelines for Water Recycling (AGWR) and the Australian Drinking Water Guidelines (ADWG).
Figure 1: The WaterVal Validation Framework.
Currently, five Validation Protocols have been developed and published, and they are available on the Water Research Australia (WaterRA) website. Through WaterRA, there is ongoing work and research to fill the most important knowledge gaps and develop future Validation Protocols.
The primary purpose of WaterVal is to coordinate treatment process validation protocols to streamline the validation process by:
• Clarifying and harmonising scientific and regulatory approaches and requirements to validation
• Reducing financial and other costs to government, industry, water utilities and the community
• Coordinating a nationally consistent and agreed validation framework that is transparent and independent
• Integrating international validation requirements and guidance into the Australian-developed Protocols, where appropriate
• Developing and maintaining standardised treatment process protocols and guidance for the validation of all water treatment processes, including processes that are used to treat drinking water, recycled water, stormwater and groundwater. Waterval will cover the validation of processes chemical contaminant removal in addition to pathogen removal
• Sharing of information, and developing confidence and assurance for governments, regulators and the community that water treatment systems can safely and effectively supply water that is fit for its intended purpose What is validation?
Validation is the process used to demonstrate that a treatment process can effectively control hazards, such as removing viruses or protozoa from water.
Different validation methods exist for validating different processes. Validation can be undertaken for new or existing processes, or it can involve reviewing existing validation studies that have been undertaken overseas or interstate. The validation of water treatment processes is necessary to protect public health and the environment.
Various validation methods are used to validate different treatment processes, as each process uses a different way of removing pathogens or chemical contaminants. These methods can encompass the validation of both new and existing processes, alongside the analysis of validation studies conducted internationally or across different regions.
Ultimately, the validation of water treatment methods is designed to protect public health and the environment, highlighting the essential role that validation
plays in ensuring safe and sustainable water management.
History of WaterVal
In response to the Australian water sector’s call for a more cost-effective way to validate water treatment technologies, the now concluded Australian Water Recycling Centre of Excellence (AWRCoE) established a program called NatVal (i.e. National Validation) in 2011, with the aim of creating a nationally agreed and consistent validation framework.
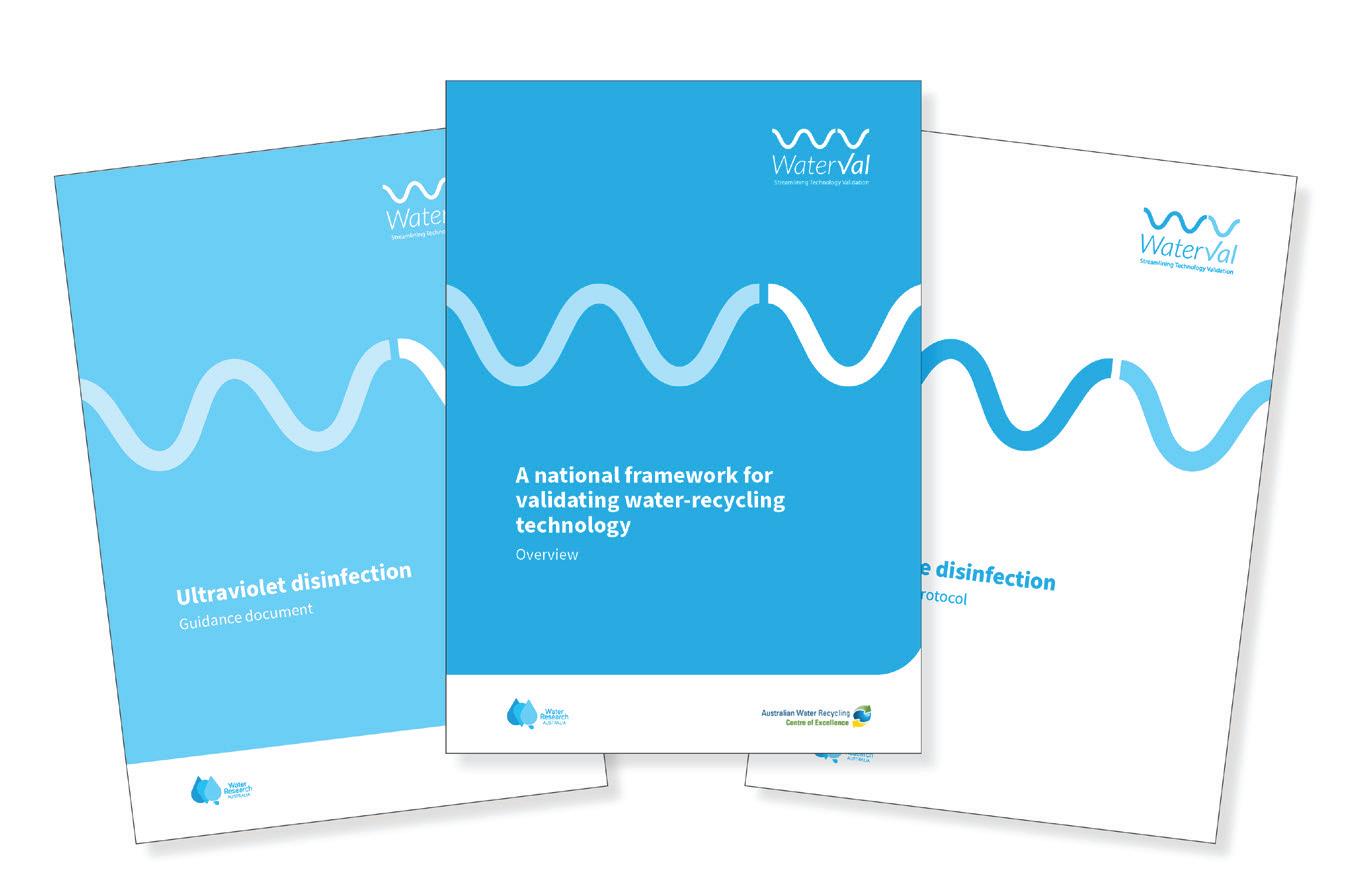
Using unspent funds from the NatVal program, and undergoing a name change to WaterVal (i.e. Water Validation), NatVal was transferred to an organisation called WaterSecure. WaterSecure published five Validation Protocols (Figure 3), covering the following treatment processes:
• Ozone
• UV
• Membrane Bioreactors (MBR)
• Chlorine
• Reverse Osmosis (RO) and nanofiltration
In 2018, WaterRA took over WaterVal and its published protocols, from WaterSecure, and has continued the process of creating a national validation framework and developing additional protocols.
Figure 2: The WaterVal Validation Protocol Template.
Figure 3: The WaterVal Treatment Barrier Validation Protocols.
Current WaterVal program coordination and activities
Since taking it over, WaterRA has continued to progress WaterVal. WaterVal is primarily funded by a number Australian water utilities and health regulators, with in-kind support provided a range of research institutions.
More recently, WaterRA has entered a partnership arrangement with partners in the US who have commenced a new program called CalVal. CalVal aims to develop guidance for validation of Purified Recycled Water (PRW) schemes in California. The guidance that they develop will inform the development of new WaterVal protocols. Having this level of international collaboration helps ensure WaterVal’s protocols remain up-to-date and contain the best available advice on the validation of treatment processes.
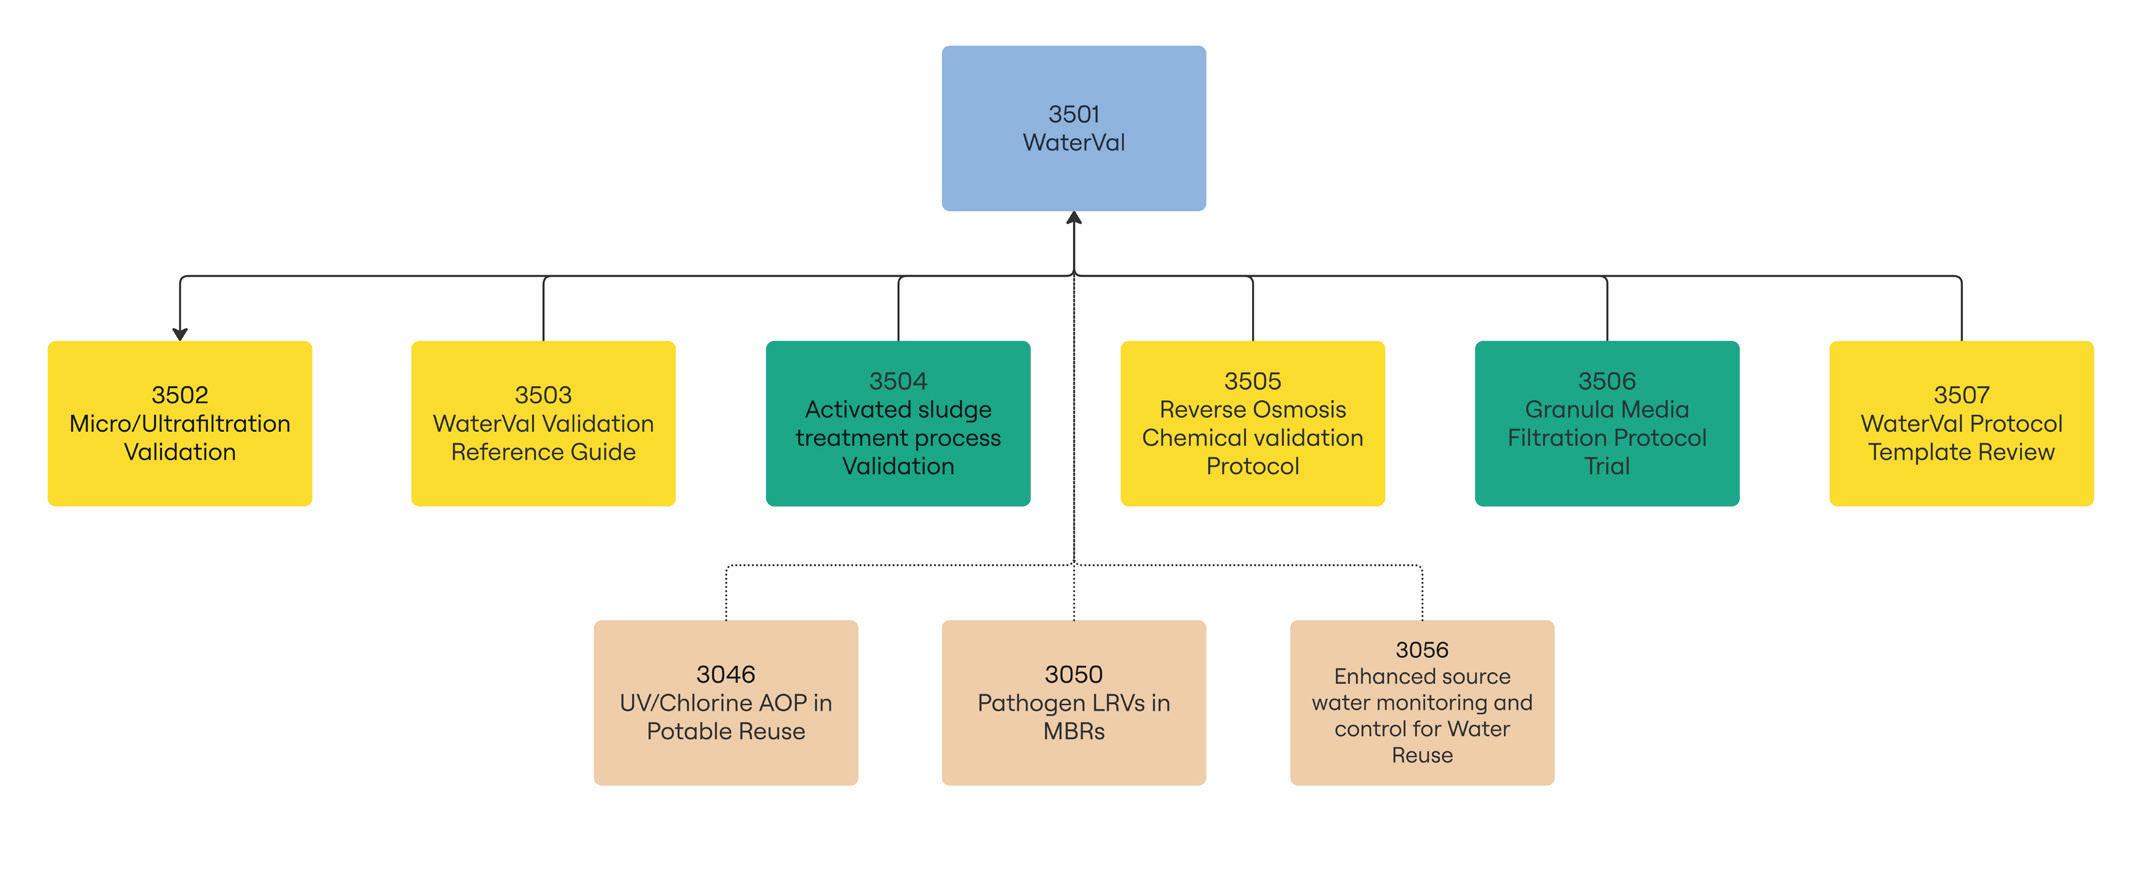
Current WaterVal projects are listed below.
WaterVal activities
Refer to Figure 4 for the overview of WaterVal and its activities.
Review and update of the WaterVal validation protocol template
WaterVal has commenced work on several protocols and in collaboration with CalVal is aiming to develop a comprehensive set of treatment protocols. Prior to commencing this program, a review of the protocol template is necessary to ensure that the
protocols are developed in a consistent and scientifically sound manner.
Creation of validation training and reference guide
This reference guide is an illustrative guide for the water sector to assist in understanding how the concept of validation is applied to treatment barriers used in the production of drinking water and recycled water. It is not a regulatory document and is not intended to be exhaustive. Rather the guide will direct readers to the detailed guidance where available.
Research for development of a new microfiltration/ultrafiltration validation protocol
The objective of this project is to recommend future research activities required for the development and acceptance of a new set of Australian guidelines for the validation of MF/UF used in water recycling. Like the approach taken in 2014 for the development of a membrane bioreactor (MBR) validation protocol, the team of researchers at UNSW Sydney and University of Sydney will:
1. Review and report on current regulatory framework,
2. Engage and survey key stakeholders (starting with WaterVal project partners), and
3. Articulate the reported research gaps and required research activities capable to best recommend the development of a new MF/UF protocol.
Development of a validation protocol for removal of chemical contaminants using reverse osmosis
This project aims to adapt the WaterVal protocol template for pathogens to a chemical basis that is applicable to water and wastewater treatment barriers. It is then proposed to develop a specific WaterVal chemical validation protocol for a reverse osmosis (RO) treatment barrier.
Granular media filtration validation protocol field trial
WaterRA project - Development of a WaterVal Granular Filter Validation Protocol - developed a validation protocol following the WaterVal protocol template. The project also outlined a process for a trial of the protocol in a water treatment plant. A trial was proposed to refine the protocol and review the protocol for WaterVal endorsement following the outcomes of the trial.
Resources and more information
There is an extensive range of resources that underpin and support WaterVal. These resources are freely available to water industry professionals and can be found at: waterra.com.au/waterval/
For more information on WaterVal, and water validation more generally, please contact Dr Marty Hancock, Research Manager, WaterRA, at marty.hancock@waterra.com.au
Figure 4: The WaterVal program and research activities.
BEST PRACTICE DRINKING WATER SAMPLING FOR MICROBIAL TESTING
False positive Escherichia coli (E. coli) detections in drinking water denote a sample that initially is flagged as positive for the presence of E. coli, but, upon deeper investigation, is deemed unrepresentative of the water provided to the customer due to external contamination. This contamination can occur at various stages of the sampling process: during sample collection, during transportation to the laboratory, or during storage, processing, or handling within the laboratory.
The rise in occurrences of false E. coli detections has led to unnecessary alarms, placing a strain on resources and finances. The operational impacts can be significant, including isolating a treated water storage, operating valves to change water supply arrangements, spot dosing storages and/ or the distribution network with chlorine,
flushing, and involving other water authorities with a shared boundary, as well as regulators.
Additionally, such events could potentially lead to boil water advisories being issued unnecessarily, with all the cost, inconvenience, and loss of public confidence that goes with such advisories. From a health and risk management perspective, this trend also poses the risk of fostering complacency in handling true positive detections over the long term.
This article looks at the thorough review of the drinking water sampling protocol for microbial testing that South East Water undertook, with assistance from Waterfutures, looking for potential sources of contamination through each step of the sample collection, transportation and analysis process, with the aim being to identify improvements in procedures that would
Was the sampler's training recently refreshed to ensure compliance with current protocols and best practices?
Were containers with preservatives not rinsed prior to sampling to maintain the integrity of the sample?
Were containers without preservatives rinsed before sampling to prevent contamination?
Was the sampling tap properly sterilised before usage to minimise contamination risk?
Was the microbiological sample collected as the initial sample to maintain sample accuracy?
Was the lid and inside of the sample bottle kept sterile during microbial sampling and contact with other surfaces avoided?
Were drinking water samples segregated from other sample types (e.g., recycled water) by storing them separately in dedicated drinking water eskies or fridges?
If the cover of the connection was damaged/absent, was it cleaned before sampling, and were notes added to the Chain of Custody?
Did the sampler wear food-handling gloves or use hand sanitiser during the sampling process?
Table 1: Sampling procedure general considerations.
reduce the likelihood of false positive E. coli detections (Table 1).
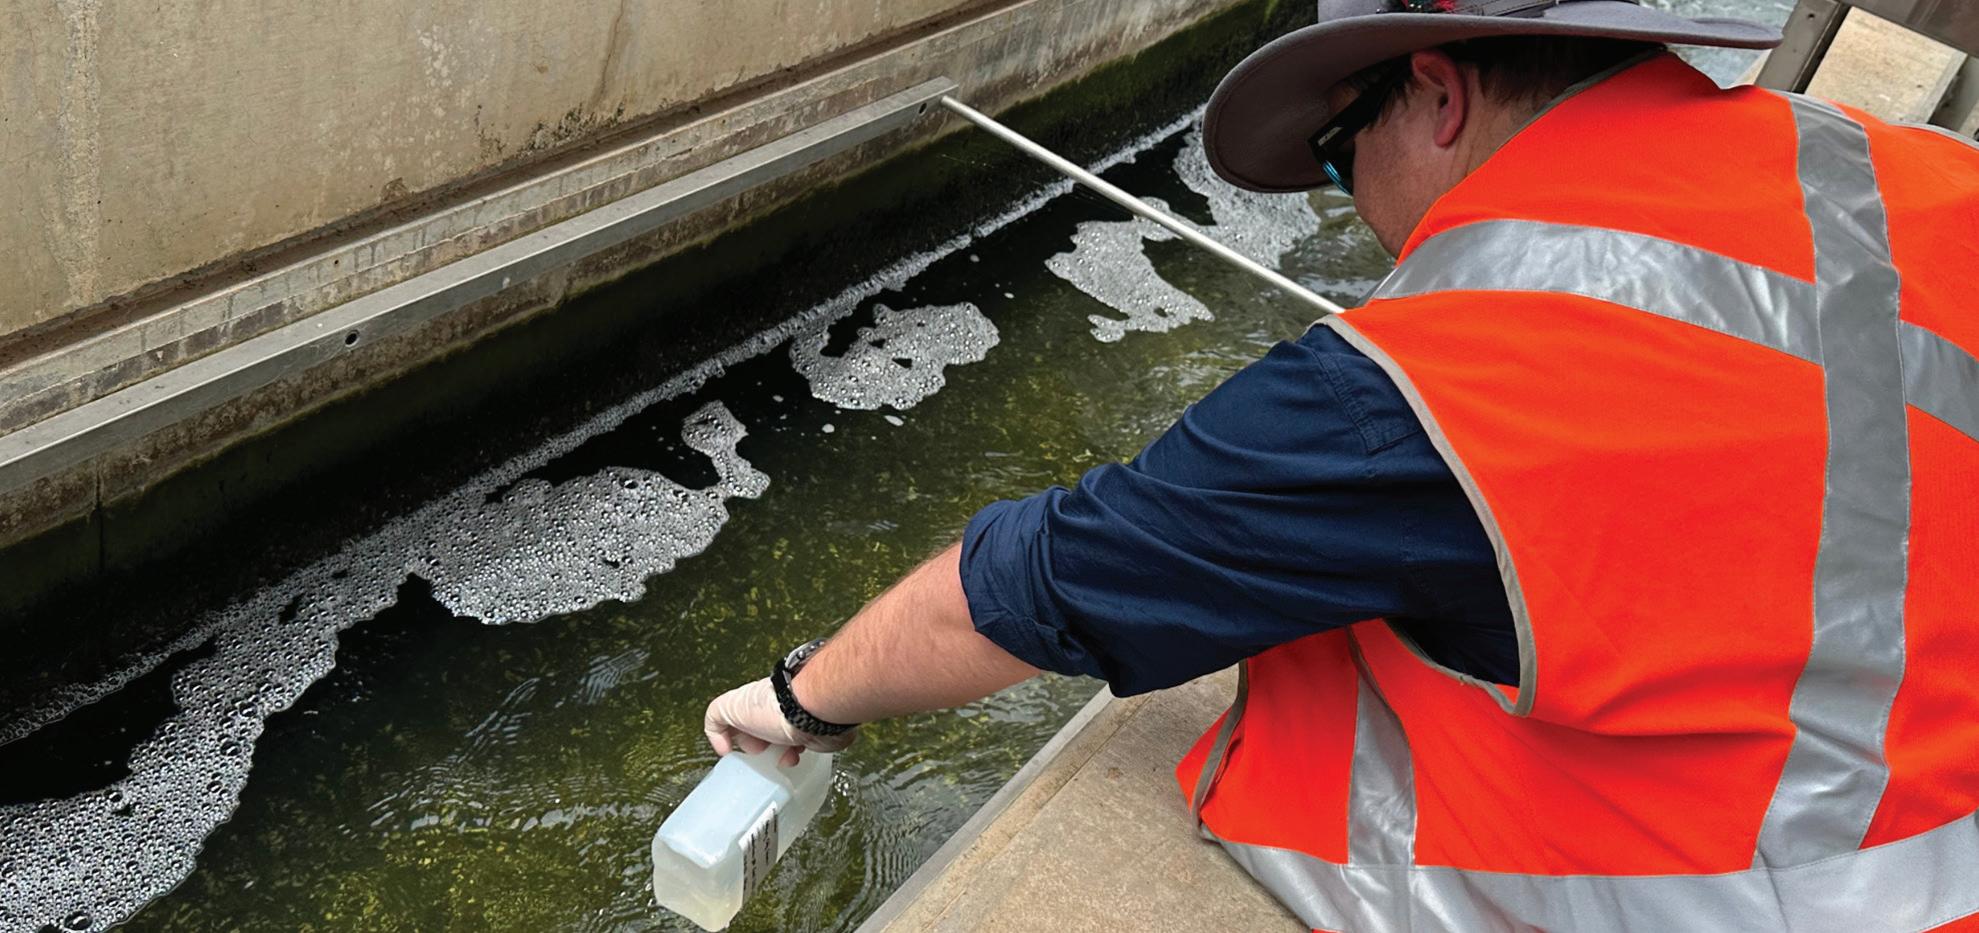
sampling procedures
The point of sampling contains several points of risk that could contribute to sample contamination. There also exists a considerable risk of contaminating sample containers during the sampling process if proper aseptic techniques are not diligently followed while handling the containers and the sampling taps used to collect the samples.
Therefore, to minimise the risk of sample contamination at the point of sampling, those who are collecting the samples need to ensure thorough flushing of the sample point is undertaken, including employing flame treatment, alcohol, or sodium hypochlorite spraying of the sampling tap, and that aseptic sampling technique is stringently followed to ensure the integrity and accuracy of the collected samples.
Were both the tap and sample container covered during sampling in case of rain to prevent contamination?
Have field instruments been calibrated within the last 12 months to ensure accuracy?
Was the sample tap fitting inspected and cleaned, if necessary, before sampling?
Was the tap flushed for the appropriate duration (≥ 2 minutes for short side service, ≥ 7 minutes for long side service) before sampling?
Was a 10 cm length from the end of the gooseneck flamed for at least 30 seconds before sampling?
If it was a Total Fire Ban Day, was a disinfection agent used and the gooseneck allowed to sit in it for 2 minutes before sampling, instead of flaming?
Was a steady stream from the gooseneck allowed for 5-10 seconds before actual sampling?
Was the plastic sleeve replaced on the sample tap fitting if visible damage or contamination was observed?
If the sampling point was overgrown, inaccessible, or prone to contamination, was the sample tap photographed and reported?
To identify potential contamination points across the full custody chain of sample collection, transport, receipt and storage, a series of trial tests were conducted. These trials were instrumental in developing an optimised sampling procedure, which is detailed as a set of steps in Table 1. This systematic approach was aimed at enhancing the reliability of the sampling process, and to minimise the probability of contamination throughout the entire chain-of-custody.
sample tap assembly
The conventional sample taps installed at customer meters typically feature a push-in air fitting on a T-connection. These taps employ a gooseneck connection for sample collection, sealed with a plastic sleeve when not in use. While cost-effective in terms of installation and maintenance, these taps harbour significant risk factors associated with false E. coli detections and operational challenges:
• Access to customer properties and notification of impending sample collection may not always be feasible, which hinders efficient sampling procedures.
• Taps are susceptible to damage or removal by customers without prior notice, necessitating samplers to seek alternative taps nearby. This increases the chance of consecutive sampling from the same tap, which contravenes Victoria’s Safe Drinking Water Regulations 2015 made under the state’s Safe Drinking Water Act 2003, resulting in additional costs and time constraints for samplers.
• Vegetation clearance around the taps is required to prevent external contamination. The presence of shrubs or bushes in proximity to sample taps poses a heightened risk of sample contamination, especially during inclement weather conditions, like rain or strong winds.
• Protection against rain droplets washing off overhanging trees or structures is crucial. Contaminated rain droplets may compromise sample integrity if they encounter the sample tap and then enter the sampling container.
Addressing these issues associated with conventional sample taps is imperative to ensure the accuracy and integrity of drinking
water samples, thereby reducing the risk of false E. coli detections and optimising operational efficiency.
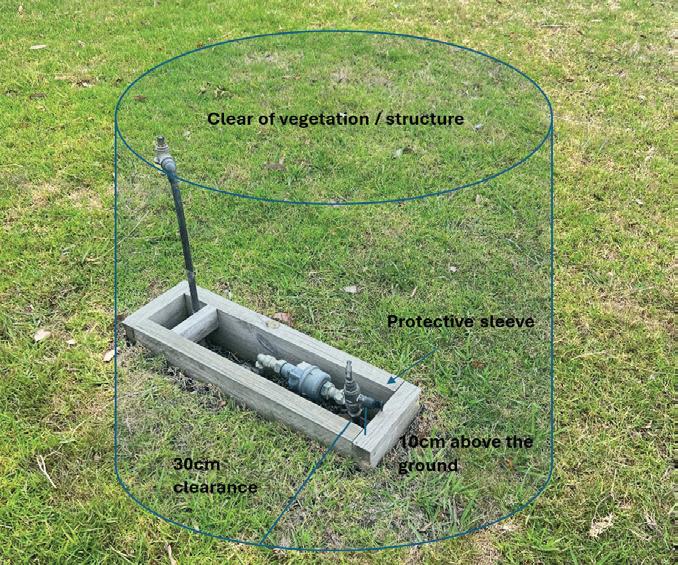
To identify an appropriate location for a sample tap near a customer meter, specific criteria are considered in order to avoid the aforementioned issues.
These criteria include ensuring that the meter is positioned at least 10 cm above ground level, is free from any overhanging trees or structures, is devoid of any obstructions within a 30 cm radius around the tap, and there no dogs on the property that could easily attack a sampler, among other factors (examples of acceptable and unacceptable taps are illustrated in Figures 1 and 2, respectively). However, in densely vegetated areas, meeting all these stipulations can be exceptionally challenging and sometimes unfeasible.
In such heavily wooded environments, locating a spot that adheres strictly to all the criteria becomes arduous and, at times, unattainable. Consequently, South East Water’s records show that instances of false positive E. coli detections primarily occur in bushy areas, and are linked to external contamination, such as contaminated water splashing into sampling containers.
This issue prompted the initiation of a case study wherein we trialled a new variant of a customer sample tap. The objective was to significantly diminish the likelihood of false E. coli detections by minimising susceptibility to external contamination, especially in densely vegetated areas.
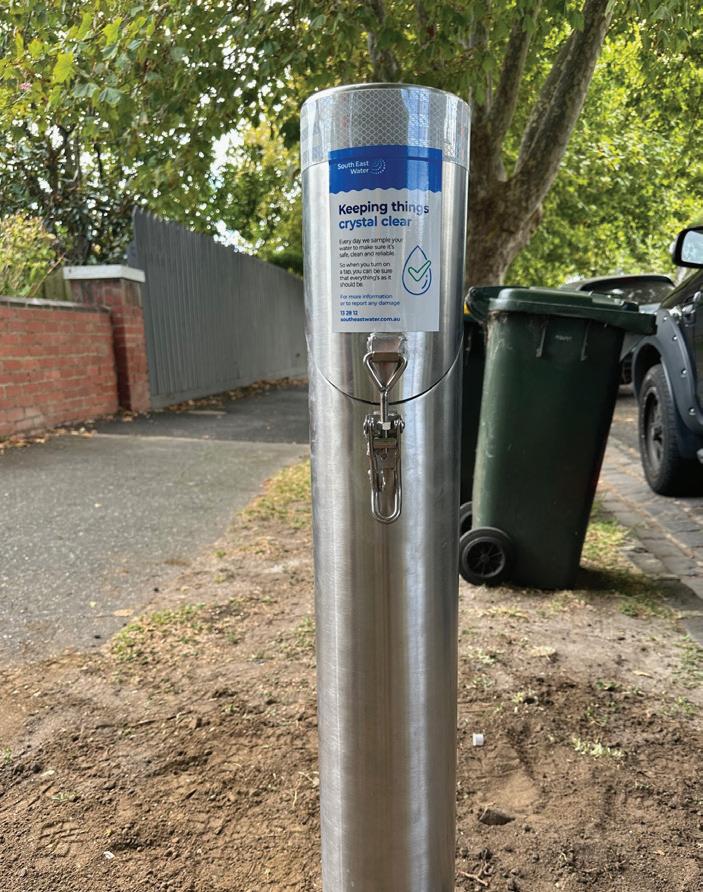
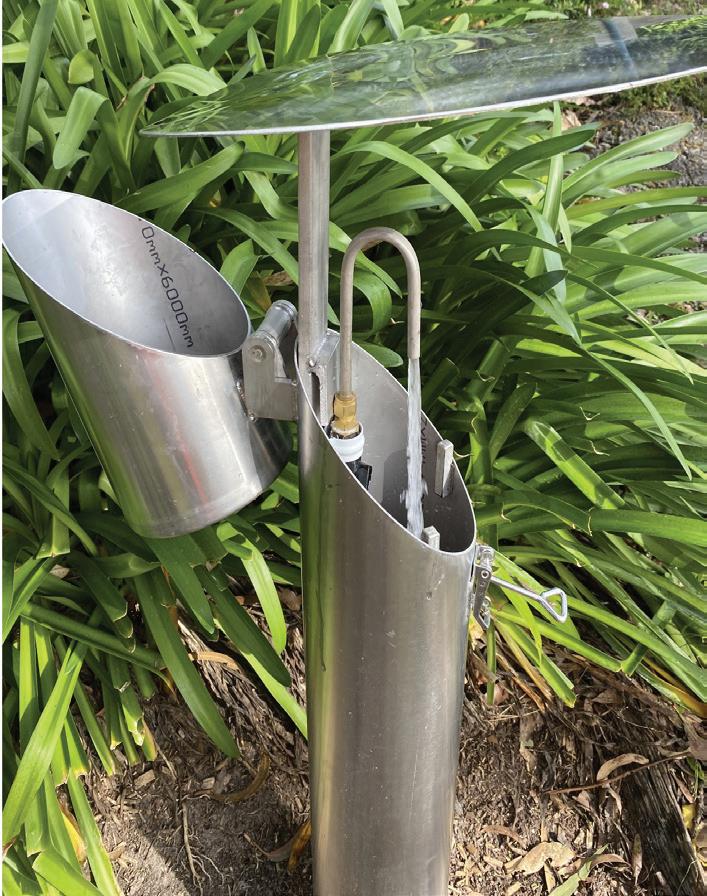
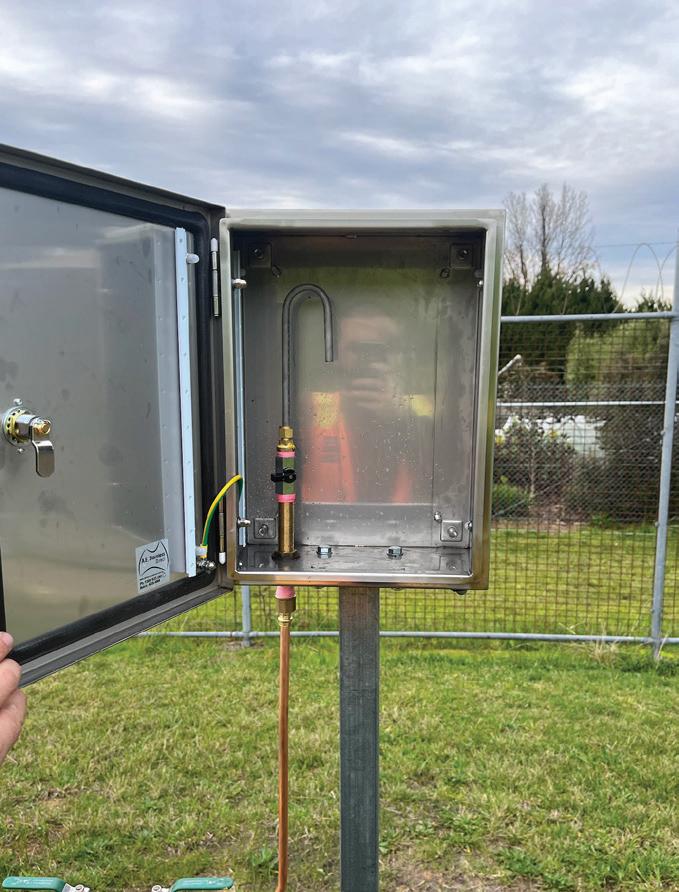
The design of the new tap encompasses several essential features aimed at improving its functionality and reliability. Notably, it boasts a one-meter-high lockable stainless steel bollard cover, serving as protection against potential animal interference, overgrown grass, or shrubs. This protective cover also acts as a deterrent against unauthorized usage, enhancing security measures.
Additionally, the tap design incorporates a rain cover or rain hat, safeguarding the sampling process from rain droplets during inclement weather conditions, thereby ensuring the integrity of the collected samples. Moreover, the inclusion of a fixed gooseneck simplifies and enhances the
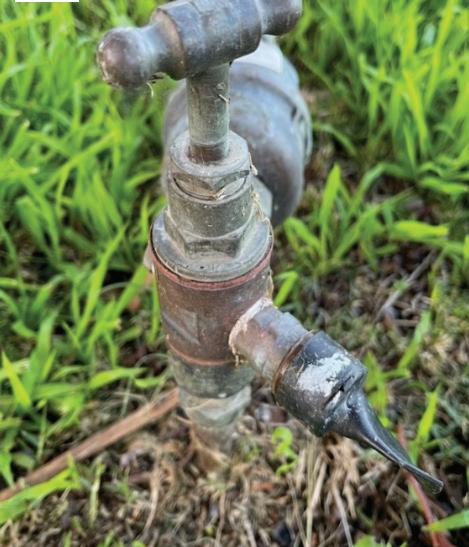
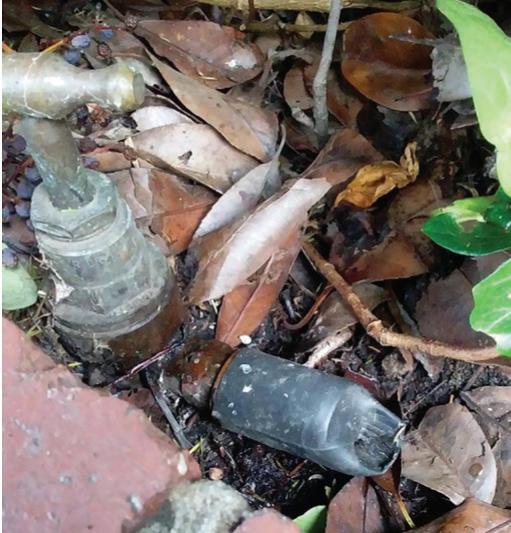
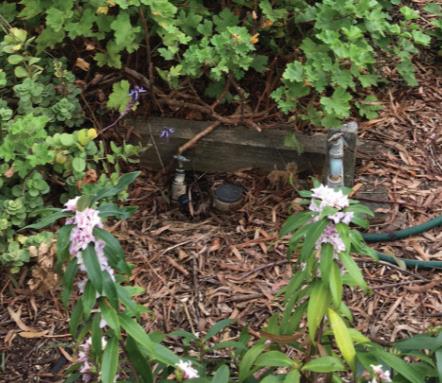
Figure 2: Examples of unacceptable conventional sample taps.
Figure 1: Example of acceptable conventional sample tap at the customer house.
The supply to this sample tap is shared with another water authority, which resulted in the false positive E. coli recorded at this site being a shared incident.
This sample tap was in amongst shrubbery. The false positive E. coli incident resulted in the supply basin being isolated, with an alternative supply being used, until the basin could be confirmed not to be the source of the E. coli detection.
Damage/hole and also bird faeces visible on the sheath covering the sample tap. The false positive E. coli result recorded at this tap resulted in a multiple-day incident, as the chlorine residuals in the surrounding network are normally low, a chlorine trailer was sourced and set up at the PRV supplying this zone and the entire network was dosed and flushed.
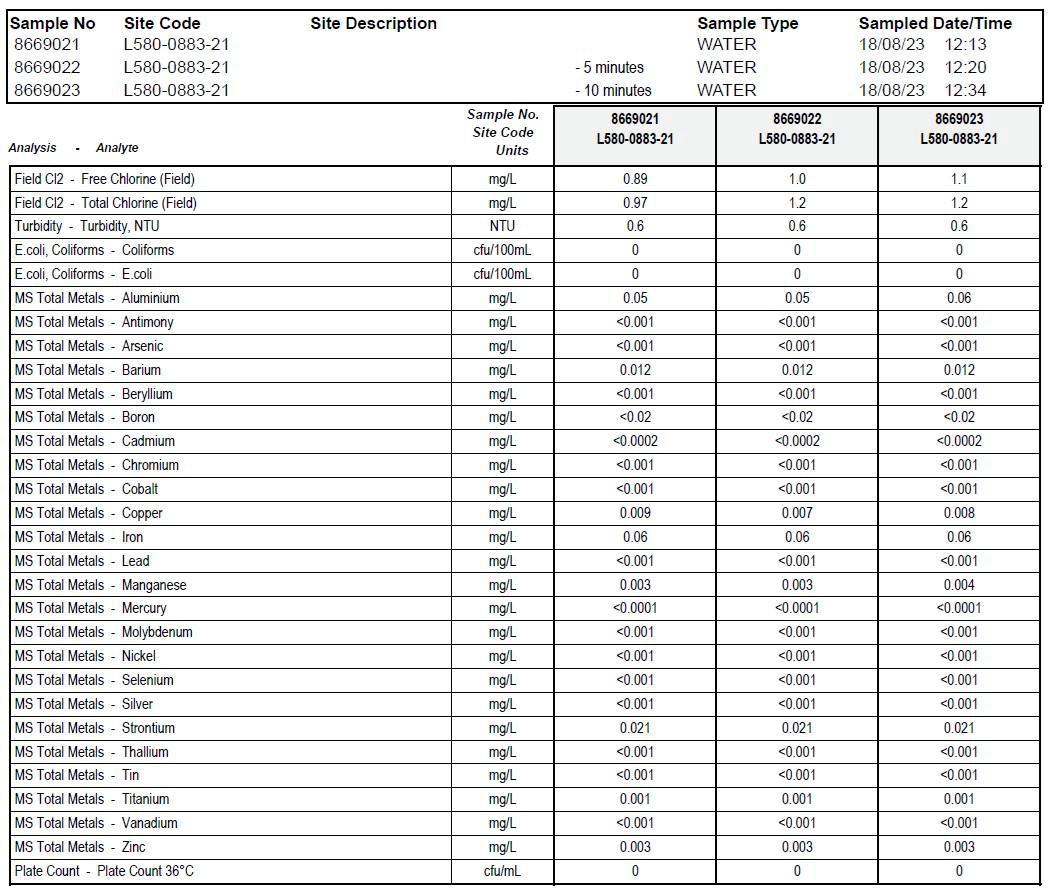
Table 2 Typical water quality verification test results.
Figure 3: New bollard sample taps at the nature strip, showing fixed gooseneck, lockable door and the rain hat.
Figure 4: sample tap boxes; showing fully sealed lockable door and fixed gooseneck.
Table 2: Typical water quality verification test results.
mid-2022 (data for 2024-25 is up to the March 2025).
sampling procedure, facilitating easier and more reliable flaming by samplers before samples are collected (refer to Figure 3).
Crucially, this tap installation strategy focuses on situating the tap on a service pipe within the nature strip outside the customer's property, effectively circumventing potential access issues. This tap installation was also promoted for sampling of hydraulic zone entry points, where weekly sampling could be frustrating and seen as intrusive for customers when a conventional sample tap is used.
Upon rigorous testing, particularly on rainy days, the results yielded no evidence of E. coli contamination in the sampled water (refer to Table 2). Furthermore, an assessment of the water retained in the tap over a period showed no alterations in the metal content of the sample, confirming the absence of water contamination attributable to the tap design (see Table 2). Notably, a total of 10 taps of this nature have been strategically installed and utilised within our network, consistently yielding negative microbial results and garnering no customer complaints.
Additionally, all sample taps at the water storage tanks, pressure reducing valves (PRVs) and pump stations have been relocated to sample tap boxes with a fully sealed lockable door (Figure 4).
sampling program
In addition to implementing improvements to the sampling methodology, and improving the physical design of the sample taps, themselves, a further step was implemented to assist with a more measured and appropriate response to an E. coli detection.
This involved reassessing the existing monitoring program and ensuring every sample run had a “source” sample and a minimum of two samples collected within the same hydraulic zone. This required new sample taps to be installed at “entry points”, which could be either at the water storage or the PRV supplying the zone; or, alternatively, a customer sample tap installed at the closest point of entry to the zone and named as the “entry point”. The laboratory then scheduled every sample run to ensure an entry point and a minimum of two samples were collected to represent a zone.
This change in process ultimately resulted in a significant increase in the total number of samples being collected annually. However, it also assisted in conducting a rapid risk assessment in response to an isolated E. coli detection which could provide some assurance that the risk was unlikely to be from the source or widespread across the zone and was most likely isolated to a small area, or a single sample tap.
Other components of the rapid risk assessment include gathering evidence on the operation of barriers as part of the preventive risk management approach, aligned to the hazard analysis and critical control point (HACCP) approach long used in the food sector and expressed as the Framework for Management of Drinking Water Quality in the Australian Drinking Water Guidelines.
Conclusion
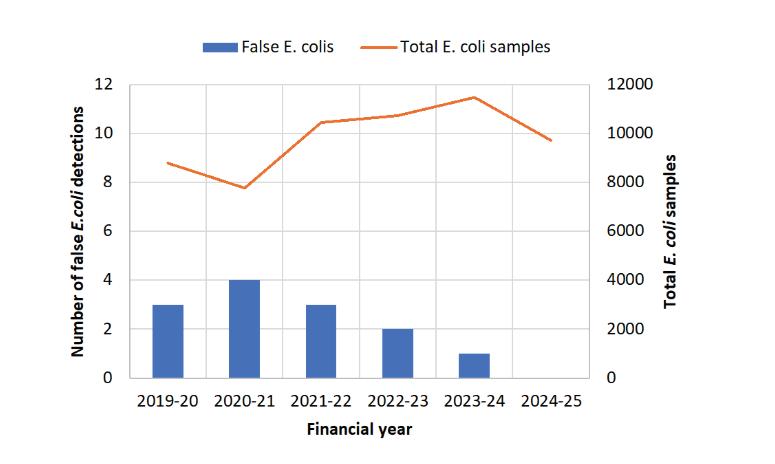
Despite the total number of E. coli samples collected from the network steadily increasing, the number of false detections has markedly decreased since the implementation, in 2022, of the changes described in this article (refer Figure 5).
The successful implementation and improvement in operational performance since 2022 validates the efficacy of this new tap design and testing procedure, demonstrating its ability to mitigate potential contamination risks, while ensuring reliable and accurate water sampling.
Call for Editorial Panel Members
We are seeking three volunteers to join the WaterWorks editorial panel.
The Editorial panel oversees the production of the WaterWorks technical journal, the bi-annual publication exclusive to WIOA members.
How to get involved
Please email your interest to info@wioa.org.au by Friday 27th June 2025.
Scan the QR code for more information:
Figure 5: Trend in the number of false positive E. coli detections (left axis) and the total number of samples collected (right axis); figure shows a decrease in false positive detections, despite an increase in total samples since
MOVING FORWARD ON WATER OPERATOR COMPETENCY IN NSW
• The Australian water industry has struggled to define operator competency, leading to inconsistent training requirements and delivery across the states and territories.
• Recent national and state approaches to address this have included strong collaboration across water and training sectors to support water industry ownership.
• Water Research Australia’s Technical Competency Benchmark provides a consistent framework for learning and development programs and an Auditing Tool to assess and improve implementation.
• NSW Department of Climate Change, Energy, the Environment and Water Operator Competency Benchmark defines a comprehensive standard training program for new operators.
• Ongoing implementation of these projects will improve demand and supply of high quality, consistent technical training for water operators.
What is a water industry operator?
The Australian water industry continues to lag behind other technical industries when it comes to defining the key skills that operators need to do their jobs. Existing guidance encourages competency in the specific skills operators need for their job role. This approach presents a challenge to utilities, as job roles vary widely across the industry, and operators working at different sites need different competencies. Across the industry this can lead to inconsistent and inefficient training delivery, and a range of different ideas on what skills define a water operator.
Benchmarking water industry operator technical competency
The Water Research Australia (WaterRA) Technical Competency Benchmark project has brought together industry, regulators, and water associations to develop a nationally consistent technical competency framework.
The NSW Department of Climate Change, Energy, the Environment and
Water recognised that the NSW local water utility sector needs more detailed guidance. The department has worked with stakeholders to implement key elements of the national benchmark for local water utilities in NSW through development of a standard training program for operators.
These projects have taken a collaborative approach to addressing water utility and operator training needs, while raising awareness and promoting consistent and fit-for-purpose learning and development programs that benefit the whole water industry.
Why do we need a standard approach to competency?
The water industry has long identified the opportunity for an agreed minimum standard of water industry operator technical competency. Almost every other utility and services industry has taken this path in recent years, with workers having clear, industry-backed training requirements and competency benchmarks to achieve. The benefits of a competency benchmark are clear:
Figure 1: Operators require a broad range of skills and knowledge.
1. Consistent and efficient learning and development programs
2. Better recognition of the skills gained through training and development
3. Greater industry influence over the content and quality of training programs
4. Opportunity for collaborative recruitment drives and shared training programs
5. Transferable skills across the sector, supporting operator mobility and confidence in recruitment for employers
6. Confidence from regulators that risks are appropriately managed by skilled staff
7. Access to training subsidies tied to formal training programs.
Despite these benefits, the water industry and its regulators have not pursued a national standard, leading to widely varying training and competency requirements across the states and territories. Most regulators have not provided clear legislative or policy drivers, leaving decisions around competency up to water utilities. There is limited guidance as to what constitutes an appropriate level of technical competency, or how to achieve this in practice. As a result, the water industry has largely adopted a voluntary approach to water
industry operator training standards, such as the national Water Industry Operator Registration framework, implemented by the Water Industry Operations Association of Australia (WIOA). A more structured approach that incorporates the existing registration framework could support improvements for operators and utilities.
Developing a nationally consistent approach to learning and development
The Water RA Technical Competency Benchmarking Project has developed a range of tools to support water utilities to take a consistent approach to learning and development. The Technical Competency Benchmark presents a framework that guides water utilities to develop and deliver training and technical competency activities and programs, specific to water industry operator roles. The auditing tool supports water utilities to assess and improve implementation. This framework promotes a cycle of technical competency management, described in Figure 2.
The tool can also facilitate regulator audits of drinking water and recycled water schemes, supporting auditing of training and competency aspects of application of regulations and guidelines.
WaterRA worked with project partners, stakeholders, including government departments, water industry associations
and water utilities, and Water RA member utilities. Research approaches included surveys and interviews to determine training needs assessment, and workshops to determine learning and development program best practice.
The Technical Competency Benchmark and audit tool are supported by further guidance on advanced decision making for operators, operator interviews and case studies, and training guidance.
Implementing an operator competency benchmark for NsW local water utilities
The department continues to support NSW local water utilities as a technical regulator, and through delivery of the Town Water Risk Reduction Program. This program has had a strong focus on addressing skills and training challenges in the sector. A key barrier to improving skills and training is the lack of an agreed competency benchmark for operators.
The department supported the development of the Water Operations Technical Competency Benchmark framework but identified a key barrier to implementation. Regional NSW has 92 water utilities providing water and sewer services, operating over 500 water and wastewater systems. Leaving individual utilities to understand, address and
Water RA graphic with dept colour
Align technical competency to organisational strategy
Figure 2: Cycle of technical competency management.
implement the framework would lead to inconsistency, duplication of effort, and not necessarily support improvement of training delivery. Many of the elements of the framework are common across water utilities, especially where they are part of the same jurisdiction. The department’s approach seeks to address these elements consistently, sector wide, for the benefit of all utilities.
The department worked with local water utilities to take key elements within the technical competency benchmark and codesign a consistent state-wide approach to determining skill requirements. This work aims to develop a standard competency benchmark for the skills required by all operators in regional NSW, regardless of location. The Competency Benchmark for Local Water Utility Operators in NSW Consultation Paper outlines appropriate training for water operators in regional NSW.
The complete benchmark includes awareness training for new employees, mandatory WHS training requirements, and covers a fundamental set of agreed technical competencies that covers the majority of works tasks completed by operators across the state. Advanced technical training allows operators to specialise and complete further technical training focused specifically on their job role and meet requirements for national
registration. Figure 3 below shows the components of the benchmark.
Fundamentals training would give all operators an understanding of policies and procedures, water and wastewater networks, and allows flexibility to focus on either drinking water or wastewater treatment, or both where required. Completion of fundamentals training would meet the requirements for awarding of a Certificate III in Water Industry Operations. This benchmark can be used to inform a single, consistent training program completed by all new operators, and serve as a gap training plan for existing operators. Figure 4 below shows the outline of the fundamentals training, mapped to units of competency included in the National Water Training Package.
The department worked in partnership with a skills and training focus group of water industry and training experts to co-design the competency benchmark. Extensive stakeholder engagement has supported the development of the approach, including joint organisations, water utility alliances, local water utilities, coregulators, state and national peak industry bodies and registered training organisations.
The department will explore the use of this benchmark, developed in consultation with the sector, as the basis for training requirements for water operators in NSW
local water utilities. This will drive improved access and quality of training delivered by registered training organisations, a key step in improving skills and training in the sector.
What are the key challenges to implementing a competency standard?
The department’s consultation on the draft benchmark included questions on the challenges to implementing a competency standard. Key challenges identified included:
• lack of capacity in registered training organisations to deliver training
• lack of workplace supervisors and assessors to support operators during training and to assess competence on site
• lack of suitable locations to deliver hands-on technical training
• misalignment of available training subsidies with actual cost of training delivery
• limited capacity in operational teams to release staff for training.
The department will continue working to address these barriers and move to successfully implement the competency benchmark in the coming years.
Figure 3: Components of the Competency Benchmark for Local Water Utility Operators in NSW.
Conclusion
A consistent national and state approach to operator competency benchmarking can improve consistency and quality of training, increase recognition of water operations as a job role, and ensure skills are transferable. It would allow the water industry to drive training needs and give confidence to the community and stakeholders, including regulators, of effective operations and risk management.
A partnership between water utilities, regulators and water industry bodies is essential to successfully implement competency standards. The department has committed to continue working with utilities to implement an agreed statewide training system, consistent with
the Technical Competency benchmark proposed by Water Research Australia.
For more information
WaterRA have published these resources for use by water utilities on its website for free download here: Water Operations Technical Competency Benchmark - WaterRA: waterra.com.au/project/wateroperations-technical-competency-benchmark/
Scan QR code to view the Competency Benchmark for Operators in Local Water Utilities in NSW Consultation Paper:
Advertise in WaterWorks
We have advertising spots available in our next issue.
WaterWorks is WIOA's technical publication, produced bi-annually. It includes operationally focused articles and technical information and enjoys a wide distribution across the water industry.
Scan the QR code for more information, or email info@wioa.org.au
Figure 4: Outline of the fundamentals training, mapped to units of competency included in the National Water Training Package.
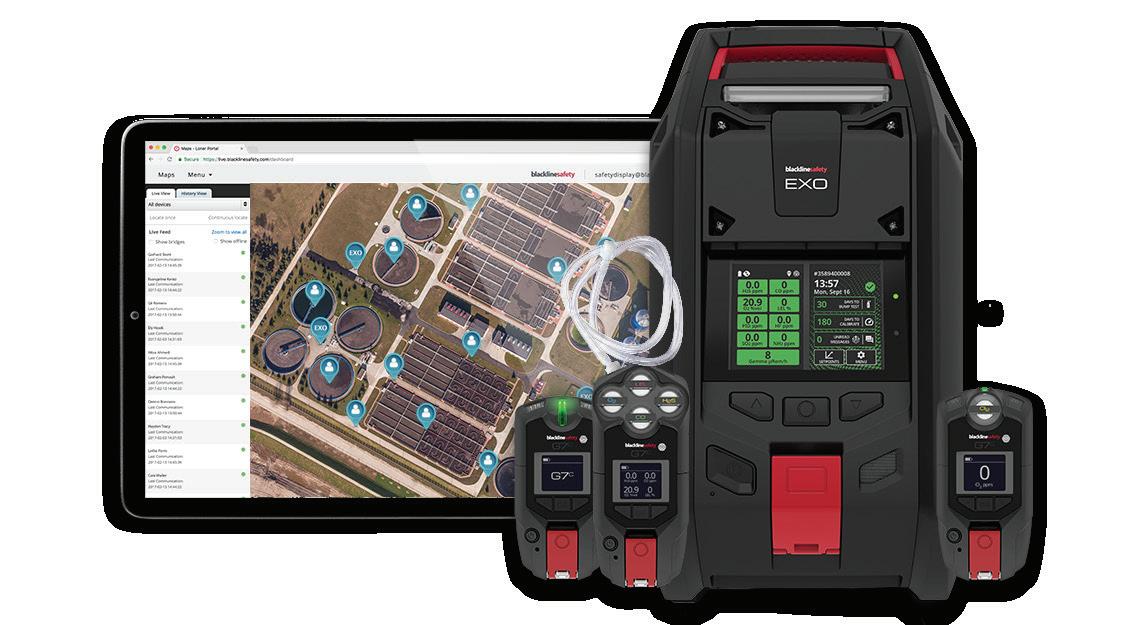
SAFE WATER BEGINS WITH SAFE TEAMS
Essential connected safety for water and wastewater workers
Protect: Your lone workers, 24/7
Detect: Up to 5 gases with 20+ sensor options
Alert: No motion, fall, gas, missed check-ins
Locate: GPS integration for live awareness
Activate: Emergency SOS latch
Communicate: Voice, text and Push-To-Talk options
Use: Real-time data, heatmaps and live compliance
dashboards
Empower your team with advanced safety solutions that ensure peace of mind and operational excellence.