WaterWorks is the technical publication of the Water Industry Operators Association of Australia (WIOA). It is published twice yearly. Neither WIOA nor the publisher assume responsibility for opinions or statements of facts expressed by contributors or advertisers.
Contributions Wanted
WaterWorks welcomes the submission of articles relating to any operations area associated with the water industry. Articles can include brief accounts of one-o experiences or longer articles describing detailed studies or events. Submissions may be emailed to peter.mosse@gmail.com or info@wioa.org.au
CONTENTS
BYPASS SURGERY
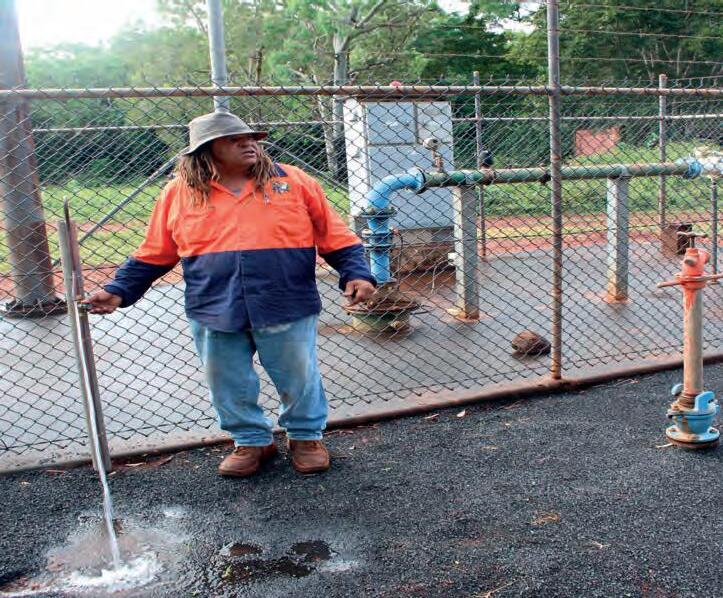
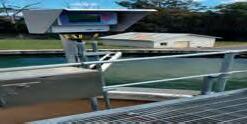
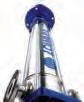
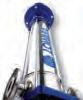
e three photographs in Figure 1 show three valves at Australian Water Treatment Plants (WTP).
ey all have something in common. ey are completely unlabelled, except perhaps for an asset number, and they have no sign indicating the importance of the valves to the ow of water at the respective WTP’s. Two of the valves have already been involved in water quality incidents. e third one is an incident in waiting. It was frozen and could not be turned and therefore its actual position (i.e. whether it is opened, closed, or somewhere in between) could not be determined.
e three valves are all raw water bypass valves, that is, valves that allow raw, untreated water to bypass all, or a major part, of a WTP and thereby allow untreated, undisinfected water to enter the distribution system.
e two incidents were both due to accidental opening of the valves while other works were being undertaken on site. One resulted in a noti cation to the relevant Health Department and the
imposition of a Boil Water Notice. e other was detected after several hours of bypass, but fortunately, no water had owed out of the storage reservoir at the WTP site. e tank was subsequently scoured and re lled.
OUR COVER
Peter Mosse
Figure 1a.
Figure 1c.
Figure 1b.
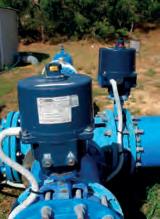
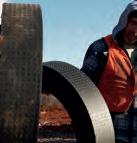
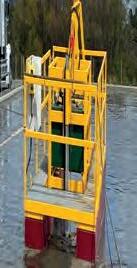
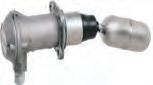
e valve shown in Figure 2 is a raw water pump bypass valve that separates the raw water from the high lift pumps. e assumption is that this valve is fully closed and does not leak. ere is a risk of raw water bypassing the treatment process and going directly to the distribution system and consumers. is valve is di erent to the ones in Figure 1 in that a recommendation was made in 2010 to remove this valve. Now in 2021, some 11 years later, the valve is still in position and still possibly leaking. And this is after several Drinking Water Quality audits, where at least one of them had a focus on raw water bypasses.
In a recent speci cation for a new WTP, the following words were included:
e Contractor shall provide an automated bypass system around the water treatment plant to facilitate the supply of water to the network in the event of a catastrophic failure at the plant. e position of the automated valve should bypass the treatment plant and storage tank to provide raw water to the supply pump inlet.
Raw water bypasses simply should not exist. ey de nitely should never have existed as they are con gured in the photographs. ere should be no such bypass path around a modern WTP. e use of the word ‘modern’ here doesn’t mean a newly installed WTP, but any treatment plant operating in the current decade.
Creating an opportunity for the supply of raw water to consumers is not acceptable, as the risk of illness and possible death is just too high.
All sorts of systems have been dreamed up to alter the risk, while not adequately controlling the risk. Some of these include manual valves with physical lock out, two manual valves both physically locked closed, and double block and bleed assemblies.
e only acceptable preventive measure is to remove a section of pipe and blank both ends of the pipes. If there really is still nervousness about possible loss of supply, or the need for an emergency supply in the face of a bush re, the removed section of pipe could be locked away, with clear instructions for its
reinstallation in an emergency, but only after consultation with the relevant Health Regulator.
e question needs to be asked: why are raw water bypasses needed in this day and age? Plant designers, consultants and water utilities are nervous. What if something goes wrong? at is a valid question, but the solution selected is often the simplest and easiest, but de nitely not the safest.
So how can we reduce or remove the need to implement a raw water bypass?
Conduct a criticality assessment. Identify all the elements in a WTP that are essential to the production of safe drinking water. ese are likely to be raw water pumps (although, if these fail, there will be no value even opening the raw water bypass anyway!), coagulant dosing pumps, possibly air scour blowers and instruments, air compressors, and backwash pumps.
Determine how long the system can operate at peak demand without the operation of the WTP. What is the limiting storage?
Establish electrical and mechanical response and repair times.
Assess the electrical mechanical contractor’s experience and ability to repair or replace all critical items. If uneasy with an element, replace it with something they are familiar with.
Set up a stock of spares with a controlled inventory that will allow repair or replacement within the minimum time necessary as identi ed above.
If there is a still a gap, build extra storage capacity. Planning to revert to a raw water bypass is not acceptable at any time, as the water supplied is not drinking water, so consumers will not be able to use it safely.
Lastly, label, label, label. All valves must be labelled to identify what they are, or what they do, with the open and close directions clearly marked. An unlabelled valve is just an incident waiting to happen
In summary, set up systems that will remove the need to implement a raw water bypass and surgically remove the o ending bypass!
Figure 2. Raw water pump bypass valve.
A TALE OF TWO CITIES
Steve Capewell
Our Guest Author
Steve Capewell (stevec@gvwater.vic. gov.au) joined Goulburn Valley Water as Managing Director in September 2020 after 18 years with the Water Corporation in Western Australia. Steve has extensive experience across the water services value chain including water cycle planning, asset management, operations, commercial and business services and major project partnerships.
With a strong technical and engineering background, Steve has deep interests and expertise in drinking water quality, water treatment technology and water quality governance and assurance processes. Early in his career he spent many years moving throughout regional WA leading water treatment plant optimisation and continuous improvement projects, along with the commissioning and integration of new plants and process technologies to water supply schemes to meet the requirements of the ADWG. He had extensive input into the early development of water quality performance and compliance frameworks associated with the Perth seawater desalination plant and the Beenyup groundwater replenishment scheme, both of which were ground-breaking projects and Australian rsts for combatting the e ects of drying climate in Western Australia.
At Goulburn Valley Water, Steve has a strong focus on safety, culture and operational excellence as part of improving the resilience, sustainability and liveability of the region.
A Tale of Two Cities – Well, Two States Actually
It’s now a little over a year since I became part of the water industry here in Victoria after more than twenty years in the same sector in Western Australia (WA). It’s a good time then to re ect on what I have seen and learnt so far about how ‘water is done’ in the east, and share my thoughts on some of the more interesting points of similarity and di erence, that is, before my mind turns it all into one homogenous mixture.
One does not need to be part of the Victorian water industry to know that the
most obvious di erence between it and WA’s is its structure. In WA, the Water Corporation has the responsibility for managing water and wastewater services across the entire state with two minor exceptions. Aqwest and Busselton Water provide water services in parts of South West WA.
I have spent many hours contemplating the pros and cons of being part of one major entity covering 2.6 million square kilometres as opposed to one of 19 water corporations serving an area one tenth of that size. e former of course a ords many advantages including the opportunity to leverage economies of scale, to standardise assets, technology and service delivery, and achieve a high level of consistency in customer experience and outcomes. e strength of the latter however is its demonstrated ability to provide highly reliable water services at comparatively low cost to the customer. Further, local entities mean local executive leadership and governance that can ensure very strong alignment between the strategic direction of the water utility and the vision and ambition of the particular community which it serves.
e jury is still out for me at this stage. Importantly though, each model has a history of delivering outstanding performance against the overall obligations and objectives of an essential service in a highly complex and everchanging environment. at’s why we love our jobs, right?
e next most obvious di erence between WA and Victoria is water source. When combined with di erent climate characteristics, the vast geography of Western Australia sees many di erent types of raw water used to produce drinking water depending on location. In the southern part of the state, this normally means rivers, streams, lakes, soaks, weirs, and even ponds. In the centre (the mid-west and wheat belt) it is groundwater, which can be shallow, deep and brackish. In the northwest it is more groundwater, especially in the very dry and hot inland towns. At the very top of WA it is back to surface water with the mighty Ord and Fitzroy
Steve Capewell
rivers. As access to ‘environmental water’ became unreliable (from the e ects of drying climate and reduced stream ow), seawater and treated wastewater were added to the portfolio to meet the demand for potable water. When presenting at international conferences I would contextualise the drying climate and geography challenge in Western Australia by saying that ‘…through necessity we use just about every type of source water… except snow melt’.
What could be thought of as a nightmare for water source planning engineers and asset managers is actually a dream scenario for the water quality and treatment specialist. at’s because, practically speaking, you have just about every type of water treatment plant that exists in the handbook. Conventional ltration technologies prevailed when I started in WA, but quickly progressed to ‘advanced conventional’ processes to achieve better disinfection characteristics shortly after release of the 1996 Australian Drinking Water Guidelines (ADWG). Examples of advanced conventional treatment include enhanced coagulation (sometimes with alternate coagulants), ion exchange, activated carbon – whatever worked to reduce dissolved organics in the raw water. Attention then turned to ltration performance and how to achieve what was considered at the time extraordinarily low ltered water turbidity.
It was at this point in the mid-2000’s I rst connected with the Victorian water sector, reaching out to Peter Mosse to teach us how on earth this could be done. It wasn’t long before Peter was schooling me and about a dozen of our most experienced technical sta and operators on the fact that it was more than just changing out lter media and ddling with ltration and backwash rate settings. e culture of really knowing your plant and the continuous observation of the entire treatment process that was required to achieve consistently high levels of lter performance was fascinating. It took us to new levels of water safety in WA back then, both at the large metropolitan plants and right across the regions.
When I rst visited Goulburn Valley Water’s treatment plants back in October last year, I instantly recognised this unique culture and vibe. It was both eerily familiar and incredibly satisfying at the same time. What could be better reassurance for a new MD than knowing (and actually feeling) the personal connection and dedication that operations sta have to their plants and the mission of delivering safe drinking water all day every day. More on that later.
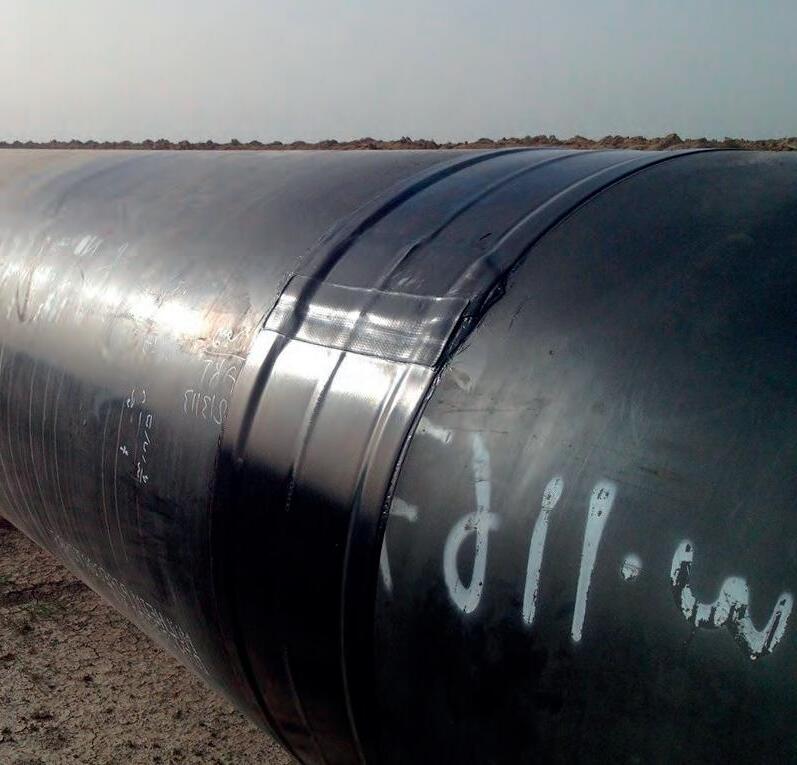
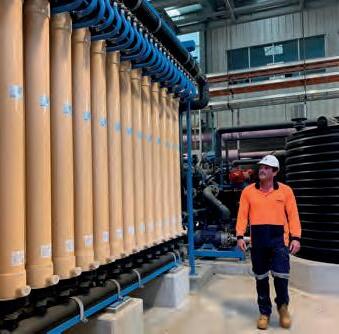
With the 2004 and then 2011 ADWG placing increased emphasis on barrier performance for microbiological removal and inactivation, it became clear that augmentation and retro tting of conventional water treatment technologies had its limits. is was especially true when the original design speci cation for many conventional plants was treated water at less than 1 NTU. WA and the industry generally pivoted to undertake more signi cant plant upgrades or build new plants featuring high performance clari ers and proper lter-to-waste capabilities. is was also the time that membrane processes came onto the scene in WA. Membrane systems, particularly low pressure systems such as micro ltration and ultra ltration, o ered smaller footprints, ‘simpler’ operation and almost guaranteed ltered water quality. e fact that these plants could be housed within a sea container and loaded onto a at-bed truck meant that this technology was mobilised to provide additional temporary ‘barriers’ to smaller, remote schemes in WA in a water quality incident scenario.
A membrane treatment plant.
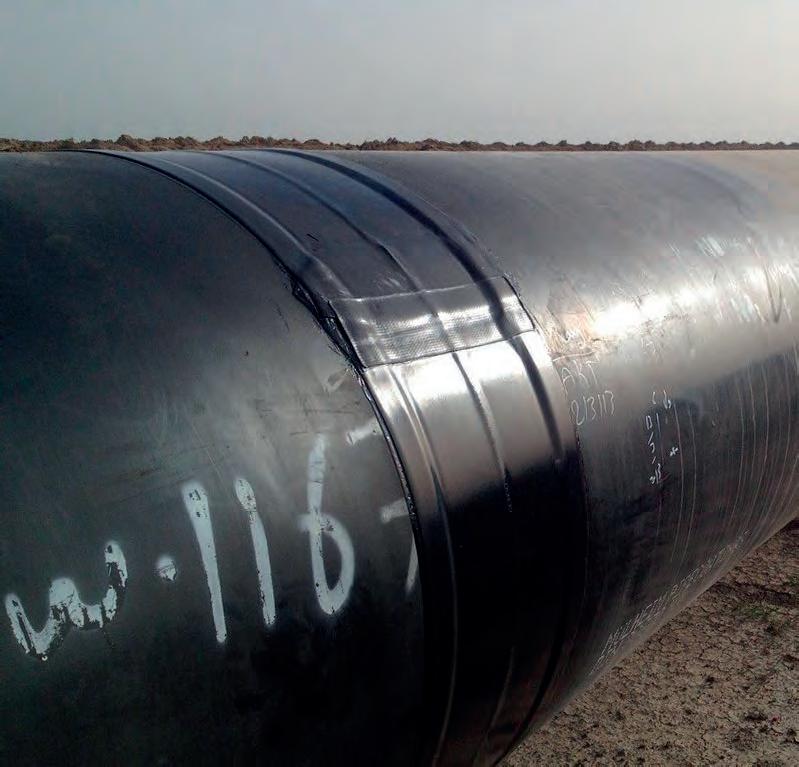
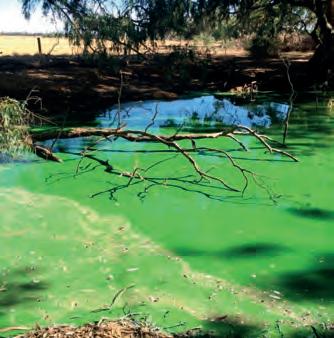
A blue-green algal bloom in a water course.
e downside of a membrane plant is of course maintenance (as well as what can be usefully done with the used membranes). at, and the fact that surface water prevails in regional Victoria is an interesting point of di erence from a treatment technology perspective – good luck getting raw water with even a modest dose of coagulant through micro ltration trouble-free – as is necessary for the highly coloured waters of the Goulburn Valley.
So far in this compare and contrast of east and west, I’ve discussed the industry, climate, sources of water and treatment technologies. Before I round things out with people, here’s a couple of other comparisons:
1. It’s consistent that we are inconsistent in our choice of assets and technologies. Clearly there’s no fun in having the next treatment plant or pump station looking like the one we built down the road two years ago.
2. Another similarity: incidents (of any kind) bring out the best in us (strong cooperation and collaboration
between internal departments, with unquestioned resource sharing, rapid decision making and focussed action) yet translation of that to business-asusual seems impossible (I think this could be a global phenomenon).
3. Algae, particularly blue green algae, is a problem in parts of WA. Here on the East coast it is just pure evil.
Humour aside, the emergence of water utilities pivoting from water and wastewater service provider to that plus many other value propositions for customers and communities is consistent and obvious. e broad uptake and participation in initiatives such as wastewater virus detection are excellent examples of what can be done by our industry to support thriving, healthy and prosperous communities.
So nally, and most importantly, I want to discuss people. Whether east or west, or anywhere that I have visited in between over my career, the skills, passion, enthusiasm and resilience of
operators and frontline water industry sta is consistently one thing. Excellent. Operators in both states, in fact all over Australia, wear many hats: safety champions, innovators, problem solvers, continuous improvement practitioners, meticulous housekeepers, agile change agents…. I could go on. ey work in di cult and challenging circumstances, sometimes alone or in very small teams, yet take their frontline responsibilities very seriously, all day every day. is last year I have been incredibly proud of our operators and service delivery teams at Goulburn Valley Water who have taken a complex and highly changeable landscape in their stride. ey have showed the rest of us how it’s done. I am sure it’s the case everywhere.
My main takeaway from reading A Tale of Two Cities many years ago was that despite the duality of the world that existed in the novel, the truth is in who you are and what you do. I am a water industry professional, and my job is to serve my sta , my customers and community, and the broader industry. Wherever I might be.
Pro-Ring™
Raise Sewer MHs to grade safely and quickly
WSA Appraised Lightweight Trafficable – Class D Leak tight
New solutions to old problems for sewer, potable and stormwater assets
Innovative products to improve the return on your valuable sewer, stormwater and potable assets
•Raise MHs to surface safely, quickly and cost-effectively
•Prevent leaks forming
•Permanently seal leaking pipes and MH joints
•Stop concrete corrosion
•Asbestos cement water main encapsulation (EncapsulAC EPR)
LSS Chimney Seal
Metz Epoxy Novolac
Gator Wrap
EncapsulAC® EPR
HydraTite® Joint Seals
Aqua Seal
KWIK ZIP SPACERS
kwik-ZIP Spacers manufacture and supply an innovative centraliser and spacer system for many industry sectors, including production well drilling, trenchless pipeline, hard disk drives, civil and construction.
kwik-ZIP spacers are the only Australian-owned spacers on the market. ey provide clients with a cost-e ective and simple solution to their spacer and centraliser requirements.
kwik-ZIP spacers and centralisers have been developed to solve support, grading and centralisation challenges in the trenchless and pipeline, vertical production drilling, and ground engineering industries.
Manufactured from high-grade thermoplastic, kwik-ZIP products are used and recommended by pipeline and civil contractors, water and gas utilities, drilling companies and international engineering rms.
kwik-ZIP Spacers are:
• QMS ISO 9001:2015 certi ed
• certi ed by the Australian Water Quality Centre (AWQC) against AS/NZS 4020:2018 – Testing of products for use in contact with drinking water
• certi ed against WSA PS – 324 Casing Spacers under WSAA (Water Services Association of Australia) Technical appraisal #1523 for kwik-ZIP’s HDX range of spacers
• MRWA (Melbourne Retail Water
Agencies)-approved for both the HD and HDX series
• SEQ Water Supply and Sewerage Design and Construction Code – SEQ Accepted Civil IPAM List.
kwik-ZIP has established distributors in Australia and New Zealand.
For more information, visit www.kwikzip.com.
CARP SPOIL EFFLUENT AT MOREE
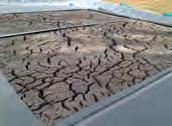
It all started in 2017 when water quality began falling away at the e uent reuse locations supplied by the Moree STP in north central NSW. e tertiary lagoons have more than 48 days retention time, so the e uent should have been clearer than it was. Old photos con rmed the change over time.
e banks of the four tertiary lagoons were collapsing creating very narrow internal tracks for vehicles to drive on and carry out inspections. Turbidity was increasing, as were the nutrient levels, and settling of the solids was poor. Aeration aimed at reducing phosphorus and improving the water quality was tried in 2017 with some limited success. Consequently, a second aeration unit was added in 2019 whilst other options were being implemented, but the problem remained.
An investigation was commenced as Council’s Parks and Garden department were experiencing persistent issues with sprinkler heads blocking and breaking. It appeared that the issue was getting worse. Sediment was appearing in the irrigation lines which had not occurred before.
Samples were taken from the inlet works, aeration tanks (SBR system) and from decanting channels in the lagoons. e results showed that the SBR plant was working e ciently, while the samples from the tertiary ponds showed high TDS and turbidity.
In one of the lagoons, clumps of European carp were noticed swirling around and breeding in about a 2 to 3 metre circle. Looking across the second lagoon, there were about 8 of these clumps and the penny dropped about the probable cause of the problem. European carp had invaded the tertiary ponds during the 2011 and 2012 oods and had increased in size and numbers.
Observations con rmed that the carp were the likely cause of the problems. ere were just so many carp. As adults, carp usually feed on the bottom and on the banks of the ponds. ey feed by sucking soft sediment into their mouths, where food items are separated and retained, and the sediments are ejected back into the water. is habit (known as roiling) leads to a suspension of sediment in the water.
Roland Heatley
When carp are present in high numbers, the resultant suspended sediment can result in several problems, including the direct deterioration of water quality leading to clogging of sprinkler systems. At almost any time of day, the carp could be easily seen sucking on the banks or stirring up the oor of the lagoons. eir feeding habits also undermined the banks of the tertiary ponds leading to the collapse of banks and associated vegetation.
e question was what to do about them?
By 2018 a project was initiated to remove the carp from the lagoons. Various options were considered.
• Poisoning was dismissed as a viable option early on, because of the fact that it was an indiscriminate strategy, and that all other wildlife present would die as well. A large ecosystem exists within and surrounding the ponds, and we weren’t willing to endanger other species.
• Electrocution and explosive charges were also quickly discarded due to there being no control over impacted species. Personally, I would have loved to have used explosive charges.
• Fishing competition. I was keen on this idea having seen the tourist dollar brought in at Horsham, Victoria over a long weekend. is option was soon dismissed by other departments within Council, due to their concerns with risk and liability with members of the public inside an operating sewage treatment plant.
• Release of a carp Herpes virus. is was still in a developmental stage and not ready for distribution. Herpes virus was also quickly taken o the table as we didn’t want another saga like rabbits, foxes and cane toads.
• Commercial shing.
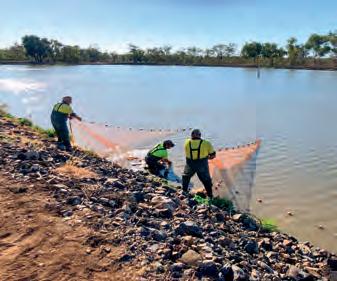
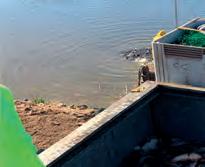
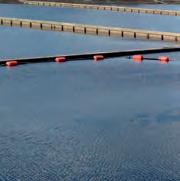
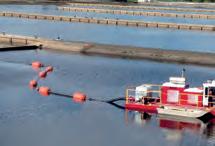
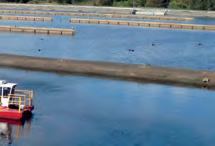
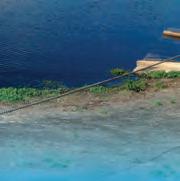
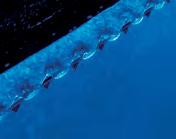
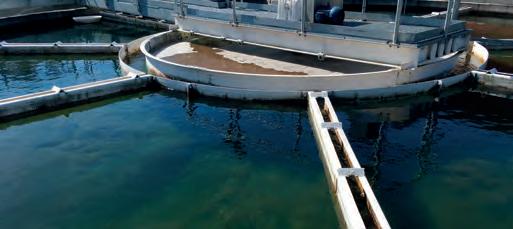
Commercial shing was seen as the best solution and quotations were sought from suitably quali ed and licenced contractors. e shing program was carried out over a one week period in May 2019. Nets were installed around the lagoons. e nets, extending from the water surface to the lagoon oor (approximately 1.5m deep), were swept across the lagoons and drawn into one point at the edge of the lagoon (Figure 1).
Figure 1. Nets being dragged to the edge of a lagoon.
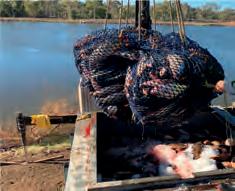
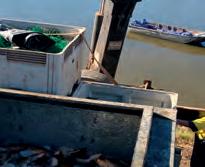
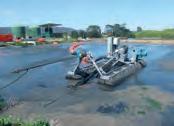
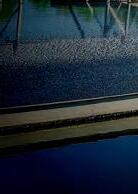
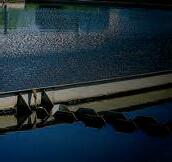
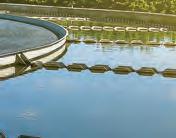
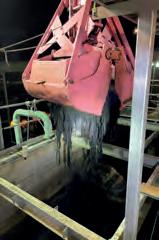
A crane truck was then used to drag the net out of the water and load the carp into a large container packed with ice (Figures 2, 3 and 4).
A total mass of 7,112 kg of carp was removed from the four lagoons. e project was judged a success. A large majority of the carp population has been removed from the ponds resulting in the water quality improving signi cantly. Having removed over 7 tonnes of sh and returned any native species caught was a good result.
Council plans to carry out the same operation every 2 years unless more frequent removal is required. e cost was around $16,000 or $2.25 per kilo of carp! All of the carp ended up as fertiliser, a great result.
In some places the lagoon banks which were originally 4.5m wide, had been reduced to around two metres, just wide enough to allow a utility to pass. Repairs to the damaged lagoon banks were undertaken including bringing in new clay to replace the collapsed areas of the banks. Council sta and equipment was utilised to restore the banks and to place new rock beaching. e overall cost of the repairs was just under $125,000. Who said carp don’t cost much.
e Author
Roland Heatley (roland.heatley@mpsc. nsw.gov.au) is the Water Services Manager, with Moree Plains Shire Council in NSW.
Figure 2. Carp being dragged from the water via crane. Note the “escapee”.
Figure 3. Netted carp being placed on ice for transport.
Figure 4. The final haul.
WAGO TOPJOB® S RAIL-MOUNT TERMINAL BLOCKS
New Disconnect and Fuse Terminal Blocks with Push-Buttons
Changing the industry with the mere push of a button, WAGO now offers button-actuated function terminal blocks that are modeled after the successful push-button-equipped TOPJOB® S Rail-Mount Terminal Blocks.
These new terminal blocks allow users to benefit from push-button convenience across the entire terminal block assembly. The new disconnect/test and fuse terminal blocks for 2.5mm² conductors feature WAGO‘s industry-proven Push-in CAGE CLAMP® connection technology, allowing solid and stranded conductors, as well as fine-stranded conductors with ferrules to be quickly terminated by just pushing them into the unit. Furthermore, they provide simple and intuitive operation – the orange color highlights the push-buttons. This rail-mount terminal block system conveniently uses the same wide range of accessories of WAGO‘s accessories as the TOPJOB® S Function Terminal Blocks with operating slots.
• Reliable power circuit disconnection via integrated knife disconnect or a separate disconnect plug
• Clear visual confirmation of the switched status
• Suitable for nominal wire cross section 2.5mm2
• Product electrical circuits against short-circuiting
• Suitable for miniature metric fuses or blade style fuses
• More versions available with LED indicator, and accessories such as jumpers and marking.
• Terminal designed for mini-automotive blade style fuses.
• Compact design with only 5.2mm width, without the end-plate.
• Wide range of accessories available, making this range of terminals quick and easy to install.
NEW TRAINING FACILITY AT GREATER WESTERN WATER
Designed to educate and fast-track the development of sta undertaking water and sewer infrastructure maintenance in the eld, Greater Western Water has opened a new training facility at their Melton depot.
e depot services a large area, responding to over 5,500 calls from water and sewer customers a year, which in 2020 alone resulted in 4645 hours worked in after-hours calls.
Giving sta access to practical training in the fundamentals of water and sewer maintenance, the facility is helping to deliver better customer experience, safer work practices and business e ciencies.
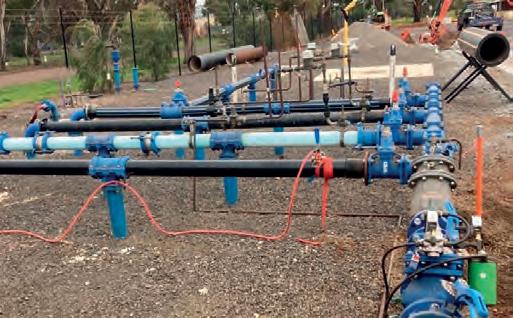
e facility includes an above ground water pipe network (Figure 2) and a below ground sewer network to allow training to take place in a simulated safe environment.
Grant Powell
e above ground water main includes a pressure reduction valve (PRV), back ow prevention devices, water air valves, sluice valves, water meter assemblies and space to undertake tappings. Water pipe materials include copper, DICL, MSCL, M-Class PVC, PE and asbestos pipe buried under the ground.
e below ground sewer network incorporates upstream and downstream maintenance holes (manholes) as well as o take pipes to mimic customer connections. e sewer training facility allows sta to use the high pressure water jetting equipment (HPWJ) to clear simulated blockages in the house connection branch (HCB) and sewer network. It can also help train sta in using sewer closed circuit television (CCTV) equipment to identify blockages or issues with the pipes without disrupting customers.
Figure 2. The sewer network section of the facility.
Figure 1. The water network section of the facility.
e facility gives sta the opportunity to gain knowledge and competency for “real life” sewer network tasks. Enhancing their familiarity with assets in this controlled environment also makes our sta safer by equipping them with the knowledge they need to operate safely and e ectively in the eld.
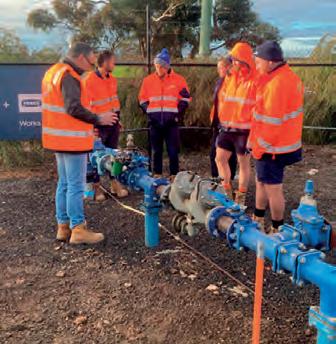
e facility and all the associated equipment is used by a Registered Training Organisation (RTO) to deliver formal training to the GWW operators. e bene t is that the RTO sta can assess the competence of the operators on site against a variety of network maintenance tasks. Once the operators are deemed competent, statements of attainment under the National Water Package can be awarded by the RTO (Figure 3).
Following completion of the formal training with the RTO, GWW has the opportunity to undertake periodic refresher training with the operators. An internal refresher training guide has been created allowing GWW sta to work with the operators to ensure that their skills remain current.
By utilising all the components installed within the training facility, training can be undertaken on a wide range of Occupational Health and Safety and operational scenarios. Some of the training able to be undertaken on site include:
• Con ned space entry
• Main to meter, working with electricity
• Working on MSCL pipe
• Working from heights
• Pressure reduction valves (PRVs)
• Back ow prevention devices
• Sewer works, jetting and CCTV
• Water and sewer air valves
• Leak investigation
• Meter assemblies
• Electrical conductivity
• Testing for Chlorine residual
• Air release
• Water main tappings
• Service leak repairs
• Leak detection and pipe location training
• Water hydraulics
• Pressure and ow testing
• High pressure water jetting
• Tra c management
• Lock out – Tag out training
e training facility has generated interest from many other water industry training providers and water corporations, as well as contractors interested in utilising the facility for sta development and training.
e long term plan for the training facility is to establish intelligent networks for training by installing water quality probes, pressure sensors, automated water ushers, site sentinel devices and much more. is will enable data from the site to be transferred into a training room and displayed on a big screen to show trends and allow operators to learn how to virtually operate a water and sewer network.
Additionally, there are plans to install an electrical switchboard with provision to allow lock out/tag out training. It
will also provide the opportunity to run a low amperage wire to the the water pipes to simulate an electric current in the reticulation network. Operators can then be taught correct procedures to avoid electrocution from working on the network.
Contributors to the project include Viadux/Reece Civil, Humvee Excavations, Bermad Water Technologies, Intelligent Water Networks (IWN), Trainright, Earthtec Excavations, Water Training Australia and the Water Industry Operators Association of Australia (WIOA).
e Author
Grant Powell (Grant.powell@gww. com.au) is the Coordinator of Field Maintenance Services with Greater Western Water in Victoria.
Editor’s note:
On 1 July 2021, Western Water and City West Water in Victoria integrated to form one water corporation, Greater Western Water.
Figure 3. Some training on the water pipe network being undertaken.
your
• Easy to use and reliable, resulting in improved plant uptime
• Corrosive resistancefor added protection for extreme environments
• CIP Security for added cyber-security protection
• Embedded analytics to aid in maintenance planning and execution
NHP is proudly 100% Australian owned and is amajorsupplierof Low Voltagevariable speed drives,as the sole distributor of Allen-Bradley products in Australia and New Zealand, with astock holding up to 450kW locally.With experts based in every capital city as well as regional centres across the length and breadth of Australia and New Zealand,it is NHP’s and Rockwell Automaton’s local people and footprint that helps us to understand your specific project needs,with superior after sales support and technical advice.
WATERBORE and water asset specialists
ACS Equip are servicing and maintaining town and city water supply networks for over half a million people. ACS Equip provide a complete bore service portfolio to cover any aspect of your bore. Whether you require inspection, diagnosis and remediation of an existing issue or an ongoing preventative maintenance program, we have you covered!
SAFETY QUALITY EFFICIENCY SUSTAINABILITY
ACS Equip operates across Australia and are the industrypreferred supplier for specialised services including:
•Bore Condition Assessments and Bore CCTV Inspections
•Bore Cleaning and Redevelopment
•Bore Repairs, Relining and Refurbishment
•Fishing and lost equipment retrieval
•Yield Pump testing
•Bore and Bore Field maintenance
•Remote Telemetry sales, installation and service
•Water sampling and testing
•Water Mainline Condition Assessments and CCTV Inspections
•Mainline cleaning and maintenance
The new Alyza IQ series from WTW adds innovative wet chemistry analyzers to the IQ Sensor Net range of dependable online monitoring instruments for water and wastewater.
Why choose Alyza IQ?
• Less than 1ml a day reagent use (P04), and just over 2ml a day (NH4), for typical low-range use.
Alyza IQ Orthophosphate and Ammonium analysers provide you with lower reagent use than most other units, along with simple servicing, highly accurate measurements, and automatic self-calibration. All up, you get testing you can count on, that also delivers a great Return On Investment.
• Clever sealed reagent bag design makes replacing reagents easier and safer, than ever before.
• Real-time monitoring of reagent levels helps keep your analyzer operating efficiently.
• Routine self-calibration ensures you get consistently accurate measurements. Contact us for more information.
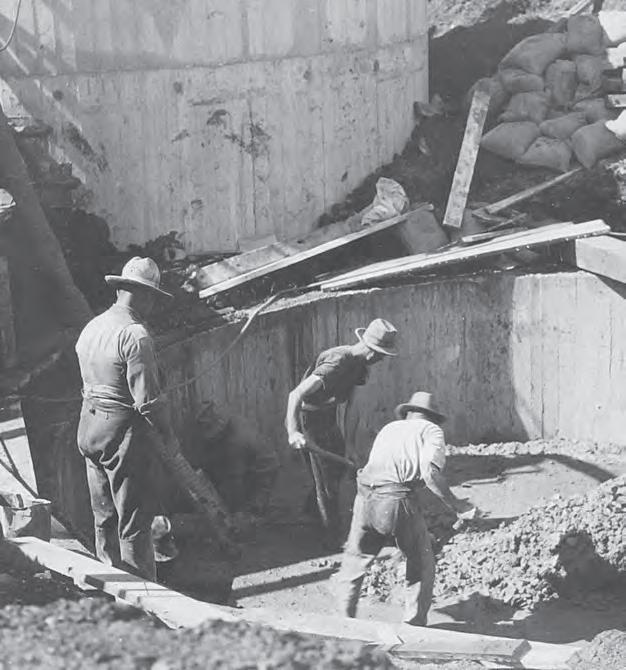
CLEANED INLET WORKS AT OXLEY CREEK
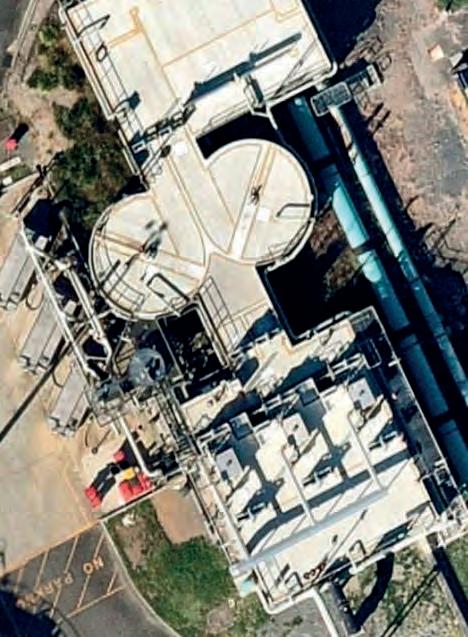
e inlet works for the Oxley Creek Resource Recovery Centre (RRC) were designed and constructed in 2006 when Stage 5 of the Oxley Creek RRC was completed. e project provided an additional 53ML/d of treatment capacity, allowing the ow through the original treatment plant to be reduced from 40ML/d to 12ML/d. e reduced ow resulted in an improvement in e uent quality. e combined capacity of the two plants is 65ML/d.
Bill Collie
e inlet works consists of a receiving chamber with a ba e wall in the front allowing the sewage to ow over or under, three centre ow band screens and two vortex grit chambers (Figure 1).
e nal pump station that feeds the raw sewage into the Oxley Creek RRC contains four 280kW pumps, each capable of delivering approximately 1,000 L/s. Urban Utilities, who operate the plant, planned to bring additional wastewater ows from the Indooroopilly catchment
to the Oxley Creek RRC to lessen the load on Brisbane’s main Luggage Point treatment plant. To cater for the additional volumes, the number of pumps needed to be increased from four to six.
Prior to investing in the pump station upgrade, a full review of the existing infrastructure was undertaken. e challenge was to understand the hydraulics and maximum ow capacity of the receiving chambers and to determine the maximum capacity of the system. It was quickly determined that the existing pumps were not meeting the design speci cations. e output of all the pumps were tested individually with all failing to meet their design curve. So began a process of elimination to determine the cause.
e original pumps 1 and 2 were damaged during the 2011 ood and were decommissioned. Investigation of the two rising mains that pumps 5 and 6, and pumps 3 and 4 deliver into, showed that there were potential losses due to the manifold and change of directions from the dry well to the inlet works.
ere was history from previous shutdowns of grit in the receiving chambers of the inlet works. A commitment was given to go in and check the inlet works. What unfolded in the inspection and subsequent works was beyond belief.
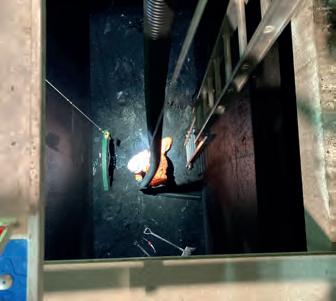
e inlet works were dewatered to allow access for an inspection. e worker in Figure 2 is standing on approximately 1 metre of rag and grit. e inlet works is 12 metres wide and the top of the delivery pipe (1050mm ID) is just protruding above the accumulated material.
e ow enters this chamber and can pass under, and over (during high ow events), the wall in the photo. What was occurring due to the build-up of grit and rag at the bottom, was a waterfall over the top of the wall and a massive loss of velocity at the bottom. e reduced velocity was insu cient to carry the grit through to the grit removal chambers.
A program was implemented to remove the accumulated rag and grit. e work was undertaken at night during o peak ows, and spread over two weeks.
Figure 1. Aerial view of the Oxley RRC inlet works.
GRIT VORTEX CHAMBERS
CENTRE FLOW BANDSCREENS
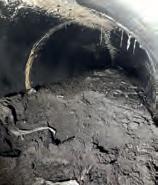
e rst two nights saw the removal of approximately 40 m3 of grit and some rag. Figure 3 shows a view inside the rising main at this stage. e pipe was half to two thirds blocked with grit and rag, thus restricting the ability of the pumps to deliver the design ows.
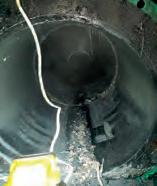
After the second night, enough material had been removed to allow the sewage in ows to start to push the remaining grit to the grit chambers and clear the pipe (Figure 4).
Once the grit was removed from around the rag, it left a rag tube around 12 metres long and 600-900 mm in diameter. No amount of suction from the vacuum truck was going to remove this massive ball of contaminant.
During the down time to allow for plant recovery, the contractor sourced a clam shell bucket that could be lowered into the chamber. So began the task of lifting the rag out in bites of between 300-900 kg at a time (Figure 5). Slow and tedious work, but successful. It is estimated that 120 m3 of rag and grit has been removed from the inlet chambers.
As a result of the inlet works cleaning program, the pumps have been able to achieve their design ows.
e next issue to be resolved relates to the throughput of the inlet works. A new design is currently being modelled to see if this will allow the grit and rag to be kept in suspension so that they each reach
their respective removal facilities further downstream in the process rather than settling and accumulating.
While planning and work is being undertaken to deliver an overall solution to the slowing of ows through the inlet chamber, a temporary manual ushing practice is now in place and run every morning during peak ows to keep each rising main free of grit.
e Author
Bill Collie (bill.collie@urbanutilities.com. au) is the Plant Manager Treatment and Production Environmental and Industrial , with Urban Utilities in Queensland.
Figure 3. One of the two rising mains exposed after the inlet chamber clean.
Figure 4. The scoured, clean pipe with all the grit now in the grit chamber.
Figure 5. The clam shell bucket in action removing the accumulated rag.
Figure 2. The accumulated rag and grit material in the inlet works. The top of the delivery pipe is indicated with an arrow.
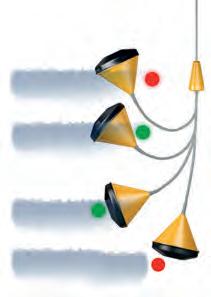
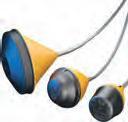
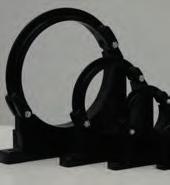
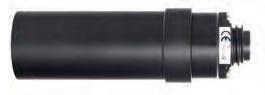
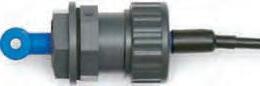
Reliable pump and valve control delivers flexible level solutions:
Reliable pump and valve control delivers flexible level solutions:
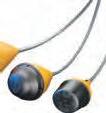
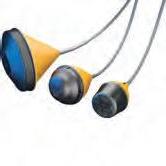
• No more tangles – up to four switches in one float
• Choice of three di erent sized floats to ensure enough buoyancy for your application – ranging from clean to black water.
• Wide range of output configurations: high / low level alarm, pump control & gold plated contacts for low voltage / current applications (e.g. battery powered telemetry systems).
• Perfect for sumps, sewage, water & wastewater treatment, power stations & silo (solids) monitoring
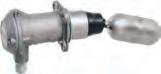
TRIMOD BESTA FLOAT SWITCHES
Rugged SS switches – Ex, low current, top mount & pneumatic alternatives
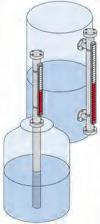
WEKA MAGNETIC VISUAL LEVEL INDICATORS
•Locally made
• +GF+ PVC and PVDF
•316SS
• Scales and level alarms.
Emptying control + high level alarm
The pump is switched on when the liquid level rises to the pre-determined high point and remains on until the low level has been reached again. The switch also issues both low and high level alarms.
FAREWELL TO ACTIVATED SILICA AT REATTA RD WTP
Ryan Melville, Brett Pritchard and Terry Preston
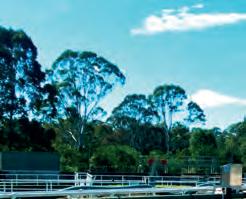
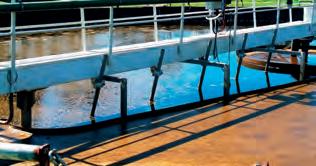
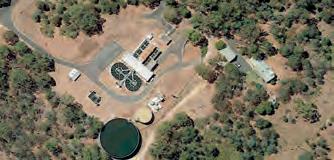
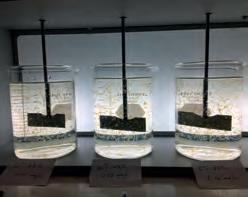
e Reatta Rd WTP is a 20 ML/d Water Treatment Plant (WTP) in the north of Tasmania (Figure 1). It is a key asset in the West Tamar drinking water supply system, servicing towns along the western side of the Tamar River, from Beauty Point in the north, down to Trevallyn Dam just outside of Launceston. Historically, the plant has used alum coagulation with activated silica dosed as a occulation aid to improve settling in the clari ers. e activated silica is dosed into the clari er ow splitter box prior to occulation and clari cation in two Accelator (up ow sludge recirculation) clari ers (Figure 2). Note the relatively high sludge blanket.
e activated silica is currently manually batched to 1% wt/vol as SiO2 and dosed at around 1 mg/L.
In the past, activated silica found widespread use as a coagulant aid (after a primary coagulant such as alum or ferric chloride), because it forms heavy, robust ocs that settle fast. However, polyacrylamide polymer products have now largely replaced activated silica in most water treatment plants as they are stable and easier to handle.
Activated silica, is produced by reacting solutions of sodium silicate with sulphuric
acid. e activation reaction leads to the polymerisation of silicate ions with a molecular formula Na 2O(SiO2)n. It is an alkaline product and its use will result in increases in pH in the treated water.
While the activated silica system has performed well, the primary reason for TasWater seeking the change was that it poses WHS risks to operators. Batching the activated silica is a manual process involving the handling of dangerous goods and one which needs to be done on a regular basis as the prepared batch has a relatively short lifespan of only 1-2 days.
TasWater wished to reduce the handling risks and relieve the operator burden as much as possible and to bring Reatta Rd WTP in line with the chemicals used and the operational practices at other TasWater sites.
In 1997 the Bryn Estyn WTP, supplying Hobart, switched from using activated silica to polyacrylamide. Given that Bryn Estyn WTP has a similar clari er and lter design, and comparable raw water quality to Reatta Rd WTP, it was considered likely that a similar change of coagulation aid would be bene cial at Reatta Rd WTP.
Figure 2. One of the upflow clarifiers at Reatta Rd WTP.
Figure 1. Aerial view of Reatta Rd WTP.
Magnafloc LT Polyacrylamide Range
e lessons learned from that change at Bryn Estyn WTP are summarised below.
• Compared to polyacrylamide, the activated silica produced a heavier and faster settling oc.
• Activated silica increased the pH of the water whereas polyacrylamides have negligible impact on dosed water pH.
• At the time of changeover, when operated with polyacrylamide, the Bryn Estyn clari ers were initially more sensitive to dose rate and operating parameters (impeller speed, sludge blow down, oc zone concentration) than with activated silica and required adjustment of these parameters to achieve satisfactory stable operation.
• e Bryn Estyn clari er also required a well-balanced sludge blanket (height and solids concentration) for satisfactory operation with
polyacrylamide, which increased monitoring requirements.
Polyacrylamide Chemistry
Charge and Molecular Weight
Polyacrylamides are the most widely used organic polymers in the water industry today. ey are available with a wide range of molecular weights (chain lengths) and charges to suit di ering raw water qualities and treatment applications. Table 1 and Figure 3 give the properties of one type of polyacrylamide. Similar ranges are available for other types.
For a moderate to high polyacrylamide dosage (>0.08 mg/L), the size of the oc particles is directly related to the molecular weight of the polyacrylamides; the higher the molecular weight, the larger the oc.
Conversely, for low dosages (<0.08 mg/L), polymers of moderate molecular weight give better results due to the ocs being smaller in size but greater in number, thereby increasing the number of collisions with and binding to yet un occulated particles ( nes). Due to the larger but fewer ocs formed with highmolecular-weight polymers, distribution is poorer and the larger ocs tend to miss the nes, leaving them in suspension.
Non-ionic polyacrylamides have a very low charge density (slightly positive) and can bind neutrally charged particles. Colloidal particles in waters that have undergone coagulation have a neutral charge, and as such non-ionic polyacrylamides generally make good occulation and lter aids.
Cationic polyacrylamides have a positive charge and can neutralise the negative charge on colloidal particles, and bind them together. is may allow a reduction in the initial dose of inorganic coagulant compared to using non-ionic polyacrylamides. ey are also useful in organic laden waters where the colloids tend to carry strong negative charges.
Anionic polyacrylamides have a negative charge and can both neutralise excess positive charges and bind them together. Positively charged colloids are much less common, but there can be an excess positive charge after coagulation with the metal ion, especially if coagulant overdosing is occurring.
Table 1. Characteristics of Magnafloc polyacrylamides.
Figure 3. Graphical presentation of the characteristics of Magnafloc products.
Cationic and anionic polymers are available with di erent levels of charge. Weaker charges give exible ocs, having good shear strength, but their ltration properties are not as good. Conversely, a moderate or stronger charge gives better ltration properties, but the ocs obtained are more prone to shearing.
e pH of the water is also a consideration. Raising the coagulation pH allows metal hydroxides to be precipitated from a soluble into solid
state. ese may then directly in uence occulation, primarily by capturing the colloids present in ocs.
e ionic charge of the polymer also depends on the pH.
• Strongly anionic polymers are very e ective in a basic (pH >7) solution, but their performance is not as good in acidic (<7) solution because the carboxylate/carboxylic functional groups do not dissociate in such a
Polymer cost Lower.
Stability in storageStable, but must be kept dry.
Moisture adsorption
Handling difficulty
Batching system cost
Absorbs water from the atmosphere causing clumping and blockage in batching systems. Storage hopper must be sealed and transfer/ metering screws heated to prevent this.
Moderate. Dust must be carefully controlled and powder must be kept dry.
Higher due to being approximately 50% inactive
Separates from hydrocarbon carrier during prolonged storage.
Negligible.
Easy. Emulsion can be transferred and metered using standard pumps.
Higher due to increased complexity of solids handling Lower.
Storage requirements Indoors area, with no special requirements
Spill control, e.g. bunded area or spill pallets.
Table 3. Comparison of different locations for dosing polyacrylamides.
Dosing Point
Immediately after the alum dosing point.
May be beneficial for cationic polyacrylamides as these assist coagulation.
Inlet to flocculation/ splitter box. Proven effective location.
Coagulation process unlikely to be complete, so less suitable for nonionic polyacrylamides.
Coagulation is slow in cold water, so coagulation may not have finished at this point.
Dosing quill.
Dosing quill or spray bar.
medium. erefore there are fewer negative charges.
• Non-ionic or moderately cationic polymers are the best performers in acid conditions, which suits the removal of NOM (which are typically negatively charged species), as a low coagulation pH (<6.3) is often found to be most e ective. Surface water in Tasmania typically contains a high concentration of negatively charged natural organic matter (NOM).
Powders and Emulsions
Polyacrylamides are commercially available as a nely powdered solid, or in liquid form as an emulsion in a hydrocarbon carrier. Both forms need to be dispersed in water and thoroughly mixed to create a solution suitable for dosing. Typical target solution strengths are 1-5 g/L as active polymer, with concentrations beyond this being highly viscous and more di cult to pump and disperse. Once in solution, polyacrylamide begins to degrade and should be used within a few days. However, the solution viscosity and rate of degradation are both highly dependent on the type of polyacrylamide.
Both polyacrylamide forms have their advantages and disadvantages, and a summary of the attributes for each form is given in Table 2.
In general, powder is preferred in high consumption applications, e.g. a large WTP, as it costs less and the stock is stable in storage. Conversely, emulsion is often used in small systems where the reduced cost and complexity of the batching system is able to o set the higher cost of supply.
In larger water treatment plants, polyacrylamide solutions are typically prepared from powder using an automated batching system made up of a mixing/ maturation tank and a separate dosing tank.
E ect of Di erent Dosing Locations
Inlet to each clarifier.
Flocculation well of each clarifier
Gives more time for completion of the coagulation process, so beneficial for cold water and non ionic polyacrylamide.
Gives greatest amount of time possible for coagulation.
More complex dosing, as split dosing lines with rotameters required to evenly divide the dose.
More complex dosing, as split dosing lines with rotameters required to evenly divide the dose. Mixing not as good as other dosing locations.
Dosing quills, split dosing line, rotameters.
Split dosing line, rotameters, spray bar.
e dosing location of polymers can have a large impact on coagulation and occulation. For this reason, it is good practice to design multiple dosing points branching o a main dosing line, each tted with manual isolation valves to allow optimisation. A general comparison of alternative dosing locations is provided in Table 3.
Reatta Rd WTP Trial
A series of jar tests were conducted to identify the best polyacrylamide polymer and dose.
Table 2. Summary of attributes for powdered and emulsion polyacrylamides.
e testing indicated LT22s cationic polymer performed better than LT20 non-ionic polymer. LT22S oc formation was rapid with large ocs formed (Figure 4).
e settling rates were good. Turbidity and colour reduction was excellent, as well as achieving high UVT results. Very good performance was achieved with doses as low as 0.06 mg/L.
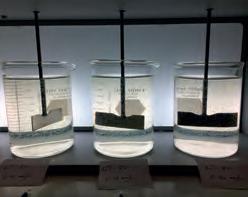
By comparison the results with activated silica were not as good (Figure 5).
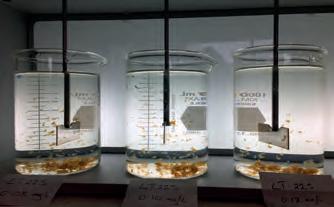
For completeness, jar testing was also carried out using the anionic polymers LT25 and LT27. ey both performed well, with good colour reduction as well as achieving high UVT results. Floc were small and similar to LT20, but the settling rates were very slow. After the gentle mixing period, good oc settling was not achieved until approximately 7 minutes. Filtered water turbidity readings were slightly higher than water dosed with LT22S. e ltered water quality was comparable to that of LT22s cationic polymer. e conclusion was that oc produced using these anionic polymers would de nitely have di culty combatting the updraft of the clari er and would therefore not be suitable for use at Reatta Rd WTP.
Based on the jar test results, a brief plant trial using LT22S was conducted by the TasWater Optimisation team towards the end of 2020. is consisted of installing a temporary polymer batching and dosing rig and using it in place of the WTP activated silica dosing system.
Figure 4. Results of jar testing of LT22S (left) and LT20 (right) at the completion of the gentle mix stage. Doses in the jars from left to right were 0.10 mg/L, 0.12 mg/L and 0.14 mg/L.
Figure 5. Comparison of settling after 30 seconds for LT22S floc (top) compared with activated silica floc (bottom). The doses were 0.08, 0.10 and 0.12 mg/L for LT22S and 1.10, 1.30 and 1.50 mg/L for activated silica.
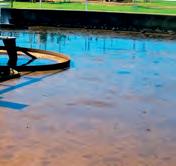
Sludge blanket detectors were also installed in each clari er (Figure 6) to allow better monitoring of the behaviour of the sludge blanket.
e results of the trial are summarised below.
• After an initial expansion in the sludge blanket, the blanket settled to sit slightly lower in the clari er and was more controllable. Activated silica had been causing pluming on the western side of the clari er, possibly caused by heating of the wall from the sun and having a greater impact on the higher sludge blanket.
•Polymer was dosed at the clari er common inlet where the activated silica had been dosed and was found to be e ective.
• Polymer dosing started at 0.14mg/L with the expectation that the sludge blanket would increase during the changeover. e dose was then reduced to 0.12 mg/L for the remainder of the two month trial.
• ere was no change in the lter runtimes, and ltered water quality remained as good or maybe slightly improved during the trial. Filter headloss accumulation and run times were unchanged. e operators noted less build-up of carry over material sitting on top of the lter media.
• ere was no change to the clari er settings necessary except for the sludge discharge control.
e WTP has now converted back to activated silica dosing for a period while a permanent polymer batching unit is being designed and installed.
e Authors
Ryan Melville (ryan@citywater.com.au) is the Senior Research Scientist with City Water Technology. Brett Pritchard ( brett. pritchard@taswater.com.au) is Optimisation Facilitator and Terry Preston (terry.preston@taswater.com.au) is Plant Operator, both with TasWater.
Water and Wastewater Treatment, Chemical Processing, Hydrocarbon Processing, Food Processing
• Capacity: To 155m³/hr
• Pressure: To 15 bar
• Temperature: To 50°C
• Viscosities: To 100,000 cps Applications
Mining, Thickener Underflow, Pulp and Paper, Filter Press, Brewery, Water Treatment, Quarry, Grout, Concrete, Waste Liquids
ALBIN Peristaltic / Hose Pumps
LOWARA Single & Multistage Centrifugal Pumps
• Capacity: To 187m³/hr
• Pressure: To 15 bar
• Temperature: To 150°C
• Viscosities: To 500,000 cps
Applications
Pressure Boosting, Industrial Washing, Water Supply, Water Conditioning, Demineralised Water, Glycol, Boiler Feed, Multi-pump, Pressure Sprinkler Systems
Figure 6. The sludge blanket detector in position in the clarifier.
BIOSOLIDS MANAGEMENT ON LORD HOWE ISLAND
Lord Howe Island is situated approximately 650 km east of Port Macquarie. e island is just 11km long, averaging about 2km wide, with the peak of Mt Gower at the southern end rising to 880m.
e Lord Howe Island Board has embarked on a series of initiatives to protect the unique island environment. ese include an island-wide residents’ clean-up campaign, introduction of solar power to reduce the reliance on fossil-fuel burning diesel generators. ere are also programmes to eradicate entire species of foreign weeds and pests.
e ultimate aim is to be totally free of introduced species which were originally brought to the island more than 100 years ago. Once this is done, species that are currently extinct in the wild can be reintroduced. e Lord Howe Stick Insect is a good example (Figure 1). ought to be extinct by 1920, it was rediscovered in 2001 on Balls Pyramid, a spectacular 562m sea stack situated approximately 35 km SE of Lord Howe Island.
e program has also included an upgrade of the sewerage management system. ere are about 220 septic tank systems on the island, 25 of which are commercial operations. In the past, sludge from the tanks was collected periodically and spread on drying beds to dewater. e process smelt bad, involved much handling, and could take extended periods to complete, particularly if the weather changed.
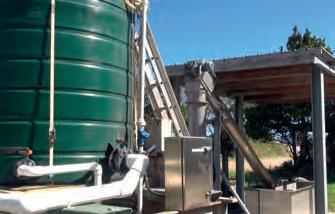
A new solid liquid separation system has been installed. Sludge from septic tank pump-outs is delivered to the new waste treatment facility via an 1,800 litre wastewater tanker. e sewage is rst screened through both coarse and ne screens and then pumped to a polymer dosing tank (Figure 2). An Excel spreadsheet was developed to help set the polymer dose and to predict the amount of liquid and biosolids that will be produced. ese predictions allow for better planning for reuse of the nal products.
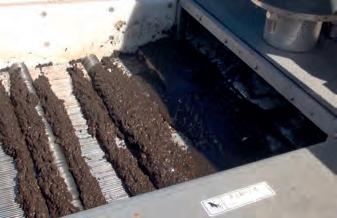
e solids are then separated from the liquid and dewatered using a KDS system (Figure 3).
Bradley Josephs and Peter Bambridge
Figure 1. The Lord Howe Island stick insect or tree lobster.
Figure 2. Septic tank waste is screened (right) and then pumped to the polymer dosage tank (left).
Figure 3. Solids separation on the KDS roller system (left).
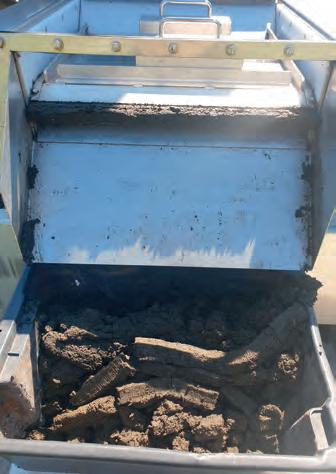
e dewatered solids are then compacted (Figure 4).
e product at this stage is drier, more compact and easier to convert to a valuable reuse product compared to the heavy, sloppy and smelly product produced in the past which was di cult to handle and dispose of in the composting system. e old system required the solids to be dug out of the evaporating bays, resulting in greater man hours and far-from-optimum working conditions. e drying bays produced a powerful odour during processing. e new system occupies a smaller footprint and produces minimal odour during the process.
Drying used to be something of a guessing game, with the drying beds and reed beds used. It would vary with the weather and humidity. e new system is swift and predictable. is speeds up the overall process and reduces problems associated with waste storage.
e drier biosolids are stored in small 50L tubs which are far more manageable. ey are mixed with other waste streams from the island and co composted using a Hot Rot composter. Waste treated in this way includes food waste, paper and cardboard, green waste and grease trap wastes. e biosolids are currently mixed with food waste, paper and wood chip green waste at a ratio of 0.05/1/2/1. e ratios are still being optimised for best product output. Small amounts of grease trap wastes are also added at this stage. e in-vessel composter produces the ner, dried output (Figure 5).
e Lord Howe Island Board is currently working towards a Resource Recovery Exemption to allow the compost to be used by residents and businesses on the island.
e liquid waste stream is treated aerobically in a Rotating Biological Contactor (RBC). e nal e uent is used to irrigate native vegetation on the island.
e Authors
Bradley Josephs is the Lord Howe Waste Management Facility Supervisor and Peter Bambridge (info@cstwastewater. com) is Sales Manager, CST Wastewater Solutions.
Figure 4. The dewatered compacted product.
Figure 5. The final solids product.
NEW SCREENS AT CRYSTAL CASCADES INTAKE
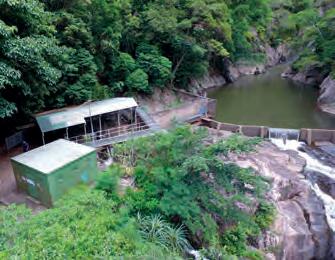
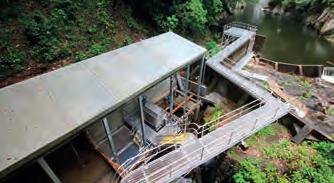
e Crystal Cascades intake on Freshwater Creek (Figure 1) is the primary raw water source for Cairns Regional Council. e intake captures a portion of the releases from Copperlode Falls Dam which is then supplied by gravity to the Freshwater Creek Water Treatment Plant (WTP). Depending on the time of the year, this intake provides 70-100% of the water for Cairns. e intake was constructed approximately 50 years ago and Council recently completed the rst major upgrade since construction. is project was particularly challenging due to the nature of the site and the need to minimise disruption to the supply of raw water to the WTP.
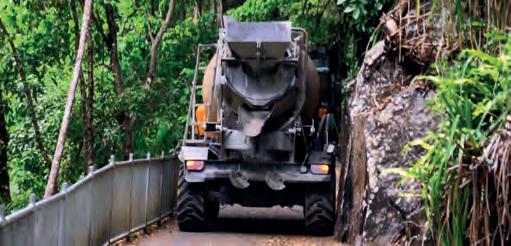
Operational access to the intake is via a narrow concrete road with extremely steep grades and is suitable for low range four wheel drive vehicles only (Figure 2). e access track is blocked regularly during the wet season due to rockfalls and landslides. It is inaccessible to most conventional construction plant and equipment.
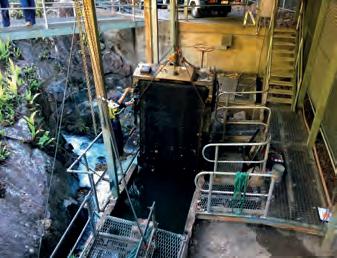
e intake is a typical open channel o stream water intake. Debris present in the raw water is removed by a primary trash rack and mechanical belt screen (Figure 3).
is upgrade project commenced in 2014 with a feasibility study to investigate whether passive Coanda screening technology could be implemented at the intake in order to reduce the need for regular site attendance and therefore
reduce the Workplace Health and Safety (WHS) risk to operational sta . Coanda screens are self-cleaning. ey consist of wedge wire welded to steel support rods. e wedge wire is arranged so that the narrow opening faces the ow.
John Bishop
Figure 1. Crystal Cascades raw water intake prior to the upgrade.
Figure 2. A four wheel drive concrete truck navigating the narrow access track.
Particles are screened at these openings but cannot get stuck as the opening in fact gets wider as it goes through the screen. e screens are sloped so that some water goes through the screen, while the remainder of the ow occurs across the surface and cleans the ltered debris.
Cairns Regional Council has good experience with Coanda screening in use at 7 other raw water intakes.
Due to the constraints presented by the site, and its location within world heritage rainforest, the design process, from concept level to detailed design was extremely challenging. Several design consultants and project managers were involved over a 5 year period.
e most logical design to incorporate a Coanda screen involved installation of the screens on the downstream side of the existing weir. Due to the elevation and grade requirements in connecting to the existing raw water main, and the need to signi cantly lift the weir wall, this option was ruled out. An alternative option was to install a Coanda screen on either side of the existing screen channel. Due to complex hydraulics and risk of air entrainment into the raw water main, this option was also ruled out. Although not a Coanda screen, Council considered installation of a submerged wedge wire passive screen within the creek itself. is option was also ruled out from a construction and approvals perspective.
During the site survey and geotechnical investigations, the signi cant risk of a rock fall and the associated risk to operational sta was quanti ed. e existing battered and bruised corrugated iron roof was extremely useful in detailing the number and severity of rockfall events. e operators were also diligent in observing and collecting fallen rocks to assist with understanding the risk. Once the rock fall hazard was quanti ed and put into a WHS risk context, the signi cance and importance of the screening equipment shelter became abundantly clear. In order to be able to achieve the equipment, site refurbishment and operability goals, the most likely option to deliver a successful outcome was to retain a mechanical screen within the o stream channel protected from rock falls by a poured insitu concrete roof (Figure 4).
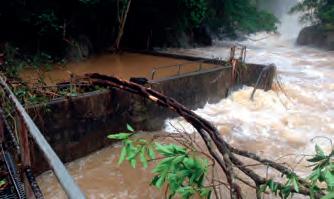
A record ood in March 2018 damaged the intake (Figure 5).
Figure 3. The original mechanical screen being removed for maintenance.
Figure 4. Construction nearing completion. Note the poured in-situ concrete roof of the screen shelter.
Figure 5. Flash flooding in Freshwater Creek.
Some key observations from that event were incorporated into the design. e water level at the intake was the highest in memory (exceeded 1% ARI or 1 in 100 yr) which resulted in a signi cant channel blockage.
Many cubic metres of sand and grit lled the screening inlet channel up to the face of the screen belt causing the screen to be electrically overloaded. e screen was unable to be restarted and the belt quickly blinded which resulted in the draining of the raw water main. Due to successive rain events leading up to the ash ood, Council’s treated water storage reservoir levels were already low. Restoring raw water supply to the WTP was critical. Initially the screen was manually raked by operators until diesel pumps could be brought up by a four wheel drive crane. Once the diesel pumps were operating, and the raw water main fully recharged, production at the WTP could recommence. A diving team was engaged to inspect the screening inlet channel and assess the condition of the screen. e diving team was also successful in uidising and pumping the sand and grit from the channel to free the screen and allow it to resume operation.
e ood event highlighted the need to be able to scour and/or isolate the screening channel. Using all this information, the nal design solution which was adopted consisted of primary trash rack and bypass, new inlet penstock, Huber Escamax mechanical screen, screen channel draining penstock, bre optic communication upgrade, additional instrumentation and CCTV.
In January of 2020, the construction phase of the project commenced. Council speci ed that the maximum allowable outage for the supply of raw water was 36 hours, so a high level of collaboration between the contractor and operational sta was critical.
e rst two shutdowns involved the installation of 900 mm diameter butter y valves. One was installed at the primary trash rack using a co er dam approach and the other installed in order to isolate the mechanical screening channel from the raw water main.
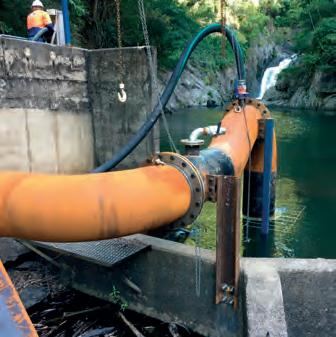
In order to keep the intake operational during the works on the intake channel, a 600 mm diameter siphon was installed from the pond immediately upstream of the primary trash rack to the raw water main downstream of the mechanical screen channel. e original screening channel outlet gate valve was modi ed in situ to allow connection of the siphon to the raw water main. e siphon pipework was primed using two diesel pumps and the air evacuated via vacuum pump. It was a tense moment when the siphon to the raw water main was nally opened. e siphon successfully delivered 700L/s to the WTP for a period of 12 weeks allowing su cient time for refurbishment and improvement works from the trash rack to the screening channel.
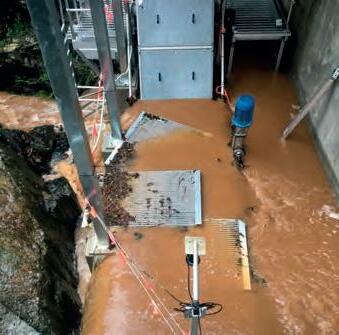
December 2020 saw completion of most of the construction and commissioning elements on site. In early January 2021, the newly upgraded intake
saw its rst ood event. e recently installed CCTV allowed operators to remotely detect an issue with platforms becoming loose and falling into the screen channel (Figure 7). e new inlet and screen channel drain penstocks made isolating the screen channel relatively simple.
Over the course of the rst wet season, a few areas where improvements could be made to the general operation and storm resilience were identi ed. ese improvements included changes to interlock the spray pump at low level to prevent loss of prime. Changes were also made to the spray pump foot valve screen and spray bar nozzle sizing. Further improvements were made to the screening channel and screen to prevent debris bypassing around the screen during ood events.
Management of the system during ood events has also highlighted the
bene t of the primary trash penstock. By throttling this penstock, we have been able to reduce ood water levels upstream of the screen to encourage subsurface ows into the screening channel. We have found that this assists in avoiding most of the oating debris. We are currently well into our wet season preparations for another year and are con dent that the newly upgraded intake will perform well.
e Author
John Bishop ( J.Bishop@cairns.qld.gov. au) is Process and Treatment Coordinator, Water and Resource Recovery, Utility Services with Cairns Regional Council in Queensland.
AWIS ASSET IDENTIFICATION
WHERE IS THAT HYDRANT OR VALVE ASSETS NEED TO BE LOCATED URGENTLY FOR: FIREFIGHTING OR URGENT SYSTEM MANAGEMENT
Fire hydrants exist to protect life and property from the perils of fire. Valves are needed in emergency situations to manage the system and to prevent serious water damage.
AWIS HAVE BEEN WORKING WITH THE FIRE DEPARTMENTS AND WATER BOARDS TO DEVELOP THIS SYSTEM
Preform Triangles that point to the hydrants or valves are coloured to identify the valves and allow them to be located quickly and easily and allow the Fire and Water personnel to operate the correct fitting.
As AWIS is the manufacturer we can tailor the system to suit your needs and requirements.
For more information or to discuss your needs call AWIS on 03 720 2803 or email info@awis.com.au
“We look forward to the next 85 years of supporting our customers and uplifting communities.”
Celebrating 85 years of innovation
Geoff Weaver, Managing Director
UV DISINFECTION
e informal adoption of the WSAA Health Based Targets Manual published in 2015 has focussed attention within the water industry on Log Removal Values (LRV) for pathogens, and provides credit values for the existing barriers in place in a water supply system. Where the barriers fall short, a so called LRV De cit results. e Manual provides guidance on how to make up that shortfall. e most common way is the addition of UV disinfection to existing, and new, WTPs.
Not surprisingly, this has created increased interest in UV disinfection. In fact, the recent WIOA webinar on UV disinfection had the highest number of registrations (293) of all the preceding webinars in the series.
In April 2012, WIOA hosted a full day seminar in Melbourne entitled “Operation and Validation of UV Disinfection Systems for Water, Wastewater and Recycled Water”. In comparison to the recent webinar, the workshop was attended by 62 delegates.
Scenario:
As Operations Manager for a water utility, I have responsibility for the operation of a 10 ML/d DAFF WTP, which operates intermittently with as many as 10 stop-starts per day.
Raw water is sourced from a reservoir with turbidity typically 2 to 15 NTU and True Colour 25 to 70 PtCo. ere have been two signi cant dirty water events in the past, with turbidity going to 150 NTU and colour 300 PtCo. Turbidity and colour do tend to come up after heavy rain.
ere is no UVT or DOC data. ere have been a number of manganese (Mn) events where soluble Mn has gone as high as 1.1 mg/L. ere are no problems with iron (Fe). e water is treated with alum as the sole coagulant.
ere are cattle in the catchment. Filter performance is OK, but de nitely not down to 0.1 NTU consistently. It averages, say, 0.15 to 0.25 NTU. As the operations manager, I am aware of Cryptosporidium and my concern is mainly for an additional barrier for Cryptosporidium. I am considering UV disinfection.
What additional information do I need to provide you with to allow you to provide good advice, and what system would you recommend and why?
e intention is to continue to postchlorinate to maintain a distribution system residual. I have heard about validation but don’t really know that much, however, the CEO and Board think we probably should have some sort of validation. I am prepared to wait a bit to collect some data if necessary to help ensure I get the most appropriate system.
As a follow up to that workshop, and based on questions from those attending, WIOA invited one of the presenters to respond to a particular scenario. is was published in the November 2012 edition of WaterWorks. e information provided then in 2012, seems equally relevant today, so we have decided to re publish that article here. Unfortunately, UV systems are still being speci ed with insu cient raw water quality monitoring and also failure to specify the need for inclusion of online monitoring of UV intensity and UVT.
Peter Mosse, Editor
Graham Smith from Berson/ Hanovia replies:
ank you for your enquiry. In order that we may correctly select the most suitable system for your needs, I have the following questions and comments regarding your application.
A UV disinfection system can only be correctly selected if we know the instantaneous maximum ow rate of the water to be treated. For this reason, can you please provide this ow rate? is is typically provided as litres per second, litres per minute or cubic metres (i.e. thousands of litres) per hour.
For example, if a 10 ML/d plant had a consistent ow over a 24-hour period, this would equate to an instantaneous ow of 116 L/sec or 417 m3/hr. e maximum instantaneous ow rate is important as it governs the length of time the pathogens in the water are exposed to the UV radiation that will potentially inactivate them.
It is also important that we address the issue of 10 start-stop cycles per day. is is a large number of cycles and will need to be accounted for, not only with the selection of the most appropriate UV system, but also with the control philosophy of the plant. One way of accommodating this number of cycles would be to leave the UV system lamps constantly on. is would have the following advantages:
1. Lamp life would be extended as the more frequently UV lamps are power cycled, the lower their life expectancy. is, however, needs to be traded o against the lamp life being unnecessarily
diminished when no water is owing through the UV system.
2. e UV system would always be ready to disinfect as soon as water started owing through it. If the UV system needed to be started prior to each of the 10 cycles, it would need to go through a warm-up period of approximately ve minutes prior to peak disinfection performance being reached. is would need to be accommodated by either simply leaving the water “static” within the UV system during the warm-up period (in which case there may be a risk the system will overheat), or by recirculating water through the UV system during the warm-up period.
On the other hand, some of the challenges posed by leaving the UV system constantly “on” include:
3. Higher power usage. Power is wasted during the “no ow” period of the 10 cycles.
4. Depending on the number of lamps and/or if the UV system is using low- or medium-pressure lamps, the UV lamps may overheat the water during the “no ow” period, causing the UV system to automatically shut down.
A further consideration is the nature of the ow during the disinfection cycle. If the ow rate through the UV system rises gradually to a peak and then gradually falls to a stop, we recommend that the UV system operates at full power at all times. If the UV system “ ow paces” its power to match the ow, the UV system runs the risk of being unable to keep pace with the increasing rate of ow at the start of the cycle.
As a result, it may “under-dose” as it fails to ramp the power quickly enough to accommodate the ever-increasing ow rate.
I see your water quality data refers to the true colour and turbidity of the water. While the ADWG makes reference to turbidity as a parameter to be considered when utilising UV disinfection, it is in fact the UV Transmissivity (UVT) of the water that is required to correctly size a UV system. UVT takes into account all water quality parameters (including colour, turbidity and DOC) that will a ect the performance of a UV system.
Furthermore, it is important that the minimum UVT reading is determined in order that the UV system be sized according to a “worst case” situation. As such, UVT data over a prolonged period should be gathered in order that the minimum UVT be accurately ascertained. Should you not have a UVT monitor or analyser, they can be purchased from many UV suppliers. Indeed, on-line UVT monitors can be purchased along with your UV system so that a real-time UVT feed can be supplied to the UV system controller. is will facilitate an accurate calculation of UV dose.
It is important to supply water to the UV system that has no more than 20 mg/L of suspended solids. Any more than this will lead to a phenomenon known as “shielding”, where pathogens are shielded from the UV light by the suspended solids in the water and inadequate disinfection may result. Whilst this is rarely an issue with treated potable water, particular attention should be paid to the ltration system prior to the UV. e somewhat elevated levels of manganese you have speci ed as being present in the raw water may (if not adequately removed during treatment) result in a black deposit on the quartz sleeve of the UV system. Manganese in the treated water should be maintained below 0.05 mg/L to minimise this deposition issue. Manganese deposits can reduce the intensity of UV light that escapes the quartz sleeve so an automatic sleeve wiper and UV intensity monitor should be tted to the UV system. While the wiper will keep the quartz sleeves relatively free of biological fouling, it will only have limited e ectiveness in clearing the manganese deposit from the sleeves. e UV intensity monitor will alert you to any drop-o in UV intensity, at which time the quartz sleeves should be inspected and,
if necessary, cleaned with a dilute (5–10%) citric acid solution.
If the sleeves are severely a ected, thorough cleaning may be impossible and they may need to be replaced.
Pre-validation of UV systems is something that is increasingly being called for by water authorities both in Australia and throughout the world. e most common validation approaches include the USEPA UV Disinfection Guidance Manual (USEPA UVDGM), the DVGW (German) protocol and the ÖNORM (Austrian) protocol. e USEPA guideline targets inactivation levels of Giardia, Cryptosporidium and Adenovirus 40 (“virus”) while DVGW and ÖNORM target UV intensity levels that translate to a speci c UV dose (more correctly referred to as UV uence) of 40 mJ/cm2. Generally, if your sanitary survey has assessed your catchment as being either Category 3 or 4, it is likely you will require some level of UV treatment to meet your LRV (Log Reduction Value) targets for the pathogen(s) of interest. Which validation approach is most suitable to achieve this LRV is best discussed with a water treatment professional who is wellversed in the various UV validation protocols and guidelines.
• Pipeline Pigging, Swabbing, Drying & Gauging
• Air Scouring & Disinfection of Water Mains
• Chemical Cleaning & Metal Passivation
• Cleaning of Oxygen Systems & Components MAINTENANCE SERVICES:
• Dewatering System Operation & Maintenance
• Water Supply System Operations & Maintenance
• Pump Maintenance & Sales
• Pressure Safety Valve Servicing & Sales
• Prepare & Maintain Site PSV Registers
DISTRIBUTORS FOR:
• Knapp Polly Pigs
• IPP Pig Signallers (Manual & Electronic)
• Standard Series Pig Launchers & Receivers
• Solidsvac Slurry & Solids Pumps
Measuring
Ammonia
ATP (Adenosine Triphosphate)
Bacterial DNA
BTX
Chloramine (Monochloramine)
Chlorine/Free Chlorine
Chemscan Analysers
MEASURING
Royce MXD75/BXD17
Analyser
SENSORS
MEASURING
Valmet TS Microwave
COD/BOD/TOC/DOC/SAC
Colour/Hazen
Conductivity
Dissolved Oxygen
Dry solids measurements
Hydrocarbons
Level
Manganese
Microbes
Nitrate/Nitrite
Oil/Grease in Water
Ortho-Phosphate
pH/ORP (Redox)
Sulphite
Sludge Blanket
Suspended Solids
TDS
Total Nitrogen
Total Phosphorus
Turbidity
UV Transmittance
Water Parameter Probes - Sondes
Royce Water Technologies proudly manufacture, Australian made Dissolved Oxygen Sensors, MLSS Sensors and Hydrostatic Level Sensors