WATERW RKS WATERW RKS


Editorial Committee
Peter Mosse, Editor peter.mosse@gmail.com
George Wall
george@wioa.org.au
Direct mail to WaterWorks Editor
WIOA, 24 New Dookie Road
Shepparton, Victoria 3630
WaterWorks is the technical publication of the Water Industry Operators Association of Australia (WIOA). It is published twice yearly. WIOA does not assume responsibility for opinions or statements of facts expressed by contributors or advertisers.
Advertising & Production
WIOA
24 New Dookie Road
Shepparton, Victoria 3630
Phone: (03) 5821 6744
Email: info@wioa.org.au
Web: www.wioa.org.au
Contributions Wanted
WaterWorks welcomes the submission of articles relating to any operations area associated with the water industry. Articles can include brief accounts of one-off experiences or longer articles describing detailed studies or events. Submissions may be emailed to: peter.mosse@gmail.com or info@wioa.org.au
The production and delivery of safe drinking water, and delivery of fit for purpose wastewater services requires a well-trained and competent workforce. The safety of the community relies on the trained operators being competent to operate their respective systems.
The continued delivery of quality training in water operations in many parts of Australia has now reached a precarious position. There are many related issues that have aligned to bring us to this point.
From a training perspective, the water sector is a small and very specialised market. Right now, we don’t have enough training organisations or trainers. The loss of several Registered Training Organisations (RTOs) in the last few years, along with the on-again, off-again nature of TAFE delivery of water operations training in some states has exacerbated this problem. The interpretation of the Australian Skills Quality Authority (ASQA) rules around who can and can’t be considered a subject matter expert and the currency of their experience relating to training delivery is also creating confusion. Third party access arrangements where potentially high quality trainers can work under a training organisation, whilst remaining employed in their Utility, have fallen by the wayside due to either real or perceived quality or compliance barriers by the training organisation.
Although we do have a very robust and nationally agreed set of training standards in the Units of Competence within the National Water Package (NWP), there are no current standardised training resources or a specific curriculum to allow consistent delivery of the standardised content to all operators. This includes the technical content for the training as well as the assessment materials to match up with the requirements from each NWP Unit. A new training organisation looking to enter the market either has to buy the outdated
resources produced in 2010 and update them to meet the current Package, buy resources from another RTO or develop their own resources from scratch. This is a very expensive and time consuming process, making it very difficult for a new training organisation to enter the market.
There are no mandatory agreed minimum standards for training in any State. Although operator training is mentioned in regulations in some States, there is no prescriptive and universally agreed definition of what competencies a trained operator should hold.
There is a long held view in the industry that having a Certificate III in Water Industry Operations is the benchmark. Unless the individual units that make up that Certificate III exactly match all the processes that the operator is responsible for, it does not help the operator supply safe water and wastewater services to their community. We desperately need the support of Regulators in the water, wastewater and recycled water sectors to take a stronger stance and make this minimum requirement mandatory.
The funding models for training places are managed on a state by state basis and vary substantially. In some parts of the country, operator training is considered an essential item, and funding for training is allocated to the operational budget in the same way as chemicals, power and other materials. In others, unless the training is fully funded by a grant or subsidy, it doesn’t occur. The risk to the community if this situation continues is unacceptable.
Although WIOA has been advocating for changes to address these issues for decades, only the establishment of the voluntary operator Registration Scheme has been achieved to date. In the absence of formal endorsement from Regulators, uptake of and participation in the Registration Scheme has been low.
The training issue forms part of a bigger picture threatening our profession. Staff shortages have become acute in some parts of the country. We have an aging workforce and poaching by other industries, and even within our sector is becoming commonplace. Many employers need to rethink their approaches to attraction and retention including their remuneration and operator reward structures.
It does appear that the industry is beginning to recognise the issues, with several presentations highlighting staffing and training related issues delivered at the 2022 WIOA NSW Conference. There was also a workshop to discuss these issues at Ozwater in Brisbane in May. The industry seems to be coming together with a better understanding of the issues and it is hoped that an industry led call for action and a consolidated and realistic national pathway


forward will be an output of the Ozwater workshop.
To date, the discussions about solutions to the issues seem to concentrate on State by State actions. This is understandable, however, the scale of change required can only be achieved through a nationally-driven approach.
We need to move from a provider driven, to a purchaser driven training model. There is no better time than now for the entire water sector to come together to pool resources to create a single National Training Institute. There are lots of examples where other industries have led the development of training resources, managed the curriculum and in some cases, also become the training provider.
If properly managed, this could provide a system that can ensure that all operators, regardless of their location, can receive the same content, quality of training and support that they need to continue to supply safe, reliable and fit for purpose water and wastewater services to our communities.

WIOA stages annual conferences in NSW, Victoria, Queensland and South Australia providing a forum for individuals involved in water operations to:
• Listen and learn from the experience of others through the latest “operational” technical and research based information provided in platform and poster presentations.
• View and discuss the latest advances in technical equipment, products and services with equipment manufacturers, suppliers and industry consultants.
• Update their knowledge and skills through interaction with fellow water industry employees.


Since it began, the COVID-19 pandemic has had a profound effect on the mental health of many people throughout Australia. In addition to the obvious health concerns, everyday life has changed to varying degrees all across the country. Restrictions and lockdowns, particularly impactful in Victoria and more recently New South Wales and the ACT, are now common terms.
While many people are understandably struggling, there are plenty of others who aren’t, but who wouldn’t say they were thriving either. Those in this position don’t know how to describe it. If you’re one of these people, you’re not alone.
That feeling you can’t put into words does in fact have a name. It’s called languishing.

Languishing is the feeling that you’re stuck and empty. That you’re not on top of everything but also not feeling really down. In a COVID-affected world, it’s something many people are feeling right now.
One of the key factors of languishing is that people might not notice they are experiencing it. Reaching this point is a more gradual process than, for instance, someone who is flourishing but then finds themselves experiencing depression. Where did it come from?
Languishing has recently featured quite a bit in the media lately, most notably in a New York Times article titled Feeling Blah During the Pandemic? It’s Called Languishing
by American organisational psychologist
Adam Grant. While the term languishing was actually coined by Corey Keyes in 2002, it has appeared regularly in mainstream and social media since Grant’s article.
How might it feel?
Languishing can take many different forms, and it won’t be the same for everyone. You might be less motivated or feel generally indifferent. One of the easiest ways to describe it is that when someone asks you how you are, the first thing that comes to mind is ‘meh’.
Because languishing can feel like being in limbo, you might not recognise it in yourself. You also won’t necessarily be able to tell if someone else is experiencing it. If you think someone you know may be languishing, be mindful of the following changes:
• Not enjoying activities that they usually do
• Cutting back on work
• Trouble focusing.
How do you combat it?
Staying well is about finding a balance that works for you, but there are some general principles that most people find useful. These include reducing and managing your stress levels and maintaining a healthy lifestyle.
There’s no one-size-fits-all solution. One approach is to try and find a state of ‘flow’. This simply means becoming so absorbed in a task that you lose sense of time and place. Getting ‘lost’ in an activity can help
increase creativity and productivity.
This could be painting, gardening or cooking. It might be running, cycling or playing guitar. It could be doing jigsaw puzzles or just reading a book.
However, it’s worth noting that when you’re languishing, you’re likely to struggle with motivation and focus. This is a common barrier that can make it difficult to achieve flow. It may be frustrating at first but don’t be discouraged.
Rather than waiting for motivation to strike, start small and experiment with a few different activities. This is a good way to ease in and see if any of these options helps with your mood and motivation.
Make sure to choose something you’re passionate about. It’s a lot easier to motivate yourself when you’re doing an activity or task you care about and are invested in. It’s also important to pick something that’s challenging enough that you’re stimulated, but not so difficult that you can’t complete it.
Everyone will have a different approach to finding an activity that helps them achieve flow, and that’s okay.
Coronavirus Mental Wellbeing Support Service
• 1800 512 348
• Online forums
• Chat online
Article sourced from Beyond Blue. This article and more information is available at https://tinyurl.com/ y2vep5p8

Water Corporation has always had a major logistical challenge when delivering training and assessment across Western Australia.
Trainers work with operators across the state delivering training in water, wastewater, sampling, dangerous goods and much more.
With over 65 training courses developed and delivered by our Technical Training Team, the majority of the training sessions have been face to face. However, we have been exploring other delivery methods; initially due to the difficulties associated with huge distances and the logistics of delivering state-wide training, but now driven by the limitations caused by the COVID-19 pandemic.
From a training perspective, our nationally accredited courses are divided into essential knowledge and required skills. While most skill development is provided ‘on the job’ by experienced operators, the formal component is completed by qualified trainers and assessors.
We are taking advantage of technologies by delivering knowledge via our online meeting platform with trainers and operators located either at home or in the office and depots. The greatest advantage of this is that operators across many regions have the ability to meet to discuss and learn from each other in a virtual classroom, each bringing their own unique regional perspective.
Together, the operators participate in reading the learner’s guides, viewing PowerPoint presentations, working though assessment activities and giving and receiving feedback. Completed assessments are sent via email to the trainers and questions are asked in a two-way process with feedback provided instantly.
For the practical component, we use technologies that are compatible with the operator’s device (such as Face Time or WhatsApp), and with a supporting tripod or another friendly operator, we utilise the video capabilities of these devices to observe them demonstrate tasks. The whole process is conducted in real time and we can provide
Rob Namestnik
guidance and instant feedback.
I have found that the operators are very careful when demonstrating on video, and often repeat procedures just to reinforce the importance of getting it right and meeting the expected standards. This is very important especially when taking water samples.
The use of mobile phones in real time is particularly useful during refresher assessments such as water and wastewater sampling, bore field monitoring, and chlorine operations such as chlorine container changeover.
Video or photographic evidence is easily recorded directly from the trainer’s device and can be included with the assessment documents as evidence of competence.
We have recently trialled the use of electronic glasses worn by the operator to either record their work (e.g. changing a chlorine cylinder) or used in real time with the trainer watching and providing feedback. This has great potential, and with technology constantly changing, we are always exploring their potential for large scale rollout and remote usefulness.
We have recently included some generic online training to support some courses, and though useful, tailored online training has proven invaluable as it aligns to our internal policies and standards. Working in consultation with professional instructional designers, we have developed and trialled an excellent online resource to supplement our courses ‘Introduction to Water Quality’ and ‘Chlorine Operations’.
Operators benefit from this resource as they can easily access the online version and view the slides (with audio) and answer questions at the conclusion of each section. This provides new starters with immediate knowledge of our core business whilst awaiting a face to face course.
Feedback has been excellent with comments describing the online training for ‘Introduction to Water Quality’ as meeting the requirements of operators who are unable to attend a full day of training due to operational constraints.
Responders also describe the case studies presented of how past issues were successfully handled such as the flooding event in Carnarvon as being informative and appropriate for the civil work crews.

Other feedback indicated the benefits of topics around the contamination of source water and the requirement for treatment and strict monitoring of water in our networks, plus understanding the role of regulatory bodies.
Conclusion
Over the past two COVID-19 disrupted years, and like many other organisations across Australia, we have used the opportunity to explore and test technologies and platforms to deliver quality technical training and assessment to our people across Western Australia.
When the operators need to demonstrate specific skills to the trainer (Figures 1 and 2), they usually have a buddy filming them while they perform the skill.
It not, they place the camera on an object like the tray of their vehicle. They improvise basically. If we took it to the next level, all they would need is a selfie kit available for around $10 – $20 in chain stores or online, that can clamp to an object. These typically include a ring light which would be useful for indoor filming but wouldn’t be necessary outdoors.

The Author Rob Namestnik (robert.namestnik@watercorporation.com.au) is Senior Advisor of Technical Training with Water Corporation in Western Australia


The Kelair-Blivet is a stand-alone packaged sewage treatment plant, designed to accept raw (unsettled) sewage and produce a high quality final effluent without the need for ancillary tankage or equipment.
Compact, flexible, modular system suitable for:
- Environmentally sensitive sites
- Townships and villages
- Construction and remote sites
- Areas not connected to mains

We know the importance of choosing the right equipment to match your process. With our extensive range of pumps, first class customer service and ongoing comprehensive support, Kelair Pumps are second to none when it comes to your pumping requirements.


Winnerof theBestPaperbyanOperatoratthe2022WIOANSWOperationsConference
Shawn Charlton
AlburyCity considers itself very lucky. The Hume Dam has a capacity 3,005,156 ML of water and historically, the water quality has been consistently high. As a result, raw water quality issues have been few and far between. The most notable issue has been the presence of Blue Green Algae (BGA) in the summer months.
However, this all changed on February 19th, 2021. AlburyCity began to receive customer complaints regarding black/brown water. The number of complaints steadily increased and peaked three days later on the 22nd February. The complaints were not centralised to any particular part of the city, and no link could be established between the complaints and a single reservoir, water main or pressure zone.
Complaints of this nature are uncommon in Albury, and are usually associated with a nearby mains break, or construction works. What made these complaints unusual was the high number and that they were distributed across the entire water reticulation system (Figure 1).
AlburyCity responded to these complaints by flushing selected water mains and reviewing recently analysed water quality data. The data which had been collected a month previous showed no change in any parameters, including iron and manganese. Council staff look over daily data from the water treatment plant, but manganese was not regularly measured there. Monthly chemical testing of water from the Council’s reservoirs would have included manganese, however, as this event only lasted days, monthly sampling simply was not enough to detect a problem.
Council also contacted North East Water (NEW) who provide water and sewer services to Wodonga, located on the Victorian side of the Murray River, to determine if similar observations had been noticed. The response from NEW was that they were not experiencing any notable increase in discoloured water, nor had they received any customer complaints.


Considering all of the available information at the time, AlburyCity entered into the weekend with the mind set of continuing to monitor the situation and taking action where required.
The number of complaints continued to rise throughout the weekend, peaking at 52 on Monday the 22nd of February (Figure 2).
2. Graph showing the number of customer complaints of discoloured water received by AlburyCity.
On Tuesday 23rd February, Council received a redirected email written by a contractor who at the time was working for the Murray Darling Basin Authority (MDBA). After being passed around a number of times to different organisations in Victoria, the email was finally received by AlburyCity. The email explained that due to a number of uncontrollable factors, the water being released from the Hume Dam was low in oxygen and high in dissolved metals like iron and manganese.
This explanation fit perfectly with what Albury City was experiencing. The Hume Dam operators noted on the 17th of February that Murray Crayfish Euastacus armatus were leaving the water and crawling up the riverbanks along with a notable strong sulphur smell. This was observed two days before complaints of discoloured water started.
Control measures were implemented at the Hume Dam on the 22nd February which saw dissolved iron and manganese concentrations decrease. Customer complaints in Albury similarly declined.
The timeline for this event actually stretches back considerably. In the summer of 2019/2020 large bushfires burnt in the Upper Murray catchment. As a result of these fires, and during a series of substantial rainfall events between October 2020 and early February 2021, large amounts of organic carbon and sediment were likely washed into the Murray River. Figure 3 shows rainfall figures for the period October 2020 to February 2021 for Jingellic, which is situated on the Murray River, a short distance upstream of the Hume Dam.
Figure 4 shows levels of Dissolved Organic Carbon (DOC) entering the Hume Dam for the period August 2020 to February 2021. It shows two distinct peaks, one in October 2020 and a second in February 2021.
It has been hypothesised that these high organic carbon loads increased the anaerobic respiration in the deoxygenated hypolimnion zone, which in turn led to the release of soluble iron and manganese (Figure 5).
When this water was then discharged from the Hume Dam and into the Murray River there was insufficient dissolved oxygen and/or time to convert all of the dissolved iron and manganese into an insoluble form. The remaining dissolved metals were then drawn into AlburyCity’s water network, causing the discoloured water complaints.
There are three ways in which water can be discharged from Hume Dam. Through the gates at the top, through the outlet valve and through the hydro plant outlet. Typically, unless the dam is spilling, the latter two are used. The mixture between the two varies dependant on what discharge is required for downstream users.
It is worth noting that the outlet valve sits above the hypolimnion zone with the hydro outlet below. This results in varying quality of the water being discharged, typically dependant on two variables. The ratio of water being discharged between the outlet and hydro plant and the water quality in the hypolimnion zone. During the event described here, water in the hypolimnion had significantly high concentrations of dissolved manganese and iron.
In the days, weeks, and months after the event, it became clear that it would be in AlburyCity’s best interests to forge greater relationships with the operational managers of the Hume Dam, The Murray-Darling Basin Authority (MDBA).
A working group was formed shortly after the event was largely over. The group included a number of key stakeholders including AlburyCity. The group has been actively collaborating throughout early 2022, identifying changes before any potential issues arise. Prior to this event, Hume Dam operators were making decisions on the operations of the dam without realising the impacts this could have on downstream local water authorities. The group has been meeting frequently over the last summer and early autumn when the Hume weir stratifies and is therefore a high risk period for adverse changes in water quality. All stakeholders are well represented, and our needs are clearly voiced to address arising issues in unison.
A review of the Council’s WQMS did identify areas in which monitoring could be expanded. This expansion would give the Council a more complete view of the water quality from catchment to tap. One fundamental consideration when entering into the review process was to consider all possible water quality events which could occur, not what has occurred in the past. Council did not want to fall into the trap of
complacency that having a reliable raw water source meant that raw water quality would never change.
Review
Council engaged a consultant to assess options for the short-term removal of manganese. The options identified included:
• Pre-chlorination dosed into the raw water
• Pre-chlorination dosed into DAF subnatant (oxide coated media)
• Potassium permanganate dosed into the raw water.
Pre-chlorination was selected, and a sodium hypochlorite dosing system was installed at Councils raw water pump station. This option was preferred due to its ease of operation, rapid installation time and its effectiveness in oxidising manganese. The system does have limitations such as disinfection by-product (DBP) generation and limited or no use during blue green algae blooms.
Data collected during a recent high manganese event has validated Council’s decision to install a pre-chlorination system. The event saw manganese concentration in the raw water increase rapidly to 0.3 mg/L with the majority of this being dissolved. The pre-chlorination system was activated and successfully oxidised the majority of the dissolved manganese to an insoluble form. The mixture of pre chlorine and Powdered Activated Carbon (PAC) reduced concentrations of manganese from 0.3 mg/L to around 0.04 mg/L.
In operating the system, our aim was to achieve a free chlorine residual of 1 mg/L in the raw water entering the plant. To achieve this we were dosing 3 to 4 mg/L of hypo at the raw water pump station. PAC was dosed at the plant for organic and THM adsorption but interestingly, the PAC dosage seemed to have a strong effect on manganese removal rates. The more PAC we dosed, the lower the manganese coming out of the filters.
After this most recent event and considering the performance of the pre chlorine plus PAC, Council will review
its processes and may move to a more permanent system of oxide coated media. Conclusions
For AlburyCity this event was unforeseen, and unheard of. We now recognise that this event could have been identified in the weeks before the ‘incident’ and we have learned that:
• The vigilant monitoring of localised raw water quality, and the wider catchment, is critical in ensuring safe and aesthetically pleasing drinking water.
• Local Water Utilities (LWU) should avoid the traps of assuming that the Catchment Regulators are aware of their needs, and that historically-reliable raw water sources are unable to have significant water quality events.
• Vigilance is key – “Expect the Unexpected”.
• Use the experiences that other Water Utilities have had to shape your raw water quality monitoring system. If other Utilities have had past events (like high manganese, high DOC or taste and odour issues), don’t assume that similar events won’t happen to you. Make your position and requirements clear to Catchment Regulators and foster strong relationships that have open and transparent lines of communications.
• Monitor your catchment. A good monitoring system is much more than just sampling at your offtake or reservoir. Pay attention to critical upstream indicators. There is a multitude of easily accessible, good, reliable, up to date data on government websites. A good starting point is data. water.vic.gov.au/
The Author
Shawn Charlton (ShCharlton@alburycity. nsw.gov.au) is Supervisor Water Filtration & Pumping, at Albury City Council in NSW.


• No more tangles – up to four switches in one float

• Choice of three di erent sized floats to ensure enough buoyancy for your application – ranging from clean to black water.
• Wide range of output configurations: high / low level alarm, pump control & gold plated contacts for low voltage / current applications (e.g. battery powered telemetry systems).
• Perfect for sumps, sewage, water & wastewater treatment, power stations & silo (solids) monitoring
Rugged SS switches – Ex, low current, top mount & pneumatic alternatives
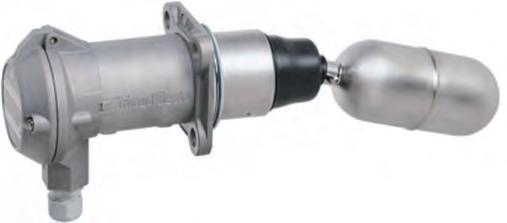

• Locally made
• +GF+ PVC and PVDF
• 316SS
• Scales and level alarms.


Level Alarm


Level Alarm

Emptying control + high level alarm
The pump is switched on when the liquid level rises to the pre-determined high point and remains on until the low level has been reached again. The switch also issues both low and high level alarms.
Wastewater from Shepparton in central Victoria is treated at the Shepparton Wastewater Management Facility (WMF) situated 8.5km north from the city centre. The wastewater received by the plant is a combination of both domestic and industrial waste, with over 80% of the average daily inflow produced by food processing centres such as SPC Ardmona and Campbell’s Soup. This unique mix of high strength industrial and domestic waste results in an organic influent loading equivalent to that which would be produced from an urban population of 1.1 million people. The actual population of the city of Shepparton itself is around 60,000.
The combined waste is treated at the Shepparton WMF in a High Rate Anaerobic Lagoon (HRAL). The lagoon is compacted clay lined and divided into two sectors, the first 1/3 is a reaction zone and the remaining 2/3 is a settling zone. Shepparton’s HRAL, the first of 17 lagoons in the wastewater treatment process, is nearly 50,000m2 in

Darren Sharman
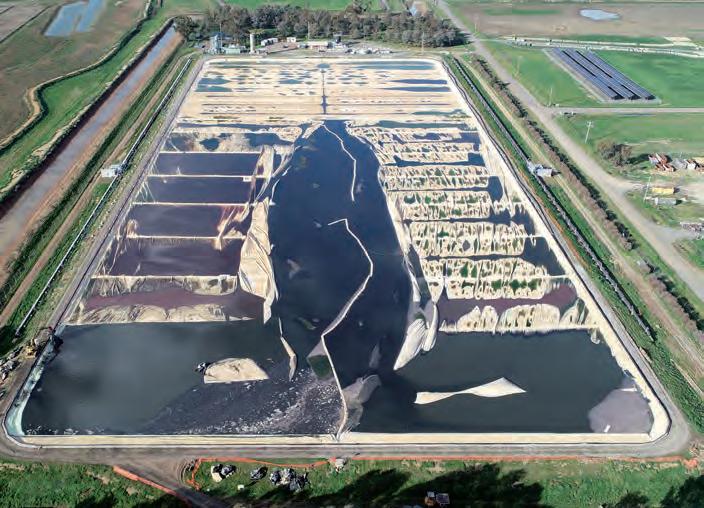
size and is covered by a large 1.14mm thick flexible geosynthetic cover, which is in place to promote ideal anaerobic conditions.
The cover also allows GVW to control odour, and enable the collection and storage of methane gas, which is either burnt off, or sold to a third party and used to generate electricity.
The cover contends with repeated pressurisation/depressurisation, UV radiation, high temperatures, contact with by-products of the treated waste and attack from wildlife such as corellas (Figure 1).
A severe windstorm in 2015 resulted in a large, 200m tear in the cover (Figure 2). These issues have contributed to the steady decline of the integrity of the cover over recent years and it was deemed to be at the end of its service life.
Investigations for the cover replacement started in 2014. This included looking at lagoon mixing, cover material and cover design options. The concrete ring beam was examined and assessed as there had
been some deterioration observed over the lagoon’s history.
Assessments were also made of the likely sludge build-up and possible options for its removal.
Project planning kicked-off in earnest in 2017, and a Design and Construct contract for cover replacement was awarded in December 2019.
The new cover is made from 2mm HDPE that was ordered in January 2020 following laboratory testing of typical material from the supplier. In July of 2020, the old cover was removed, taking 4 weeks (Figures 3 and 4).
In preparation for the works, an extensive community communications campaign was planned to inform key stakeholders of the work and possible impacts that may be expected, odour being a particularly sensitive possibility. The planning works also investigated the best way to keep treating the waste that would continue to flow to the wastewater treatment plant.

Options included by-passing the High Rate Lagoon directly into the aerated and subsequent treatment lagoons; reducing the load to the system by moderating the trade waste inflows; or the chosen option of allowing the lagoon to process the waste as per usual but without a cover and the associated biogas collection and processing step. This worked well as the lagoon biomass was very active and the organic load removal efficiency was maintained, but methane capture was compromised. Timing of the cover removal and reactor area cover replacement during the winter period ensured that most of the highly loaded trade waste (seasonal fruit processing waste) was not entering the system.
During September a new ring beam was installed and a sludge survey undertaken. Some 1,200 tonnes of sludge were removed by a floating dredge in October (Figure 5) and dried in an adjacent paddock (Figure 6). Recirculation draw-off pipework was also checked and repaired or replaced as required.
Late October 2020 saw a 12m wide works barge constructed and installed on the lagoon. The barge assembly spanned the full width of the lagoon (see Figure 8 below). By the end of October, the new cover installation had commenced and the contractor was now in the full swing of installing the cover. By mid-November, the reaction zone of the lagoon was almost covered when a windstorm, struck blowing the cover off (Figure 7).


Whilst the repairs were completed by mid-December, it would not be until the end of January 2021 that the reaction zone cover would be fully sealed and secured in place. By the end of December 2021, the reaction zone was covered, sealed and the gas flare recommissioned. Works then commenced on covering the settling zone –the remaining 2/3 of the lagoon (Figure 8). By mid-April the works barge was removed from the lagoon as the cover was almost complete and by the end of April the lagoon was fully covered (Figure 9).
Attention was then directed to the cover dewatering system. Dewatering systems for covered lagoons are typically active or passive. The passive version uses gravity to allow rainwater to drain from the cover. Due to the nature of our cover, it moves up and down depending on the biogas captured at any given time. This makes it difficult to engineer the drainage system to work under all conditions. An active system employs sumps built into the cover and mechanical pumps to remove the build-up of water. This took another 8 months to install and address all the operating issues.
Major issues encountered during the project:
• Odour. An extensive communications program was initiated to inform the people of Shepparton and surrounding districts about the project. Odour misting and frost fans were also used. The odour management program had one unexpected consequence which was that it highlighted other odour issues in the area.
• November 2020 storm, damage and delays.
• The cover material selection. This is very technical and needs the right experts. Two days were spent interviewing the selected tenderer, with most of the discussions centred on the material selection, chemistry and


warranty.
• The cover dewatering system took longer to engineer and implement than expected.
• The gas flare was not included in the project. After replacing the cover and the flare was put back into operation, the flare needed to be taken offline for a major overhaul.
A lot of lessons were learnt around design and execution of the project. For example, planning for long material lead times, assessing sludge dewatering volumes and having a matrix of options dependant on survey results, and dealing with pandemic induced site-shutdowns. A side benefit of the program has been improved Greenhouse Gas capture and management.
Overall, the project cost $9.76M, took 5 years of planning and 2 years to construct. The successful completion of the project was the result of a combined effort from GVW staff, consultants and the contractor all working together.
More information with drone videos can be found on the GVW website or by following this link Shepparton High Rate Anaerobic Lagoon Cover Removal | Goulburn Valley Water (gvwater.vic.gov.au).
The Author Darren Sharman (DarrenS@gvwater.vic. gov.au) is a District Manager with Goulburn Valley Water in Victoria.
New generation of Grundfos CR pumps
The new Grundfos CR moves the limits for multistage pumps. Energy e ciency is improved beyond all known limits and maximum working pressure on the standard pumps is increased to 40 bar. Introducing new ow sizes up to 320 m3/h, Grundfos CR opens whole new worlds of possibilities for inline vertical multistage pumps.
Find out more about Grundfos Municipal water supply applications and the new Grundfos CR. The perfect pumps for optimal water and energy e ciency.


It’s 6am on a sunny Sunday morning when City of Gold Coast officers are alerted to a large subsidence on a major highway through the bustling tourist hub of Surfers Paradise.
The emergency on-call officer, an experienced operator, assessed that this was no simple water main break, but a significant incident.
Arriving at the scene he witnessed a set of traffic lights disappear into the subsidence (Figure 1) as he was briefing his supervisor by phone.
To repair crew supervisors, the situation sounded dire, knowing the heavy flow of weekend traffic likely to be impacted as well as the urgent needs of the surrounding customers who had lost water access, in particular, a packed 250-room holiday resort.
Traffic at the scene needed to be stopped and diverted immediately from the busy north-bound Gold Coast Highway. By 7am, traffic controllers had set up an exclusion zone to manage traffic in the short-term as the City’s maintenance and construction repair crew arrived.
Traffic control and police were required at the impacted intersection, now without traffic lights. A Traffic Management Plan was a priority.
A significant unplanned event can be quite confronting for those first onsite. Our officers use a simple but practical thought tool, ‘Wait A Sec’, which reminds them to take time to assess the situation. The term ‘SEC’ prompts them for immediate considerations to stabilise the site.
SAFETY- Your safety and the safety of others around you.
ENVIRONMENT- What has happened? Is there any potential for environmental harm?
CUSTOMER- How has this activity affected our customers (no water, reduced access, noise).
Kent Weeden

With an initial evaluation of the site, and the impacts assessed, an Incident was declared activating our Incident Management Process that allows the City’s water maintenance officers ease of access to assistance from other City departments.
This includes areas such as community messaging and media management and as well, engagement of external emergency services, public transport operators and so on. This process frees up onsite officers to concentrate on their roles.
A major consideration was the location of the water main break in front of the threestorey holiday resort. That meant no water and no holding tanks for resort operations.
Officers had to cut in and install a valve in a confined space to get water back to those customers. That job was estimated to take up to four hours, so a supply of bottled water was delivered to the resort.
With ideal weather, and the lifting of COVID-19 restrictions, the resort was fully occupied. By 9am visitors were leaving their rooms to head to Gold Coast theme parks, beaches and other attractions. Controlled access was swiftly put in place to safely allow cars and buses in and out of the resort.
It was some hours before officers could fully assess the actual subsidence site, which was close to 1.5 metres deep (Figure 2).
Officers called on Dial Before You
Dig (DBYD) infrastructure mapping to locate the complex underground services impacted. These included both high and low

voltage power, and a range of other utilities services that needed to be either isolated, repaired or assessed. The traffic lights also had to be isolated and removed from the intersection as well.
The response from other utilities was excellent as the different parties worked well together.
The iAuditor phone app was invaluable in allowing officers to check and log the numerous site actions taking place simultaneously.
They were able to log and capture timelines, hold copies of DBYD and Traffic Management Plans, Safe Work Method Statements, permits and isolation approvals from other utilities.
Once the power was isolated, the concrete and bitumen was removed from the area of the subsidence. The affected area was opened to provide a clearer picture of the work required and how long it would take.
The cause of the subsidence was the roots from a large Norfolk pine tree nearby, combined with lots of rain one week and lots of wind the next week whilst the ground was soft.
Fatigue management planning was then possible, as was the continued updates for customers, the community and the media who had been regularly reporting on the break and the progress of our repairs.
While all this was happening on the Sunday, crews completed the works to install a new valve, restoring water supply to the holiday resort, the first major issue off the check list.


With the subsidence cleaned out, it became clear that there would be no bitumen back on the highway for some time, days or weeks, not just hours.
The task of rebuilding started over the next few days. The works had to be paused each night to minimise noise and disruptions to residents and visitors staying in the surrounding tourist accommodation. Our maintenance and construction crews repaired the affected water main and laid a
base for the other utility services to do their work.
The entire restoration needed two weeks to finalise, which included renewal of some associated aging infrastructure while the worksite was in operation (Figure 3).
The Author
Kent Weeden (KWEEDEN@goldcoast. qld.gov.au) is a Civil Works Supervisor with the City of Gold Coast (CoGC) in Queensland.


•Early detection of Bacterial Growth on surfaces
•Monitoring & optimisation of sanitation requirements.


Entry into media filters at Water Treatment Plants (WTPs), and inspection of the media is an essential part of ensuring ongoing supply of safe drinking water. Getting into a filter is necessary to fully assess the condition of the media, the amount of mud on the surface and possibly throughout the media, and whether the bed and support gravels have been disrupted. Each of these “failure’’ modes can contribute to poor performance of the filter and production of water which may not be safe to drink. It is also necessary to ensure and prevent expensive filter refurbishments and rebuilds and on occasion, very expensive structural repairs.
Filter entry procedures vary widely. Some are adequate. Some are totally inadequate. There is no single filter entry and inspection procedure. WTPs are different. Filters are different, and each type of filter presents different hazards and risks. Therefore, while it is possible to produce a generic procedure, it needs to be further customised for each filter type.
Most Utilities in my experience expect some sort of control for descending and ascending the access ladder into the filter and have often purchased expensive equipment to cater for this. The most common system in use is some sort of fall arrest system.
But before we even consider fall arrest, we need to consider other factors related to the use of a ladder.
Therein lies another major safety issue. The ladder itself. All too often, a heavy extension ladder is lifted and “muscled” up steps, around corners, through narrow doorways and then finally levered and lowered over a railing. All this has the potential to put substantial and unusual loads on the spine. It is not acceptable. The very act of lowering an extension ladder into a filter, too often over a rail, presents a very real hand or finger “pinch” risk, or an even worse hand injury if the parts of the ladder slide past each other uncontrollably. Ladders should be light, cut to the necessary length and maintained on the filter deck area to avoid all the carrying and lifting usually required.
Peter Mosse
In many cases, Utilities have not invested money to address the problem of actually getting past the filter railing and getting on to a ladder! Many Utilities have not provided any entry system through the railings. This leaves the only option of climbing over the railings and onto the ladder in some way, making this step by far the riskiest part of a filter entry. Even with fall arrest in place, a fall at this time could result in serious injury. Utilities must ensure there is an entry way through railings to allow safe entry. Access is most commonly through a gate cut into the railing system at a strategic point that allows easy positioning of the base of the ladder on the filter media. There can be much debate about whether the gate should open into the filter or into the walkway. There are pros and cons to each.
A very simple solution I saw at one WTP was a trombone slide type entry point (Figure 1). This worked extremely well and would be relatively cheap to install compared to some gate systems.
Filter entry paperwork requirements at some Utilities are becoming totally unrealistic and unworkable. At a site I visited recently, the paperwork required the attention of two people for about 35 – 40 minutes. Huge format pages with lots of boxes and small print. With this sort of requirement, it is not surprising that inspections are not occurring.
Another issue is the fall arrest system. Fall arrest systems seem attractive at first glance, however its implementation for filter inspections is fraught with difficulty and introduces massive complexity for what
seem to be small gains in safety.
• For gantry and winch systems, carrying and positioning the winch apparatus (and the base pedestal) introduces a very real risk of back injury (Figure 2). The apparatus is heavy, large, and awkwardly shaped. It is difficult to carry and position.
• Some systems require fixing a retractable pulley system to some point theoretically above the entry point. Offcentre fixing would lead to a pendulum swing of the worker if they slipped and fell and could result in contact of body parts with various structures in the filter. I remember one entry where the OHS manager requested he inspect the site to ensure safety. He approved the off-centre location of the fixation point high above the entry point that would have resulted in a long pendulum.
• Simply securing the fix point is often very unsafe. At one site recently, an operator had to stand at the top of a long ladder, balancing the shackle and retraction system to allow attachment to a roof purlin. This definitely wasn’t safe and presented a very real risk of falling, which in itself, using the same logic as the filter entry, would have required fall arrest!
• The winching system on gantry style fall arrest systems can be a problem. I have experienced several failures of the winching system even though the units were supposedly in test.


the complexity of entry procedures and paperwork have contributed to this situation.
Figure 3 shows one such winch failure where the winch jammed while operators were coming out of the filter. The end result was we just had to climb the vertical ladder and as you can see in the figure, a bad slip or fall would have resulted in a body very possibly hitting the corner of the launder, probably resulting in injury.
• The distance to the media is such that by the time the shock absorbing part of the harness has paid out, the operator could well have hit the launder anyway resulting in significant injury.
So, is there an alternative to the various fall arrest systems referred to above? Yes.
The use of a safety lanyard and scaffhook system is an easy to use and cheap system (Figure 4).
While using the system it is very easy to maintain 3 points of contact while shifting one clip at a time. The clips are continually moved so as they remain as much as possible high above the head.
Having now used this system several times at North East Water in Victoria, I can attest to the fact that it is the easiest and safest system compared to those I have been forced to use at many, many other WTPs. I highly recommend it for your consideration next time you carry out a filter inspection. It is worth noting that there is evidence that many Utilities have not been carrying out filter inspections and I believe
Now some readers may instantly raise the question of recovery of an incapacitated operator in a filter. The lanyard and scaffhook system does not facilitate recovery.
Let’s think about this requirement. In the worst case, some Utilities expect the operator to remain attached to the fall arrest system for the whole time they are in the filter to facilitate recovery. This is totally impractical. With an entry point toward one end of a filter or even in the middle of one of the sides, the operator will have to pass under several launders. If incapacitated at one of the far reaches in the filter, the concept is that the operator be reeled in like a doomed fish. I know for one that I DO NOT want to be reeled in, under 2 or 3 launders and then winched up, dangling like a bag of potatoes and then somehow man handled onto the walkway. And then what?

We are not trained in recovery techniques, but only really in first aid. One of the key principles of first aid is to not move the patient unnecessarily. If the filter has been well isolated, there is no risk of engulfment, low oxygen environment or presence of dangerous gases. First aid should be administered at the site. The most likely scenario is a heart attack. It is hard to imagine much else. And in that case, the most appropriate action would be use of an AED in the filter followed by calling an ambulance. But how many WTP teams have an AED available during inspections?
This whole question of what is done in the case of an incapacitated worker in a filter needs to be addressed and carefully considered. We are not the best to carry out a rushed retrieval. Others such as SES and ambulance, are better trained and equipped. They should be consulted while filter entry procedures are considered more fully and recovery options fully evaluated.
To minimise the need for recovery from a filter, operators with known health problems, in particular heart problems, dizziness or fear of small spaces should disqualify themselves from participating in filter inspections.
So, carefully analyse your filter entry procedures to see whether they are practicable, sensible and in fact are not the reason why filter inspections are just not being carried out.
Give the lanyard system a try. It just makes it so easy and safe. And don’t forget to install gates or slides in the filter railing for all your filters.
The Author
Peter Mosse (peter.mosse@gmail) manages Hydrological P/L. A small specialist company offering technical support in water treatment and distribution system management.


The Morwell Waste Water Treatment Plant is an activated sludge plant with two treatment streams consisting of two activated sludge reactors connected to two secondary clarifiers running in parallel (Figure 1). The secondary clarifiers serve as the last treatment process before the treatment stream combines prior to UV disinfection.
One of the main operational challenges at the plant is the routine cleaning of solids built up on the ‘V’ notch weirs (Figure 2) and in the outlet channel. Depending on the amount of build-up, the cleaning required could range from a hose down with potable water, to entering the outlet channel and manually scrubbing it out.

A pressure wash is conducted several times a year to increase the time in-between cleans and to reduce the need for a manual clean. Even the hose down takes a couple of hours to complete, cleaning both clarifiers, cleaning brushes and filter baskets. During the cleaning, the effluent from the reactors needs to be bypassed to the storage lagoons for a couple of hours. Manual handling strains to some operators are a constant occurrence and the time required to complete the cleaning process takes the operator away from other valuable plant operations.
Scott Kitwood

During low seasonal flow, the weir overflow rate can be as little as <2L/s in a clarifier with a circumference of about 51 metres. This low flow allows any suspended solids to build up in the grooves of the concrete and provide an environment for algae to grow easily. If the regular site operator is on leave, the cleaning process might not be completed as often as required due to the relief operator managing more than one site.
Historically, brushes were mounted to the scraper bridge to clean the top and side walls, with a brush mounted sled being dragged in the outlet channel. This method was never truly effective due to
the imperfections in the concrete, and at times the cleaning system itself caused other problems. If there was a surge in flow during a wet weather event, the sled would sometimes get stuck in the outlet of the clarifier, ‘fault out’ the scraper causing it to stop working and require a call out.
The solids build-up on the weirs and outlet channel, as well as looking unpleasant, would eventually slough off in large clumps and block the clarifier outlet filter basket (Figure 3). These large clumps could also be carried through to the UV disinfection system and reduce the effectiveness of the disinfection process.

Several changes were made to the brush system to make it more effective and reliable but with limited success. Although the improved brushes and adjustments cleaned the walls better, this just increased the brush wear and cleaning requirements for the brushes, and therefore didn’t really make much of an overall improvement.
A concept was developed to fabricate a spray system, which like the brushes would be mounted on the scraper arm, and clean the walls and V notch weir as it rotated around the clarifier. Unfortunately there were a few electrical limitations, the power supply cabling to the clarifier bridge was a smaller gauge than expected, reducing the size of the pump we could use. And the board wasn’t setup for 240V, so a 1.5kVA 415/240v transformer had to be installed on each bridge to allow us to run a variety of pump options.
A pump was installed to draw the supernatant from the surface of the clarifier which would otherwise just be going over the weir anyway.
The pump is mounted under the walkway of the clarifier scraper bridge. This allows for all the pipework and cables to be run out of the way whilst still allowing access to the spray system while the scraper bridge is still running. The hose from the pump to the spray manifold has a camlock fitting and all sections of the manifold are screw fit allowing for easy removal for cleaning or maintenance. An inline filter (Figure 4)

prevents any solids picked up by the pump from blocking the spray nozzles and can easily be accessed for cleaning.
The spray system has been set up on an individual circuit breaker with a builtin timer. This allows for the system to be turned off separately from the scraper, and also allows for the operator to select on and off times to optimise and reducing power usage when not required. All items are off the shelf and can easily be replaced for same day repair.
With the spray system up and running (Figure 5), cleaning by the operator is almost no longer required. Routine visual inspections are carried out daily, and the filter is checked and cleaned twice a week.

There are many advantages with the new system.
• Time spent cleaning has been reduced from 3 to 5 hours down to just 20 minutes per week. With more time spared for other plant related tasks and less manual strain on the operator, the reduction in operator hours for cleaning alone has covered the full cost of the project, approximately $5000 in less than one year.
• There is no longer any need to bypass effluent. This equates to around 300kL a week that is no longer sent to the storage lagoons. This volume would have needed to be returned to the
plant for processing over about one week. With the reduction in flow to the storage lagoons, the yearly lagoon pump energy consumption and run hours have dropped by 39%.
• Chemical usage (caustic soda, ferric sulfate) has been reduced by a combined average of around 100L per week over the year
• The volume of potable water used for cleaning has also been reduced by around 150kL a year.
• The UV system has also benefitted from the improved cleaning. The system itself needs cleaning less frequently. The time required to drain and clean the UV tank has reduced by 50%. Large clumps no longer block the drain lines, and build up on the UV sleeves has reduced, requiring less water to clean. As less abrasive techniques are required for cleaning the UV sleeves, the risk to damaging the sleeves, or the lamps inside is also reduced. Morwell’s UV system requires custom built lamps and sleeves which take time to make, so a crack in a sleeve could cost $1200 just in parts to repair.
• There has also been an increase in the UV transmissivity of the effluent passing to the UV system which means better disinfection and generally higher quality effluent.
• The specialised final effluent instruments are easier to clean, and are more accurate with small samples line blockages reduced.
It’s a great peace of mind knowing that a small change has made such a large impact on the operation of the plant. From an environmental perspective, this minimises risk to Morwell Wetlands and Morwell River which the plant discharges into.
Work is continuing on the spray system to modify the spray manifold to allow for a better coverage and ease of cleaning
The
Author Scott Kitwood (Scott.Kitwood@ gippswater.com.au) is a Waste Water Treatment Technician with Gippsland Water in Victoria.


Measurementof UVabsorptionat 254nmfor monitoringof organic contamination. IdealforUVT measurement. Insensitiveto fouling.


Contact-free turbidity measurement. Noconsumables andnofollow-up costs. Automatic measurement chamberflushing. Fastandeasy verification.

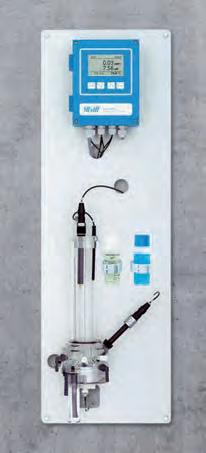


Easy-to-use amperometric measurementfor thecontrolof disinfection concentrations. Reagent-free withlow operatingcosts. Low maintenance.


Differentiated photometric determinationof chlorine. Continuous analysis. Freelyadjustable measuring intervals. Fastandeasy verification.


Measuringof specific conductivity, TDSorsalinity. Insensitiveto fouling. Easycalibration Measurementof salinityasNaCl.


For more information please download our potablewater flyer through the QR codeor to discuss your requirements in more detail get in touch with our expert team: +61294821455 sales@swan-analytical.com.au


NagalingamThayalakumaranandDavidSheehan
The Bridgewater-Inglewood water supply system supplies the towns of Bridgewater and Inglewood, in north central Victoria, with drinking water produced at the Bridgewater Water Treatment Plant (WTP).
The WTP consists of the following unit treatment processes:
• Powdered activated carbon
• Coagulation, using Ultrion as the coagulant
• Clarification
• Dual media filtration
• Reverse osmosis (which was discontinued as a treatment step in December 2019)
• Granular activated carbon
• Post pH correction through the addition of caustic soda
• UV disinfection
Primary disinfection occurs through chlorination to achieve a minimum C.t of 15 min.mg/L, thereby meeting the HealthBased Target (HBT) for microbiological water quality. The disinfected water is then chloraminated prior to supply into the distribution system.
In chloraminated systems, monochloramine concentrations need to be high in order to control biofilm growth (minimum value of 2 mg/L) and to reduce the risk of nitrification (minimum value of 0.5 mg/L), as well as to manage specific pathogens of concern (for example, 0.5 mg/L minimum to control Naegleria fowleri).
Coliban Water has set an operational target of 0.5 mg/L Total Chlorine at the customer tap. To maintain residual chlorine at customer taps, chlorine tablet dosing and changes in source water were implemented in December 2010 and December 2019, respectively. In this paper we discuss the improvements in residual chlorine in the distribution system due to these changes.
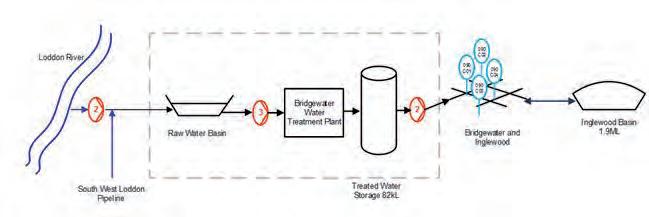
The Bridgewater-Inglewood water distribution system consists of two storages and a long interconnecting pipe. The chloraminated water in the Treated Water Storage (TWS) at the Bridgewater WTP is pumped into the Bridgewater and Inglewood distribution system, via a 225mm uPVC main, while the Inglewood Basin (1.9ML capacity) is being filled. When the Inglewood Basin is full, the system is back-fed from the basin. The basin is located 2km north of the town. The two towns are separated by about 7km. Figure 1 shows a diagrammatic representation of the supply system.
Given that the Inglewood Basin is located at the far end of the distribution system and it has a relatively large storage volume, maintaining an adequate disinfectant residual in the basin has been a challenge for Coliban Water.
To help maintain a disinfectant residual throughout the extensive distribution system, chloramination was added after
initial primary disinfection using free chlorine. However, maintaining an adequate residual, particularly at the Inglewood Basin, was an ongoing issue, especially when the raw water was sourced from the Loddon River (Figure 1). The result was low disinfectant residual at times, most notably when the water was being back-fed from the Inglewood Basin. The low residual was considered a possible risk to public health due to potential secondary microbial contamination.
To increase the chlorine residual, calcium hypochlorite tablets were dosed into the inlet of the Inglewood Basin. However, this strategy had limited success due to the following reasons.
1. Inability to achieve breakpoint chlorination.
2. Difficulty in controlling the dose. The dosing system consisted of chlorine tablets placed in canisters where the treated water was pumped from the TWS, located at the plant, to the Basin.
3. Decay of chlorine in the basin as chlorine was dosed only when the Basin was filling.
One possibility to improve the poor disinfectant residuals in the distribution system was to change the source water. The Bridgewater-Inglewood system can source water from either the Loddon River or the South-West Loddon pipeline. The South-West Loddon pipeline predominantly supplies water from the Waranga Western Channel (connected to the Waranga Basin) or the Wimmera Mallee Pipeline.
The change of source water was made in December 2019.
Table 1 shows the characteristics of source water from the Loddon River and Waranga Channel. Note that the hardness, alkalinity, bromide, electrical conductivity and Total Organic Carbon (TOC) of the Waranga Channel are lower than that of the Loddon River.


The higher concentration of TOC in the Loddon River reflects the higher concentration of Natural Organic Matter (NOM) in the water. The presence of a higher concentration of NOM also increases chlorine decay. As a consequence of changing the source, the TOC in the raw water entering the Bridgewater WTP reduced 2 to 3-fold (Figure 2).
Chlorine decay in the distribution system depends on the water age, temperature, bromide (chlorine reacts with bromide to form bromate) and TOC concentrations. As Waranga Channel water has a lower concentration of bromide and TOC, the risk of low chlorine residual occurring in the distribution system was considered to be lower.
The concentration of TOC in the treated water at the Bridgewater WTP has consistently been below 6.0mg/L since the change of the raw water source to the Waranga Channel (Figure 3). Prior to the change, TOC in the treated water was occasionally above 6.0 mg/L, mostly due to high levels of NOM in the Loddon River water, which coincided with times when the RO plant was not in operation.
Figure 4 shows the total chlorine concentration in the Inglewood Basin over time. Prior to the source water change in December 2019, achieving the target concentration of total chlorine above 0.5 mg/L was not always possible. This was mainly due to the limited success in improving the disinfectant residual by dosing chlorine tablets at the Inglewood Basin.

Total chlorine was maintained between 1.5 mg/L and 2.5 mg/L in the treated water at the plant. As a result, the target of 0.5 mg/L total chlorine at the Inglewood Basin was able to be maintained (Figure 4), thereby helping to prevent nitrification and biofilm formation in the trunk main, the basin and the distribution systems in the supplied towns.
As a result, chlorine tablet dosing into the basin was stopped in April 2020.
Figure 5 shows the total chlorine measured at Bridgewater and Inglewood customer taps. The samples were taken and tested weekly in either Bridgewater or Inglewood. The total chlorine results have been consistently above 0.5 mg/L since April 2020. Note that the fluctuation between high and low total chlorine results was mainly due to samples being either taken when the treated water was pumping from the TWS at the plant into the distribution system, or when it was being back-fed from the Inglewood Basin.


The change in source water has had a dramatic effect on the stability of operation of the water supply to these two linked small towns in central Victoria.
The Author
Nagalingam Thayalakumaran (kumaran.Nagalingam@coliban. com.au) is a Process Operations Engineer and David Sheehan is the Senior Water Quality and Regulatory Advisor, both with Coliban Water in central Victoria.


Innovative sludge aeration technology that cleans water and wastewater in ponds, lakes and lagoons, while lowering energy costs by up to 80%.
FEATURES
Only 3 kW at maximum energy used
Moves 37,000m3 of water every day
No propellers or shafts to foul
No belts or gearboxes to break or require maintenance
No metal frame, so no corrosion
Made from recycled HDPE
The addition of up to 3.0 kg/O2 per hour
4 x Kuh Kai Aerators move and mix water through the Lagoon Aerator
BENEFITS


Continuously moves the lagoon or pond water via vertical mixing, for complete destratification, algae bloom reduction, and natural sludge digestion
Delivers more dissolved oxygen to the water per hour
Lowers energy costs by up to 80%
Practically maintenance free for years
Eliminates trapped nitrogen and ammonia gases, and improves BOD/COD counts
Optimise your site to reduce energy consumption and improve your water quality
