Bighorn Sheep Analysis
March 2023
 Dr. Aaron Facka - Senior Wildlife Biologist, Western Region
Bighorn sheep. Photo: Docmigues
Slope or terrain ruggedness is important for sheep to observe and escape predators
This slide depicts highest slopes in the northern Peloncillos (blue colors) and flat terrain as brown

2
Slope overlaid with location data from bighorn sheep rams (green dots) provided by the Arizona Department of Game and Fish
Sheep were tracked from 2017-2020

3
Selection of Slope
Slope (degrees)
Plots of resource selection functions showing how sheep used slope, aspect and the land cover types.
Negative values indicate avoidance while positive numbers show greater selectivity.
Slope and land cover seemed valuable to include in further models. Aspect was not.
-0.6 -0.5 -0.4 -0.3 -0.2 -0.1 0 0.1 0.2 0.3 0.4 0 51015 20253035404550556065 Selection Function
-0.5 -0.4 -0.3 -0.2 -0.1 0 0.1 0.2 0.3 0.4 0.5 04590 135 180 225 270 315 360 Aspect -0.4 -0.3 -0.2 -0.1 0 0.1 0.2 0.3 0.4 5652 659559 11219 10518805784349320335551996159245 Selection Function Land Cover Type 4
Using the relationships shows in previous slide, I created a habitat suitability index based on landcover and slope.

Both layers was parameterized such that the highest habitat suitability was a 1 whereas the lowest a 0. intermediary values ranged between these 2 end points.
I then used a harmonic mean to calculate the final suitability index which also ranged from 0 to 1.
5

6
Habitat Model Fit
Predicted Habitat Quality
This is the validation of the model to what sheep actually used. In general, the model shows high selection by sheep where we predict the best habitat and avoidance in bad habitat.

7
-0.5 -0.4 -0.3 -0.2 -0.1 0 0.1 0.2 0.3 0.4 0.5 0 0.5 0.60.6666670.8571431 Resource Selection
R² = 0.8035
Projecting the model across the region
Relatively little habitat in northern Peloncillos south of I10
Approximate Distribution of population

8
A slightly different parametrization of the slope and land cover provided a resistance to movement layer. Black and purples show low resistance (easy movement) where orange and yellow indicate high resistance to movement

9

10
Resistance map showing I10 (the yellow line) and the northern Peloncillo region
Resistance map for a larger section of the region and with connection points selected based on locations from iNaturalist. The red line is an optimized least cost path across all connection points.
Note I10 near the middle of the figure.

11
Least Cost Path follows actual sheep points closely

12
I created 4 scenarios of sheep starting North of I10 and moving south of I10.

3 of 4 converged on the same location.
The final (white line) I tried to influence to choose a different path by placing them closer to I10 and further west of the other ‘crossing point’.
13
A closer view of the 4 different predicted paths. Note differences in how sheep might move to connect to better areas across more resistant regions depending on the starting points. These lines could be monitored to evaluate sheep movement and to validate the model in general.

14
Predicted paths overlaid on satellite imagery and with the camera locations from our study.
Red circles show the 2 cameras where sheep were detected or likely detected. The furthest west camera also detected a mountain lion.
Additional analyses of the camera data will evaluate relative activity of other species along these ‘routes’.

15
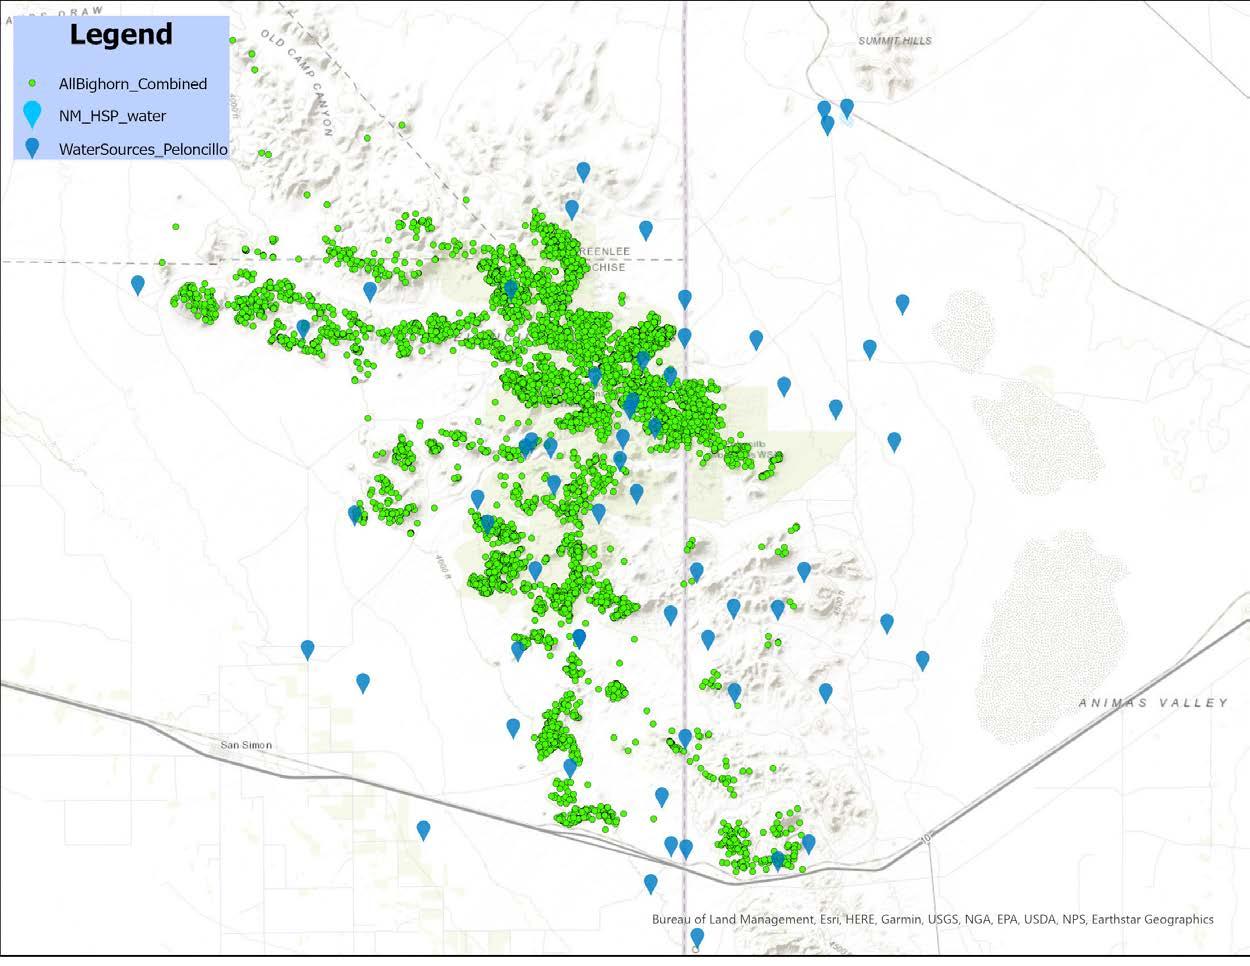
All sheep locations (green dots) with all identified potential water sources in the areas.

We cannot know which water source actually produced or held water during this period.
Some water sources are springs which should continue to have water.
Not show, but this portion of the mountains seems to have more water than the portion between I10 and Granite Gap.
16
2 of the water sources with
The green highest and site with most visits is in the mountains but is exact type is unknown.
In general, no evidence that sheep are selecting water sources
13% of water sources are used more than expected Slope HSI Value (underused water) = 0.26
Slope HIS Value (overused water) = 0.34
Slight evidence that water sources in steep terrain is used more by sheep.
Number Visits by sheepRandAvg*Delta_UseSig_DeltaHSI_valsSlope_HSI 12.175 -1.175Sig0.60.02 12.175 -1.175Sig0.6680.22 22.175 -0.175000.003 15 2.175 12 825 Sig 0.735 0.23 12.175 -1.175Sig0.50.03 22.175 -0.17500.730.46 42.1751.825Sig0.60.12 12.175 -1.175Sig0.730.43 12.175 -1.175Sig0.830.13 12.175 -1.175Sig0.710.31 22.175 -0.17500.780.66 42.1751.82500.6990.36 11 2.175 8.825 Sig 0.77 0.36 11 2.175 8.825 Sig 0.71 0.66 32.1750.825Sig0.70.36 USE STATISTICS BY WATER SOURCE Percent visited by sheep 33% 80.00%significantly less use than random 13.33%significantly more use than random Percent if random use 88% 6.67%no different from random 86.67%less or equal to random 17
spring (blue
the highest visits are
highlight)
*Number of visits to water expected if sheepbehaved randomly
Green circles show water sources with high sheep visits.

Red show those with lower than expected visits
Sites with 0 visits are shown only blue pins and no circle.
18


info@wildlandsnetwork.org wildlandsnetwork.org
 Dr. Aaron Facka - Senior Wildlife Biologist, Western Region
Bighorn sheep. Photo: Docmigues


