MESSAGE FROM THE GENERAL MANAGER
Dear valued Western Water customer,
I am proud to present to you Western Municipal Water District’s (Western Water) annual water quality report for 2022. As part of our commitment to transparency, it is important to provide our customers with information about your drinking water quality.
This report, also known as the Consumer Confidence Report, shows that Western Water continued to deliver safe and reliable drinking water throughout 2022. The report is required by the California State Water Resources Control Board and provides detailed information about the sources and quality of the water served to our community.
The report also shows that Western Water meets all the strict drinking water quality standards set by the United States Environmental Protection Agency and the State Water Board, Division of Drinking Water. Our commitment to this exceptional service is aligned with Western Water’s 2022-2025 Strategic Plan, which outlines four key priorities for the agency. These priorities include effective resource management, sustainable financial stewardship, fostering an elite workforce, and providing superior service. Western Water’s diverse water portfolio and resource management help bridge the gap during dry years, and we have been partnering with local agencies to secure more reliable and affordable water supply sources.
Western Water is committed to ensuring the safety and quality of the drinking water delivered to homes, businesses, and schools in our service area. Rigorous monitoring and testing of the water is conducted from over 148 locations within the distribution system, performing over 41,000 tests to monitor for contaminants and impurities.
Western Water is actively involved in Sacramento, leading a coalition of water agencies to make water reliability a top statewide priority with investments capable of meeting needs of all Californians and the environment. We are working to revolutionize water management in California by shifting the focus away from scarcity and towards achieving water supply targets that can adequately meet the needs of our communities, agriculture, and the environment. By prioritizing this proactive approach, we are committed to ensuring that California has a sustainable and ample water supply for the benefit of all. To learn more, visit CAWaterForAll.com.
Customers are encouraged to read this report as it outlines important details about your water and the many customer support programs we offer.
Guidelines set by the State Water Board for distributing this report allow for electronic delivery of the report instead of a paper copy delivered through the United States Postal Service. By providing these reports electronically, Western Water can reduce costs and eliminate paper waste associated with printing and mailing the full report to our more than 25,000 accounts.
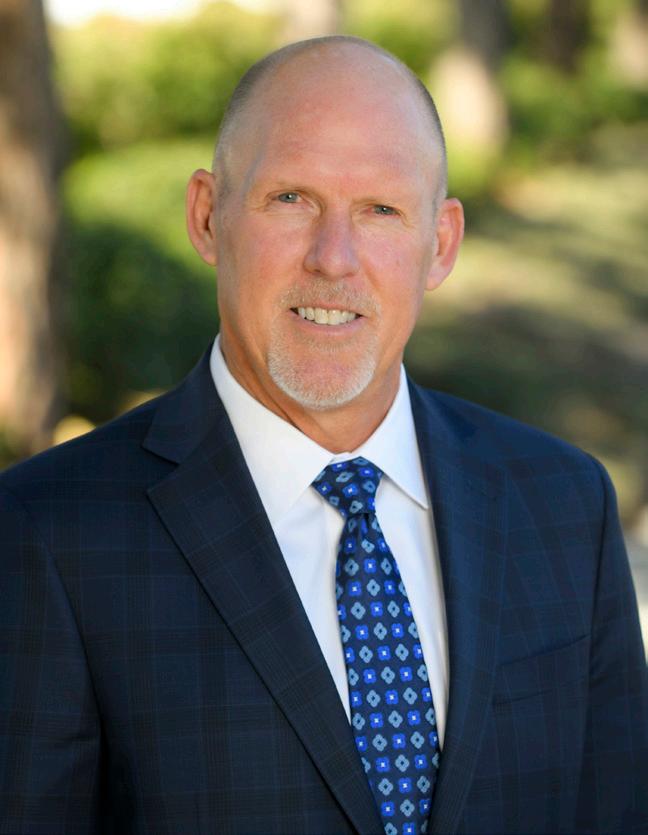
Craig Miller GENERAL MANAGER
Please note that you may change your delivery preference at any time. Western Water is happy to mail you a paper copy of this report upon request.
To request a paper copy of this report you can do so by calling us at 951.571.7119 or via email to outreach@wmwd.com.
3 2022 Annual Water Quality Report
Western Water provides water supply, water supply, recycled water services, and water resource management to the public in a safe, reliable, environmentally sensitive and financially responsible manner.
OUR VISION
To enhance Western Water’s leadership role by integrating the best-in-business processes and business systems while developing a leading-edge workforce that continuously creates greater efficiency and value for our customers.
WE GUARANTEE THE QUALITY AND RELIABILITY OF YOUR DRINKING WATER
Since 1954, Western Water has been dedicated to providing essential water, wastewater (sewer), and recycled water services to nearly 1 million individuals residing in western Riverside County. As an agency, we serve as both a direct water provider to customers and a wholesale water supplier to local water districts.
The drinking water that Western Water provides to homes, businesses, and schools meets all state and federal water quality standards. The State Water Board (SWB), Division of Drinking Water (DDW), and the Environmental Protection Agency (EPA) are the agencies responsible for establishing and enforcing drinking water quality standards.
In addition to performing over 41,000 tests for more than 205 contaminants, impurities, and water quality parameters, Western Water also tests for unregulated chemicals that may have health risks, but do not have drinking water standards. This monitoring of unregulated chemicals aids the EPA and DDW in identifying their presence and evaluating the need to establish new standards.
Western Water is committed to delivering a sustainable water supply while proactively adapting to the challenges posed by climate change and escalating drought conditions. Through our recently completed “Connecting the Drops” project, we are spearheading initiatives focused on stormwater management, recycling, and enhancing groundwater quality. These endeavors are instrumental in advancing our agency’s water supply objectives, with the introduction of approximately 253 million gallons of fresh local groundwater to the region.
In addition, we have formed a groundbreaking partnership with six esteemed water agencies throughout Southern California. This collaboration allows us to procure surplus water during wet years via the State Water Project, subsequently storing it in six strategically located groundwater basins within the Santa Ana Watershed. This visionary approach ensures the availability of a more abundant water supply during dry years.
Moreover, Western Water is committed to significant investments in innovative infrastructure projects, including developing groundwater wells, treatment facilities, and conveyance systems. Securing millions of dollars in grant funding for design and construction, we actively support and drive these initiatives forward.
This comprehensive approach plays a pivotal role in storing more water during wet years, subsequently increasing the availability of water during dry periods. By combining these resources, we can operate more efficiently and provide a better water supply for our customers. We’re excited to advance our efforts toward water supply reliability and continue to invest in our local water supplies and infrastructure for our customers 24 hours a day, 7 days a week, 365 days a year.
2022 Annual Water Quality Report 4 OUR MISSION
Eastvale Norco Corona Prado Dam Riverside SantaAnaRiver Canyon Lake Lake Elsinore Murrieta Temecula Murrieta Service Area Riverside Service Area Western Water Headquarters March A.R.B. Rainbow Service Area Jurupa Valley DIVISION 5 DIVISION 4 DIVISION 3 DIVISION 2 DIVISION 1
SOURCE WATER ASSESSMENT
A source water assessment lists possible contaminants that might affect the quality of your water sources. Assessments were completed for the two surface water sources Western Water utilizes, the State Water Project and Colorado River. In 2021, the State Water Project was reassessed, and in 2020, the Colorado River. Both were found to be most vulnerable to stormwater runoff, recreational activities, wastewater discharges, wildlife, fires, and other watershed-related factors that could affect water quality.
A drinking water source assessment for the Murrieta service area was completed in June 2020 for one of the groundwater wells. The source is considered most vulnerable to the following activities associated with contaminants detected in the water supply: historic gas station, pest control storage, underground storage tanks, and sewer collection systems.
Additionally, the State Water Resources Control Board Division of Drinking Water (State Water Board) completed sanitary surveys for the:
• Riverside service area in 2018
• Murrieta service area in 2022; and
• Rainbow service area in 2021.
A sanitary survey is an on-site review of a public water system for the purpose of evaluating the adequacy of the water source, facilities, equipment, operation, and maintenance for producing and distributing safe drinking water. No significant deficiencies were identified during the surveys.
5 2022 Annual Water Quality Report
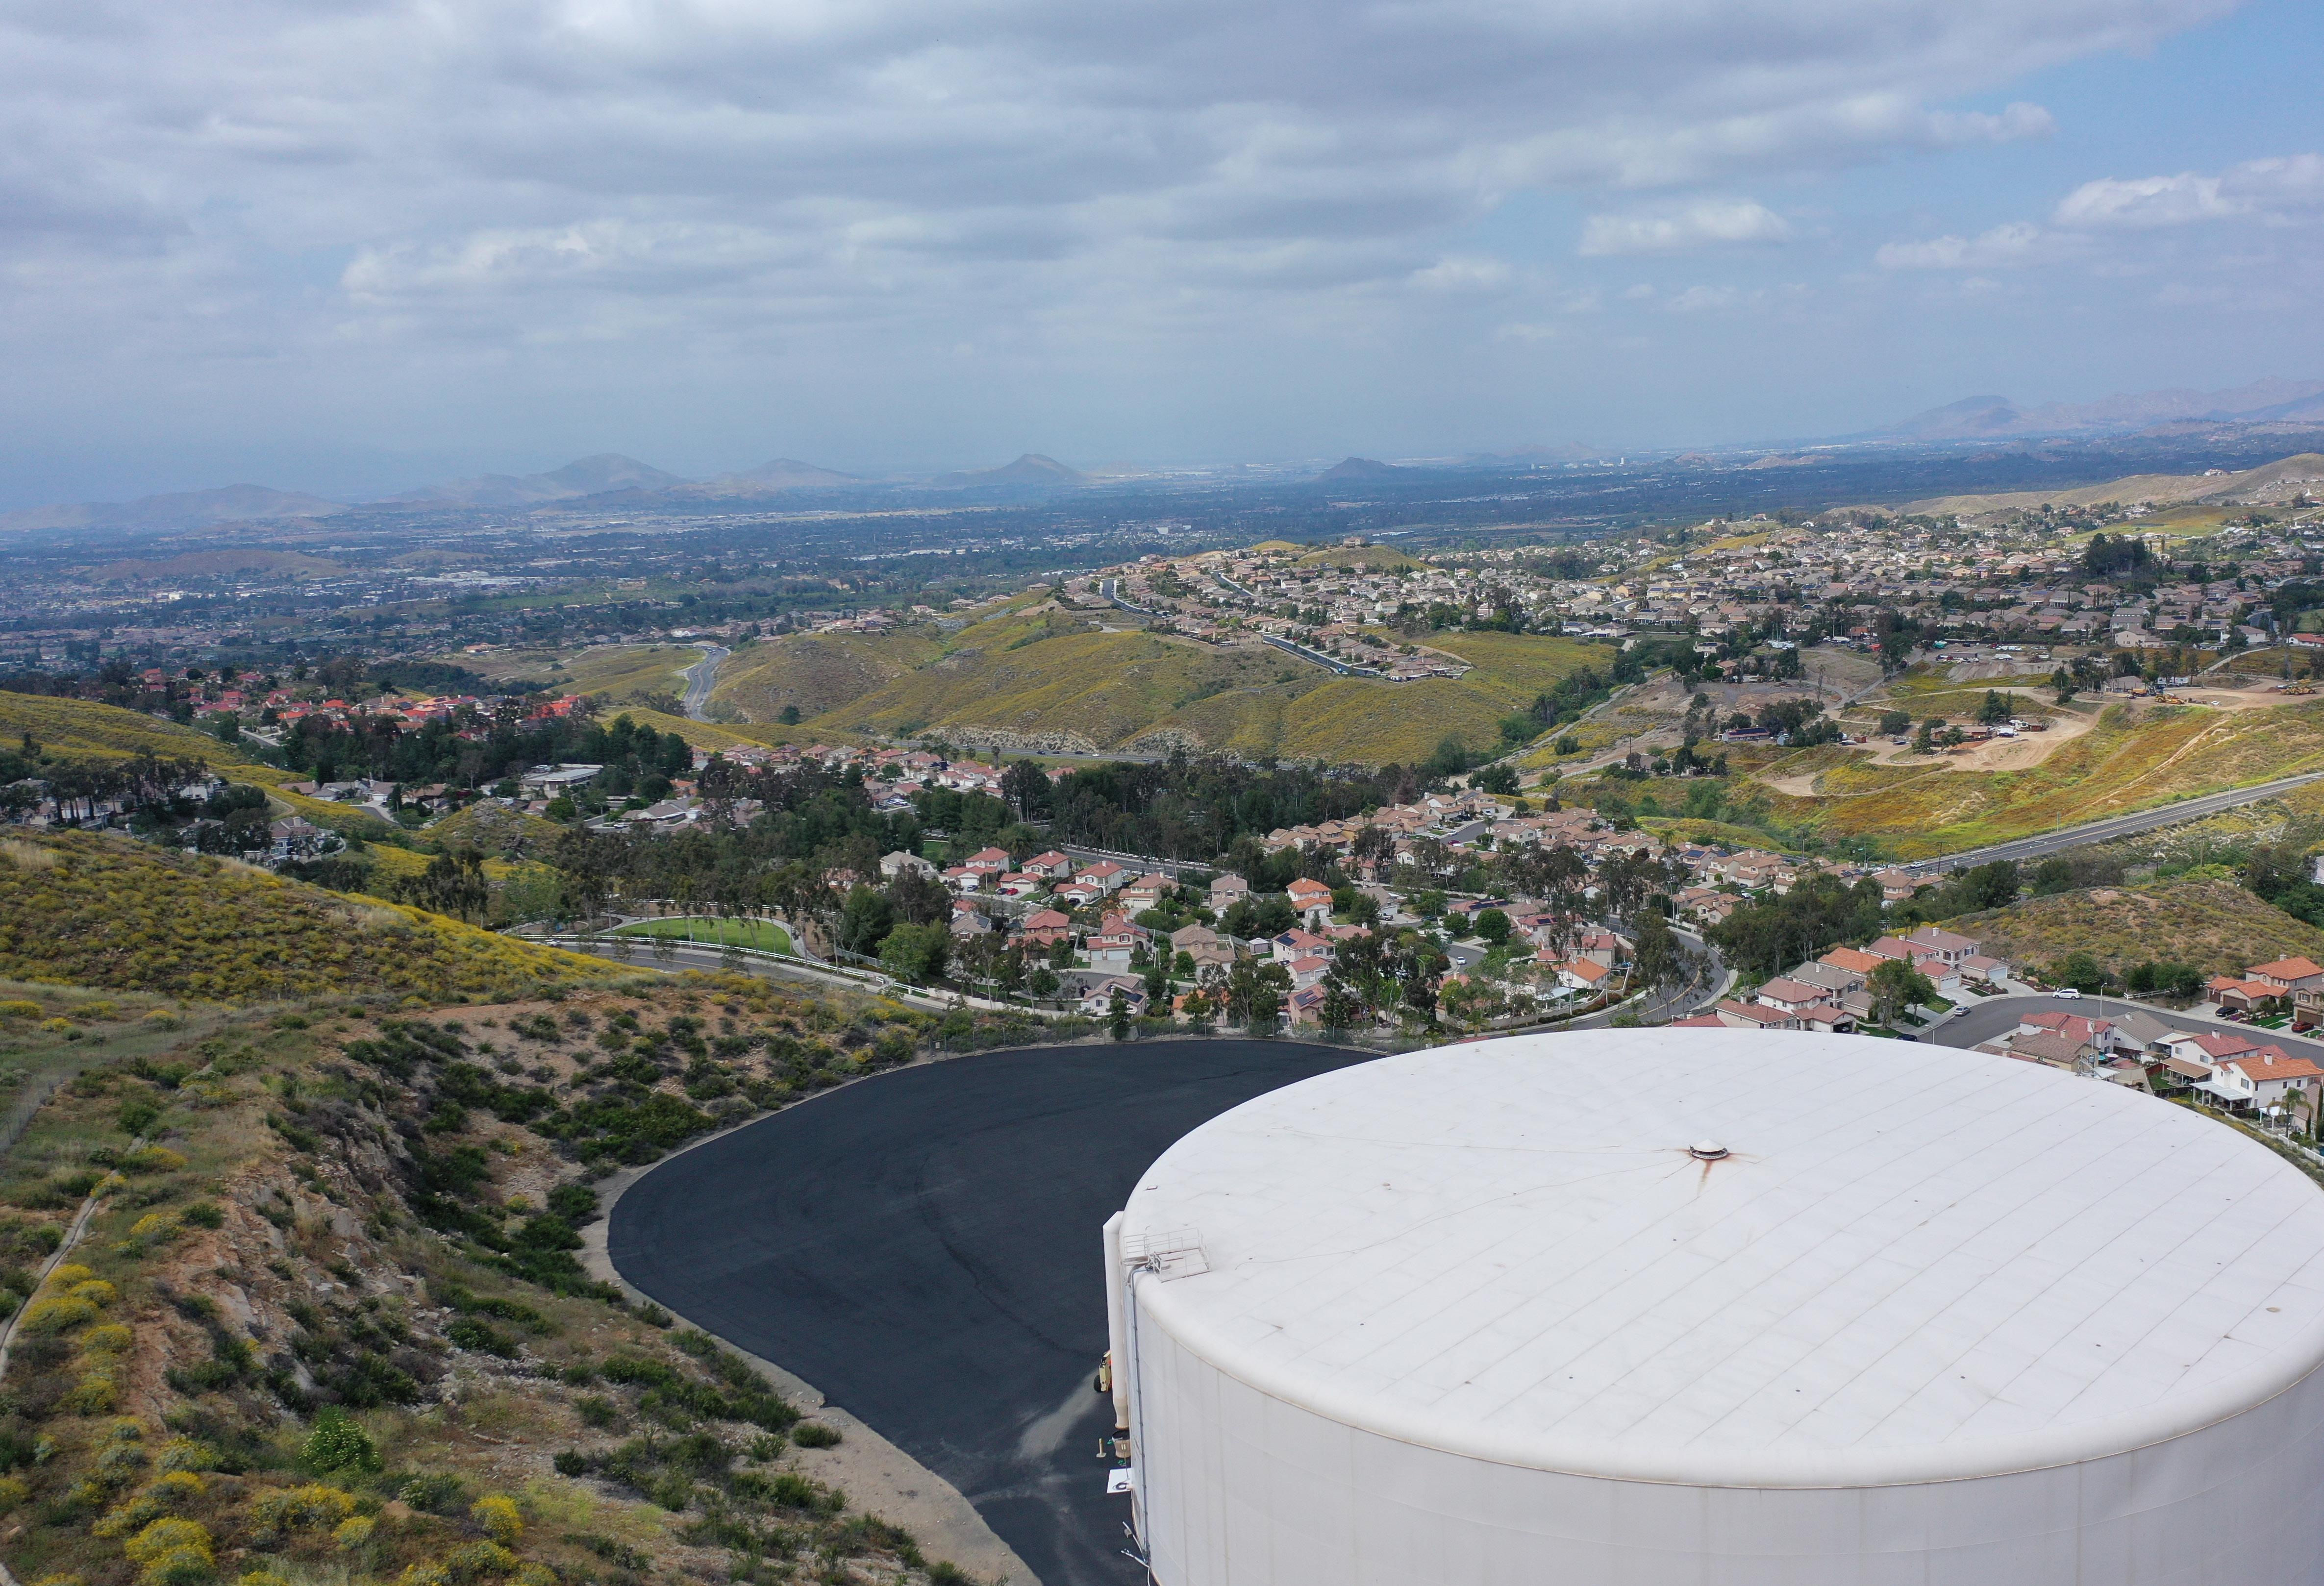
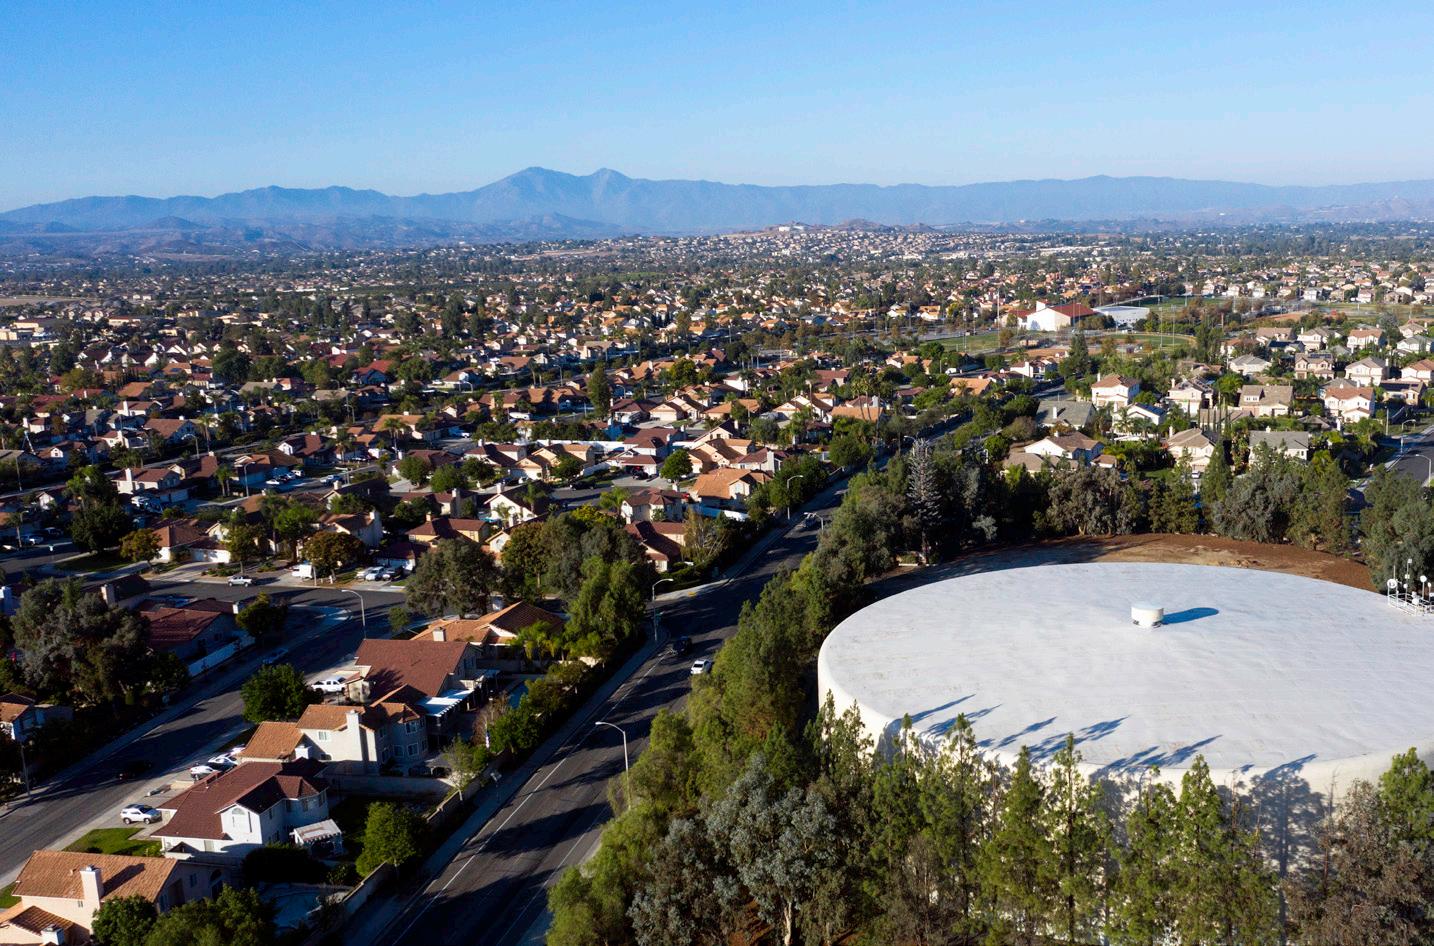
Orangecrest Reservoir
A copy of the complete assessment is available at Western Water. You may request a summary of the assessment be sent to you by contacting 951.571.7104.
Some people may be more vulnerable to contaminants in drinking water than the general population. Immuno-compromised individuals, which include those with cancer who are undergoing chemotherapy, those who have undergone organ transplants, those with HIV/AIDS or other immune system disorders, and some elderly individuals and infants can be particularly at risk of infections.
Water quality monitoring indicates no Cryptosporidium organisms in the sources and finished water. Cryptosporidium is a microbial pathogen found in surface water throughout the United States. Although filtration removes Cryptosporidium, the most commonly used filtration methods cannot guarantee 100 percent removal. Ingestion of Cryptosporidium may cause cryptosporidiosis, an abdominal infection. Symptoms of infection include nausea, diarrhea and abdominal cramps. Most healthy individuals can overcome the disease within a few weeks. However, immuno-compromised individuals are at greater risk of developing a life-threatening illness. Western Water encourages immuno-compromised individuals to consult their doctor regarding appropriate precautions to take to avoid infection. Cryptosporidium must be ingested to cause disease, and it may spread through means other than drinking water.
Individuals with special health concerns should seek advice about drinking water from their healthcare provider. Both the EPA and the Centers for Disease Control and Prevention have guidelines on ways to reduce the risk of infection from Cryptosporidium and other microbial contaminants and are available from the Safe Drinking Water Hotline, 800.426.4791 or online at epa.gov/safewater.
While your drinking water meets the federal and state standard for arsenic, it does contain low levels of arsenic. The arsenic standard balances the current understanding of arsenic’s possible health effects against the costs of removing arsenic from drinking water. The EPA continues to research the health effects of low levels of arsenic, which is a mineral known to cause cancer in humans at high concentrations and is linked to other health effects such as skin damage and circulatory problems.
Nitrate in drinking water at levels above 10 mg/L is a health risk for infants less than 6 months old. Such nitrate levels in drinking water can interfere with the capacity of the infant’s blood to carry oxygen, resulting in a serious illness. Symptoms can include shortness of breath and blueness of skin. Nitrate levels above 10 mg/L may also affect the ability of the blood to carry oxygen in other individuals, such as pregnant women and those with certain specific enzyme deficiencies. If you are caring for an infant or you are pregnant, you should ask advice from your health care provider.
The sources of drinking water (both tap water and bottled water) include rivers, lakes, streams, ponds, reservoirs, springs, and wells. As water travels over the surface of the land or through the ground, it dissolves naturally-occurring minerals and, in some cases, radioactive material, and can pick up substances resulting from the presence of animals or from human activity. Contaminants that may be present in source water include:
• Microbial contaminants, such as viruses and bacteria, that may come from sewage treatment plants, septic systems, agricultural livestock operations, and wildlife.
• Inorganic contaminants, such as salts and metals, that can be naturally-occurring or result from urban stormwater runoff, industrial or domestic wastewater discharges, oil and gas production, mining, or farming.
• Pesticides and herbicides, that may come from a variety of sources such as agriculture, urban stormwater runoff, and residential uses.
• Organic chemical contaminants, including synthetic and volatile organic chemicals, that are byproducts of industrial processes and petroleum production, and can also come from gas stations, urban stormwater runoff, agricultural application, and septic systems.
• Radioactive contaminants, that can be naturally-occurring or be the result of oil and gas production and mining activities.
2022 Annual Water Quality Report 6 SPECIAL HEALTH INFORMATION
Arsenic and Nitrate levels in all of Western’s service areas are below the state and federal standards of 10 mg/L.
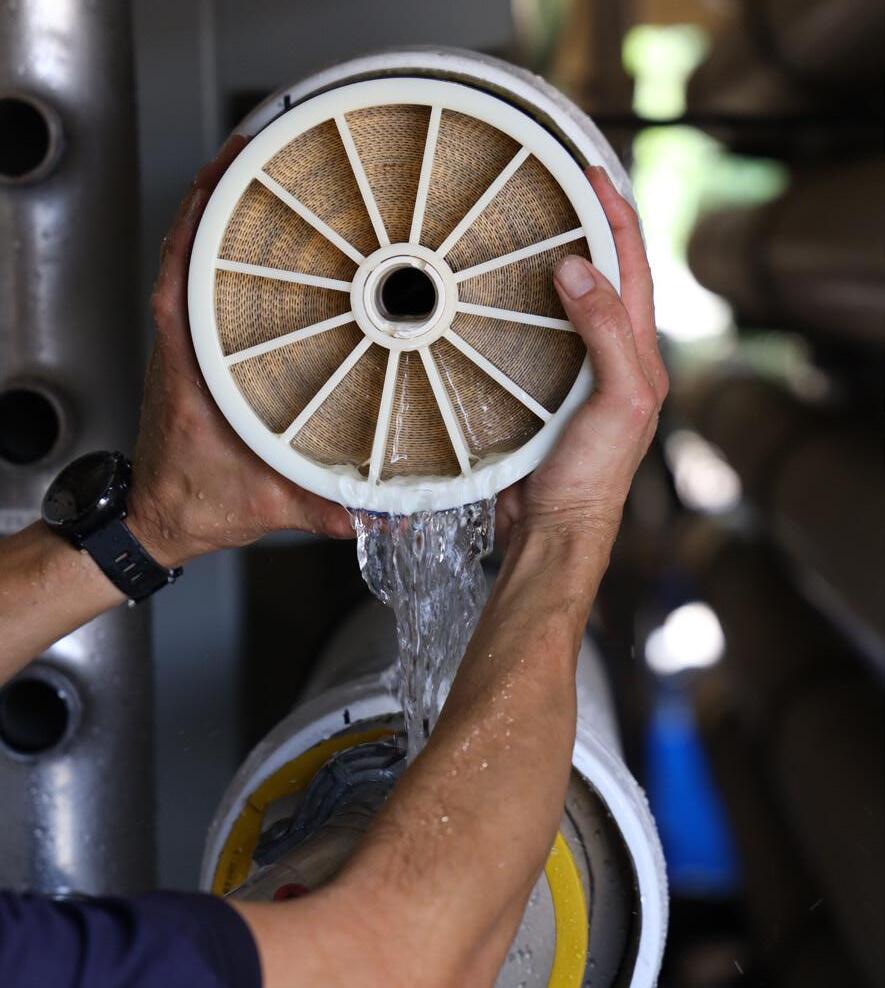
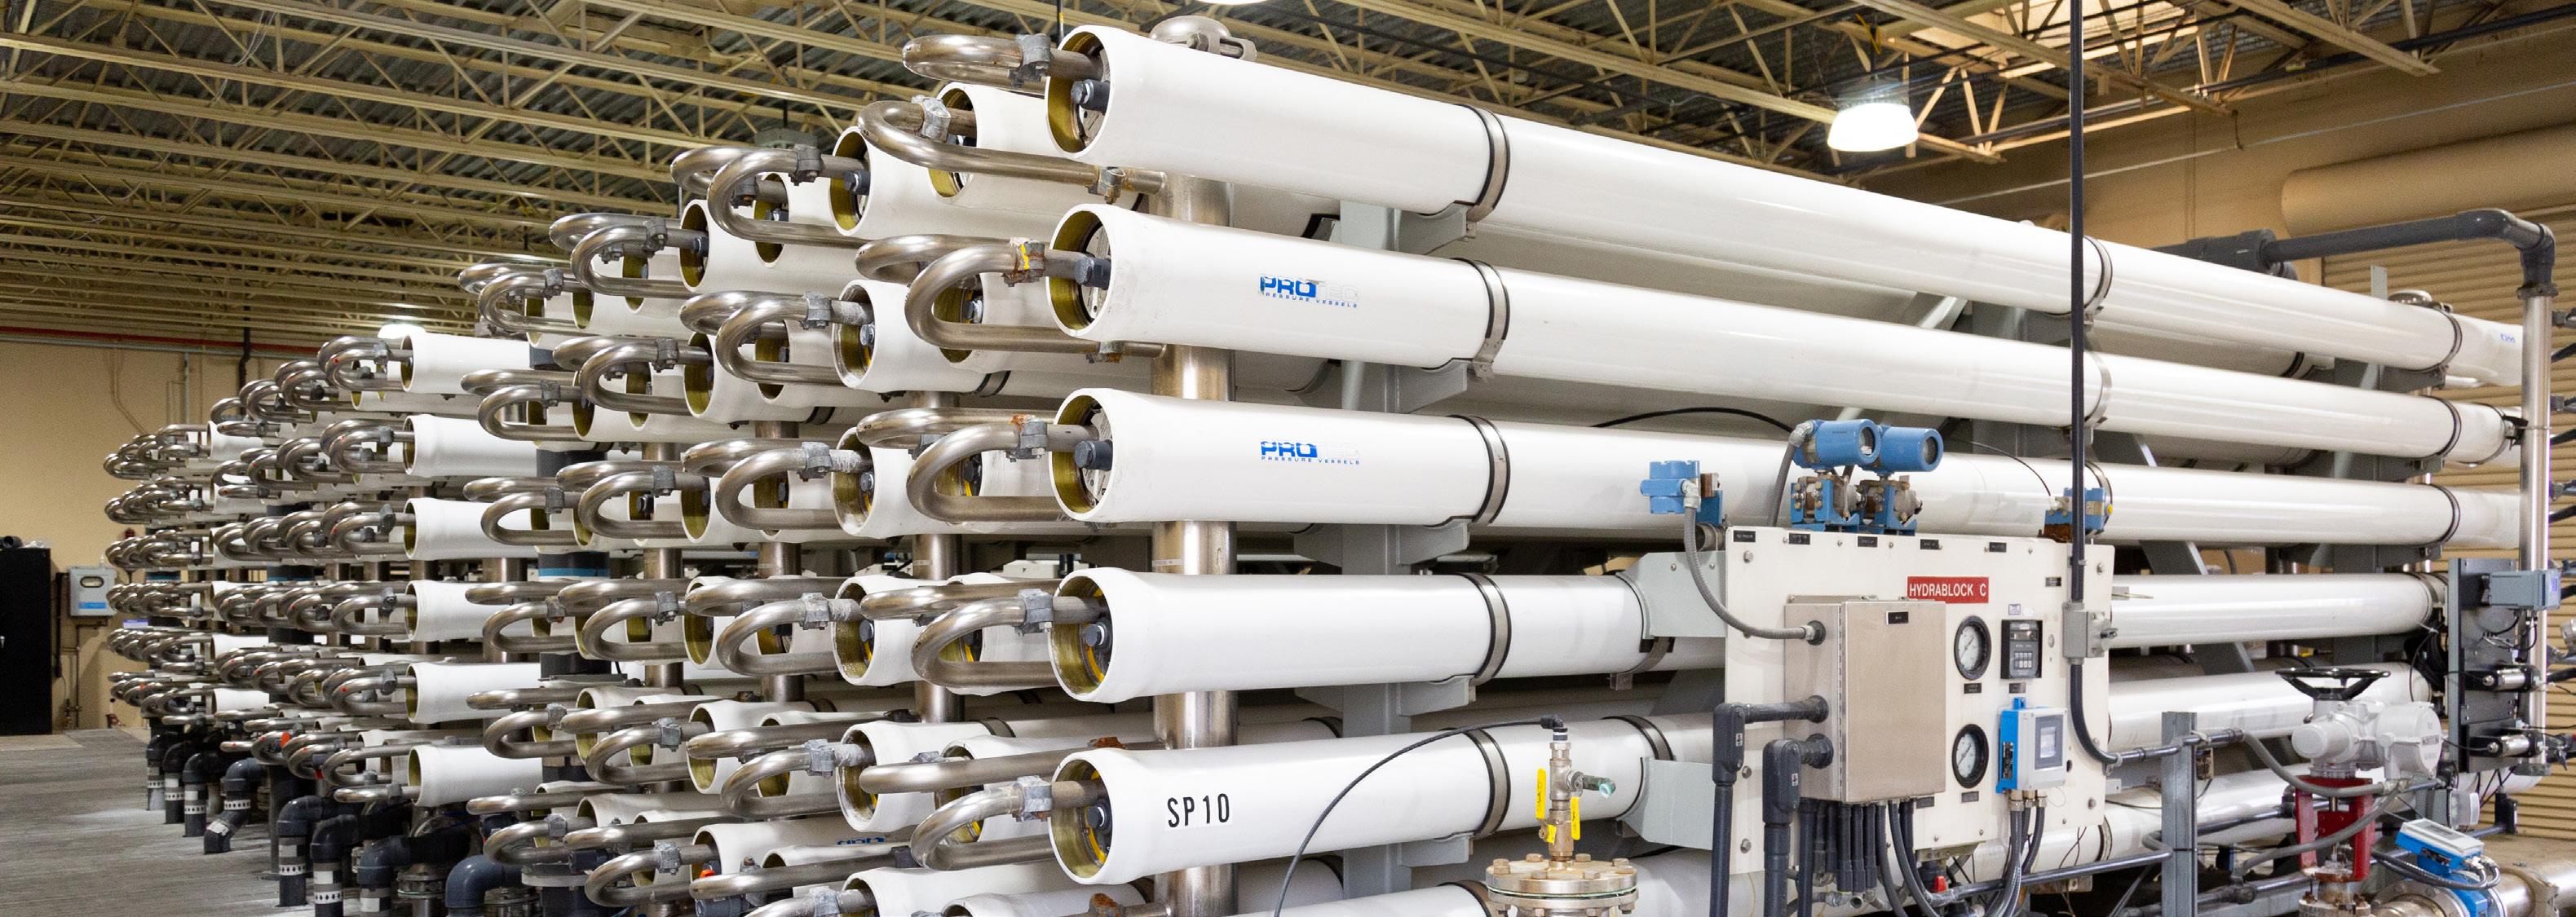
Arlington Desalter Membrane
In order to ensure that tap water is safe to drink, the EPA and the State Water Board prescribe regulations that limit the amount of certain contaminants in water provided by public water systems. State Water Board regulations also establish limits for contaminants in bottled water that provide the same protection for public health.
Drinking water, including bottled water, may reasonably be expected to contain at least small amounts of some contaminants. The presence of contaminants does not necessarily indicate that water poses a health risk. More information about contaminants and potential health effects can be obtained by calling the EPA Safe Drinking Water Hotline 800.426.4791. Western Water continues to ensure your water is safe to drink.
JUST THE FACTS ON PFAS
PFAS, short for per- and polyfluoroalkyl substances, are a group of more than 4,700 synthetic chemicals created to repel water, oil, grease and stains. The chemicals, dating to the 1940s, have been found to be nearly indestructible over time. These chemicals appear in a range of industrial and everyday consumer products, including makeup, food wrappers, nonstick cookware, carpets, stain repellents, and firefighting foams.
Because PFAS have been so widely used, most Americans have been exposed to them through sources other than their drinking water. People ingest PFAS by eating, drinking, or breathing the chemicals when they are present in food, water, fire retardants, and consumer and industrial products. Based on research cited by the Department of Drinking Water (DDW), most people are exposed to PFAS through food—via food packaging, farming processes, or bioaccumulation (gradual chemical buildup).
Over time, PFAS also have accumulated in land near airports, industrial sites, military bases, and landfills. Once PFAS leach into the land, the chemicals can, in some cases, seep into the local groundwater.
Western Water continues to adhere to DDW’s guidelines for the monitoring of PFAS. The State Water Board has established reporting levels for PFAS. Learn more about these forever chemicals at WesternWaterCA.gov/PFAS
LEAD AND COPPER RULE
The Lead and Copper Rule (LCR) was developed to protect public health by minimizing lead and copper levels in drinking water. The most common source of lead and copper in drinking water is corrosion of plumbing materials. Plumbing materials that can be made with lead and copper include pipes, solder, fixtures and faucets. The LCR established an action level of 15 ppb (parts per billion) for lead and 1.3 ppm (parts per million) for copper based on the 90th percentile level of tap water samples. If more than 10 percent of the samples are above either action level, further actions are required. Lead and copper are sampled on a state mandated 3-year testing cycle with sampling conducted at selected customer taps.
Testing has confirmed that Western Water’s drinking water, most of which is imported from Northern California snowmelt, is safe and does not contain PFAS above state mandated notification levels. Learn more about these forever chemicals at WesternWaterCA.gov/PFAS .
7 2022 Annual Water Quality Report
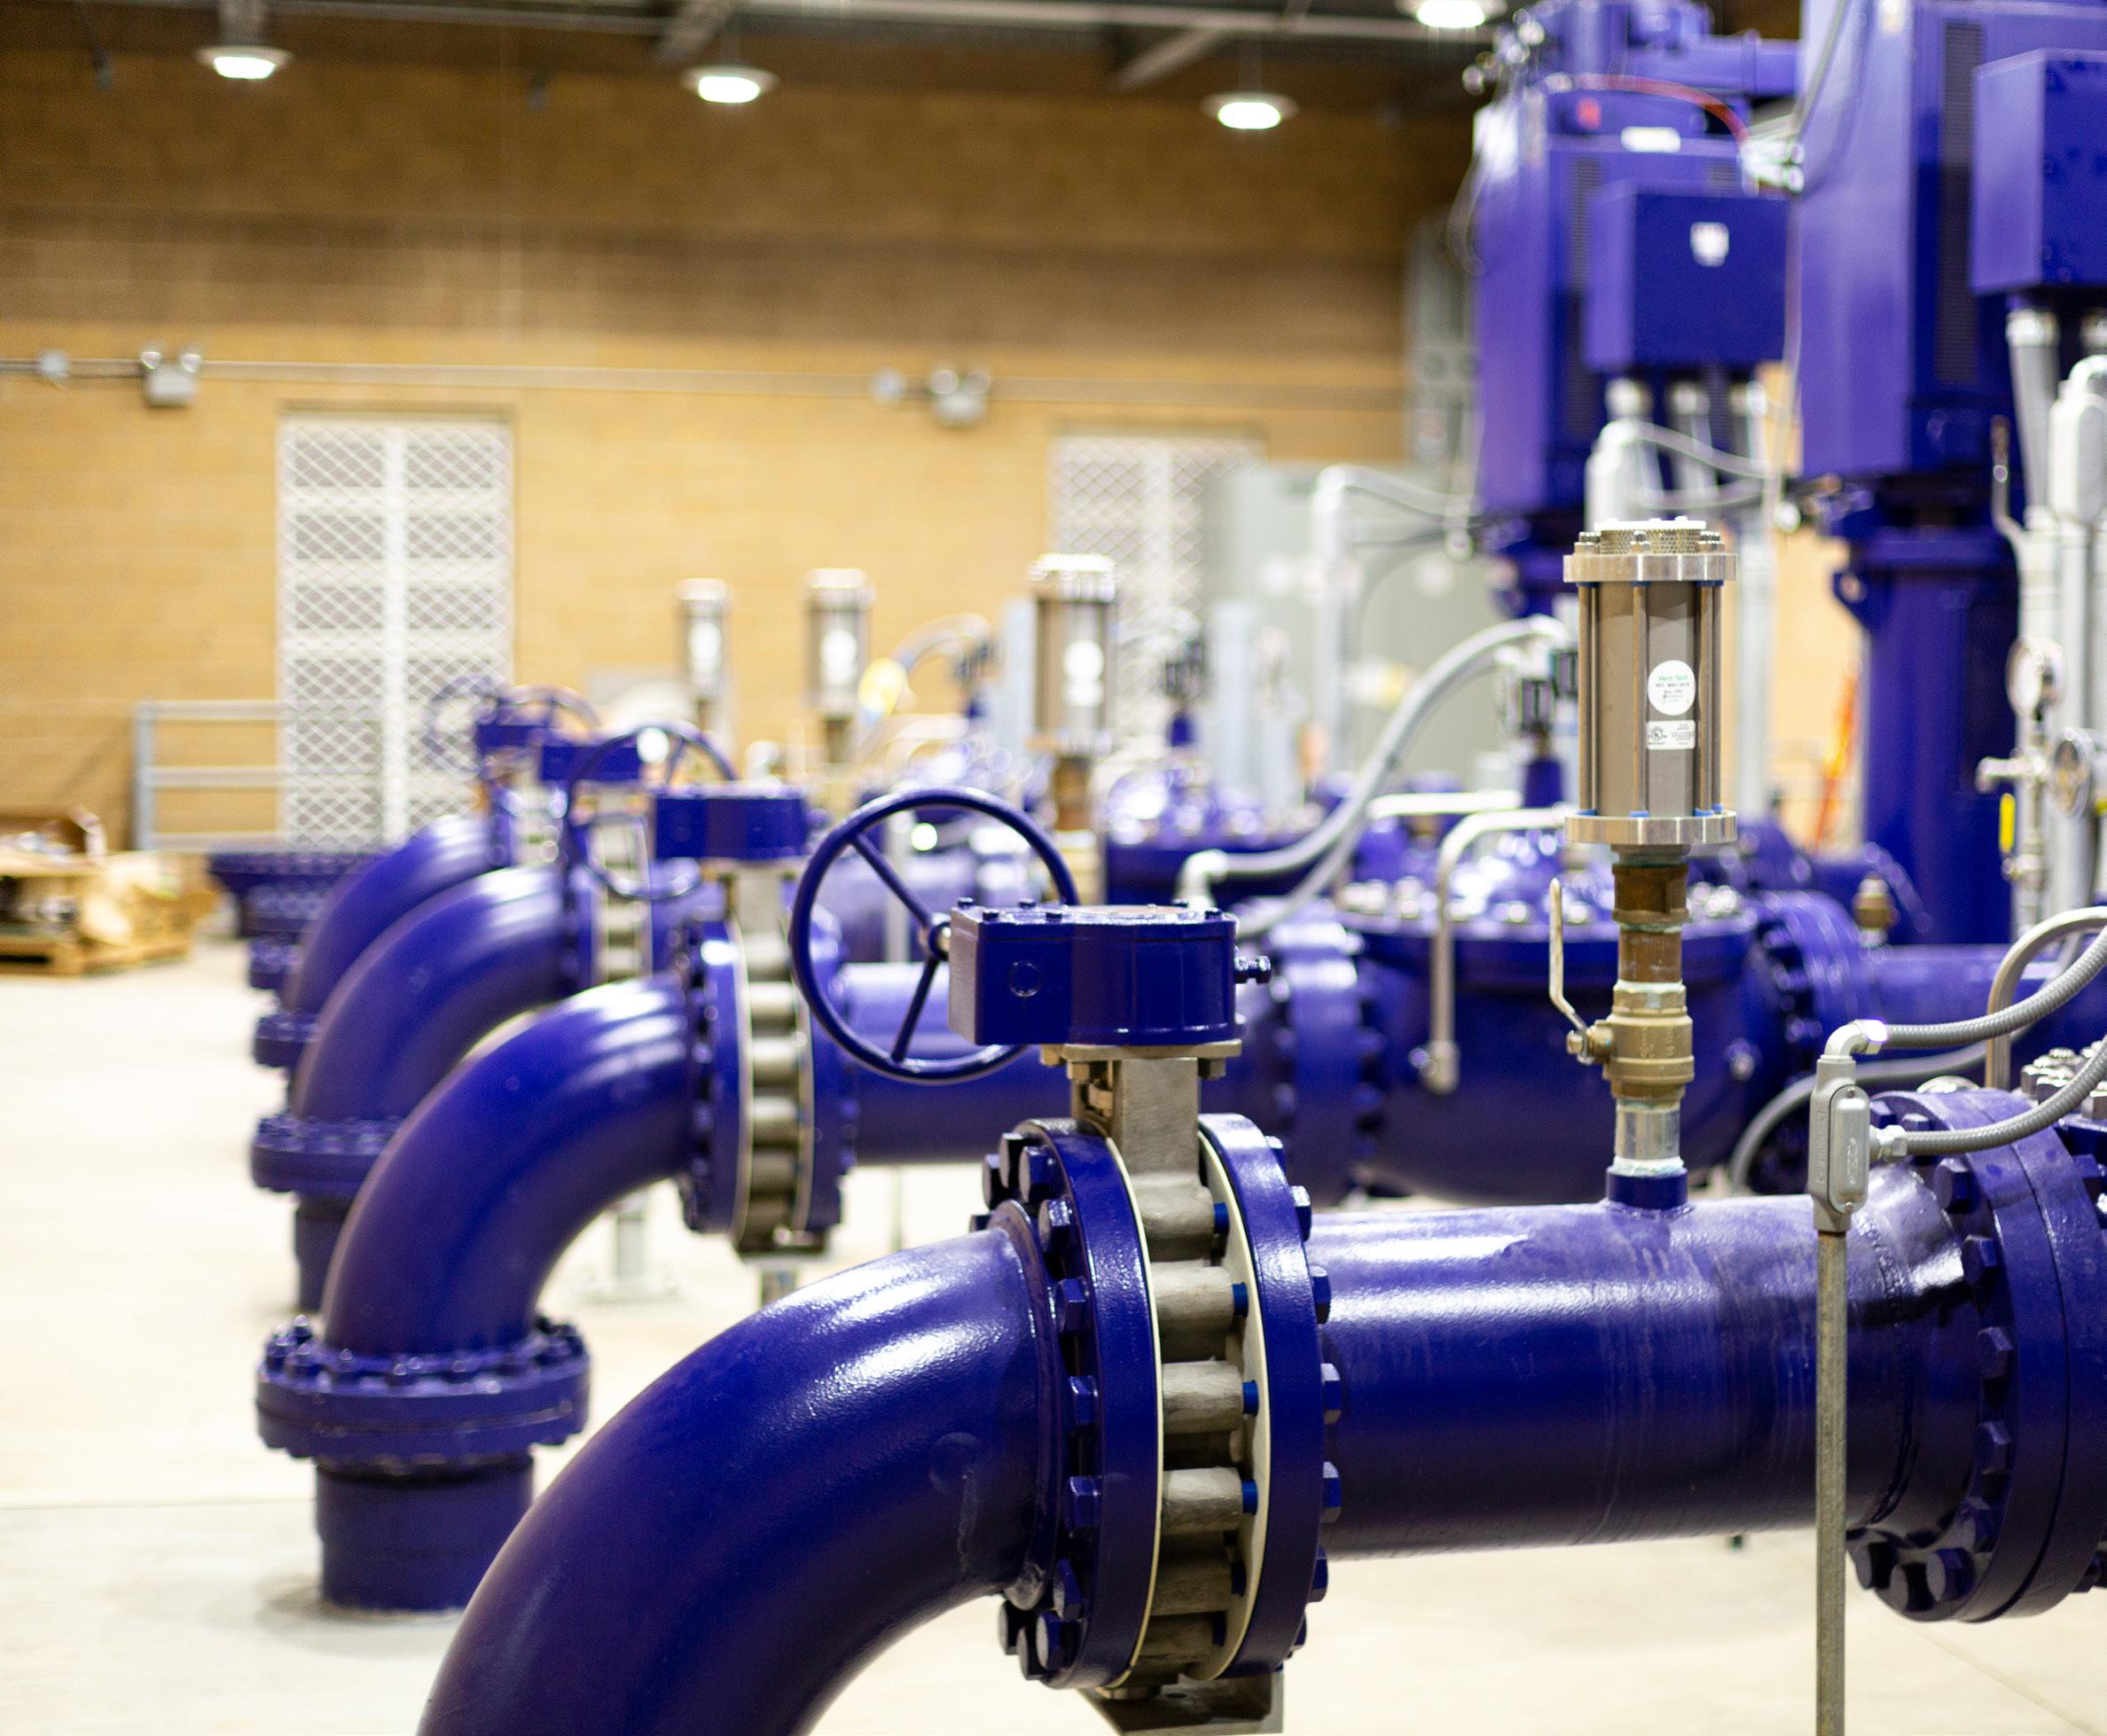
Sterling Pump Station
The LCR requires Western Water to sample at locations that may be particularly susceptible to high lead or copper concentrations. With a tiered system for prioritizing sampling sites, federal regulations prioritize sampling for single-family structures with copper pipes that have lead solder installed after 1982. Western Water’s sample locations remain the same for each sampling event unless voluntary participation from its customers is not sufficient to meet the minimum required samples per the LCR.
If present, elevated levels of lead can cause serious health problems, especially for pregnant women and young children. Lead in drinking water is primarily from materials and components associated with service lines and home plumbing. Western Water is responsible for providing high-quality drinking water but cannot control the variety of materials used in plumbing components beyond the meter. When your water has been sitting for several hours, you can minimize the potential for lead exposure by flushing your tap for 30 seconds to two minutes before using water for drinking or cooking. If you are concerned about lead in your water, you may wish to have your water tested. Information on lead in drinking water, testing methods and steps you can take to minimize exposure is available from the Safe Drinking Water Hotline 800.426.4791 or at epa.gov/safewater/lead.
LEAD SAMPLING IN SINGLE-FAMILY STRUCTURES

Thirty-four homes were tested in the Riverside service area within the last 3-year testing cycle, completed in 2022. Thirty homes were tested in the Murrieta service area within the last 3-year testing cycle, completed in 2022. Six homes were tested in the Rainbow service area within the last 3-year testing cycle completed in 2021.
LEAD SAMPLING IN SCHOOLS
No schools requested sampling for lead in 2022. To schedule lead testing for your school, contact Western Water’s Water Quality team at 951.789.5119.
2022 Annual Water Quality Report 8
Lead and Copper Testing Regulated at Customer’s Tap Lead (µg/L) Copper (mg/L) Action Level @ 90th Percentile 15 1.3 California Public Health Goal (PHG) 0.2 0.3 Detection Limits for Purposes of Reporting (DLR) 5 0.05 Riverside, 2022 Monitoring 90th percentile value ND 0.26 # of homes over action level 0 of 34 0 of 34 Murrieta, 2022 Monitoring 90th percentile value ND 0.15 # of homes over action level 0 of 30 0 of 30 Rainbow, 2021 Monitoring 90th percentile value ND 0.07 # of homes over action level 0 of 6 0 of 6
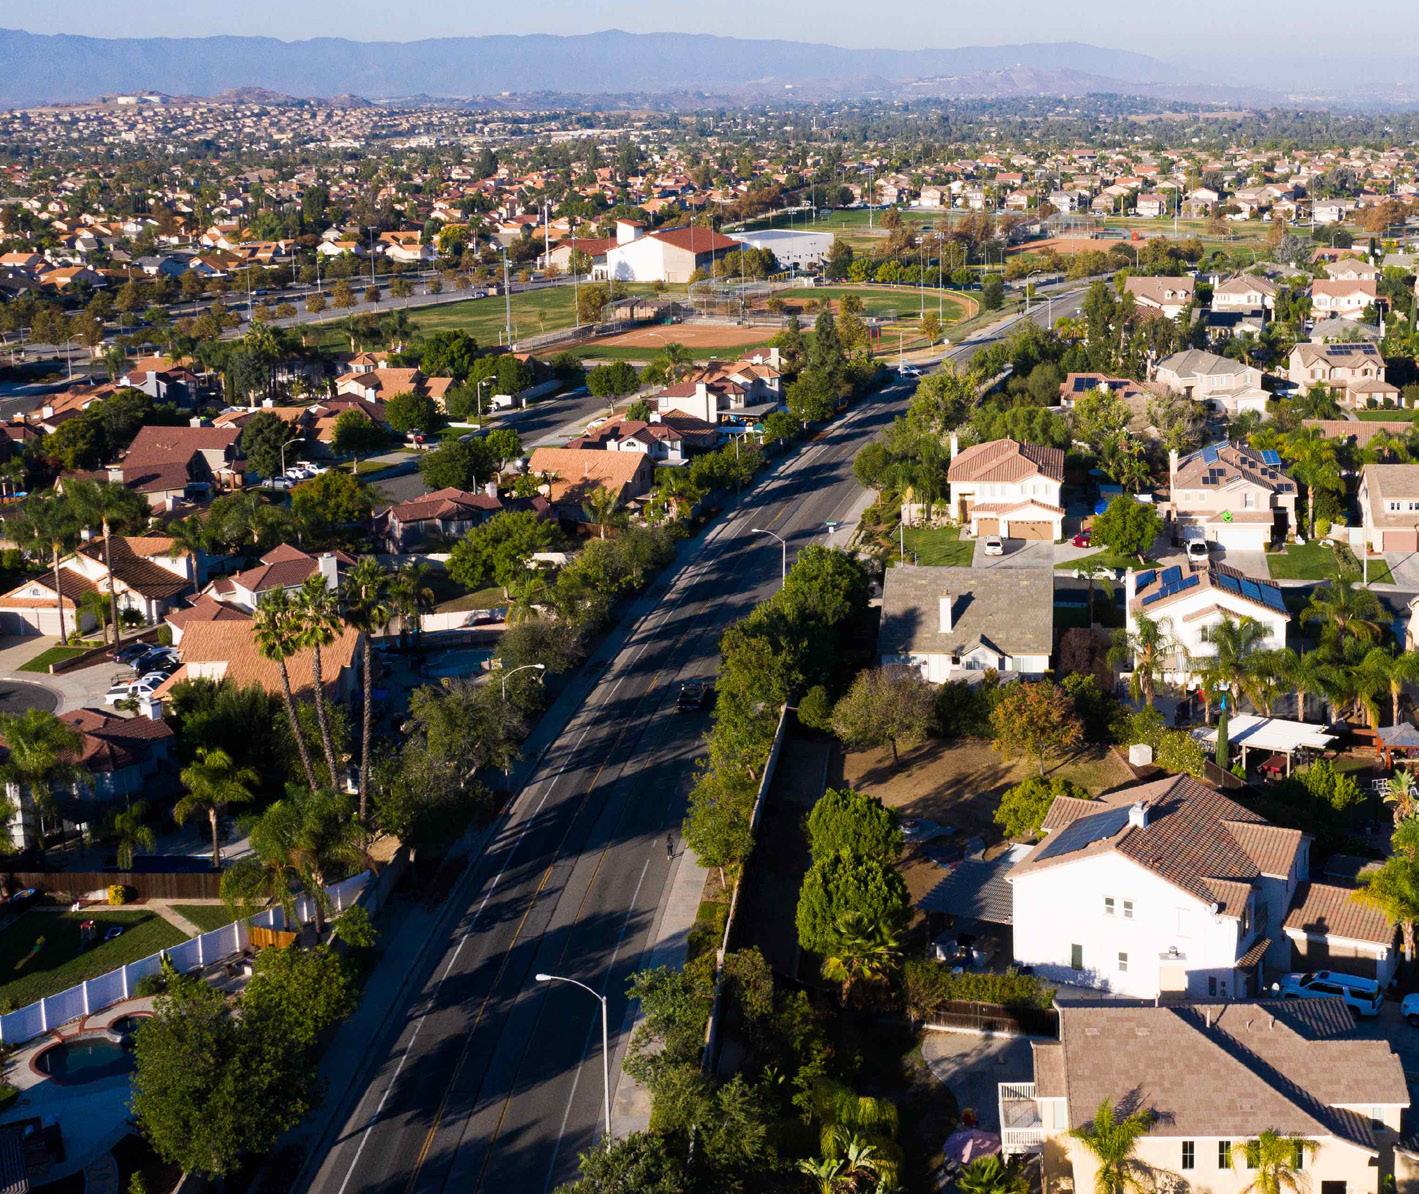
Orangecrest Service Area
2022 WATER QUALITY TABLE
glass and electronics production wastes
of oil drilling wastes and from metal refineries; erosion of natural
Erosion of natural deposits; water additive that promotes strong teeth; discharge from fertilizer and aluminum factories
Runoff and leaching from fertilizer use; leaching from septic tanks and sewage; erosion of natural deposits
Perchlorate is an inorganic chemical used in solid rocket propellant, fireworks, explosives, flares, matches, and a variety of industries. It usually gets into drinking water as a result of environmental contamination from historic aerospace or other industrial operations that used or use, store, or dispose of perchlorate and its salts.
Discharge from petroleum, glass, and metal refineries; erosion of natural deposits; discharge from mines and chemical manufacturers; runoff from livestock lots (feed additive)
2022 Annual Water Quality Report 10
RETAIL SYSTEM Units of Measure State/Fed MCL [MRDL] PHG (MCLG) [MRDLG] DLR (CCRDL) [RL] Riverside Service Area(a) Murrieta Service Area(b) Rainbow Service Area(c) Primary Sources Local Groundwater Surface Water Local Groundwater Surface Water Surface Water Average Range Average Range Average Range Average Range Average Range Primary Standards, Mandatory Health Related Standards Clarity Highest Highest % ≤ 0.3 Highest % ≤ 0.3 % ≤ 0.1 Highest % ≤ 0.3 Turbidity NTU TT(d) NA NA 0.06 NA 0.06 100 NA NA 0.15 100 99.87 0.05 100 Soil runoff Disinfection Byproduct Precursors Total Organic Carbon (TOC) mg/L TT NA 0.3 No Data No Data 1.9 1.7 - 2.2 0.5 0.4 - 0.9 2.7 1.7 - 3.7 2.5 2.3 - 2.6 Various natural and manmade sources Inorganic Chemicals Aluminum µg/L 1000 600 50 ND NR 60 ND - 150 ND NR ND ND - 230 113 ND - 230 Erosion of natural deposits; residue from some surface water treatment processes Arsenic µg/L 10 0.004 2 ND ND - 4 ND NR ND ND - 6 ND ND - 3 ND NR Erosion of natural deposits; runoff from orchards;
Barium mg/L 1 2 0.1 ND NR ND NR 0.1 ND - 0.3 ND ND - 0.1 ND NR Discharges
Fluoride mg/L 2 1 0.1 0.2 ND - 0.5 0.7 0.6 - 0.8 0.2 ND - 0.4 0.3 ND - 0.8 0.7 0.6 - 0.8
deposits
Nitrate (N) mg/L 10 10 0.4 5.1 3.8 - 7.5 ND NR 0.9 ND - 4.2 ND ND - 3.6 ND NR
Perchlorate µg/L 6 1 2 ND ND - 3 ND NR ND NR ND NR ND NR
Selenium µg/L 50 30 5 ND ND - 7 ND NR ND ND - 14 ND NR ND NR
Banned nematocide that may still be present in soils due to runoff/leaching from former use on soybeans, cotton, vineyards, tomatoes, and tree fruit
that form ions in water; seawater influence
11 2022 Annual
Quality Report Units of Measure State/Fed MCL [MRDL] PHG (MCLG) [MRDLG] DLR (CCRDL) [RL] Riverside Service Area(a) Murrieta Service Area(b) Rainbow Service Area(c) Primary Sources Local Groundwater Surface Water Local Groundwater Surface Water Surface Water Average Range Average Range Average Range Average Range Average Range Organic Chemicals Synthetic Organic Compounds Dibromochloropropane (DBCP) ng/L 200 3 10 ND ND - 14 ND NR ND NR ND NR ND NR
Water
Radiological Gross Alpha pCi/L 15 (0) 3 ND ND - 10 ND ND - 4 ND ND - 7 ND ND - 3 ND ND - 3 Erosion of natural deposits Gross Beta pCi/L 50 (0) 4 No Data No Data 4 ND - 6 ND ND - 5 ND ND - 8 7 5 - 8 Decay of natural and man-made deposits Radium 228 pCi/L 5 0.019 1 ND NR ND NR ND NR ND ND - 1 ND ND - 1 Erosion of natural deposits Uranium pCi/L 20 0.43 1 3 ND - 9 ND ND - 2 2 ND-6 2 ND - 3 2 ND - 2 Erosion of natural deposits Secondary Standards - Aesthetic Standards Aluminum(e) µg/L 200 600 50 ND NR 60 ND - 150 ND NR ND ND - 230 113 ND - 230 Erosion of natural deposits; residual from some surface water treatment processes Chloride mg/L 500 NA NA 47 12 - 62 76 76 - 77 87 9.5 - 140 93 69 - 113 102 98 - 106 Runoff/leaching from natural deposits; seawater influence Copper mg/L 1.0 0.3 0.05 ND NR ND NR ND ND - 0.1 ND NR ND NR Internal corrosion of household plumbing systems; erosion of natural deposits; leaching from wood preservatives Sulfate mg/L 500 NA 0.5 41 7.3 - 72 56 56 - 57 50 9.0 - 222 152 45 - 229 218 206 - 229 Runoff/leaching from natural deposits; industrial wastes Total Dissolved Solids (TDS) mg/L 1000 NA NA 282 170 - 390 296 289 - 304 354 193 - 690 509 272 - 708 621 591 - 651 Runoff/leaching from natural deposits Manganese µg/L 50; NL = 500 NA 20 ND NR ND NR ND ND - 36 ND NR ND NR Leaching from natural deposits Specific Conductance µS/cm 1600 NA NA 450 320 - 610 534 522 - 546 564 306 - 942 814 483 - 1080 987 944 - 1030
Notification Levels, Nonregulatory Standards Boron µg/L NL = 1000 NA 100 ND NR 160 NR 112 ND - 454 141 122 - 170 130 NR Runoff/leaching from natural deposits; industrial wastes Chlorate µg/L NL = 800 NA 20 No Data No Data 200 NR No Data No Data 75 NR 75 NR Byproduct of drinking water chlorination; industrial processes N-Nitrosodimethylamine (NDMA) ng/L NL= 10 3 [2] ND NR 4 NR No Data No Data 4 NR 4 NR Byproduct of drinking water chlorination; industrial processes Perfluorooctanoic Acid (PFOA)(f) ng/L NL = 5.1 NA (4) ND ND - 4.6 ND NR ND NR ND NR ND NR Industrial chemical factory discharges; runoff/leaching from landfills; used in fire-retarding
and
industrial processes Perfluorooctanesulfonic Acid (PFOS)(f) ng/L NL = 6.5 NA (4) ND ND - 4.9 ND NR ND NR ND NR ND NR Perfluorobutanesulfonic Acid (PFBS)(f) ng/L NL = 500 NA (3) ND ND - 3 ND NR ND NR ND NR ND NR Perfluorohexanesulfonic Acid (PFHxS)(f) (g) ng/L NL = 3 NA (3) ND ND - 3 ND NR ND NR ND NR ND NR Vanadium µg/L NL = 50 NA 3 ND ND - 7 ND NR No Data No Data ND NR ND NR Naturally occurring; industrial waste discharge
Substances
foams
various
Monitored in the Distribution System
2022 Annual Water Quality Report 12 Units of Measure State/Fed MCL [MRDL] PHG (MCLG) [MRDLG] DLR (CCRDL) [RL] Riverside Service Area(a) Murrieta Service Area(b) Rainbow Service Area(c) Primary Sources Local Groundwater Surface Water Local Groundwater Surface Water Surface Water Average Range Average Range Average Range Average Range Average Range Unregulated Contaminant Monitoring Chlorodibromoacetic Acid µg/L NA NA NA 0.08 ND - 0.33 No Data No Data No Data No Data No Data No Data No Data No Data Byproduct of drinking water disinfection Chromium, Hexavalent µg/L NA 0.02 1 ND ND - 4 ND NR ND NR ND NR ND NR Runoff/leaching from natural deposits; discharge from industrial wastes Germanium(h) µg/L NA NA NA 0.28 ND - 0.44 No Data No Data ND NR No Data No Data No Data No Data Naturally-occurring element; byproduct of zinc ore processing; used in solar, electronics and optic systems Perfluorohexanoic Acid (PFHxA)(f) ng/L NA NA (3) ND ND - 7 ND NR ND NR ND NR ND NR Industrial chemical factory discharges; runoff/leaching from landfills; used in fire-retarding foams and various industrial processes Other Parameters Tested Alkalinity, Total mg/L NA NA NA 119 72 - 180 86 83 - 89 112 34 - 220 118 80 - 150 124 119 - 128 Runoff/leaching of natural deposits Calcium mg/L NA NA NA 46 28 - 71 26 25 - 28 44 18 - 90 54 24 - 76 67 63 - 71 Hardness mg/L NA NA NA 155 110 - 220 118 115 - 120 140 47 - 294 220 109 - 299 272 263 - 282 Magnesium mg/L NA NA [0.33] 9.4 5.5 - 13 12 12 - 13 7 ND - 17 21 12 - 27 25 24 - 26 Potassium mg/L NA NA NA 1.8 1.0 - 3.4 3.7 3.6 - 3.8 2.3 1.1 - 7.7 4.3 3.4 - 5.2 4.6 4.4 - 4.8 Salt present in the water; naturallyoccurring Silica mg/L NA NA [5] 15 12 - 25 No Data No Data 9 5 - 26 6 ND - 14 No Data No Data NA Sodium mg/L NA NA NA 36 22 - 45 60 60 - 61 65 27 - 100 86 57 - 112 100 96 - 103 Salt present in the water; naturallyoccurring
Units of Measure MCL [MRDL] PHG (MCLG) [MRDLG] DLR (RL) Riverside(a) Murrieta(b) Rainbow(c) Primary Sources Average Range Average Range Average Range Disinfection Byproducts Highest LRAA or RAA Highest LRAA or RAA Highest LRAA or RAA Total Trihalomethanes (TTHMs) µg/L LRAA = 80 NA 1.0 27 2.1 - 36 24 ND - 31 21 13 - 30 Byproduct of drinking water disinfection Haloacetic Acids (HAA5) µg/L LRAA = 60 NA 1.0 9.1 ND - 4.4 6.4 ND - 9.5 6.3 ND - 9.9 Bromate(e) µg/L RAA = 10 0.1 1.0 5.5 ND - 14 1.2 ND - 5.5 1.2 ND - 5.5 Microbiological Highest % 2022 Total Highest # 2022 Total Highest # 2022 Total Total Coliform(i) Monthly Positive Samples TT: 5% (>40 Samples) 1 (<40 Samples) (0) NA 1% 1 0 0 0 0 Naturally present in the environment
Monitored in the Distribution System
13 2022 Annual Water Quality Report
Units of Measure MCL [MRDL] PHG (MCLG) [MRDLG] DLR (RL) Riverside(a) Murrieta(b) Rainbow(c) Primary Sources Average Range Average Range Average Range Disinfectant Chloramines mg/L [4] [4] NA 1.23 0.00 - 3.1 1.49 0.01 - 2.87 1.70 0.28 - 2.56 Drinking water disinfectant added for treatment Physical Parameters Color Color Units 15 NA (3) ND ND - 3 ND ND - 10 ND NR Naturally-occurring organic materials pH pH units NA NA NA 8.0 7.1 - 8.5 8.2 7.5 - 8.8 8.2 7.9 - 8.3 NA Turbidity(j) NTU 5 NA 0.1 ND ND - 1.3 ND ND - 0.2 ND ND - 0.4 Soil runoff Unregulated Contaminant Monitoring(k) Haleoacetic Acids (HAA5) µg/L NA NA NA 6.4 ND - 28 7.8 3.5 - 15 No Data No Data Byproduct of drinking water disinfection Haleoacetic Acids (HAA6Br) µg/L NA NA NA 5.6 ND - 15 7.9 3.9 - 14 No Data No Data Haeloacetic Acids (HAA9) µg/L NA NA NA 9.7 ND - 30 13 5.9 - 26 No Data No Data
Arlington Desalter Trains
KIDNEY DIALYSIS / AQUARIUMS
Western Water uses chloramines to disinfect its drinking water. Customers who have unique water quality needs or use specialized home treatments, such as kidney dialysis machines, should make the necessary adjustments to remove chloramines. Like chlorine, chloramines are toxic to dialysis water. Customers who have fish tanks in their homes or businesses should also take precautions to remove chloramines prior to adding water to tanks. Effective treatments include using granular activated carbon filters or chemicals specifically designed to remove chloramines.
MEASUREMENT TERMS
Maximum Contaminant Level (MCL): The highest level of a contaminant that is allowed in safe drinking water. Primary MCLs are set as close to the (PHGs) (or MCLGs)-as is economically and technologically feasible. Secondary MCLs are set to protect the odor, taste and appearance of drinking water. The standards listed in our water quality table are the most conservative set by the State. Individual measurements above a primary or secondary MCL listed in the table do not indicate an exceedance of the regulatory standard.
Maximum Contaminant Level Goal (MCLG): The level of a contaminant in drinking water below for which there is no known or expected risk to health. MCLGs are set by the U.S. Environmental Protection Agency.
Maximum Residual Disinfectant Level (MRDL): The highest level of a disinfectant allowed in drinking water. Adding a disinfectant is necessary to control microbial contaminants.
Maximum Residual Disinfectant Level Goal (MRDLG): The level of a drinking water disinfectant below for which there is no known or expected risk to health. MRDLGs do not reflect the benefits of using disinfectants to control microbial contaminants.
Notification Level (NL): Notification levels are health-based advisory levels established by DDW for chemicals in drinking water that lack MCLs.
Primary Drinking Water Standards (PDWS or Primary Standards): MCLs, MRDLs, and treatment techniques (TTs) for contaminants that affect health, along with their monitoring and reporting requirements and water treatment requirements.
Public Health Goal (PHG): The level of a contaminant in drinking water below for which there is no known or expected health risk. PHGs are set by the California Environmental Protection Agency.
Regulatory Action Level (AL): The concentration of a contaminant, which, if exceeded, triggers treatment or other requirements that a water system must follow.
Treatment Technique (TT): A required process intended to reduce the level of a contaminant in drinking water.
ABBREVIATIONS
CCRDL Consumer Confidence Report Detection Level
DLR Detection Limits for Purposes of Reporting
HAA5 Sum of Five Regulated Haloacetic Acids (HAAs): Monochloroacetic Acid, Monobromoacetic Acid, Dichloroacetic Acid, Dibromoacetic Acid, and Trichloroacetic Acid
HAA6Br Sum of Bromochloroacetic Acid, Bromodichloroacetic Acid, Dibromoacetic Acid, Dibromochloroacetic Acid, Monobromoacetic Acid, and Tribromoacetic Acid
HAA9 Sum of Bromochloroacetic Acid, Bromodichloroacetic Acid, Chlorodibromoacetic Acid, Dibromoacetic Acid, Dichloroacetic Acid, Monobromoacetic Acid, Monochloroacetic Acid, Tribromoacetic Acid, and Trichloroacetic Acid
LRAA Locational Running Annual Average
MCL Maximum Contaminant Level
MCLG Maximum Contaminant Level Goal
MRDL Maximum Residual Disinfectant Level
MRDLG Maximum Residual Disinfectant Level Goal
NA Not Applicable
ND Not Detected at or above CCRDL, DLR, or RL
NL Notification Level
No Data No data for reporting year and/or previous 9 years.
NR No Range
PHG Public Health Goal
RAA Running Annual Average
RL Reporting Limit (Laboratory)
TT Treatment Technique
µg/L micrograms per liter
mg/L milligrams per liter
ng/L nanograms per liter
pCi/L picocuries per liter (a measure of radioactivity)
µS/cm microSiemen per centimeter
NTU Nephelometric Turbidity Units
2022 Annual Water Quality Report 14
FOOT NOTES
(a) The Riverside service area benefits from multiple sources of groundwater, including the Arlington Basin (through Western Water’s Arlington Desalter), the Bunker Hill Basin (provided by the City of Riverside), and the Chino Basin (supplied by the Chino Desalter Authority). These groundwater sources complement the imported surface water received from the Henry J. Mills Water Filtration Plant, operated by the Metropolitan Water District, that is sourced from the California State Water Project. To provide an accurate representation, the reported averages for the Riverside service area groundwater encompass the collective average of all groundwater sources distributed throughout the reporting year within the service area. Similarly, the reported ranges for the Riverside service area groundwater capture the entire spectrum of groundwater sample results obtained from the various sources within the service area.
(b) The Murrieta service area benefits from multiple sources of groundwater, including the Temecula Valley Basin (through Western Water’s groundwater wells) and the Elsinore Valley and San Jacinto Basins (provided by Eastern Municipal Water District). These groundwater sources complement the imported surface water received from the Robert A. Skinner Water Filtration Plant (operated by the Metropolitan Water District) and Hemet Water Filtration Plant and Perris Water Filtration Plant (operated by Eastern Municipal Water District). These surface water contributions are sourced from the California State Water Project and the Colorado River. To provide an accurate representation, the reported averages for the Murrieta service area encompass the collective average of all sources distributed throughout the reporting year within the service area for each respective source type (groundwater or surface water). Similarly, the reported ranges for the Murrieta service area capture the entire spectrum of sample results obtained from the various sources within the service area.
(c) The Rainbow Service Area only receives imported water from Metropolitan Water District’s Robert A. Skinner Water Filtration Plant, that is sourced from the California State Water Project and Colorado River.
(d) The turbidity level in the combined filter effluent at Mills and Skinner Filtration plants must be less than or equal 0.3 NTU in 95% of monthly measurements, with no readings exceeding 1 NTU. Similarly, the Hemet and Perris Water Filtration plants must maintain a turbidity level less than or equal 0.1 NTU in 95% of monthly measurements, with no readings exceeding 1 NTU.
(e) Compliance with the State MCL is based on a RAA. No MCL exceedance occurred.
(f) The CCRDL is based on the United States Environmental Protection Agency (EPA) Fifth Unregulated Contaminant Monitoring Rule (UCMR5) minimum reporting levels (MRLs) for 25 EPA 533 constituents.
(g) Notification and response levels for perfluorohexanesulfonic acid (PFHxS) were issued by the California State Water Resources Control Board on October 31, 2022. Reported data reflects sampling completed for 2022 (January-December), with some results occurring prior to the adoption of the notification level.
(h) The average and range reported are based on only a single water source since only one water source was sampled for the reported constituent.
(i) Total coliform compliance is determined based on the total number of monthly samples collected. For a water system collecting at least 40 samples per month (Riverside system), the treatment technique (TT) trigger is set at 5% of monthly samples being positive. For a water system collecting fewer than 40 samples per month (Murrieta and Rainbow systems), the treatment technique (TT) trigger is set at one positive monthly sample.
(j) Turbidity is a measure of the cloudiness of the water. High turbidity can hinder the effectiveness of disinfectants. We monitor it because it’s a good indicator of water quality and the effectiveness of filtration systems, where used.
(k) This data was from the Fourth Unregulated Contaminant Monitoring Rule (UCMR4) program that was conducted in 2018 through 2019.
15 2022 Annual Water Quality Report

 Powered by Water. Driven by Service.