increase in crashes during the Winter months with December and January the most (13) followed by November (12) (See Figure 37).
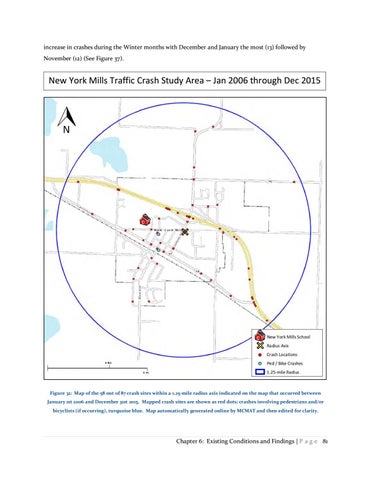
New York Mills Traffic Crash Study Area – Jan 2006 through Dec 2015
Figure 32: Map of the 58 out of 87 crash sites within a 1.25-mile radius axis indicated on the map that occurred between January 1st 2006 and December 31st 2015. Mapped crash sites are shown as red dots; crashes involving pedestrians and/or bicyclists (if occurring), turquoise blue. Map automatically generated online by MCMAT and then edited for clarity.
Chapter 6: Existing Conditions and Findings | P a g e 81


