11 minute read
Parent Surve y – S elect Qu estions


Other results included:
The school bus was the most frequently used mode of travel to and from school, followed by the family vehicle. Distance was the main reason parents do not allow their children to walk or bicycle to/from school. Safety factors, such as amount of traffic and speed of traffic, were cited more frequently by parents as barriers preventing their children walking or biking to school, more so than crime or violence. A vast majority of parents (71 percent) believe that New York Mills Schools neither support nor actively encourage children to walk and bike to and from school. A vast majority of parents (80 percent) believe that walking and biking to and from school is, in some degree, healthy for their child. 45 percent believe it to be healthy and 35 percent very healthy.
PARENT SURVEY – SELECT QUESTIONS
For the complete Parent Survey results, see Appendix A.
The New York Mills Elementary School serves grades PreK-6. In September 2014, 250 parent surveys were distributed, which exceeds the total school enrollment of 184 students at that time. Of that 250, 71 surveys were returned, met the criteria to be entered in the National Centers’ database, and are included in this
report. Also, 50 parent surveys were distributed to students in grades 7-12 with 19 being returned and deemed eligible to be entered into the database. It should again be noted that the New York Mills Elementary and High Schools share the same location and building. Results of all 90 parent surveys from grades PreK-12 have been included in this one analysis.
P a g e 90 | Chapter 8: Standardized SRTS Survey Analysis
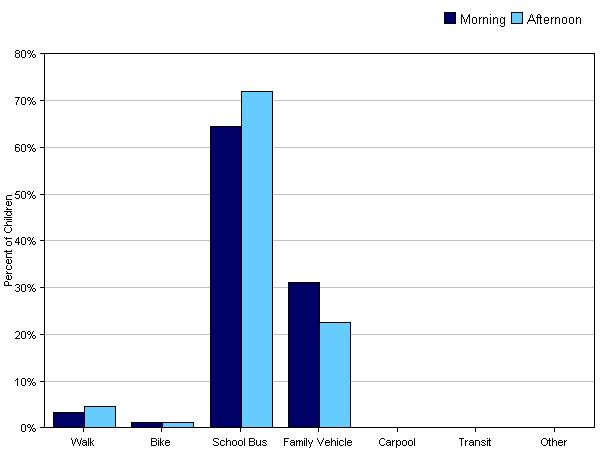
Question – On most days, how does your child arrive and leave for school?
A comparison of a child’s typical travel mode of arrival at and departure from school, as reported by parents, is shown in Figure 38 and Table 8. The survey is structured so that parents can give an answer for both how their child arrives at school and then leaves from school. Based on the parent responses, the school bus was the most common mode of travel both to and from school representing 64 percent and 72 percent of all trips, respectively. The second most frequently chosen mode for travel to and from school was the family vehicle at 31 percent and 22 percent, followed by walking at three and four percent. Students riding a bike represented just one percent of the travel mode share in both the mornings and afternoons.
There is a slight change in travel modes chosen for school departure compared to arrival. There is a switch from the family vehicle to the school bus and walking in the afternoon. It is believed that this mode switch happens because it is easy for parents to drive children to school as they are headed to work. In the afternoon, parents are at work when students are dismissed and students can take their time getting home. Bike mode share for students does not vary between mornings and afternoons as it stands to reason that students will need to ride their bikes home if they wish to ride to school the next day. These mode share results with the switch away from family vehicle in the afternoon are typical of what has been observed at other schools and school districts in west central Minnesota.
When compared to the 2013 national SRTS combined walk and bike mode share numbers of 15.2 percent in the morning and 18.4 percent in the afternoon, the percentages of elementary students walking and bicycling to and from the New York Mills School (four percent morning, five percent afternoon) are below the average. 21
21
The National Center for Safe Routes to School. Trends in Walking and Bicycling to School from 2007 to 2013. March, 2015. Available at http://saferoutesinfo.org/sites/default/files/SurveyTrends_2007-13_final1.pdf. Accessed on April 1, 2016.
Chapter 8: Standardized SRTS Survey Analysis | P a g e 91
Figure 38: Typical mode of arrival at and departure from school (Fall 2014)
Table 78: Typical mode of arrival at and departure from school (Fall 2014)
No Response Morning: 0 No Response Afternoon: 1 Percentages may not total 100% due to rounding.
P a g e 92 | Chapter 8: Standardized SRTS Survey Analysis
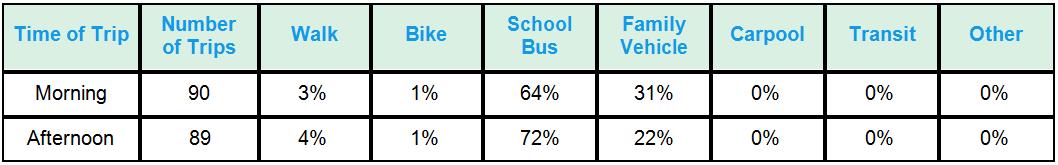
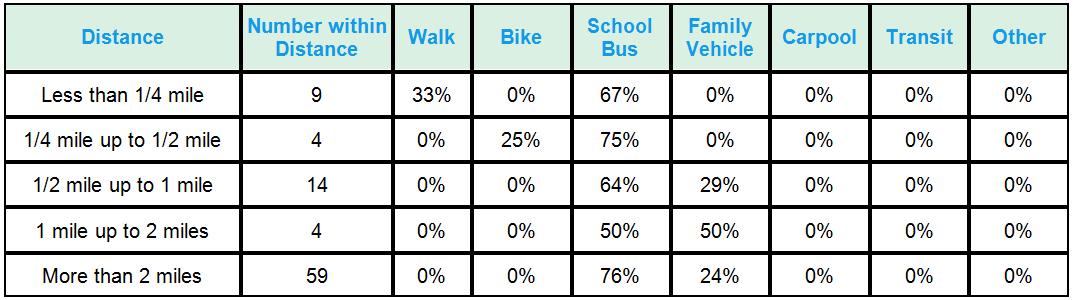
Question – How far does your child live from school?
Parents were asked to give the distance from their home to the school. This question is asked in a way so that parents likely estimate that distance. These results are shown in Table 9. This is recorded because parents’ estimation will have an effect on their mode choice for their child. Often parents will overestimate that distance and drive their child to school when walking and/or biking is a viable, safe and timely alternative.
Table 89: Parent estimate of distance from the child’s home to school.
Don't know or No response: 0 Percentages may not total 100% due to rounding.
Cross-reference – Distance, by arrival and departure modes
These estimated distances are then cross-referenced with actual arrival and departure mode choice (Tables 10 and 11).
Table 910: Parent estimate of the distance from child’s home to school and mode choice to school (Fall 2014).
School Arrival
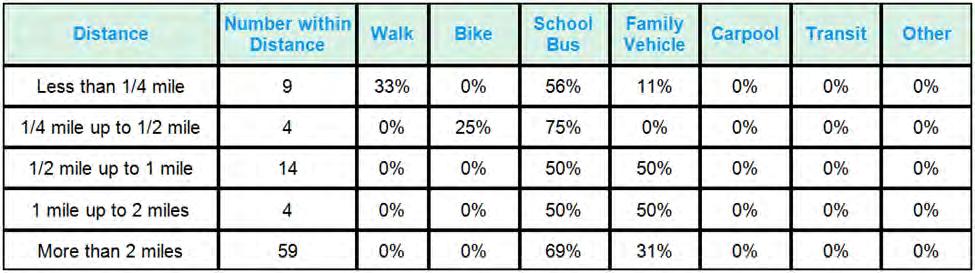
Don't know or No response: 0 Percentages may not total 100% due to rounding.
Chapter 8: Standardized SRTS Survey Analysis | P a g e 93
Table 1011: Parent estimate of the distance from child’s home to school and mode choice from school (Fall 2014).
School Departure
Don't know or No response: 0 Percentages may not total 100% due to rounding.
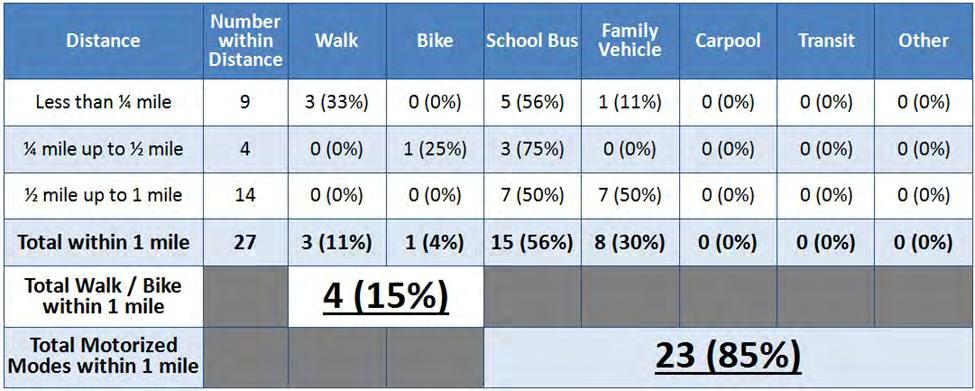
Mode analysis within the Walk / Bike Zone, arrival and departure modes
According to the MnDOT Walk / Bike Zone concept, one-half mile is considered an appropriate distance for students in grades PreK through Fifth to walk and/or bike to and from school, for grades 6-8, it is one mile and for grades 9-12, the acceptable distance is one and one-half miles. Even though these results are from parents with students in grades K-12, for the sake of this exercise, only those living within a perceived one mile will be considered within the Walk / Bike Zone. At least among the parents who returned the survey, no students living within a perceived one to two mile distance of the New York Mills schools walked or biked to or from school.
Further WCI staff analysis of the parent survey data shows that just 15 percent of children, who lived within one mile of the school, walked and/or biked to school in the morning (Table 12) and that rate remains the same in the afternoon (Table 13). For students living within one mile of the school, use of the school bus and family vehicle to travel to and from school was likely due to habit and convenience posed by both modes, the perceived and/or real dangers posed by automobile traffic on the streets of New York Mills, and/or the heavy amount of rail freight traffic on the BNSF railway. However this also reveals that there is a great deal of potential to get more students walking and biking to and from the New York Mills School.
P a g e 94 | Chapter 8: Standardized SRTS Survey Analysis
Table 1112: School arrival modes for K-12 students (raw numbers and percent) living within one mile of the New York Mills School.
Percentages may not total 100% due to rounding.
Table 1213: School departure modes for K-12 students (raw numbers and percent) living within one mile of the New York Mills School.

Percentages may not total 100% due to rounding and/or * reporting error.
Chapter 8: Standardized SRTS Survey Analysis | P a g e 95
Question – What of the following issues affected your decision to allow, or not allow, your child to walk or bike to/from school?
Parents were asked to identify issues affecting their decision to allow, or not allow, their child to walk or bike to and from school. Parents were given a list of options to choose from, with the ability to select as many reasons they felt applied. The results from this question were then split by whether parents did allow their child to walk or bike to and from school, or did not.
Figure 39 illustrates the issues affecting the decisions of the 75 parents that do not allow their child to walk or bike both to and from school. For those parents, the top four issues affecting their decision are “distance” (87 percent), “speed of traffic along route” (60 percent), “amount of traffic along route” (57 percent), and “sidewalks or pathways” (57 percent.) The four least frequently cited issues are the “convenience of driving” (35 percent), a lack of “crossing guards” (33 percent), “child’s participation in after school programs” (32 percent), and the lack of “adults to bike/walk with” (29 percent).
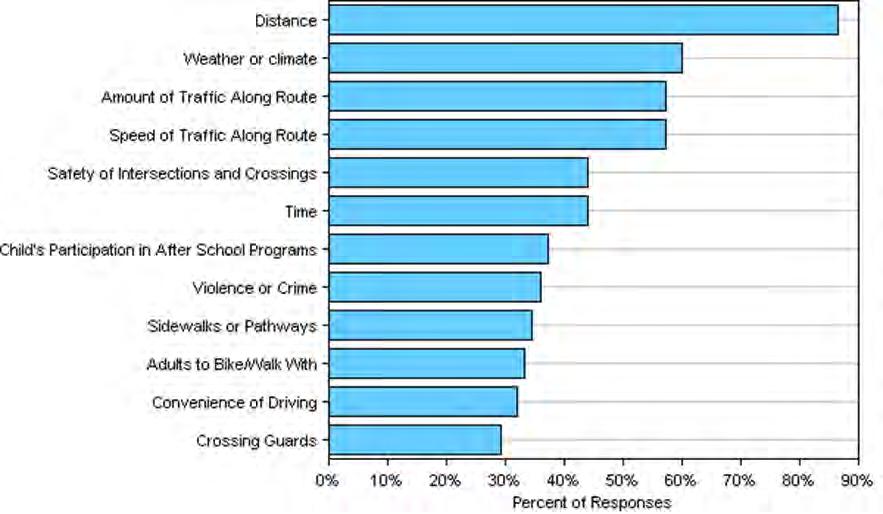
Figure 39: Issues reported to affect the decision to not allow a child to walk or bike to/from school by parents of children who do not walk or bike to/from school (Fall 2014).
P a g e 96 | Chapter 8: Standardized SRTS Survey Analysis
Figure 40 illustrates the results for the four parents who allow their children to walk or bicycle to and from school. The top two issues affecting their decisions (tied at 75 percent) are “distance” and “weather or climate,” followed these five reasons (tied at 50 percent) “amount of traffic along route,” “Child's Participation in After School Programs,” “violence or crime,” “sidewalks or pathways” and “convenience of driving.” Finally, these five reasons were the least cited (tied at 25 percent), “speed of traffic along route,” “safety of intersections and crossings,” “time,” “adults to bike/walk with” and “crossing guards.”
Note: Because of the low response rate from parents that do allow their children to walk and bike to school (four), the results from this question are likely not statistically significant and should not be compared to the general population of parents that do allow their children to walk and bike to school.
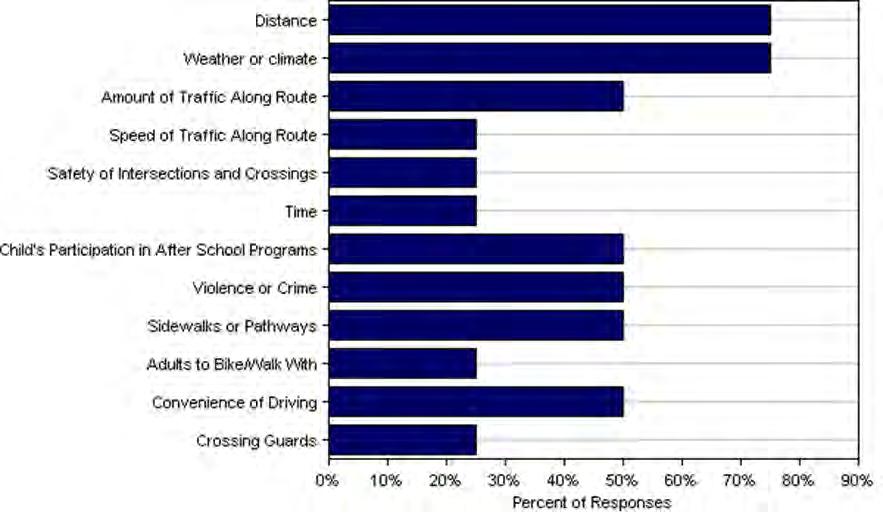
Figure 40: Issues reported to affect the decision to allow a child to walk or bike to/from school by parents of children who already walk or bike to/from school (Fall 2014).
Chapter 8: Standardized SRTS Survey Analysis | P a g e 97
Parent Comments
School Survey ID Comment
NewYork Mills ElementarySchool
NewYork Mills ElementarySchool
NewYork Mills ElementarySchool
NewYork Mills ElementarySchool
NewYork Mills ElementarySchool
NewYork Mills ElementarySchool
NewYork Mills ElementarySchool
NewYork Mills ElementarySchool
NewYork Mills ElementarySchool 1247604 We live too far inthe country.
1247633
1247649
1247652
1247835
1247842 A lot of this would be more of a concern if we lived closer. But I do want this to improve as we would like to move closer in the future.
We live in Bluffton, MN so my children live too far away to walk or bike. If we lived really close to school, they would/would.
Would love to have her commute every day to and fromschool either bike or walk. However sidewalk is in bad shape and intersection is dangerous and with out a high schooler, I will not let her make trip by herself.
Streets do not have sidewalks, which is the main reason my children do not walk to school.
Mostly worriedabout the short section of HWY he would have to bike along (speed limit 55) second worry is the high school kids driving/texting on their way to school.
1247846 Questions 9-14 I am not going to answer because he rides the bus.
1247856
1247862 I am glad the school provides a bus. I would not let my children walk without one of us (parents) accompanyingthem.
If there was ever an event where time wasn't crucial, I would allow my children to have an opportunity to walk a fewblocks to arrive at school if bus and school could nominate a locationto dropoff to or fromschool.
NewYork Mills ElementarySchool
NewYork Mills ElementarySchool 1247867 K-2 is awful young to allowa child to walk to school, no matter what the distance.
1247870 I live to far out in the country to even let my child do this.
School Survey ID Comment
NewYork Mills Secondary 1253215 Multiple boxes marked on purpose, the kids have an hour bus ride both ways - don't allow younger kids to ride in car with older kids.
NewYork Mills Secondary
NewYork Mills Secondary 1253220 Answers totally depend on distance fromschool.
1253232 We live 5 miles from school so never would my kids walk or bike to school.
P a g e 98 | Chapter 8: Standardized SRTS Survey Analysis


