4 minute read
Student Tra vel Ta lly – Se lect Que stions


STUDENT TRAVEL TALLY – SELECT QUESTIONS
For complete Stu dent Trav el Ta lly res ults , see App endix B .
Note! T he stu dent tra vel tal lie s origina lly done in October 2 01 4 only recorded morning travel modes w hich w as inconsistent w it h t he National C enters for SRTS tal ly protocols. Si nce production of t hi s plan wa s dela yed d ue to a chang e in staff ing at WCI, it w as f elt that it wo uld be be st to de lay the f inal production of t his plan to includ e a proper admin istere d st udent trave l tally . T he ta lly res ults belo w ar e from Febr uary 2 017 .
STUDENT TRAVEL TALLY : NEW YORK MILLS SCHOOL – ELEMENTARY STUDENTS
Question – How did you arrive at school today? How do you plan to leave for home after school?
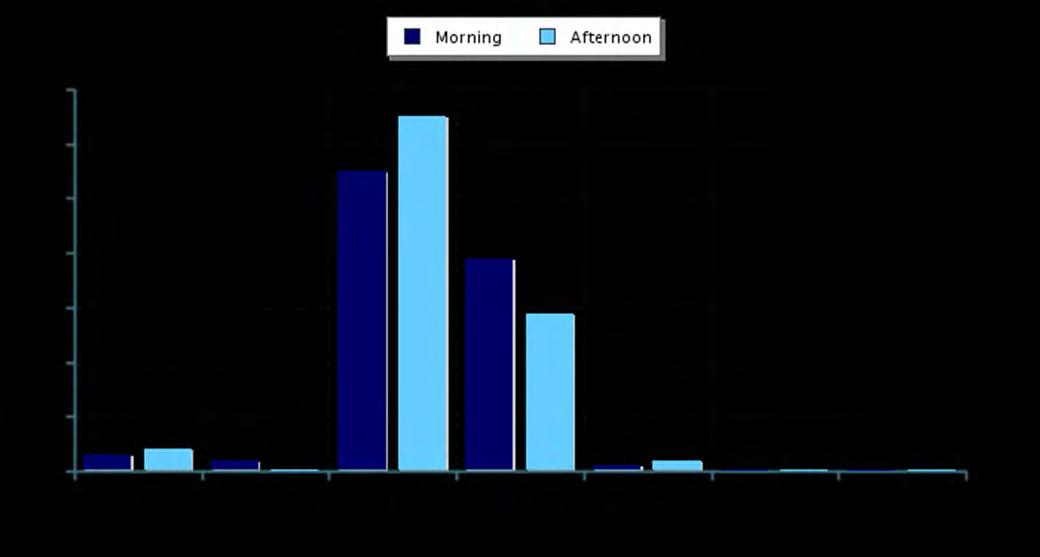
The student travel tally for the elementary students recorded 1143 trips in the morning and 1081 in the afternoon. This is a large sample size that will have a degree of statistical significance. Travel mode results from the student travel tally match up fairly well with the travel mode results from the parent survey with the typical shift to the school bus in the afternoon from the family and walking to a lesser degree.
According to the tally results seen in Figure 41 the combined rate of walking and biking to school in the morning was five percent (three percent walking, two percent biking). This combined rate however then decreased to four percent in the afternoon (four percent walking, zero percent biking). These figures remains below the 2013 national SRTS combined walk and bike mode share of 15.2 percent in the morning and 18.4 percent in the afternoon.
55 percent of students took the school bus in the morning and 65 percent in the afternoon, while 39 percent of students took the family vehicle to school in the morning and 29 percent in the afternoon. There is also a small percentage using a car pool (one percent morning and two in the afternoon) with no other modes being used. This mode shift towards the school bus, car pooling and walking in the afternoon is consistent with patterns seen at other schools. Greater use of a family vehicle in the morning is likely due to the convenience of dropping off students while parents are headed to work.
Chapter 8: Standardized SRTS Survey Analysis | P a g e 99
Morning and Afternoon Travel Mode Comparison
Figure 41: Morning and Afternoon Travel Mode Comparison. Numbers above the bars show percentages of each mode.
STUDENT TRAVEL TALLY :
NEW YORK MILLS SCHOOL – SECONDARY AND HIGH SCHOOL STUDENTS
Question – How did you arrive at school today? How do you plan to leave for home after school?
The student travel tally for the secondary and high school students recorded 639 trips in the morning and 580 in the afternoon. This is a large sample size that will have a degree of statistical significance. Travel mode results from the student travel tally do not match up well with the travel mode results from the parent survey which is likely a reflection of the more advanced maturity level of these students. All modes keep essentially the same shares between morning and afternoons with no shift from the family vehicle in the morning to other modes in the afternoon as is typically seen in other schools often with younger students.
According to the tally results seen in Figure 42 the combined rate of walking and biking to schoo l in the morning was three percent (three percent walking, zero percent biking). This combined rate however then decreased to just two percent in the afternoon (two percent walking, zero percent biking). These figures
P a g e 100 | Chapter 8: Standardized SRTS Survey Analysis
remain below the 2013 national SRTS combined walk and bike mode share of 15.2 percent in the morning and 18.4 percent in the afternoon.
24 percent of students took the school bus in the morning and 23 percent in the afternoon, while 66 percent of students took the family vehicle to school in the morning and 67 percent in the afternoon. There is also a larger percentage using a car pool (seven percent morning and eight in the afternoon) with no other modes used. This lack of a shift between modes in the afternoon is likely a result of the maturity levels of secondary and high school students. The much higher use of the family vehicle in both the morning and afternoon is again likely the result of a greater percentage of high school students driving themselves and possibly friends and siblings to and from school.
Morning and Afternoon Travel Mode Comparison
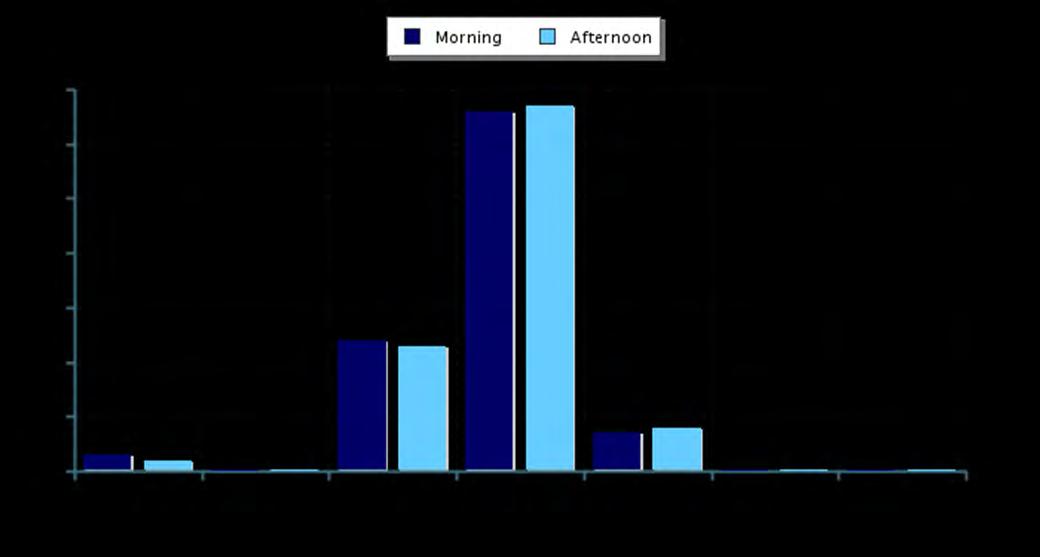
Figure 42: Morning and Afternoon Travel Mode Comparison. Numbers above the bars show percentages of each mode.
Chapter 8: Standardized SRTS Survey Analysis | P a g e 101


