6 minute read
Crash Data


C RA S H D AT A
Crash data with the greatest proximal significance to walking and biking to the New York Mills School was gathered using the online Minnesota Crash Mapping Analysis Tool (MCMAT) (http://www.dot.state.mn.us/stateaid/crashmapping.html). MCMAT is MnDOT’s crash database that includes all crashes involving a motor vehicle where a crash report was filed. It includes only crash reports from the past ten years. However, a crash involving a solo cyclist, the most common type of bicycle crash, would not be recorded even if emergency services responded as long as the crash did not involve a motor vehicle. The MCMAT data for New York Mills was accessed, July 23rd 2016. As of that date, the dataset included crash reports from January 1st 2006 through December 31st 2015, all of which were included in this analysis. According to the MCMAT homepage, the lag time between crash occurrence and data entry into the MCMAT database can be approximately 2-3 months and the data is updated four times per year (approximately quarterly).
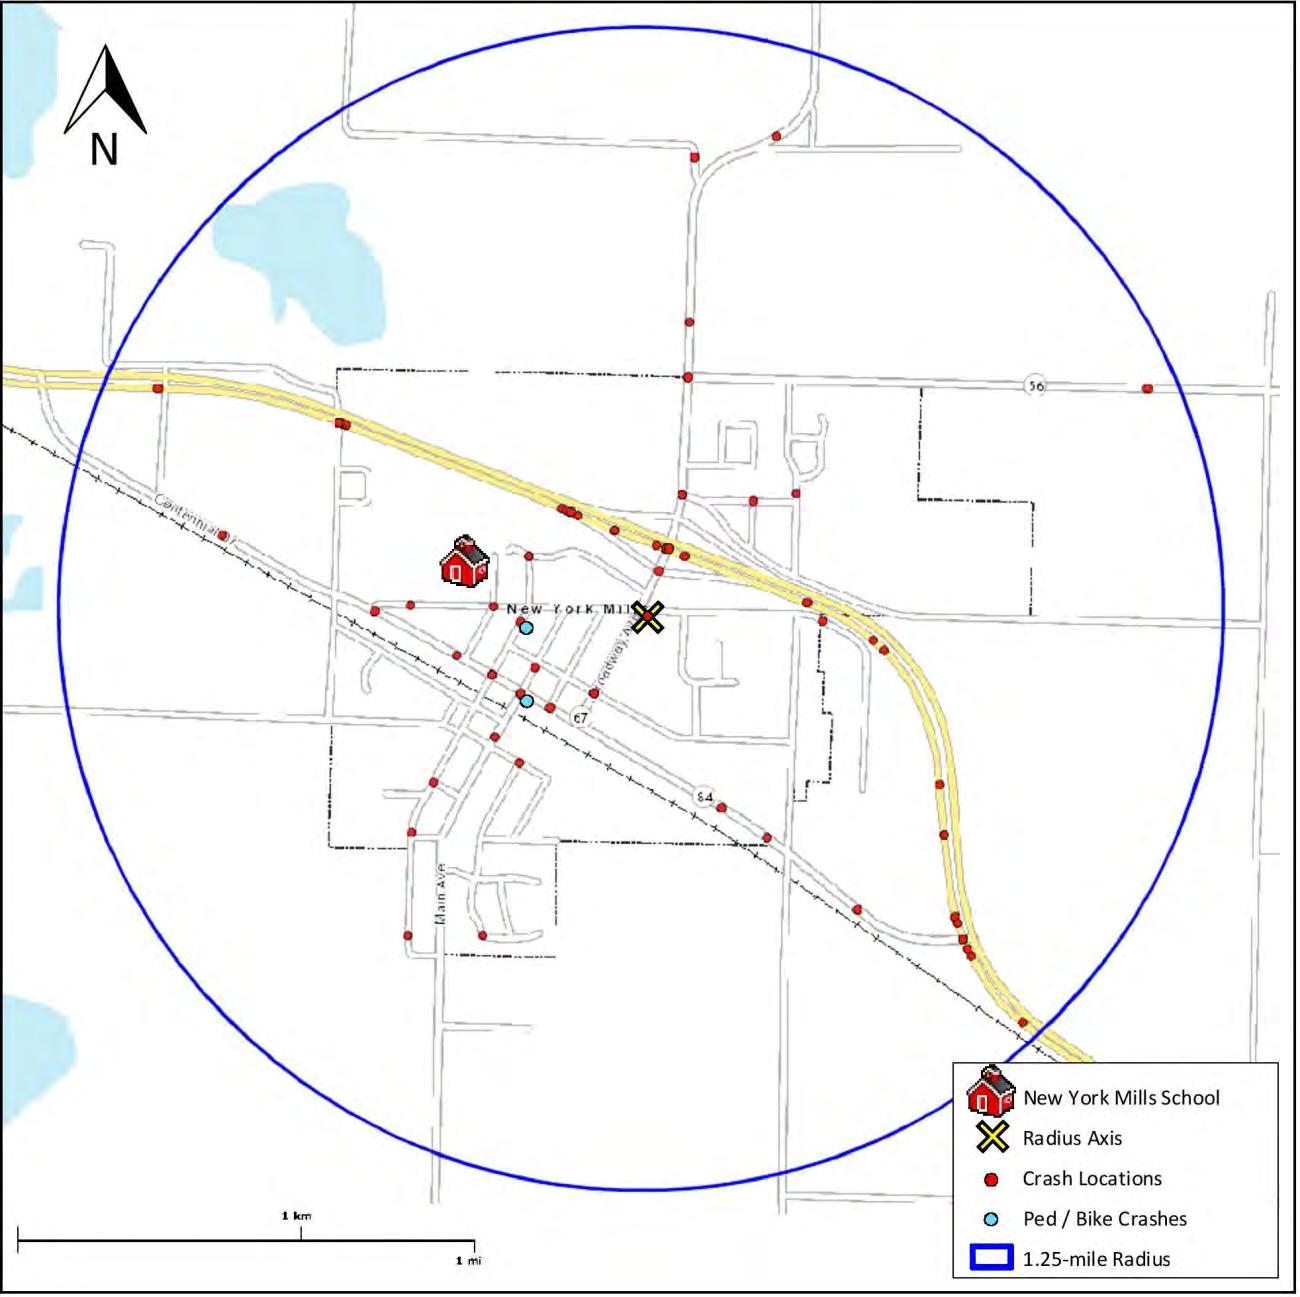
The staff at WCI felt that collecting crash data within a 1.25 mile radius from the intersection of Broadway Avenue and Gilman Street, roughly 1900 feet east of the school building, would provide the most utility. This is the approximate center of New York Mills, as well as relatively proximal to the school. From this center point, a 1.25 mile radius includes all lands within New York Mills city limits and all residences that are within the New York Mills School Walk / Bike Zone.
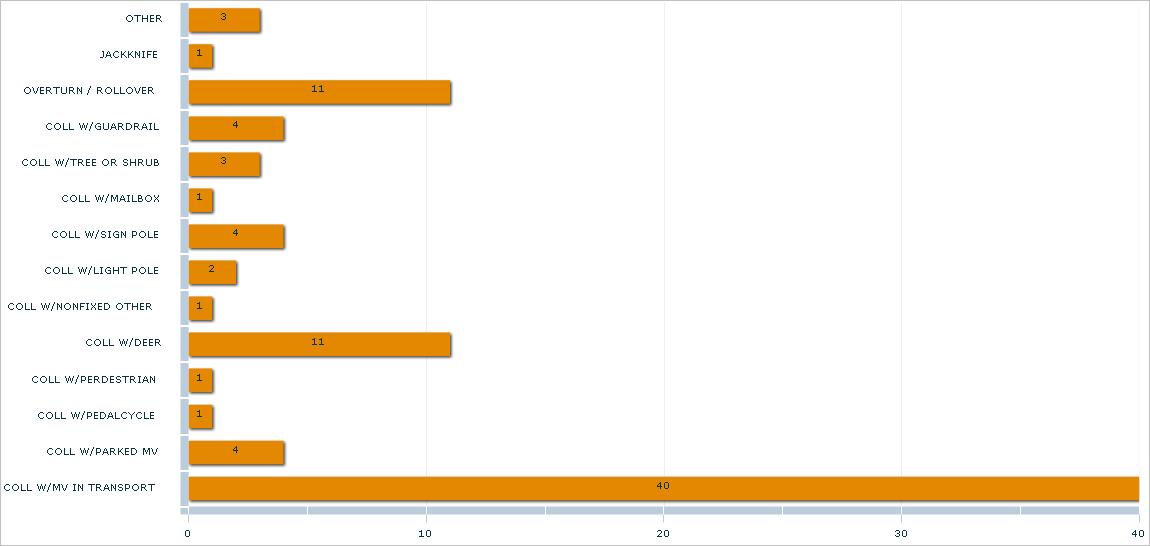
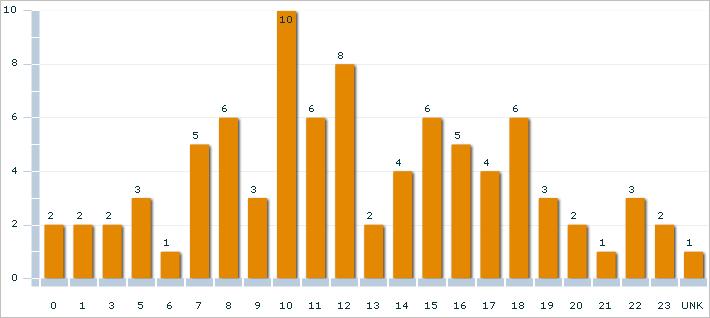
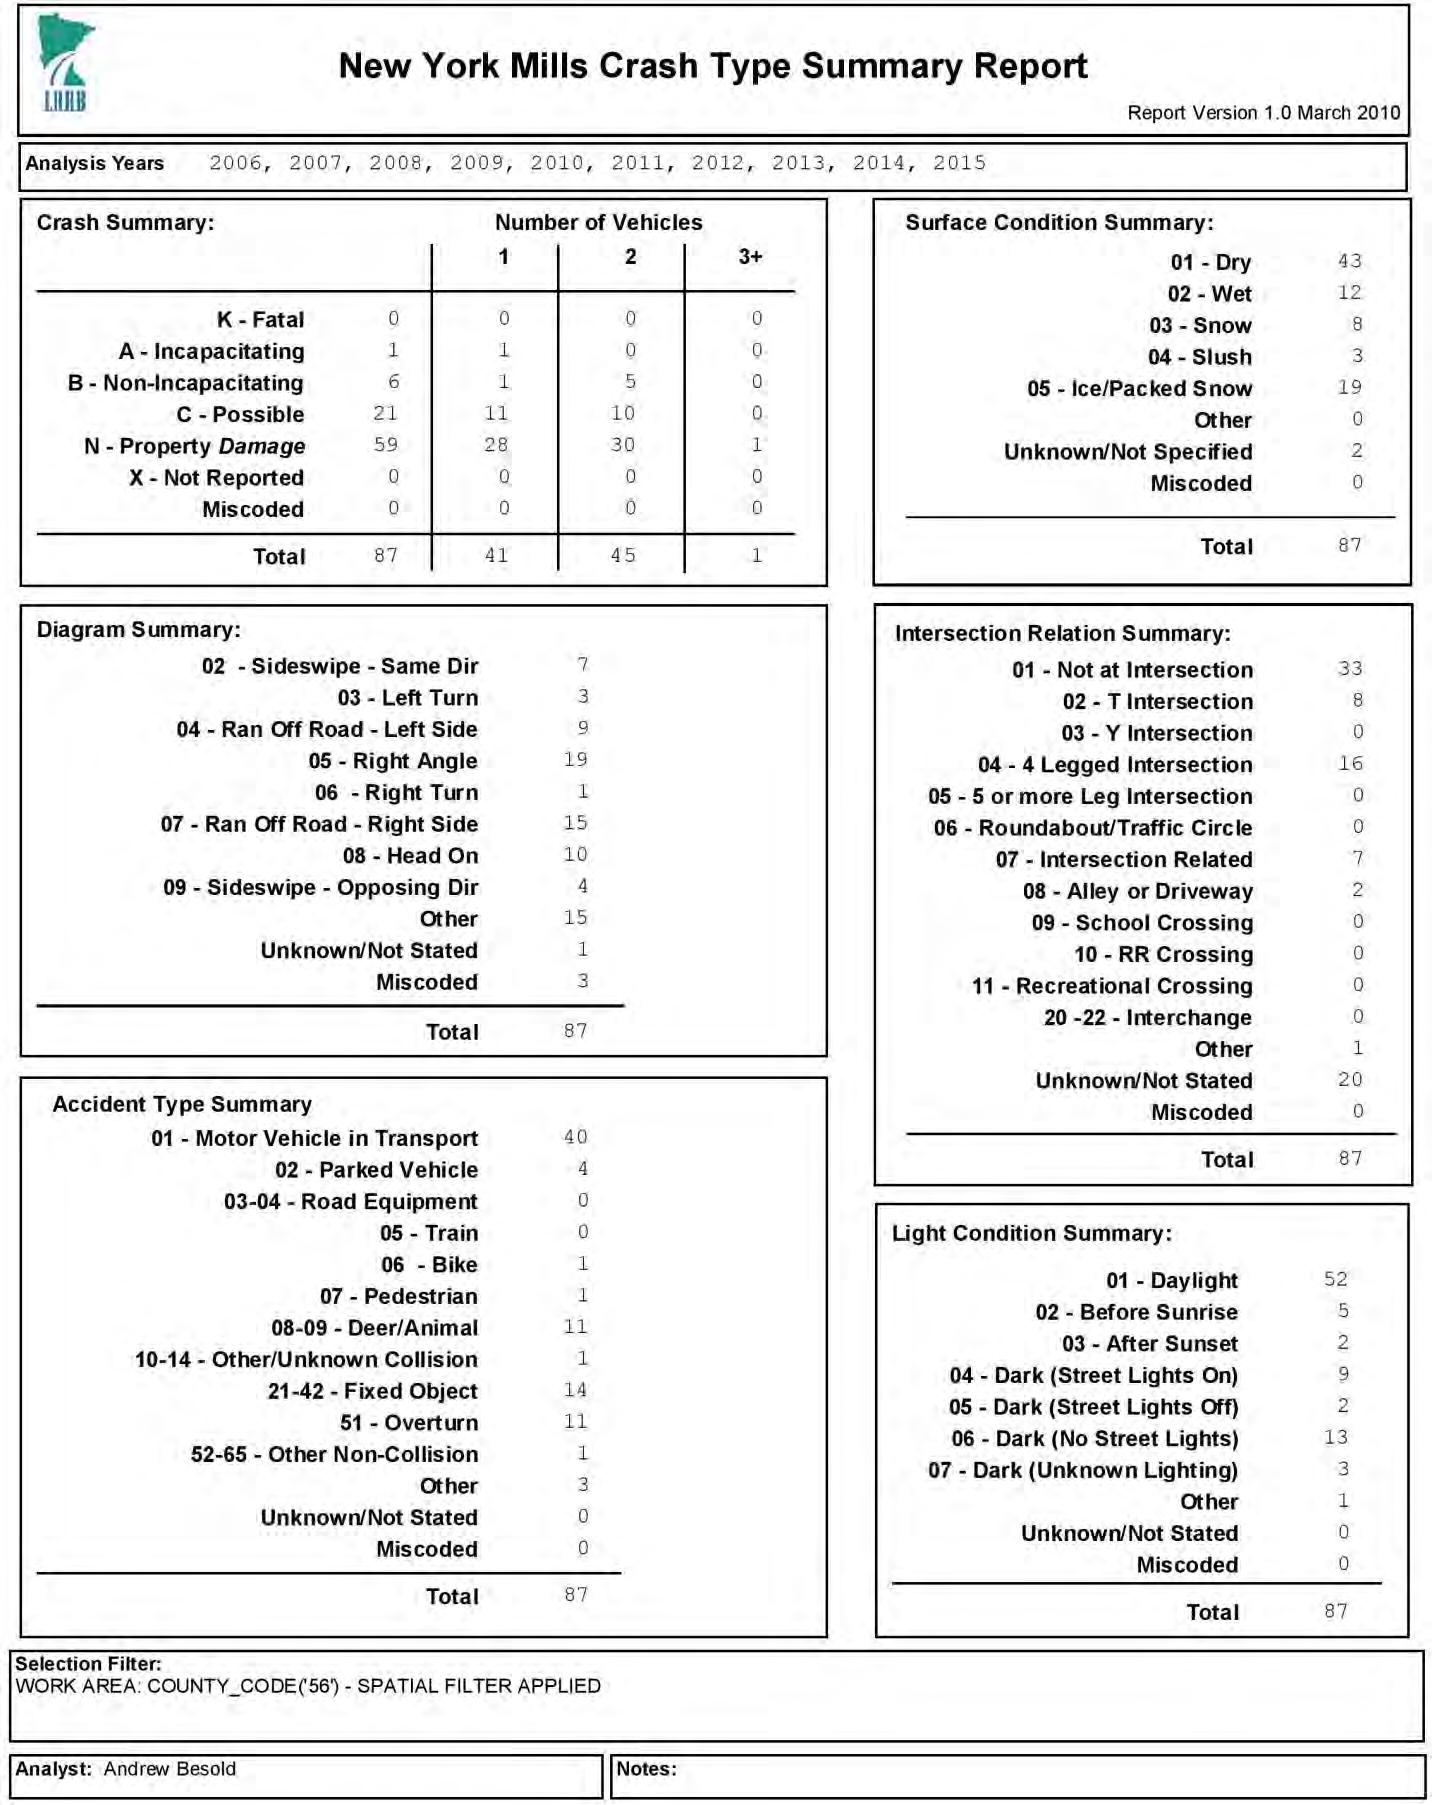
A circle formed by 1.25 mile radius from the above-mentioned center point returns 87 crash reports from the MCMAT dataset. Of the 87, 58 can be seen on the map (see Figure 32). It is not known why 19 crash sites are not shown on the MCMAT generated map. However, it is likely that some of these sites are obscured by other crash dots on the map. Of these 87 crashes, there were no fatalities. There was one crash with an incapacitating injury, six with non-incapacitating injuries, 21 with possible injuries, and 59 crashes involving property damage (see Figure 33). Of the “Crash Types,” 40 of those crashes involved a collision with another motor vehicle in transport, four with a parked motor vehicle, one with a bicycle (resulted in an incapacitating injury presumably to the cyclist - crash summary below), one with a pedestrian (also see crash summary below), 11 with a deer, one as non-fixed other, 14 with a fixed object (guardrail, three/shrub, mailbox, sign pole, light pole, etc.), 11 where a vehicle overturned and one classified as a “jackknife” (see Figure 34). 24 of the 87 crashes happened on U.S. Highway 10 with two more happening on Broadway Avenue but within the U.S. Highway 10 ROW. On average, there were 9 crashes in the selected area per year but only 6 per year off of U.S. Highway 10. There does not appear to be a trend of an increase or decrease in crashes in the study area from 2006 to 2015 (see Figure 35). There was also a noticeable spike of 10 crashes in the 10:00 hour (10AM to 11AM) and another at the 12:00 hour (12PM to 1PM) which seems to not correspond to periods with school traffic (see Figure 36). Finally, there was a noticeable
P a g e 80 | Chapter 6: Existing Conditions and Findings
increase in crashes during the Winter months with December and January the most (13) followed by November (12) (See Figure 37).
New York Mills Traffic Crash Study Area – Jan 2006 through Dec 2015
Figure 32: Map of the 58 out of 87 crash sites within a 1.25-mile radius axis indicated on the map that occurred between January 1st 2006 and December 31st 2015. Mapped crash sites are shown as red dots; crashes involving pedestrians and/or bicyclists (if occurring), turquoise blue. Map automatically generated online by MCMAT and then edited for clarity.
Chapter 6: Existing Conditions and Findings | P a g e 81
New York Mills Crash Type and Number
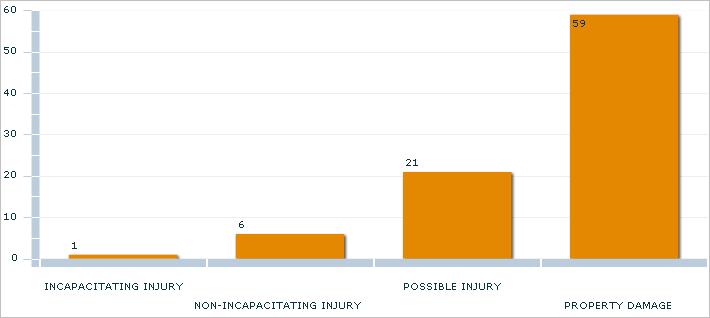
Figure 33: New York Mills Crash Severity - Severity Class and number of crashes in each class. Graph automatically generated online by MCMAT.
Figure 34: New York Mills Crash Type – Crash type and number of each crash type. Graph automatically generated online by MCMAT.
P a g e 82 | Chapter 6: Existing Conditions and Findings
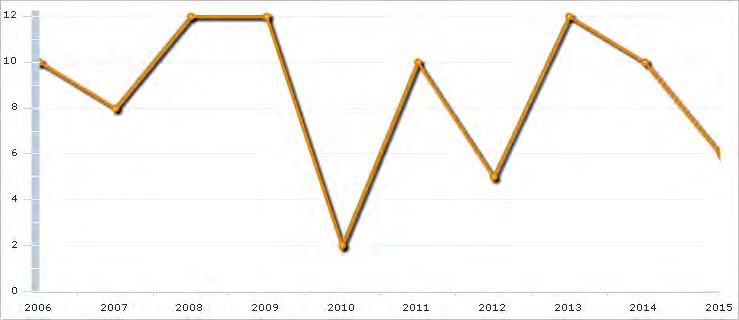
Figure 35: New York Mills crash rate per year. Graph automatically generated online by MCMAT.
Figure 36: New York Mills crashes per hour of the day (24 hour time). Graph automatically generated online by MCMAT.
Chapter 6: Existing Conditions and Findings | P a g e 83
New York Mills Crashes per Month of the Year
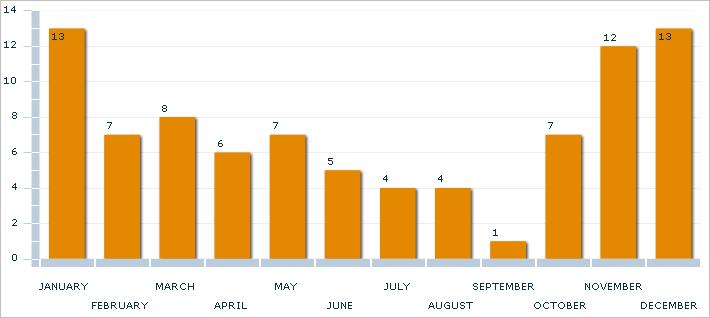
Figure 37: New York Mills crashes per month of the year. Graph automatically generated online by MCMAT.
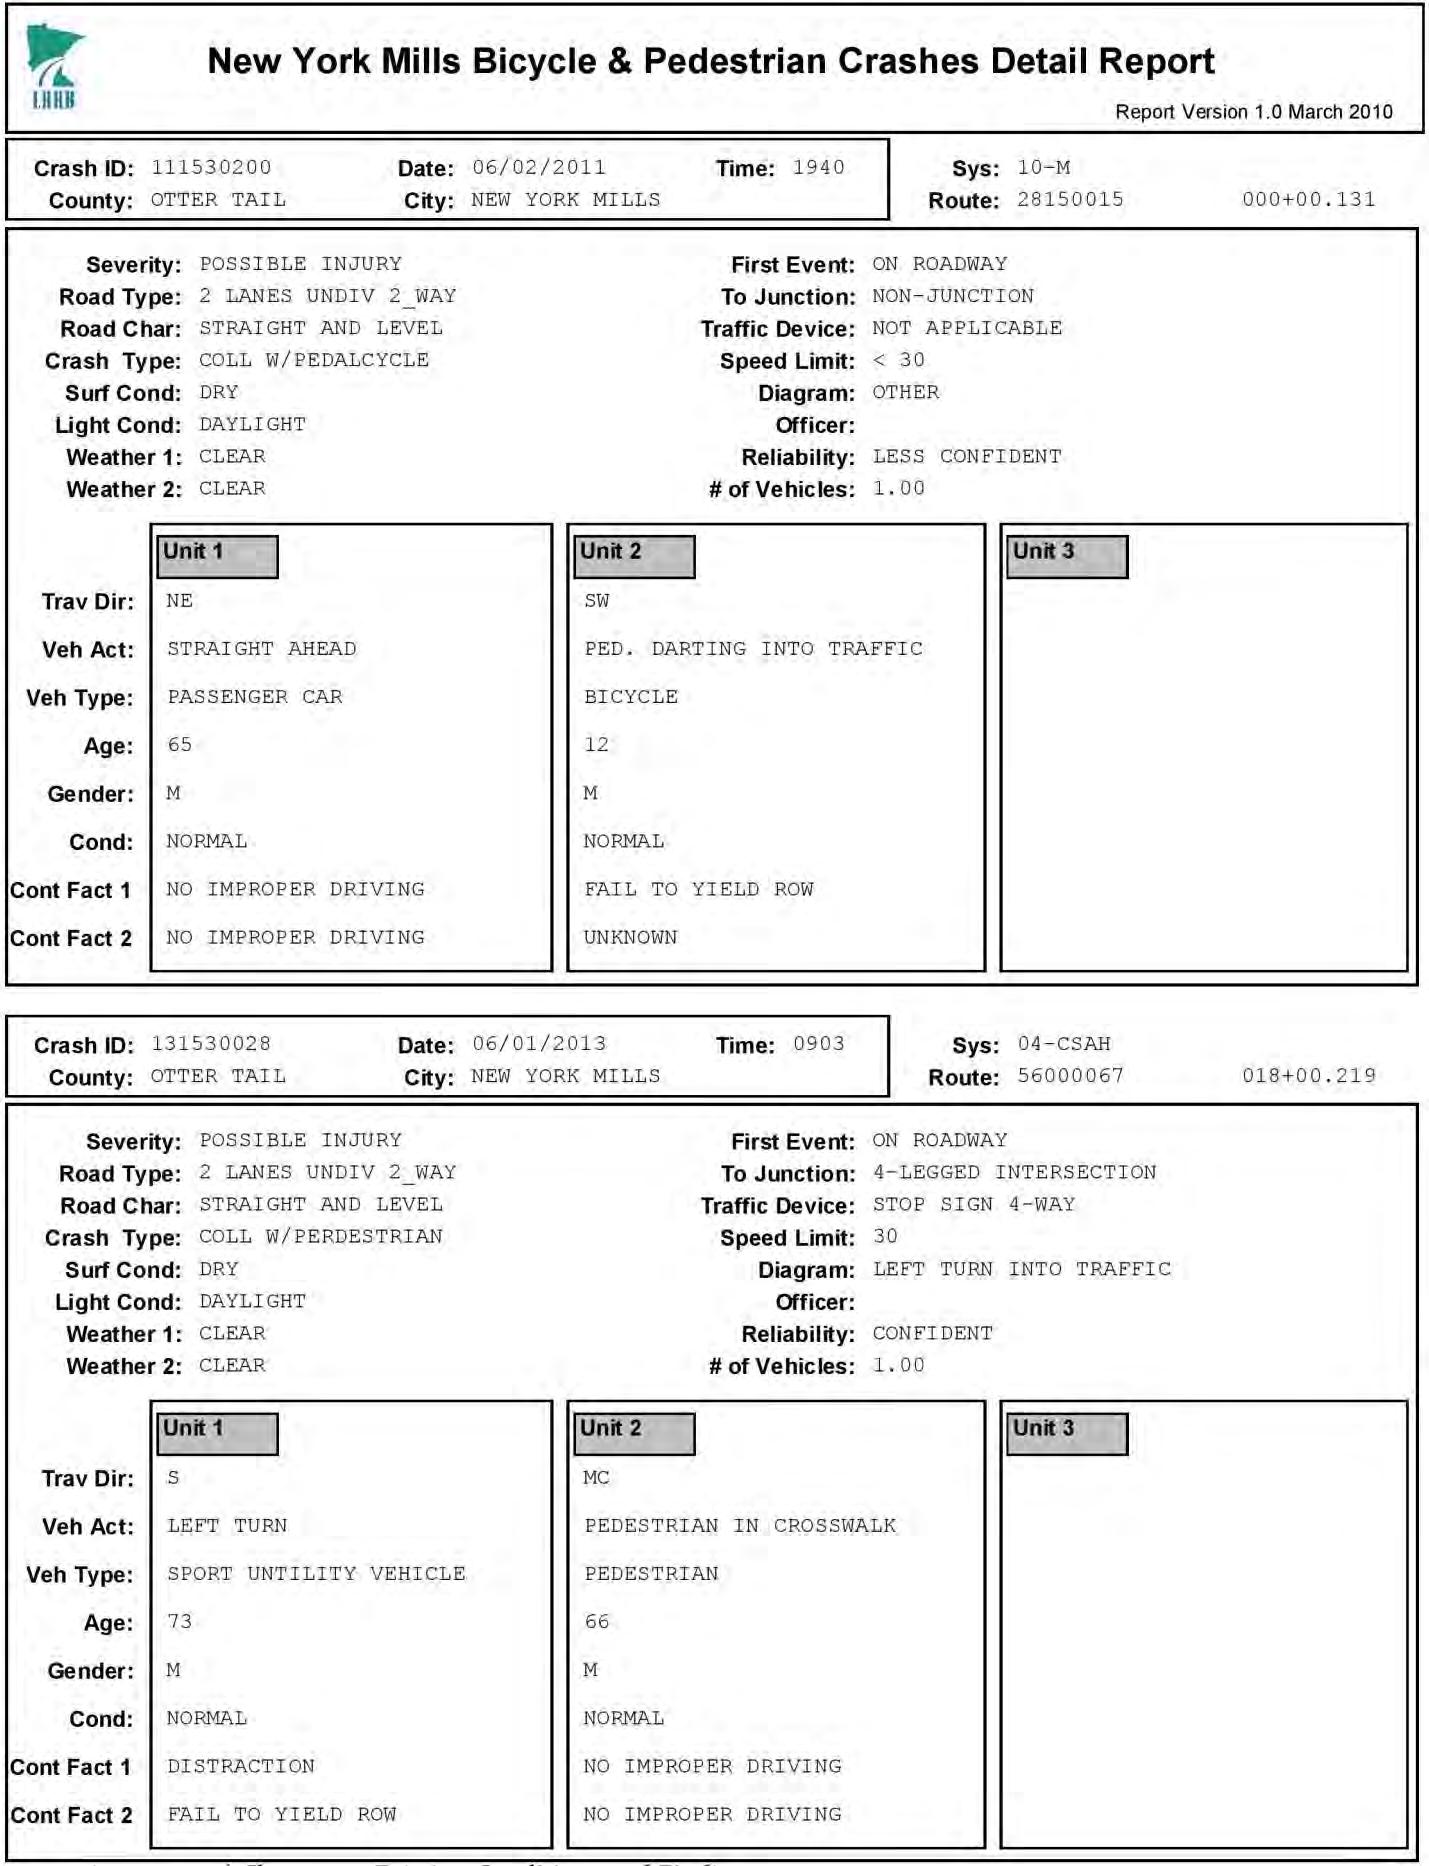
Reported Bicycle and Pedestrian Crashes Based upon infromati0n provided by the MCMAT-generated crash detail report, on June 2, 2008 at 19:40 hours, under dry, daylight conditions, a 12-year-old male on a bicycle was struck on Walker Avenue approximately 175 feet south of Gilman Street by a 65-year-old male driving a passenger car. This is only 600 feet away from the school using the indirect roadway network. It was determined that the 12-year-old male on a bicycle was at fault as he darted out into traffic and failed to yield the right-of-way. It was reported that the 65-year-old male driver was not at fault and exhibited no improper driving.
Also, based upon the MCMAT-generated crash detail report, on June 1, 2011 at 09:03 hours at the intersection of Centennial 84 Drive and Main Avenue, a 66-year-old male pedestrian was struck while in the crosswalk by a 73-year-old male driver of a sport utility vehicle that was making a left turn. The driver was found to be at fault for failing to yield and the pedestrian suffered possible injuries. It is not clear, from the information provided, which of the four crosswalks the pedestrian was in when struck.
Crash Summary and Bicycle and Pedestrian Crash Detail Reports The crash summary report of all the pertinent crash statistics for the selected area around New York Mills is found on the next page of this chapter. The detail reports of the two crashes involving a pedestrian and a bicyclist is titled “New York Mills Bicycle and Pedestrian Crash Detail Report” and is found on the last page of this chapter.
P a g e 84 | Chapter 6: Existing Conditions and Findings
Chapter 6: Existing Conditions and Findings | P a g e 85
P a g e 86 | Chapter 6: Existing Conditions and Findings


