

COMPREHENSIVE SAFETY ACTION PLAN
Draft | March 20, 2024
Initial
WASATCH FRONT REGIONAL COUNCIL COMPREHENSIVE SAFETY ACTION PLAN
Initial Draft Final Report
March 20, 2024
Prepared for:
Prepared by: In


COMPREHENSIVE SAFETY ACTION PLAN 2
Wasatch
41 North Rio Grande Street Salt Lake City, UT 84101 801-363-4250 111 E Broadway Suite 600 Salt Lake City, UT 84111
Partnership with:
Front Regional Council
DRAFT
Statutory Notice
23 U.S.C. § 409: US Code - Section 409: Discovery and admission as evidence of certain reports and surveys
Notwithstanding any other provision of law, reports, surveys, schedules, lists, or data compiled or collected for the purpose of identifying, evaluating, or planning the safety enhancement of potential accident sites, hazardous roadway conditions, or railway- highway crossings, pursuant to sections 130, 144, and 148 of this title or for the purpose of developing any highway safety construction improvement project which may be implemented utilizing Federal-aid highway funds shall not be subject to discovery or admitted into evidence in a Federal or State court proceeding or considered for other purposes in any action for damages arising from any occurrence at a location mentioned or addressed in such reports, surveys, schedules, lists, or data.
DRAFT
COMPREHENSIVE SAFETY ACTION PLAN 3
COMPREHENSIVE SAFETY ACTION PLAN 4
EXECUTIVE SUMMARY ..................................................................................... 11 INTRODUCTION .............................................................................................. 14 Safe Streets and Roads for All Program ...........................................................................................................................14 Safety Action Plan Components 14 Comprehensive Safety Action Plan Study Area ..................................................................................................................16 REGIONAL SAFETY COMMITMENT RESOLUTION ................................................... 21 Safety Commitment Resolution 22 SAFE SYSTEM APPROACH ................................................................................ 24 Introduction to Safe System Approach 24 Safe System Approach Paradigm Shift 25 Safe System Approach Strategies ..................................................................................................................................... 25 Example Safe System Approach Strategies 26 Speed Management: Appropriate Speed Limits for All Road User 27 Intersections: Roundabouts ........................................................................................................................................... 28 Roadway Departures: Wider Edge Lines 29 Pedestrians/Bicyclists: Pedestrian Refuge Islands in Urban and Suburban Areas 30 CSAP PROCESS AND STAKEHOLDER ENGAGEMENT ............................................... 32 Process to Prepare the Comprehensive Safety Action Plan 32 Comprehensive Safety Action Plan Steering Team ............................................................................................................ 32 Stakeholder Engagement .................................................................................................................................................. 33 Safety Launch Webinar 33 Geographic Focus Area Workshops ............................................................................................................................... 33 Regional Stakeholders Workshop 33 WFRC Community Advisory Committee 33 Utah League of Cities and Towns .................................................................................................................................. 34 REGIONAL SAFETY ANALYSIS RESULTS ............................................................. 36 Safety Analysis Methodology Overview 36 SHSP Emphasis Areas Analysis ..................................................................................................................................... 37 Historical Crash Analysis 37 Utah SHSP Emphasis Areas 37 DRAFT
TABLE OF CONTENTS
COMPREHENSIVE SAFETY ACTION PLAN 5 Network Screening Analysis .......................................................................................................................................... 38 High-Risk Network Analysis .......................................................................................................................................... 39 Composite High-Risk Roadway Network 43 WFRC Study Area Analysis Results ................................................................................................................................... 44 SHSP Emphasis Areas Analysis 44 Historical Crash Analysis 45 Emphasis Area Focus Analysis: Intersections, Roadway Departure, Active Transportation ................................................. 48 Intersection Crashes 48 Roadway Departure Crashes 50 Active Transportation/Vulnerable User Crashes ............................................................................................................. 52 GFA Safety Analysis Results and Priorities 54 EQUITY ANALYSIS .......................................................................................... 56 Equity Considerations ....................................................................................................................................................... 56 Federally Defined Equity Areas 56 Locally Defined Equity Priority Index .............................................................................................................................. 56 STRATEGIES AND SOLUTIONS .......................................................................... 64 Strategy Toolbox by Safe System Elements 64 Safety Countermeasures Toolbox ...................................................................................................................................... 64 Countermeasures Effectiveness 64 Safety Priorities and Improvement Case Studies 65 Case Study Project Sheet Overview ............................................................................................................................... 65 Case Study Project Sheets 65 BEST PRACTICES FOR POLICIES AND PROCEDURES ............................................ 76 Benchmarking Process ..................................................................................................................................................... 76 Regional Trends for Safety Policies and Plans 78 Strengths of Regional Safety Policies 78 Gaps in Regional Safety Policies .................................................................................................................................... 79 Highlights of Recommendations 80 Safe Systems Element: Safe Users ................................................................................................................................ 81 Safe Systems Element: Safe Roadways ......................................................................................................................... 82 Safe Systems Element: Safe Vehicles 83 Safe Systems Element: Safe Speeds ............................................................................................................................. 83 Safe Systems Element: Post-Crash Care ....................................................................................................................... 84
DRAFT
COMPREHENSIVE SAFETY ACTION PLAN 6
Figure 1-1 – WFRC Study Area by Jurisdiction .................................................................................................................18 Figure 1-2 – WFRC Study Area by GFA 19 Figure 3-1 – Safe System Approach ................................................................................................................................ 24 Figure 3-2 – Proven Safety Countermeasures – Speed Management 27 Figure 3-3 – Proven Safety Countermeasures – Roundabouts 28 Figure 3-4 – Proven Safety Countermeasures – Wider Edge Lines ................................................................................... 29 Figure 3-5 – Proven Safety Countermeasures – Medians and Refuge Islands 30 Figure 4-1 – CSAP Development Process 32 Figure 5-1 – CSAP Safety Analysis Methodology ............................................................................................................. 36 Figure 5-2 – Roadway Safety Management Process 38 Figure 5-3 – usRAP Star Rating Summary 42 Figure 5-4 – Total Number of Fatal and Serious Injury Crashes by GFA, 2018-2022......................................................... 46 Figure 5-5 – Fatal and Serious Injury Crash Rate by GFA, 2018-2022 46 Figure 5-6 – Fatal and Serious Injury Crashes as Percent of Total Crashes by GFA, 2018-2022 47 Figure 5-7 – Fatal and Serious Injury Crashes as by Roadway Ownership, 2018-2022 ..................................................... 47 Figure 5-8 – Fatal and Serious Injury Crashes by Crash Type, 2018-2022 48 Figure 6-1 – Weber County Equity Index .......................................................................................................................... 58 Figure 6-2 – Weber County Equity Index, Census Tract 200900 ....................................................................................... 59 Figure 6-3 – Davis County Equity Index 60 Figure 6-4 – Salt Lake City Equity Index .......................................................................................................................... 60 Figure 6-5 – Salt Lake County Equity Index, Census Tract 112406 ................................................................................... 61 Figure 7-1 – Crash Modification Factor Calculation 64 Figure 7-2 – Crash Reduction Factor Calculation ............................................................................................................. 64 Figure 7-3 – Countermeasure Toolbox Cost Effectiveness 65 Figure 7-4 – Example Case Study Project Information Sheet, Page 1 66 Figure 7-5 – Example Case Study Project Information Sheet, Page 2 ............................................................................... 67 Figure 8-1 – Fatal and Serious Injury Crashes by Crash Type, 2018-2022 79
LIST OF FIGURES
DRAFT
COMPREHENSIVE SAFETY ACTION PLAN 7
Table 1-1 – SS4A Action Plan Requirements and WFRC CSAP Compliance........................................................................15 Table 1-2 – Jurisdictions by GFA ......................................................................................................................................17 Table 3-1 – Safe System Approach Paradigm 25 Table 3-2 – Proven Safety Countermeasures ................................................................................................................... 26 Table 4-1 – CSAP Steering Team Members 32 Table 5-1 – Composite High-Risk Network 37 Table 5-2 – Crash Profile Risk Assessment Ranking ........................................................................................................ 40 Table 5-3 – Local Street Risk Factors 43 Table 5-4 – SHSP Emphasis Area Comparison Analysis 44 Table 5-5 – Crashes by Severity by Roadway Ownership (2018-2022) ............................................................................. 45 Table 5-6 – GFA Appendix List 54 Table 7-1 – Case Study Project Locations - South Box Elder and North Weber County GFA 68 Table 7-2 – Case Study Project Locations – West Weber County GFA ............................................................................... 68 Table 7-3 – Case Study Project Locations – East Weber & Morgan County GFA 69 Table 7-4 – Case Study Project Locations – Central Weber County GFA 69 Table 7-5 – Case Study Project Locations – Salt Lake City GFA ....................................................................................... 70 Table 7-6 – Case Study Project Locations – North Davis County GFA 70 Table 7-7 – Case Study Project Locations – South Davis County GFA ............................................................................... 71 Table 7-8 – Case Study Project Locations – East Salt Lake Valley GFA ............................................................................. 72 Table 7-9 – Case Study Project Locations – West Salt Lake Valley GFA 73 Table 7-10 – Case Study Project Locations – South Salt Lake Valley GFA .......................................................................... 74 Table 7-11 – Case Study Project Locations – Tooele County GFA....................................................................................... 74 Table 8-1 – Core Elements of Safety Planning 76 DRAFT
LIST OF TABLES
LIST OF ACRONYMS
A Severe Injury Crash
AADT Average Annual Daily Traffic
AASHTO American Association of State Highway and Transportation Officials
B Suspected Minor Injury Crashes
BIL Bipartisan Infrastructure Law
C Possible Injury Crashes
CCR Critical Crash Rate
CMF Crash Modification Factor
CRF Crash Reduction Factor
CSAP Comprehensive Safety Action Plan
EPDO Equivalent Property Damage Only Crash
FHWA Federal Highway Administration
GFA Geographic Focus Area
GIS Geographic Information System
HSM Highway Safety Manual
K Fatal Crashes
O No Injury/PDO Crashes
PHB Pedestrian Hybrid Beacon
SS4A Safe Streets and Roads For All
TWLTL Two-Way Left-Turn Lane
UDOT Utah Department of Transportation
USDOT United States Department of Transportation
WFRC Wasatch Front Regional Council
COMPREHENSIVE SAFETY ACTION PLAN 8
DRAFT
ACKNOWLEDGEMENTS
STEERING TEAM
Ali Avery North Salt Lake City
Britney Ward Sandy City
Dan Bergenthal Salt Lake City
Daniel Gillies Ogden City
David Rodgers Salt Lake County
Jared Stewart Tooele City
Jeff Lewis Utah Department of Transportation
Kip Billings Wasatch Front Regional Council
Matthew Shipp City of Cottonwood Heights
Sheldon Shaw Utah Transit Authority
Amee Rock
PROJECT MANAGEMENT TEAM
Penna Powers
Brent Crowther Kimley-Horn and Associates, Inc.
Kip Billings Wasatch Front Regional Council
Maria Vyas Fehr and Peers, Inc.
Wayne Bennion Wasatch Front Regional Council
COMPREHENSIVE SAFETY ACTION PLAN 9
Wayne Bennion Wasatch Front Regional Council Average Household Size 2.7 Total Equity Index Score 1.81 Equity Priority (High, Medium, Low) High
DRAFT

EXECUTIVE SUMMARY
THIS CHAPTER IS UNDER DEVELOPMENT.
COMPREHENSIVE SAFETY ACTION PLAN 11
DRAFT
THIS CHAPTER IS UNDER DEVELOPMENT.
COMPREHENSIVE SAFETY ACTION PLAN 12
DRAFT

1. INTRODUCTION
INTRODUCTION
Safe Streets and Roads for All Program
Wasatch Front Regional Council (WFRC) prepared this regional Comprehensive Safety Action Plan (CSAP) to present a holistic, welldefined strategy to reduce roadway fatalities and serious injuries in the Wasatch Front Region.
The CSAP analyzes safety needs, identifies high-crash and high-risk locations and factors contributing to crashes, and prioritizes strategies to address them.
The CSAP was prepared with funding from the Safe Streets and Roads for All (SS4A) discretionary program. The Bipartisan Infrastructure Law (BIL) established the SS4A discretionary program to fund improvements and strategies to prevent roadway fatalities and serious injuries of all users of highways, streets, and roadways: pedestrians, bicyclists, public transportation users, motorists, personal conveyance and micro-mobility users, and commercial vehicle operators. The program includes $5 billion in appropriated funds over 5 years, 2022-2026. The SS4A program supports the U.S. Department of Transportation’s (USDOT’s) National Roadway Safety Strategy and a goal of zero roadway deaths using a Safe System Approach
The SS4A programs provides Federal funds for two types of grants:
e Planning and Demonstration Grants are to prepare an Action Plan. Action Plans develop a holistic, well-defined strategy to prevent roadway fatalities and serious injuries in a locality, Tribe, or region.
DRAFT
e Implementation Grants to implement projects and strategies identified in an Action Plan to address a roadway safety problem. Projects and strategies may be infrastructure, behavioral, and/or operational activities. Applicants must have a qualifying Action Plan that meets the eligibility requirements to apply for an Implementation Grant. In addition, applicant agencies must have ownership and/or maintenance responsibilities over a roadway network, safety responsibilities that affect roadways, or an agreement from the agency that has ownership and/or maintenance responsibilities for the roadway within the applicant’s jurisdiction.
This WFRC CSAP meets eligibility requirements that allow local jurisdictions to apply for Implementation Grants from the USDOT SS4A discretionary grant program.
This CSAP was finalized on April 30, 2024, to meet eligibility criteria for the 2024 Notice of Funding Opportunity. The CSAP is posted and publicly available at wfrcsafetyplan.org.
Safety Action Plan Components
An eligible Action Plan is determined by the Self-Certification Eligibility Worksheet.1 The Action Plan requirements are summarized in Table 1-1. The WFRC CSAP serves as the eligible Safety Action Plan to enable local jurisdictions to apply for a SS4A Implementation Grant. The Self-Certification Eligibility Worksheet is included in Appendix A.
1 https://www.transportation.gov/sites/dot.gov/files/2024-02/SS4A-FY24-Self-Certification-Worksheet.pdf
COMPREHENSIVE SAFETY ACTION PLAN 14
ACTION PLAN ELEMENT REQUIRED OR OPTIONAL
The Safety Action Plan must include the three elements:
Analysis of existing conditions and historical trends to baseline the level of crashes involving fatalities and serious injuries across a jurisdiction, locality, Tribe, or region;
1. Safety Analysis: Does the Action Plan include all the following?
Analysis of the location where there are crashes, the severity, as well as contributing factors and crash types;
Analysis of systemic and specific safety needs, as needed (e.g., high risk road features, specific safety needs of relevant road users);
A geospatial identification (geographic or locational data using maps) of higher risk locations.
2. Strategy and Project Selections: does the plan identify a comprehensive set of projects and strategies to address the safety problems in the Action Plan, time ranges when projects and strategies will be deployed, and explain project prioritization criteria?
3. Completion Date: Was the plan finalized and/or last updated between 2019 and April 30, 2024?
Required - This WFRC CSAP completed these requirements.
The CSAP includes a comprehensive safety analysis of historical trends, contributing factors, safety needs, and identification of high-crash and high-risk segments. See Chapter 5
Required - This WFRC CSAP completed these requirements.
The CSAP recommends and prioritizes countermeasures, strategies, and project types to reduce fatalities and serious injuries. See Chapter 6.
Required - This WFRC CSAP was completed on April 30, 2024.
The Safety Action Plan must include at least four of the following six optional requirements:
4. Are both of the following true:
Leadership Commitment: Did a high-ranking official and/or governing body in the jurisdiction publicly commit to an eventual goal of zero roadway fatalities and serious injuries?
DRAFT
Goal: Did the commitment include either setting a target date to reach zero, OR setting one or more targets to achieve significant declines in roadway fatalities and serious injuries by a specific date?
5. Planning Structure: To develop the Action Plan, was a committee, task force, implementation group, or similar body established and charged with the plan’s development, implementation, and monitoring?
6. Engagement and Collaboration: Did the Action Plan development include all the following activities?
e Engagement with the public and relevant stakeholders, including the private sector and community groups
e Incorporation of information received from the engagement and collaboration into the plan
e Coordination that included inter- and intra-governmental cooperation and collaboration, as appropriate
Optional - This WFRC CSAP completed these requirements.
Regional leaders adopted a Safety Commitment Resolution on March 28, 2024. The Safety Resolution includes a 50% reduction by 2040. See Chapter 2.
Optional - This WFRC CSAP completed these requirements. The CSAP was prepared under the direction of a Steering Team, with representatives of cities, counties, Utah Department of Transportation (UDOT), and Utah Transit Authority (UTA). The Steering Team met monthly. See Chapter 4.
Optional - This WFRC CSAP completed these requirements.
The CSAP is available at wfrcsafetyplan.org. The CSAP engaged stakeholders at 24 meetings throughout the region during plan development. Comments were collected and included in the preparation of the CSAP. See Chapter 4. See Chapter 4.
COMPREHENSIVE SAFETY ACTION PLAN 15
1-1
Table
– SS4A Action Plan Requirements and WFRC CSAP Compliance
ACTION PLAN ELEMENT
7. Equity Considerations: Did the Action Plan development include the following?
e Considerations of equity using inclusive and representative processes
e Identification of underserved communities through data
e Equity analysis, in collaboration with appropriate partners, focused on initial equity impact assessments of the proposed projects and strategies, and population characteristics
8. Policy and Process Changes: Are both of the following true?
e Plan development included an assessment of current policies, plans, guidelines, and/or standards to identify opportunities to improve how processes prioritize safety
e Plan discusses implementation through the adoption of revised or new policies, guidelines, and/or standards
9. Progress and Transparency: Does the plan include the following?
e A description of how progress will be measured over time that includes, at a minimum, outcome data
e The plan is posted publicly online
REQUIRED OR OPTIONAL
Optional - This WFRC CSAP completed these requirements.
An equity analysis identified concentrations of disadvantaged or vulnerable populations. The equity analysis utilized tools published by WFRC and by the Federal Highway Administration (FHWA). See Chapter 6.
Required - This WFRC CSAP completed these requirements.
Existing policies, programs, and practices were reviewed that may impact safety. Opportunities for change were identified. Potential engineering, enforcement, or education policies or practices were recommended. See Chapter 8.
Required - This WFRC CSAP completed these requirements. The CSAP is available at wfrcsafetyplan.org. See Chapter 9.
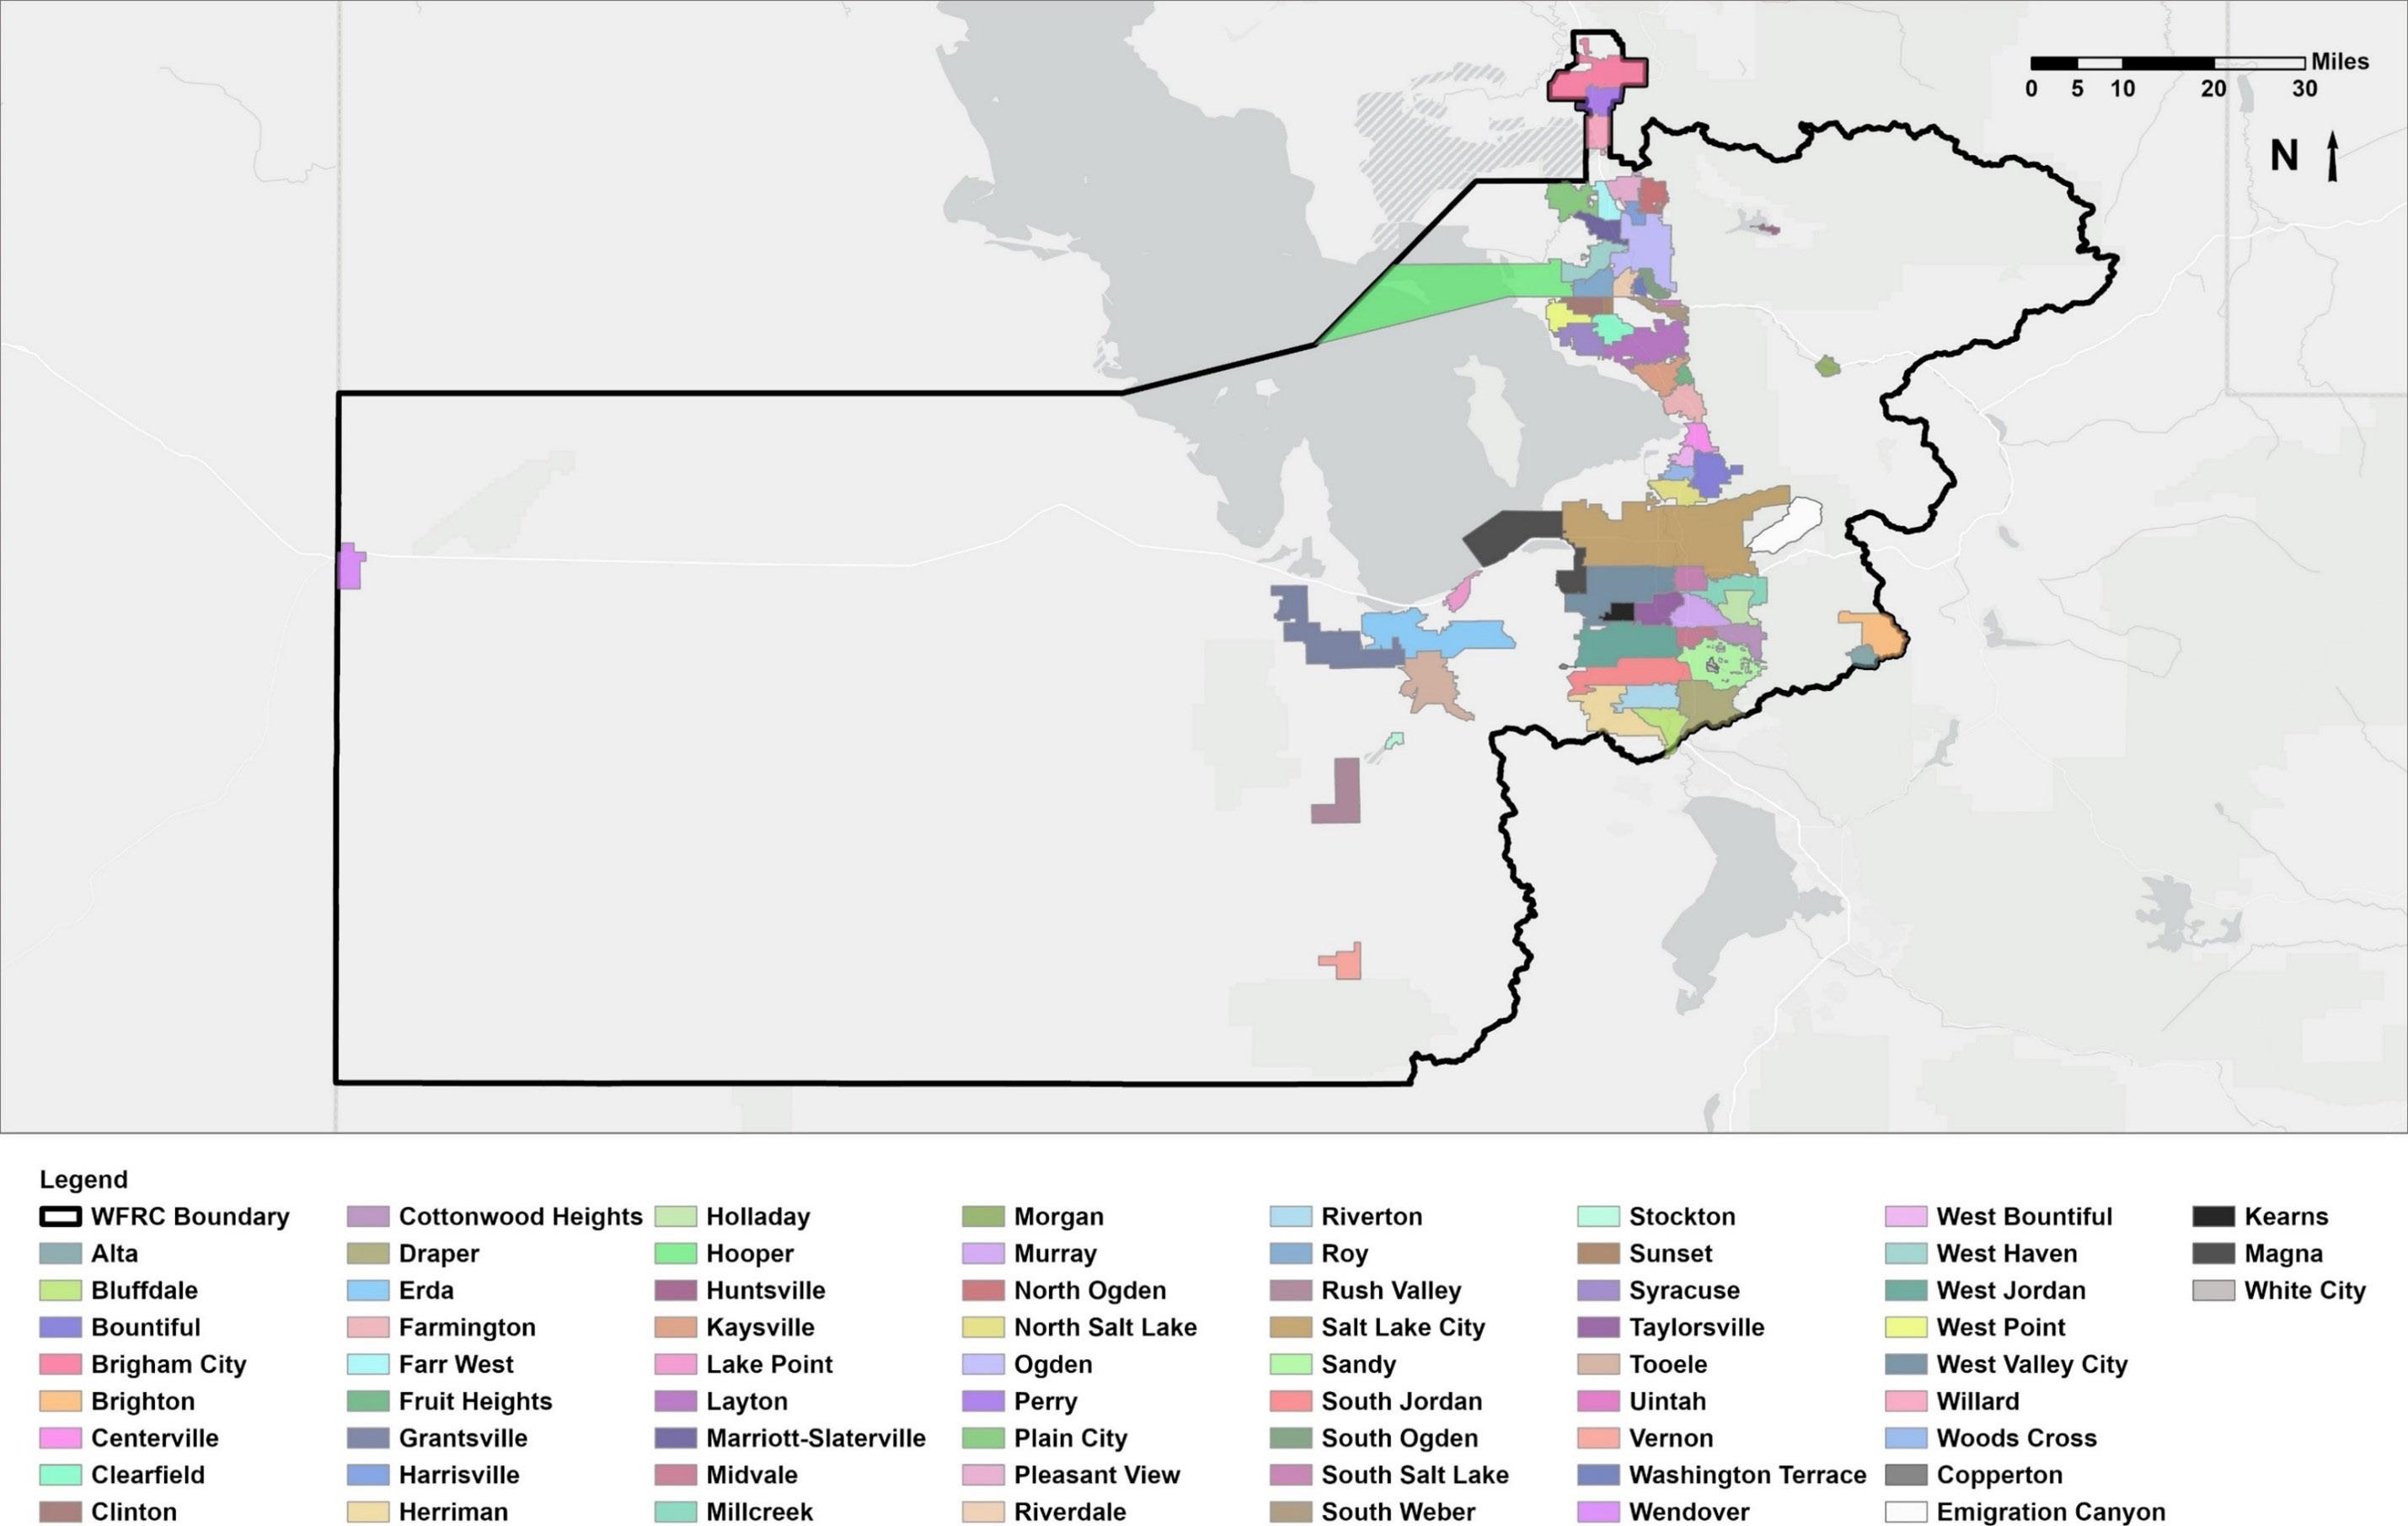
Comprehensive Safety Action Plan Study Area
The CSAP study area includes each jurisdiction within the WFRC Region, as illustrated in Figure 1-1. To organize the large number of jurisdictions within the WFRC Region into manageable analysis areas, jurisdictions are grouped into Geographic Focus Area (GFA). A map of the GFAs is included in Figure 1-2 , and Table 1-2 lists jurisdictions by GFA. The safety analyses conducted for this CSAP is presented for each GFA.
1. Box Elder/North Weber 2. Morgan/Huntsville 3. Central Weber Co. 4. West Weber Co. 5. North Davis Co. 6. South Davis Co. 7. Salt Lake City 8. West Salt Lake Valley 9. South Salt Lake Valley 10. East Salt Lake Valley 11. Tooele Co.
COMPREHENSIVE SAFETY ACTION PLAN 16
DRAFT
GEOGRAPHIC FOCUS AREA JURISDICTIONS
Brigham City
Box Elder County
Perry
South Box Elder/ North Weber County
Willard
Farr West
Harrisville
North Ogden
Pleasant View
Marriott-Slaterville
Weber County
Hooper
West Weber County
East Weber County/ Morgan County
Central Weber County
Plain City
Roy
West Haven
Morgan
Morgan County
Huntsville
Weber County
Ogden
Riverdale
South Ogden
Uintah
Washington Terrace
Davis County
Clearfield
Clinton
Layton
North Davis County
South Weber
Sunset
Syracuse
West Point
Davis County
Bountiful
Centerville
South Davis County
Farmington
Fruit Heights
Kaysville
South Davis County (continued)
Salt Lake City
East Salt Lake Valley
North Salt Lake
West Bountiful
Woods Cross
Salt Lake City
Sandy Cottonwood Heights
Salt Lake County
Alta
Brighton
Holladay
Millcreek
White City
Emigration
West Jordan
Salt Lake County
Copperton
Kearns
Magna
West Salt Lake Valley
South Salt Lake Valley
Midvale
Murray
South Salt Lake
Taylorsville
West Valley City
Herriman
Bluffdale
Draper
Riverton
South Jordan
Tooele County
Erda
Grantsville
Lake Point
Tooele County
Rush Valley
Stockton
Tooele
Vernon
COMPREHENSIVE SAFETY ACTION PLAN 17
GEOGRAPHIC FOCUS AREA JURISDICTIONS
Wendover Table 1-2 – Jurisdictions by GFA DRAFT
COMPREHENSIVE SAFETY ACTION PLAN 18
Figure 1-1 – WFRC Study Area by Jurisdiction
DRAFT

COMPREHENSIVE SAFETY ACTION PLAN 19
Figure 1-2 – WFRC Study Area by County
DRAFT

2. REGIONAL SAFETY COMMITMENT RESOLUTION
REGIONAL SAFETY COMMITMENT RESOLUTION
The mission of the WFRC is to build consensus and enhance quality of life by developing and implementing visions and plans for a well-functioning multimodal transportation system, livable communities, a strong economy, and a healthy environment. To accomplish this mission, WFRC serves as a convener to facilitate collaboration with communities and partners, technical expert to provide trusted subject matter guidance, planner to proactively plan for the future of our region, and implementer to put visions and plans into action.
The Wasatch Front Regional Council affirms its commitment to improving roadway safety.
A Regional Safety Commitment Resolution, included on the next page, was presented to the WFRC Transportation Coordinating Committee (Trans Com) on February 15, 2024, for their consideration to recommend adoption to the Wasatch Front Regional Council. Trans Com serves as the policy advisory body to the Wasatch Front Regional Council regarding short-range transportation planning and programming. Trans Com membership is comprised primarily of local elected officials from Box Elder, Davis, Morgan, Salt Lake, Tooele, and Weber counties. The recommendation passed unanimously.
The Regional Safety Commitment Resolution was presented to Wasatch Front Regional Council on March 28, 2024. The Council is comprised of 19 local elected officials appointed by the county councils of governments in Box Elder, Davis, Morgan, Salt Lake, Tooele, and Weber. The Council also includes representation from the UDOT, UTA, Utah League of Cities and Towns, and Utah Association of Counties, the State Legislature, the Governor’s Office of Planning and Budget, and Envision Utah.
DRAFT

COMPREHENSIVE SAFETY ACTION PLAN 21
Safety Commitment Resolution
Adopted: March 28, 2024
RESOLUTION OF THE WASATCH FRONT REGIONAL COUNCIL ESTABLISHING THE GOAL TO WORK TOWARDS ZERO ROADWAY FATALITIES AND SERIOUS INJURIES
WHEREAS the Wasatch Front Regional Council is the officially designated Metropolitan Planning Organization for the Salt Lake and Ogden-Layton Urbanized Areas; and
WHEREAS between 2018 and 2022, in the Wasatch Front Regional Council planning area, 619 people died and another 3,247 people were seriously injured due to roadway crashes; and
WHEREAS crashes that result in death or serious injury are largely preventable, and the Wasatch Front Regional Council acknowledges that the only acceptable goal is to eliminate deaths and serious injuries to all roadway users; and
WHEREAS having safe, user-friendly streets is one of the goals of the adopted 2023-2050 Wasatch Front Regional Council Regional Transportation Plan; and
WHEREAS creating safe, user-friendly streets will encourage active transportation, improving population health, air quality, and overall public well-being; and
WHEREAS the Wasatch Front Regional Council’s Comprehensive Safety Action Plan presents the region’s commitment and strategies to reducing deaths and serious injuries to all roadway users.
NOW, THEREFORE LET IT BE RESOLVED, by the Wasatch Front Regional Council:
1. Wasatch Front Regional Council supports proactively utilizing a “Safe System Approach” to improve safety for all roadway users, rather than relying on a reactive approach to address roadway fatalities or serious injuries, and
2. Wasatch Front Regional Council declares that any roadway fatality or serious injury is unacceptable and supports reasonable measures to prevent roadway crashes, and
3. Wasatch Front Regional Council establishes a goal of reducing deaths and serious injuries for all roadway users by 50% by the year 2040, and
4. Wasatch Front Regional Council establishes a goal of reducing roadway fatalities and serious injuries by 2.5% each year compared to the preceding three-year rolling average, and
5. Wasatch Front Regional Council will measure the progress towards these regional goals and will provide regional quantitative metrics that are reported annually.
Mayor Dawn Ramsey Chair, Wasatch Front Regional Council
Andrew Gruber Executive Director, Wasatch Front Regional Council
COMPREHENSIVE SAFETY ACTION PLAN 22
DRAFT

3. SAFE SYSTEM APPROACH
Figure 3-1
SAFE SYSTEM APPROACH
Introduction to Safe System Approach
CSAP recommendations are consistent with the Safe System Approach.
The Safe System Approach was adopted by the USDOT as the guiding paradigm to address roadway safety and mitigate the risk inherent in our complex transportation system.2
The Safe System Approach focuses on human mistakes and human vulnerability to design a system with redundancies in place to protect everyone. A Safe System Approach includes the principles as summarized in Figure 3-1.
A Safe System Approach incorporates the following principles: 2
Approach

Source: USDOT, https://www.transportation.gov/NRSS/SafeSystem
DEATH AND SERIOUS INJURIES ARE UNACCEPTABLE
A Safe System Approach prioritizes the elimination of crashes that result in death and serious injuries.
HUMANS MAKE MISTAKES
People will inevitably make mistakes and decisions that can lead or contribute to crashes, but the transportation system can be designed and operated to mitigate the outcomes of human mistakes and avoid death and serious injuries when a crash occurs.
HUMANS ARE VULNERABLE
Human bodies have physical limits for tolerating crash forces before death or serious injury occurs; therefore, it is critical to design and operate a transportation system that is human-centric and recognizes physical human vulnerabilities.
RESPONSIBILITY IS SHARED
All stakeholders—including government at all levels, industry, non-profit/advocacy, researchers, and the public—are vital to preventing fatalities and serious injuries on our roadways.
SAFETY IS PROACTIVE REDUNDANCY IS CRUCIAL
Proactive tools should be used to identify and address safety issues in the transportation system, rather than waiting for crashes to occur and reacting afterwards.
Reducing risks requires that all parts of the transportation system be strengthened, so if one part fails, the other parts still protect people.
COMPREHENSIVE SAFETY ACTION PLAN 24
https://www.transportation.gov/NRSS/SafeSystem
– Safe System
DRAFT
Safe System Approach Paradigm Shift
A Safe System Approach requires moving away from traditional safety paradigms, as summarized in Table 31 3
TRADITIONAL APPROACH TO SAFETY
PREVENT CRASHES
IMPROVE HUMAN BEHAVIOR
CONTROL SPEEDING
INDIVIDUALS ARE RESPONSIBLE
REACT BASED ON CRASH HISTORY
SAFE SYSTEM APPROACH PARADIGM
Prevent death and serious injury:
e The Safe System approach seeks to prevent death and serious injuries
Design for human mistakes/limitations
DRAFT
e In addition to trying to improve human behavior, the Safe System Approach designs for human mistakes and limitations.
Reduce system kinetic energy
e While the traditional safety approach focuses on controlling speeding, the Safe System approach includes speed and other strategies to reduce system kinetic energy.
Share responsibility
e Rather than asserting that only individual roadway users are responsible, the Safe System Approach aims to share responsibility among system users, managers, and others.
Proactively identify and address risks
e Instead of reacting based on crash history, the Safe System Approach proactively identifies and addresses risks.
Safe System Approach Strategies
Local jurisdictions with the WFRC planning area have the most influence over “Safer Roads” and “Safer Speeds,” as they plan, design, construct, and maintain streets and roadways.
To assist agencies to reduce the frequency of traffic-related fatalities and serious injuries on streets and roadways, USDOT has advanced an initiative to develop a growing collection of Proven Safety Countermeasures 4 Proven Safety Countermeasures are designed for all road users and all types of roads—from rural to urban, from high-volume freeways to less traveled two-lane state and county roads, from signalized crossings to horizontal curves, and everything in between.
USDOT encourages transportation agencies to consider widespread implementation of these countermeasures to reduce fatalities and serious injuries on our roadways. Examples of Proven Safety Countermeasures are listed in Table 3-2
3 https://highways.dot.gov/safety/zero-deaths/safe-system-approach-presentation-0
4 https://www.transportation.gov/NRSS/SaferRoads
COMPREHENSIVE SAFETY ACTION PLAN 25
Table 3-1 – Safe System Approach Paradigm
Table 3-2 – Proven Safety Countermeasures


SPEED MANAGEMENT
e Appropriate Speed Limits for All Road Users
e Speed Safety Cameras
e Variable Speed Limits
INTERSECTIONS
e Backplates with Retroreflective Borders
e Corridor Access Management
e Yellow Change Intervals
e Dedicated Left- and Right-Turn Lanes at Intersections
DRAFT

e Reduced Left-Turn Conflict Intersections
e Roundabouts
e Systemic Application of Multiple Low-Cost Countermeasures at Stop-Controlled Intersections
ROADWAY DEPARTURES
e Enhanced Delineation for Horizontal Curves
e Longitudinal Rumble Strips and Stripes on Two-Lane Roads
e Median Barriers
e Roadside Design Improvements at Curves
e Safety Edge
e Wider Edge Lines
PEDESTRIANS/BICYCLISTS
e Bicycle Lanes
e Crosswalk Visibility Enhancements
e Leading Pedestrian Interval
e Medians and Pedestrian Refuge Islands in Urban and Suburban Areas
e Pedestrian Hybrid Beacon
e Rectangular Rapid Flashing Beacons (RRFB)
e Road Diets (Roadway Configuration)
e Walkways
CROSSCUTTING
e Lighting
e Local Road Safety Plans
e Pavement Friction Management
e Road Safety Audit
Example Safe System Approach Strategies
The following are example roadway improvements strategies that implement a Safe System Approach. Examples are drawn from Proven Safety Countermeasures.5
5 https://highways.dot.gov/safety/proven-safety-countermeasures/roundabouts
COMPREHENSIVE SAFETY ACTION PLAN 26
SPEED MANAGEMENT: Appropriate Speed Limits for All Road User
A review of crashes in the WFRC area shows that “speed-related”, meaning excessive or high vehicle speeds, was identified as a factor in 23% fatal and serious injuries.
Speed management is one of the most important methods for reducing fatalities and serious injuries. Speed is especially important in areas where vehicles and vulnerable road users mix.
Drivers typically drive at a speed that feels reasonable for themselves, but not at speeds that safe for vulnerable road users. A driver traveling at 30 miles per hour who hits a pedestrian has a 45 percent chance of killing or seriously injuring them.6
FHWA recommends that states and local jurisdictions set appropriate speed limits to reduce the significant risks drivers impose on others—especially vulnerable road users. Addressing speed is fundamental to the Safe System Approach to making streets safer, and a growing body of research shows that speed limit changes alone can lead to measurable declines in speeds and crashes.7
COMPREHENSIVE SAFETY ACTION PLAN 27
6 Pilkinton, Paul. Reducing the speed limit to 20 mph in urban areas: Child deaths and injuries would be decreased. BMJ, Published April 29, 2000. 7 Hu, W. and J. Cicchino (2019). Lowering the speed limit from 30 to 25 mph in Boston: effects on vehicle speeds. Insurance Institute for Highway Safety. Hit by a vehicle traveling at Hit by a vehicle traveling at Hit by a vehicle traveling at 9.5 out of 10 pedestrians survive. 4.5 out of 10 pedestrians survive. only 1.5 out of 10 pedestrians survives.
Figure 3-2 – Proven Safety Countermeasures – Speed Management
DRAFT
INTERSECTIONS: Roundabouts
A review of crashes in the WFRC area shows that 39% of fatalities and serious injuries occurred at intersections.
The modern roundabout is a type of intersection with a circular configuration that safely and efficiently moves traffic. Roundabouts feature channelized, curved approaches that reduce vehicle speed, entry yield control that gives right-of-way to circulating traffic, and counterclockwise flow around a central island that minimizes conflict points. A roundabout has eight vehicle-to-vehicle conflict points, a 70% reduction from a traditional four-legged intersection, which has 32 vehicle-to-vehicle conflict points. The net result of lowering speeds to 15-20 mph, and reduced conflicts at roundabouts, is an environment where crashes that cause injury or fatality are reduced.
Roundabouts can be implemented in both urban and rural areas under a wide range of traffic conditions. They can replace signals, two-way stop controls, and all-way stop controls. Roundabouts are an effective option for managing speed and transitioning traffic from high-speed to low-speed environments, such as freeway interchange ramp terminals, and rural intersections along high-speed roads.


Roundabouts lower vehicle speeds. When crashes do occur, fatal and serious injuries resulting from the crash are less likely to occur.
Converting a two-way stopcontrolled intersection to a Roundabout has a proven reduction up to 82% of fatal and injury crashes.8
Converting signalized Intersections to a Roundabout has a proven reduction up to 78% of fatal and injury crashes.
COMPREHENSIVE SAFETY ACTION PLAN 28
https://highways.dot.gov/sites/fhwa.dot.gov/files/Roundabouts_508.pdf
Figure 3-3 – Proven Safety Countermeasures – Roundabouts
8
DRAFT
ROADWAY DEPARTURES: Wider Edge Lines
Roadway departures account for over half of all traffic fatalities in the United States, and 26 percent of fatalities in the WFRC Region. If drivers cannot clearly identify the edge of the travel lanes and see the road alignment ahead, the risk of roadway departure may be greater. Wider edge lines enhance the visibility of travel lane boundaries compared to traditional edge lines. Edge lines are considered ”wider“ when the marking width is increased from the minimum normal line width of 4 inches to the maximum normal line width of 6 inches.9 Wider edge lines increase drivers’ perception of the edge of the travel lane and can provide a safety benefit to all facility types (e.g., freeways, multilane divided and undivided highways, two-lane highways, etc.) in both urban and rural areas.10
DRAFT

Source: Neal Hawkins/Institute for Transportation
9 Manual on Uniform Traffic Control Devices (MUTCD), Section 3A.04. FHWA, (2023).
10 https://ctre.iastate.edu/research-synthesis/rural-speed-management/pavement-markings/wide-edgelines/
11 https://highways.dot.gov/safety/proven-safety-countermeasures/wider-edge-lines
Wider edge lines can reduce crashes up to 37% for nonintersection fatal and injury crashes on rural, two-lane roads.11
Wider edge lines have a benefit cost ration of 25:1 for fatal and serious injury crashes on two-lane rural roads
COMPREHENSIVE SAFETY ACTION PLAN 29
Figure 3-4 – Proven Safety Countermeasures – Wider Edge Lines
PEDESTRIANS/BICYCLISTS:
Pedestrian Refuge Islands in Urban and Suburban Areas
A pedestrian refuge island (or crossing area) is a median with a refuge area that is intended to help protect pedestrians who are crossing a road.
Pedestrian crashes account for approximately 17 percent of traffic fatalities nationally, and 25 percent of all traffic fatalities in the WFRC Region in the five-year period (2018-2022). Nationally, 74 percent of these occur at nonintersection locations.12 Within the WFRC area, 60 percent of these occur at non-intersection locations. For pedestrians to safely cross a roadway, they must estimate vehicle speeds, determine acceptable gaps in traffic based on their walking speed, and predict vehicle paths. Installing a median or pedestrian refuge island can help improve safety by allowing pedestrians to cross one direction of traffic at a time.
Transportation agencies should consider medians or pedestrian refuge islands in curbed sections of urban and suburban multilane roadways, particularly in areas with a significant mix of pedestrian and vehicle traffic, traffic volumes over 9,000 vehicles per day, and travel speeds 35 mph or greater. Medians/refuge islands should be at least 4-ft wide, but preferably 8 ft for pedestrian comfort. Some example locations that may benefit from medians or pedestrian refuge islands include:
e Mid-block crossings.
e Approaches to multilane intersections.
DRAFT
e Areas near transit stops or other pedestrian-focused sites.
Medians with a marked crosswalk can reduce pedestrian crashes up to 46%.13 Pedestrian refuge islands can reduce pedestrian crashes up to 56%.
12 National Center for Statistics and Analysis. (2020, March). Pedestrians: 2018 data (Traffic Safety Facts. Report No. DOT HS 812 850). National Highway Traffic Safety Administration
13 (CMF ID: 175) Desktop Reference for Crash Reduction Factors, FHWA-SA-08-011, September 2008, Table 11.
COMPREHENSIVE SAFETY ACTION PLAN 30
Figure 3-5 – Proven Safety Countermeasures – Medians and Refuge Islands

4. CSAP PROCESS AND STAKEHOLDER ENGAGEMENT
CSAP PROCESS AND STAKEHOLDER ENGAGEMENT Process to Prepare the Comprehensive Safety Action Plan
The 10-month WFRC Comprehensive Safety Action Plan development process is illustrated in Figure 4-1
Safety Launch
Geographic Focus Ara Safety Planning Team Workshop #1
Safety Analysis
Strategy and Project Selection
Geographic Focus Ara Safety Planning Team Workshop #2
Engagement and Collaboration, Committee Meetings
Comprehensive Safety Action Plan Steering Team
Draft and Final CSAP
Leadership Commitment
SS4A Regional Workshop
Safety Commitment Resolution
A Steering Team, comprised of representatives from seven local jurisdictions as well as UDOT, WFRC, and UTA, oversaw the CSAP development, and will continue to convene to monitor and coordinate CSAP implementation. Members of the Steering Team are listed in Table 4-1. NAME AGENCY/JURISDICTION ALI AVERY North Salt Lake
BRITNEY WARD Sandy City
DAN BERGENTHAL Salt Lake City
DANIEL GILLIES Ogden City
DAVID RODGERS Salt Lake County
JARED STEWART Tooele City
JEFF LEWIS Utah Department of Transportation
KIP BILLINGS Wasatch Front Regional Council
MATTHEW SHIPP City of Cottonwood Heights
SHELDON SHAW Utah Transit Authority
WAYNE BENNION Wasatch Front Regional Council
COMPREHENSIVE SAFETY ACTION PLAN 32
Figure 4-1 – CSAP Development Process
City
OCT
NOV
JAN 2024 FEB
MAR-APR
Table 4-1 – CSAP Steering Team Members
JUN-SEPT 2023
2023
2023-
2024
2024
DRAFT
Stakeholder Engagement
To create a more complete and effective CSAP, WFRC engaged stakeholders with varying perspectives on transportation safety in the region. These stakeholders included city and agency staff, elected officials, advocacy groups, health departments, law enforcement organizations, UDOT, school districts, business leaders, and other community groups. The Action Plan incorporated information provided by stakeholders through a variety of engagement activities, summarized below.
Safety Launch Webinar
CSAP development initiated with a regional Safety Launch webinar on August 22, 2023. More than 200 stakeholders representing municipalities, counties, UDOT, health departments, advocacy groups, and other organizations attended the event. The project team introduced attendees to the CSAP project, outlined how to get involved, reviewed desired outcomes, and described how local jurisdictions could support a regional safety commitment and prepare to submit a SS4A grant application to fund safety improvements in their communities. A recording of the webinar is available at wfrcsafetyplan.org.14
See Appendix B for the presentation materials shared at the webinar.
Geographic Focus Area Workshops
The CSAP study area includes each jurisdiction within the WFRC Region, as previously illustrated in Figure 1-1. To organize 65 cities, towns, and townships within the WFRC Region into manageable analysis areas, jurisdictions were grouped into 11 GFAs. A map of the GFAs is included in Figure 1-2 , and Table 1-2 lists jurisdictions by GFA
DRAFT
In October 2023 and February 2024, WFRC hosted Safety Planning Workshops in each GFA.
During the 11 GFA workshops hold in October, representatives from jurisdictions within each area met together to review the safety data analysis, discuss safety-related concerns, map problem areas, and review what it will take to achieve a safety paradigm shift. The project team used this input to help inform the safety analysis and guide project recommendations.
Following the safety and equity analysis process, WFRC hosted a second round GFA workshops in February 2024. During these 11 workshops, the project team outlined safety analysis results, presented safety-improvement projects and strategies specific to each jurisdiction, and invited feedback from attendees to further project refinement.
14 https://www.wfrcsafetyplan.org/documents

Representatives from UDOT’s Zero Fatalities team and the Utah Highway Safety Office also shared information about partnership and funding resources available to improve transportation safety in local communities.
See Appendix B for the presentation materials shared at each workshop.
Regional Stakeholders Workshop
Not all stakeholders fit within the GFA groups. To accommodate stakeholders offering multi-jurisdictional and regional perspectives, the project team convened two Regional Stakeholder Workshops, one on October 30, 2023, and one on March 14, 2024. During these meeting, UDOT staff, advocacy groups, school district officials, and other community organization discussed over-arching safety concerns and solutions.
WFRC Community Advisory Committee
The purpose of the Wasatch Choice Community Advisory Committee is to enhance the engagement of communities and apply an equity lens to the WFRC planning efforts while advising Wasatch Choice transportation partner agencies (UDOT, UTA, MAG and WFRC) on transportation and land use decisions. Committee membership is published on WFRC’s website.15
15 https://wfrc.org/committees/community-advisory/#1492203600322-07b5ef37-04aa
COMPREHENSIVE SAFETY ACTION PLAN 33
The Advisory Committee creates a forum/dialog for enhancing awareness and understanding of the needs and priorities of diverse communities and promoting equity in the region. Advisory Committee members can make recommendations on issues and analyses potentially relevant to the needs and circumstances of diverse populations in the region.
A discussion of regional safety needs was held with the WFRC Community Advisory Committee on February 7, 2024. Input received from the Community Advisory Committee included the following:
e Yellow-light running is of concern in the region. Additional education and enforcement is needed.
e Flashing yellow lefts make it difficult for pedestrians to know whether it’s safe to use the crosswalk.
e New standards for retro reflectivity are appreciated. This issue is particularly important in construction zones when temporary striping has been placed for lane shifts, etc.
e Disability advocates noted:
e Push buttons for walk signals at intersections are sometimes difficult for people in mobility devices to reach. This could be mitigated if the pedestrian phase is automatic in the signal phasing, rather than requiring push activation.
e UDOT is developing an app that a person with a disability can use to trigger a walk cycle even if it isn’t automatically included in the signal phasing.
e Snow removal on sidewalks in areas where there are many disabled users, along transit lines, near schools, and in other high-priority pedestrian areas, should be prioritized.
Utah League of Cities and Towns
While the WFRC CSAP is a regional initiative, Utah’s transportation safety paradigm shift will require support and action statewide. To work toward this collaborative goal, WFRC will partner with two other Utah MPOs, Mountainland Association of Governments and Dixie/Five County, as well as UDOT Traffic and Safety and FHWA, to host a Transportation Safety Workshop at the Utah League of Cities and Towns Midyear Conference on April 19, 2024. WFRC and its workshop partners will outline what local government officials and staff can do to support this overall paradigm shift and their region’s safety resolution through policy alignment and infrastructure changes.
DRAFT

COMPREHENSIVE SAFETY ACTION PLAN 34

5. REGIONAL SAFETY ANALYSIS RESULTS
REGIONAL SAFETY ANALYSIS RESULTS
This chapter provides an overview of the safety analysis conducted for the CSAP to meet the requirements for an SS4A eligible Action Plan as part of the self-certification process. These requirements include:
e Analysis of existing conditions and historical trends to baseline the level of crashes involving fatalities and serious injuries across a jurisdiction, locality, Tribe, or region
e Analysis of the location where there are crashes, the severity, and contributing factors and crash types
e Analysis of systemic and specific safety needs, as needed (e.g., high-risk road features, specific safety needs of relevant road users, etc.)
e A geospatial identification (geographic or locational data using maps) of higher risk locations.
A detailed overview of the safety analysis methodology and results by GFA are provided in Appendix D.
Safety Analysis Methodology Overview
The CSAP safety analysis was informed by four individual sub-analyses, as illustrated in Figure 5-1, that each identified safety needs in the WFRC Region.
The “Strategic Highway Safety Plan (SHSP) Emphasis Areas” comparison identified general crash trends and patterns in the WFRC Region. The other three sub-analysis identified specific segments or intersections with a safety need. If a segment was identified by the safety sub-analyses, it was given a “point,” as explained in Table 5-1. Segments that cumulatively received four (4) or more points were included in the WFRC CSAP High-Risk Network.
Each analysis is explained in the following sections.
COMPREHENSIVE SAFETY ACTION PLAN 36
SHSP EMPHASIS AREAS Comparison HISTORICAL CRASH ANALYSIS Trends NETWORK SCREENING ANALYSIS Intersections HIGH-RISK NETWORK ANALYSIS State Route and Federal Aid Segments Segments Local Street Segments COMPOSITE RISK SCORE High-Risk Network DRAFT
Figure 5-1 – CSAP Safety Analysis Methodology
COMPOSITE RISK SCORE
SAFETY SUB-ANALYSIS
SHSP EMPHASIS AREAS ANALYSIS
The SHSP Emphasis Areas Analysis compares the number of fatal and serious injuries for each of the 11 Utah SHSP emphasis safety areas, as listed in the text box at right.
A ranking is assigned to each emphasis area for the state, WFRC planning area, and GFA based on the frequency of fatal and serious injuries for that emphasis area.
This analysis helps to determine priority emphasis areas for each GFA, based on whether the ranked frequency of fatal and serious injury crashes within the GFA is significantly different than the statewide or WFRC rankings.
DRAFT
Note that while bicyclist-involved crashes are not one of the eleven Utah SHSP emphasis areas, bicyclist-involved fatal and serious injuries were included in this analysis.
HISTORICAL CRASH ANALYSIS
UTAH SHSP EMPHASIS AREAS
e Aggressive Driving
e Distracted Driving
e Impaired Driving
e Motorcycle Safety
e Pedestrian Safety
e Roadway Departure Crashes
e Intersection Safety
e Speed Management
e Teen Driving Safety
e Use of Safety Restraints
e Senior Safety
The historical crash data analysis analyzed crash trends for the five-year period, 2018–2022. Trends were identified for WFRC study area as a whole and for each individual GFA. Results are summarized for the following areas:
e Overall Crashes by Severity and Roadway Ownership
e Crashes by Year
e Crashes by Location and Density
e Crashes by Crash Type
e Vulnerable User Crashes
e Crashes by Manner of Collision
e Intersection Crashes
e Crashes by Functional Class
e Crash Tree Diagrams
COMPREHENSIVE SAFETY ACTION PLAN 37
RISK SCORE ELEMENT CRITERIA POINTS HISTORICAL CRASH ANALYSIS 5-Year Crash Totals (Segment) ≥ 3 Crashes 1 NETWORK SCREENING ANALYSIS Critical Crash Rate (CCR) Differential (Segments or Intersections) > 0 1 HIGH-RISK NETWORK ANALYSIS Crash Profile Risk Score (Segments) ≥ 20 1 usRAP Vehicle Star Rating (Segments) 1-2 Stars 1 usRAP Pedestrian Star Rating (Segments) 1-2 Stars 0.5 usRAP Bicycle Star Rating (Segments) 1-2 Stars 0.5 Total Possible Composite Score 5
Table 5-1 – Composite High-Risk Network
NETWORK SCREENING ANALYSIS
The Highway Safety Manual (HSM) provides guidance for incorporating quantitative safety analysis into project planning and development processes. The basic structure of the Roadway Safety Management Process, as recommended in the HSM, Part B, is illustrated in Figure 5-2 .
Network Screening, the first step of the process, reviews a transportation network to identify and rank sites from most likely to least likely to realize a reduction in crash frequency with the implementation of a safety improvement. The location of sites identified as most likely to realize a reduction in crash frequency are then studied in more detail to identify crash patterns, contributing factors, and potential countermeasures.
The CSAP Network Screening Analysis methodologies are based on HSM Part B, Chapter 4. Intersections and roadway segments were analyzed using the following metrics:
e Number of Crashes
e Critical Crash Rate (CCR)
Number of Crashes
e Probability of Specific Crash Types Exceeding Threshold Proportion
e Equivalent Property Damage Only (EPDO)
The initial step of the crash analysis organized roadway segments and intersections into groups, or sub-populations, with similar characteristics (e.g., major arterial, minor arterial, collector, etc.), control type (signalized, unsignalized), and by ownership (State Route, Federal Aid Route, and Local Street). Segments and intersections that experienced three or more crashes in the five-year period were identified.
Critical Crash Rate Analysis
The CCR analysis is a statistical review of locations to determine where a higher frequency of crashes occurred than experienced at locations with similar attributes such as functional class, number of lanes, daily volume, and posted speeds.
The CCR compares the observed crash rate of a segment or intersection to the GFA-specific average crash rate for the intersection or roadway segment. A CCR threshold is established at the 95% confidence level to determine locations with higher crash rates that are unlikely to be random. A CCR differential is then calculated for each intersection and roadway segment as the difference of the CCR threshold to the location-specific CCR. A positive CCR differential indicates a location with higher-than-expected crashes rates.
COMPREHENSIVE SAFETY ACTION PLAN 38
Figure 5-2 – Roadway Safety Management Process
NETWORK SCREENING SAFETY EFFECTIVENESS EVALUATION PRIORITIZE PROJECTS
ECONOMIC APPRAISAL SELECT CONTERMEASURES DIAGNOSIS DRAFT
Probability of Specific Crash Types Exceeding Threshold Proportion
The Probability of Specific Crash Types Exceeding Threshold Proportion Analysis identifies locations where a higher proportion of specific crash types or injury levels are occurring than would be expected. The threshold proportion is based on the proportion of a specific crash attribute/severity to all crashes within the dataset. This analysis identifies locations where certain crash attributes are overrepresented and therefore subject to be isolated for further analysis. For each GFA the following crash attributes were analyzed for the locations identified from the CCR analysis:
e Crash Severity – Fatal, Suspected Serious Injury, Suspected Minor Injury, Possible Injury, and Property Damage Only
e Manner of Collision – Angle, Front to Rear, Head On, Single Vehicle, Parked Vehicle, Rear to Rear, Rear to Side, Sideswipe, and Other/ Unknown
Equivalent Property Damage Only (EPDO)
e Vulnerable Road Users –Pedestrian, Bicycle, and Motorcycle
The EPDO method assigns weighting factors to crashes based on a crash severity level to develop a property-damage-only score. In this analysis, the injury crash costs, a measure of crash severity, were calculated for each location (based on 2023 UDOT crash costs). This value is divided by the cost for a property-damage-only crash to calculate the equivalent number of property-damageonly crashes at each site. This value allows all locations to be compared on an equal basis of injury crash costs.
HIGH-RISK NETWORK ANALYSIS
A roadway characteristic risk analysis was performed to identify risk factors that are shown to lead to fatal and serious injury crashes occurring on roadway segments within each GFA, using the following three sub-analyses:
e Crash Profile Risk Assessment e usRAP Risk Factors Analysis
Crash Profile Risk Assessment
e Local Street Risk Assessment
The Crash Profile Risk Assessment reviewed fatal and serious injury crashes to identify attributes that correspond to a higher frequency of fatal and serious injury crashes. A point value was assigned to each characteristic or attribute based on the frequency per the review. A risk factor score was calculated for each state and federal aid route.
Table 5-2 outlines the Crash Profile Risk factor scoring framework. The roadway characteristic data used in this assessment is extracted from UDOT’s usRAP dataset, available for state and federal aid roads. This analysis identifies roadway segments where improvements can be made to reduce potential for crashes.
COMPREHENSIVE SAFETY ACTION PLAN 39
DRAFT
A review of regional crash data shows that:
e Roadways with more than 20,000 AADT experience approximately 44% of all crashes.
e Roadways with AADT of 10,000 to 20,000 have approximately 25% of all fatal and serious injury crashes.
A review of regional crash data shows that:
e 51.4% of fatal and serious injury crashes occurred on roadways with a posted speed limit of 35 MPH or 40 MPH.
e 28.7% of fatal and serious injury crashes occurred on roadways with speed limits 45 MPH and above.
e 19.9% of fatal and serious injury crashes occurred on roadways with a posted speed limit of 30 MPH or less.
A review of regional crash data shows that:
e 28.0% of fatal and serious injury crashes in urban areas occur on two-lane undivided roadways.
e 17.3% of fatal and serious injury crashes in urban areas occur on four-lane undivided roadways.
e 16.2% of fatal and serious injury crashes in urban areas occur on four-lane roadways with Two Way Left Turn Lane (TWLTL)
e 29.1% of fatal and serious injury crashes in urban areas occur on two-lane roadways with TWLTL (9.6%), four-lane divided roadways (9.9%), and six-lane divided roadways (9.6%).
A review of regional crash data shows that:
e 48.7% of fatal and serious injury crashes in rural areas occurred on two-lane undivided roadways.
e 21.7% of fatal and serious injury crashes in rural areas occurred on four-lane roadways with TWLTL.
e 18.9% of fatal and serious injury crashes in rural areas occurred on two-lane roadways with TWLTL.
estimates that lighting can reduce crashes by up to 28% (for nighttime injury crashes).
COMPREHENSIVE SAFETY ACTION PLAN 40 RISK FACTOR CHARACTERISTIC AREA TYPE (URBAN/ RURAL) MEASUREMENT AND POINTS MAX POINTS EXPLANATION TRAFFIC VOLUME Average Annual Daily Traffic (AADT) Both 0: <1,000 AADT 2: 1,000-4,000 4: 4,001-10,000 6: 10,001-20,000 8: 20,001+ 8
SPEED Speed Limit (MPH) Both 0: ≤ 20 MPH 2: 25 MPH 4: 30 MPH 6: 35 – 40 MPH 4: 45 MPH 3: ≥ 50 MPH 6
ROADWAY TYPE Cross Section (Urban) Urban 0: 2 Lane Divided/Median 0: 8+ Lanes 0: One-Way 2: 6 Lane w/ TWLTL 2: 6 Lane Undivided 3: 2 Lane w/ TWLTL 3: 4 Lane Divided/Median 3: 6 Lane Divided 4: 4 Lane Undivided 4: 4 Lane w/ TWLTL 6: 2 Lane Undivided 6
ROADWAY TYPE Cross Section (Rural) Rural 0: 2 Lane Divided/Median 0: 4 Lane Divided/Median 0: 6+ Lanes 0: One-Way 1: 4 Lane Undivided 2: 2 Lane w/ TWLTL 3: 4 Lane w/ TWLTL 4: 2 Lane Undivided 4
LIGHTING CONDITION Presence of Lighting Both 0: Lighting 2: No Lighting 2 FHWA
5-2 –
Ranking
Table
Crash Profile Risk Assessment
DRAFT
2 HSM crash prediction models for urban roadways segments indicate a reduction in total crashes with greater offsets to fixed objects.
Distance to Fixed Object (< 3.3’)
0:
0.5:
1 HSM Crash Modification Factors indicate that greater clear zone widths reduce run off road and single-vehicle fatal and injury crashes on rural roadways.
estimates that sidewalks can reduce crashes involving pedestrians walking along
by 65%-89%.
COMPREHENSIVE SAFETY ACTION PLAN 41 RISK FACTOR CHARACTERISTIC AREA TYPE (URBAN/ RURAL) MEASUREMENT AND POINTS MAX POINTS EXPLANATION ACCESS DENSITY Presence of Commercial Access Both 0: No Commercial Access 2: Commercial Access (Rural) 3: Commercial Access (Urban) 2 (Rural) 40.3% of fatal and serious injury crashes occurred on segments with at least one commercial access. CENTERLINE CONDITION Presence of Centerline Rumble Strip Rural 0: Rumble Strip 2: No Rumble Strip 3 (Urban) FHWA estimates that centerline longitudinal rumble strips can reduce headon fatal and serious injury crashes by 44%-64% SHOULDER CONDITION Presence of Shoulder Rumble Strip Rural 0: Rumble Strip 2: No Rumble Strip 2 FHWA estimates that shoulder rumble strips can reduce single-vehicle, run-off-road fatal and serious injury crashes on two lane rural roads by 13%-51% SHOULDER CONDITION Presence of Paved Shoulder Rural 1: ≥3.3’ Paved Shoulder 2: <3.3’ Paved Shoulder 3: No Paved Shoulder 3 50.3% of fatal and serious injury crashes occurred on segments with non-paved shoulders, while these same segments carried 37.8% of vehicle miles traveled (VMT). ROADSIDE HAZARD Presence of Fixed Object Urban 0: No Roadway Fixed Object 0: Distance to Fixed Object (≥ 16.4’) 1: Distance to Fixed Object (3.3’-< 16.4’) 2:
ROADSIDE HAZARD Clear Zone Width Rural
Clear
zone Width (≥ 32.8’)
Clear zone
Clear
Clear
Width (16.4’ - < 32.8’) 0.5:
zone Width (3.3’-< 16.4’) 1:
zone Width (< 3.3’)
GEOMETRICS Curve Rural 0: No Curve or Gentle Curve 0: Moderate Curve 1: Sharp or Very Sharp Curve 1 4.3% of fatal and serious injury
the WFRC study area
on roadways
sharp or very sharp curves. PEDESTRIAN CONDITION Presence of Sidewalk Urban 0: Sidewalk 2: No Sidewalk 2 27.8% of bicycle and pedestrian
and serious injury
the WFRC study area occurred on roadways
sidewalk. FHWA
the roadway
BICYCLIST CONDITION Presence of Bicycle Facility Urban 0: Bike Lane or Facility 2: No Bike Lane or Facility 2 87.4% of bicycle and pedestrian fatal and serious injury crashes occurred on segments without a designated bike lane.
crashes in
occurred
with
fatal
crashes in
without a
DRAFT
usRAP Risk Factors Analysis
The United States Road Assessment Program16 (usRAP) is a tool, prepared by the Roadway Safety Foundation, to proactively analyze the safety of a roadway. In Utah, the data set is maintained by UDOT and the University of Utah for state and federal aid routes.
Within the tool, the road network data is coded in 100-meter segments and roadway attributes for each segment are assessed and scored by a technician. Software, known as ViDA, outputs a star rating for each roadway segment on a 1 to 5 scale (for each star increase, the socioeconomic cost of crashes is halved on that road section).
Star ratings consider road infrastructure attributes known to impact the likelihood of a crash and its severity. The roadway’s star rating is based on the presence or absence of these design and traffic control features. Stars are awarded depending on the level of safety that is “built-in” to the roadway. Separate star ratings are assigned for vehicle occupants, bicyclists, and pedestrians.
Five-star roadways have the most safety-related design and traffic control features. One-star roadways have the fewest safetyrelated design and traffic operational features. The best candidates for safety improvements usually fall in the two star and below range. Figure 5-3 provides a summary of the usRAP star rating system.
A Star Rating Score (SRS) is calculated for 100-meter segments for vehicles, pedestrians, and bicyclists. However, for the purposes of producing a usable output for the region-wide WFRC CSAP, 100 meters is too detailed for a regional analysis. Hence, star ratings are “smoothed” (or averaged) over longer lengths to produce meaningful results.

COMPREHENSIVE SAFETY ACTION PLAN 42
16 http://www.usrap.org/
Figure 5-3 – usRAP Star Rating Summary
DRAFT
Local Street Risk Assessment
A Local Street Risk Assessment was performed on all non-state highway and non-federal aid routes within the WFRC study area because the usRAP analysis above is not available for local streets. This assessment integrated available crash data and other location factors into a scoring system appropriate for local roads, given that a more limited data set is available for local streets. These location factors account for conditions such as active transportation activity, proximity to land uses that tend to attract people walking and bicycling, equity focus areas, and speed-related data from Wejo, a big-data (vehicle location-based services data) vendor.
Table 5-3 – Local Street Risk Factors
DRAFT
This scoring system highlights sections of the roadway network based on the prevalence of the characteristics in Table 5-3.
The scoring process overlaid these datasets in geographic information systems (GIS) to rank locations that had the highest occurrence of the combined characteristics. This process identified local streets that have both the highest rate of crashes along with land use and locational characteristics that indicate a high level of vulnerable users. The scoring process acknowledges that some factors are more important than others.
After the scoring process was completed, roadway segment scores were stratified to identify the five percent of local streets in the WFRC study area with the highest scores (a high score indicates a high risk). The highest-scoring local streets were incorporated into the Composite High-Risk Network for local streets, classified into Tier 1 (highest 20 segment scores in each GFA) and Tier 2 (highest
COMPOSITE HIGH-RISK ROADWAY NETWORK
5% of scores in the overall WFRC region).
Each of the safety analysis methodologies explained in this section identified segments or intersections with a safety need. As explained in Table 5-1, the overall high-risk network consists of segments or intersections identified by the individual sub-analysis. The Composite High-Risk Network consists of overlapping segments from each of the safety sub-analyses. The high-risk network consists of:
1. Segments with a composite score of 4 or higher
2. Intersections with a positive CCR
3. Tier 1 local street segments (20 highest segments within each GFA) and Tier 2 local street segments (highest 5% of scores in the overall WFRC region).
COMPREHENSIVE SAFETY ACTION PLAN 43
RISK FACTOR CATEGORY RISK FACTOR AVAILABLE SCORE CRASH SEVERITY Presence of Fatal or Serious Injury Crash (KA) 26 Presence of Minor Injury Crash 2 Presence of Possible Injury Crash 1 ACTIVE TRANSPORTATION Presence of Active Transportation Crash 5 LOCATION RISK Within an Equity Focus Area 5 Within 1000’ of a School 5 Within 250’ of a Transit Stop 5 Presence of a Bicycle or Pedestrian Activity Center 5 HIGH SPEED Segments with an 85th Percentile Speed Greater than 40 MPH 10 AGGRESSIVE DRIVING Top 10% of Segments with Observed Hard-Braking or Hard-Acceleration Events 5
WFRC Study Area Analysis Results
This section presents the results of the safety analysis that was introduced in the previous sections. Data is reported for crashes that occurred within the WFRC study area, January 1, 2018, to December 31, 2022. Results of the safety analysis for each GFA are included in Appendix D.
SHSP EMPHASIS AREAS ANALYSIS DRAFT
The SHSP emphasis area analysis compared the ranking of total fatalities and serious injuries for each of the eleven statewide emphasis areas, as identified by the Utah SHSP17, to total fatalities and serious injuries in the WFRC area for those emphasis areas. Note that a single crash may be assigned multiple categories (e.g., Teen Driver and Roadway Departure) and have multiple fatalities and/or serious injuries. The results of the SHSP emphasis area comparison analysis are displayed in Table 5-4. Intersections and Roadway Departure are the two highest-ranked emphasis areas for the WFRC study area.
*Note that more than one emphasis area may be associated with a single crash.
17 Utah SHSP identified statewide emphasis areas considering factors related to the driver, roadway, and special users (motorcycle and pedestrian). Bicycle is not one of the eleven Utah SHSP emphasis areas but was included as part of the CSAP safety analysis.
COMPREHENSIVE SAFETY ACTION PLAN 44
CATEGORY UTAH SHSP SAFETY EMPHASIS AREA* STATEWIDE TOTALS WFRC TOTALS FATAL AND SERIOUS INJURIES* RANK FATAL AND SERIOUS INJURIES RANK CHANGE IN RANK DRIVER Teen Driver 1,640 4 751 4 0 Older Driver 1,508 6 700 6 0 Speed-Related 2,133 3 936 3 0 Aggressive Driving 555 11 297 10 1 Distracted Driving 718 10 286 11 -1 Impaired Driving 1,184 8 623 8 0 No Safety Restraints 1,542 5 599 9 -4 ROADWAY Intersections 3,567 1 2,163 1 0 Roadway Departure 2,931 2 1,014 2 0 SPECIAL USERS Motorcycle 1,457 7 750 5 -2 Pedestrian 912 9 636 7 -2 Bicycle 280 12 167 12 0
Table 5-4 – SHSP Emphasis Area Comparison Analysis
HISTORICAL CRASH ANALYSIS
The historical crash analysis was conducted for the five-year period from 2018 to 2022 for crashes that occurred within the WFRC study area. The full historical crash analysis is provided in Appendix D.
Crashes by Severity Level
Table 5-5 provides an overview of crashes by severity level and roadway ownership. The data shows:
e Three times as many fatal crashes occurred on State Routes as compared to Federal Aid Routes. State Routes typically carry higher traffic volumes and vehicles travel at higher speeds as compared to Federal Aid Routes and Local Streets.
e The total number of crashes (all severity levels) that occurred on State Routes is twice that of those that occurred on Federal Aid Routes, and five times that of Local Streets.
e 0.3% of all crashes resulted in a fatality in the WFRC study area.
DRAFT
Fatal and Serious Crashes by GFA
Figure 5-4 through Figure 5-6 summarize fatal and serious injury crashes by GFA. The data shows:
e West Salt Lake GFA experienced more than twice the number of crashes as compared to other GFAs.
e In addition to the West Salt Lake Valley GFA, Salt Lake City GFA and East Salt Lake GFA each experienced more than 400 fatal and serious injury crashes over the five-year period.
e Adjusted for VMT, Tooele County GFA had the highest rate of fatal and serious injury crashes.
e Crashes in rural GFAs—East Weber County/Morgan County GFA and Tooele County GFA—tended to be more severe as compared to urbanized GFAs such as South Davis County.
e Figure 5-7 shows that fatal and serious injury crash rates are greatest on Federal Aid Urban routes possibly attributable to speeds greater than local roads and increased conflict points with cross traffic, pedestrians, and bicyclists.
COMPREHENSIVE SAFETY ACTION PLAN 45
ROUTE TYPE STATE ROUTE FEDERAL AID ROUTE LOCAL STREET OTHER OVERALL TOTAL CRASH SEVERITY CRASHES CRASHES CRASHES CRASHES CRASHES % # % # % # % # % FATAL 432 0.4% 148 0.3% 39 0.2% 0 0.0% 619 0.3% SUSPECTED SERIOUS INJURY 1,862 2% 1,056 2% 329 2% 0 0.0% 3,247 2% SUSPECTED MINOR INJURY 10,868 10% 6,316 12% 1,794 8% 13 1.6% 18,991 11% POSSIBLE INJURY 20,295 19% 9,978 19% 2,512 12% 9 1.1% 32,794 18% NO INJURY / PROPERTY DAMAGE ONLY 73,101 69% 34,159 66% 16,597 78% 812 97.4% 124,669 69% ROUTE TOTAL 106,558 100% 51,657 100% 21,271 100% 834 100% 180,320 100%
Table 5-5 – Crashes by Severity by Roadway Ownership (2018-2022)


COMPREHENSIVE SAFETY ACTION PLAN 46
Figure 5-4 – Total Number of Fatal and Serious Injury Crashes by GFA, 2018-2022
Figure 5-5 – Fatal and Serious Injury Crash Rate by GFA, 2018-2022
DRAFT


Fatal and Serious Injury Crashes by Crash Type
Figure 5-8 summarizes fatal and serious injury crashes by crash type. The data shows that the three most common crash types are Left-Turn at Intersection, Roadway Departure, and Active Transportation. A closer examination of the data shows that all three of these crash types are most prevalent on State Routes.
COMPREHENSIVE SAFETY ACTION PLAN 47
Figure 5-6 – Fatal and Serious Injury Crashes as Percent of Total Crashes by GFA, 2018-2022
Figure 5-7 – Fatal and Serious Injury Crashes as by Roadway Ownership, 2018-2022
DRAFT

Emphasis Area Focus Analysis: Intersections, Roadway Departure, Active Transportation
Intersections, Roadway Departure, and Active Transportation represent three high priority safety emphasis areas. The following pages include additional data, specific to the WFRC planning area, about crashes that related to each of these emphasis areas.
Intersection Crashes
Roadway intersections represent conflict points that create circumstances where crashes occur. Intersections crashes represent the highest frequency of fatal and serious injuries in the state, and in the WFRC planning area. Improving safety at intersections are a national, state, and local road safety priority.
COMPREHENSIVE SAFETY ACTION PLAN 48
CATEGORY UTAH SHSP SAFETY EMPHASIS AREA* STATEWIDE TOTALS WFRC TOTALS FATAL AND SERIOUS INJURIES* RANK FATAL AND SERIOUS INJURIES RANK ROADWAY Intersections 3,567 1 2,163 1
Figure 5-8 – Fatal and Serious Injury Crashes by Crash Type, 2018-2022
DRAFT


Within the period 2018-2022, there were 1,975 fatalities and serious injuries resulting from 1,870 intersection fatal and serious injury crashes. The vast majority of these fatal and serious injury crashes occurred in urban areas, with just 26 occurring in rural areas in the WFRC planning area.
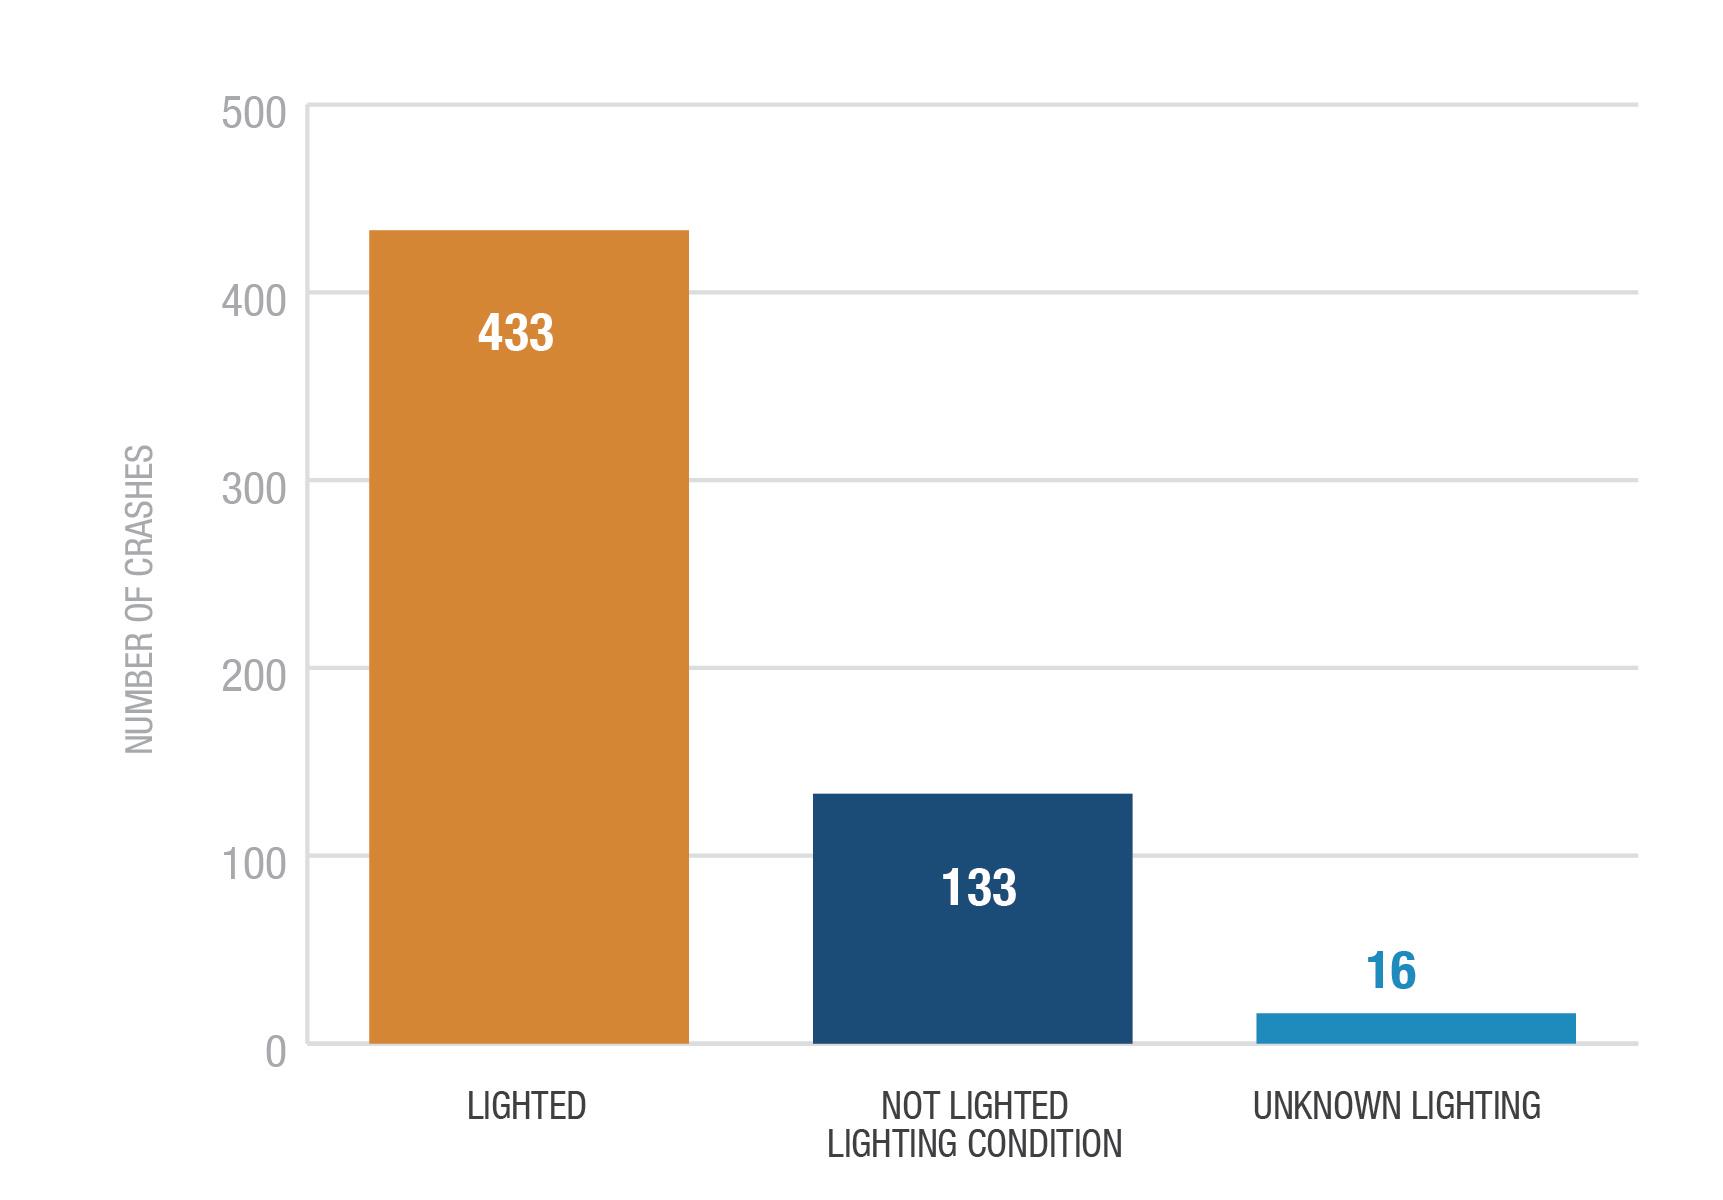
Most crashes occurred during day-light hours. However, as fewer vehicles drive at night, dark conditions appear to have an over representation of intersection crashes.
42% 15%
DRAFT
43% of intersection crashes occurred at signalized intersections of intersections crashes occurred at stop sign controlled intersections of intersection crashes occurred at unknown or other controlled intersections
10% of crashes involved a DUI
Related to crashes by lighting condition, of crashes that occurred in dark conditions, most crashes occurred in lighted conditions. This shows that additional safety improvements, beyond improved lighting, are needed to reduce intersection crashes that occur at night.
22% of crashes were active transportation involved
The data shows that of 843 fatal and serious injury crashes:
44% of crashes involved a left or U-turning vehicle
36% of crashes involved a vehicle moving straight ahead
7% of crashes involved a right turning vehicle
52% of crashes were single vehicle crashes
7% of crashes were angle crashes
5% of crashes involved distracted or drowsy driving of crashes were front to rear crashes
32% of crashes were head on (front to front) crashes
5%
COMPREHENSIVE SAFETY ACTION PLAN 49
Crashes by Area Type
Crashes by Light Condition
Dark Crashes by Lighting Intersection Crashes
Roadway Departure Crashes
FHWA defines a roadway departure crash as a crash which occurs after a vehicle crosses an edge line or a center line, or otherwise leaves the traveled way. Lane departure is a synonymous term often used. Both include head-on collisions when a vehicle enters an opposing lane of traffic.
Roadway departure crashes represent the 2nd highest frequency of fatal and serious injuries in the state, and in the WFRC planning area.
COMPREHENSIVE SAFETY ACTION PLAN 50
CATEGORY UTAH SHSP SAFETY EMPHASIS AREA* STATEWIDE TOTALS WFRC TOTALS FATAL AND SERIOUS INJURIES* RANK FATAL AND SERIOUS INJURIES RANK ROADWAY Roadway Departure 2,931 2 1,014 2
DRAFT
Roadway Departure Crashes

Within the period 2018-2022, there were 1,503 fatalities and serious injuries resulting from 873 fatal and serious injury roadway departure crashes.
DRAFT

Most crashes occurred during day-light hours. However, as fewer vehicles drive at night, dark conditions appear to have an over representation of roadway departure crashes.
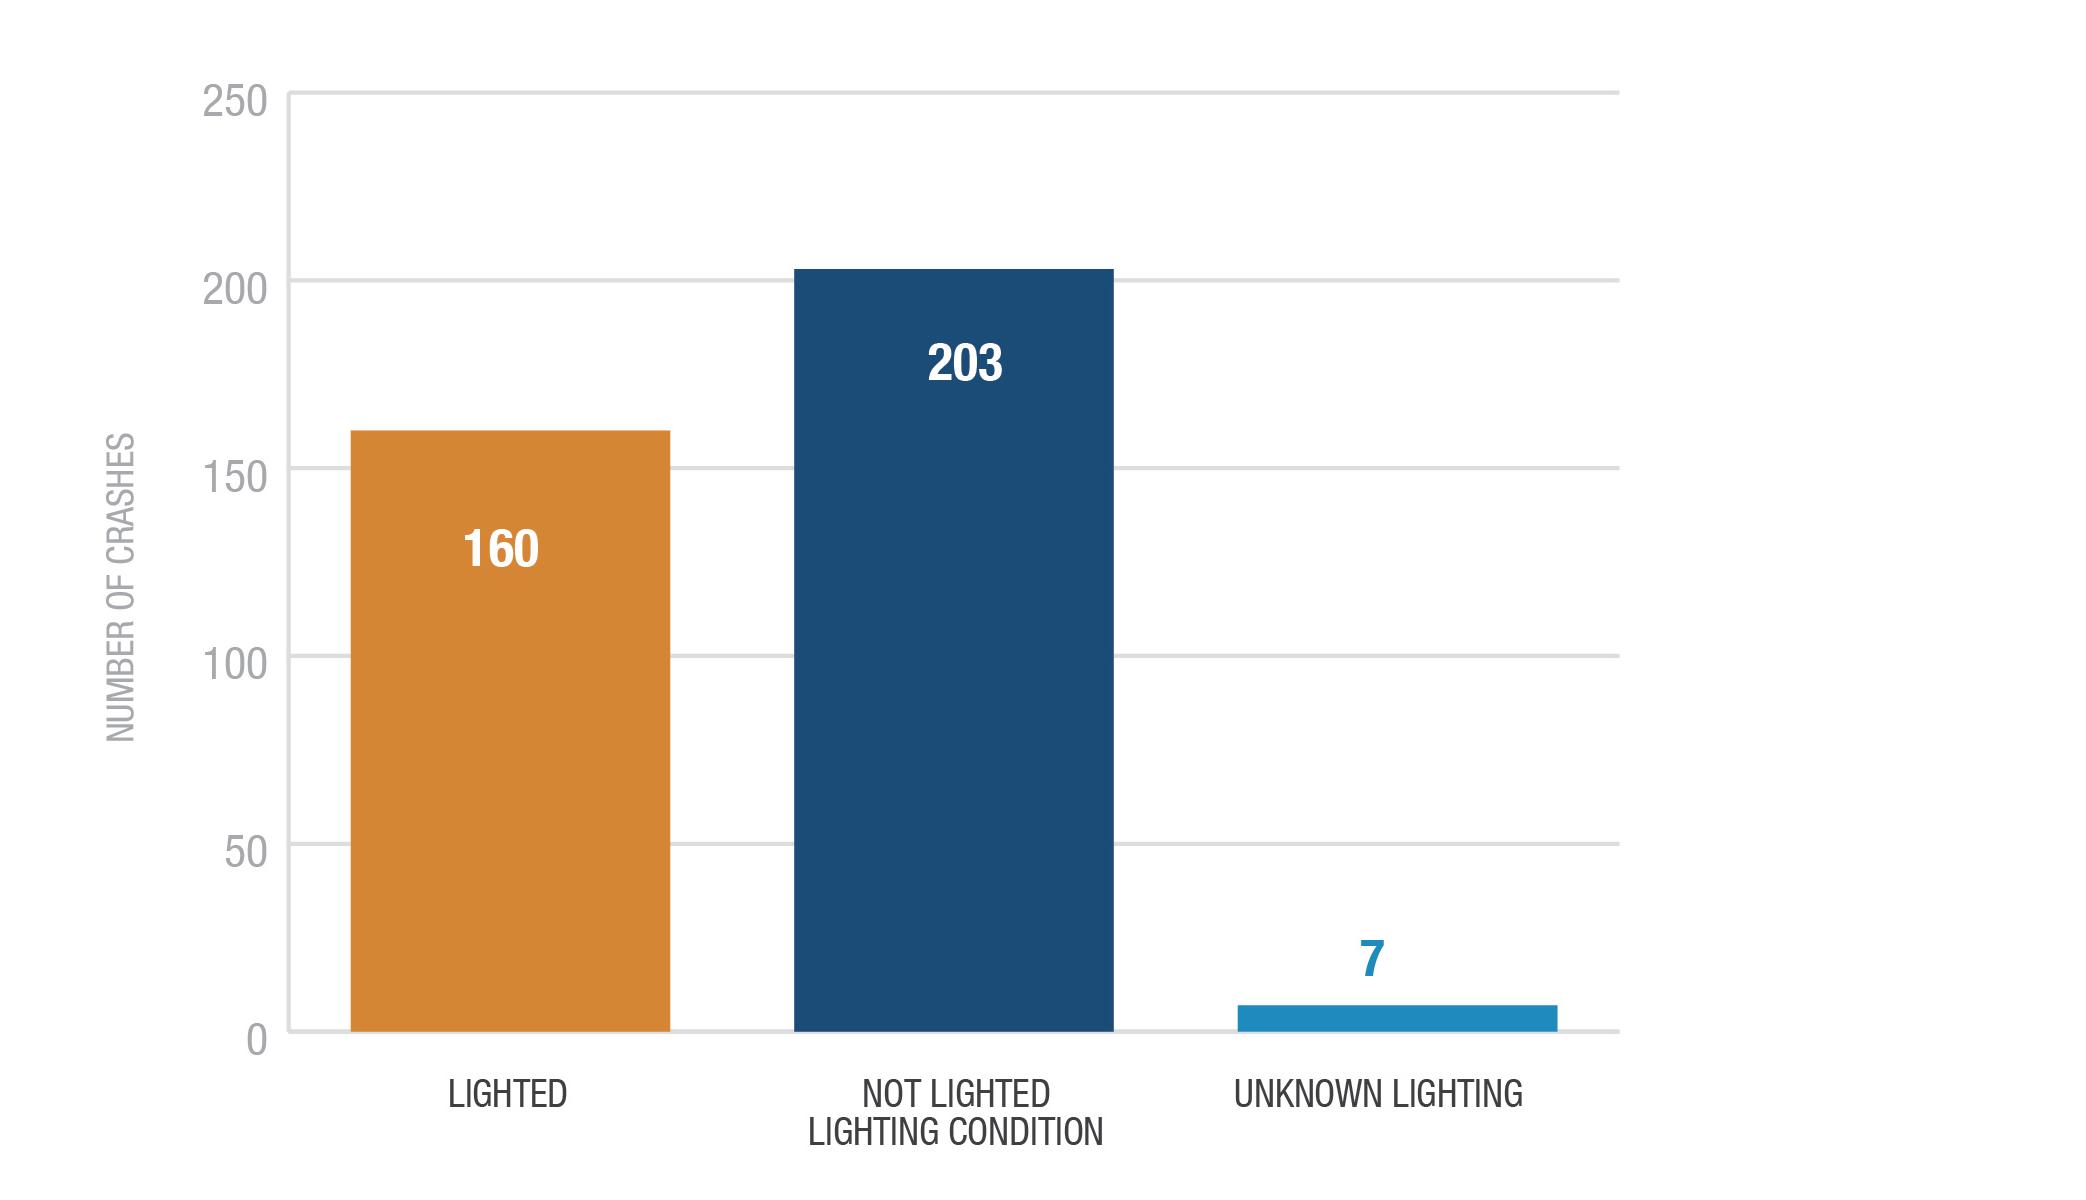
Related to crashes by lighting condition, of crashes that occurred in dark conditions, most crashes occurred in not lighted conditions.
24%
10%
8% of crashes involved a DUI of crashes involved distracted or drowsy driving of crashes involved aggressive driving
88% of crashes involved only one vehicle
10% of crashes occurred in adverse weather
65% of crashes occurred on undivided highways
16% of crashes were overturn/ rollover crashes
22% of crashes occurred at estimated travel speeds of 50 mph or more
COMPREHENSIVE SAFETY ACTION PLAN 51
Crashes by Area Type
Crashes by Light Condition
Dark Crashes by Lighting
Active Transportation/Vulnerable User Crashes
Active transportation crashes are those that involved a pedestrian, person riding a bicycle, or another non-motorized user (e.g., scooters, etc.).
While the Pedestrian emphasis area is 9th highest frequency among the Utah SHSP emphasis areas in the state and in the WFRC region, within the Salt Lake City GFA, the Pedestrian emphasis area is 2nd highest, only behind intersections.
Within the period 2018-2022, there were 636 pedestrian fatal and serious injuries and 167 bicycle fatal and serious injuries resulting from 803 pedestrian fatal and serious injury crashes.
COMPREHENSIVE SAFETY ACTION PLAN 52
CATEGORY UTAH SHSP SAFETY EMPHASIS AREA* STATEWIDE TOTALS WFRC TOTALS FATAL AND SERIOUS INJURIES* RANK FATAL AND SERIOUS INJURIES RANK SPECIAL USERS Pedestrian 912 9 636 9 Bicycle 280 12 167 12
DRAFT


Within the period 2018-2022, there were 636 pedestrian fatalities and serious injuries and 167 bicycle fatalities and serious injuries resulting from 775 pedestrian or bicycle involved fatalities and serious injury crashes. A majority of these fatal and serious injury crashes occurred in urban areas, with just 19 occurring in rural areas in the WFRC planning area.
Most (53%) of the active transportation crashes occurred at intersections.
53%
23%
12% of crashes were intersection involved of crashes occurred at signalized intersections of crashes occurred at stopcontrolled intersections
28% of crashes occurred at crosswalks (22% marked, 6% unmarked)

Most crashes occurred during day-light hours. However, as fewer active transportation users are out at night, dark conditions appear to have an over representation of active transportation crashes.

Related to crashes by lighting condition, of crashes that occurred in dark conditions, most crashes occurred in lighted conditions, but not lighted conditions represents a significant percentage (44%).
25% of crashes occurred in travel lanes
16% of crashes involved a left or U-turning vehicle
10% of crashes involved a right turning vehicle
COMPREHENSIVE SAFETY ACTION PLAN 53
Crashes by Area Type Crashes by Light Condition Dark Crashes by Lighting Intersection Involved Crashes Active Transportation/Vulnerable User Crashes
DRAFT
GFA Safety Analysis Results and Priorities
Each of the completed safety analysis methodologies identified segments or intersections that may be candidates for safety improvements to reduce fatalities and serious injury crashes.
To provide focused safety priorities for jurisdictional decisions regarding safety improvements, an analysis was performed to identify overlapping segments from each of the analysis methodologies.
A composite score, from zero to five, was assigned to each State Highway or Federal Aid Route segment in the region. State Route or Federal Aid Route segments with a score of “4” or higher are included in the High-Risk Network. These represent the top 10% of State Route and Federal Aid Route segments for the entire WFRC area. This is referred to in the CSAP as the Composite High Risk Network. The Composite High Risk Network also includes the highest priority intersections based on CCR, and segments identified in the Local Street Risk Assessment.
A complete summary of crash analysis results for each GFA for Network Screening, High-Risk Network, and Composite Score sub-analysis is provided Appendix D. Table 5-6 identifies the appendix reference number by GFA.
COMPREHENSIVE SAFETY ACTION PLAN 54
NETWORK SCREENING ANALYSIS HIGH-RISK NETWORK ANALYSIS COMPOSITE RISK SCORE GEOGRAPHIC FOCUS AREA APPENDIX # South Box Elder & North Weber Counties D1 West Weber County D2 Central Weber County D3 East Weber & Morgan County D4 North Davis County D5 South Davis County D6 West Salt Lake Valley D7 Salt Lake City D8 East Salt Lake Valley D9 South Salt Lake Valley D10 Tooele County D11
Table 5-6 – GFA Appendix List
DRAFT

6. EQUITY ANALYSIS
EQUITY ANALYSIS
Equity Considerations
Federally Defined Equity Areas
Several tools are available at the federal level to begin to understand the locations of disadvantaged communities. These include the USDOT Equitable Transportation Community (ETC) Disadvantaged Areas dataset, and the Council on Environmental Quality’s Climate and Economic Justice Screening Tool (CEJST).
The ETC data uses census tracts to highlight communities experiencing transportation insecurity and other transportation disadvantages. Managed by USDOT, the tool provides insights into how transportation insecurity impacts marginalized communities. It highlights disparities in access to transportation resources and informs decision-making for more equitable outcomes. Per USDOT, transportation insecurity happens when “people are unable to get to where they need to go to meet the needs of their daily life regularly, reliably, and safely.”18 This dataset is part of the Justice40 Initiative, born from Executive Order 1400819, and uses census tracts with data from the 2020 Census to help determine the community burden that results from underinvestment in transportation. The indicators that are used to create the index in the dataset include the following:
e Transportation insecurity
e Environmental burden
e Social vulnerability
e Health vulnerability
e Climate and disaster risk burden
Similarly, the CEJST dataset uses census tracts and data from the 2020 Census to identify disadvantaged communities. Disadvantaged communities are within the boundaries of Federally Recognized Tribal Lands or meet at least one category of burden. The categories of burden include:
e Climate change
e Energy
e Health
e Housing
e Legacy pollution
e Transportation
DRAFT
e Water and wastewater
e Workforce development
A community is designated as disadvantaged if they are in census tracts at or above the 65th percentile for low-income and at or above the 90th percentile for any of the categories listed above. The CEJST uses data related to carbon emissions, economic indicators, demographic information, and environmental justice metrics. The tool provides an analysis of how climate policies might affect different communities, considering their economic status and vulnerability. It aims to ensure that climate actions are equitable and do not disproportionately burden marginalized populations while addressing environmental challenges. Its purpose is to guide policy decisions by considering the equitable distribution of benefits and burdens across different communities.
Locally Defined Equity Priority Index
To identify equity priority communities within the WFRC region, a locally defined equity priority index was developed. The locally defined index provides insight on not only whether transportation-disadvantaged people are present in a place, but also the degree to which they are experiencing transportation challenges. It also assesses more variables than the WFRC Equity Focus Areas, which are also defined at the block group level and primarily focus on the concentration of low-income households and individuals identifying as members of racial and ethnic minority groups.
18 https://experience.arcgis.com/experience/0920984aa80a4362b8778d779b090723/page/Understanding-the-Data/
19 Executive Order 14008, available here: https://www.whitehouse.gov/briefing-room/presidential-actions/2021/01/27/executive-order-on-tackling-the-climatecrisis-at-home-and-abroad/
COMPREHENSIVE SAFETY ACTION PLAN 56
Methodology
The locally defined equity index (“index”) of transportation disadvantaged populations was calculated for each tract, formulated by aggregating the populations within the specified categories and then dividing by the tract’s total population. People fitting into multiple categories (for instance, people with a disability who are also over the age of 65) are counted multiple times. The higher the index number, the more disadvantaged the population is with respect to transportation. The formula used to develop the segmented transportation disadvantaged population scores is defined as follows:

Where the variables represent:
Eld: Number of residents over 65 years of age
Yth: Number of residents under 18 years of age
NH: Number of non-white or Hispanic residents
LEP: Number of residents with limited English proficiency
Pov: Number of residents below 200% of the poverty threshold
HH: Average household size
Veh: Number of households without vehicle access
Dis: Number of residents with a disability
Crwd: Number of crowded households
Pop: Total population of the Census tract
These factors were evaluated for each census tract and then normalized by total population, to create an index score for each census tract in the WFRC region. The index reveals the scale of the disadvantage experienced by people in critical census tracts. The index was then overlaid with areas of known or anticipated safety risks. This analysis identified corridors where safety enhancements are needed and where communities are most disadvantaged in terms of transportation. The worst-scoring sections of state, federalaid, and local roads on the high-risk network were identified for each community within the CSAP study area. This approach helps cities recognize roadway sections that best meet equity-based criteria for competitive federal SS4A implementation grants. As recommendations were developed for individual corridors and intersections, planners and engineers considered how various safety countermeasures would uniquely impact transportation-disadvantaged communities.
DRAFT

COMPREHENSIVE SAFETY ACTION PLAN 57
Results and Observations
A review of the ensuing GIS-based index provides some insights on equity needs throughout the region. A full set of Equity Index maps, for each GFA, is included in Appendix D.
In the following figures, the darker-colored census tracts indicate high numbers of people experiencing a lot of transportation disadvantages based on the factors listed above. Figure 6-1 provides a glimpse of central Weber County. As shown, much of the Ogden area is highlighted on the map compared to its neighbors.


Figure 6-2 concentrates on Census Tract 200900 (from Washington Blvd to Monroe and from the Weber to 26th); the data table indicates that of the total population in that tract (4,107 people), half (1,894) are non-white/Hispanic, and almost half (2,058) of them are below federal low-income and poverty thresholds.
Davis County ( Figure 6-3) has few concentrations of transportation-disadvantaged people, but Salt Lake County offers further insights of how people are experiencing transportation challenges, as shown in Figure 6-4. The locally defined index shows a consistent concentration of transportation-disadvantaged people in Salt Lake City’s west side, from State Street west to 5600 West. This index also indicates equity hot spots in Magna, West Valley City, Midvale, Taylorsville, and Kearns.
COMPREHENSIVE SAFETY ACTION PLAN 58 235 89 W Pioneer Rd S 1 9 0 0 W N 2 0 0 0 W W 2 7 0 0 N W 4 0 0 N N 1200 W Wall Av e Ogden Depot Ben Lomond Go f Course Ogden Nature Center H a r r s v i l e H i l l A c r e s F a r r W e s t M a r r o t t S l a t e r v i l l e C i t y 53 104 S 1 9 0 0 W W 2 1 0 0 S Hinkl e y D r W 1 2 h S Wall Av e 31 st S t W 2 4 t h S Ogden Go and Coun ry C ub Ogden Hinck ey Airport R i v e r d a l e M a r r i o t t 15 84 S 1 9 0 0 W N M a in S t W 5 6 0 0 S N M a in S t S 1050 W H l A r Force Base S u n s e t W a s h n g t o n T e r r a c e R o y 235 39 89 Ogden-Web App ied Tech C a r r N o r t h O g d e n 79 1 2 t h S t Cany o n Rd Ha r r s on Blv d Washingt on B v d E Monte Go Course Weber Sta e University F a i r m o n t O a k R d g e A c r e s S o u t h O g d e n O g d e n 84 HarrisonBlvd S 475 E Highway89 USHighway89 Hi A r Force Base Hubbard Go Course U i n t a h W o o d a n d E s t a t e s S o u t h W e b e r H i l A r F o r c e B a s e B i g S k y E s t a t e s N o r d i c V a l e y E s t a t e s B l a k e H o l l e y H e r m t a g e W i l d w o o d 226 Wasatch-Cache Nat Forest Pond S o u t h r i d g e N n e Equity Need Areas High Medium Low Central Weber County
Figure 6-1 – Weber County Equity Index
DRAFT

EQUITY AREAS
TRACT 2009
COMPREHENSIVE SAFETY ACTION PLAN 59
Figure 6-2 – Weber County Equity Index, Census Tract 200900
County Weber County Total Population 4107 Total Households 1895 Population 65 Years and Older 297 Population Under 18 Years 1035 Non White and Hispanic Population 1894 Low Income Population Less than 200% Poverty Level 2058 Population with Limited English Proficiency 426 Households with Zero Vehicles 409 Population of People with a Disability 810 Crowded Households 64 Average Household Size 2.12 Total Equity Index Score 1.83 Equity Priority (High, Medium, Low) High
DRAFT


COMPREHENSIVE SAFETY ACTION PLAN 60 Gr eat S al Lak e 80 Ante ope Island State Park G a r e l d J u n c t i o n 107 89 89 15 Hi l A r Force Base D a v i s S y r a c u s e C l e a r f e l d F a r m i n g t o n K a y s v e L a y t o n Gr ea S a t Lak e 68 201 201 201 15 15 80 80 Sa t Lake C ty Interna onal Airport W e s t B o u n f u l B o u n u l N o r t h S a t L a k e C e n t e r v i e S o u t h S a L a k e S a l t L a k e C i t y 80 M o r g a n S t o d d a r d L t t e o n M i l t o n 80 M o u n t A i r e Equity Need Areas High Medium Low South Davis County Kennecott Copper Corp Pond 154 Sa Lake C ty In ernat ona A rpor P r o g r e s s R i t e r M a p l e w o o d A d d o n 85 171 154 Stonebr dge Golf Course B a c c h u s M a g n a 67 15 W e s t B o u n t i f u W o o d s C r o s s B o u n u 68 68 71 15 15 15 80 S S a t e S t The Country Club Mue er Park Un versi y of Utah This s The P ace He tage Park N o r t h S a t L a k e S o u t h S a t L a k e S a l t L a k e C i t y 195 171 171 215 15 S S t a e S t S a t L a k e M u r r a y H o l a d a y M i l l c r e e k W e s t V a l e y C i t y 80 M o u n A i r e M e r r y w o o d 215 M o u n t O l y m p u s Equity Need Areas High Medium Low Salt Lake City
Figure 6-3 – Davis County Equity Index
DRAFT
Figure 6-4 – Salt Lake City Equity Index

COMPREHENSIVE SAFETY ACTION PLAN 61
County Salt Lake County Total Population 3880 Total Households 1435 Population 65 Years and Older 167 Population Under 18 Years 1254 Non White and Hispanic Population 2508 Low Income Population Less than 200% Poverty Level 1685 Population with Limited English Proficiency 332 Households with Zero Vehicles 74 Population of People with a Disability 501 Crowded Households 140 Average Household Size 2.7 Total Equity Index Score 1.81 Equity Priority (High, Medium, Low) High
Figure 6-5 – Salt Lake County Equity Index, Census Tract 112406
EQUITY AREAS TRACT 112406
Figure 6-5 focuses on Midvale’s Census Tract 112406, from I-15 to the Jordan River and between Midvale’s Center Street and 900 South.
DRAFT
Contributing factors for identifying this census tract as an equity priority area are likely that 64% of its 3,880 residents (2,508 people) are listed as non-white or Hispanic, and about 43% of its residents (1,685 people) are below the federal poverty line. This tract also has more crowded households than its neighbors, meaning there are more households where residents are sharing bedrooms or sleeping in non-bedroom areas – with 140 crowded households, and an average household size of 2.7, that equates to around 378 people are living in overcrowded conditions, or about 10% of this tract’s overall population.
Role in Identifying Projects
The locally defined equity index was overlaid with the roadway segments identified as needing safety improvements to understand which corridors would most benefit people that are experiencing the most challenges regarding their daily transportation needs. As case study project sheets were developed throughout the WFRC region (as discussed in Chapter 7), each project was flagged as being in a high-, medium-, or low-equity priority area.
Projects in high-equity priority areas are in communities where transportation challenges are felt most deeply, and which offer the most benefit to communities experiencing transportation disadvantages.
Elevated attention should be given to these projects when considering funding applications, as they are most likely to compete well for the SS4A Grant Program and other grant funding.
DRAFT

COMPREHENSIVE SAFETY ACTION PLAN 62

7. STRATEGIES AND SOLUTIONS
STRATEGIES AND SOLUTIONS
Strategy Toolbox by Safe System Elements
A key outcome of CSAP is a set of projects and strategies to address specific safety needs that can be implemented to reduce the frequency of fatalities and serious injuries.
The Safe System Approach encourages designing transportation systems with a multi-layered safety net. If one countermeasure fails, another will help prevent a crash or, in the event of a crash, lessen the likelihood of serious injury or death. The safety net includes proven countermeasures designed to protect all road users, especially people not in motor vehicles.
As introduced in Chapter 3, FHWA encourages transportation agencies to consider widespread implementation of Proven Safety Countermeasures, organized around the focus areas of speed management, intersections, roadway departures, or pedestrians/ bicyclists.
Safety Countermeasures Toolbox
To assist agencies in the WFRC to select effective countermeasures, the Proven Safety Countermeasures, and other strategies were compiled into a Countermeasure Toolbox ( Appendix F ). Countermeasures were identified from sources including those listed at right.
The CSAP recommends that agencies select locations identified in the safety analysis and use the Countermeasure Toolbox to choose corresponding effective strategies to implement in order to address the safety needs identified in the analysis. Toolbox countermeasures are organized into segment-related countermeasures, intersectionrelated countermeasures, and non-engineering countermeasures. As available and applicable, the following information is provided for each countermeasure identified in the toolbox:
e Emphasis Area/Crash Problem
e Safety Countermeasure
e Crash Modification Factor (CMF) Value
e Unit Cost
Countermeasures Effectiveness
POTENTIAL SAFETY IMPROVEMENTS RESOURCES
FHWA’s Proven Safety Countermeasures
CMF Clearinghouse Website
UDOT’s Countermeasure Fact Sheets
NHTSA’s Countermeasures that Work
e Cost Effectiveness
e Application Guidance
e Urban/Rural
e Signalized/ Unsignalized
The Countermeasure Toolbox includes information about the effectiveness of each of the countermeasures.
Effectiveness is measured in terms a Crash Modification Factor (CMF) or a Crash Reduction Factor (CRF). CMFs and CRFs are complementary factors used to compute the anticipated number of crashes after implementing a countermeasure or safety treatment at a specific site.
A CMF is a multiplicative factor that can be multiplied by the number of crashes at a specific site to compute the number of anticipated crashes after a countermeasure is implemented.
A CRF is similar to a CMF but is stated as the percent reduction factor that when applied to the number of crashes at a specific site, results in the number of crashes anticipated to be reduced after a countermeasure is implemented. CMF and CRF calculations are presented in Figure 7-1 and Figure 7-2 , respectively.

Figure

COMPREHENSIVE SAFETY ACTION PLAN 64
Figure 7-1 – Crash Modification Factor Calculation
7-2 – Crash Reduction Factor Calculation
DRAFT
A CRF or CMF should be regarded as a generic estimate of the effectiveness of a countermeasure. The estimate is a useful guide, but it remains necessary to apply engineering judgment and to consider sitespecific environmental, traffic volume, traffic mix, geometric, and operational conditions which will affect the safety impact of a countermeasure. Actual effectiveness will vary from site to site.20
The Countermeasure Toolbox includes “Cost Effectiveness” that considers both the cost of the countermeasure and the CRF. A “HIGH” cost effectiveness represents a countermeasure with a low implementation cost and a high potential to reduce crashes. Conversely, a “LOW” cost effectiveness represents a countermeasure with a high cost and low potential to reduce crashes, as illustrated in Figure 7-3
Safety Priorities and Improvement Case Studies
Chapter 5 describes the process led to the Composite High Risk Network. The Composite High Risk Network is comprised of the top 10% of State Route, Federal Aid Route, intersections, and high priority local street segments for the entire WFRC area.

Recognizing the impracticality of preparing improvements and cost estimates, within the scope of this CSAP, for every segment and intersection included in the Composite High Risk Network, C ase study projects were developed to provide an example and relative cost of the type of projects that could be developed for the Composite High Risk Network segments and intersections. The case studies were identified from among the priorities identified in the Composite High Risk Network. Up to three case study projects were identified for each jurisdiction within the study area. A wide range of project types were identified based on the safety analysis and jurisdiction input.
Once the case study project locations were identified, Case Study Project Information Sheets were prepared for each case study location. These project sheets included introductory information, jurisdiction(s), SHSP emphasis areas, equity priority, location description, project map, segment information, safety analysis summary, segment crash history, key intersections, intersection crash history, project description, proven safety countermeasures, applicable countermeasure improvement, opinion of probable costs, and potential additional improvements.
Case Study Project Sheet Overview
Figure 7-4 and Figure 7-5 provide an orientation of the Case Study Project Sheets and the information found within each page.
The Case Study Project Information Sheets are intended to provide examples of safety-focused projects that jurisdictions could implement. Countermeasures or improvements were selected from the Countermeasures Toolbox ( Appendix F ). As jurisdictions desire to move toward project implementation, additional detailed analysis is required to confirm the strategies recommended in the Case Study Project Information Sheets. Informed by additional analysis, it is expected that jurisdictions will modify the suggested improvements or quantities based on local knowledge.
Case Study Project Information Sheets could not be prepared for every location identified as a safety need by the safety analysis. While it is expected that jurisdictions may use the Case Study Project Information Sheets to inform an SS4A grant application, the jurisdiction should also consider developing projects for locations identified in the safety analysis, but for which Case Study Project Information Sheets were not prepared. The Countermeasures Toolbox is a starting location for selecting countermeasures to implement. The full set of segments and intersections for which a safety need was identified are included in the GFA maps in Appendix D. Segments and intersections with a safety need are also included in the StoryMap accessible at wfrcsafetyplan.org
Case Study Project Sheets
Case Study Project Information Sheets were prepared for locations listed in Tables 7-1 through 7-11. Case Study Project Information Sheets were for each jurisdiction, organized by GFA, are provided in Appendix D.
20 Toolbox of Countermeasures and Their Potential Effectiveness for Pedestrian Crashes, available at https://safety.fhwa.dot.gov/ped_bike/tools_solve/ped_ tctpepc/#:~:text=A%20CRF%20is%20the%20percentage,is%20provided%20for%20each%20countermeasure
COMPREHENSIVE SAFETY ACTION PLAN 65
Figure 7-3 – Countermeasure Toolbox Cost Effectiveness
DRAFT

COMPREHENSIVE SAFETY ACTION PLAN 66
7-4 – Example Case Study Project
1
Project Information Project Title General Intro Information General Location Information Identified by Safety Analysis Segment Only Information Historical Crash History
Crash Types that are Higher than Expected for Similar Facility Types Location Identified Based on these Safety Analysis
Figure
Information Sheet, Page
General
Key Intersections
DRAFT

COMPREHENSIVE SAFETY ACTION PLAN 67
General Project Description Applicable FHWA Proven Safety Countermeasures SegmentCountermeasures from Toolbox Intersection Countermeasures from Toolbox High Level Opinion of Probable Project cost Estimates Local Match Need for SS4A Implementation Grant Additional Improvements to Consider but not Included in Cost Estimates Not Included in Project Cost DRAFT
Figure 7-5 – Example Case Study Project Information Sheet, Page 2
COMPREHENSIVE SAFETY ACTION PLAN 68
Study
Locations
County GFA
Table 7-1 – Case
Project
- South Box Elder and North Weber
Study Project Locations – West Weber County GFA
BOX ELDER & NORTH WEBER COUNTY GFA PROJECT ID JURISDICTIONS PROJECT NAME 1.1.1 Brigham City 500 West from Forest Street to 1150 South 1.1.2 Brigham City Systemic Unsignalized Intersection Improvements 1.1.3 Brigham City Main Street Signalized Intersection Improvements: 990 South, 700 South, 200 South, and 100 South 1.2.1 Perry US 89 from 1100 South to 3600 South 1.3.1 Willard US 89 from North Willard Limits to South Willard Limits 1.4.1 Farr West 1800/Harrisville Road from 2750 West to 1200 West 1.4.2.1 Farr West, Pleasant View 2700 North (SR-134) from 2575 West to US 89 1.4.3.1 Farr West, Marriott-Slaterville 1200 West from 2700 North to 17th Street 1.5.1 Harrisville Harrisville Road from 1200 West to US 89 1.5.2 Harrisville Larsen Lane from Harrisville Road to Washington Boulevard 1.5.3.1 Harrisville, Pleasant View, Uintah, Ogden, South Ogden US 89 from SR 134 to I-84 1.6.1 North Ogden 2600 North from Washington Boulevard to Mountain Road 1.6.2 North Ogden Washington Boulevard Intersection Improvements: 2600 North, 2650 North, 3100 North, and 2300 North 1.6.3 North Ogden 2600 North, 2650 North from Washington Boulevard to 550 East 1.7.1.1 Pleasant View, Farr West 2700 North (SR-134) from 2575 West to US 89
PROJECT ID JURISDICTIONS PROJECT NAME 2.8.1 Hooper Unsignalized Intersection Improvements 2.8.2 Hooper SR 97 (5500 South) from 5900 West to 4300 West 2.9.1 Marriott-Slaterville Pioneer Road from 1500 North to 1200 West 2.9.2.1 Marriott-Slaterville, Farr West 1200 West from 2700 North to 17th Street 2.10.1 Plain City 1975 North/ 1900 North from 4650 West to 2750 West 2.11.1 Roy 6000 South from 4300 West (SR 108) to 1900 W (SR 126) 2.11.2.1 Roy, West Haven, Sunset 1900 West (SR 126) from SR 39 to 2400 North 2.12.1 West Haven 2550 South from 3500 West to 1900 West 2.12.2.1 West Haven, Sunset, Roy 1900 West (SR 126) from SR 39 to 2400 North DRAFT
Table 7-2 – Case
SOUTH
WEST WEBER COUNTY GFA
COMPREHENSIVE SAFETY ACTION PLAN 69
GFA
WEBER & MORGAN COUNTY GFA PROJECT ID JURISDICTIONS PROJECT NAME 3.13.1.1 Weber County Ogden Canyon (SR 39) from Valley Drive to SR 226 3.13.2 Weber County SR 158 from SR 39 to Powder Ridge Road 3.13.3 Huntsville, Weber County SR 39 from 7800 East to Ant Flat Road 3.14.1 Morgan, Morgan County Old Highway Road (SR 167) from Monte Verde Drive to 300 North (SR 66) 3.14.2 Morgan, Morgan County SR 66 from 700 East (I-84) to Canyon Road (SR-65)
Table 7-3 – Case Study Project Locations – East Weber & Morgan County
EAST
GFA
PROJECT ID JURISDICTIONS PROJECT NAME 4.15.1 Ogden, South Ogden Monroe Boulevard Intersections 4.15.2.1 Ogden, Harrisville, Pleasant View, Uintah, South Ogden US 89 from SR 134 to I-84 4.15.3.1 Ogden, South Ogden 40th Street from Riverdale Road to Harrison Boulevard 4.15.4.1 Ogden, South Ogden Harrison Boulevard (SR 203) from 12th Street to US 89 4.16.1 Riverdale Riverdale Road (SR 26) from I-15 to 40th Street 4.16.2 Riverdale 1050 West (SR 60) from Riverdale Road (SR 26) to Weber Drive 4.16.3.1 Riverdale, South Weber Weber Drive (SR 60) from 1050 West to Canyon Meadows Drives 4.17.1.1 South Ogden, Ogden Harrison Boulevard (SR 203) from 12th Street to US 89 4.17.2.1 South Ogden, Ogden, Harrisville, Pleasant View, Uintah US 89 from SR 134 to I-84 4.17.3.1 South Ogden, Ogden 40th Street from Riverdale Road to Harrison Boulevard 4.18.1.1 Uintah, South Ogden, Ogden, Harrisville, Pleasant View US 89 from SR 134 to I-84 4.19.1 Washington Terrace 500 East from US 89 to 5600 South 4.19.2 Washington Terrace 350 East from Laker Way to 5000 South 4.19.3 Washington Terrace 4400 South from Ridgeline Road to US 89
Table 7-4
– Case Study Project Locations – Central Weber County
CENTRAL WEBER COUNTY GFA
DRAFT
COMPREHENSIVE SAFETY ACTION PLAN 70
SALT LAKE CITY GFA PROJECT ID JURISDICTIONS PROJECT NAME 5.20.1 Salt Lake City Redwood Road from 2300 North to 2100 South (SR 201) 5.20.2 Salt Lake City 900 West from 1000 North to SR 201 5.20.3 Salt Lake City 800 South from 1000 West to 700 East
Locations
GFA PROJECT ID JURISDICTIONS PROJECT NAME 6.21.1.1 Clearfield, Layton 700 South (SR 193) from 1000 West to US 89 6.21.2.1 Clearfield, Syracuse Antelope Drive (SR 108) from 2500 West to 500 West 6.21.3 Clearfield 1000 East from 700 South (SR 193) to Antelope Drive (SR 108) 6.22.1.1 Clinton, Roy 2000 West (SR 108) from 6000 South (Roy) to 2050 North 6.22.2 Clinton 1800 North (SR 37) from 3000 West to 2000 West 6.23.1 Layton 2200 West from Antelope Drive to Gentile Street 6.23.2 Layton North Hill Field Road (SR 232) from 700 South (SR 193) to Main Street (SR 126) 6.23.3 Layton Main Street (SR 126) from Antelope Drive to Layton Parkway 6.23.4.1 Layton, Clearfield 700 South (SR 193) from 1000 West to US 89 6.24.1.1 South Weber, Riverdale Weber Drive from 1050 West to Canyon Meadows Drives 6.25.1.1 Sunset, Roy Main Street (SR 126) from 600 South (Roy) to 800 North 6.26.1 Syracuse 2000 West (SR 108) from SR 193 to SR 127 6.26.2.1 Syracuse, Clearfield Antelope Drive (SR 108) from 4000 West to 500 West 6.26.3 Syracuse 2000 West from Antelope Drive to 2700 South 6.27.1 West Point Unsignalized Intersections; West Point
Table 7-5 – Case Study Project Locations – Salt Lake City GFA
Table 7-6 – Case Study Project
– North Davis County GFA NORTH DAVIS COUNTY
DRAFT
COMPREHENSIVE SAFETY ACTION PLAN 71 Table 7-7 –
Case Study Project Locations – South Davis County GFA
PROJECT ID JURISDICTIONS PROJECT NAME 7.28.1 Bountiful 200 West from 2600 South to Lyman Lane 7.28.2 Bountiful Main Street/400 North from Pages Lane/1600 North to 500 West 7.28.3 Bountiful 500 South (SR 68) from 500 West to Orchard Drive 7.29.1 Centerville Main Street (SR 106) from 1700 South to Pages Lane 7.30.1 Farmington 650 West from State Street to Glovers Lane 7.30.2 Farmington Main Street (SR 106) from US 89 to 1700 South 7.30.3 Farmington 200 West/Frontage Road from State Street to Glovers Lane 7.31.1 Fruit Heights Eastoaks Drive from Mountain Road to 1800 East 7.32.1 Kaysville 200 North from Angel Street to 600 West 7.32.2 Kaysville Main Street (SR 273)/200 North from Burton Lane to 600 West 7.32.3 Kaysville Main Street from 200 North to 400 West 7.33.1 North Salt Lake US 89 from 1100 North/2600 South to Frontage Road 7.33.2 North Salt Lake 1100 North/2600 South from Redwood Road to 800 West 7.33.3 North Salt Lake Redwood Road (SR 68) from 1100 North to I-215 7.34.1 West Bountiful 500 South (SR 68) from 1100 West to I-15 7.35.1 Woods Cross Redwood Road from 500 South to 1100 North 7.35.2 Woods Cross 1100 West from 1500 South to 1100 North 7.35.3.1 Woods Cross, Bountiful 500 West from 500 South to Main Street
SOUTH DAVIS COUNTY GFA
DRAFT
COMPREHENSIVE SAFETY ACTION PLAN 72 Table 7-8 –
Study Project Locations –
VALLEY GFA PROJECT ID JURISDICTIONS PROJECT NAME 8.36.1 Alta Little Cottonwood Canyon (SR 21) Unsignalized Intersection: Bypass Road, Michigan City Road, day Lodge Road, Hellgate Road, and Collins Road 8.37.1 Brighton Big Cottonwood Canyon (SR 190) from Cardiff Fork Road to Guardsman Pass Road 8.38.1.1 Cottonwood Heights, Holladay Wasatch Boulevard from I-215 to Fort Union Boulevard 8.38.2 Cottonwood Heights Fort Union Boulevard from Union Park Avenue to 3000 East 8.38.3 Cottonwood Heights Creek Road from Union Park Avenue to 3500 East 8.39.1 Holladay Lincoln Lane: Lynne Lane to 2700 East 8.39.2.1 Holladay, Millcreek Highland Drive from 3000 South to SR 152 8.39.3 Holladay 300 East from 3000 South to Lincoln Lane 8.40.1.1 Millcreek, Holladay, South Salt Lake 3900 South from I-15 to Wasatch Boulevard 8.40.2.1 Millcreek, Holladay Highland Drive from 3000 South to SR 152 8.40.3 Millcreek 1300 East from 3300 South to Murray Holladay Road 8.41.1 Sandy School Area Improvements from 1000 East to 11000 South 8.41.2 Sandy Auto Mall Drive from 10600 South to State Street 8.41.3 Sandy 9400 South from Monroe Street to SR 209 8.41.4.1 Sandy, White City 10600 South from 700 East to 1300 East 8.42.1 White City White City Trail Intersections: Lake Spur Drive, Carnation Drive, and Sego Lily Drive 8.42.2.1 White City, Sandy 10600 South from 700 East to 1300 East 8.43.1 Emigration Emigration Canyon Road from Crestview Drive to Pincecrest Canyon Road
Case
East Salt Lake Valley GFA EAST SALT LAKE
DRAFT
COMPREHENSIVE SAFETY ACTION PLAN 73
7-9 –
PROJECT ID JURISDICTIONS PROJECT NAME 8.36.1 Alta Little Cottonwood Canyon (SR 21) Unsignalized Intersection: Bypass Road, Michigan City Road, day Lodge Road, Hellgate Road, and Collins Road 8.37.1 Brighton Big Cottonwood Canyon (SR 190) from Cardiff Fork Road to Guardsman Pass Road 8.38.1.1 Cottonwood Heights, Holladay Wasatch Boulevard from I-215 to Fort Union Boulevard 8.38.2 Cottonwood Heights Fort Union Boulevard from Union Park Avenue to 3000 East 8.38.3 Cottonwood Heights Creek Road from Union Park Avenue to 3500 East 8.39.1 Holladay Lincoln Lane: Lynne Lane to 2700 East 8.39.2.1 Holladay, Millcreek Highland Drive from 3000 South to SR 152 8.39.3 Holladay 300 East from 3000 South to Lincoln Lane 8.40.1.1 Millcreek, Holladay, South Salt Lake 3900 South from I-15 to Wasatch Boulevard 8.40.2.1 Millcreek, Holladay Highland Drive from 3000 South to SR 152 8.40.3 Millcreek 1300 East from 3300 South to Murray Holladay Road 8.41.1 Sandy School Area Improvements from 1000 East to 11000 South 8.41.2 Sandy Auto Mall Drive from 10600 South to State Street 8.41.3 Sandy 9400 South from Monroe Street to SR 209 8.41.4.1 Sandy, White City 10600 South from 700 East to 1300 East 8.42.1 White City White City Trail Intersections: Lake Spur Drive, Carnation Drive, and Sego Lily Drive 8.42.2.1 White City, Sandy 10600 South from 700 East to 1300 East 8.43.1 Emigration Emigration Canyon Road from Crestview Drive to Pincecrest Canyon Road
Table
Case Study Project Locations – West Salt Lake Valley GFA WEST SALT LAKE VALLEY GFA
DRAFT
COMPREHENSIVE SAFETY ACTION PLAN 74
SALT LAKE VALLEY GFA PROJECT ID JURISDICTIONS PROJECT NAME 10.52.1 Bluffdale 14600 South from SR 68 to I-15 10.52.2 Bluffdale 2700 West & 14400 South Intersection Improvements 10.53.1 Draper 12300 South from 700 East to 1300 East 10.53.2 Draper Minuteman Drive & Highland Drive 10.54.1.1 Herriman, Riverton 13400 South from 6400 West to Bangerter Highway 10.54.2 Herriman 12600/Herriman Boulevard & Anthem Park Boulevard 10.54.3 Herriman Sentinel Ridge Boulevard: 14230 South to 13400 South 10.55.1.1 Riverton, Herriman 13400 South from 6400 West to Bangerter Highway 10.56.1 South Jordan South Jordan Parkway from Bangerter Highway to Redwood Road 10.56.2 South Jordan Daybreak Parkway/SR 175 from 4000 West to 3600 West 10.56.3 South Jordan Redwood Road and Shields Lane Intersection Improvements 10.57.1 Copperton SR 209/SR 48 from Kennecott Road to 10200 South
Table 7-10 – Case Study Project Locations – South Salt Lake Valley GFA SOUTH
COUNTY GFA PROJECT ID JURISDICTIONS PROJECT NAME 11.58.1 Erda SR 36 from Bates Canyon Road to Cimmarron Way 11.58.2 Erda Bates Canyon Road from Stratsford Drive to Droubay Road 11.58.3 Erda Erda Way from 400 West to Droubay Road 11.59.1 Grantsville Sheep Lane & Erda Way 11.59.2 Grantsville Sheep Lane from SR 138 to SR 112 11.59.3 Grantsville Willow Street from Main Street to Durfee Street 11.60.1.1 Lake Point, Tooele, Erda SR 36 from I-80 to Bates Canyon Road 11.61.1 Rush Valley SR 199 from Stookey Lane to SR 36 11.61.2 Rush Valley Main Street/Mormon Trail Road from Meadow Lane to SR 199 11.62.1 Stockton SR 36 from Ben Harrison Road to Honerine Avenue 11.63.1.1 Tooele, Erda SR 36 from Cimmarron Way to Mountain Road 11.63.2 Tooele Vine Street, 200 South, 100 South from Coleman Street to 200 West 11.63.3 Tooele 600 North, 400 North, Utah Avenue, Vine Street, & 100 South from West to East 11.64.1 Vernon SR 36 from Mule Skinner Road to Country Road 20337 11.65.1 Wendover 1st Street & Wendover Boulevard Intersection Improvements 11.64.1 Vernon SR 36 from Mule Skinner Road to Country Road 20337 11.64.1 Vernon SR 36 from Mule Skinner Road to Country Road 20337
Table 7-11 – Case Study Project Locations – Tooele County GFA TOOELE
DRAFT

8. BEST PRACTICES FOR POLICIES AND PROCEDURES
BEST PRACTICES FOR POLICIES AND PROCEDURES
This section outlines best practices for safety policies, processes, education, and enforcement. The analysis and recommendations are rooted in the core elements of the Vision Zero and Safe System Approach, in recognition that moving the needle on safety will not come from individual capital infrastructure projects alone. Rather, change must be prioritized across all community operations to see meaningful improvements.
These recommendations highlight effective program and policy opportunities that address a demonstrated safety need and are suited to the context of WFRC communities. While these recommendations serve as a resource for general safety improvements, they also support individual communities with a foundation for future SS4A grant applications.
This chapter is separated into the following sections:
e Overview of the benchmarking process
e Regional trends for safety policies and plans
e Recommended policies and strategies
Benchmarking Process
To evaluate the current state of practice on safety policy, 108 local and county general, transportation, active transportation, and transit station area plans across 68 communities and agencies in the WFRC region were examined. The assessment focused on national best-practice benchmarks to assess the level of safety commitments in WFRC communities. It is important to note that these benchmarks primarily rely on the evaluation of published local planning documents and materials, some of which have remained unchanged for years. Consequently, they offer a comprehensive external overview, but lack an “inside look” into a community’s processes. Therefore, these benchmarks serve as a general qualitative evaluation of regional safety planning progress undertaken to highlight core areas of focus.
Table 8-1 summarizes the benchmark categories used in the assessment, which are organized by Safe System Approach element. These benchmarks provide a framework for an effective safety approach and can inform stronger safety-related policies and programs.
DRAFT
STRATEGY CATEGORY STRATEGY DETAIL
SAFETY PLANNING AND CULTURE
Culture and Commitment
Meaningful Engagement
Data and Analysis
Funding
Development Review
Education
Planning materials commit to the goal of eliminating traffic fatalities and serious injuries within a specific timeframe while integrating Safe System principles across administrative, programming, and evaluation frameworks.
Meaningful and accessible community engagement efforts and materials toward Vision Zero strategy and implementation are employed, with a focus on equity.
A map of the community’s fatal and serious injury crash locations is developed, regularly updated, and used to guide priority actions and funding. Data is also obtained and analyzed in an innovative fashion.
Funding recommendations and allocations are intended to advance projects and policies for safe, equitable multimodal travel, with a prioritization framework that emphasizes roadways and projects with the highest safety impact.
Communities recommend leveraging new developments with improvements to identify mitigation and cost-sharing opportunities.
SAFE USERS
Proposed educational safety programs target high-risk behaviors and audiences and are to be used alongside demonstration projects to raise awareness of new designs, gain stakeholder support, and gather public feedback.
COMPREHENSIVE SAFETY ACTION PLAN 76
Table 8-1 – Core Elements of Safety Planning
STRATEGY CATEGORY STRATEGY DETAIL
Progressive Enforcement
Demographic Data
Collision Avoidance
Kinetic Energy Reduction
Policies and Tradeoffs
Innovation
Supportive Infrastructure
Fleet Management
Vehicle Data
Design and Operations
Communities examine and document the effects of traffic safety enforcement and surveillance and reallocate enforcement efforts to focus on behaviors and locations most associated with death and serious injury.
Strategies are developed and implemented for robust demographic data collection in crash reporting.
SAFE ROADWAYS
Recommended proven countermeasures separate users in space, separate users in time, and increase attentiveness and awareness, particularly for active transportation users across ages and abilities.
Communities advocate for established measures to control vehicle speed and collision angles, and assess intersection design and control decisions during planning, prioritizing reductions in kinetic energy transfer in alignment with FHWA guidance.
DRAFT
Digital Enforcement*
Policy and Training
Crash Investigation
Partnerships
Source: Fehr & Peers, 2023
Functional class and modal priority are assigned to roadways for targeted safety countermeasures and efficient tradeoff decisions, evaluated at a network scale. Communities prioritize safety and accessibility for all users during construction and road maintenance projects.
Intelligent transportation systems (ITS) infrastructure is included on roadways to facilitate data collection and analysis, promoting proactive system management.
SAFE VEHICLES
Communities provide or plan for supportive infrastructure for dynamic curbside management, autonomous vehicles, and infrastructure-to-vehicle communication to provide warnings to drivers that support safer driving behavior.
Safer operations of public and commercial vehicles are addressed through a transition plan of the vehicle fleet to lower-mass and safety feature enhanced vehicles, heavy vehicle route restrictions to avoid high-pedestrian areas, and curbside management programs to limit user conflicts around stopped or loading vehicles.
Data is collected on the involvement of autonomous vehicles in crashes for future data analysis and to inform local design and policies.
SAFE SPEEDS
Travel speeds are set and managed to achieve safe conditions for the specific roadway context and to reduce risk of fatal and serious injuries for all road users, particularly those most at risk in crashes. Proven speed management policies and practices are prioritized to reach this goal.
Speed safety cameras and other digital enforcement technologies are implemented with an emphasis on fair fee structures.
Speed limit setting methodologies consider land use and roadway context for human-scale factors and provide staff training on speed management with a focus on minimizing fatalities and serious injuries.
POST CRASH CARE
Collision reporting practices promote accurate data collection and establish a feedback loop to share key insights with designers and inform outreach and education.
Data is shared among agencies, first responders, and hospitals for a comprehensive safety overview. Connect with victims' families and the advocacy community to provide support and resources, fostering partnerships in outreach and education.
*Automated enforcement is currently limited by Utah state statute, Utah Code Section 41-6a-608
COMPREHENSIVE SAFETY ACTION PLAN 77
Regional Trends for Safety Policies and Plans
The results of the benchmarking process are summarized for each core Safe System Element below. Organizing each benchmark into a thematic category provides a comprehensive overview of documented safety practices in the region. Out of 108 planning documents, 29 of 42 total benchmarking metrics were identified or recommended within the documents, to varying degrees of frequency. In some categories, the region aligns with suggested practice, while in other areas, more work is needed to fully integrate safety into community practices. The strengths and gaps in policies around the region are described in this section.
Strengths of Regional Safety Policies
Several key areas of focus arose as consistent achievements by communities in the region. The most identified benchmarking themes are described below.
Data-Driven Safety Analysis: Around a third (37%) of plans reviewed integrate a data-driven safety analysis. These plans use data to identify overall safety trends in their region but may also target crash types or traffic movements, incorporating systemic profiles, roadway factors, and mode-specific conditions. They use this data lens to make clear policy, program, and project recommendations for the community to act upon.
Focused Network Screening: Recorded as an individual element within the Data and Analysis category of the Safety Planning and Culture benchmark category, 22% of plans analyze fatal and serious injuries visually across the roadway system. This was particularly important, as planning efforts have historically either evaluated fatal and serious injuries statically in charts or not worked to distinguish crashes on the transportation network by severity, instead only broadly identifying areas of frequent crashes and thereby missing key contextual information about local safety in the process. While this is less apparent in older planning efforts, plans within the last five years often included this type of data, particularly those centered around active transportation. As planning cycles result in plan updates throughout the region, this trend bodes well for the likelihood of implementing and gathering similar safety data, potentially representing a yet untapped regional capacity.
GIS Inventory and Contextualization: 33% of plans incorporate GIS inventory of crash and roadway data, including details such as bikeways, sidewalks, and intersection controls. Contextualizing roadways with local information is key, enabling the identification of crash patterns or correlations often missed in traditional analyses.
Recommendation of Countermeasures: Approximately 51% of plans recommend clear countermeasures to separate users in space and time. These plans consistently reference and advocate for high-quality designs and approaches, particularly to local infrastructural assets that support traffic calming and active transportation.
Complete Connectivity for Pedestrians and Bicyclists: Recorded as a category within the Safe Users category, 49% of plans emphasize the recommendation of complete connectivity for pedestrians and bicyclists, catering to all ages and abilities. While this is a broad recommendation, it highlights communities’ desires to center multimodal safety as a core community value.
This benchmarking assessment can be compared against regional crash data, shown below in Figure 8-1 which provides context for understanding where to improve safety measures. Crashes at intersections and roadway departures dominate, accounting for a significant number of both serious injuries and fatalities. A notable finding from previous crash analysis work 21 is that half of all crashes occur around intersections, particularly on higher-capacity roadways like principal arterials and collectors, with left turns making up a considerable share of intersection crashes. Active transportation-related crashes, mid-block urban incidents, and rearend collisions also contribute to the overall figures. Together, roadway departures and active transportation crashes hold the highest share of fatalities for the region by a wide margin. Although not the sole considerations for future planning efforts, especially given the regional focus of this analysis, these types of crashes signify some of the highest policy concerns across the region.
COMPREHENSIVE SAFETY ACTION PLAN 78
21 Wasatch Front Regional Council September 2023 Comprehensive Safety Action Plan, Technical Memorandum #1: Safety Analysis. Kimley-Horn, 2023.
DRAFT

Gaps in Regional Safety Policies
The Safe System Approach is a relatively new idea in the region, and as such, gaps are to be expected. It should be noted that it is unlikely for any community to check each box, due to the range of safety efforts represented in the evaluation matrix. The following areas represent key opportunities for enhancement across the region.
Vision Zero Commitment: Although the adoption of a Regional Safety Resolution by WFRC will render individual cities eligible for SS4A grant funding, each community can demonstrate its own commitment to the Safe System Approach in order support greater safety institutionalization and strengthen their eligibility for safety funding. Currently, there is no documented planning evidence of a WFRC community adopting a Vision Zero commitment, except for Salt Lake City. In early 2023, Salt Lake City announced a resolution to adopt Vision Zero and has begun work integrating Vision Zero principles into planning project work and has established a Vision Zero task force.22 There are also clues that regional Vision Zero acceptance may be gradually changing; for example, UDOT adopted the Zero Fatalities program in 201723 , and the City of South Salt Lake has an action item to eventually adopt a Vision Zero resolution.
Crash Data Collection: Though noted as a regional strength, the benchmarking process and crash analysis highlight a need for improvements to data collection. Safety data is increasingly integrated into planning efforts, but there are frequent gaps that prevent a more thorough crash analysis, falling primarily into three categories:
e Availability of Driver Contributing Factors
e Availability of Roadway Contributing Factors
e Integration of Demographic Data
COMPREHENSIVE SAFETY ACTION PLAN 79
Salt Lake City Vision Zero Website 23 UDOT Zero Fatalities Program Website
22
Figure 8-1 – Fatal and Serious Injury Crashes by Crash Type, 2018-2022
DRAFT
While data utilization is still an area of success for the region, these gaps may highlight why collision analyses found in planning materials have mostly yet to integrate a more thorough form of safety analyses. Because safety comes from a host of contributing factors and sees trends play out differently across communities, the lack of these additional factors in analysis may be missing key systemic issues and result in insufficient planning safety recommendations.
Equity: A key feature in modern safety approaches and funding, efforts to define and highlight issues of equity were found uniformly lacking, only present in seven percent of all plans across relevant benchmarks. This includes not only defining areas of equity and the issues around them but exploring the impact of existing safety approaches on equity groups, particularly regarding enforcement and engagement.
Safe System Approach: While safety as a value is stated in nearly all planning materials, a targeted approach to improving safety is infrequently outlined, and no plans explicitly mention the Safe System Approach. While the Safe System Approach does not represent the only avenue to safety improvements, it is important to recognize this lack of mention, as it may indicate a gap in regional safety planning knowledge among staff. Additionally, plans do not identify opportunities to identify safety focus or training to any staff member or internal group, keeping the responsibility of safety dispersed across departments rather than unified and focused. Worth noting is the tendency of the region to prefer approaches to safety centered around individual responsibility rather than systemic responsibility, exemplified by recommendations to improve outreach and education, and broadly increase traffic enforcement efforts.
Partnered Approaches: Additionally, the integration of partnered approaches for safety improvement, specifically concerning post-crash care, has been notably absent from all the planning materials. Recommendations to build direct partnerships with external organizations, enabling the sharing of pertinent data and establishing feedback mechanisms, were not evident in the documentation. Despite potential existing relationships, these collaborations were not formally acknowledged within the planning materials nor their connection to local roadway designers, indicating a need for greater visibility and emphasis on these vital safety strategies in future planning initiatives.
DRAFT
Kinetic Energy Transfer: The assessed plans do not include specific design standards with the express purpose of reducing kinetic energy transfer in crash events, particularly at intersections, noted as a driving crash area. Kinetic energy transfer is crucial in crash events and is influenced by factors like speed and mass—vehicles that are larger or move faster transfer more of that kinetic energy when they crash, increasing the damage and injury sustained by others. Implementing design standards aligned with Safe System Approach principles and FHWA guidance, particularly through speed management, modern context-appropriate speed limit setting methodologies, and intersection design evaluations, can enhance road safety by reducing the transfer of kinetic energy and therefore the severity of crashes. The absence of such standards may indicate a gap between local regulations and best engineering practices.
Progressive Enforcement: Automated enforcement is currently limited by Utah State Statute, although it has been shown to be effective. Therefore, it has not been recommended in any of the reviewed plans. Additionally, best-practice enforcement strategies, such as high-visibility enforcement campaigns, focused enforcement in problem areas, and an equitable review of both the efficacy and harm of current activities, have yet to be integrated into planning materials. While the Safe System Approach emphasizes a transportation system designed with a reduced reliance on police monitoring, targeted and thoughtful enforcement remains a central piece of the philosophy.
Local Fleets: Local communities have yet to explore the impacts of their own assets on safety beyond infrastructure. Fleets and operations can be particularly impactful, as communities could explore fleet strategies and compositions that provide different sightlines, vehicle weights, and operational speeds.
Highlights of Recommendations
The following recommendations are presented as components of the five Safe System Elements and build upon the strengths of the region while filling gaps identified in planning materials and addressing historic fatal and serious injury crash trends. A more comprehensive set of policy recommendations is available in Appendix C. Broadly speaking, these recommendations are intended for individual communities, either working internally or in partnership with other communities and agencies. Each policy recommendation indicates whether the policy is applicable at a regionwide or local scale and a rough timeline for implementation (short-, medium-, or long-term).
COMPREHENSIVE SAFETY ACTION PLAN 80
Safe Systems Element: Safe Users
IMPROVE DATA COLLECTION PRACTICES
Timeline: Short-Term | Context: Regionwide
Safer systems start with quality data. Good data and effective analysis are key to making sound decisions on the safety, design, and operation of roadways. Unfortunately, more than a quarter of regional crash data lacks sufficient Driver Contributing Factor entries for a reliable analysis of crash trends, indicative of a need for greater consistency and completion of data reporting. Crash reporting entities, such as police departments and emergency services, should seek to investigate issues associated with data gaps. While the reasons behind these data gaps are not clear, they may be a result of technical errors, reporting bias, incomplete report standardization, administrative burden of crash reporting, or simple human error. To counter barriers associated with reporting, local communities, regional agencies, and crash responders could institutionalize strategies to improve reporting performance by recording a commitment to collaborate and review in transportation safety planning efforts.
To support greater data consistency, communities and agencies across the region should also engage in quality control of crash data. While different methodologies exist, a key strategy includes ground truthing. Ground truthing involves comparing a sample of traditionally collected data with other data, such as hospital or insurance claim data, to assess relative accuracy. Another method employs random sampling, investigating small bundles of data entries to evaluate their completeness, assigning a ranking to each sample, or reporting institution to better track issues and improvements.
Resources:
e Utah Crash Report Data Dictionary
e Utah Crash Report Instruction Manual
e Utah Crash Report General Guidance
PRIORITIZE EQUITABLE ENFORCEMENT
DRAFT
e NHTSA Crash Data Improvement Program Guide
e National Safety Council Incomplete Crash Reporting Summary
Timeline: Short-Term | Context: HIN Corridors and Vulnerable Communities
Even with engineering countermeasures in place, road users can fail to obey traffic laws and cause crashes of varying severity. Police enforcement can increase driver awareness and reduce traffic crashes. If enforcement agencies are to improve overall safety in a community and build trust with its members, traffic laws must be applied equitably and with sensitivity toward groups where there may be limited rapport with law enforcement. Whenever possible, communities should investigate, document, and address the impacts of traffic safety enforcement and traffic safety surveillance on underserved groups, integrating it into public-facing performance monitoring mechanisms. Effective partnerships with community and safety stakeholders with health professionals, parents, community organizations, law enforcement, members of the justice system, and nonprofit organizations can help reduce the chances of harmful impacts.
Resources:
e Vision Zero Planning for Equity
e Re-thinking the Role of Enforcement in Traffic Safety
SAFE ROUTES TO SCHOOL
Timeline: Short-Term | Context: Regionwide
e FHWA Equity in Roadway Safety Hub
Active transportation crashes are among the most frequently deadly in the region. and children on their way to school make up one of the most vulnerable user groups on the roads. Communities can collaborate with school districts to use the Safe Routes to School (SRTS) programs that exist within the WFRC region, administered by UDOT, to improve route planning, provide parent/ driver education, collect safety data, and potentially modify roadways to ensure safe routes for all students, particularly students in underserved areas. Many communities use their SRTS programs to highlight areas in need of impactful investments, steering roadway capital improvements. Individually, communities and schools/school districts can bolster SRTS programs by implementing
COMPREHENSIVE SAFETY ACTION PLAN 81
safe walking and biking curriculum to elementary and middle school students. Recognizing the resident-supported nature of many SRTS programs, communities can also help establish formalized volunteer efforts to support safer access to schools, such as walking chaperones, bike buses, or even speed watch programs, akin to neighborhood watches.
Resources:
e UDOT SRTS Program
e Safe Routes to School Online Guide
e FHWA PedSafe Pedestrian Countermeasure Selection System
Safe Systems Element: Safe Roadways
COMPLETE STREETS
Timeline: Short-Term | Context: Regionwide
e Bike Utah Community Planning Assistance
e Safe Routes to School National Program
e How to Start a Bike Bus in Your Community
WFRC communities should consider joining the more than 1,500 US towns, cities, and agencies24 who have adopted some form of Complete Streets Policy into local ordinance, which requires all users be considered each time a street investment is made. Coupled with robust, multimodal network planning, these policies enable communities to systematically assess the trade-offs associated with accommodating or not accommodating each type of user. In practical terms, a commitment and vision mean that the policy uses clear, binding, and enforceable language like “shall” or “must” in the legislative text itself, rather than words like “may” or “consider.” The policies that provide maximum value also mention several transportation modes and specifically call out biking and walking, an especially vulnerable group of roadway users. However, Complete Streets include an increasingly wide spectrum of options and are intended to be right-sized approaches for addressing critical infrastructure gaps within any community.
Resources:
e Smart Growth for America Complete Streets Policy
Framework
e Smart Growth for America Complete Streets
DRAFT
e WFRC Complete Streets Tools
e Salt Lake City Complete Streets Ordinance
ZERO FATALITIES REGIONAL WORKING GROUPS
Timeline: Short-Term | Context: Regionwide
During the second round of GFA workshops held in February 2024, representatives from UDOT’s Zero Fatalities team and the Utah Highway Safety Office introduced their safety program purposes and suggested resources available to local communities seeking to improve transportation safety. UDOT specifically invited local jurisdictions to organize Zero Fatalities Regional Working Groups to increase safety coordination and solution identification across jurisdictions and to tap into statewide resources. It is recommended that WFRC communities draw upon the resources available through the UDOT Zero Fatalities25 program to organize and participate in Zero Fatalities Regional Working Groups organized around the GFAs established for the CSAP.
Resources:
e UDOT Zero Fatalities Program
24 Complete list of communities that have adopted a Complete Streets Policy, compiled by Smart Growth for America, December 2023.
25 https://www.udot.utah.gov/strategic-direction/zero-fatalities.html
COMPREHENSIVE SAFETY ACTION PLAN 82
Safe Systems Element: Safe Vehicles
GOVERNMENT AND COMMERCIAL FLEETS
Timeline: Long-Term | Context: Regionwide
Cities can support safer operations of city and commercial vehicles through a plan to transition their vehicle fleets to safety-featureenhanced vehicles (or provide after-market safety upgrades such as telematics or speed limiters) and update existing heavy duty vehicle routes to avoid high-pedestrian areas. This could also mean increasing the use of alternate modes, such as e-bikes, for local operational tasks. Communities and their departments should also consider vehicle safety and size/weight enforcement in the planning, design, and operation of the regional transportation system, particularly when considering upgrades to existing fleets.
Resources:
e Vision Zero Network Fleet Safety
e NYC Safe Fleet Transition Plan
CURBSIDE MANAGEMENT
e NYC Vision Zero Safety Toolkit for Trucks
Timeline: Short-Medium Term | Context: Neighborhood and High-Density Areas
With the growth of shared mobility services, typically offered by private companies in the form of ride-hail services (e.g., Lyft or Uber) for both solo and pooled trips, bike share, and scooter shares, curbsides in urban areas are increasingly complex and risky. Developing policies for shared mobility services can allow communities to encourage, prohibit, or direct how they want shared mobility to work on their streets, particularly as they interact with other elements. Such policies may be particularly adept at addressing the serious injuries and deaths occurring at urban mid-blocks, one of the most common regional crash types.
Resources:
e Virginia Tech Curb Management Practices for Safety
Safe Systems Element: Safe Speeds
DRAFT
UPDATE SPEED LIMIT METHODOLOGIES
Timeline: Short-Term | Context: Regionwide
e NYC Vision Zero Safety Toolkit for Trucks
Appropriate speed limits reduce fatalities and serious injuries, particularly on roadways where vehicles and vulnerable road users mix. As vehicle speeds increase, the probability of death for all roadway users also increases. Communities should set appropriate speed limits to reduce the significant risks drivers impose on others, vulnerable road users, and on themselves. This may involve updating not only the speed limits, but the methodologies used to determine these limits. Previously, many agencies and communities have relied on the 85th percentile methodology for determining appropriate speed limits, which is the speed at or below which 85 percent of the drivers travel on a road segment. Recent updates to the (effective January 8, 2024) Manual of Uniform of Traffic Control Devices (MUTCD)26 , have deemphasized the focus on this methodology, and instead recommends that agencies explore other approaches when setting speed limits on urban and suburban arterials, and on rural arterials that serve as main streets through developed areas of communities. As part of UDOT’s goal of Zero Fatalities, the Utah MUTCD will soon reflect this expansion to reduce the potential for roadway injuries and deaths.
Potential alternatives to the 85th percentile include the 50th percentile (median) speed, relying on the FHWA USLIMITS2 Tool, and contextualizing assumed roadway conditions through the Safe System Approach. Communities should consider adjusting not only the speed limits of their roadways, but also updating their preferred methodologies for determining these speeds to align with recommended best practices, particularly those that emphasize the importance of roadway context in speed limit setting. Worth noting is the potential for level of service (LOS) requirements, variously codified across WFRC communities, to act as barriers to successful safety improvements. In such cases, communities may consider investigating the benefits and tradeoffs between safety and roadway access.
26 FHWA Updates to the MUTCD
COMPREHENSIVE SAFETY ACTION PLAN 83
Resources:
e Ut ah MUTCD
e UDOT Policy Update: Establishment of Speed Limits
e UDOT Speed Management Study Guidance
Safe Systems Element: Post-Crash Care
PROACTIVE INSTITUTIONAL COORDINATION
Timeline: Medium-Term | Context: Regionwide
e FHWA USLIMITS2 Speed Limit Tool
e FHWA Safe System Speed Limit Setting
Emergency first responders must quickly locate, stabilize, and transport crash victims to medical facilities. Post-crash care, however, extends beyond emergency response to include analysis of why a crash occurred, traffic incident management, and even adjudication. Communities should partner local planning agencies with emergency response providers to collaborate, share information, and mitigate severity of injuries sustained in crashes. Examples for which planning and engineering bodies could seek guidance on include:
e Emergency Medical Service (EMS) vehicle size requirements, particularly with traffic calming treatments
e Grid versus cul-de-sac challenges
e Prime locations for signal preemption
e On-street parking as a speed management technique vs EMS vehicle space
First responders include state highway safety, EMS, 911 offices, designated trauma systems, police, EMS agencies, federal interagency committees, and other EMS and trauma system stakeholders. Communities can also collaborate with local partners to evaluate opportunities for improvements in the emergency response and trauma care portions of safety work, traditionally reserved for medical and law enforcement professionals. Opportunities for collaboration may include identifying barriers to effective traffic incident management, providing training to staff or residents in trauma care, or linking those affected by crashes to survivor networks that can help support recovery and advocate for improvements to safety.
Resources:
e FICEMS Recommendations to Improve Post-Crash Care
DRAFT
e EMS, Highway Safety & Post-Crash Care
e National Safety Council Survivor Advocate Network
CRASH RESPONSE TEAM
Timeline: Long-Term | Context: Regionwide
Building off existing Utah Highway Patrol programming, communities should encourage their law enforcement and public safety departments to develop and deploy a multi-agency rapid response team to all crash locations with a fatality or serious injury to evaluate the site for safety enhancements. Current crash investigation remains within the purview of the Utah Highway Patrol; expanding the capacity of local units to operate as crash investigators rather than solely as reporters supports efforts to better document and understand the driving local factors behind crashes.
Resources:
e Utah Highway Patrol Accident Investigation Training
COMPREHENSIVE SAFETY ACTION PLAN 84

9. MOVING FORWARD
THIS CHAPTER IS UNDER DEVELOPMENT.
COMPREHENSIVE SAFETY ACTION PLAN 86
DRAFT
APPENDIX A: SS4A SELFCERTIFICATION ELIGIBILITY WORKSHEET

Safe Streets and Roads for All
Self - Certification Eligibility Worksheet
All applicants should follow the instructions in the NOFO to correctly apply for a grant. See the SS4A website for more information.
Table 1 of the SS4A NOFO describes eight components of an Action Plan, which correspond to the questions in this worksheet Applicants should use this worksheet to determine whether their existing plan(s) contains the required components to be considered an eligible Action Plan for SS4A.
This worksheet is required for all SS4A Implementation Grant applications and any Planning and Demonstration Grant applications to conduct Supplemental Planning/Demonstration Activities only Please complete the form in its entirety, do not adjust the formatting or headings of the worksheet, and upload the completed PDF with your application.
Eligibility
An Action Plan is considered eligible for an SS4A application for an Implementation Grant or a Planning and Demonstration Grant to conduct Supplemental Planning/Demonstration Activities if the following two conditions are met:
• You can answer “YES” to Questions 3, 7, and 9 in this worksheet; and
• You can answer “YES” to at least four of the six remaining Questions, 1, 2, 4, 5, 6, and 8.
If both conditions are not met, an applicant is still eligible to apply for a Planning and Demonstration Grant to fund the creation of a new Action Plan or updates to an existing Action Plan to meet SS4A requirements.
Applicant Information
Lead Applicant: ______________________________________________ UEI: ____________________________________
Action Plan Documents
In the table below, list the relevant Action Plan and any additional plans or documents that you reference in this form. Please provide a hyperlink to any documents available online or indicate that the Action Plan or other documents will be uploaded in Valid Eval as part of your application. Note that, to be considered an eligible Action Plan for SS4A, the plan(s) coverage must be broader than just a corridor, neighborhood, or specific location

Document Title Link Date of Most Recent Update SS4A Self-Certification Eligibility Worksheet | Page 1 of 5
Action Plan Components
For each question below, answer “YES” or “NO.” If “YES,” list the relevant plan(s) or supporting documentation that address the condition and the specific page number(s) in each document that corroborates your response. This form provides space to reference multiple plans, but please list only the most relevant document(s).
1. Leadership Commitment and Goal Setting
Are BOTH of the following true?
• A high-ranking official and/or governing body in the jurisdiction publicly committed to an YES eventual goal of zero roadway fatalities and serious injuries; and NO
• The commitment includes either setting a target date to reach zero OR setting one or more targets to achieve significant declines in roadway fatalities and serious injuries by a specific date
Note: This may include a resolution, policy, ordinance, executive order, or other official announcement from a high-ranking official and the official adoption of a plan that includes the commitment by a legislative body.
If “YES,” please list the relevant document(s) and page number(s) that corroborate your response
2. Planning Structure
YES
To develop the Action Plan, was a committee, task force, implementation group, or similar body established and charged with the plan’s development, implementation, and monitoring? NO
Note: This should include a description of the membership of the group and what role they play in the development, implementation, and monitoring of the Action Plan
If “YES,” please list the relevant document(s) and page number(s) that corroborate your response
Document Title Page Number(s)
Document Title Page Number(s) SS4A Self-Certification Eligibility Worksheet | Page 2 of 5
3. Safety Analysis
Does the Action Plan include ALL of the following?
• Analysis of existing conditions and historical trends to provide a baseline level of crashes involving fatalities and serious injuries across a jurisdiction, locality, Tribe, or region; YES
• Analysis of the location where there are crashes, the severity, as well as contributing factors and crash types; NO
• Analysis of systemic and specific safety needs, as needed (e.g., high-risk road features or specific safety needs of relevant road users); and,
• A geospatial identification (geographic or locational data using maps) of higher risk locations.
Note: Availability and level of detail of safety data may vary greatly by location. The Fatality and Injury Reporting System Tool (FIRST) provides county- and city-level data. When available, local data should be used to supplement nationally available data sets.
If “YES,” please list the relevant document(s) and page number(s) that corroborate your response
4. Engagement and Collaboration
Did the Action Plan development include ALL of the following activities?
• Engagement with the public and relevant stakeholders, including the private sector and community YES groups;
• Incorporation of information received from the engagement and collaboration into the plan; and NO
• Coordination that included inter- and intra-governmental cooperation and collaboration, as appropriate.
Note: This should be a description of public meetings, participation in public and private events, and proactive meetings with stakeholders.
If “YES,” please list the relevant document(s) and page number(s) that corroborate your response Document
Document Title Page Number(s)
Page Number(s) SS4A Self-Certification Eligibility Worksheet | Page 3 of 5
Title
5. Equity Considerations
Did the Action Plan development include ALL of the following? YES
• Considerations of equity using inclusive and representative processes;
• The identification of underserved communities through data; and NO
• Equity analysis developed in collaboration with appropriate partners, including population characteristics and initial equity impact assessments of proposed projects and strategies.
Note: This should include data that identifies underserved communities and/or reflects the impact of crashes on underserved communities, prioritization criteria that consider equity, or a description of meaningful engagement and collaboration with appropriate stakeholders.
If “YES,” please list the relevant document(s) and page number(s) that corroborate your response
6. Policy and Process Changes
Are BOTH of the following true? YES
• The plan development included an assessment of current policies, plans, guidelines, and/or standards to identify opportunities to improve how processes prioritize safety; and NO
• The plan discusses implementation through the adoption of revised or new policies, guidelines, and/or standards.
Note: This may include existing and/or recommended Complete Streets policy, guidelines for community engagement and collaboration, policy for prioritizing areas of greatest need, local laws (e.g., speed limit), design guidelines, and other policies and processes that prioritize safety.
If “YES,” please list the relevant document(s) and page number(s) that corroborate your response.
Document Title Page Number(s)
Document Title Page Number(s) SS4A Self-Certification Eligibility Worksheet | Page 4 of 5
7. Strategy and Project Selections
Does the plan identify a comprehensive set of projects and strategies to address the safety problems in the Action Plan, with information about time ranges when projects and strategies will be deployed, and NO an explanation of project prioritization criteria?
Note: This should include one or more lists of community-wide multi-modal and multi-disciplinary projects that respond to safety problems and reflect community input and a description of how your community will prioritize projects in the future
If “YES,” please list the relevant document(s) and page number(s) that corroborate your response.
8. Progress and Transparency
Does the plan include BOTH of the following?
YES
YES
• A description of how progress will be measured over time that includes, at a minimum, outcome data. NO
• The plan is posted publicly online.
Note: This should include a progress reporting structure and list of proposed metrics
If “YES,” please list the relevant document(s) and page number(s) that corroborate your response.
9. Action Plan Date
Was at least one of your plans finalized and/or last updated between 2019 and April 30, 2024?
Note: Updates may include major revisions, updates to the data used for analysis, status updates, or the addition of supplemental planning documents, including but not limited to an Equity Plan, one or more Road Safety Audits conducted in high-crash locations, or a Vulnerable Road User Plan.
If “YES,” please list your most recent document(s), date of finalization, and page number(s) that corroborate your response.
Document Title Page Number(s)
Document Title Page Number(s)
NO
YES
Document Title Date of Most Recent Update Page Number(s) SS4A Self-Certification Eligibility Worksheet | Page 5 of 5
APPENDIX B: STAKEHOLDER ENGAGEMENT SUMMARY
Content under development
APPENDIX C: POLICY AND PROCEDURES TECH MEMO
Content under development
APPENDIX D: GFA SAFETY ANALYSIS AND CASE STUDY PROJECTS
Appendix D: GFA Safety Analysis and Case Study Projects
Appendix D is provided under Separate Cover
Appendices are organized as follows:
D1 – South Box Elder/North Weber
D2 – West Weber
D3 – Central Weber
D4 – East Weber/Morgan
D5 – North Davis
D6 – South Davis
D7 – West Salt Lake Valley
D8 – Salt Lake City
D9 – East Salt Lake Valley
D10 – South Salt Lake Valley
D11 – Tooele County
Separate files are provided for each GFA. Each appendix includes the following:
· Safety Summary
· Tech Memo #1 Safety Analysis
· Case Study Project Information Sheets
· Equity Index Map
APPENDIX E: COST ESTIMATE ASSUMPTIONS
Segment Countermeasures and Cost Estimates Item Unit Unit Cost Quantity Total Cost Notes Variable Speed Limit Sign Each 5,000.00 $ 1 10,000.00 $ Assumes 1 sign each Power Source Each 30,000.00 $ 1 30,000.00 $ Power for variable speed limit signs. Can service 2 signs Power Conduit Ft 10.00 $ 1320 13,200.00 $ Conduit for variable speed limit signs. Item Unit Unit Cost Quantity Total Cost Notes Driver Feedback Speed Limit Sign Each 5,000.00 $ 1 10,000.00 $ Assumes 1 sign each direction Item Unit Unit Cost Quantity Total Cost Notes Type B5 Curb ft 25.00 $ 10560 264,000.00 $ Assumes center median with back to back B5 and no sidestreets Item Unit Unit Cost Quantity Total Cost Notes Type B1 Curb & Gutter ft 40.00 $ 100 4,000.00 $ Assumes 6 ft shoulder for parking, not for pedestrian crossings on both legs Concrete Flatwork 6 Inch sq ft 20.00 $ 1000 20,000.00 $ Assumes 6 ft shoulder for parking, not for pedestrian crossings on both legs Asphalt Pavement sq ft 20.00 $ 400 8,000.00 $ Assumes 6 ft shoulder for parking, not for pedestrian crossings on both legs Roadway Excavation cu yd 25.00 $ 93 2,314.81 $ Assumes 6 ft shoulder for parking, not for pedestrian crossings on both legs Remove Concrete Curb & Gutter ft 9.00 $ 100 900.00 $ Assumes 6 ft shoulder for parking, not for pedestrian crossings on both legs Item Unit Unit Cost Quantity Total Cost Notes Pavement Message (Preformed Thermoplastic) Each 300.00 $ 42 12,672.00 $ Assumes no additional pavement needed. Bike rider/ arrow assumed every 500' Sign Type A-1 Sq ft 42.00 $ 30 1,260.00 $ Assumes signs every 1000' on both sides. Bike lane sign Sign Type A-2 sq ft 50.00 $ 40 2,000.00 $ Assumes signs every 1000' on both sides. No parking sign Sign Post P2 Each 150.00 $ 10 1,500.00 $ Assumes signs every 1000' on both sides. Small Sign Tubular Steel Post Base (B1) Each 300.00 $ 10 3,000.00 $ Assumes signs every 1000' on both sides. Item Unit Unit Cost Quantity Total Cost Notes Pavement Marking Paint ft 0.30 $ 24300 7,290.00 $ Assumes no sidestreets, 3' buffer both sides. Assumes no additional pavement needed. Pavement Message Each 300.00 $ 42 12,672.00 $ Assumes bike rider/arrow assumed every 500' Sign Type A-1 Sq ft 42.00 $ 30 1,260.00 $ Assumes signs every 1000' on both sides. Bike lane sign Sign Post P2 Each 150.00 $ 10 1,500.00 $ Assumes signs every 1000' on both sides. Small Sign Tubular Steel Post Base (B1) Each 300.00 $ 10 3,000.00 $ Assumes signs every 1000' on both sides. Item Unit Unit Cost Quantity Total Cost Notes Pavement Marking Paint ft 0.30 $ 21120 6,336.00 $ Assumes no sidestreets, 3' buffer both sides. Assumes no additional pavement needed. Pavement Message Each 300.00 $ 42 12,672.00 $ Assumes bike rider/arrow assumed every 500' Sign Type A-1 Sq ft 42.00 $ 30 1,260.00 $ Assumes signs every 1000' on both sides. Bike lane sign Sign Post P2 Each 150.00 $ 10 1,500.00 $ Assumes signs every 1000' on both sides. Small Sign Tubular Steel Post Base (B1) Each 300.00 $ 10 3,000.00 $ Assumes signs every 1000' on both sides. Type B5 Curb ft 25.00 $ 21120 528,000.00 $ Assumes median with back to back B5 and no sidestreets. Both sides of road Item Unit Unit Cost Quantity Total Cost Notes Flexible Delineator Post Each 85.00 $ 528 44,880.00 $ Assumes delineators every 20' (<45 mph, otherwise 40') on both sides, no sidestreets. Item Unit Unit Cost Quantity Total Cost Notes Pavement Marking Paint 4" Solid ft 0.30 $ 42240 12,672.00 $ Assumes no change in pavement width, just re-striping Pavement Marking Paint 4" Solid and Broken ft 0.40 $ 21120 8,448.00 $ Assumes no sidestreets Sign Type A-1 Sq ft 42.00 $ 30 1,260.00 $ Assumes signs every 1000' on both sides. Bike lane sign Sign Post P2 Each 144.00 $ 10 1,440.00 $ Assumes signs every 1000' on both sides. Small Sign Tubular Steel Post Base (B1) Each 300.00 $ 10 3,000.00 $ Assumes signs every 1000' on both sides. Pavement Message Each 300.00 $ 42 12,672.00 $ Assumes bike rider/arrow assumed every 500' Item Unit Unit Cost Quantity Total Cost Notes Pavement Marking Paint 4" Solid ft 0.30 $ 42240 12,672.00 $ Assumes no change in pavement width, just re-striping Pavement Marking Paint 4" Solid and Broken ft 0.40 $ 21120 8,448.00 $ Assumes no sidestreets Item Unit Unit Cost Quantity Total Cost Notes Sign Type A-1 sq ft 42.00 $ 15 630.00 $ Assumes signs every 1000' on both sides. Sign Post P2 Each 150.00 $ 10 1,500.00 $ Assumes signs every 1000' on both sides. Small Sign Tubular Steel Post Base (B1) Each 300.00 $ 10 3,000.00 $ Assumes signs every 1000' on both sides. Item Unit Unit Cost Quantity Total Cost Notes Concrete Curb Type B3 ft 30.00 $ 170 5,100.00 $ Assumes 75 foot long, 10 foot wide island. Assumes enough room in existing roadway section. No curb removals. Concrete Flatwork, 6 Inch Thick sq ft 20.00 $ 611 12,220.00 $ Assumes 75 foot long, 10 foot wide island. Assumes enough room in existing roadway section. No curb removals. Bus Shelter each 10,000.00 $ 1 10,000.00 $ Sign Type A-1 sq ft 42.00 $ 5 210.00 $ Keep Left sign to direct traffic Sign Post P2 Each 150.00 $ 1 150.00 $ Small Sign Tubular Steel Post Base (B1) Each 300.00 $ 1 300.00 $ Shared Sidewalk Sign Total/Mile 6,000.00 $ Floating Transit Island Total/Mile 28,000.00 $ Total/Each 10,000.00 $ Total/Each Bulbout Corner 36,000.00 $ Bicycle Lane Separated by Delineators Total/Mile 4 to 3-Lane Road Diet with Addition of Bike Lanes 45,000.00 $ Buffered Bicycle Lane Total/Mile 26,000.00 $ Curb Separated Bicycle Lane Total/Mile 553,000.00 $ Variable Speed Limit Sign Driver Feedback Speed Limit Sign Bicycle Lane Total/Mile 21,000.00 $ Medians - Back to Back Curb Total/Mile 264,000.00 $ Bulbouts Total/Each 54,000.00 $ Total/Mile 40,000.00 $ 4 to 3-Lane Road Diet Total/Mile 22,000.00 $
Segment Countermeasures and Cost Estimates Item Unit Unit Cost Quantity Total Cost Notes Underground service pedestal - power source each 660.00 $ 1 660.00 $ Lighting 40' Signal Pole Luminaire each 300.00 $ 2 600.00 $ Lighting 15' Mast Arm each 162.00 $ 2 324.00 $ Lighting LED Luminaire each 312.00 $ 2 624.00 $ Lighting Foundation each 3,137.00 $ 2 6,274.00 $ Lighting Junction Box each 2,000.00 $ 2 4,000.00 $ Lighting Pavement Message (Preformed Thermoplastic) each 300.00 $ 26 7,800.00 $ Assumes 4 12-ft lanes and 2 4-ft shoulders (ladder style crosswalk) RRFB Lump 15,000.00 $ 1 15,000.00 $ Enhanced signing Remove Sign Less than 20 Square Feet each 100.00 $ 2 200.00 $ Remove Pavement Message each 120.00 $ 12 1,440.00 $ Item Unit Unit Cost Quantity Total Cost Notes Underground service pedestal - power source each 660.00 $ 1 660.00 $ Lighting 40' Signal Pole Luminaire each 300.00 $ 2 600.00 $ Lighting 15' Mast Arm each 162.00 $ 2 324.00 $ Lighting LED Luminaire each 312.00 $ 2 624.00 $ Lighting Foundation each 3,137.00 $ 2 6,274.00 $ Lighting Junction Box each 2,000.00 $ 2 4,000.00 $ Lighting Pavement Message (Preformed Thermoplastic) each 300.00 $ 26 7,800.00 $ Assumes 4 12-ft lanes and 2 4-ft shoulders (ladder style crosswalk) RRFB Lump 15,000.00 $ 1 15,000.00 $ Enhanced signing Item Unit Unit Cost Quantity Total Cost Notes Concrete Curb Type B5 ft 25.00 $ 9120 228,000.00 $ Assumes 100' intersection every 750' and 10' crosswalks Concrete Flatwork 6 Inch Thick sq ft 20.00 $ 36480 729,600.00 $ Assumes existing 12' TWLTL and Crosswalks Item Unit Unit Cost Quantity Total Cost Notes Concrete Curb Type B5 ft 25.00 $ 9840 246,000.00 $ Assumes 100' intersection every 1320' and 10' crosswalks Concrete Flatwork 6 Inch Thick sq ft 20.00 $ 39360 787,200.00 $ Assumes existing 14' TWLTL and Crosswalks - $ Item Unit Unit Cost Quantity Total Cost Notes Concrete Curb Type B5 ft 25.00 $ 9120 228,000.00 $ Assumes 100' intersection every 750' and 10' crosswalks Concrete Flatwork 6 Inch Thick sq ft 20.00 $ 36480 729,600.00 $ Assumes existing 12' TWLTL and Crosswalks Pavement Message (Preformed Thermoplastic) each 300.00 $ 312 93,600.00 $ Assumes 4 12-ft lanes and 2 4-ft shoulders (ladder style crosswalk) - 12 crosswalks along 1 mile segment Item Unit Unit Cost Quantity Total Cost Notes Concrete Curb Type B5 ft 25.00 $ 9120 228,000.00 $ Assumes 100' intersection every 750' and 10' crosswalks Concrete Flatwork 6 Inch Thick sq ft 20.00 $ 35000 700,000.00 $ Assumes existing 12' TWLTL and Crosswalks Item Unit Unit Cost Quantity Total Cost Notes Concrete Sidewalk sq ft 10.00 $ 63360 633,600.00 $ Assumes 6' sidewalk, no sidestreets both sides Item Unit Unit Cost Quantity Total Cost Notes Cast-In-Place Concrete Constant Slope Barrier - 42 Inch ft 180.00 $ 10456 1,882,080.00 $ Assumes no sidestreets both sides 42 Inch Trailing Sloped End Section Each 7,500.00 $ 4 30,000.00 $ Assumes end sections on both sides Item Unit Unit Cost Quantity Total Cost Notes Midwest 31 Inch W-Beam Guardrail 6 ft Steel Post ft 35.00 $ 10560 369,600.00 $ Assumes no sidestreets both sides End Treatment Type G (MASH) Each 6,000.00 $ 4 24,000.00 $ Assumes end treatments on both sides Item Unit Unit Cost Quantity Total Cost Notes High Tension Cable Barrier 10 ft Post Spacing (MASH) ft 40.00 $ 10560 422,400.00 $ Assumes no sidestreets both sides MASH Cable Barrier Gating Terminal Each 8,500.00 $ 4 34,000.00 $ Tension Gauge Each 4,500.00 $ 2 9,000.00 $ Assumes one each side of road Item Unit Unit Cost Quantity Total Cost Notes Pavement Marking Paint ft 0.30 $ 21120 6,336.00 $ Assumes no sidestreets and painting over existing Item Unit Unit Cost Quantity Total Cost Notes Longitudinal Rumble Strip - Asphalt ft 1.00 $ 8448 8,448.00 $ Assumes no sidestreets, both sides Item Unit Unit Cost Quantity Total Cost Notes Delineator Type 1 Each 100.00 $ 20 2,000.00 $ Assumes no sidestreets, no curves, delineators on both sides of road Flexible Delineator Post - Type 1 Each 85.00 $ 20 1,700.00 $ Item Unit Unit Cost Quantity Total Cost Notes Sign Type A-1 sq ft 42.00 $ 11 472.50 $ Includes W1-2 warnings signs and W13-1 Speed Advisory Plaque Sign Post P2 Each 150.00 $ 1 150.00 $ For above signs Small Sign Tubular Steel Post Base (B1) Each 300.00 $ 1 300.00 $ For above signs Sign Type A-1 sq ft 42.00 $ 5 210.00 $ Added cost per W1-8 Chevron Sign Post P2 Each 150.00 $ 1 150.00 $ Added cost per W1-8 Chevron Small Sign Tubular Steel Post Base (B1) Each 300.00 $ 1 300.00 $ Added cost per W1-8 Chevron Total/Mile 634,000.00 $ Upgrade Existing Crosswalk to High-Visibility Crosswalk at Midblock locations New High-Visibility Crosswalk at Midblock locations Total/Crossing 36,000.00 $ Install Medians and Pedestrian Refuge Islands in Urban Areas Total/Mile 958,000.00 $ Install Medians and Pedestrian Refuge Islands in Suburban Areas Total/Mile 1,034,000.00 $ Total/Crossing 37,000.00 $ 928,000.00 $ Total/Mile 1,913,000.00 $ Edgeline Rumblestrips Total/Mile 9,000.00 $ Post-Mounted Delineators Total/Mile 4,000.00 $ Install Medians with Marked Crosswalks Total/Mile 1,052,000.00 $ Median Barriers on Divided Highways (Metal Guardrail) Total/Mile 394,000.00 $ Install Sidewalk or Walkway 6" Edgeline Total/Mile 7,000.00 $ Install or Upgrade Curve Signage Total/Curve 2,000.00 $ Median Barriers on Divided Highways (Cable Barrier) Total/Mile 466,000.00 $ Median Barriers on Divided Highways (Concrete Barrier) Install Raised Medians on Roads with TWLTL Total/Mile
Segment Countermeasures and Cost Estimates Item Unit Unit Cost Quantity Total Cost Notes Pavement Message (Preformed Thermoplastic) Each 300.00 $ 7 2,100.00 $ Two bars, four letters (SLOW) and an arrow Item Unit Unit Cost Quantity Total Cost Notes Retroreflective strip Each 50.00 $ 11 550.00 $ Two bars, four letters (SLOW) and an arrow Item Unit Unit Cost Quantity Total Cost Notes HMA 1/2 Inch Ton 200.00 $ 117.487 23,497 $ Assumes 5" HMA safety edge section, assumes both sides of road, no sidestreets UTBC (Plan Quantity) cu yd 100.00 $ 971 97,139.50 $ Assumes a 4 ft x 7 inch UTBC section behind the safety edge, assumes both sides of the road Item Unit Unit Cost Quantity Total Cost Notes High Friction Pavement Ton 250.00 $ 172 43,094 $ Assumes 2-lane highway with 2' shoulders. Assumes 1000' curve with 1000' radius. Assumes 150 lb/cu ft Rotomilling - 1 Inch sq yd 3.00 $ 3064 9,193.33 $ Assumes 2-lane highway with 2' shoulders. Assumes 1000' curve with 1000' radius Item Unit Unit Cost Quantity Total Cost Notes UTBC Shouldering cu yd 3.00 $ 10560 31,680.00 $ Assumes a 2 ft x 10 inch UTBC shoulder, assumes no sidestreets Item Unit Unit Cost Quantity Total Cost Notes UTBC (Plan Quantity) cu yd 80.00 $ 652 52,148.15 $ Assumes 10" section, both sides of road. Assumes no sidestreets HMA 1/2 Inch Ton 200.00 $ 912 182,336.00 $ Assumes 7" section, both sides of road. Assumes no sidestreets Granular Borrow cu yd 80.00 $ 782 62,577.78 $ Assumes 12" section, both sides of road. Assumes no sidestreets Item Unit Unit Cost Quantity Total Cost Notes Highway Lighting Lump 300,000.00 $ 1 300,000.00 $ Assumes 20 poles each side of road, junction box wiring, and power source (From Bao) Item Unit Unit Cost Quantity Total Cost Notes Remove Pavement Marking ft 3.00 $ 10560 31,680.00 $ Striping on Both Sides of Road. Assumes no sidestreets - 2 Lanes Pavement Marking Paint ft 0.30 $ 21120 6,336.00 $ Item Unit Unit Cost Quantity Total Cost Notes Concrete Flatwork 7 Inch Thick sq ft 20.00 $ 3360 67,200.00 $ 4 Lanes Pavement Message (Preformed Thermoplastic) Each 300.00 $ 12 3,600.00 $ 4 Lanes Lane Narrowing Install Raised Crosswalk Total/Mile 71,000.00 $ Total/Mile 39,000.00 $ 3,000.00 $ Highway Lighting Total/Mile 300,000.00 $ Retroreflective Strips on curve signage Total/Curve 1,000.00 $ Safety Edge Total/Mile 121,000.00 $ Lane Curve Warning Pavement Markings Total/Curve Shoulder Extension on Rural Roads Total/Mile 32,000.00 $ 2 Foot Paved Shoulder on Rural Roads Total/Mile 298,000.00 $ High Friction Surface Treatment (HFST) on Curve Total/Mile 53,000.00 $
Intersection Countermeasures and Cost Estimates Item Unit Unit Cost Quantity Total Cost Notes Remove Concrete Sidewalk sq yd 15.00 $ 78 1,163.33 $ Remove Concrete Curb ft 10.00 $ 139 1,390.00 $ Remove Concrete Curb and Gutter ft 10.00 $ 357 3,570.00 $ Remove Pavement Marking Paint ft 3.00 $ 120 360.00 $ Roadway Excavation cu yd 35.00 $ 329 11,507.87 $ Assumes a 30" Pavement Section (8" HMA, 10" UTBC, 12" GB) Concrete Curb and Gutter Type B1 ft 40.00 $ 385 15,400.00 $ Relocate Sign Each 175.00 $ 5 875.00 $ Items not estimated lump 5,000.00 $ 1 5,000.00 $ Item Unit Unit Cost Quantity Total Cost Notes Concrete Curb Type M2 ft 45.00 $ 2 90.00 $ Assumes Type M2 curb back to back Item Unit Unit Cost Quantity Total Cost Notes Underground service pedestal - power source each 660.00 $ 1 660.00 $ 40' Signal Pole Luminaire each 300.00 $ 4 1,200.00 $ 15' Mast Arm each 162.00 $ 4 648.00 $ LED Luminaire each 312.00 $ 4 1,248.00 $ Foundation each 3,137.00 $ 4 12,548.00 $ Junction Box each 2,000.00 $ 4 8,000.00 $ Items not Estimated lump 6,000.00 $ 1 6,000.00 $ Item Unit Unit Cost Quantity Total Cost Notes Remove Concrete Driveway sq yd 30.00 $ 30 900.00 $ Assumes 30' flared concrete driveway Concrete Sidewalk sq ft 10.00 $ 180 1,800.00 $ Assumes 30' flared concrete driveway. Assumes 6' sidewalk Curb and Gutter Type B1 ft 40.00 $ 30 1,200.00 $ Assumes 30' flared concrete driveway Items not estimated Lump 3,000.00 $ 1 3,000.00 $ Item Unit Unit Cost Quantity Total Cost Notes Concrete Sidewalk sq ft 10.00 $ 1765 17,648.74 $ Remove Concrete Curb and Gutter ft 10.00 $ 385 3,854.70 $ Pavement Marking Paint ft 0.30 $ 300 90.00 $ Clearing and Grubbing acre 15,000.00 $ 0.1 1,222.74 $ Assumes a 30" Pavement Section (8" HMA, 10" UTBC, 12" GB) Concrete Curb and Gutter Type B1 ft 40.00 $ 357 14,267.56 $ Relocate Sign Each 175.00 $ 5 875.00 $ UTBC (Plan Quantity) cu yd 80.00 $ 110 8,765.43 $ Assumes a 30" Pavement Section (8" HMA, 10" UTBC, 12" GB) HMA 1/2 Inch Ton 200.00 $ 175 35,026.67 $ Assumes a 30" Pavement Section (8" HMA, 10" UTBC, 12" GB) Granular Borrow cu yd 80.00 $ 131 10,518.52 $ Assumes a 30" Pavement Section (8" HMA, 10" UTBC, 12" GB) Items not estimated lump 15,000.00 $ - $ Signal Pole Relocate and new foundation. Doesn't account for ROW Item Unit Unit Cost Quantity Total Cost Notes UTBC (Plan Quantity) cu yd 80.00 $ 1235 98,765.43 $ Assumes a 30" Pavement Section (8" HMA, 10" UTBC, 12" GB) HMA 1/2 Inch Ton 200.00 $ 1973 394,666.67 $ Assumes a 30" Pavement Section (8" HMA, 10" UTBC, 12" GB) Granular Borrow cu yd 80.00 $ 1481 118,518.52 $ Assumes a 30" Pavement Section (8" HMA, 10" UTBC, 12" GB) Roadway Excavation cu yd 25.00 $ 4074 101,851.85 $ Assumes a 5 lane, 575 foot long section of reconstruction for intersection construction Concrete Curb Type B5 ft 25.00 $ 1145 28,625.00 $ Pavement Marking Paint ft 0.30 $ 4500 1,350.00 $ Pavement Message (Preformed Thermoplastic) each 300.00 $ 10 3,000.00 $ Signing Lump 20,000.00 $ 1 20,000.00 $ Item Unit Unit Cost Quantity Total Cost Notes Huntsville ICE Concept Lump 1,930,000.00 $ 1 1,930,000.00 $ Cedar City ICE Concept Lump 1,620,000.00 $ 1 1,620,000.00 $ Tremonton ICE Concept Lump 2,850,000.00 $ 1 2,850,000.00 $ Item Unit Unit Cost Quantity Total Cost Notes Type Type IV Signal Head Each 1,760.00 $ 4 7,040.00 $ Includes removal of existing head Item Unit Unit Cost Quantity Total Cost Notes Type Type IV Signal Head Each 1,760.00 $ 4 7,040.00 $ Includes removal of existing head Item Unit Unit Cost Quantity Total Cost Notes Type Type IV Signal Head Each 1,760.00 $ 4 7,040.00 $ Includes removal of existing head Item Unit Unit Cost Quantity Total Cost Notes Traffic signal foundation 2' x 3' each 750.00 $ 1 750.00 $ From UDOT Signal Procurement Cost Estimate Type A Junction Box each 1,660.00 $ 2 3,320.00 $ From UDOT Signal Procurement Cost Estimate 11' Traffic Signal Pole each 300.00 $ 2 600.00 $ From UDOT Signal Procurement Cost Estimate Type III Signal Head each 1,260.00 $ 2 2,520.00 $ From UDOT Signal Procurement Cost Estimate Concrete Curb Type B5 ft 25.00 $ 40 1,000.00 $ Concrete Flatwork 6 inch thick sq ft 20.00 $ 20 400.00 $ Sign Type A-1 sq ft 42.00 $ 17 693.00 $ Sign Post P2 Each 150.00 $ 2 300.00 $ Small Sign Tubular Steel Post Base (B1) Each 300.00 $ 2 600.00 $ Items not estimated lump 10,000.00 $ 1 10,000.00 $ wiring, installing boxes, etc. Close Slip Lane Total/Lane 40,000.00 $ Implement Corridor Access Management Principles on Urban Roadways Total/Driveway Removal 7,000.00 $ Centerline Hardening Total/ft 1,000.00 $ Intersection Lighting Total/Intersection 31,000.00 $ Provide Right Turn Lane Total/Lane 93,000.00 $ Install Reduced Left-Turn Conflict Control Intersection Type (RCUT, MUT, Etc..) Total/Intersection 767,000.00 $ Convert Existing Intersection to Modern Roundabout Total/Intersection 2,134,000.00 $ Change a permissive only to Flashing Yellow Arrow Total/Intersection 8,000.00 $ Change permissive left-turn phasing to protected only or protected/permissive Total/Intersection 8,000.00 $ Change a 5-section "doghouse" protected/permissive left turn to flashing yellow arrow protected/permissive left turn Total/Intersection 8,000.00 $ Exclusive Bike Phase Total/Intersection 21,000.00 $
Intersection Countermeasures and Cost Estimates Item Unit Unit Cost Quantity Total Cost Notes Green Epoxy (Bike Box) sq ft 10.00 $ 255 5,100.00 $ $2550+2 messages @ $300/each = $3150/box (Assume 2 Boxes) Green Epoxy (Crossing Markings) Each 300.00 $ 2 600.00 $ Green Epoxy (Two Stage Queue Boxes) sq ft 10.00 $ 90 1,800.00 $ $900+2 messages @ $300/each = $1500 per box (Assume 2 Boxes) Sharrow Pavement Message each 300.00 $ 2 600.00 $ - $ Item Unit Unit Cost Quantity Total Cost Notes Sign Type A-2 sq ft 50.00 $ 32 1,600.00 $ Advanced Warning Sign (Oversized W3-1) Sign Post P2 Each 150.00 $ 4 600.00 $ Advanced Warning Sign Small Sign Tubular Steel Post Base (B1) Each 300.00 $ 4 1,200.00 $ Advanced Warning Sign Retroreflective strip each $50 4 200.00 $ RRFB lump 15,000.00 $ 1 15,000.00 $ Item Unit Unit Cost Quantity Total Cost Notes Sign Type A-2 sq ft 50.00 $ 48 2,400.00 $ Item Unit Unit Cost Quantity Total Cost Notes Remove Pavement Marking ft 3.00 $ 1345 4,035.00 $ Assumes 2' offset and no new pavement required Pavement Marking Paint ft 0.30 $ 1334 400.20 $ Assumes paint Pavement Message (Preformed Thermoplastic) Each 300.00 $ 2 600.00 $ Remove Pavement Message Each 120.00 $ 2 240.00 $ Remove Concrete Curb ft 10.00 $ 190 1,900.00 $ Concrete Curb Type M2 ft 45.00 $ 185 8,325.00 $ Modify Signal Phasing and Add No Right Turn on Red Signange Create Positive Off-Set of Existing Left-Turn Lanes at an Intersection Total/Lane 16,000.00 $ Total/Intersection 3,000.00 $ Apply Systemic Application of Multiple Low-Cost Countermeasures at Stop-Controlled Intersections Total/Assembly 19,000.00 $ Bicycle Treatments at Intersections Total/Intersection 9,000.00 $
APPENDIX F: SAFETY COUNTERMEASURES TOOLBOX
Emphasis Area Safety Countermeasure Crash Reduction Factor (CRF) Applicable Crashes Unit Cost Cost Effectiveness Application Guidance Urban Rural Speeding Set Appropriate Speed Limits for All Road Users NA All NA NA Locations identified with speed related issues and/or crashes X X Speeding Install Variable Speed Limit Signs 0.34 Interstate $54,000 Each LOW 1. Roadways that are susceptible to significant changes over a short amount of time (e.g., congestion, crashes, weather, work zones) 2. Freeways and high-speed arterials with Posted speed limits greater than 40 MPH X X Speeding Install Driver Feedback Speed Limit Signs NA All $10,000 Each NA Targeted locations required speed compliance over a short distance X X Speeding Install Driver Feedback Speed Limit Signs on Rural Curves 0.05 - 0.07 Rural Curves $10,000 Each LOW Rural roadways with curves X Speeding Re-Evaluate Speed Based on Roadway Context, Built Environment, and Existing Road Users NA All NA NA Locations where speed limits doesn't fit the build environment and existing roadway context X X Speeding Traffic Calming - Lane Narrowing 0.32 All $39,000 per Mile LOW If a lower 85th percentile speed is desired X Speeding Traffic Calming - Wider Lane Lines 0.32 All $21,000 per Mile LOW If a lower 85th percentile speed is desired X Speeding Traffic Calming - Medians (Back-To-Back Curb) 0.32 All $264,000 per Mile MED If a lower 85th percentile speed is desired X Speeding Traffic Calming - Bulbouts 0.32 All $36,000 Each LOW If a lower 85th percentile speed is desired X Bicyclist Install Bicycle Lane 0.31 - 0.49 Bicycle $21,000 per Mile LOW ADT ≥ 3000 and Posted Speed Limit ≥ 25 MPH X X Bicyclist Install Buffered Bicycle Lane NA Bicycle $26,000 per Mile NA 1. High Traffic Volumes, 2. Regular Truck Traffic, or 3. Posted Speed Limit > 35 MPH X Bicyclist Install a Separated Bicycle Lane (Curb Separated, Cycle Track or Multi-Use Path) NA Bicycle $553,000 per Mile NA X Bicyclist Convert a Traditional or Buffered Bicycle Lane to a Separated Bicycle Lane with Flexible Delineator Posts 0.532 Bicycle $45,000 per Mile MED Existing bicycle lane present X Bicyclist 4-Lane to 3-Lane Road Diet Conversion with Installation of Bicycle Lanes 0.19 - 0.47 All $40,000 per Mile MED-LOW ADT less than 25,000 and with repaving project X X Bicyclist Install Bicycle Ramp NA Bicycle $10,000 Each NA Connects bicyclists from the road to the sidewalk or a shared use path; transition cyclists out of roadway when vehicle movements become complicated, or when pavement narrows and can no longer accommodate separate bike lane (on high-speed, low-comfort routes) X X
Segment Countermeasures
Emphasis Area Safety Countermeasure Crash Reduction Factor (CRF) Applicable Crashes Unit Cost Cost Effectiveness Application Guidance Urban Rural Bicyclist Install Shared Sidewalk Sign NA Bicycle $6,000 per Mile NA Signs communicate to
bicyclists
the sidewalk and
bicyclists
yield to pedestrians. May be prohibited in downtown areas due to high pedestrian volumes; would require wider sidewalks (10' min) in order to accommodate both modes. X X Bicyclist Install Floating Transit Island NA All $28,000 per Island NA An in-street transit boarding island is used in conjunction with a separated bikeway, separating transit traffic from bicycle traffic, reducing conflict between the two modes, and lowering the risk of collision. X Rear-End, Left-Turn, Speeding, Pedestrian 4-Lane to 3-Lane Road Diet Conversion 0.19 - 0.47 All $22,000 per Mile LOW ADT less than 25,000 and with repaving project X X Pedestrian Upgrade Existing Crosswalk to a High-Visibility Crosswalk at Midblock Locations (Lighting, Enhanced Signing, Enhanced Pavement Markings, Lighting, In-Pavement Signage, etc.) 0.25 - 0.4 Pedestrian $37,000 per Crossing LOW Multilane roadway crossing with AADT > 10,000 X Pedestrian Install a High-Visibility Crosswalk at Midblock Locations (Lighting, Enhanced Signing, Enhanced Pavement Markings, Lighting, In-Pavement Signage, etc.) 0.25 - 0.4 Pedestrian $36,000 per Crossing LOW Multilane roadway with AADT > 10,000 X Pedestrian Install Raised Crosswalk NA Pedestrian $71,000 Each NA A raised crosswalk is a pedestrian crosswalk that is typically elevated 3-6 inches above the road or at sidewalk level. A raised crosswalk improves safety by increasing crosswalk and pedestrian visibility and slowing down motorists. X X Pedestrian Install Medians and Pedestrian Refuge Islands in Urban and Suburban Areas 0.56 Pedestrian $958,000 per Mile (Urban) HIGH Multilane roadway, 35 MPH or greater speed limit, Mix of pedestrian and Vehicle Traffic, AADT > 9,000 X Pedestrian Install Medians with Marked Crosswalks 0.46 Pedestrian $1,052,000 per Mile HIGH Multilane roadway, 35 MPH or greater speed limit, Mix of pedestrian and Vehicle Traffic, AADT > 9,000 X X Pedestrian Install Pedestrian Hybrid Beacons (PHB) or HAWK 0.547 Pedestrian $200,000 Each MED Midblock Crossings, Speed Limit > 35 MPH, Multilane Roadway, AADT > 9,000 X Pedestrian Install a Rectangular Rapid Flashing Beacons (RRFB) 0.474 Pedestrian$15,000 per Crossing (2) MED Speed Limits < 40 MPH, Multilane Roadway X Pedestrian Install Sidewalk or Walkways NA Pedestrian $634,000 per Mile NA All Roadways with no existing sidewalk X X Cross-Median Crashes Install Median Barriers on Divided Highways (Cable Barrier, Metal Guardrail, Concrete Barrier) 0.97 Cross Median $1,913,000 per Mile HIGH High-speed, fully controlled access roadways for locations where the median is 30 ft in width or less and the average daily traffic (ADT) is greater than 20,000 vehicles per day (vpd) X Cross-Median Crashes Install Median Barriers on Divided Highways (Cable Barrier, Metal Guardrail, Concrete Barrier) 0.97 Cross Median $394,000 per Mile HIGH High-speed, fully controlled access roadways for locations where the median is 30 ft in width or less and the average daily traffic (ADT) is greater than 20,000 vehicles per day (vpd) X Cross-Median Crashes Install Median Barriers on Divided Highways (Cable Barrier, Metal Guardrail, Concrete Barrier) 0.97 Cross Median $466,000 per Mile HIGH High-speed, fully controlled access roadways for locations where the median is 30 ft in width or less and the average daily traffic (ADT) is greater than 20,000 vehicles per day (vpd) X
Segment Countermeasures
pedestrians that
may also use
that
must
Emphasis Area Safety Countermeasure Crash Reduction Factor (CRF) Applicable Crashes Unit Cost Cost Effectiveness Application Guidance Urban Rural Vehicle Implement Corridor Access Management Principles on Urban RoadwaysDriveway Consolidation 0.25 - 0.31Fatal & Injury$7,000 per Drivewway LOW All Roadways X Vehicle Implement Corridor Access Management Principles on Rural 2-Lane Roadways - Driveway Consolidation 0.05 - 0.23 All $7,000 per Drivewway LOW All Roadways X Nighttime CrashesProvide Highway Lighting 0.28 Nighttime $300,000 per Mile MED All Roadways X X Multiple Perform Road Safety Audits 0.1 - 0.6 All $25,000 per Location MED-LOW All Roadways X X Run Off Road Install 6” Edge Line (Both Sides of Road) 0.12 - 0.36 All $7,000 per Mile LOW Rural two-lane highways X Run Off Road Install Edge Line Rumble Strips 0.13 - 0.51Fatal & Injury $9,000 per Mile LOW Rural two-lane highways X Head-On Install Centerline Rumble Strips 0.44 - 0.64 Head-on (Fatal & Injury) $5,000 per Mile LOW Rural two-lane highways X Run off Road Curve Install Post-Mounted Delineators 0.15 Run Off Road $4,000 per Mile LOW Rural roadways with existing signage X Curve Review, Install and/or Upgrade Curve Signage (Warning signs, Speed Advisory Plaques, Chevrons) to Provide Enhanced Delineations (Pavement Markings, Delineators, etc.) 0.148 - 0.6 All $2,000 per Curve LOW Rural roadways with curves X Curve Improve Roadside Design on Curves (Clear Zone Improvement, Slope Flattening, Shoulder Installation/Widening, Barrier/Guardrail, etc.) 0.08 - 0.44 All Varies per Curve NA Rural roadways with curves X Curve Install In-Lane Curve Warning Pavement Markings 0.348 - 0.384 All $3,000 per Curve LOW Rural roadways with curves X Curve Install Retroreflective Strips on Curve Signage NA All $1,000 per Curve NA Existing curve warning signage X Run Off Road Install Safety Edge with Repaving Projects 0.11 - 0.21 All $121,000 per Mile LOW All rural two-lane roadways X Curve Install High Friction Surface Treatment (HFST) on Curve 0.485 Fatal & Injury $53,000 per Curve MED Rural roadways with curves X Multiple Install Raised Medians on Roadways with Existing TWLTL 0.71 All $928,000 per Mile HIGH Roadways with TWLTL X Run Off Road Shoulder Widening on Rural Roads 0.229 All $32,000 per Mile LOW Rural Multilane Roadways X Run Off Road Provide 2-Ft Paved Shoulder on Rural 2-Lane Roadways 0.11 - 0.34 All $298,000 per Mile MED Rural 2-Lane Roadways without shoulders X Run Off Road Shoulder Widening on Rural Roads 0.229 Rural $32,000 per Mile LOW Rural Multilane Roadways X H i g h HIGH MED L o w MED LOW Low High Cost Effectiveness E f f e c t i v e n e s s ( C R F ) Cost
Segment Countermeasures
Intersection Countermeasures
improving-ped-safety.pdf
Emphasis Area Safety Countermeasure Crash Reduction Factor (CRF) Applicable Crash Types Unit Cost Cost Effectiveness Application Guidance Signal No Signal Intersection Install Retroreflective Backplates/Boarders 0.15 All $275 Each LOW All Signalized Intersections without backplates X Pedestrian Upgrade Existing Crosswalk to High-Visibility Crosswalk (Lighting, Enhanced Signing, Enhanced Pavement Markings, In-Pavement Signage, etc.) 0.25 - 0.4 Pedestrian $37,000 per Crossing LOW Select improvements consistent with Guide for Improving Pedestrian Safety at Uncontrolled Crossing Locations, Table 1 - Application of pedestrian crash countermeasures by roadway feature; https://www.fhwa.dot.gov/innovation/everydaycounts/edc_5/docs/STEP-guideimproving-ped-safety.pdf X X Pedestrian Install High-Visibility Crosswalk (Lighting, Enhanced Signing, Enhanced Pavement Markings, In-Pavement Signage, etc.) 0.25 - 0.4 Pedestrian $36,000 per Crossing LOW Select improvements consistent with Guide for Improving Pedestrian Safety at Uncontrolled Crossing Locations, Table 1 - Application of pedestrian crash countermeasures by roadway feature; https://www.fhwa.dot.gov/innovation/everydaycounts/edc_5/docs/STEP-guide-
X X Pedestrian Modify Signal Phasing to Include a Leading Pedestrian Interval (LPI); include No Right Turn on Red Signage 0.13 Pedestrian $3,000 per Intersection LOW Signalized Intersection with high turning volumes and high pedestrian crossings X Pedestrian Close Slip Lane 0.3 Pedestrian $40,000 per Each LOW Modifies the corner of an intersection to remove the sweeping right turn lane for vehicles. Results in shorter crossings for pedestrians, reduced speed for turning vehicles, better sight lines, and space for landscaping and other amenities. X X Pedestrian Angled Centerline Hardening NA Angled $5,500 per Intersection NA Centerline hardening makes intersections safer for pedestrians by encouraging drivers to make left turns at slower speeds. X Pedestrian Add Sidewalk 0.8 Pedestrian $4,500 per Intersection MED Adding sidewalks provides a separated and continuous facility for people to walk along the roadway. Adding sidewalks improves safety by minimizing collisions with pedestrians walking in the road. X X Pedestrian Extended Time Pushbutton NA Pedestrian $500 per Each NA A pushbutton that can be pressed to request extra time for using the crosswalk, beyond the standard crossing time. Ideal near senior-serving land uses. X Pedestrian, Transit Co-Locate Bus Stops and Pedestrian Crossings NA Pedestrian NA NA Place bus stops and pedestrian crossings in close proximity to allow transit riders to cross the street safely. X Pedestrian, Vehicle Install Intersection Lighting 0.33 - 0.38 Nighttime $31,000 per Intersection LOW All Intersections Without Lighting X X Pedestrian, Vehicle Implement Corridor Access Management Principles on Urban Roadways 0.25 - 0.31 Fatal & Injury $7,000 per Driveway LOW Limiting or eliminate driveways within the functional area of an intersection (upstream and downstream), as determined by stopping sight distance X X Vehicle Implement Corridor Access Management Principles on Rural 2-Lane Roadways 0.05 - 0.23 All $7,000 per Driveway LOW Limiting or eliminate driveways within the functional area of an intersection (upstream and downstream), as determined by stopping sight distance X X Angled, Left-Turn Provide Left-Turn Lanes at the Intersection 0.28 - 0.48 Rural $300,000 per Lane MED Major leg approaches at intersections with significant turning volumes and history of turn-related crashes X X
Intersection Countermeasures
Emphasis Area Safety Countermeasure Crash Reduction Factor (CRF) Applicable Crash Types Unit Cost Cost Effectiveness Application Guidance Signal No Signal Angled Create Positive Off-Set of Existing Left-Turn Lanes at an Intersection 0.356 All $16,000 per Intersection LOW Offset increases with design speed and approaches a value of 2.0 ft, which provides unrestricted sight distance when opposing left-turn vehicle is a passenger car. An offset of 1.0 ft accommodates design speeds 45 mph and below; offset of 1.5 ft accommodates design speeds up to 70 mph, unrestricted left-turn sight distance is provided by a 3.5-ft offset. When opposing left turn is a truck a 2.5-ft offset would accommodate design speeds of 40 mph and lower, and a 3.0-ft off et would provide adequate sight distance for design speeds up to 70 mph (https://onlinepubs.trb.org/Onlinepubs/trr/1992/1356/1356-004.pdf), page 6 of 9. X X Angled, Left-Turn Provide Right-Turn Lanes at the Intersection 0.14 - 0.26 All $150,000 per Lane LOW Major leg approaches at intersections with significant turning volumes of history of turn-related crashes X X Angled, Left-Turn Install Reduced Left-Turn Conflict Control Intersection Type (RCUT, MUT, Etc..) 0.22 - 0.63 Fatal & Injury $767,000 per Intersection MED-HIGHAll intersections with significant angled and left-turn crash issues X X Multiple Convert Existing Intersection to Modern Roundabout 0.41 - 0.82 All $2,500,000 per Intersection HIGH All Intersections X X Intersection Apply Systemic Application of Multiple Low-Cost Countermeasures at Stop-Controlled Intersections (advanced warning signs, retroreflecting sign posts, pavement marking, doubling signs, oversized signs, flashing beacons, etc.) 0.1 - 0.27 All $19,000 per Intersection LOW All Stop-Controlled Intersections with crash issues X Multiple Appropriately Time the Yellow Change Interval 0.08 - 0.12 All NA NA Signalized Intersections X Intersection Install High Friction Surface Treatment (HFST) at Intersections 0.201 All $16,000 per Intersection LOW All Intersections X X Multiple Perform Road Safety Audits 0.1 - 0.6 All $5,000 per Intersection MED-LOW All Intersection X X Multiple Perform an Intersection Control Evaluation (ICE) Study and Implement Results NA All $225,000 per Intersection NA All Intersection X X Angled, Left-Turn Change a Permissive Only to Flashing Yellow Arrow 0.4 - 0.5 Left-Turn $8,000 per Intersection LOW All permission only signals X Angled, Left-Turn Change permissive left-turn phasing to protected only or protected/permissive 0.05 - 0.21 Left-Turn $8,000 per Intersection LOW Signalized intersections with left turn issues X Angled, Left-Turn Change a 5-section "doghouse" protected/permissive left turn to flashing yellow arrow protected/permissive left turn 0.07 - 0.25 Left-Turn $8,000 per Intersection LOW All intersections with doghouse signal head X Bicycle Signal / Exclusive Bike Phase Install a separate traffic signal directing bicycle traffic across an intersection, or add an exclusive phase to the signal cycle specifically for cyclists (could be used for pedestrians also). Separates bicycle movements from conflicting motor vehicle, streetcar, light rail, or pedestrian movements. NA Bicycle $21,000 per Intersection NA Appropriate at locations with high volumes of cyclists or pedestrians, such as at major trail crossings or near schools or university campuses. X Bicycle Add Bicycle Treatments at Intersections (Bike Box, Intersection Crossing Markings, Two Stage Turn Queue Boxes, Combined Bike Lane/Turn Lane) NA Bicycle $9,000 per Intersection NA Intersection with Bicycle Lanes on approaches X X Pedestrian Construct Protected Intersection NA Pedestrian $650,000 per Intersection NA Protected intersections use corner islands, curb extensions, and colored paint to delineate bicycle and pedestrian movements across an intersection. Slower driving speeds and shorter crossing distance increase safety for pedestrians. Separates bicycles from pedestrians X
Intersection Countermeasures
Emphasis Area Safety Countermeasure Crash Reduction Factor (CRF) Applicable Crash Types Unit Cost Cost Effectiveness Application Guidance Signal No Signal Angle Right-in-Right-out Access Treatment 0.45 All $50,000 per Driveway MED Price per driveway X X Pedestrian Raised Intersection/Raised Crossing 0.36 All $30,000 per Each LOW Per crosswalk X Intersection Adequate Number/Visibility of Signal Heads 0.15 All $24,000 per Intersection LOW Assumes one additional signal head per approach X X Pedestrian Pedestrian Only Crossing Phase 0.35 All $50,000 per Intersection LOW X Pedestrian Install Pedestrian Signal Heads 0.25 All $7,000 per Intersection LOW Per intersection cost, includes APS units X Pedestrian Install Pedestrian Refuge Island 0.46 All $30,000 per Each MED Per island, assumes island is 50 feet long and 10 feet wide X Pedestrian Install High Visibility Crosswalk Markings 0.4 All $2,500 per Crossing LOW Per crosswalk, assumes crosswalk if 60 feet long and 10 feet wide X X Pedestrian Install Pedestrian Hybrid Beacons (PHB) or HAWK 0.547 All $200,000 per Each MED Midblock Crossings, Speed Limit > 35 MPH, Multilane Roadway, AADT > 9,000 X Pedestrian Install a Rectangular Rapid Flashing Beacon (RRFB) 0.474 All $15,000 per Crossing (2) LOW Speed Limits < 40 MPH, Multilane Roadway X Speeding Traffic Calming - Bulbouts 0.32 All $36,000 Each LOW If a Lower 85th percentile speed is desired X H i g h HIGH MED L o w MED LOW Low High Cost Effectiveness E f f e c t i v e n e s s ( C R F ) Cost
Category Safety Countermeasure
Better Data Improve Crash Data Collection
Education Bicycle Safety Education Events
Non-Engineering Countermeasures
Description
Improve the accuracy, breadth, and consistency of crash data by creating a near-miss and unreported crash database, developing a standardized electronic reporting form for all crashes, forming agreements with shared mobility operators to acquire crash data, and/or creating a multi-jurisdiction crash database that can be updated by paramedics, police, City staff, and hospitals.
Partner with local bike shops and other partners to host events/fairs to educate residents on bicycle safety. For example, host rides to introduce residents to new bicycle facilities as they are opened; offer tune ups at safety fairs.
Education Youth Education
Education Education Campaigns for Vulnerable Groups
Education Pilot Demonstration Safety Projects
Launch a countywide transportation safety education campaign targeting youth that covers a wide range of topics, such as alcohol and drug impairment, speeding, and potentially distracted driving. Local schools can also be partners in promoting safe driver behavior during school pick-up and drop offs. Educational campaigns that involve both students and parents can be more impactful as they involve parents, who are actually driving, and students, who may not only remind their parents but also retain safe driving behavior if they eventually drive.
Launch targeted public education campaigns for seniors, non-English speaking populations, or other vulnerable groups.
Implement pilot demonstration safety projects. Projects can either be implemented on a temporary basis (tactical urbanism) or permanent basis with room for modification (quick builds).
Education Public Information Campaigns
Launch public safety education campaigns. Example campaign topics include safe speeds, yielding to pedestrians, distracted driving, drinking and driving, awareness of bicyclists and pedestrians, appropriate crosswalk behavior, rail safety, moving over for EMS vehicles, etc. Campaigns may include yard signs, wall boards/posters in prime injury-corridor neighborhoods, ads on bus exteriors, radio ads, etc. Public education may also involve making safety and crash data publicly available on project websites, the City's data portal, social media, and other avenues as appropriate.
Maintenance Keep Roadways Clear of Debris
Partnerships Safe Routes to School
Policies and Programs Update City Policies and Standards
Policies and Programs Neighborhood Slow Zones
Policies and Programs Targeted Enforcement and Deterrence
A smoothly paved surface free of debris enhances safety for vehicles and bicyclists.
Establish a Safe Routes to School (SRTS) program in partnership with school districts.
Update policies, standards, and guidelines on topics such as signal timing, street design, street lighting, complete streets, and pedestrian crossings to incorporate current best practices and improve safety for all modes.
Develop a neighborhood slow zone program to allow neighborhoods to request treatments to slow motor vehicles to 15 to 20 mph using traffic calming features, signs, and markings. Selected locations are typically in areas serving children, seniors, public transit users, commercial activity, and pedestrian/bicycle activity.
Use crash history and corridors on the High Injury Network as one criterion for where to concentrate enforcement efforts. Add extra patrols to look for distracted drivers as part of a statewide distracted driving campaign, with focus on where data indicates that the most traffic safety benefit can be realized. Implement deterrence policies that are highly visible, such as publicized sobriety checkpoints, saturation patrol, and other forms of high visibility enforcement that are effective for safety outcomes.
