

COMPREHENSIVE SAFETY ACTION PLAN
April 25, 2024

April 25, 2024
Prepared for:
Prepared by: In


23 U.S.C. § 409: US Code - Section 409: Discovery and admission as evidence of certain reports and surveys
Notwithstanding any other provision of law, reports, surveys, schedules, lists, or data compiled or collected for the purpose of identifying, evaluating, or planning the safety enhancement of potential accident sites, hazardous roadway conditions, or railway- highway crossings, pursuant to sections 130, 144, and 148 of this title or for the purpose of developing any highway safety construction improvement project which may be implemented utilizing Federal-aid highway funds shall not be subject to discovery or admitted into evidence in a Federal or State court proceeding or considered for other purposes in any action for damages arising from any occurrence at a location mentioned or addressed in such reports, surveys, schedules, lists, or data.
A Severe Injury Crash
AADT Average Annual Daily Traffic
AASHTO American Association of State Highway and Transportation Officials
B Suspected Minor Injury Crashes
BIL Bipartisan Infrastructure Law
C Possible Injury Crashes
CCR Critical Crash Rate
CEJST Climate and Economic Justice Screening Tool
CMF Crash Modification Factor
CRF Crash Reduction Factor
CSAP Comprehensive Safety Action Plan
EPDO Equivalent Property Damage Only Crash
ETC Equitable Transportation Community
FHWA Federal Highway Administration
GFA Geographic Focus Area
GIS Geographic Information System
HSM Highway Safety Manual
ITS Intelligent Transportation Systems
K Fatal Crashes
O No Injury/Property Damage Only Crashes
PHB Pedestrian Hybrid Beacon
RRFB Rectangular Rapid Flashing Beacon
SHSP Strategic Highway Safety Plan
SS4A Safe Streets and Roads For All
TWLTL Two-Way Left-Turn Lane
UDOT Utah Department of Transportation
USDOT United States Department of Transportation
WFRC Wasatch Front Regional Council
Ali Avery North Salt Lake City
Britney Ward Sandy City
Dan Bergenthal Salt Lake City
Daniel Gillies Ogden City
David Rodgers Salt Lake County
Jared Stewart Tooele City
Jeff Lewis Utah Department of Transportation
Kip Billings Wasatch Front Regional Council
Matthew Shipp City of Cottonwood Heights
Sheldon Shaw Utah Transit Authority
Wayne Bennion Wasatch Front Regional Council
Amee Rock Penna Powers
Brent Crowther Kimley-Horn and Associates
Kip Billings Wasatch Front Regional Council
Maria Vyas Fehr and Peers
Wayne Bennion Wasatch Front Regional Council
Wasatch Front Regional Council (WFRC), in consultation with transportation and local government partners, prepared this regional Comprehensive Safety Action Plan (CSAP) to present a holistic, well-defined strategy to reduce roadway fatalities and serious injuries in the Wasatch Front region. WFRC anticipates making periodic modifications to this CSAP to address additional information as it becomes available.
The CSAP analyzes safety needs, identifies high-crash and high-risk locations and factors contributing to crashes, and prioritizes strategies to address them.
The CSAP was prepared with funding from the Safe Streets and Roads for All (SS4A) discretionary program. The Bipartisan Infrastructure Law (BIL) established the SS4A discretionary program to fund improvements and strategies to prevent roadway fatalities and serious injuries of all users of highways, streets, and roadways: pedestrians, bicyclists, public transportation users, motorists, personal conveyance and micro-mobility users, and commercial vehicle operators. The program includes $5 billion in appropriated funds over five years, 2022-2026. The SS4A program supports the U.S. Department of Transportation’s (USDOT’s) National Roadway Safety Strategy and a goal of zero roadway deaths using a Safe System Approach
The SS4A programs provides Federal funds for two types of grants:
e Planning and Demonstration Grants to prepare an Action Plan. Action Plans develop a holistic, well-defined strategy to prevent roadway fatalities and serious injuries in a locality, Tribe, or region.
e Implementation Grants to implement projects and strategies identified in an Action Plan to address a roadway safety problem. Projects and strategies may be infrastructure, behavioral, and/or operational activities. Applicants must have a qualifying Action Plan that meets the eligibility requirements to apply for an Implementation Grant. In addition, applicant agencies must have ownership and/or maintenance responsibilities over a roadway network, safety responsibilities that affect roadways, or an agreement from the agency that has ownership and/or maintenance responsibilities for the roadway within the applicant’s jurisdiction.
This WFRC CSAP meets eligibility requirements that allow local jurisdictions to apply for Implementation Grants from the USDOT SS4A discretionary grant program.
This CSAP was completed on April 25, 2024, to meet eligibility criteria for the 2024 Notice of Funding Opportunity. The CSAP is posted and publicly available at https://wfrc.org/programs/csap/
An eligible Action Plan is determined by the Self-Certification Eligibility Worksheet.1 The Action Plan requirements are summarized in Table 1-1. The WFRC CSAP serves as the eligible Safety Action Plan to enable local jurisdictions to apply for a SS4A Implementation
1 https://www.transportation.gov/sites/dot.gov/files/2024-02/SS4A-FY24-Self-Certification-Worksheet.pdf
The Safety Action Plan must include these three required elements:
Analysis of existing conditions and historical trends to baseline the level of crashes involving fatalities and serious injuries across a jurisdiction, locality, Tribe, or region;
1. Safety Analysis: Does the Action Plan include all the following?
Analysis of the location where there are crashes, the severity, as well as contributing factors and crash types;
Analysis of systemic and specific safety needs, as needed (e.g., high risk road features, specific safety needs of relevant road users);
A geospatial identification (geographic or locational data using maps) of higher risk locations.
2. Strategy and Project Selections: Does the plan identify a comprehensive set of projects and strategies to address the safety problems in the Action Plan, time ranges when projects and strategies will be deployed, and explain project prioritization criteria?
3. Completion Date: Was the plan finalized and/or last updated between 2019 and April 30, 2024?
Required - This WFRC CSAP completed these requirements.
The CSAP includes a comprehensive safety analysis of historical trends, contributing factors, safety needs, and identification of high-crash and high-risk segments. See Chapter 5.
Required - This WFRC CSAP completed these requirements.
The CSAP recommends and prioritizes countermeasures, strategies, and project types to reduce fatalities and serious injuries. See Chapter 6.
Required - This WFRC CSAP was completed on April 25, 2024.
The Safety Action Plan must include at least four of the following six optional requirements:
4. Are both of the following true?
Leadership Commitment: Did a high-ranking official and/or governing body in the jurisdiction publicly commit to an eventual goal of zero roadway fatalities and serious injuries?
Goal: Did the commitment include either setting a target date to reach zero, OR setting one or more targets to achieve significant declines in roadway fatalities and serious injuries by a specific date?
5. Planning Structure: To develop the Action Plan, was a committee, task force, implementation group, or similar body established and charged with the plan’s development, implementation, and monitoring?
6. Engagement and Collaboration: Did the Action Plan development include all the following activities?
e Engagement with the public and relevant stakeholders, including the private sector and community groups
e Incorporation of information received from the engagement and collaboration into the plan
e Coordination that included inter- and intra-governmental cooperation and collaboration, as appropriate
Optional - This WFRC CSAP completed these requirements.
Regional leaders adopted a Safety Commitment Resolution on March 28, 2024. The Safety Resolution includes a 50% reduction by 2040. See Chapter 2.
Optional - This WFRC CSAP completed these requirements. The CSAP was prepared under the direction of a Steering Team, with representatives of cities, counties, Utah Department of Transportation (UDOT), and Utah Transit Authority (UTA). The Steering Team met monthly. See Chapter 4.
Optional - This WFRC CSAP completed these requirements.
The CSAP is available at https://wfrc.org/programs/csap/. The CSAP engaged stakeholders at 24 meetings throughout the region during plan development. Comments were collected and included in the preparation of the CSAP. See Chapter 4.
7. Equity Considerations: Did the Action Plan development include the following?
e Considerations of equity using inclusive and representative processes
e Identification of underserved communities through data
e Equity analysis, in collaboration with appropriate partners, focused on initial equity impact assessments of the proposed projects and strategies, and population characteristics
8. Policy and Process Changes: Are both of the following true?
e Plan development included an assessment of current policies, plans, guidelines, and/or standards to identify opportunities to improve how processes prioritize safety
e Plan discusses implementation through the adoption of revised or new policies, guidelines, and/or standards
9. Progress and Transparency: Does the plan include the following?
e A description of how progress will be measured over time that includes, at a minimum, outcome data
e The plan is posted publicly online
Optional - This WFRC CSAP completed these requirements.
An equity analysis identified concentrations of disadvantaged or vulnerable populations. The equity analysis utilized tools published by WFRC and by the Federal Highway Administration (FHWA). See Chapter 6.
Required - This WFRC CSAP completed these requirements.
Existing policies, programs, and practices were reviewed that may impact safety. Opportunities for change were identified. Potential engineering, enforcement, or education policies or practices were recommended. See Chapter 8.
Required - This WFRC CSAP completed these requirements. The CSAP is available at https://wfrc.org/programs/csap/. See Chapter 9.
Grant. The Self-Certification Eligibility Worksheet is included in Appendix A.
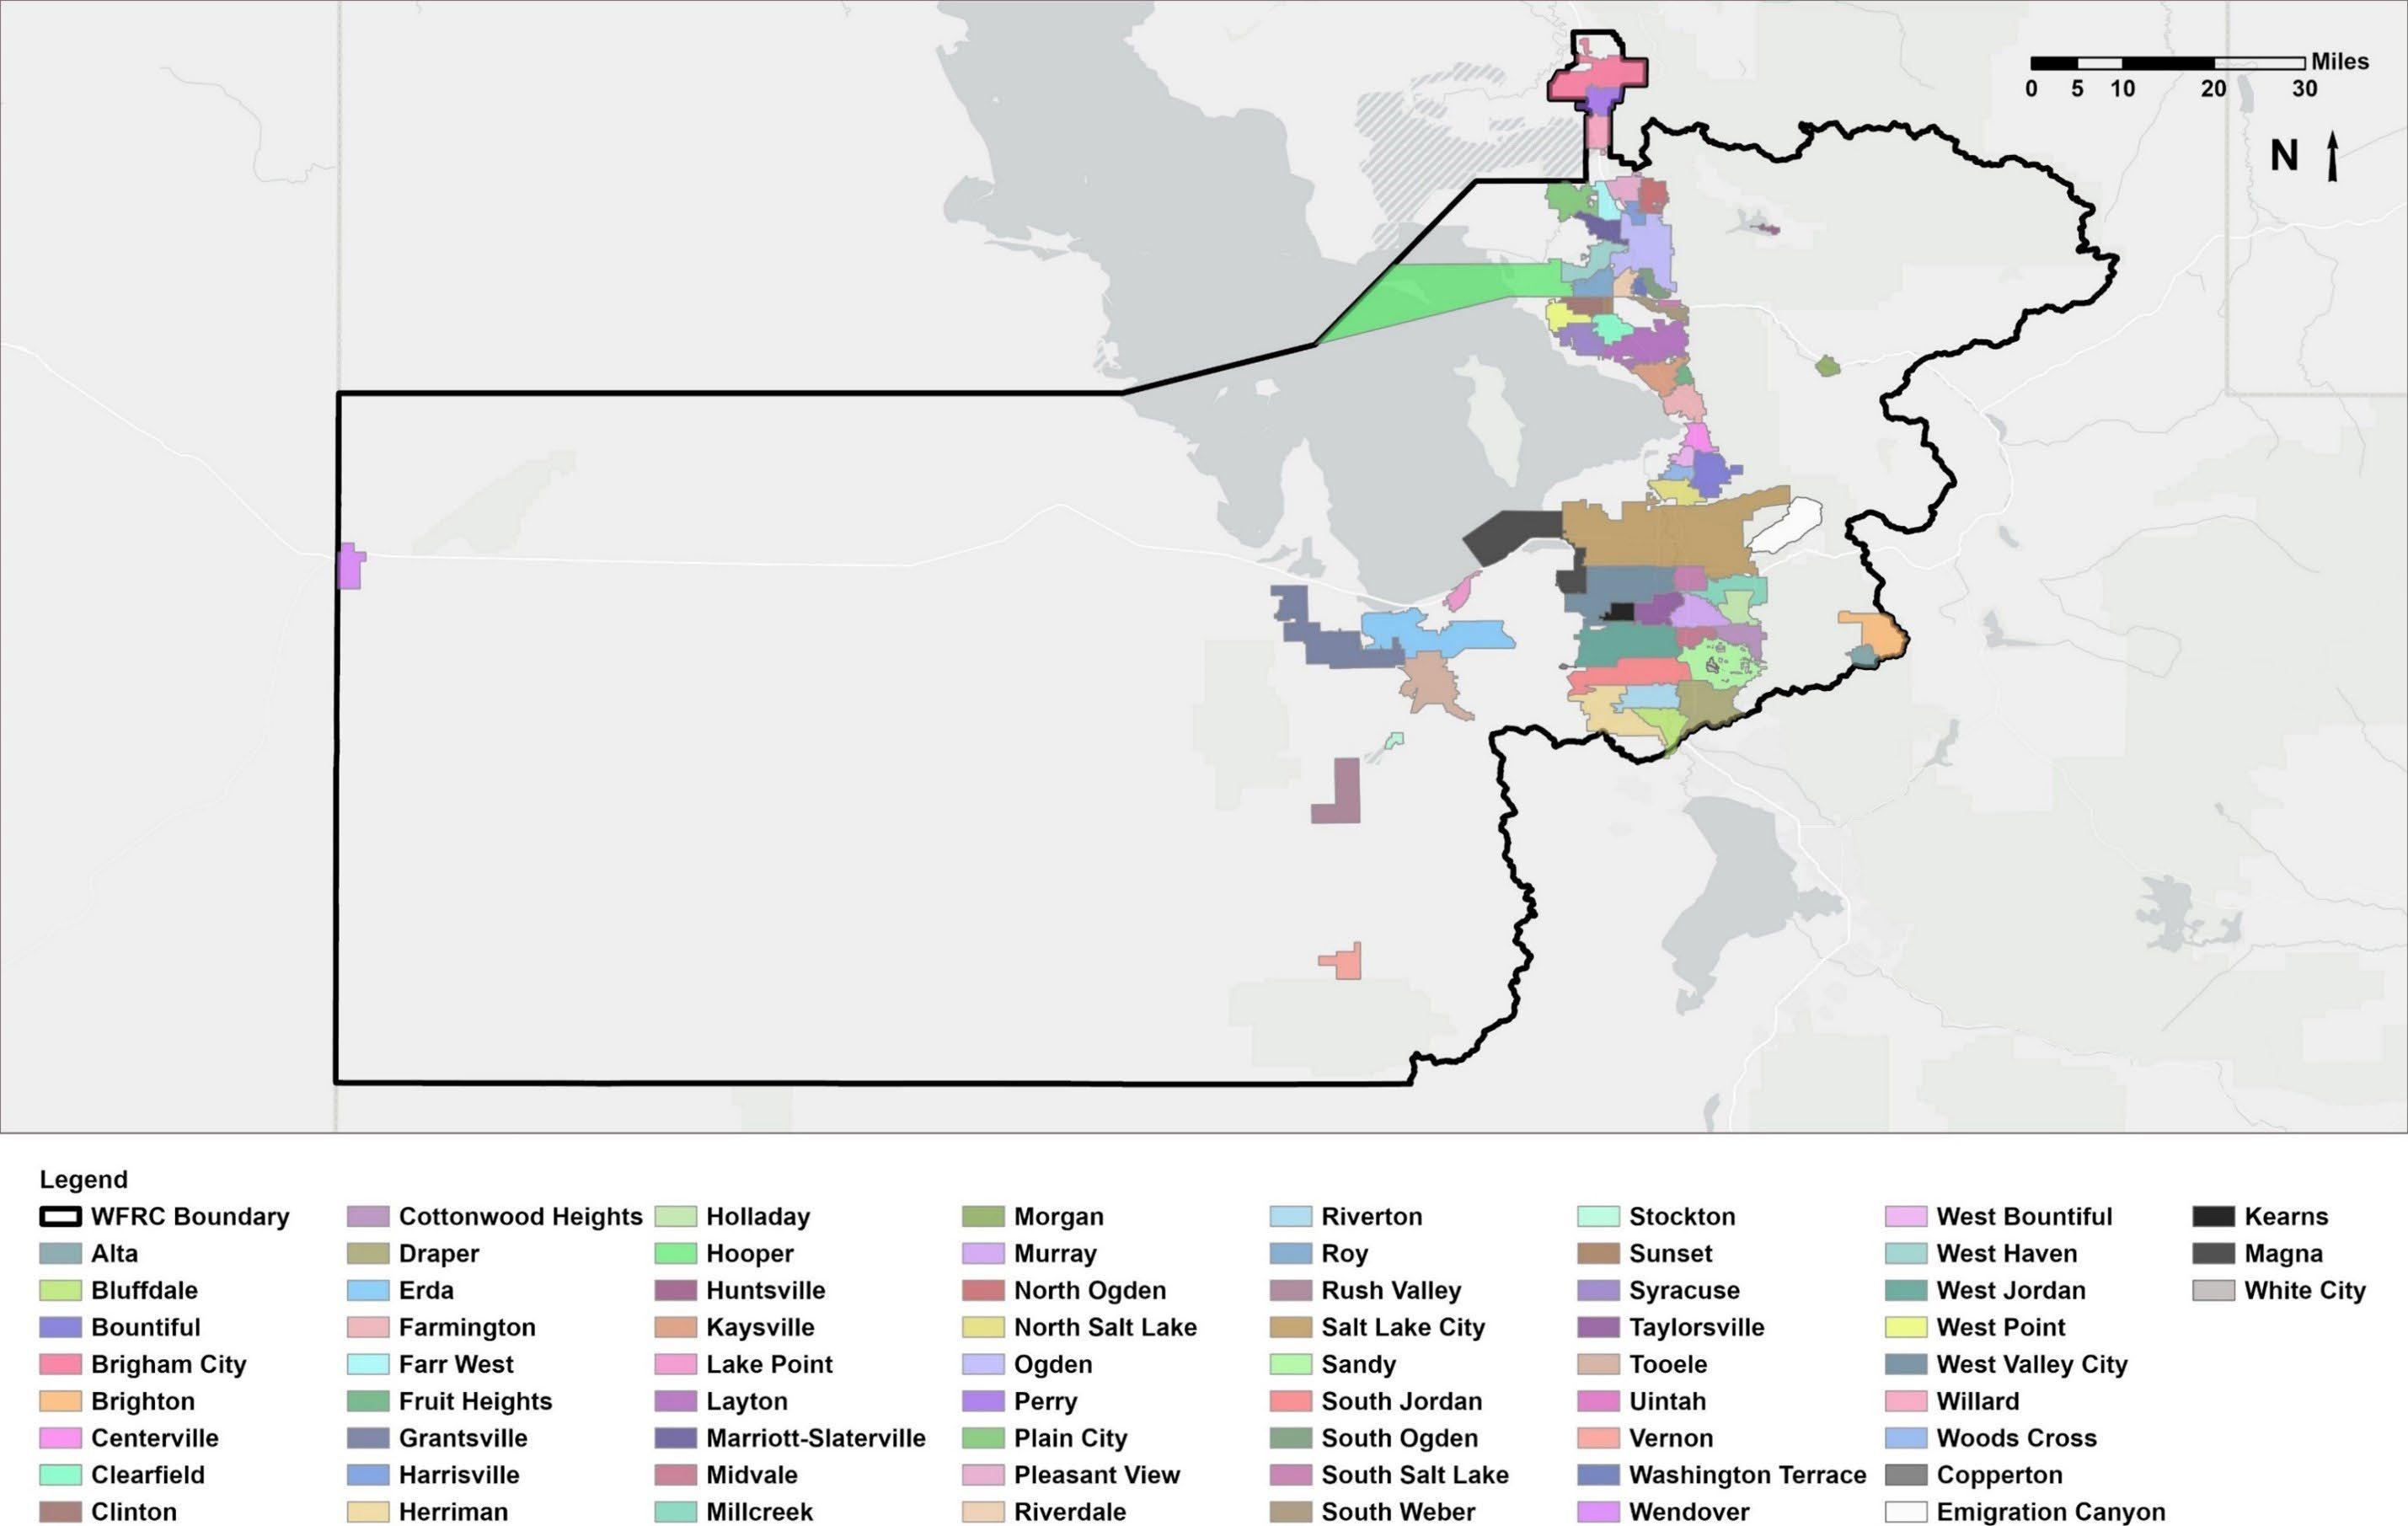
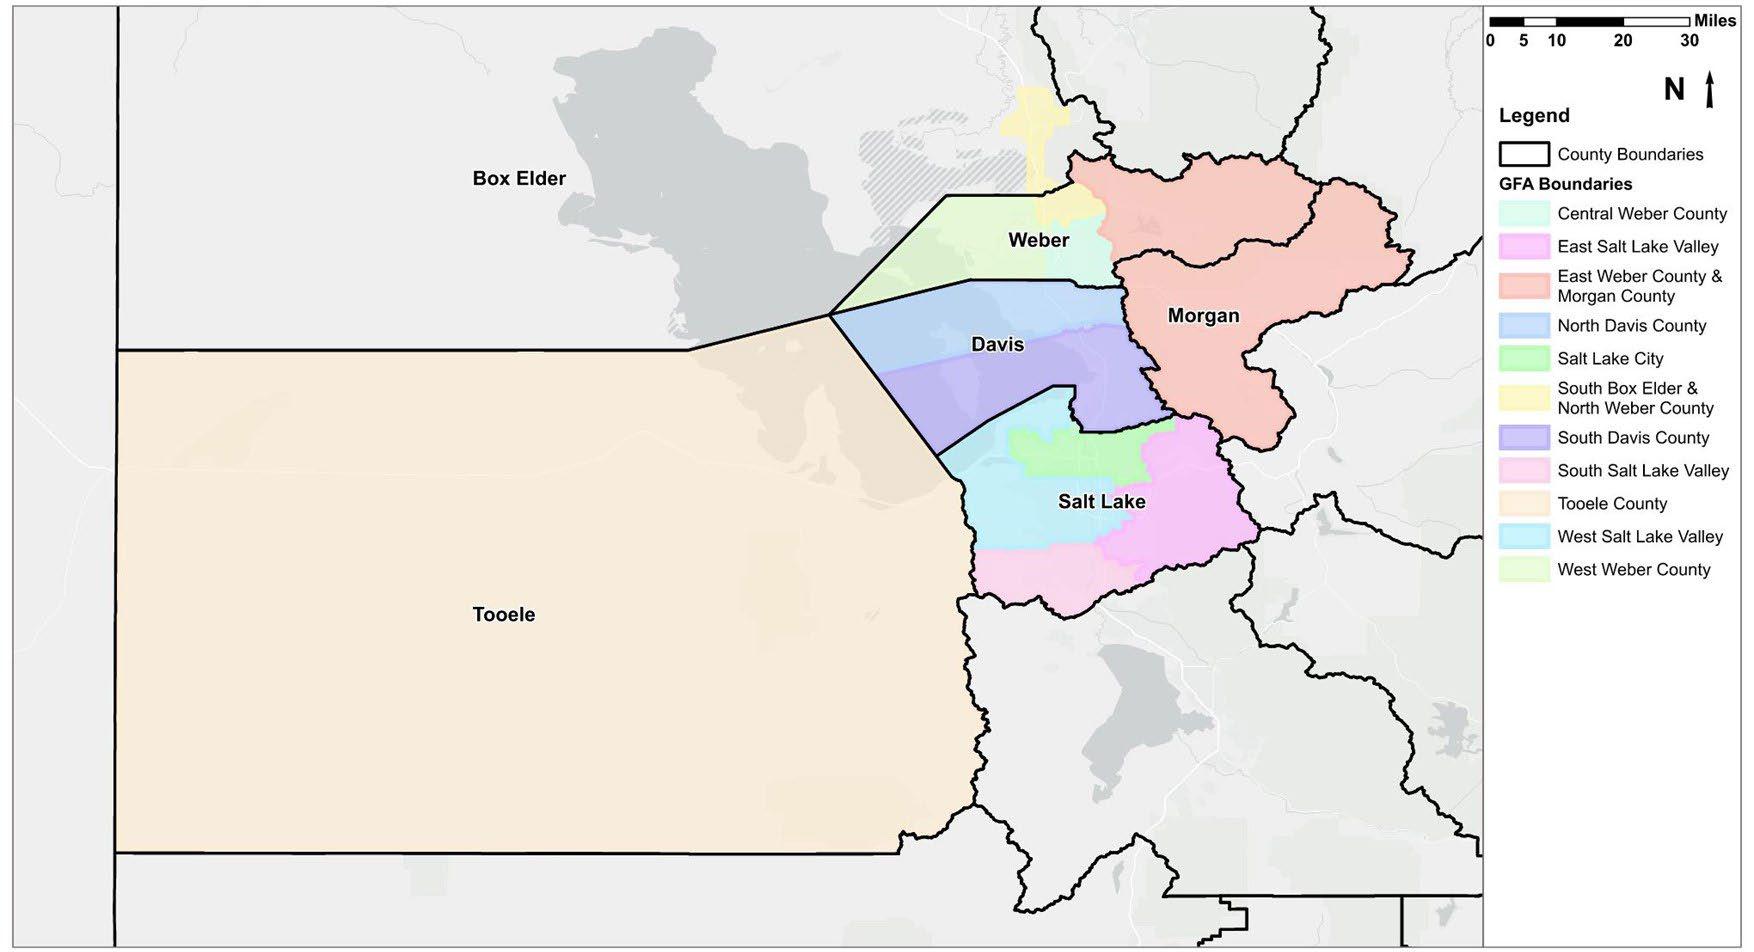
The CSAP study area includes each jurisdiction within the WFRC Region, as illustrated in Figure 1-1. To organize the large number of jurisdictions within the WFRC Region into manageable analysis areas, jurisdictions are grouped into Geographic Focus Areas (GFA). A map of the GFAs by County is included in Figure 1-2 , and Table 1-2 lists jurisdictions by GFA. The safety analyses conducted for this CSAP are presented for each GFA.
Brigham City
Box Elder County
Perry
South Box Elder & North Weber County
Willard
Farr West
Harrisville
North Ogden
Pleasant View
Marriott-Slaterville
Weber County
Hooper
West Weber County
East Weber County & Morgan County
Plain City
Roy
West Haven
Morgan
Morgan County
Huntsville
Weber County
Ogden
Riverdale
Central Weber County
South Davis County (continued)
Salt Lake City
East Salt Lake Valley
North Salt Lake
West Bountiful
Woods Cross
Salt Lake City
Sandy Cottonwood Heights
Salt Lake County
Alta
Brighton
Holladay
Millcreek
White City
Emigration Canyon
West Jordan
Salt Lake County
Copperton
Kearns
Magna
West Salt Lake Valley
North Davis County
South Ogden
Uintah
Washington Terrace
Davis County
Clearfield
Clinton
Layton
South Weber
Sunset
Syracuse
West Point
Davis County
Bountiful
Centerville
South Davis County
Farmington
Fruit Heights
Kaysville
South Salt Lake Valley
Midvale
Murray
South Salt Lake
Taylorsville
West Valley City
Herriman
Bluffdale
Draper Riverton
South Jordan
Tooele County
Erda
Grantsville
Lake Point
Tooele County
Rush Valley
Stockton
Tooele
Vernon
Wendover

The mission of WFRC is to build consensus and enhance quality of life by developing and implementing visions and plans for a wellfunctioning multimodal transportation system, livable communities, a strong economy, and a healthy environment. To accomplish this mission, WFRC serves as a convener to facilitate collaboration with communities and partners, technical expert to provide trusted subject matter guidance, planner to proactively plan for the future of our region, and implementer to put visions and plans into action.
The Wasatch Front Regional Council affirms its commitment to improving roadway safety.
A Regional Safety Commitment Resolution, included on the next page, was presented to WFRC’s Transportation Coordinating Committee (Trans Com) on February 15, 2024, for their consideration to recommend adoption to WFRC. Trans Com serves as the policy advisory body to the WFRC regarding short-range transportation planning and programming. Trans Com membership is comprised primarily of local elected officials from Box Elder, Davis, Morgan, Salt Lake, Tooele, and Weber counties. The recommendation passed unanimously.
The Regional Safety Commitment Resolution was adopted by WFRC on March 28, 2024. The WFRC Council is comprised of 19 local elected officials appointed by the county councils of governments in Box Elder, Davis, Morgan, Salt Lake, Tooele, and Weber. The WFRC Council also includes representation from UDOT, UTA, Utah League of Cities and Towns, and Utah Association of Counties, the State Legislature, the Governor’s Office of Planning and Budget, and Envision Utah.


CSAP recommendations are consistent with the Safe System Approach.
The Safe System Approach was adopted by the USDOT as the guiding paradigm to address roadway safety and mitigate the risk inherent in our complex transportation system.2
The Safe System Approach focuses on human mistakes and human vulnerability to design a system with redundancies in place to protect everyone. A Safe System Approach includes the principles as summarized in Figure 3-1.
A Safe System Approach incorporates the following principles:
A Safe System Approach prioritizes the elimination of crashes that result in death and serious injuries.
People will inevitably make mistakes and decisions that can lead or contribute to crashes, but the transportation system can be designed and operated to mitigate the outcomes of human mistakes and avoid death and serious injuries when a crash occurs.
Human bodies have physical limits for tolerating crash forces before death or serious injury occurs; therefore, it is critical to design and operate a transportation system that is human-centric and recognizes physical human vulnerabilities.
2 https://www.transportation.gov/NRSS/SafeSystem
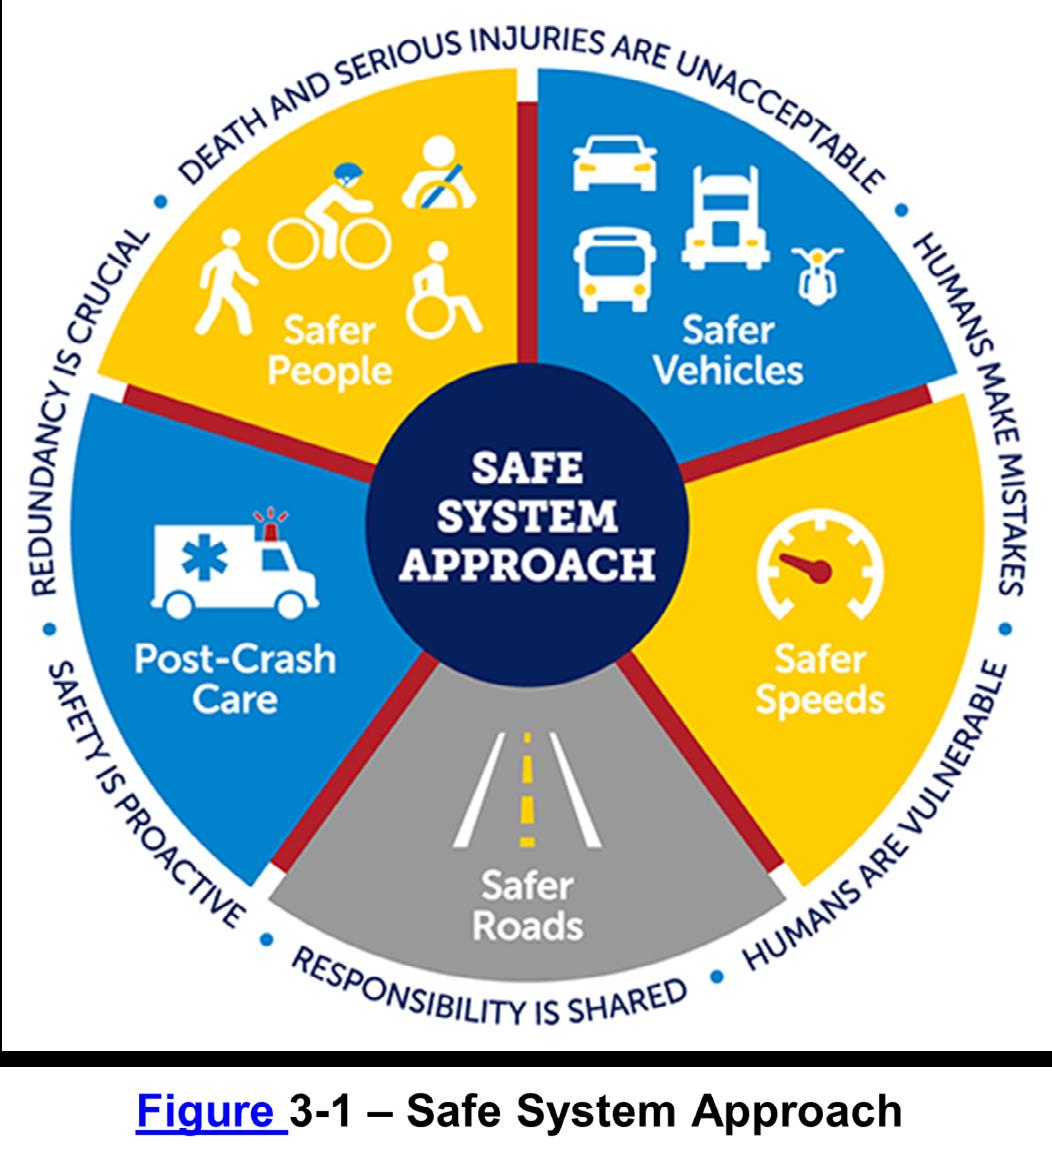
Source: USDOT, https://www.transportation.gov/NRSS/SafeSystem
All stakeholders—including government at all levels, industry, non-profit/advocacy, researchers, and the public—are vital to preventing fatalities and serious injuries on our roadways.
Proactive tools should be used to identify and address safety issues in the transportation system, rather than waiting for crashes to occur and reacting afterwards.
Reducing risks requires that all parts of the transportation system be strengthened, so if one part fails, the other parts still protect people.
A Safe System Approach requires moving away from traditional safety paradigms, as summarized in Table 3-1 3
Table 3-1
TRADITIONAL APPROACH TO SAFETY
PREVENT CRASHES
CONTROL SPEEDING
SAFE SYSTEM APPROACH PARADIGM
Prevent death and serious injury
e The Safe System Approach seeks to prevent death and serious injuries.
Design for human mistakes/limitations
e In addition to trying to improve human behavior, the Safe System Approach designs for human mistakes and limitations.
Reduce system kinetic energy
e While the traditional safety approach focuses on controlling speeding, the Safe System Approach includes speed and other strategies to reduce system kinetic energy.
Share responsibility
e Rather than asserting that only individual roadway users are responsible, the Safe System Approach aims to share responsibility among system users, managers, and others.
Proactively identify and address risks
e Instead of reacting based on crash history, the Safe System Approach proactively identifies and addresses risks.
To assist agencies to reduce the frequency of traffic-related fatalities and serious injuries on streets and roadways, USDOT has advanced an initiative of growing collection of Proven Safety Countermeasures.4 Proven Safety Countermeasures are designed for all road users and all types of roads—from rural to urban, from high-volume freeways to less traveled two-lane state and local roads, from signalized crossings to horizontal curves, and everything in between.
USDOT encourages transportation agencies to consider widespread implementation of these countermeasures to reduce fatalities and serious injuries on our roadways. Examples of Proven Safety Countermeasures are listed in Table 3-2
3 https://highways.dot.gov/safety/zero-deaths/safe-system-approach-presentation-0
4 https://www.transportation.gov/NRSS/SaferRoads

SPEED MANAGEMENT
e Appropriate Speed Limits for All Road Users
e Speed Safety Cameras
e Variable Speed Limits
e Backplates with Retroreflective Borders
e Corridor Access Management
e Yellow Change Intervals
e Dedicated Left- and Right-Turn Lanes at Intersections
e Reduced Left-Turn Conflict Intersections
e Roundabouts
e Systemic Application of Multiple Low-Cost Countermeasures at Stop-Controlled Intersections
e Enhanced Delineation for Horizontal Curves
e Longitudinal Rumble Strips and Stripes on Two-Lane Roads
e Median Barriers
e Roadside Design Improvements at Curves
e Safety Edge
e Wider Edge Lines
PEDESTRIANS/BICYCLISTS
e Bicycle Lanes
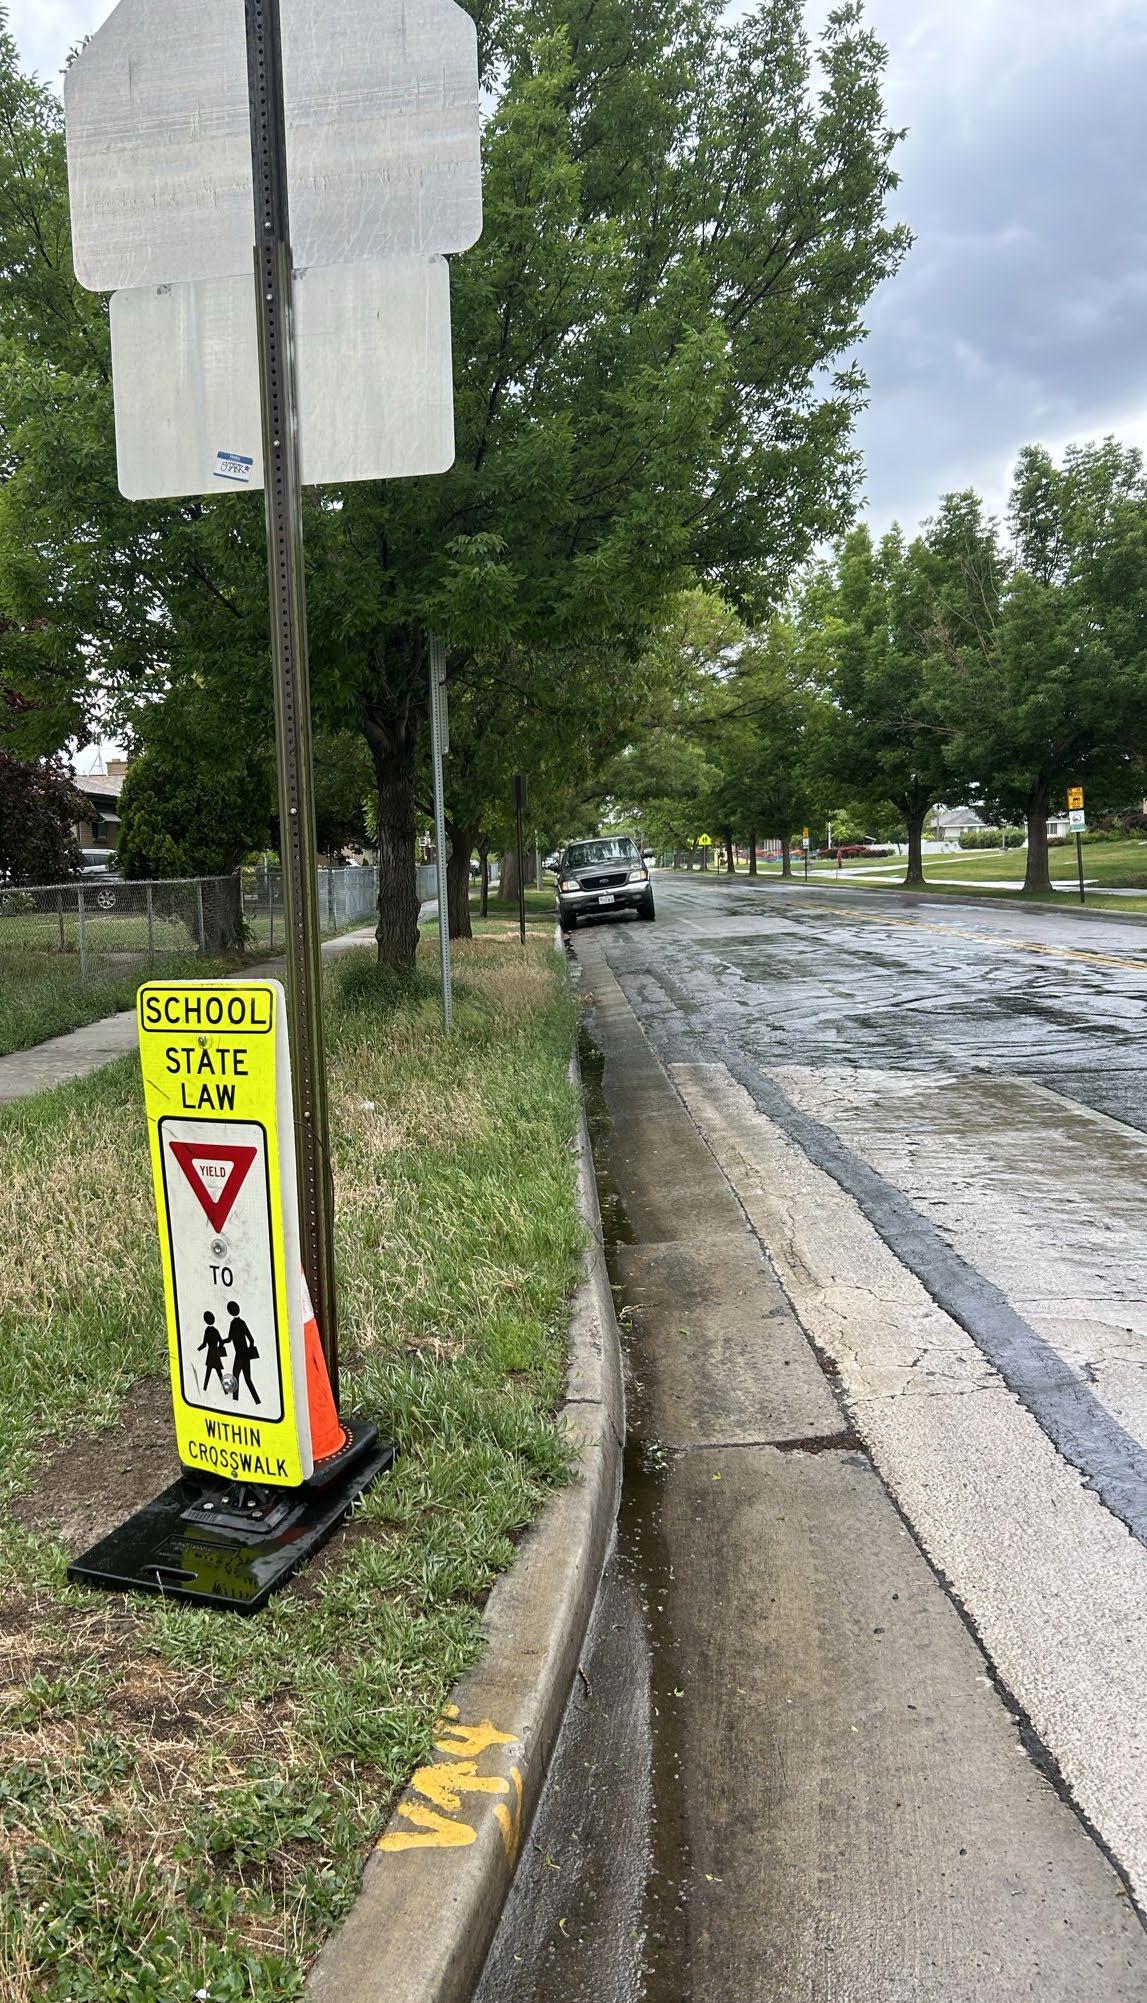
e Crosswalk Visibility Enhancements
e Leading Pedestrian Interval
e Medians and Pedestrian Refuge Islands in Urban and Suburban Areas
e Pedestrian Hybrid Beacon
e Rectangular Rapid Flashing Beacons (RRFB)
e Road Diets (Roadway Configuration)
e Walkways
CROSSCUTTING
e Lighting
e Local Road Safety Plans
e Pavement Friction Management
e Road Safety Audit
The following are example roadway improvement strategies that implement a Safe System Approach. Examples are drawn from Proven Safety Countermeasures.5
5 https://highways.dot.gov/safety/proven-safety-countermeasures/search
A review of crashes in the WFRC area shows that “speed-related,” meaning excessive or high vehicle speeds, was identified as a factor in 21% fatal and serious injury crashes.
Speed management is one of the most important methods for reducing fatalities and serious injuries. Speed is especially important in areas where vehicles and vulnerable road users mix.
Drivers typically drive at a speed that feels reasonable for themselves, rather than at speeds that are safe for vulnerable road users. A pedestrian struck by a vehicle traveling 30 mph has only a 45% likelihood of surviving; at 20 mph a pedestrian would have a 95% chance of surviving.6
FHWA recommends states and local jurisdictions set appropriate speed limits to reduce the significant risks drivers impose on others—especially vulnerable road users. Addressing speed is fundamental to the Safe System Approach to making streets safer, and a growing body of research shows that speed limit changes alone can lead to measurable declines in speeds and crashes.7
A review of crashes in the WFRC area shows that 49% of fatalities and serious injuries occurred at intersections.
The modern roundabout is a type of intersection with a circular configuration that safely and efficiently moves traffic. Roundabouts feature channelized, curved approaches that reduce vehicle speed of moving vehicles, entry yield control that gives right-of-way to circulating traffic, and counterclockwise flow around a central island that minimizes angle and head-on crashes. A roundabout has eight vehicle-to-vehicle conflict points, a 70% reduction from a traditional four-legged intersection, which has 32 vehicle-to-vehicle conflict points. Roundabouts also reduce the number of vehicles to pedestrian conflict points. The net result of lowering speeds to 15-20 mph, and reduced conflicts at roundabouts, is an environment where crashes that cause injury or fatality are reduced.
Roundabouts can be implemented in both urban and rural areas under a wide range of traffic conditions. They can replace signals, two-way stop controls, and all-way stop controls. Roundabouts are an effective option for managing speed and transitioning traffic from high-speed to low-speed environments, such as freeway interchange ramp terminals, and rural intersections to collector and local roads.


Roundabouts lower vehicle speeds. When crashes do occur, fatal and serious injuries resulting from the crash are less likely to occur.
Converting a two-way stopcontrolled intersection to a roundabout has a proven reduction of up to 82% of fatal and serious injury crashes.8
Converting signalized Intersections to a roundabout has a proven reduction of up to 78% of fatal and serious injury crashes.
Roadway departures account for over half of all traffic fatalities in the United States, and 29% of fatalities in the WFRC region. If drivers cannot clearly identify the edge of the travel lanes and see the road alignment ahead, the risk of roadway departure may be greater. Wider edge lines enhance the visibility of travel lane boundaries compared to traditional edge lines. Edge lines are considered ”wider“ when the marking width is increased from the minimum normal line width of four inches to the maximum normal line width of six inches.9 Wider edge lines increase drivers’ perception of the edge of the travel lane and can provide a safety benefit to all facility types (e.g., freeways, multilane divided and undivided highways, two-lane highways, etc.) in both urban and rural areas.10
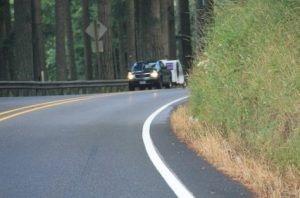
Source: Neal Hawkins/Institute for Transportation
9 Manual on Uniform Traffic Control Devices (MUTCD), Section 3A.04. FHWA, (2023).
10 https://ctre.iastate.edu/research-synthesis/rural-speed-management/pavement-markings/wide-edgelines/
11 https://highways.dot.gov/safety/proven-safety-countermeasures/wider-edge-lines
Wider edge lines can reduce crashes up to 37% for nonintersection fatal and injury crashes on rural, two-lane roads.11
Wider edge lines have a benefit cost ratio of 25:1 for fatal and serious injury crashes on two-lane rural roads
A pedestrian refuge island (or crossing area) is a median with a refuge area that is intended to help protect pedestrians who are crossing a road.
Pedestrian crashes account for approximately 17% of traffic fatalities nationally, and 25% of all traffic fatalities in the WFRC region in the five-year period (2018-2022). Nationally, 74% of these occur at non-intersection locations.12 Within the WFRC area, 60% of these occur at non-intersection locations. For pedestrians to safely cross a roadway, they must estimate vehicle speeds, determine acceptable gaps in traffic based on their walking speed, and predict vehicle paths. Installing a median or pedestrian refuge island can help improve safety by allowing pedestrians to cross one direction of traffic at a time.
Transportation agencies should consider medians or pedestrian refuge islands in curbed sections of urban and suburban multilane roadways, particularly in areas with a significant mix of pedestrian and vehicle traffic, traffic volumes over 9,000 vehicles per day, and travel speeds 35 mph or greater. Medians/refuge islands should be at least four-ft wide, but preferably eight-feet wide for pedestrian comfort. Some example locations that may benefit from medians or pedestrian refuge islands include:
e Mid-block crossings. e Approaches to multilane intersections.
e Areas near transit stops or other pedestrian-focused sites. These areas are particularly important as they represent focused pedestrian destinations and are often in close proximity to intersections. Additional detailed evaluation of pedestrian crashes near transit stops is recommended.
Medians with a marked crosswalk can reduce pedestrian crashes up to 46%.13 Pedestrian refuge islands can reduce pedestrian crashes up to 56%.
12 National Center for Statistics and Analysis. (2020, March). Pedestrians: 2018 data (Traffic Safety Facts. Report No. DOT HS 812 850). National Highway Traffic Safety Administration
13 (CMF ID: 175) Desktop Reference for Crash Reduction Factors, FHWA-SA-08-011, September 2008, Table 11.

The 10-month WFRC Comprehensive Safety Action Plan development process is illustrated in Figure 4-1
Engagement
A steering team comprised of representatives from seven local jurisdictions as well as UDOT, WFRC, and UTA, oversaw the CSAP development, and will continue to convene to monitor and coordinate CSAP implementation. Members of the CSAP Steering Team are listed in Table 4-1.
DANIEL
DAVID
KIP
SHELDON
WAYNE
To create a more complete and effective CSAP, WFRC engaged stakeholders with varying perspectives on transportation safety in the region. These stakeholders included city and agency staff, elected officials, advocacy groups, health departments, law enforcement organizations, UDOT, school districts, business leaders, and other community groups. The CSAP incorporated information provided by stakeholders through a variety of engagement activities, summarized below.
CSAP development initiated with a regional Safety Launch webinar on August 22, 2023. More than 200 stakeholders representing municipalities, counties, UDOT, health departments, advocacy groups, and other organizations attended the event. The project team introduced attendees to the CSAP project, outlined how to get involved, established a project website for sharing documents and collecting comments, reviewed desired outcomes, and described how local jurisdictions could support a regional safety commitment and prepare to submit a SS4A grant application to fund safety improvements in their communities.
The CSAP study area includes each jurisdiction within the WFRC region, as previously illustrated in Figure 1-1. To organize 65 cities, towns, and townships within the WFRC region into manageable analysis areas, jurisdictions were grouped into 11 GFAs. A map of the GFAs is included in Figure 1-2 , and Table 1-2 lists jurisdictions by GFA
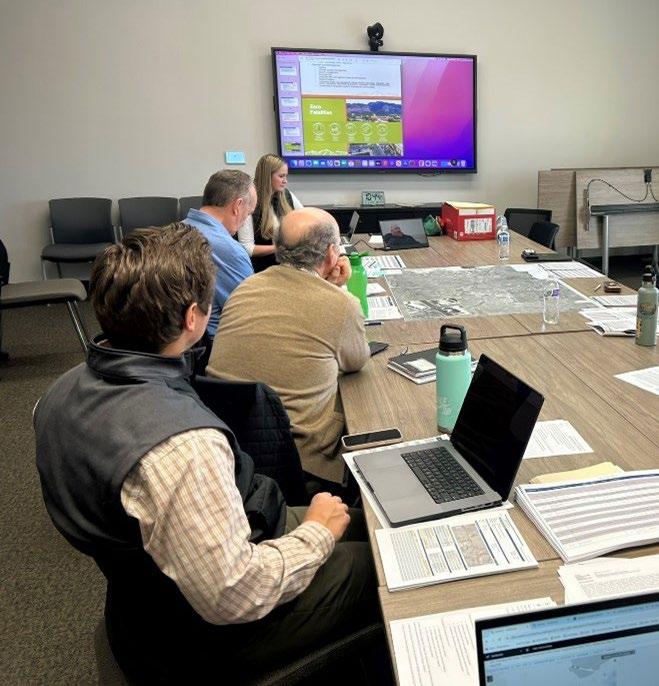
In October 2023 and February 2024, WFRC hosted safety planning workshops in each GFA.
During the 11 GFA workshops held in October, representatives from jurisdictions within each area met together to review the safety data analysis, discuss safety-related concerns, map problem areas, and review what it will take to achieve a safety paradigm shift. The project team used this input to help inform the safety analysis and guide project recommendations.
Following the safety and equity analysis process, WFRC hosted a second round of GFA workshops in February 2024. During these 11 workshops, the project team outlined safety analysis results, presented safety-improvement projects and strategies specific to each jurisdiction, and invited feedback from attendees to further project refinement.
Representatives from UDOT’s Zero Fatalities team and the Utah Highway Safety Office also shared information about partnership and funding resources available to improve transportation safety in local communities.
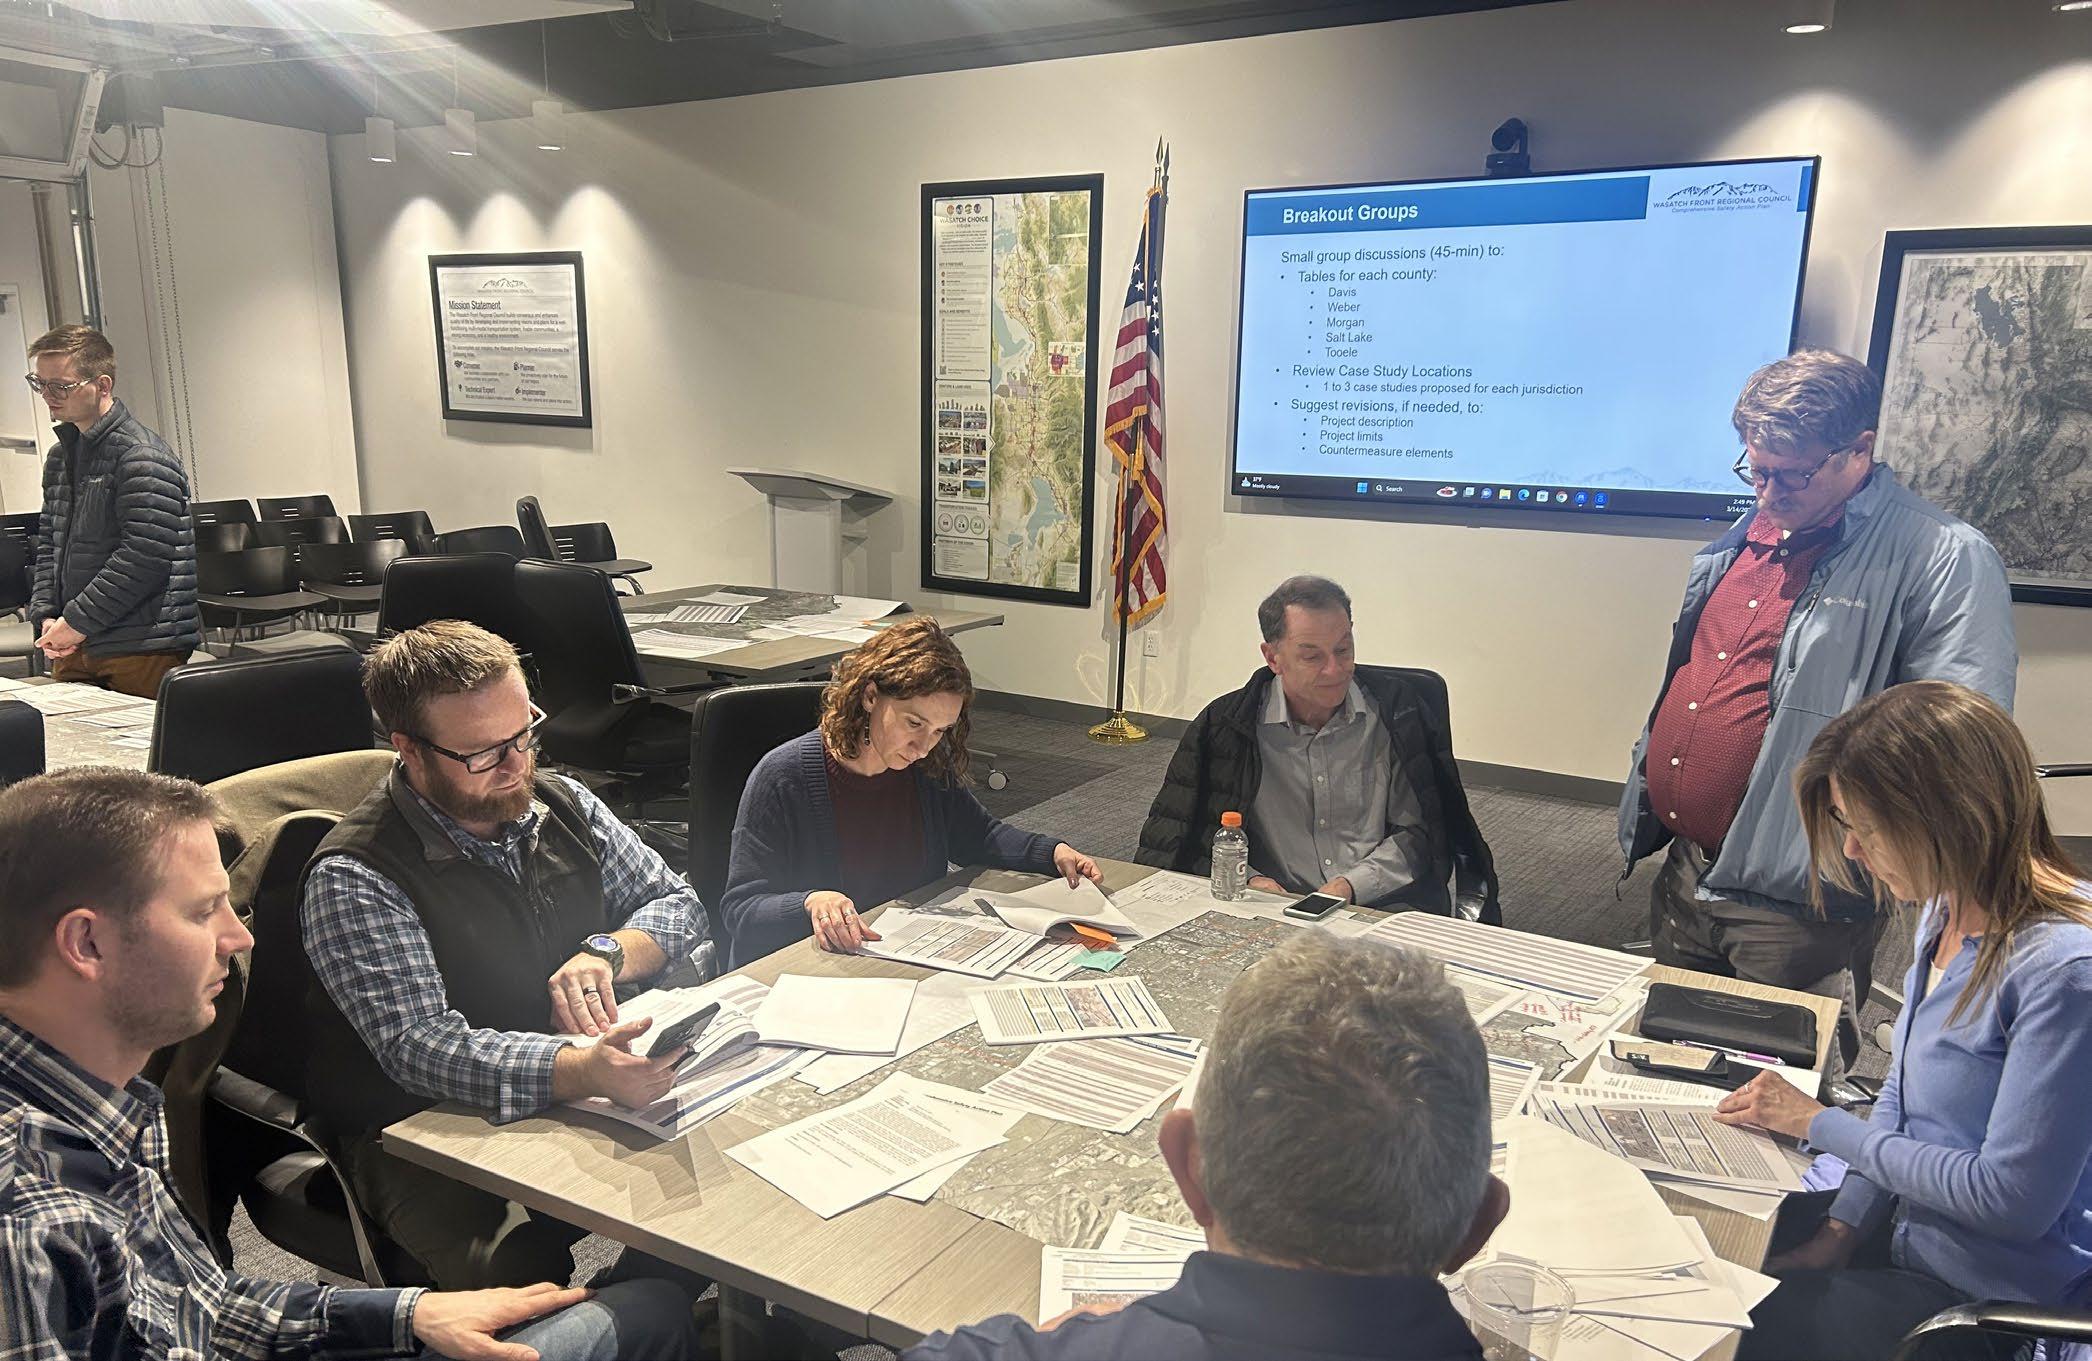
To accommodate stakeholders offering multi-jurisdictional and regional perspectives, two workshops with regionally-focused stakeholders were held, one on October 30, 2023, and one on March 14, 2024. During these meetings, staff from multiple agencies, advocacy groups, school district officials, and other community organizations discussed over-arching safety concerns and solutions.
The purpose of the Wasatch Choice Community Advisory Committee is to enhance the engagement of communities and apply an equity lens to the WFRC planning efforts while advising Wasatch Choice transportation partner agencies (UDOT, UTA, MAG and WFRC) on transportation and land use decisions. Committee membership is published on WFRC’s website.15
14 https://www.wfrc.org
15 https://wfrc.org/committees/community-advisory/#1492203600322-07b5ef37-04aa
The Advisory Committee creates a forum/dialog for enhancing awareness and understanding of the needs and priorities of diverse communities and promoting equity in the region. Advisory Committee members can make recommendations on issues and analyses potentially relevant to the needs and circumstances of diverse populations in the region.
A discussion of regional safety needs was held with the WFRC Community Advisory Committee on February 7, 2024. Input received from the Community Advisory Committee included the following:
e Yellow-light running is of concern in the region. Additional education and enforcement is needed.
e Flashing yellow lefts make it difficult for pedestrians to know whether it’s safe to use the crosswalk.
e New standards for retro reflectivity are appreciated. This issue is particularly important in construction zones when temporary striping has been placed for lane shifts, etc.
e Disability advocates noted:
e Push buttons for walk signals at intersections are sometimes difficult for people in mobility devices to reach. This could be mitigated if the pedestrian phase is automatic in the signal phasing, rather than requiring push activation.
e UDOT is developing an app that a person with a disability can use to trigger a walk cycle even if it is not automatically included in the signal phasing.
e Snow removal on sidewalks in areas where there are many disabled users, along transit lines, near schools, and in other high-priority pedestrian areas, should be prioritized.
While the WFRC CSAP is a regional initiative, Utah’s transportation safety paradigm shift will require support and action statewide. To work toward this collaborative goal, WFRC partnered with two other Utah MPOs, Mountainland Association of Governments and Dixie MPO, as well as UDOT Traffic and Safety and FHWA, to host a break-out workshop session at the Utah League of Cities and Towns Midyear Conference on April 19, 2024. WFRC and its workshop partners outlined what local government officials and staff can do to support this overall paradigm shift and their region’s safety resolution through policy alignment and infrastructure changes.
This chapter provides an overview of the safety analysis conducted for the CSAP to meet the requirements for an SS4A eligible Action Plan as part of the self-certification process. These requirements include:
e Analysis of existing conditions and historical trends to baseline the level of crashes involving fatalities and serious injuries across a jurisdiction, locality, Tribe, or region
e Analysis of the locations where there are crashes, the severity, and contributing factors and crash types
e Analysis of systemic and specific safety needs, as needed (e.g., high-risk road features, specific safety needs of relevant road users, etc.)
e A geospatial identification (geographic or locational data using maps) of higher risk locations.
A detailed overview of the safety analysis methodology and results by GFA are provided in Appendix D.
The CSAP safety analysis was informed by four individual sub-analyses, as illustrated in Figure 5-1, that each identified safety needs in the WFRC region.
The “Strategic Highway Safety Plan (SHSP) Emphasis Areas” comparison identified general crash trends and patterns in the WFRC Region. The other three sub-analyses identified specific segments or intersections with a safety need. If a segment was identified by a safety sub-analysis, it was given a “point,” as explained in Table 5-1. Segments that cumulatively received four (4) or more points were included in the WFRC CSAP Composite Network.
Each analysis is explained in the following sections.
The SHSP Emphasis Areas Analysis compares the number of fatal and serious injuries for each of the 11 Utah SHSP emphasis safety areas, as listed in the text box at right.
A ranking is assigned to each emphasis area for the state, WFRC planning area, and GFA based on the frequency of fatal and serious injuries for that emphasis area.
This analysis helps to determine priority emphasis areas for each GFA, based on whether the ranked frequency of fatal and serious injury crashes within the GFA is significantly different than the statewide or WFRC rankings.
Note that while bicyclist-involved crashes are not one of the 11 Utah SHSP emphasis areas, bicyclist-involved fatal and serious injuries were included in this analysis.
UTAH SHSP EMPHASIS AREAS
e Aggressive Driving
e Distracted Driving
e Impaired Driving
e Motorcycle Safety
e Pedestrian Safety
e Roadway Departure Crashes
e Intersection Safety
e Speed Management
e Teen Driving Safety
e Use of Safety Restraints
e Senior Safety
The Historical Crash Analysis analyzed crash trends for the five-year period, 2018–2022. Trends were identified for the WFRC study area as a whole and for each individual GFA. Results are summarized for the following areas:
e Overall Crashes by Severity and Roadway Ownership
e Crashes by Year
e Crashes by Location and Density
e Crashes by Crash Type
e Vulnerable User Crashes
e Crashes by Manner of Collision
e Intersection Crashes
e Crashes by Functional Class
e Crash Tree Diagrams
The Highway Safety Manual (HSM) provides guidance for incorporating quantitative safety analysis into project planning and development processes. The basic structure of the Roadway Safety Management Process, as recommended in the HSM, Part B, is illustrated in Figure 5-2 .
Network Screening, the first step of the process, reviews a transportation network to identify and rank sites from most likely to least likely to realize a reduction in crash frequency with the implementation of a safety improvement. The location of sites identified as most likely to realize a reduction in crash frequency are then studied in more detail to identify crash patterns, contributing factors, and potential countermeasures.
The CSAP Network Screening Analysis methodologies are based on HSM Part B, Chapter 4. Intersections and roadway segments were analyzed using the following metrics:
e Number of Crashes
e Critical Crash Rate (CCR)
e Probability of Specific Crash Types Exceeding Threshold Proportion
e Equivalent Property Damage Only (EPDO)
The initial step of the crash analysis organized roadway segments and intersections into groups, or sub-populations, with similar characteristics (e.g., major arterial, minor arterial, collector, etc.), control type (signalized, unsignalized), and by ownership (State Route, Federal Aid Route, and Local Street). Segments and intersections that experienced three or more crashes in the five-year period were identified.
The CCR analysis is a statistical review of locations to determine where a higher frequency of crashes occurred than experienced at locations with similar attributes such as functional class, number of lanes, daily volume, and posted speeds.
The CCR compares the observed crash rate of a segment or intersection to the GFA-specific average crash rate for the intersection or roadway segment. A CCR threshold is established at the 95% confidence level to determine locations with higher crash rates that are unlikely to be random. A CCR differential is then calculated for each intersection and roadway segment as the difference of the CCR threshold to the location-specific CCR. A positive CCR differential indicates a location with higher-than-expected crashes rates.
The Probability of Specific Crash Types Exceeding Threshold Proportion Analysis identifies locations where a higher proportion of specific crash types or injury levels are occurring than would be expected. The threshold proportion is based on the proportion of a specific crash attribute/severity to all crashes within the dataset. This analysis identifies locations where certain crash attributes are overrepresented and therefore subject to be isolated for further analysis. For each GFA the following crash attributes were analyzed for the locations identified from the CCR analysis:
e Crash Severity – Fatal, Suspected Serious Injury, Suspected Minor Injury, Possible Injury, and Property Damage Only
e Manner of Collision – Angle, Front to Rear, Head On, Single Vehicle, Parked Vehicle, Rear to Rear, Rear to Side, Sideswipe, and Other/Unknown
e Vulnerable Road Users – Pedestrian, Bicycle, and Motorcycle
Equivalent Property Damage Only (EPDO)
The EPDO method assigns weighting factors to crashes based on a crash severity level to develop a property-damage-only score. In this analysis, the injury crash costs, a measure of crash severity, were calculated for each location (based on 2023 UDOT crash costs). This value is divided by the cost for a property-damage-only crash to calculate the equivalent number of property-damageonly crashes at each site. This value allows all locations to be compared on an equal basis of injury crash costs.
A roadway characteristic risk analysis was performed to identify risk factors that are shown to lead to fatal and serious injury crashes occurring on roadway segments within each GFA, using the following three sub-analyses:
e Crash Profile Risk Assessment
e usRAP Risk Factors Analysis
e Local Street Risk Assessment
Crash Profile Risk Assessment
The Crash Profile Risk Assessment reviewed fatal and serious injury crashes to identify attributes that correspond to a higher frequency of fatal and serious injury crashes. A point value was assigned to each characteristic or attribute based on the frequency per the review. A risk factor score was calculated for each state and federal aid route.
Table 5-2 outlines the Crash Profile Risk factor scoring framework. The roadway characteristic data used in this assessment is extracted from UDOT’s usRAP dataset, available for state and federal aid roads. This analysis identifies roadway segments where improvements can be made to reduce potential for crashes.
A review of regional crash data shows that:
e Roadways with more than 20,000 AADT experience approximately 44% of all crashes.
e Roadways with AADT of 10,000 to 20,000 have approximately 25% of all fatal and serious injury crashes.
A review of regional crash data shows that:
e 51.4% of fatal and serious injury crashes occurred on roadways with a posted speed limit of 35 MPH or 40 MPH.
e 28.7% of fatal and serious injury crashes occurred on roadways with speed limits 45 MPH and above.
e 19.9% of fatal and serious injury crashes occurred on roadways with a posted speed limit of 30 MPH or less.
A review of regional crash data shows that:
e 28.0% of fatal and serious injury crashes in urban areas occur on two-lane undivided roadways.
e 17.3% of fatal and serious injury crashes in urban areas occur on four-lane undivided roadways.
e 16.2% of fatal and serious injury crashes in urban areas occur on four-lane roadways with Two Way Left Turn Lane (TWLTL).
e 29.1% of fatal and serious injury crashes in urban areas occur on two-lane roadways with TWLTL (9.6%), four-lane divided roadways (9.9%), and six-lane divided roadways (9.6%).
A review of regional crash data shows that:
e 48.7% of fatal and serious injury crashes in rural areas occurred on two-lane undivided roadways.
e 21.7% of fatal and serious injury crashes in rural areas occurred on four-lane roadways with TWLTL.
e 18.9% of fatal and serious injury crashes in rural areas occurred on two-lane roadways with TWLTL.
2 HSM crash prediction models for urban roadways segments indicate a reduction in total crashes with greater offsets to fixed objects.
2: Distance to Fixed Object (< 3.3’)
1 HSM Crash Modification Factors indicate that greater clear zone widths reduce run off road and single-vehicle fatal and injury crashes on rural roadways.
estimates that sidewalks can reduce crashes involving pedestrians walking along
by 65%-89%.
The United States Road Assessment Program16 (usRAP) is a tool, prepared by the Roadway Safety Foundation, to proactively analyze the safety of a roadway. In Utah, the data set is maintained by UDOT and the University of Utah for state and federal aid routes.
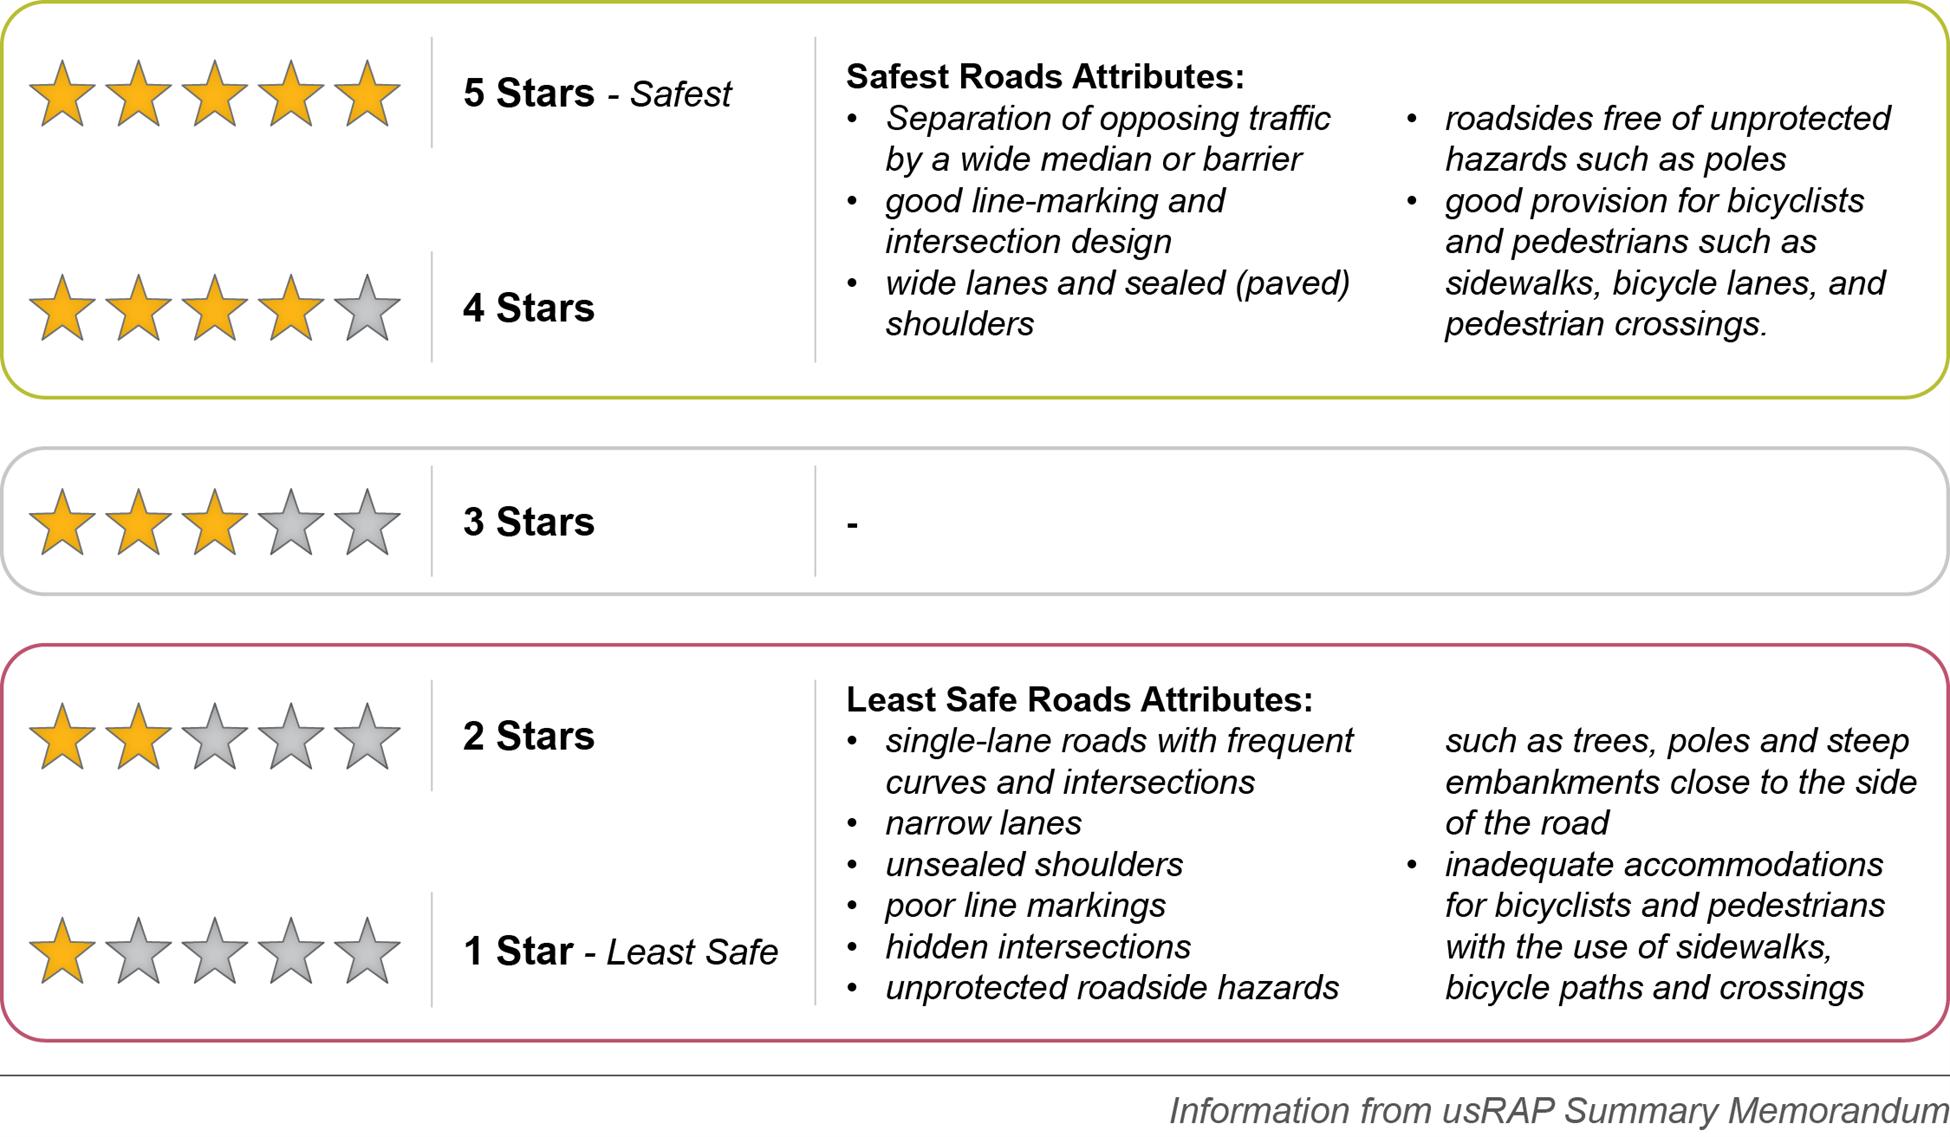
Within the tool, the road network data is coded in 100-meter segments and roadway attributes for each segment are assessed and scored by a technician. Software, known as ViDA, outputs a star rating for each roadway segment on a 1 to 5 scale (for each star increase, the socioeconomic cost of crashes is halved on that road section).
Star ratings consider road infrastructure attributes known to impact the likelihood of a crash and its severity. The roadway’s star rating is based on the presence or absence of these design and traffic control features. Stars are awarded depending on the level of safety that is “built-in” to the roadway. Separate star ratings are assigned for vehicle occupants, bicyclists, and pedestrians.
Five-star roadways have the most safety-related design and traffic control features. One-star roadways have the fewest safetyrelated design and traffic operational features. The best candidates for safety improvements usually fall in the two star and below range. Figure 5-3 provides a summary of the usRAP star rating system.
While a Star Rating Score (SRS) is calculated for 100-meter segments for vehicles, pedestrians, and bicyclists, for the purposes of producing a usable output for the region-wide WFRC CSAP, 100 meters is too detailed for a regional analysis. Hence, star ratings are “smoothed” (or averaged) over longer lengths to produce meaningful results.
A Local Street Risk Assessment was performed on all non-state highway and non-federal aid routes within the WFRC study area because the usRAP analysis described above is not available for local streets. This assessment integrated available crash data and other location factors into a scoring system appropriate for local roads, given that a more limited data set is available for local streets. These location factors account for conditions such as active transportation activity, proximity to land uses that tend to attract people walking and bicycling, equity focus areas, and speed-related data from Wejo, a big-data (vehicle location-based services data) vendor. This scoring system highlights sections of the roadway network based on the prevalence of the characteristics summarized in Table 5-3
The scoring process overlaid these datasets in geographic information systems (GIS) to rank locations that had the highest occurrence of the combined characteristics. This process identified local streets that have both the highest rate of crashes along with land use and locational characteristics that indicate a high level of vulnerable users. The scoring process acknowledges that some factors are more important than others.
After the scoring process was completed, roadway segment scores were stratified to identify the five percent of local streets in the WFRC study area with the highest scores (a high score indicates a high risk). The highest-scoring local streets were incorporated into the Composite Network, classified into Tier 1 (highest 20 segment scores in each GFA) and Tier 2 (highest 5% of scores in the overall WFRC region).
Each of the safety analysis methodologies explained identified segments or intersections with a safety need. As explained in Table 5-1, the overall Composite Network consists of segments or intersections identified by the individual sub-analysis. A composite risk score, based on a scale of 1 to 5, was assigned to overlapping segments identified in the individual analyses. Those segments with a score of 4 or 5 are incorporated into the Composite Network and represent the top 10% of State Route and locally-owned Federal Aid Route segments with a safety need for the entire WFRC area. The Composite Network also includes high priority intersections and segments identified in a Local Street Risk Assessment. The Composite Network consists of:
1. Segments with a composite score of “4” or higher
2. Intersections with a positive CCR
3. Tier 1 local street segments (20 highest segments within each GFA) and Tier 2 local street segments (highest 5% of scores in the overall WFRC region)
This section presents the results of the safety analysis that was introduced in the previous sections. Data is reported for crashes that occurred within the WFRC study area, January 1, 2018 to December 31, 2022. Results of the safety analysis for each GFA are included in Appendix D.
T he Utah SHSP identified 11 safety emphasis areas. The CSAP analysis compared the ranking of total fatalities and serious injuries for each of the 11 statewide emphasis areas, as identified by the Utah SHSP17, to total fatalities and serious injuries in the WFRC area for those emphasis areas. The results of the comparison are displayed in Table 5-4.
The top three safety emphasis areas in the WFRC study area matches the top three safety emphasis areas for the State. The Intersections emphasis area represents the highest frequency of fatalities and serious injuries in the WFRC region. Within each GFA, the Intersection Safety emphasis area ranks in the top three for highest frequency of fatal and serious injury crashes, with exception to East Weber/Morgan County, where Roadway Departure Crashes and Motorcycle Safety emphasis areas are ranked the highest.
The second ranked safety emphasis area is Roadway Departure Crashes which includes leaving the paved roadway and crossing the centerline, both of which can result in high energy collisions. Roadway Departure Crashes ranked highest in largely rural East Weber/Morgan County, South Box Elder/North Weber, and Tooele County GFAs.
Ranked third, is Speed Management crashes which increase impact energy and reduce reaction time. Speed Management ranked second, third, or fourth highest in most of the GFAs, with the only exception being the West Weber County GFA.
The Pedestrian Safety emphasis area represents the second highest frequency of fatalities and serious injuries in the Salt Lake City and Central Weber GFAs which are the two most urbanized locations in the WFRC area.
Teen Driving Safety, Senior Safety, and Motorcycle Safety are each top-three emphasis areas in one or more GFAs.
e Aggressive Driving
e Distracted Driving
e Impaired Driving
e Motorcycle Safety
e Pedestrian Safety
e Roadway Departure Crashes
e Intersection Safety
e Speed Management
e Teen Driving Safety
e Use of Safety Restraints
e Senior Safety
17 Utah SHSP identified statewide emphasis areas considering factors related to the driver, roadway, and special users (motorcycle and pedestrian). Bicycle is not one of the eleven Utah SHSP emphasis areas but was included as part of the CSAP safety analysis.
*Note that more than one emphasis area may be associated with a single crash. Reflects data from January 1, 2018 - December 31, 2022
The historical crash analysis was conducted for the five-year period from 2018 to 2022 for crashes that occurred within the WFRC study area. The full historical crash analysis is provided in Appendix D
Table 5-5 provides an overview of crashes by severity level and roadway ownership. The data shows:
e Nearly three times as many fatal crashes occurred on State Routes as compared to Federal Aid Routes. State Routes typically carry higher traffic volumes and vehicles travel at higher speeds as compared to Federal Aid Routes and Local Streets.
e The total number of crashes (all severity levels) that occurred on State Routes is twice that of those that occurred on Federal Aid Routes, and five times that of Local Streets.
e The number of all crashes that resulted in a fatality was 0.3%, and 2% resulted in serious injury in the WFRC area. That means that 97% of all roadway crashes result in minor injuries of only property damage. Eliminating all crashes would seem an impossible goal, but the safety task is limited to identifying and eliminating risk factors that lead to a small minority of serious and fatal crashes in the WFRC study area.
Figure 5-5 through Figure 5-8 summarize fatal and serious injury crashes by GFA.
e Figure 5-5 shows that the West Salt Lake Valley GFA experienced more than twice the number of crashes as compared to other GFAs, and nearly three times the average of all of the other GFAs.
e In addition, Figure 5-5 shows the West Salt Lake Valley GFA, Salt Lake City GFA, and East Salt Lake GFA each experienced more than 400 fatal and serious injury crashes over the five-year period.
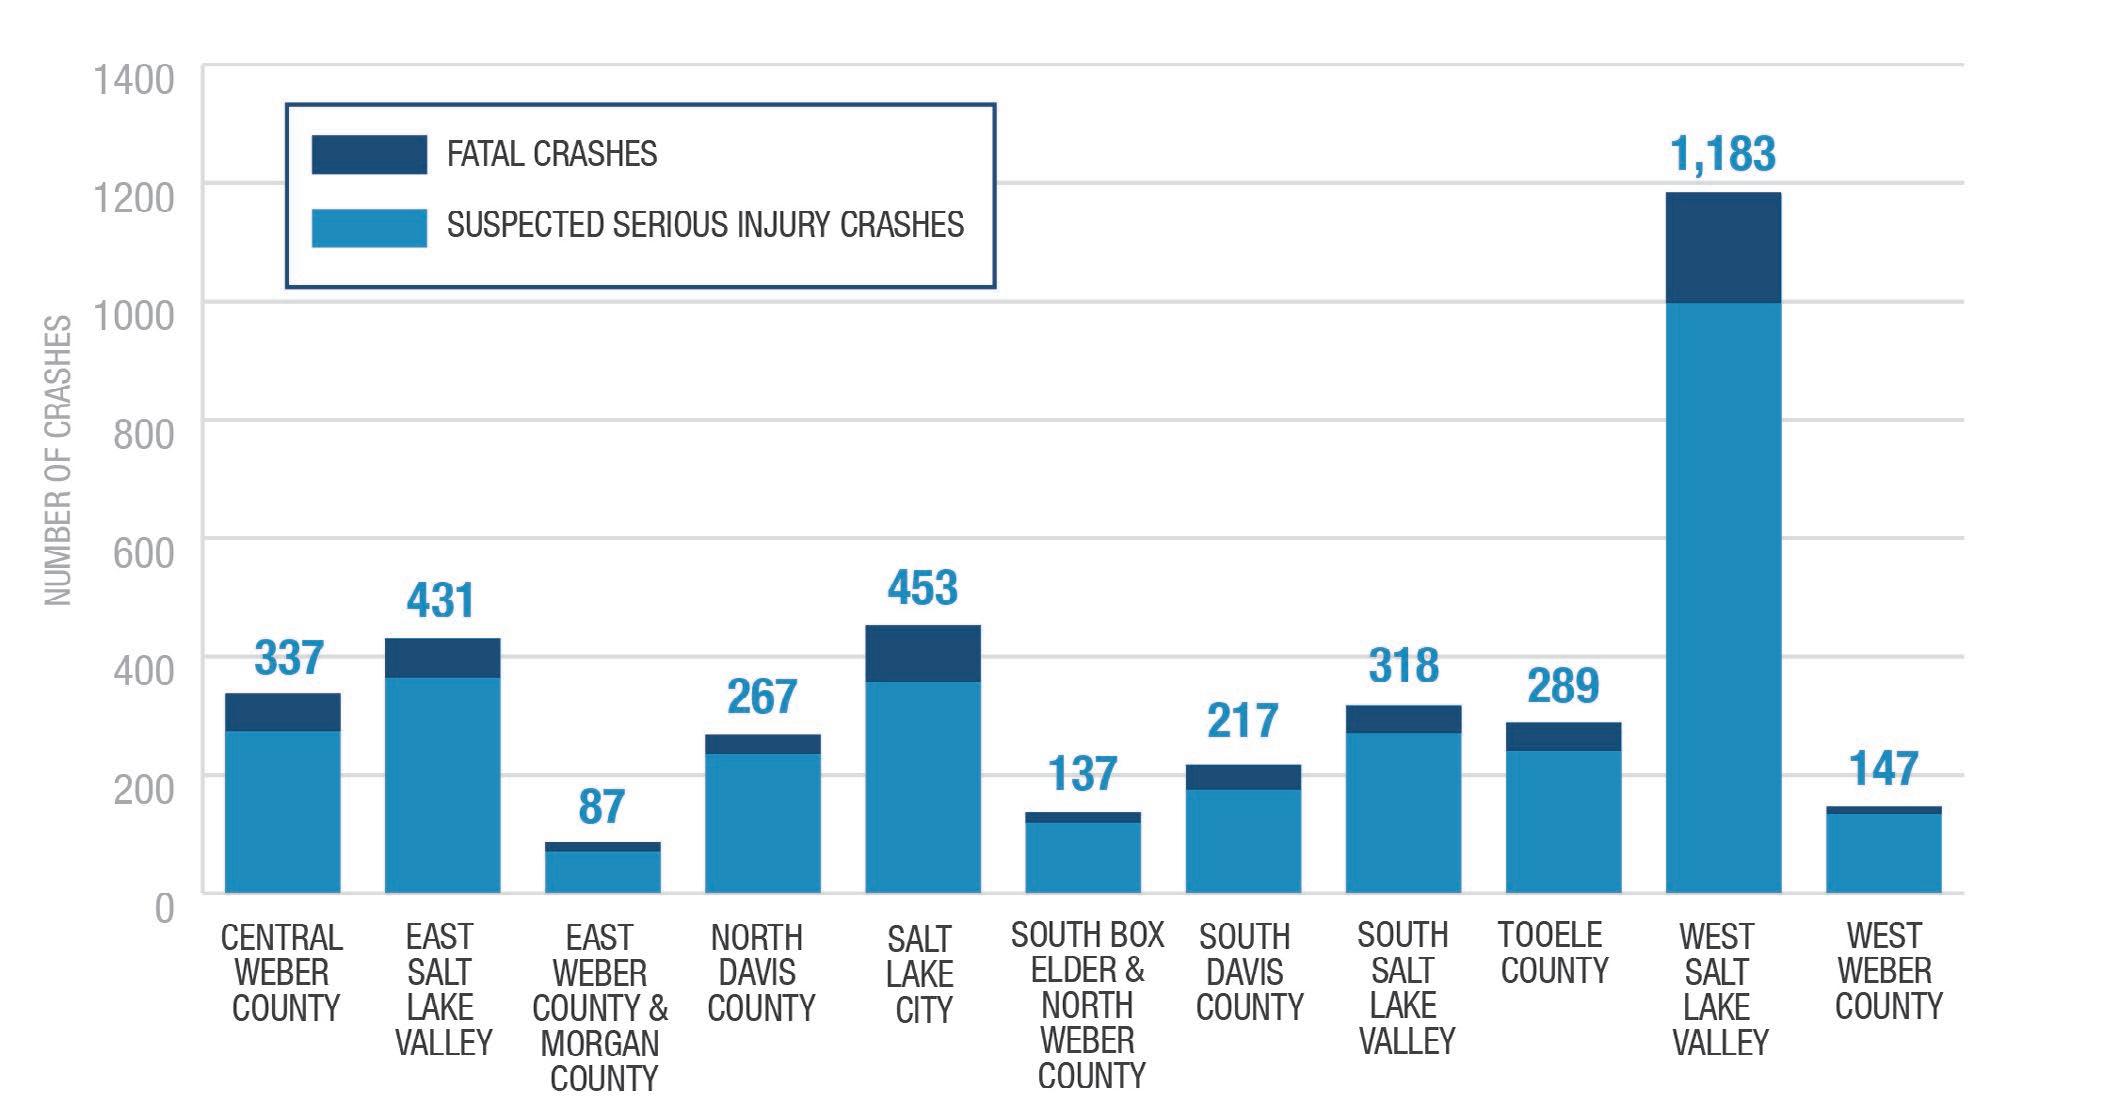
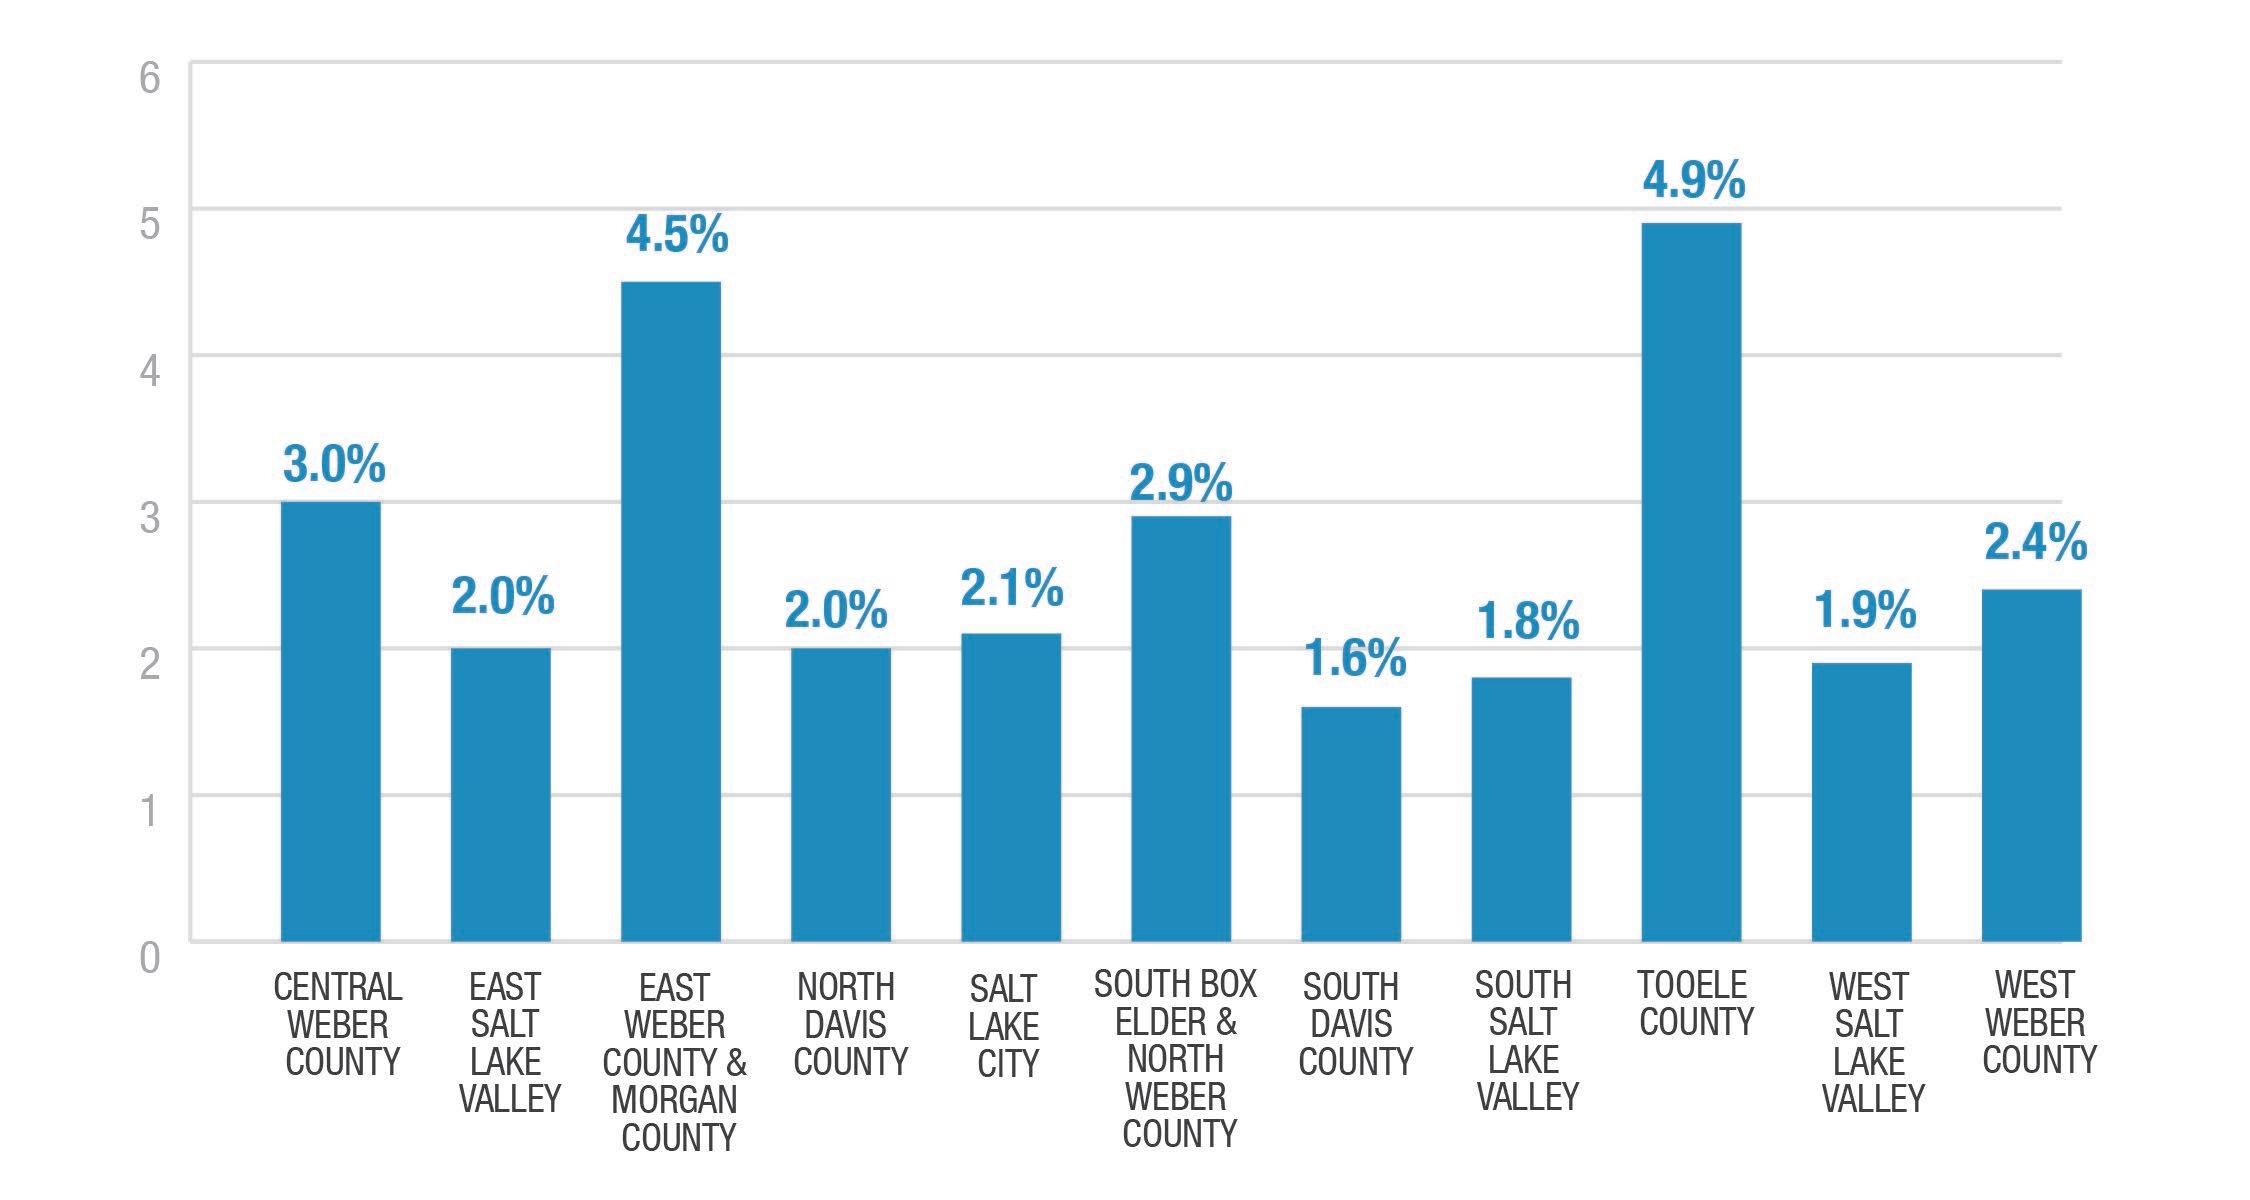
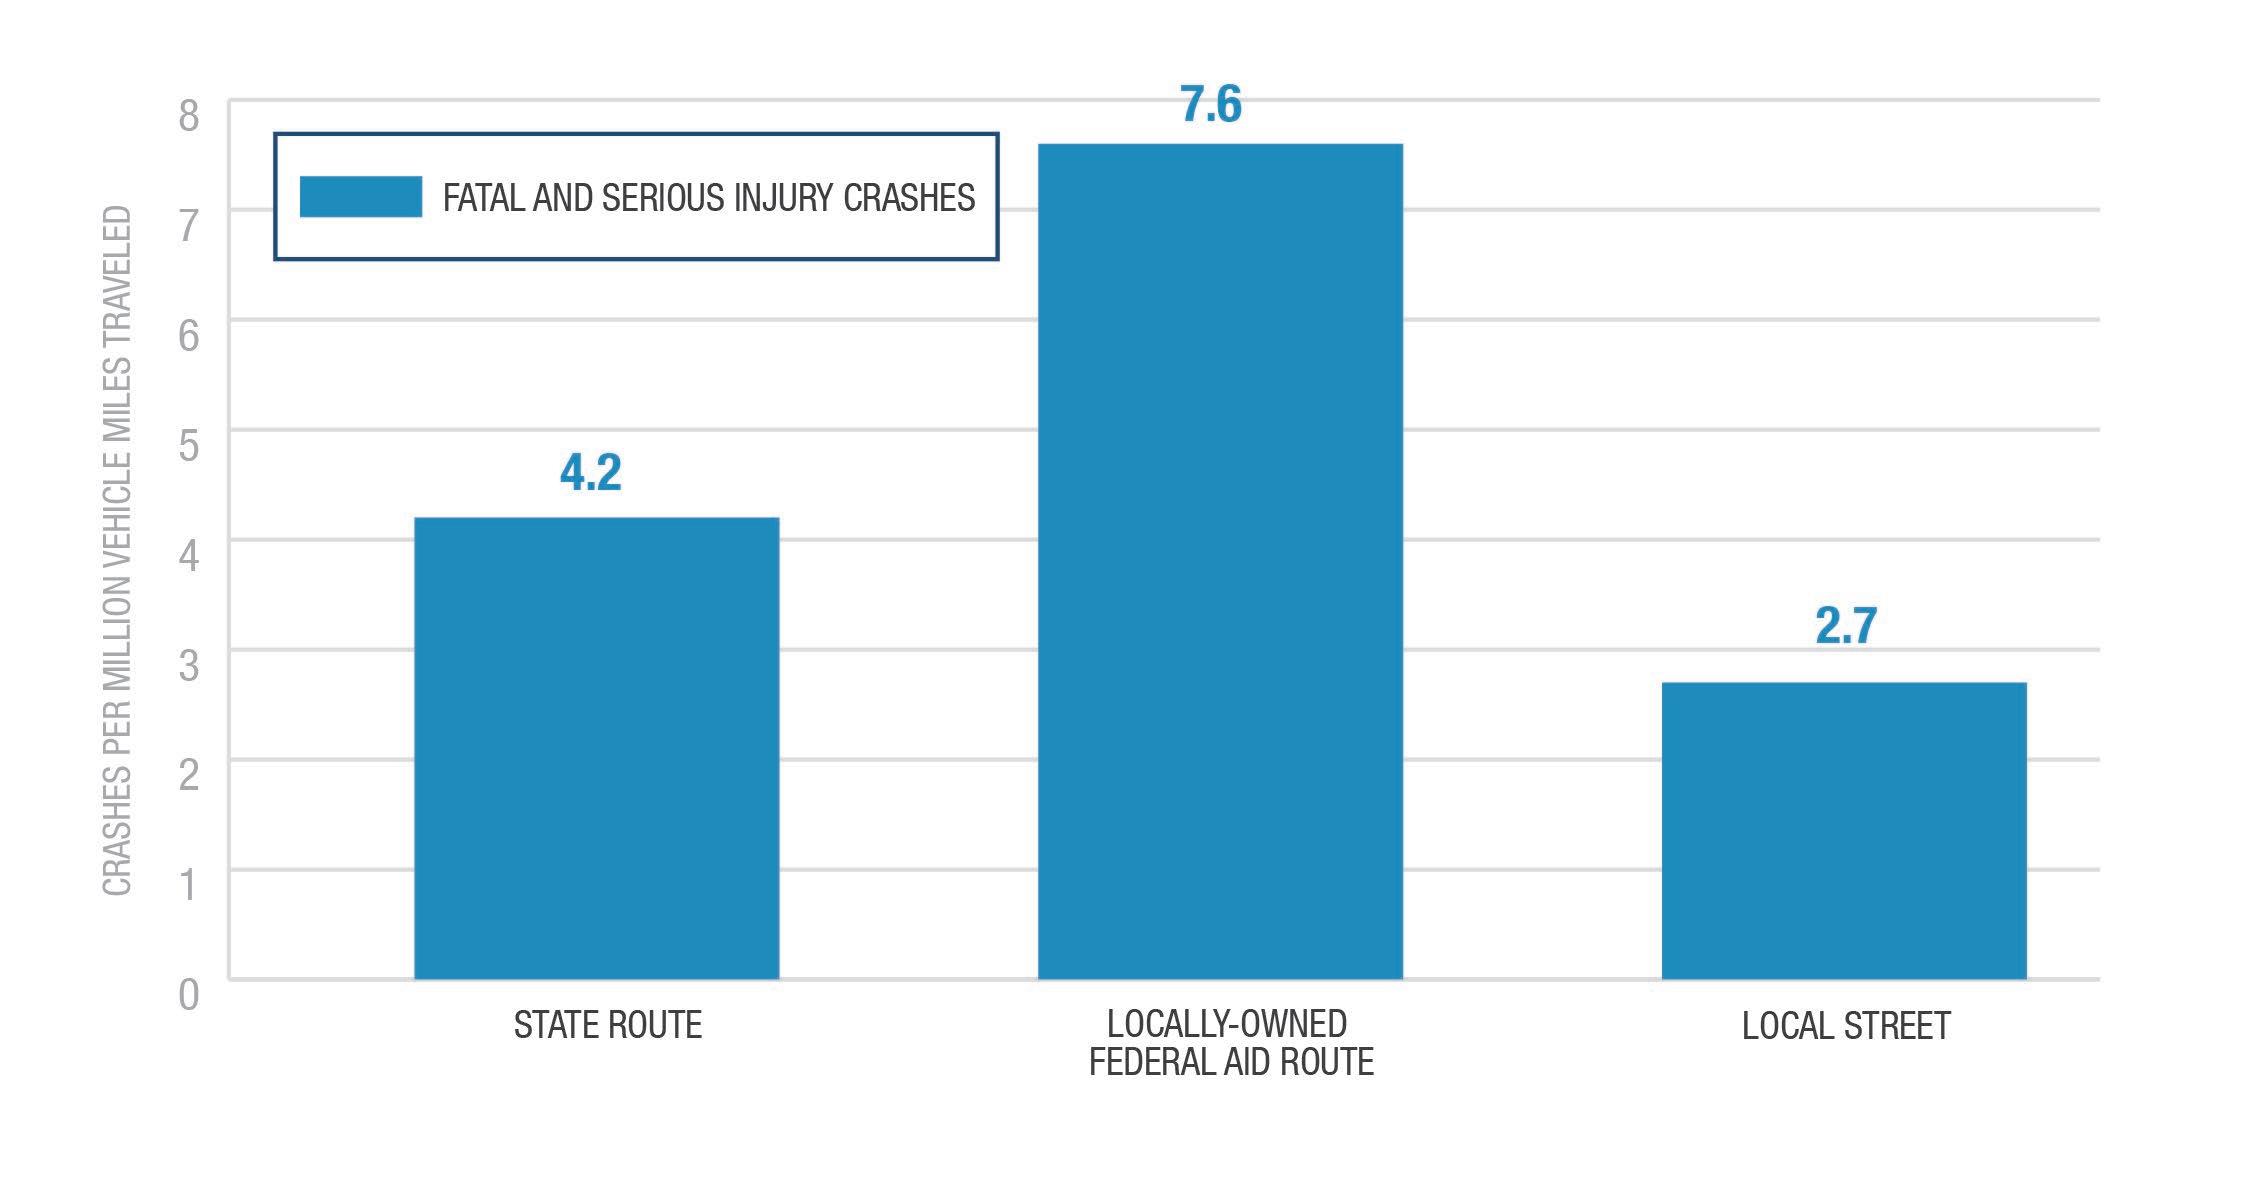
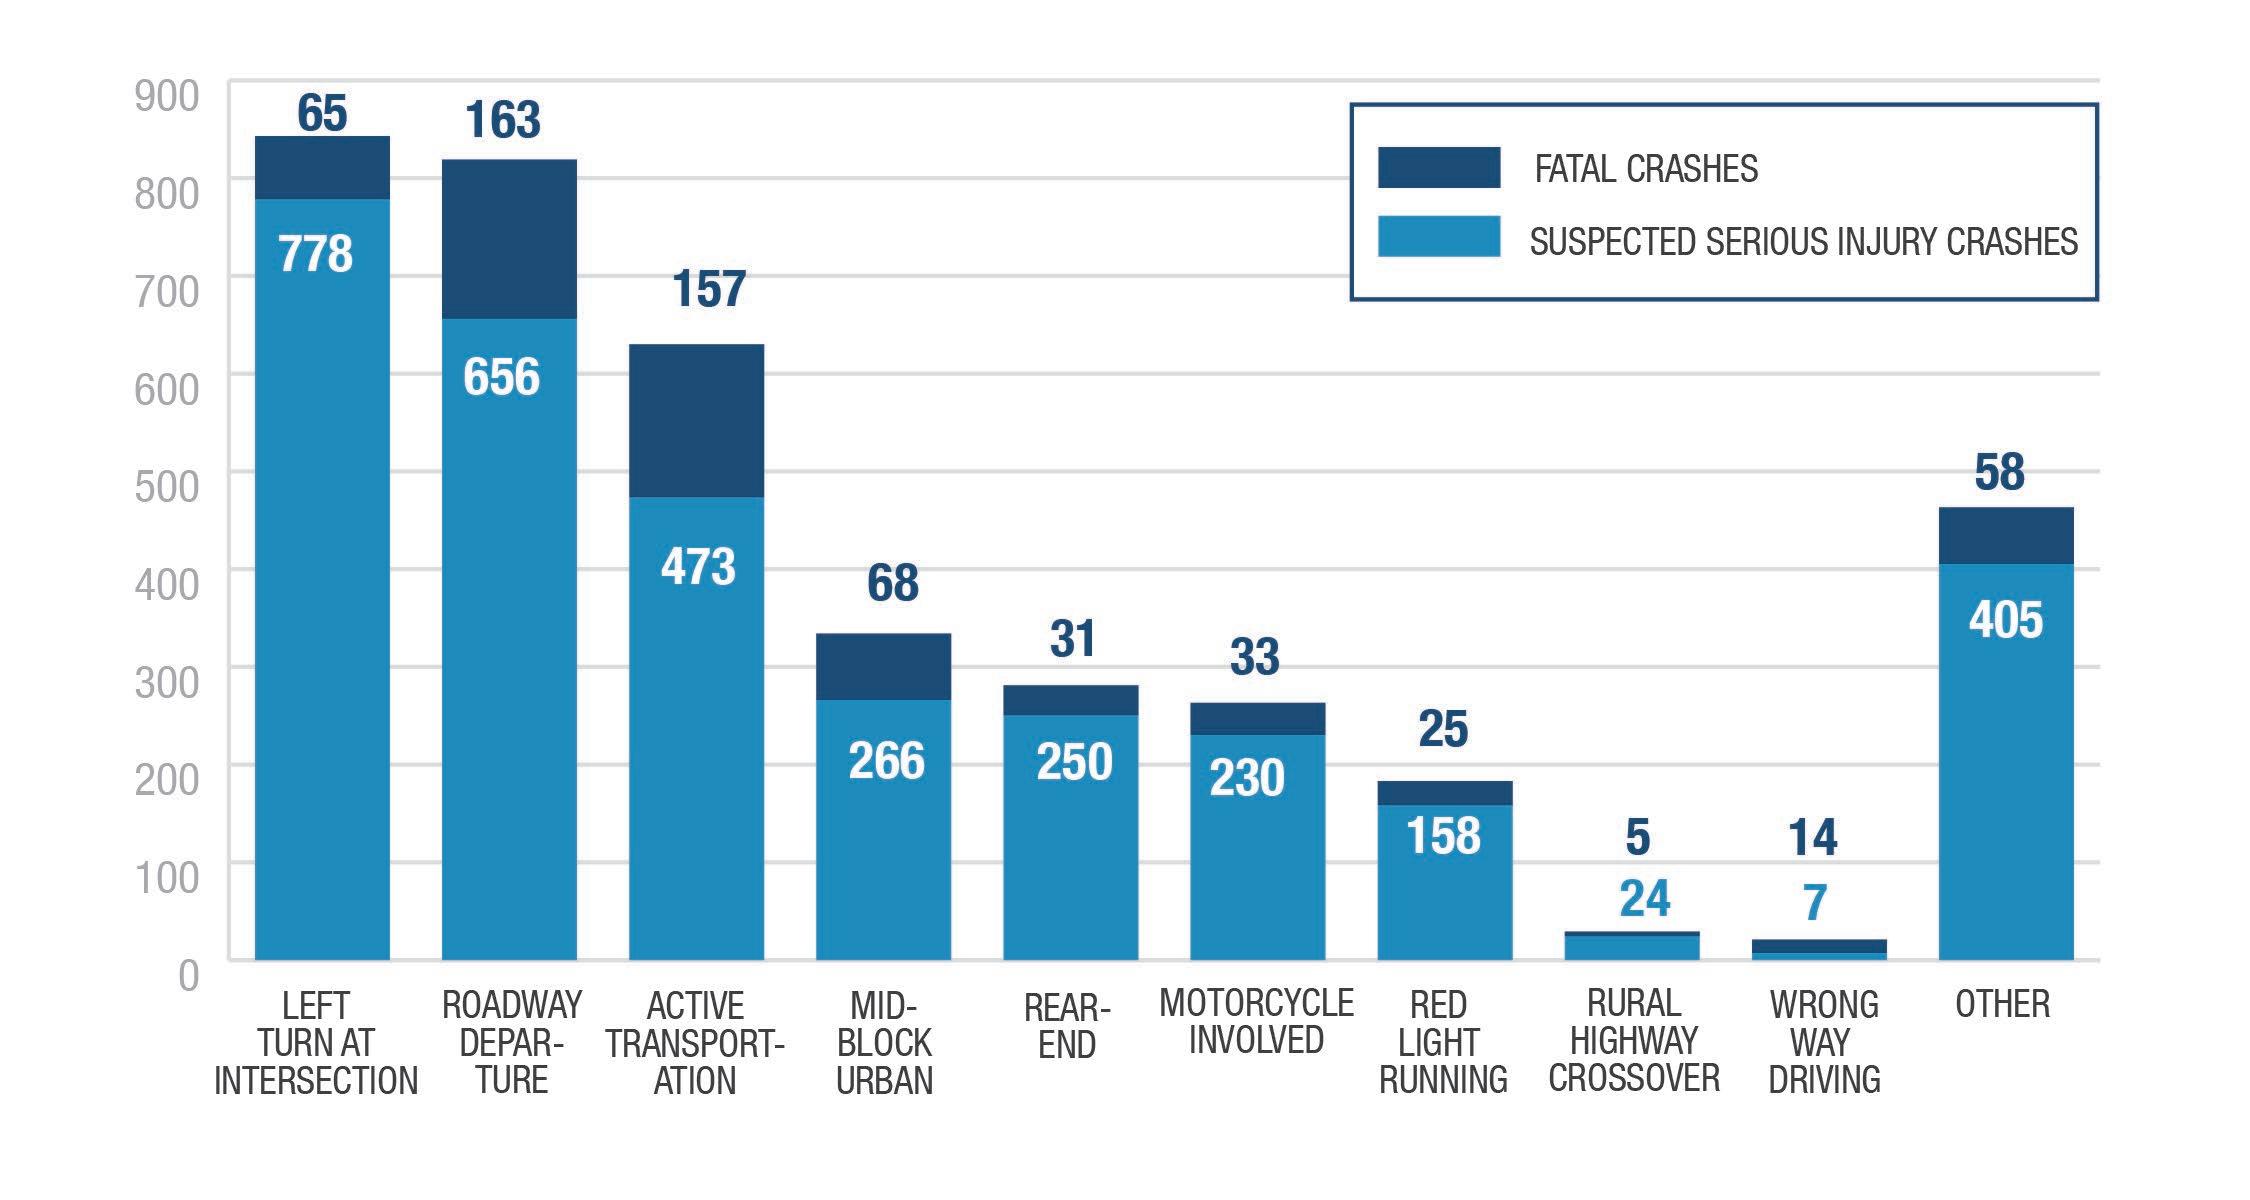
Figure 5-9 summarizes fatal and serious injury crashes by crash type. The data shows the three most common crash types are LeftTurn at Intersection, Roadway Departure, and Active Transportation. A closer examination of the data shows that all three of these crash types are most prevalent on State Routes.
Each of the completed safety analysis methodologies identified segments or intersections that may be candidates for safety improvements to reduce fatalities and serious injury crashes.
To provide focused safety priorities for jurisdictional decisions regarding safety improvements, an analysis was performed to identify overlapping segments from each of the analysis methodologies.
If a segment was identified by a safety sub-analysis, it was given a “point,” as explained previously in Table 5-1. The points, or composite score, range from zero to five, and were assigned to each State Highway or locally-owned Federal Aid route segment in the region. State Route or locally-owned Federal Aid route segments with a score of “4” or higher are included in the Composite Network. These represent the top 10% of State Route and Federal Aid Route segments for the entire WFRC area. The Composite Network also includes the highest priority intersections based on Critical Crash Rate (CCR), and segments identified in the Local Street Risk Assessment.
A complete summary of crash analysis results for each GFA for Network Screening, High-Risk Network, and Composite Score sub-analysis is provided Appendix D.
Table 5-6 identifies the appendix reference number by GFA.
Several tools are available at the federal level to begin to understand the locations of disadvantaged communities. These include the USDOT Equitable Transportation Community (ETC) Disadvantaged Areas dataset, and the Council on Environmental Quality’s Climate and Economic Justice Screening Tool (CEJST).
The ETC data uses census tracts to highlight communities experiencing transportation insecurity and other transportation disadvantages. Managed by USDOT, the tool provides insights into how transportation insecurity impacts marginalized communities. It highlights disparities in access to transportation resources and informs decision-making for more equitable outcomes. Per USDOT, transportation insecurity happens when “people are unable to get to where they need to go to meet the needs of their daily life regularly, reliably, and safely.”18 This dataset is part of the Justice40 Initiative, born from Executive Order 1400819, and uses census tracts with data from the 2020 Census to help determine the community burden that results from underinvestment in transportation. The indicators that are used to create the index in the dataset include the following:
e Transportation Insecurity
e Environmental Burden
e Social Vulnerability
e Health Vulnerability
e Climate and Disaster Risk Burden
Similarly, the CEJST dataset uses census tracts and data from the 2020 Census to identify disadvantaged communities. Disadvantaged communities are within the boundaries of Federally Recognized Tribal Lands or meet at least one category of burden. The categories of burden include:
e Climate Change
e Energy
e Health
e Housing
e Legacy Pollution
e Transportation
e Water and Wastewater
e Workforce Development
A community is designated as disadvantaged if they are in census tracts at or above the 65th percentile for low-income and at or above the 90th percentile for any of the categories listed above. The CEJST uses data related to carbon emissions, economic indicators, demographic information, and environmental justice metrics. The tool provides an analysis of how climate policies might affect different communities, considering their economic status and vulnerability. It aims to ensure that climate actions are equitable and do not disproportionately burden marginalized populations while addressing environmental challenges. Its purpose is to guide policy decisions by considering the equitable distribution of benefits and burdens across different communities.
To identify equity priority communities within the WFRC region, a locally defined equity priority index was developed. The locally defined index provides insight on not only whether transportation-disadvantaged people are present in a place, but also the degree to which they are experiencing transportation challenges.
18 https://experience.arcgis.com/experience/0920984aa80a4362b8778d779b090723/page/Understanding-the-Data/
19 Executive Order 14008, available here: https://www.whitehouse.gov/briefing-room/presidential-actions/2021/01/27/executive-order-on-tackling-the-climatecrisis-at-home-and-abroad/
The locally defined equity index (“index”) of transportation disadvantaged populations was calculated for each tract, formulated by aggregating the populations within the specified categories and then dividing by the tract’s total population. People fitting into multiple categories (for instance, people with a disability who are also over the age of 65) are counted multiple times. The higher the index number, the more disadvantaged the population is with respect to transportation. The formula used to develop the segmented transportation disadvantaged population scores is defined as follows:

Eld: Number of residents over 65 years of age
Yth: Number of residents under 18 years of age
NH: Number of non-white or Hispanic residents
LEP: Number of residents with limited English proficiency
Pov: Number of residents below 200% of the poverty threshold
HH: Average household size
Veh: Number of households without vehicle access
Dis: Number of residents with a disability
Crwd: Number of crowded households
Pop: Total population of the Census tract
These factors were evaluated for each census tract and then normalized by total population, to create an index score for each census tract in the WFRC region. The index reveals the scale of the disadvantage experienced by people in critical census tracts. The index was then overlaid with areas of known or anticipated safety risks. This analysis identified corridors where safety enhancements are needed and where communities are most disadvantaged in terms of transportation. The worst-scoring sections of state, federal-aid, and local roads on the Composite Network were identified for each community within the CSAP study area. This approach helps cities recognize roadway sections that best meet equity-based criteria for competitive federal SS4A implementation grants. As recommendations were developed for individual corridors and intersections, planners and engineers considered how various safety countermeasures would uniquely impact transportation-disadvantaged communities.
A review of the ensuing GIS-based index provides some insights on equity needs throughout the region. A full set of Equity Index maps, for each GFA, is included in Appendix D.
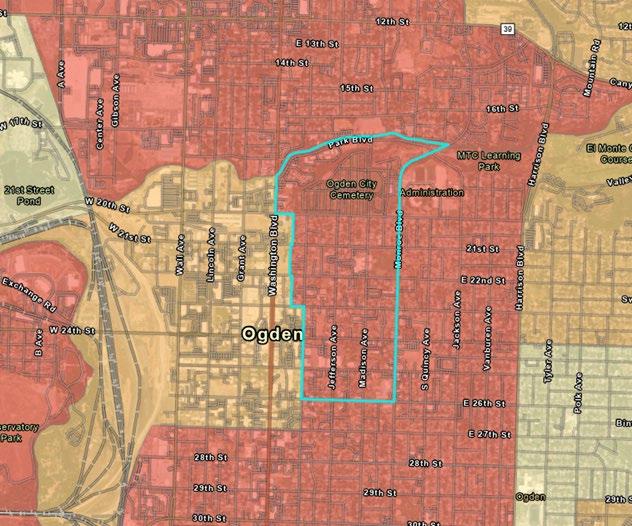
In the following figures, the darker-colored census tracts indicate high numbers of people experiencing transportation disadvantages based on the factors listed above. Figure 6-1 provides a glimpse of central Weber County. As shown, much of the Ogden area is highlighted on the map compared to its neighbors.

Figure 6-2 concentrates on Census Tract 200900 (from Washington Blvd to Monroe and from the Weber River to 26th Street); the data table indicates that of the total population in that tract (4,107 people), half (1,894) are non-white/Hispanic, and almost half (2,058) of them are below federal low-income and poverty thresholds.
Davis County ( Figure 6-3) has few concentrations of transportation-disadvantaged people, but Salt Lake City offers further insights of how people are experiencing transportation challenges, as shown in Figure 6-4. The locally defined index shows a consistent concentration of transportation-disadvantaged people in Salt Lake City’s west side, from State Street west to 5600 West. This index also indicates equity hot spots in other cities in Salt Lake County, including Magna, West Valley City, Midvale, Taylorsville, and Kearns.


Contributing factors for identifying this census tract as an equity priority area are likely that 64% of its 3,880 residents (2,508 people) are listed as non-white or Hispanic, and about 43% of its residents (1,685 people) are below the federal poverty line. This tract also has more crowded households than its neighbors, meaning there are more households where residents are sharing bedrooms or sleeping in non-bedroom areas—with 140 crowded households, and an average household size of 2.7, that equates to around 378 people are living in overcrowded conditions, or about 10% of this tract’s overall population.
The locally defined equity index was overlaid with the Composite Network to understand which corridors would most benefit people that are experiencing the most challenges regarding their daily transportation needs.
As Case Study Project Information Sheets were prepared for jurisdictions throughout the region (as discussed in Chapter 7), each project was flagged as being in a high-, medium-, or low-equity priority area.
Projects in high-equity priority areas are in communities where transportation challenges are felt most deeply, and which offer the most benefit to communities experiencing transportation disadvantages.
A key outcome of CSAP is a set of projects and strategies to address specific safety needs that can be implemented to reduce the frequency of fatalities and serious injuries.
The Safe System Approach encourages designing transportation systems with a multi-layered safety net. If one countermeasure fails, another will help prevent a crash or, in the event of a crash, lessen the likelihood of serious injury or death. The safety net includes proven countermeasures designed to protect all road users, especially people not in motor vehicles.
As introduced in Chapter 3, FHWA encourages transportation agencies to consider widespread implementation of Proven Safety Countermeasures, organized around the focus areas of speed management, intersections, roadway departures, or pedestrians/ bicyclists.
To assist communities in the WFRC to select effective countermeasures, the Proven Safety Countermeasures, and other strategies were compiled into a Countermeasure Toolbox ( Appendix F ). Countermeasures were identified from sources including those listed at right.
The CSAP recommends that agencies select locations identified in the safety analysis and use the Countermeasure Toolbox to choose corresponding effective strategies to implement in order to address the safety needs identified in the analysis. Toolbox countermeasures are organized into segment-related countermeasures, intersectionrelated countermeasures, and non-engineering countermeasures. As available and applicable, the following information is provided for each countermeasure identified in the toolbox:
e Emphasis Area/Crash Problem
e Safety Countermeasure
e Crash Modification Factor (CMF) Value
e Unit Cost
POTENTIAL SAFETY IMPROVEMENTS RESOURCES
FHWA’s Proven Safety Countermeasures
CMF Clearinghouse Website
UDOT’s Countermeasure Fact Sheets
NHTSA’s Countermeasures that Work
e Cost Effectiveness
e Application Guidance
e Urban/Rural
e Signalized/ Unsignalized
The Countermeasure Toolbox includes information about the effectiveness of each of the countermeasures.
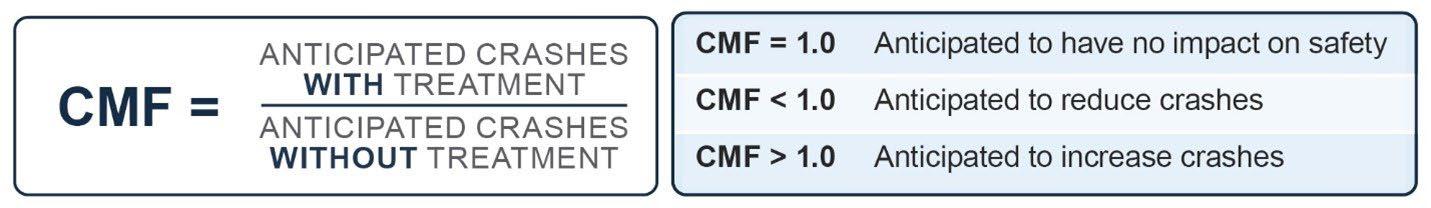
Effectiveness is measured in terms a Crash Modification Factor (CMF) or a Crash Reduction Factor (CRF). CMFs and CRFs are complementary factors used to compute the anticipated number of crashes after implementing a countermeasure or safety treatment at a specific site.
A CMF is a multiplicative factor that can be applied to the number of crashes at a specific site to compute the number of anticipated crashes remaining after a countermeasure is implemented.
A CRF is similar to a CMF but is stated as the percent reduction factor that when applied to the number of crashes at a specific site, results in the number of crashes anticipated to be reduced after a countermeasure is implemented. CMF and CRF calculations are presented in Figure 7-1 and Figure 7-2 , respectively.

A CRF or CMF should be regarded as a generic estimate of the effectiveness of a countermeasure. The estimate is a useful guide, but it remains necessary to apply engineering judgment and to consider sitespecific environmental, traffic volume, traffic mix, geometric, and operational conditions which will affect the safety impact of a countermeasure. Actual effectiveness will vary from site to site.20
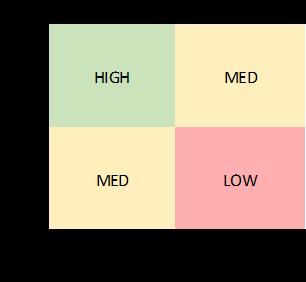
The Countermeasure Toolbox includes “Cost Effectiveness” that considers both the cost of the countermeasure and the CRF. A “HIGH” cost effectiveness represents a countermeasure with a low implementation cost and a high potential to reduce crashes. Conversely, a “LOW” cost effectiveness represents a countermeasure with a high cost and low potential to reduce crashes, as illustrated in Figure 7-3
Chapter 5 describes the process that led to the Composite Network. The Composite Network is comprised of the top 10% of State Route, locally-owned Federal Aid route, intersections, and high priority local street segments with a need for safety improvement for the entire WFRC Area.
C ase study projects were developed to provide an example and relative cost of the type of projects that could be developed for the Composite Network segments and intersections. The case studies were identified from among the priorities identified in the Composite Network. Up to three case study projects were identified for each jurisdiction within the study area. A wide range of project types were identified based on the safety analysis and jurisdiction input.
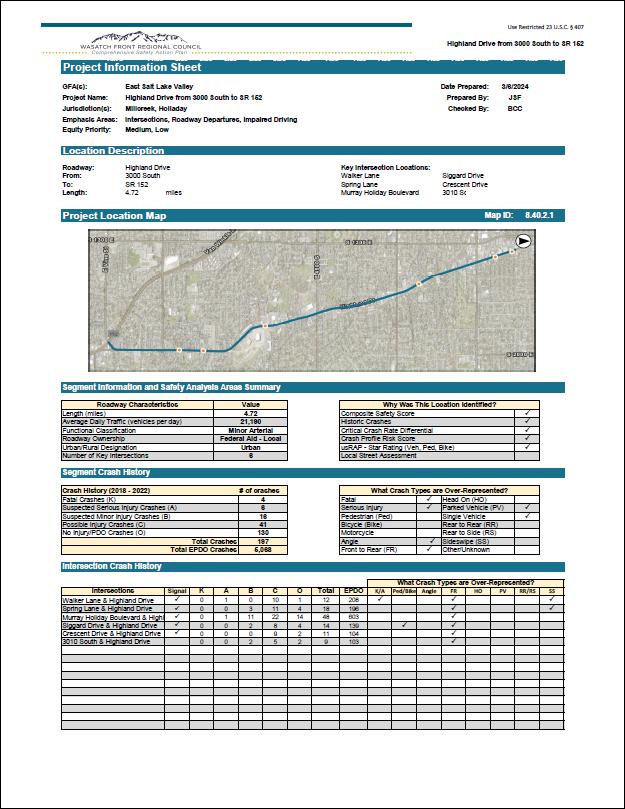
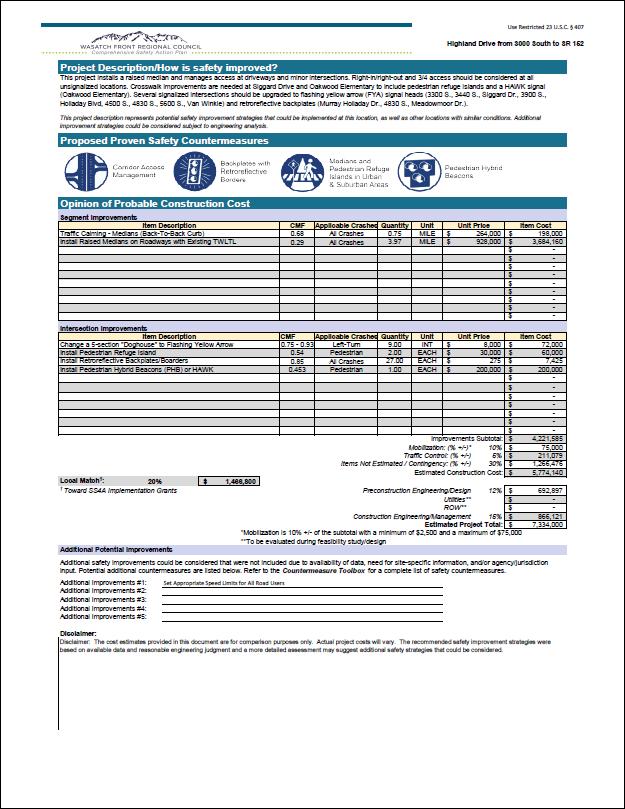
Case Study Project Information Sheets were prepared for each case study project location. These project sheets included introductory information, jurisdiction(s), SHSP emphasis areas, equity priority, location description, project map, segment information, safety analysis summary, segment crash history, key intersections, intersection crash history, project description, proven safety countermeasures, applicable countermeasure improvement, opinion of probable costs, and potential additional improvements for the project location or similar roadway type.
Figure 7-4 and Figure 7-5 provide an orientation of the Case Study Project Sheets and the information found within each page.
The Case Study Project Information Sheets are intended to provide examples of safety-focused projects that jurisdictions could implement. Countermeasures or improvements were selected from the Countermeasures Toolbox ( Appendix F ). As jurisdictions desire to move toward project implementation, additional detailed analysis is required to confirm the strategies recommended in the Case Study Project Sheets. Informed by additional analysis, it is expected that jurisdictions will modify the suggested improvements or quantities based on local knowledge.
Case Study Project Information Sheets were not prepared for every location identified as a safety need by the safety analysis. While it is expected that jurisdictions may use the Case Study Project Information Sheets to inform an SS4A grant application, the jurisdiction should also consider developing projects for locations identified in the safety analysis, but for which Case Study Project Information Sheets were not prepared. The Countermeasures Toolbox is a starting point for selecting countermeasures to implement. The full set of segments and intersections for which a safety need was identified are included in the GFA maps in Appendix D Segments and intersections with a safety need are also included in the StoryMap accessible at https://wfrc.org/programs/csap/.
Case Study Project Information Sheets were prepared for locations listed in Tables 7-1 through 7-11. Case Study Project Information Sheets for each jurisdiction, organized by GFA, are provided in Appendix D
20 Toolbox of Countermeasures and Their Potential Effectiveness for Pedestrian Crashes, available at https://safety.fhwa.dot.gov/ped_bike/tools_solve/ped_ tctpepc/#:~:text=A%20CRF%20is%20the%20percentage,is%20provided%20for%20each%20countermeasure

This section outlines best practices for safety policies, processes, education, and enforcement. The analysis and recommendations are rooted in the core elements of the Safe System Approach, in recognition that moving the needle on safety will not come from individual capital infrastructure projects alone. Rather, change must be prioritized across all community operations to see meaningful improvements. This section is a summary of the information presented in Appendix C, Policy and Best Practices Review.
These recommendations highlight effective program and policy opportunities that address a demonstrated safety need and are suited to the context of WFRC communities. While these recommendations serve as a resource for general safety improvements, they also support individual communities with a foundation for future SS4A grant applications.
This chapter is separated into the following sections:
e Overview of the benchmarking process
e Regional trends for safety policies and plans
e Recommended policies and strategies
To evaluate the current state of practice on safety policy, 108 local and county general, transportation, active transportation, and transit station area plans across 68 communities and agencies in the WFRC region were examined. The assessment focused on national Safe System Approach best-practice benchmarks to assess the level of safety commitments in WFRC communities. It is important to note that these benchmarks primarily rely on the evaluation of published local planning documents and materials, some of which have remained unchanged for years. Consequently, they offer a comprehensive external overview, but lack an “inside look” into a community’s processes. Therefore, these benchmarks serve as a general qualitative evaluation of regional safety planning progress undertaken to highlight core areas of focus.
Table 8-1 summarizes the benchmark categories used in the assessment, organized by Safe System Approach element. These benchmarks provide a framework for an effective safety approach and can inform stronger safety-related policies and programs.
Education
Progressive Enforcement
Demographic Data
Collision Avoidance
Kinetic Energy Reduction
Policies and Tradeoffs
Innovation
Proposed educational safety programs target high-risk behaviors and audiences and are to be used alongside demonstration projects to raise awareness of new designs, gain stakeholder support, and gather public feedback.
Communities examine and document the effects of traffic safety enforcement and surveillance and reallocate enforcement efforts to focus on behaviors and locations most associated with death and serious injury.
Strategies are developed and implemented for robust demographic data collection in crash reporting.
Recommended proven countermeasures separate users in space, separate users in time, and increase attentiveness and awareness, particularly for active transportation users across ages and abilities.
Communities advocate for established measures to control vehicle speed and collision angles, and assess intersection design and control decisions during planning, prioritizing reductions in kinetic energy transfer in alignment with FHWA guidance.
Functional class and modal priority are assigned to roadways for targeted safety countermeasures and efficient tradeoff decisions, evaluated at a network scale. Communities prioritize safety and accessibility for all users during construction and road maintenance projects.
Intelligent transportation systems (ITS) infrastructure is included on roadways to facilitate data collection and analysis, promoting proactive system management.
Supportive Infrastructure
Fleet Management
Vehicle Data
Design and Operations
Digital Enforcement*
Policy and Training
Crash Investigation
Partnerships
Culture and Commitment
Meaningful Engagement
Data and Analysis
Funding
Development Review
Source: Fehr & Peers, 2023
Communities provide or plan for supportive infrastructure for dynamic curbside management, autonomous vehicles, and infrastructure-to-vehicle communication to provide warnings to drivers that support safer driving behavior.
Safer operations of public and commercial vehicles are addressed through a transition plan of the vehicle fleet to lower-mass and safety feature enhanced vehicles, heavy vehicle route restrictions to avoid high-pedestrian areas, and curbside management programs to limit user conflicts around stopped or loading vehicles.
Data is collected on the involvement of autonomous vehicles in crashes for future data analysis and to inform local design and policies.
Travel speeds are set and managed to achieve safe conditions for the specific roadway context and to reduce risk of fatal and serious injuries for all road users, particularly those most at risk in crashes. Proven speed management policies and practices are prioritized to reach this goal.
Speed safety cameras and other digital enforcement technologies are implemented with an emphasis on fair fee structures.
Speed limit setting methodologies consider land use and roadway context for human-scale factors and provide staff training on speed management with a focus on minimizing fatalities and serious injuries.
Collision reporting practices promote accurate data collection and establish a feedback loop to share key insights with designers and inform outreach and education.
Data is shared among agencies, first responders, and hospitals for a comprehensive safety overview. Connect with victims' families and the advocacy community to provide support and resources, fostering partnerships in outreach and education.
Planning materials commit to the goal of eliminating traffic fatalities and serious injuries within a specific timeframe while integrating Safe System principles across administrative, programming, and evaluation frameworks.
Meaningful and accessible community engagement efforts and materials toward Vision Zero strategy and implementation are employed, with a focus on equity.
A map of the community’s fatal and serious injury crash locations is developed, regularly updated, and used to guide priority actions and funding. Data is also obtained and analyzed in an innovative fashion.
Funding recommendations and allocations are intended to advance projects and policies for safe, equitable multimodal travel, with a prioritization framework that emphasizes roadways and projects with the highest safety impact.
Communities recommend leveraging new developments with improvements to identify mitigation and cost-sharing opportunities.
*Automated enforcement is currently limited by Utah state statute, Utah Code Section 41-6a-608
This section summarizes the results of the benchmarking process. In some cases, the region aligns with suggested best practice, while in other areas more work is needed to fully integrate safety into community practices. The strengths and gaps in policies around the region are described in this section. Worth noting is that several areas of focus described in the benchmarks may be more relevant or operable for larger and more well-resourced communities, rather than the many smaller communities in the WFRC region but are still included to potentially serve as best-practice options for establishing future policy and process commitments.
Several key areas of focus arose as consistent achievements by communities in the region. The most identified benchmarking themes are described below.
Data-Driven Safety Analysis: Around one third (37%) of plans reviewed integrate a data-driven safety analysis. These plans use data to identify overall safety trends in their region but may also target crash types or traffic movements, incorporating systemic profiles, roadway factors, and mode-specific conditions. They use this data lens to make clear policy, program, and project recommendations for the community to act upon.
Focused Network Screening: Many of the plans that utilized a data-driven analysis evaluate fatal and serious injuries visually across the roadway system. This reflects the “Safety Planning and Culture” benchmark category. Historically, planning efforts tended to evaluate crashes broadly to identify areas of frequent crashes, but missing contextual information. Plans undertaken within the last five years often included more contextual information, particularly those centered around active transportation.
Separation of Users: Approximately half of plans recommend countermeasures to separate users in space and/or time, a core element reflected in the “Safe Roadways” benchmark category. Many of these plans advocate for infrastructure that supports traffic calming and active transportation.
Additionally, approximately half of plans emphasize the importance of connectivity for pedestrians and bicyclists, catering to all ages and abilities. While this is a broad recommendation, it highlights communities’ desires to center multimodal safety as a core community value.
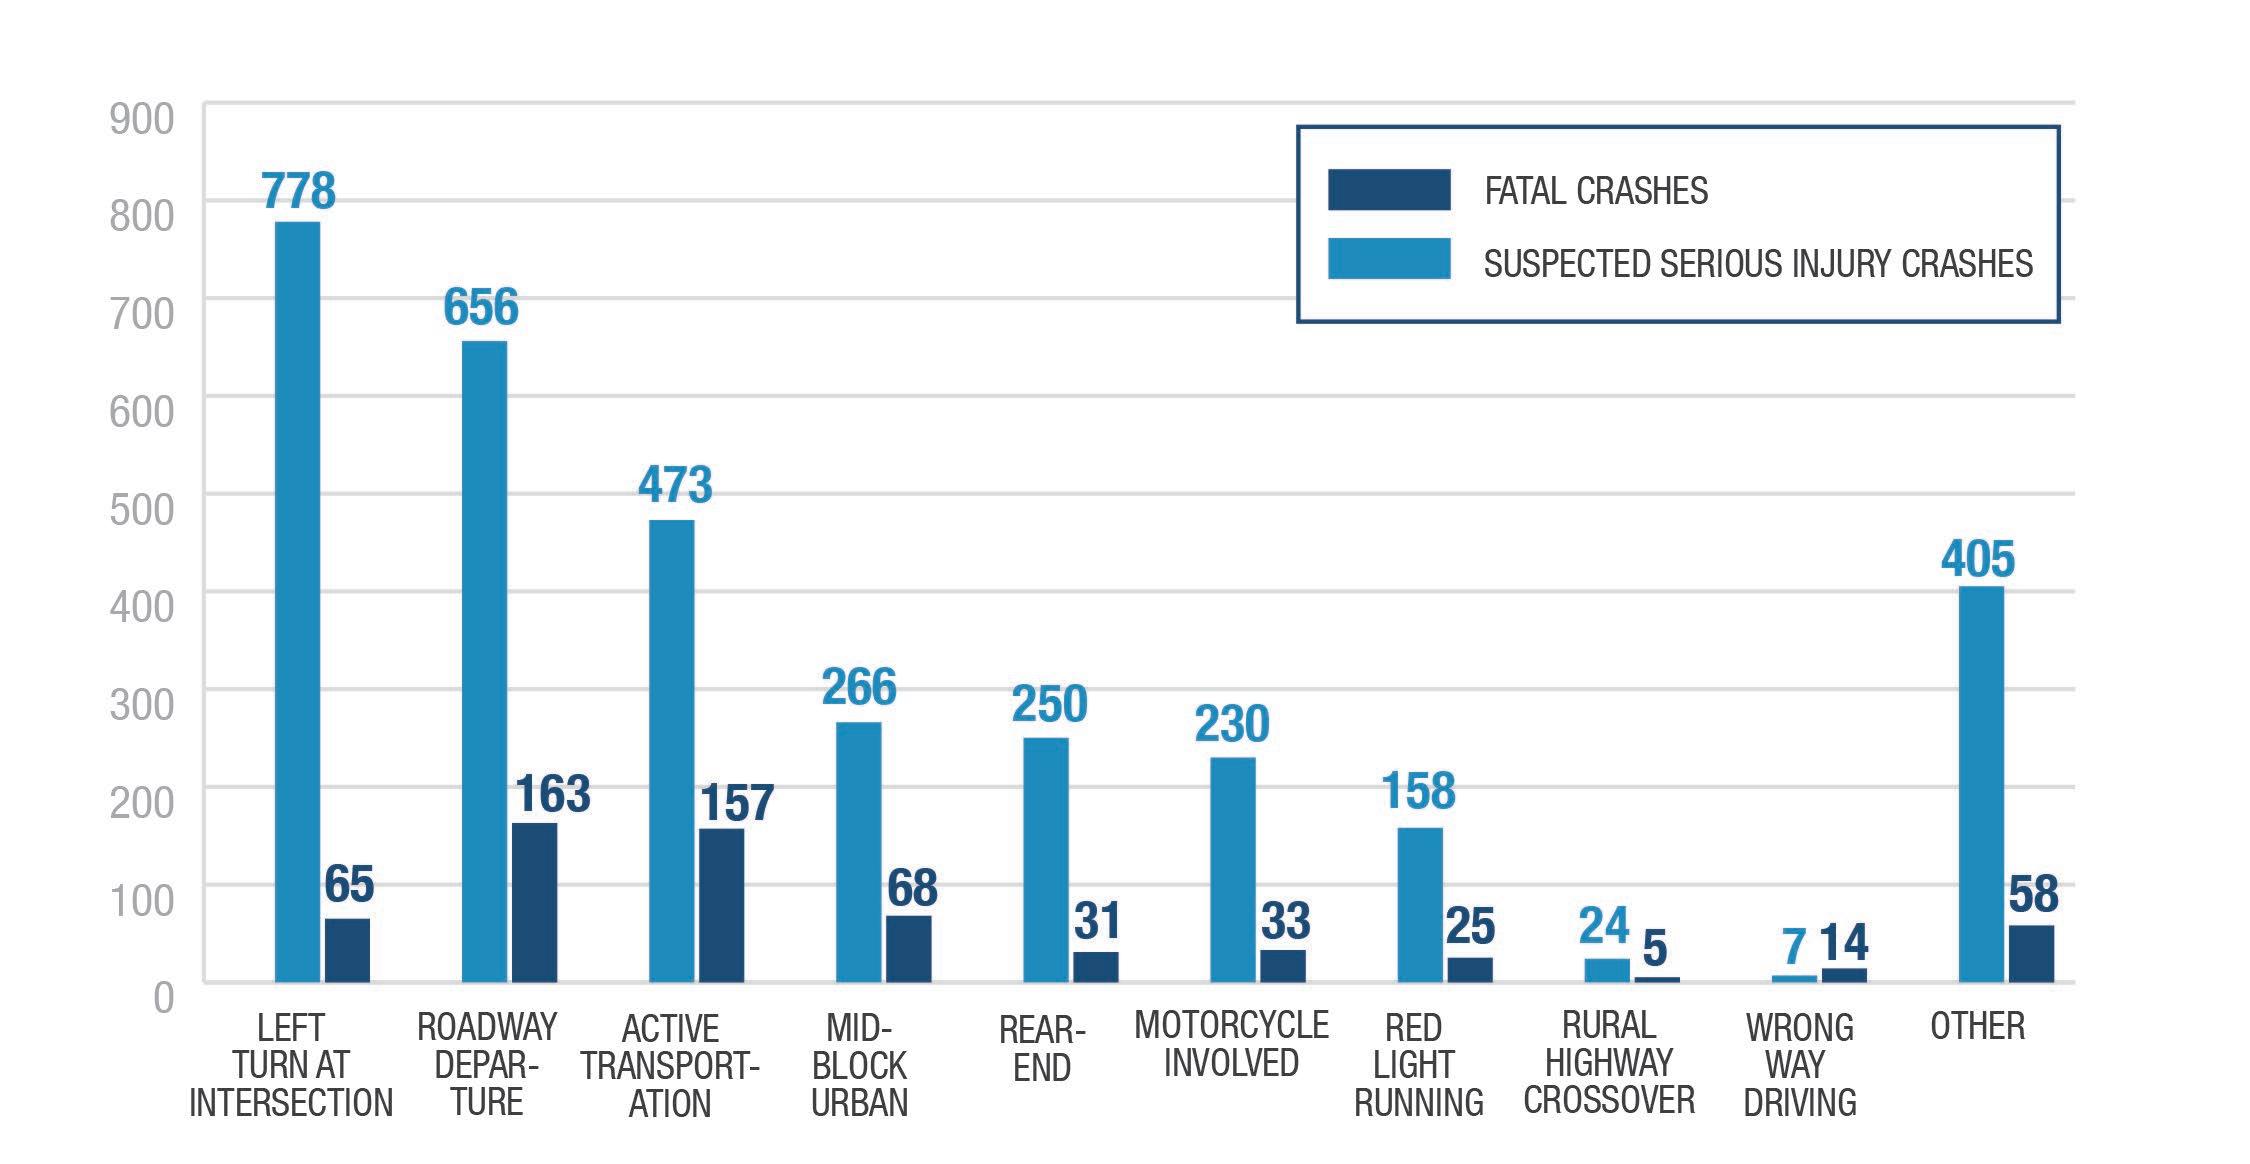
This benchmarking assessment can be compared against regional crash data, shown in Figure 8-1, to provide context for understanding where to focus safety measures. Crashes at intersections and roadway departures dominate alongside active transportation-related crashes. A notable finding from CSAP Technical Memorandum #1 is that half of all crashes occur around intersections, particularly on principal arterials and collectors, with left turns making up a considerable share of intersection crashes.21 Motorcyclist-related crashes, mid-block urban incidents and rear-end collisions also contribute to the overall figures. Together, roadway departures and active transportation crashes hold the highest share of fatalities for the region by a wide margin. Although not the sole considerations for future planning efforts, especially given the regional focus of this analysis, these types of crashes represent some of the highest policy concerns across the region.
It is unlikely for any community to include every Safe System element. The following areas represent opportunities for enhancement across the region.
Vision Zero Commitment: Although the adoption of a Regional Safety Resolution by WFRC renders individual cities eligible to apply for SS4A Implementation Grant funding, each community can demonstrate its commitment to the Safe System Approach in order to support greater safety institutionalization. Currently, Salt Lake City is the only local community in the WFRC region with a documented Vision Zero commitment. In early 2023, Salt Lake City announced a resolution to adopt Vision Zero and has begun integrating Vision Zero principles into planning project work and has established a Vision Zero task force.22 It should be noted that UDOT led the region by adopting the Zero Fatalities program in 201723 and the City of South Salt Lake has an action item to eventually adopt a Vision Zero resolution documented in the 2021 General Plan.
Crash Data Collection: Though noted as a regional strength, the benchmarking process and crash analysis highlight a need for improvements to data collection. Safety data is increasingly integrated into planning efforts, but there are frequent gaps that prevent a more thorough crash analysis, falling primarily into three categories:
e Availability of Driver Contributing Factors
e Availability of Roadway Contributing Factors
e Integration of Demographic Data
22
While data utilization is an area of success for the region, these gaps may highlight why planning materials have mostly yet to integrate a more thorough safety analysis. The lack of these additional factors in analysis may be missing key systemic issues and result in insufficient planning safety recommendations.
Equity: A key feature in modern safety approaches and funding, efforts to highlight issues of equity were present in just a handful of plans. This includes not only defining equity priority communities where underserved populations are concentrated, but exploring the impact of existing safety approaches on communities of color and other underrepresented groups, particularly regarding law enforcement and community engagement.
Safe System Approach: While safety as a value is stated in nearly all planning materials, a targeted approach to improving safety is infrequently outlined, and no plans explicitly mention the Safe System Approach. While the Safe System Approach does not represent the only avenue to safety improvements, it is important to recognize this lack of mention, as it may indicate a gap in regional safety planning knowledge among staff. Worth noting is the tendency of the region to prefer approaches to safety centered around individual responsibility rather than systemic responsibility, exemplified by recommendations to improve outreach and education and broadly increase traffic enforcement efforts.
Partnered Approaches: The integration of partnered approaches concerning post-crash care is notably absent from the planning materials. Recommendations to build direct partnerships with external organizations, enabling the sharing of pertinent data and establishing feedback mechanisms, were not evident in the documentation. While data collection efforts are expanding between law enforcement, hospitals, social care, and health departments, these collaborations were not formally acknowledged within the planning materials, indicating a need for greater emphasis on these safety strategies in future planning initiatives.
Kinetic Energy Transfer: The assessed plans do not include specific design standards with the purpose of reducing kinetic energy transfer in crash events, particularly at intersections. Kinetic energy transfer is influenced by speed and mass—vehicles that are larger or move faster transfer more of that kinetic energy when they crash, increasing the damage and injury sustained by others. Implementing design standards aligned with Safe System Approach principles, particularly through speed management, modern context-appropriate speed limit setting methodologies, and intersection design evaluations, can enhance road safety by reducing the transfer of kinetic energy and therefore the severity of crashes. The absence of such standards may indicate a gap between local regulations and best engineering practices
Progressive Enforcement: Automated enforcement is currently limited by Utah state statute, although it has been shown to be effective elsewhere in the country. Strategies such as high-visibility enforcement campaigns, focused enforcement in problem areas, and an equitable review of both the efficacy and harm of current activities have yet to be integrated into planning materials. While the Safe System Approach emphasizes a transportation system designed with a reduced reliance on police monitoring, targeted and thoughtful enforcement remains a central piece of the philosophy.
The following recommendations are presented as components of the five Safe System Elements and build upon the strengths of the region while filling gaps identified in planning materials and addressing historic fatal and serious injury crash trends. A more comprehensive set of policy recommendations is available in Appendix C. Broadly speaking, these recommendations are intended to serve as an assortment of tools for individual communities, either working internally or in partnership with other communities and agencies. Each policy recommendation indicates whether the policy is applicable at a regionwide or local scale and a rough timeline for implementation (short-, medium-, or long-term).
Timeline: Short-Term | Context: Regionwide
Safer systems start with quality data. Good data and effective analysis are key to making sound decisions on the safety, design, and operation of roadways. Unfortunately, more than a quarter of regional crash data lacks comprehensive Driver Contributing Factor entries inhibiting a robust and reliable analysis of crash trends. Crash reporting entities such as police departments should seek to investigate issues associated with data gaps. While the reasons behind these data gaps are not clear, they may be a result of technical errors, incomplete report standardization, administrative burden of crash reporting, or human error. In cases where distracted driving is suspected, the reporting officer may not have adequate resources to determine cell phone usage. To counter barriers associated with reporting, local communities, regional agencies, and emergency responders could institutionalize strategies to improve reporting performance by recording a commitment to collaborate and review in transportation safety planning efforts.
To support greater data consistency, communities and agencies across the region should also engage in quality control of crash data. While different methodologies exist, a key strategy includes ground truthing. Ground truthing involves comparing a sample of traditionally collected data with other data, such as hospital or insurance claim data, to assess relative accuracy. Another method employs random sampling, investigating small bundles of data entries to evaluate their completeness, assigning a ranking to each sample, or reporting institution to better track issues and improvements.
Resources:
e Utah Crash Report Data Dictionary
e Utah Crash Report Instruction Manual
e Utah Crash Report General Guidance
e NHTSA Crash Data Improvement Program Guide
e National Safety Council Incomplete Crash Reporting Summary
Timeline: Short-Term | Context: Composite Network and Vulnerable Communities
Even with engineering countermeasures in place, road users can fail to obey traffic laws. Law enforcement can increase driver awareness and reduce traffic crashes. If enforcement agencies are to improve overall safety in a community and build trust with its members, traffic laws must be applied equitably and with sensitivity toward groups where there may be limited rapport with law enforcement. Whenever possible, communities should investigate, document, and address the impacts of traffic safety enforcement and traffic safety surveillance on underserved groups, integrating it into public-facing performance monitoring mechanisms. Effective partnerships with community and safety stakeholders with health professionals, parents, community organizations, law enforcement, members of the justice system, and nonprofit organizations can help reduce the chances of harmful impacts.
Resources:
e Vision Zero Planning for Equity
e Re-thinking the Role of Enforcement in Traffic Safety
Timeline: Short-Term | Context: Regionwide
e FHWA Equity in Roadway Safety Hub
Communities can collaborate with school districts to use the Safe Routes to School (SRTS) programs that exist within the WFRC region, administered by UDOT, to improve route planning, provide parent/driver education, collect safety data, and potentially modify roadways to ensure safe routes for all students, particularly students in underserved areas. Many communities use their SRTS programs to highlight areas in need of investments, steering roadway capital improvements. Individually, communities and schools/
school districts can bolster SRTS programs by implementing safe walking and biking curriculum to elementary and middle school students. One such example is Salt Lake City, which was recently awarded SS4A Demonstration Grant to pilot an interactive safety education program. Dialogue and coordination between school districts and transportation planners could be improved in the school site selection process and the design of the school access and other transportation elements. A more thorough site design review involving transportation professionals can be immensely valuable to minimize pedestrian crossings on major streets or to avoid congestion and traffic conflicts at school start and end times.
Resources:
e UDOT SRTS Program
e Safe Routes to School Online Guide
e FHWA PedSafe Pedestrian Countermeasure Selection System
Timeline: Short-Term | Context: Regionwide
e Bike Utah Community Planning Assistance
e Safe Routes to School National Program
e How to Start a Bike Bus in Your Community
WFRC communities should consider joining the more than 1,500 US towns, cities, and agencies24 who have adopted Complete Streets Policy into local ordinance, which requires all users be considered each time a street investment is made. Coupled with robust, multimodal network planning, these policies enable communities to systematically assess the trade-offs associated with accommodating or not accommodating each type of user. In practical terms, a commitment and vision mean that the policy uses clear, binding, and enforceable language like “shall” or “must” in the legislative text itself, rather than words like “may” or “consider.” The policies that provide maximum value also mention several transportation modes and specifically call out biking and walking, an especially vulnerable group of roadway users. However, Complete Streets include an increasingly wide spectrum of options and are intended to be right-sized approaches for addressing critical infrastructure gaps within any community. The policy should include guidance on which streets or roadways would be prioritized for different modes – vehicles, freight, transit, bicycling and walking. Not all roadways will address all modes.
Resources:
e Smart Growth for America Complete Streets Policy Framework
e Smart Growth for America Complete Streets
Timeline: Short-Term | Context: Regionwide
e WFRC Complete Streets Tools
e Salt Lake City Complete Streets Ordinance
During the second round of GFA workshops held in February 2024, representatives from UDOT’s Zero Fatalities team and the Utah Highway Safety Office introduced their safety program purposes and suggested resources available to local communities seeking to improve transportation safety. UDOT specifically invited local jurisdictions to organize Zero Fatalities Regional Working Groups to increase safety coordination and solution identification across jurisdictions and to tap into statewide resources. It is recommended that WFRC communities draw upon the resources available through the UDOT Zero Fatalities25 program to organize and participate in Zero Fatalities Regional Working Groups organized around the GFAs established for the CSAP.
Resources:
e UDOT Zero Fatalities Program
24 Complete list of communities that have adopted a Complete Streets Policy, compiled by Smart Growth for America, December 2023.
25 https://www.udot.utah.gov/strategic-direction/zero-fatalities.html
Timeline: Long-Term | Context: Regionwide
Cities can support safer operations of city and commercial vehicles through a plan to transition their vehicle fleets to safety feature enhanced vehicles (or provide after-market safety upgrades such as telematics or speed limiters) and an update of existing heavy duty vehicle routes to avoid high-pedestrian areas.
Fleet improvements could also mean increasing the use of alternate modes, such as e-bikes, for local trips so long as such a transition avoids overexposing staff to risk.
Resources:
e Vision Zero Network Fleet Safety
e NYC Safe Fleet Transition Plan
e NYC Vision Zero Safety Toolkit for Trucks
Timeline: Short-Medium Term | Context: Neighborhood and High-Density Areas
With the growth of shared mobility services, typically offered by private companies in the form of ride-hail services (e.g., Lyft or Uber), bike share, and scooter shares, curbsides in urban areas are increasingly complex. Developing policies and design standards to address the risks associated with a concentration of shared mobility services can allow communities to encourage, prohibit, or direct how they want shared mobility to work on their streets, particularly as they interact with other elements. As different user vie for limited space, communities should consider where to implement increased user separation.
Resources:
e Virginia Tech Curb Management Practices for Safety
Timeline: Short-Term | Context: Regionwide
e NYC Vision Zero Safety Toolkit for Trucks
Appropriate speed limits reduce fatalities and serious injuries, particularly on roadways where vehicles and vulnerable road users mix. As communities develop and the land use context around existing roadways changes, communities should consider adjusting their existing speed limits to encourage driving speeds more appropriately aligned with the surrounding context where necessary. Communities should set appropriate speed limits to reduce the significant risks drivers impose on others, vulnerable road users and on themselves. This may involve updating not only the speed limits, but the methodologies used to determine these limits. Previously, many agencies and communities relied on the 85th percentile methodology for determining appropriate speed limits, which is the speed at or below which 85 percent of the drivers travel on a road segment.
Recent updates to the MUTCD (effective January 8th, 2024) have deemphasized the focus on this methodology, and instead recommends that agencies explore additional approaches when setting speed limits on urban and suburban arterials, and on rural arterials that serve as main streets through developed areas of communities. As part of UDOT’s goal of zero fatalities, the Utah policy has been updated to consider potential alternatives to the 85th percentile including the 50th percentile (median) speed, the FHWA USLIMITS2 Tool, and contextualizing assumed roadway conditions through Safe System approaches. Communities should consider adjusting not only the speed limits of their roadways to fit the adjacent land use context most appropriately, but also updating their preferred methodologies for determining these speeds to align with recommended best practices, particularly those that emphasize the importance of roadway context in speed limit setting. Rather than solely adjusting target speeds on their roadways, communities
should also work to ensure that street designs are updated to complement these adjustments whenever possible, with the physical design reinforcing speed goals.
Resources:
e Ut ah MUTCD
e UDOT Policy Update: Establishment of Speed Limits
e UDOT Speed Management Study Guidance
Timeline: Medium-Term | Context: Regionwide
e FHWA USLIMITS2 Speed Limit Tool
e FHWA Safe System Speed Limit Setting
First responders include state highway safety, EMS, 911 offices, designated trauma systems, police, federal interagency committees, and other trauma system stakeholders. Emergency first responders must quickly locate, stabilize, and transport crash victims to medical facilities. Post-crash care, however, extends beyond emergency response to include analysis of why a crash occurred, traffic incident management, and even adjudication. Communities should partner local planning agencies with emergency response providers to collaborate, share information, and mitigate severity of injuries sustained in crashes. Examples for which planning and engineering bodies could seek guidance on include:
e Emergency Medical Service (EMS) vehicle size requirements, particularly with traffic calming treatments
e Grid versus cul-de-sac challenges
e Prime locations for signal preemption
e On-street parking as a speed management technique vs EMS vehicle space and tradeoffs associated with increased conflict points.
First responders include state highway safety, EMS, 911 offices, designated trauma systems, police, EMS agencies, federal interagency committees, and other EMS and trauma system stakeholders. Communities can also collaborate with local partners to evaluate opportunities for improvements in the emergency response and trauma care portions of safety work, traditionally reserved for medical and law enforcement professionals. Opportunities for collaboration may include identifying barriers to effective traffic incident management, providing training to staff or residents in trauma care, or linking those affected by crashes to survivor networks that can help support recovery and advocate for improvements to safety.
Resources:
e FICEMS Recommendations to Improve Post-Crash Care
e National Safety Council Survivor Advocate Network
Timeline: Long-Term | Context: Regionwide
e EMS, Highway Safety & Post-Crash Care
Communities may encourage their law enforcement and public safety departments to develop and deploy a multi-discipline rapid response team to all crash locations with a fatality or serious injury to evaluate the site for safety enhancements. The team would be comprised of law enforcement, emergency services, engineering, planning, and management.
Resources:
e Utah Highway Patrol Accident Investigation Training

The WFRC Comprehensive Safety Action Plan is a living document that has been reviewed, discussed, and collectively agreed upon by the Action Plan Steering Team. It is meant for WFRC and safety stakeholders to use to advance safety through implementation of strategies, countermeasures, and policies.
WFRC recognizes the importance of accountability and performance monitoring to reduce traffic deaths and serious injuries. However, it is imperative that monitoring does not reduce or minimize the focus on the ultimate performance measure of eliminating fatal and serious injuries on all roadways for all users across WFRC region. The general approach to tracking implementation follows:
Leadership: WFRC will assume leadership of the Action Plan and will promote its implementation throughout the region. As part of this role, WFRC will be responsible for convening stakeholders on a regular basis to discuss implementation progress, operating as a regional leader in supporting partners as need arises.
Implementation Meetings: WFRC anticipates that it will convene stakeholders annually, to discuss progress, associated challenges, and opportunities to implement the plan. The meeting(s) will focus on the progress towards addressing the Strategic Highway Safety Plan (SHSP) emphasis safety areas identified previously in the Action Plan safety analysis. Upon conclusion of the meeting(s), progress will be documented, and the Action Plan may be updated as needed.
Annual Evaluation : When the most recent year’s crash data is available, WFRC will evaluate progress toward Action Plan goals by assessing region-wide fatalities and serious injuries, and critical crash attributes or risk factors. Data will also be analyzed to see if the SHSP emphasis areas have been affected. To help communicate overall safety performance in the region, WFRC anticipates preparing an annual report that tracks WFRC’s progress towards its Roadway Safety Resolution of reducing deaths and serious injuries for all roadway users by 50% by 2040. To provide context to the annually reported crash data, WFRC will use existing opportunities within the RTP and TIP update process to identify and record new capital improvements, policies, and programs that are working toward improving regional roadway safety.
Refreshing the Plan: WFRC anticipates that the Action Plan will be refreshed or updated as needed, perhaps in conjunction with Regional Transportation Plan (RTP) updates.
Funding Safety: WFRC will encourage communities to give increased emphasis to including safety improvements in their transportation improvement projects, as well as to seek funding for safety improvements through existing and new resources. WFRC will encourage inclusion of
Action Plan recommended safety improvements as part of project prioritization within the Regional Transportation Plan (RTP) and the Transportation Improvement Program (TIP).
Other Planning Efforts: WFRC will work to remain informed of current and new local and statewide safety programs, policies, plans, guidelines, and/or standards. Based on this information, WFRC can continue to identify opportunities to build upon the current Action Plan while sharing updates with local communities.
Included below is a review of current WFRC performance measures along with proposed updates for the agency to integrate into future monitoring efforts. These updates include individual performance monitoring metrics and opportunities to amend existing WFRC programs to support regional safety efforts.
WFRC currently reports regional safety progress through five highway performance measures as listed in Table 9-1. In addition, WFRC uses weighted safety criteria 27 including the usRAP Star Rating to advance regional projects during the needs-based phasing process of the RTP for active transportation (“project reduces level of traffic stress for an active transportation user ”) and roadway projects (“location on facility with low usRAP star rating and reduces serious and/or fatal crashes ”). WFRC also is currently using the usRAP Star Rating for safety as part of the TIP project selection process.
Number of fatalities
Fatality rate per 100 million vehicle miles traveled
Number of serious injuries
Serious injury rate per 100 million vehicle miles traveled
Number of non-motorized fatalities and serious injuries
Source: 2023-2050 WFRC RTP
The Utah Strategic Highway Safety Plan (October 2020) established performance measures as illustrated in Table 9-2 . These measures relate to each of the identified SHSP Emphasis Areas.
The Utah Highway Safety Office established performance measures which are tracked on an annual basis. Included are four Behavior and Activity measures and eleven Core Performance Measures that the National Highway Traffic Safety Administration (NHTSA) and Governors Highway Safety Association (GHSA) agreed upon. Also included are sixteen performance measures specific to Utah’s programs. The performance measures are shown below in Table 9-3.
Total Fatal Crashes and Serious Injury Crashes
Total Fatalities and Total Serious Injuries
Reduce the fatality rate to 0.55 per one hundred million vehicles miles traveled (100M VMT) by 2024
Reduce fatal crashes by 6.8% per year with ultimate goal of reaching zero fatalities
Reduce serious injury crashes by 6.8% per year with ultimate goal of reaching zero serious injuries
Reduce fatalities by 50% by 2030 as compared to 2010
Emphasis Areas:
e Total Aggressive Driving Fatalities
e Total Distracted Driving Fatalities
e Total Impaired Driving Fatalities
e Total Motorcycle Fatalities and Serious Injuries
e Total Pedestrian Fatalities and Serious Injuries
e Total Roadway Departure Fatalities
Number of Seat Belt Citations Issued
Number of Impaired Driving Arrests Made
Number of Speeding Citations Issued
Observed Seat Belt Use for Front Seat Occupants
Number of Traffic Fatalities
Number of Serious Injuries
Fatalities/VMT
Pedestrian Fatalities
Bicyclist Fatalities
Unrestrained Passenger Vehicle Occupant Fatalities
Fatalities Involving an Intoxicated Driver
Speeding-related Fatalities
Motorcyclist Fatalities
Unhelmeted Motorcyclist Fatalities
Drivers Aged 20 or Younger Involved in Fatal Crashes
Child Safety Seat Use for Children Ages 0-8 Years in Traffic Crashes
Percent of Children in Crashes in Child Safety Seats
Percent of Crash Occupant Fatalities Ages 10-19 that were Unrestrained
Percent of Crash Occupant Fatalities Occurring at Night that were Unrestrained
Percent of Restraint Use Among Seriously Injured and Killed Occupants in Crashes, Rural vs. Urban Fatalities Involving a Drug-Positive Driver
Helmeted Motorcycle Fatalities
Motorcyclist Crash Rate/1,000 Registered Motorcycles
Teen Driver Crash Rate/1,000 Licensed Drivers
Pedestrian Crashes/10,000 Population
Bicyclist Crashes/10,000 Population
Percent of Drivers in Fatal Crashes with known BAC Results
Average Number of Days between Submission and Occurrence for Crashes
Number of Drowsy Driving-related Fatalities
Number of Fatalities Involving a Distracted Driver
Number of Drivers Aged 65 or Older in Fatal Crashes
Source: Utah FY 2023 Highway Safety Plan
Though existing performance measures help broadly evaluate the region’s progress towards established safety targets, they lack the detail necessary to provide context for local challenges and the safety emphasis areas identified in the Action Plan. In order to provide this detail, WFRC will supplement existing performance measures to issue annual updates for key metrics and safety improvements since the initial development of this Plan.
WFRC will use two forms of additional performance measures: efficiency and effectiveness.
Efficiency measures are useful because they are often quantifiable in real time and measure rates of implementation. However, they don’t directly gauge the final outcome. For example, installing rumble strips does not guarantee fewer crashes. When selecting efficiency metrics, it is crucial to link efforts to their ultimate objectives. Despite their value, drawing clear links between actions and crash data can be difficult when monitoring the efficacy of safety work, particularly across a large, dynamic region. For example, an increase in roadway departure crashes may disguise the benefits of newly installed rumble strips. The rise in crashes may instead have been a result of a yet-unidentified contributing factor. While direct comparisons between outputs and results are not always feasible, the multifocal approach to measuring progress will bring the region closer to understanding what is working and what is not.
Conversely, effectiveness measures directly assess outcomes. These metrics are more closely aligned with overarching goals like reducing fatalities and serious injuries. The effectiveness measures used by WFRC will broadly mirror the SHSP emphasis areas and crash categories used to help inform the safety analysis of the Action Plan with additional efficiency measures to track safety investments. Because these measures are already collected and reported at the statewide level, it is expected that WFRC will utilize subsets of existing resources for region-specific review. Not only does this leverage existing procedures for crash reporting, but it may also facilitate greater interagency uniformity and collaboration. The proposed performance measures are detailed below in Table 9-4. Performance measures will be measured in comparison to the previous three or more years of data, as appropriate.
WFRC anticipates that it will provide annual effectiveness measure updates as part of the safety report as a regional summary. Efficiency measures would also be reported annually, in conjunction with the TIP preparation process.
Number of fatalities
Number of serious injuries
Number of unrestrained vehicle occupant fatalities (all seat positions)
Number of alcohol-impaired driving fatalities
Number of speeding-related fatalities
Number of motorcyclist fatalities (helmeted and un-helmeted)
Number of fatal crashes involving younger drivers
Number of roadway departure fatalities
Number of intersection fatalities
Number of bicyclist serious injuries and fatalities
Number of pedestrian serious injuries and crashes
The WFRC Action Plan webpage will include links to the UDOT Numetric Crash Query App29 and the Utah Highway Safety Office Numetric Crash Data and Statistics Query App30. The Action Plan Steering Team will work with each of these organizations to identify any additional queries that may be needed and useful by WFRC and local jurisdictions to actively monitor progress towards reducing fatalities and serious injuries.
Local agency staff are encouraged to request a log-in from UDOT to access the Numetric website and the Utah Office of Highway Safety. WFRC will facilitate this process. WFRC will also inform local jurisdictions of training opportunities for staff on the crash data Apps. Promoting access to these tools will help improve communities’ access to safety-related resources so they can tailor local approaches to reduce fatalities and serious injuries. These tools provide WFRC partners at large with the opportunity to evaluate performance across the region.
The following section describes additional opportunities for the WFRC to continually develop its safety expertise and tools for community support.
The WFRC Transportation and Land Use Connection (TLC) program provides technical planning assistance for local communities to help achieve their development goals. By bringing together local partners, the program encourages integration of multimodal transportation and land use planning, ultimately providing a platform for communities to implement a shared regional vision. Included within that vision is ample opportunity for safety improvements, and the TLC program has previously supported a number of local planning initiatives.
Safety-oriented plans and studies on a variety of scales and contexts, including implementation planning, are eligible for support from the TLC program. As such, communities are encouraged to continue applying for TLC planning support when preparing for safety projects. To support a greater safety integration across diverse TLC project types, WFRC may also consider refining existing TLC project selection criteria to address safety more directly.
WFRC anticipates that using the CSAP analysis it will update weighted safety criteria during the RTP needs-based phasing process to advance regional projects intended to deliver safety improvements. Doing so drives greater emphasis on safety during the project selection process undertaken every four years. Potential safety criteria are outlined below in Table 9-5. As more strategies, actions, and policies gain a foothold in the region, providing a concerted path to safety project implementation for stakeholders can help accelerate and solidify progress.
Project is on facility with low usRAP star rating, or on the Composite Network and would reduce serious and/or fatal crashes OR 10-15
Project utilizes an FHWA Safety Countermeasure
29 https://udot.aashtowaresafety.com/signin?returnUrl=%2Fcrash-query#/metrics
30 https://highwaysafety.utah.gov/crash-data/
31 WFRC categorizes roadway projects on three scales based on intent of the project: Within Community, Community to Region, Region to Region. All projects will be scored with the same criteria and methodology, but the weighing of criteria will change between the three scales. Refer to RTP for allocation of scores.
The Transportation Improvement Program (TIP) is a six-year program of roadway, transit, and active transportation projects for the Salt Lake and Ogden-Layton urbanized areas. It is updated annually and provides a carefully reviewed prioritization of roadway, transit, bicycle, and pedestrian projects in the region. WFRC’s safety evaluation process for the Urban Surface Transportation Program (Urban STP) currently evaluates projects on a one-to-five-point Star Rating scale, based on the usRAP network rating (discussed previously in the Action Plan and integrated into safety analysis). Potential updates to the Urban STP safety evaluation process include integrating the Composite Network as shown in Table 9-6, evaluating the safety improvements on a one-to-fourpoint scale based on assumed safety improvements.
Beyond the measures for WFRC processes described above, a few examples of additional actions for communities to consider include:
e Conduct at least one crash assessment, targeted safety analysis or collect speed data at priority locations annually.
e Prioritize local projects with at least one safety criteria (such as total crashes, number of fatalities or serious injuries, location on Composite Network, location in an Equity Focus Areas area, or number of comments received from public).
e Collaborate with at least one new partner to address traffic safety (such as law enforcement, EMS, school districts, or health departments).
e Update at least one design guideline in local code to support safety improvements.
Communities should also consider partnering with WFRC to work toward implementing these actions. WFRC will act as a regional convener to support local safety advancement, providing potential resources through funding, collaboration, and other means.