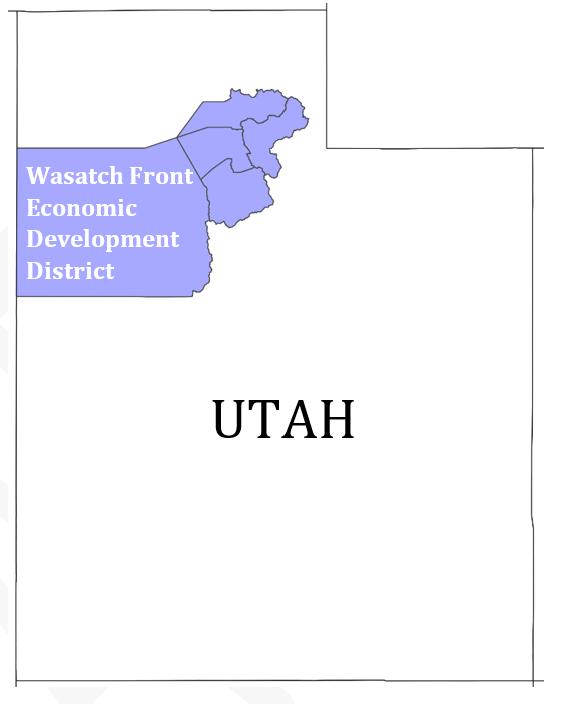
The 2023-2028 Comprehensive Economic Development Strategy (CEDS) for the Wasatch Front Economic Development District (WFEDD) outlines key objectives, opportunities, and initiatives for economic development in the Wasatch Front Region (referred to within this document as “the Region”), which comprises the counties of Davis, Morgan, Salt Lake, Tooele, and Weber within the State of Utah (“the State”).
The Region is home to 55% of the State’s total households, 66% of the State’s total jobs, and represents more than 66% of the State’s total Gross Domestic Product (GDP)1. With the State of Utah often at the top of national rankings2, the Region deserves to be acknowledged as one of the premier economic development districts in the country. The Region is paramount to the State’s economic vitality and growth. The Region is experiencing a variety of issues that are constraining the economy, including in key areas of focus for the WFEDD including the built environment, workforce, and housing. This document provides the strategy for the Region’s next five years, identifying specific strategies and action items that will improve local quality of life, increase wealth, and make the Region more resilient to economic shocks.
This Strategy contains four main sections, all of which support the main strategy of improving the Region’s economic development ecosystem:
1. City and Town Centers
2. Economic Development Capacity
3. Human Capital Development
4. Diverse Business Environment
This document is intended to support the recently completed State of Utah Coordinate State of Utah, Coordinated Action Plan for Economic Vision 2030 for Economic Vision 2030, as well as the Wasatch Choice Vision and other municipal and county-wide plans. This plan will serve as the basis for the WFEDD’s strategic focus for the next 5 years.
1 Sources: US Census Bureau, Population Estimates Program; U.S. Census Bureau, LEHD Origin-Destination Employment Statistics, 2020, LODES 8.0; Bureau of Economic Analysis, Real Gross Domestic Product by State and County, 2021 data using 2012 chained dollars.
2 See https://www.usnews.com/news/best-states/utah and https:// worldpopulationreview.com/state-rankings/best-states-to-live-in, where Utah is #1 and #3, respectively.
Regional Key Findings
The Region is enjoying tremendous success and prosperity, with one of the most industrial diverse economies of any region in the United States. The Region enjoys a wide variety of well-paying jobs and a workforce that is highly engaged and participatory. However, constraints due to the natural barriers of the Wasatch Front Range and the Great Salt Lake limit the total buildable area of the Region, causing upward pressure on land values and limiting the amount of developable land.
In addition, workforce shortages—especially in lowerskill jobs—as well as high housing costs have created a challenge along the Wasatch Front. The Region has an opportunity to address these issues through the intentional development of City and Town Centers, or human-focused clusters of activity that provide transportation, housing, culture, and health within a walkable area. This will improve the quality of life, make amenities more accessible for workers, and move the Region toward the desired outcomes of the Wasatch Choice Vision.
Key Strategies and Recommendations
The following are the key strategies and high-level recommendations provided within this CEDS. Each section contains an analysis of specific regional issues that were identified by stakeholders and substantiated through rigorous analysis. Additional details and tasks can be found within the recommendations of each section.
A matrix of all the recommendations, tasks, and metrics is provided in the last section of the document: Regional CEDS 2023-2028 Evaluation Framework. There is also a companion dashboard tool (available on the WFEDD website) that shows the Region’s progress on these recommendations over time.
Strategy 1: Promote City and Town Centers
• Promote the development of City and Town Centers
• Provide resources to support the development of City and Town Centers
Strategy 3: Support Human Capital Development
• Increase the labor force participation rate for lowparticipating groups
• Reduce completion and attainment gaps for minority populations
• Include diverse stakeholders and representatives
Strategy 2: Facilitate Economic Development
Capacity
• Assist the development of an Economic Development Professional Network
• Facilitate grant applications
• Support the Region’s counties
• Host a regional data hub and data dashboard
Strategy 4: Leverage a Diverse Business Environment
• Refine objectives for small business recruitment
• Improve the entrepreneurial support ecosystem
• Leverage technology to fill workforce gaps
• Promote sustainable technologies
SUMMARY BACKGROUND
This 2023-2028 Regional Comprehensive Economic Development Strategy (CEDS) outlines the Wasatch Front Region's economic objectives and the roadmap to achieving them. The Wasatch Front Economic Development District includes Salt Lake County, Tooele County, Davis County, Weber County, and Morgan County.
This strategy serves as a regional economic development plan for a resilient and prosperous economy. It provides a collaboratively developed efforts and provide information to local decision-makers to assist with setting priorities for investment in key economic development efforts.
This CEDS process began in February based on the analysis and synthesis of prior plans, stakeholder input, and thorough data analysis and research.
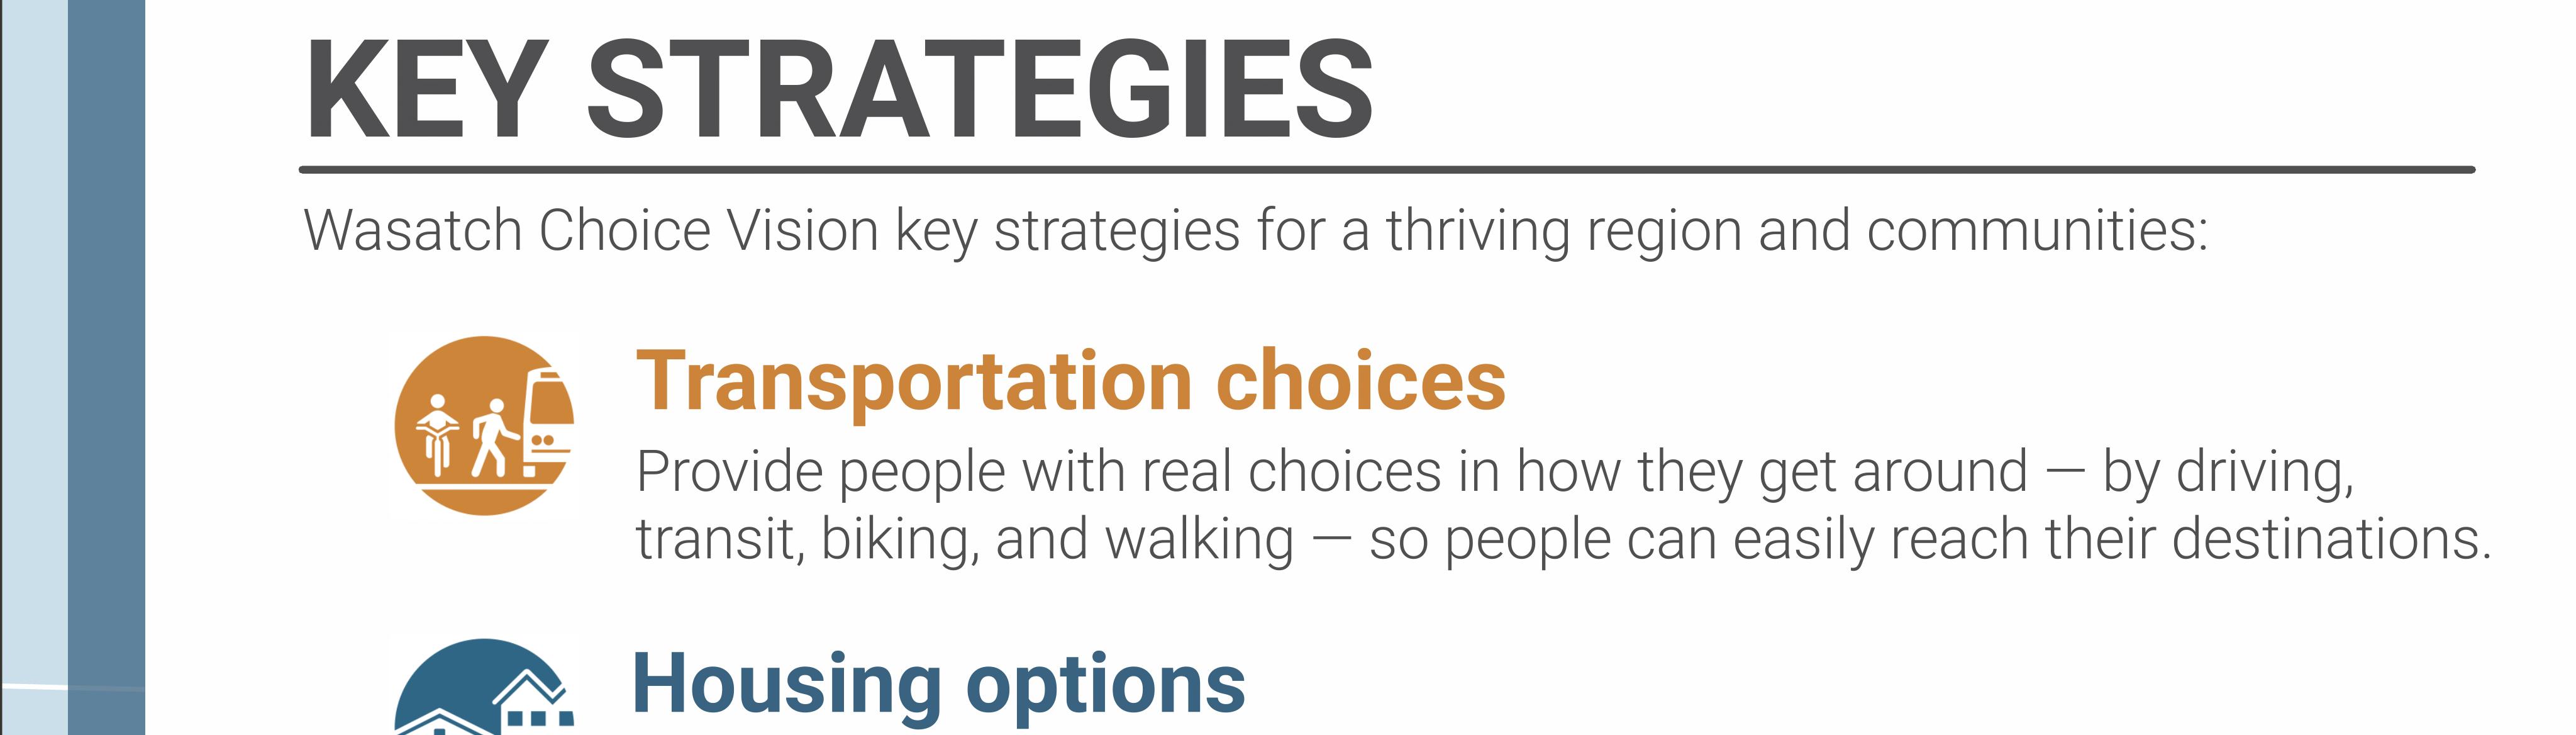
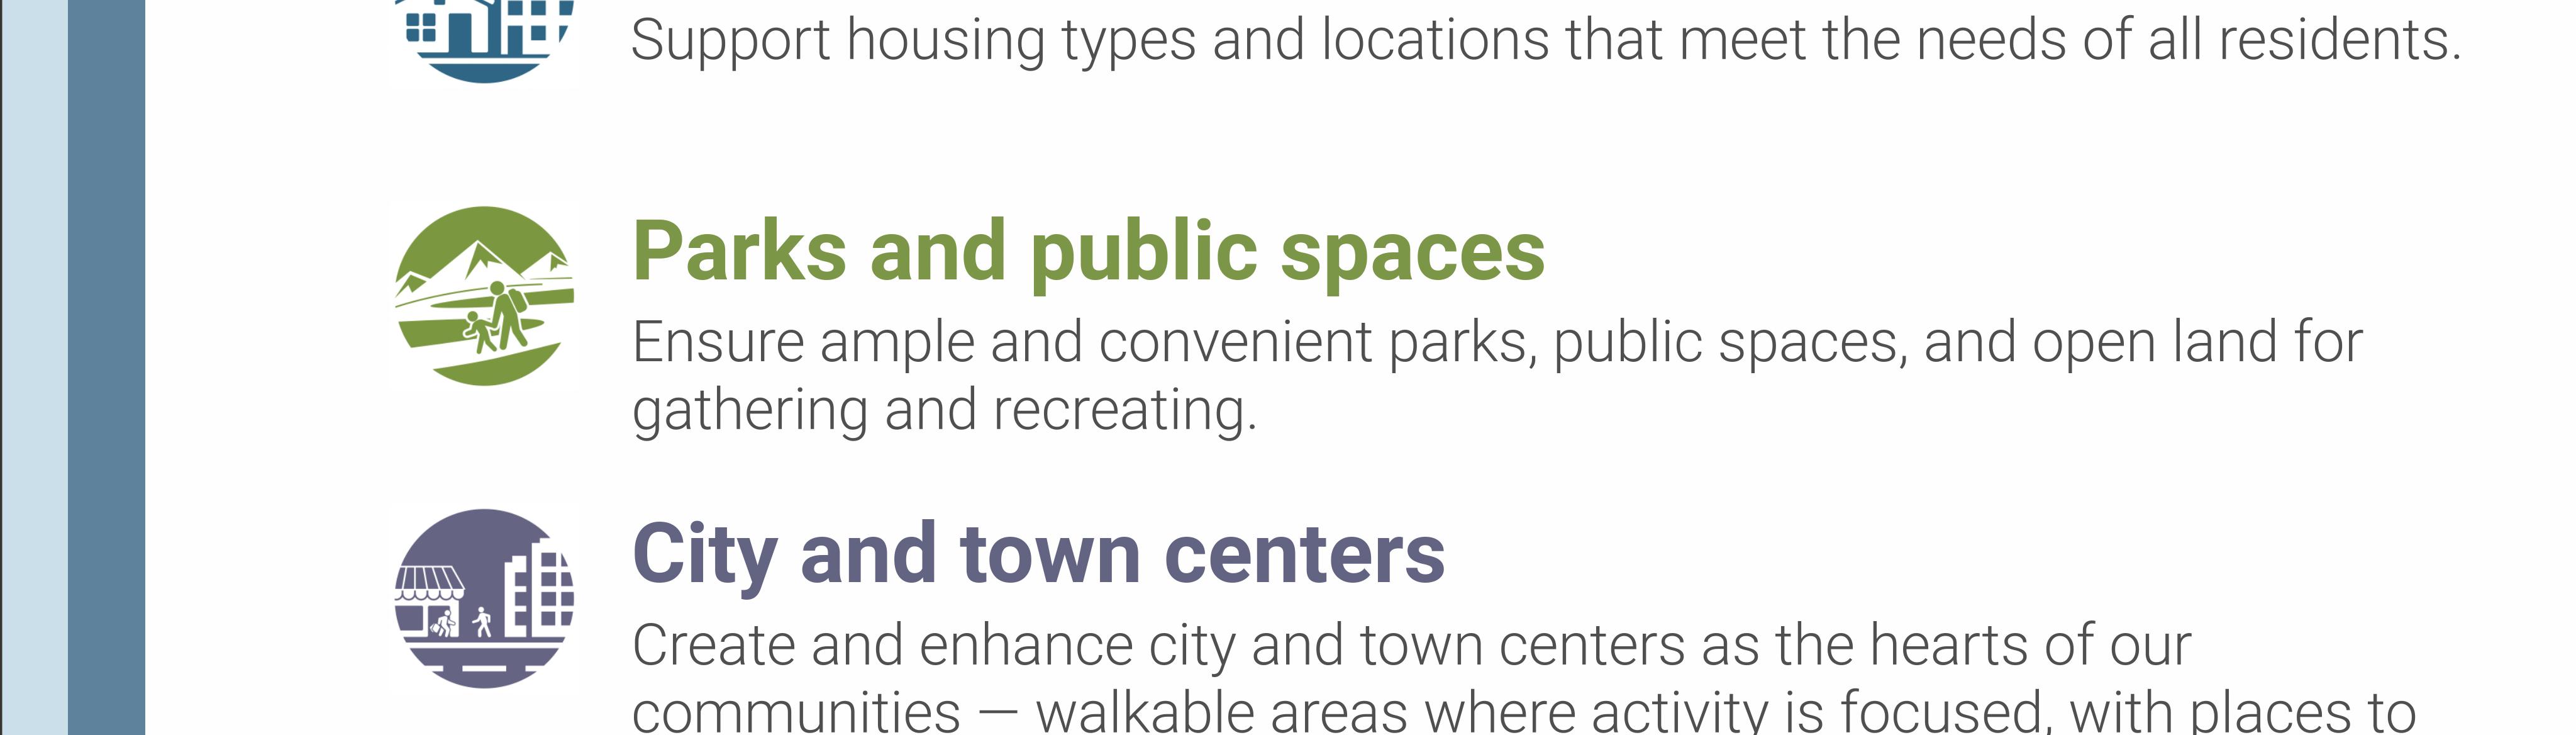
Complementary Plans
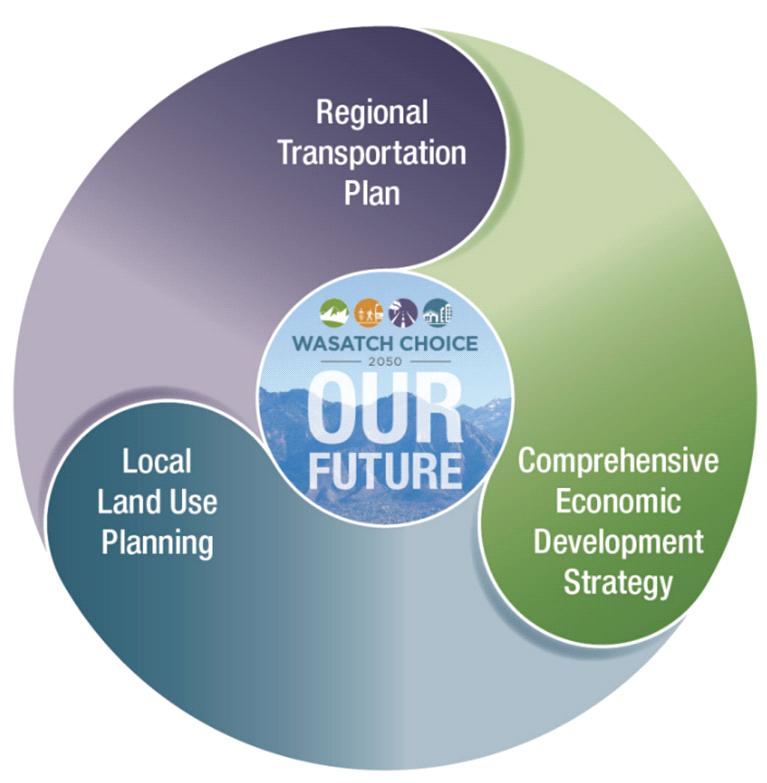
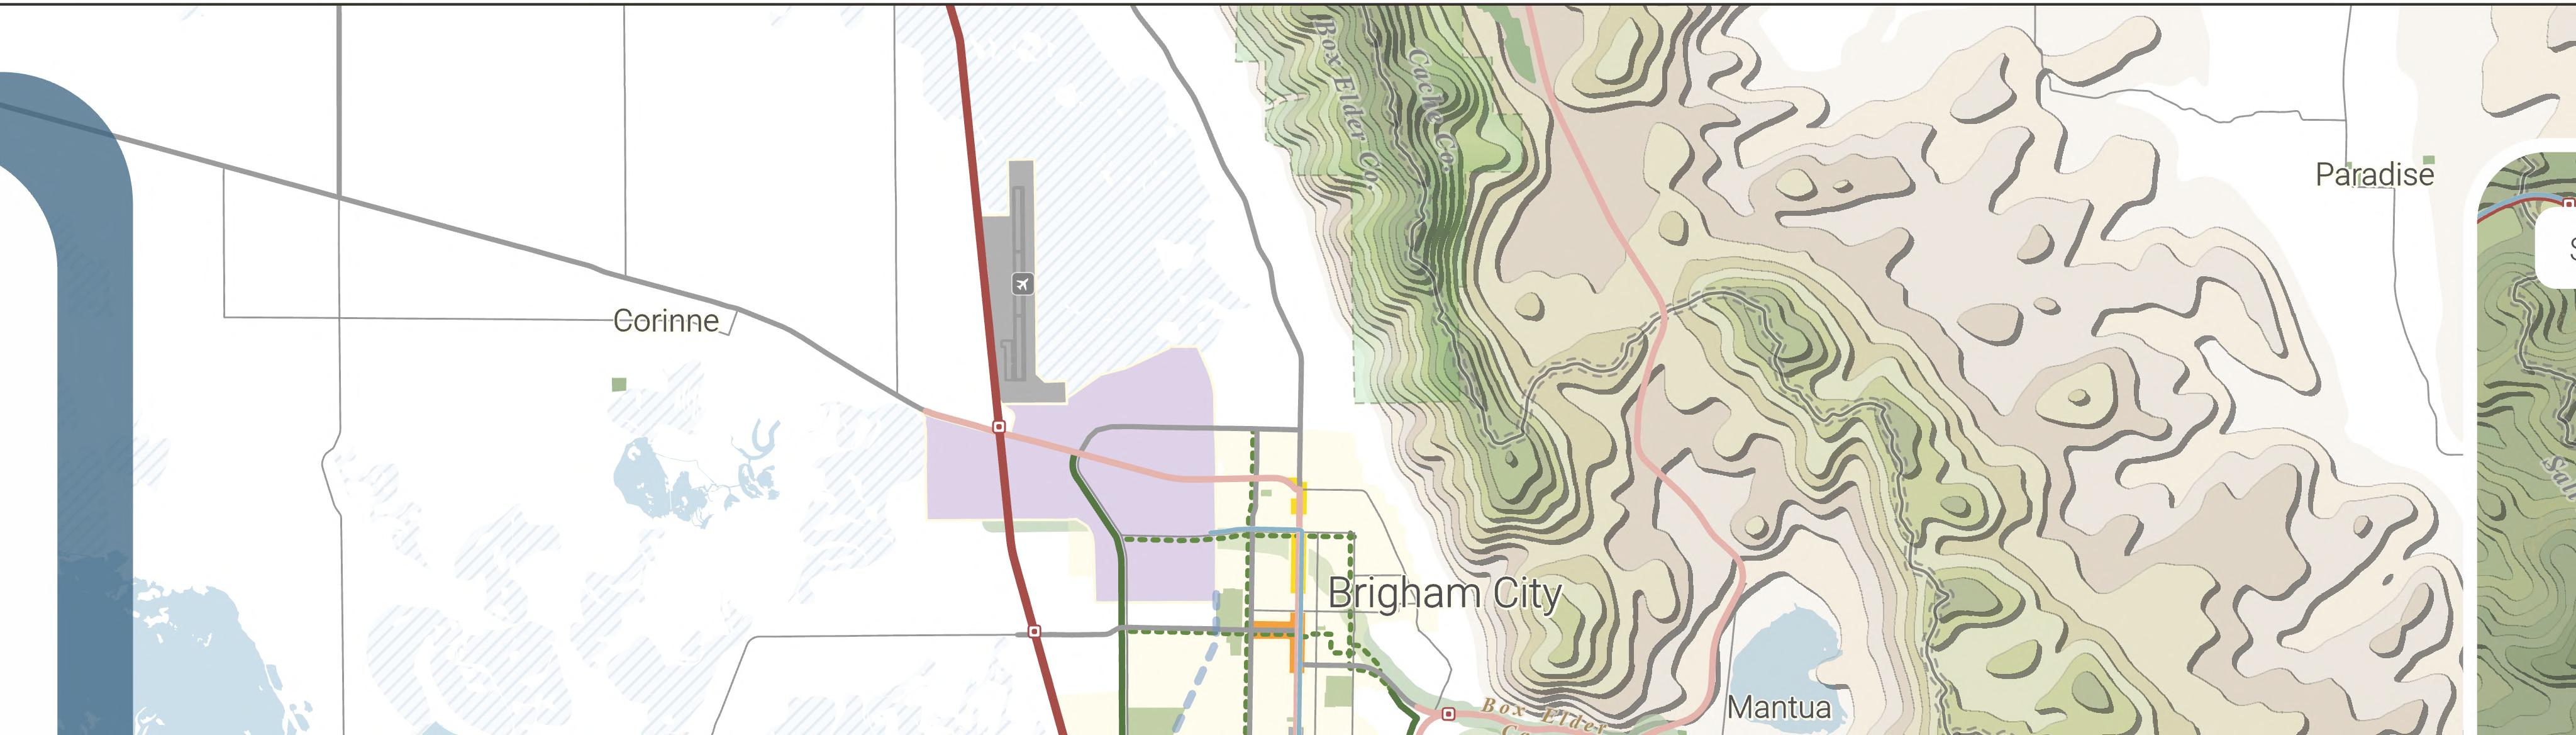
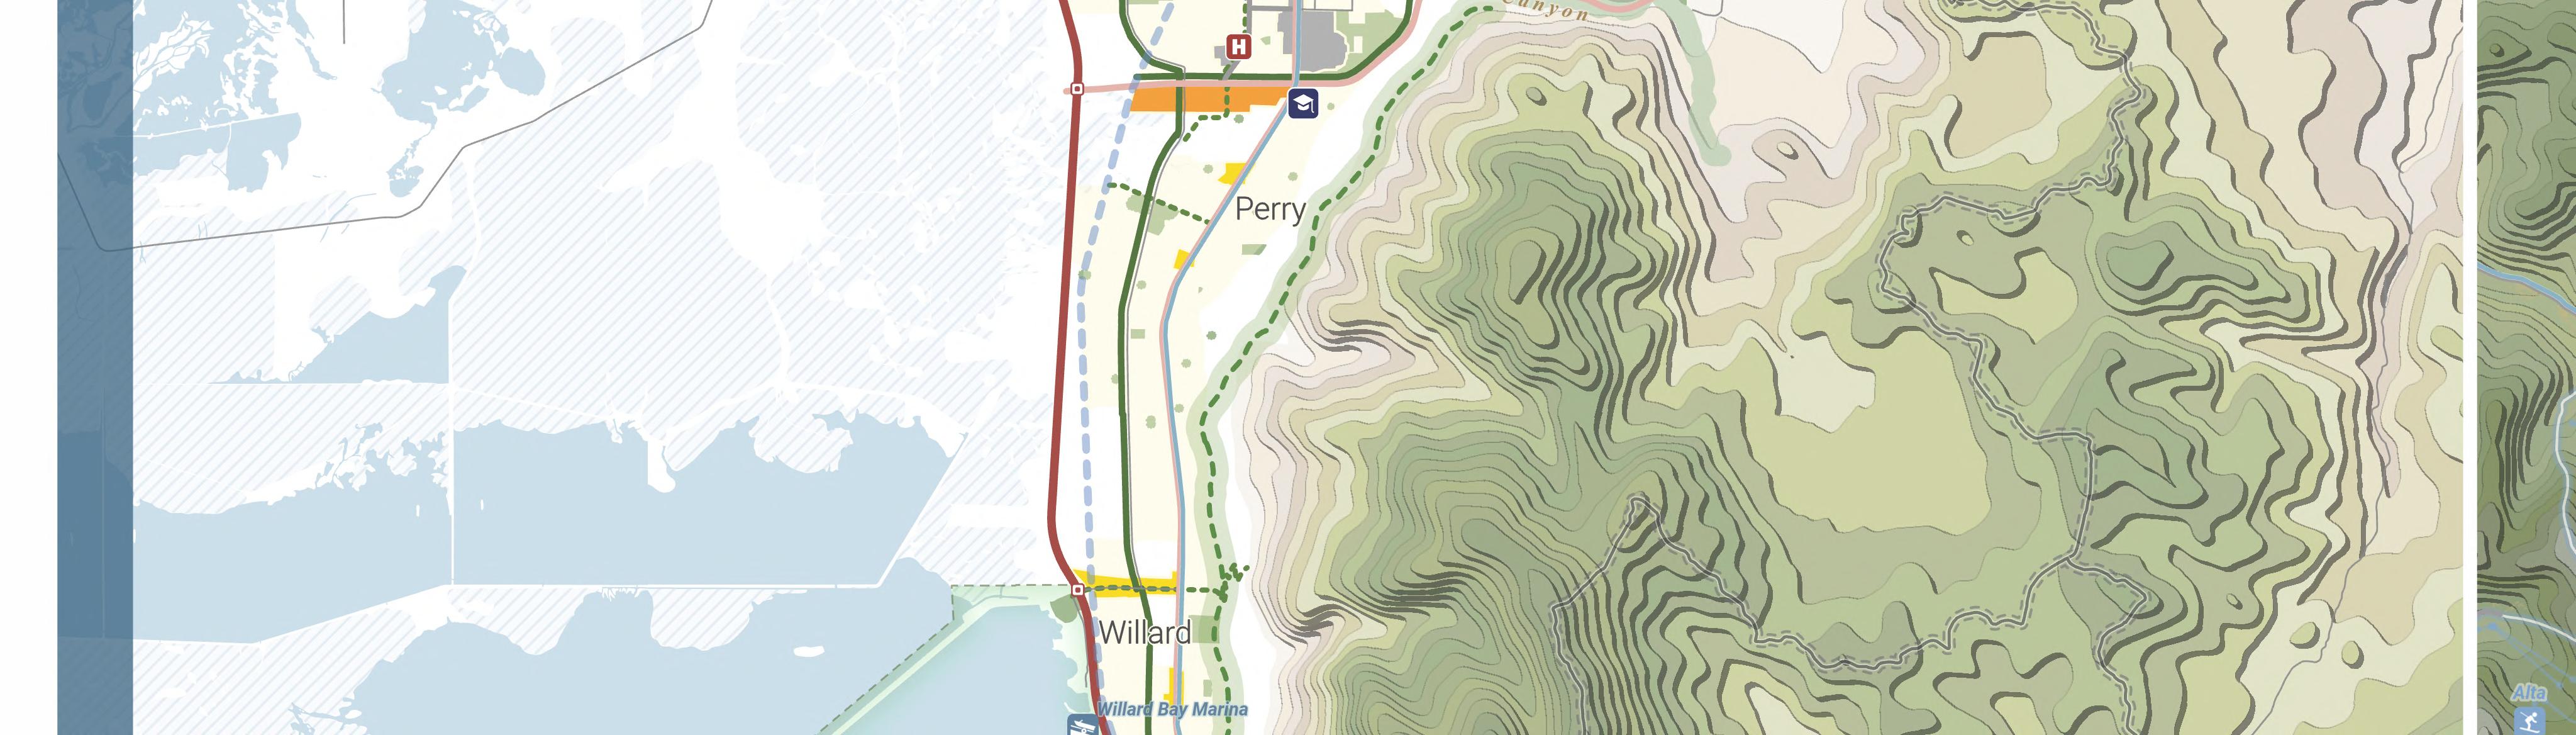
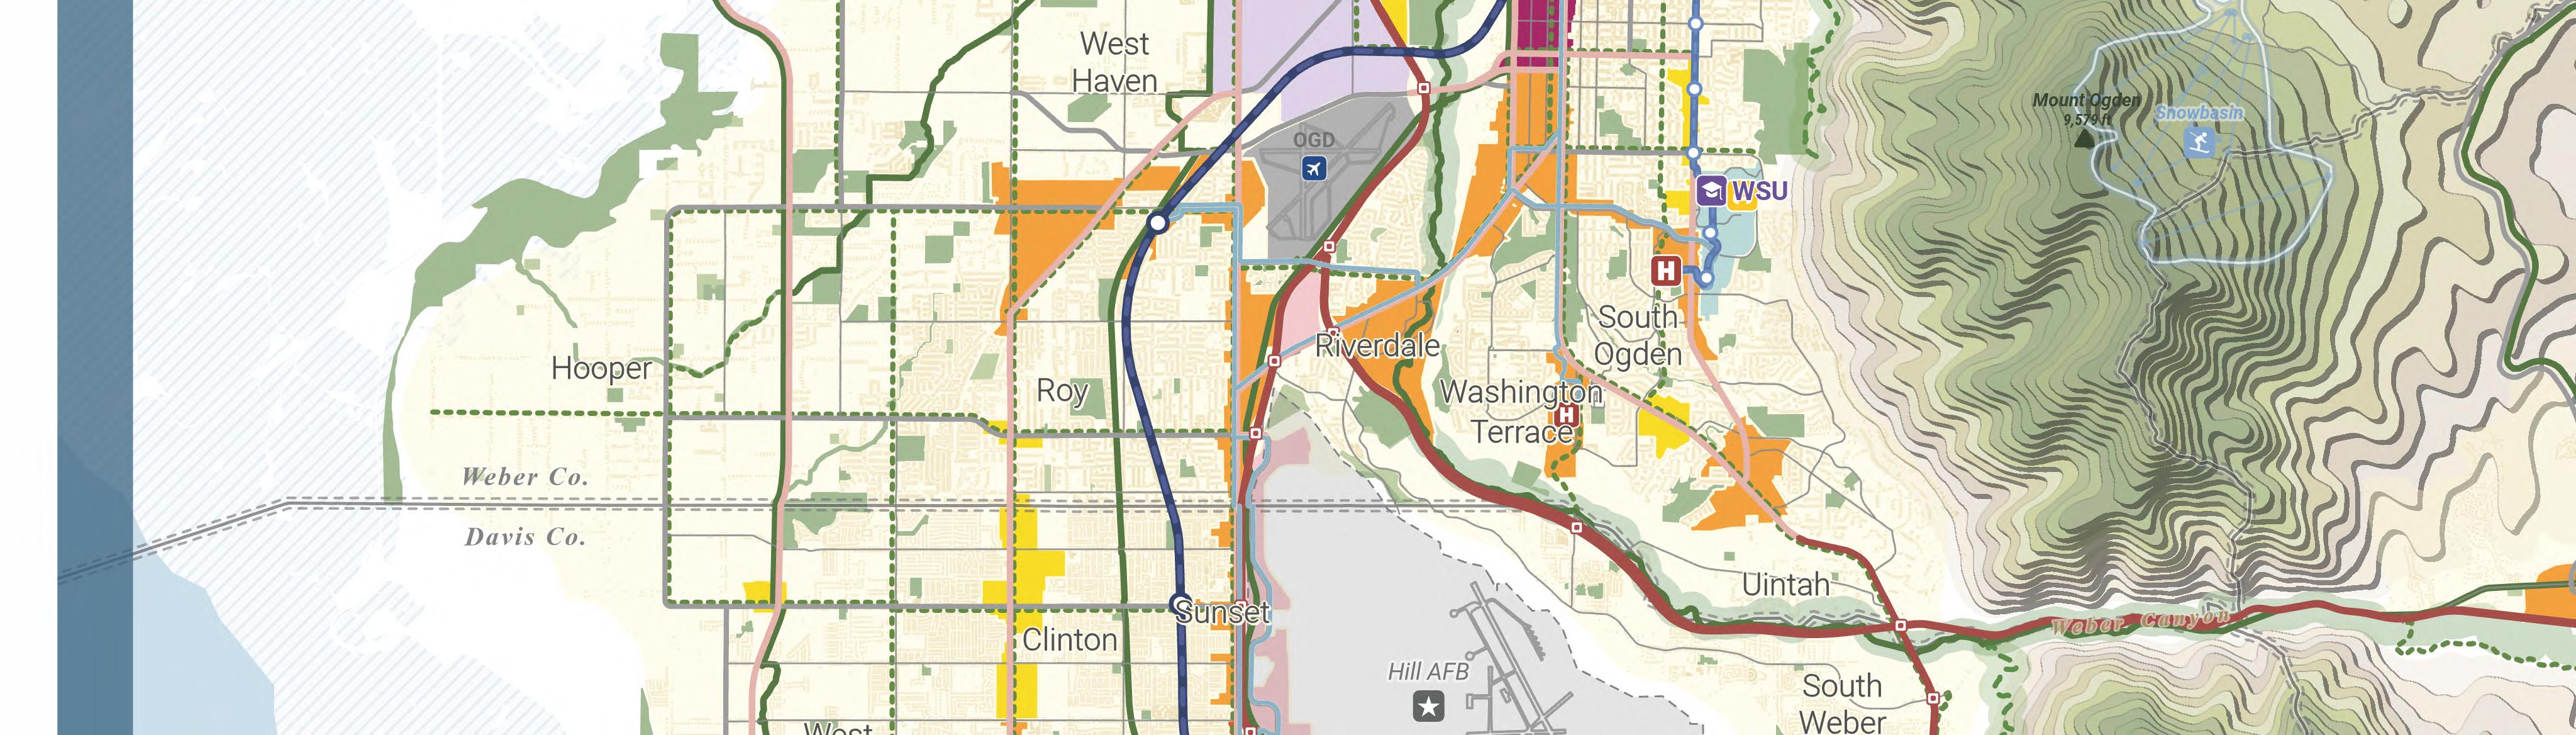
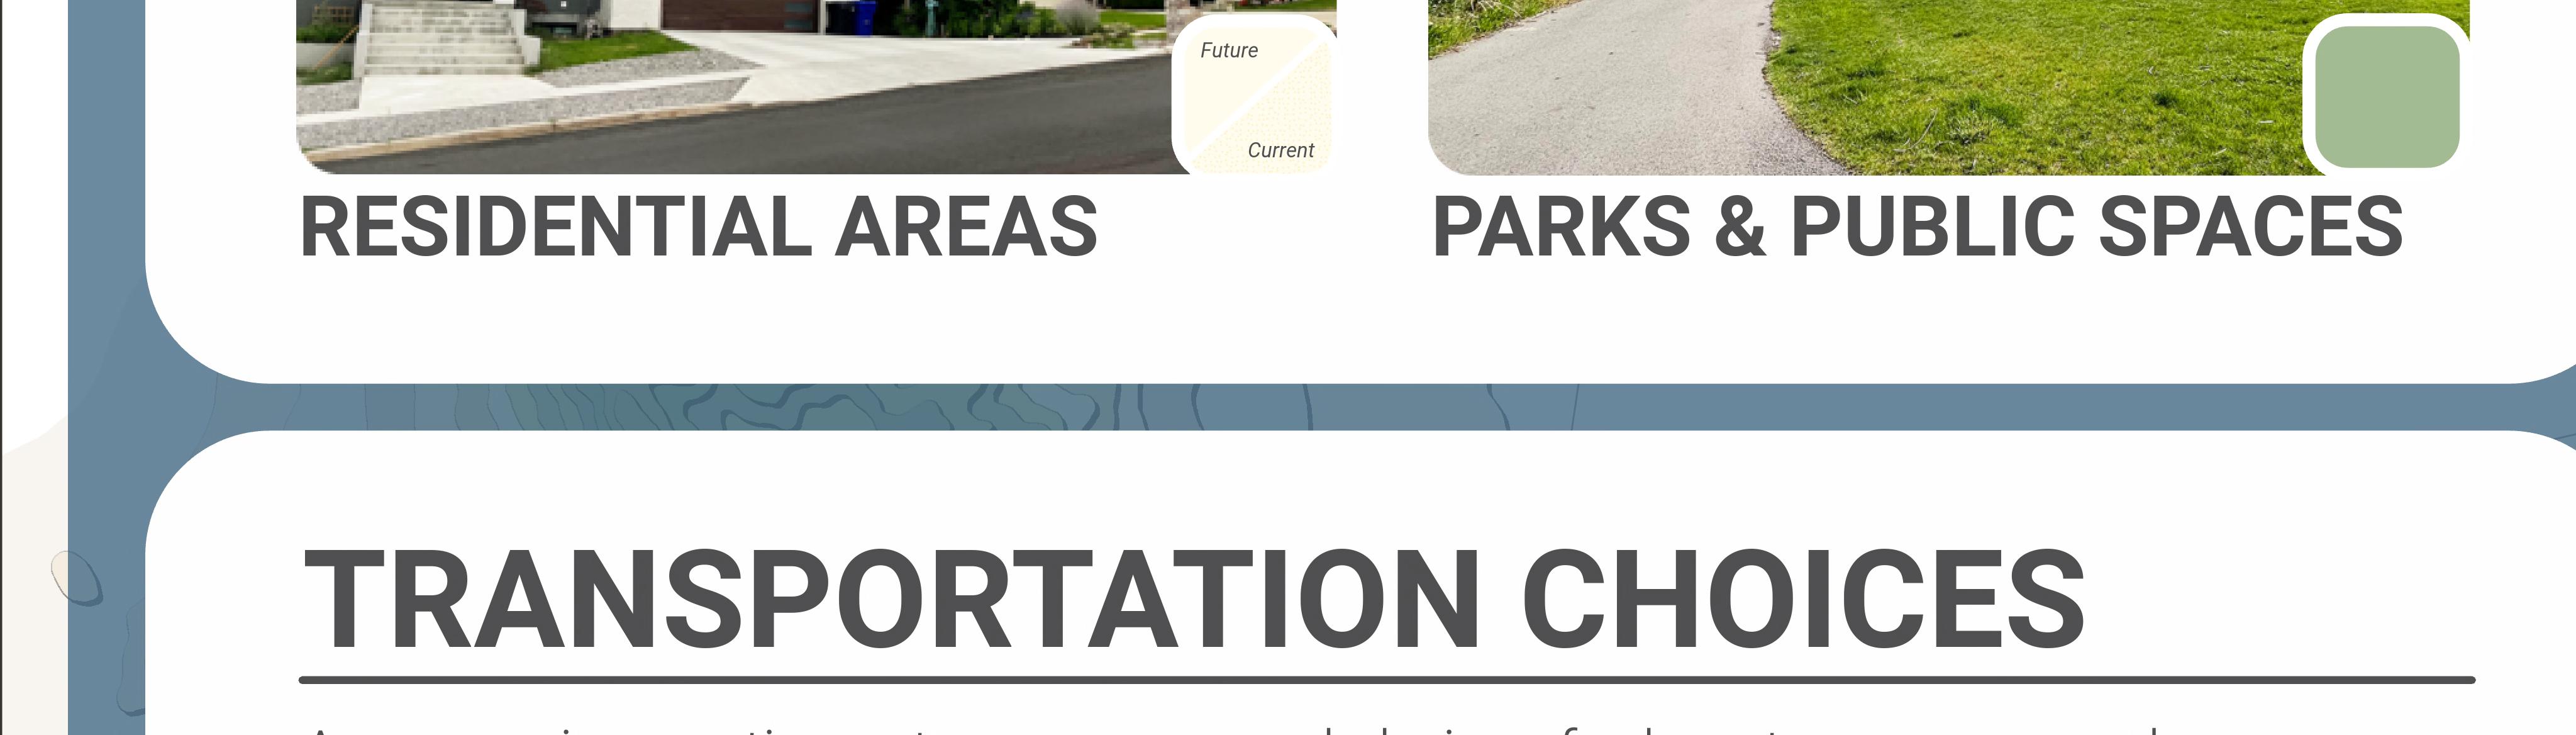
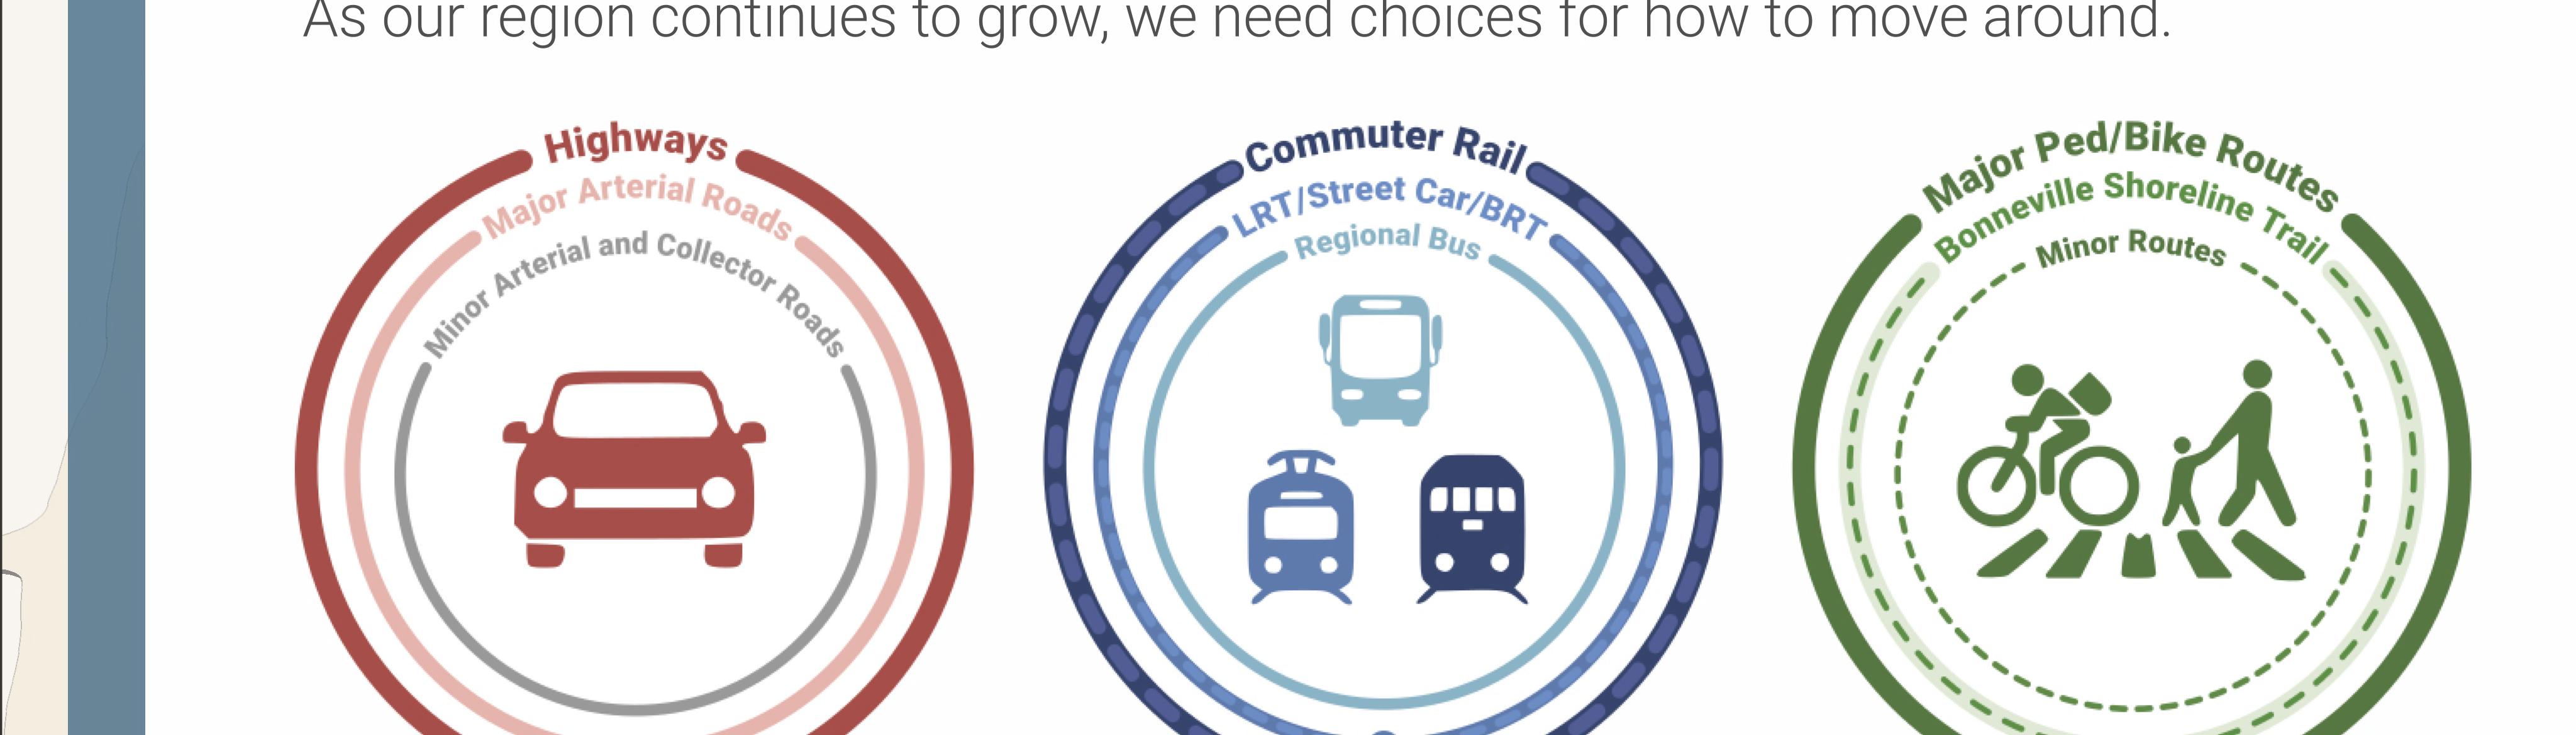
The Wasatch Choice Vision is the Region’s shared vision for transportation choices, housing options, parks & public spaces and city and town center development. The Wasatch Choice Vision is a locally driven plan in which cities, counties, community organizations, transportation partners, businesses, the public, and other partners create local solutions, with regional significance at the center to enhance quality of life as the Region grows.
The Wasatch Choice Vision includes transportation investments and interrelated land and economic development decisions that achieve desired local and regional outcomes. This CEDS, the Regional Transportation Plan, and local land use plans augment and support the Region’s efforts to achieve the objectives of the Wasatch Choice Vision.
Planning documents created by the State, Region, and counties referenced and researched at the onset of the planning process include:
• Wasatch Front Comprehensive
• Wasatch Choice Vision
• State of Utah, Coordinated Action Plan for Economic Vision 2030
• Wasatch Front Regional Transportation Plan
• Davis County Economic Development Strategy
• Morgan County General Plan
• Tooele County Economic Development Strategic Plan
• Salt Lake County Foundation Document
• Utah’s Coordinated Action Plan for Water
• Utah Digital Connectivity Broadband Plan
Key strategies from these planning documents provided a background of previously identified priorities for the previous Regional CEDS 2018-2023, primarily:
• Creating fiscally sustainable places with amenities, open space, transportation, and housing options
• Linking economic development to transportation and housing
• Attracting and retaining businesses and encouraging innovation
Input was collected via focus groups, with participants composed of members of the Wasatch Front Economic Development District Board, Strategy Committee, and Choice Community Advisory Committee. These groups represented both the public and private sectors, including community and state and local elected leaders, representatives of workforce development boards, institutions of higher education, banking and finance, construction, manufacturing, small business, real estate, and others who contribute to and benefit from economic development efforts in the Region. A youth focus group also provided additional input.
Findings from the focus groups were synthesized into the Strengths, Weaknesses, Opportunities, and Threats (SWOT) analysis. In addition, feedback via a survey of the WFRC Board was conducted to add to the SWOT analysis. These responses were used to identify priorities for the CEDS, and the related strategies were approved by the WFEDD Board and Strategy Committee before final recommendations were made.
REGIONAL PROFILE
The Wasatch Front Region comprises a mix of larger, urbanized counties such as Salt Lake, Weber, and Davis, as well as less populated and more rural counties such as Tooele and Morgan. Each of these counties has more urbanized as well as rural communities within their purview. Because of the unique variety of development needs, resources, and capacity across each county, the best way to understand the Region comes from data analyzed at the county level.
To best understand the needs of the Region’s demographics and businesses, data for each county was analyzed. Only common issues were identified in this regional strategy. For the purpose of setting a baseline understanding of the Region, a quick-view snapshot of the region’s economic indicators is provided on the following page.
Research and analysis were validated through stakeholder input, with each county providing insight into local data trends and the drivers of those changes from a local perspective. This analysis guided the development of strategies to achieve the Region's desired outcomes.
In addition to the specific data analyses included with each section of the plan, a static snapshot of each of the most recent socio-economic data for each county within the Wasatch Front Region is provided in Appendix I. Additional dynamic, interactive, and regularly updated data dashboards for each county, as well as the key metrics the Region that will be tracked until the next major CEDS update are available online on the WFEDD website.
In addition to the Regional indicators, the State of Utah, Coordinated Action Plan for Economic Vision 2030 for Economic Vision 2030 dashboard created a dashboard for the State, available at thislink. This dashboard includes important goals and actions that will be tracked for that plan.
SWOT ANALYSIS
A Strengths, Weaknesses, Opportunities, and Threats (SWOT) analysis considers the internal factors (strengths and weaknesses) and external factors (opportunities and threats) that influence the efficacy of economic development activities within an EDD Region. Two separate SWOT analyses were performed: one as it relates to the Region and the other as it relates to the WFEDD as an organization.
The Wasatch Front Region’s Strengths, Weaknesses, Opportunities, and Threats (SWOT) analysis identifies the internal and external factors that influence the performance of the economy. The SWOT analysis was used to identify strategies to drive prosperity and to enhance resilience in the
tional diversity
nections
Unified vision for development
Access to Opportunities: Commute times/amenity distances
Regional Strengths
BroadbandInfrastructure: Populated areas across the Region have access to high-speed internet, providing individuals and businesses with reliable and fast internet access. This enables them to participate in the digital economy, access online resources, and engage in communication, education, and various online activities.
BusinessandEmploymentGrowth: There is a positive trend in the expansion and creation of businesses and the corresponding increase in employment opportunities. The thriving regional economy with growing businesses, new job creation, and a positive environment for entrepreneurship lead to overall economic prosperity.
EducatedWorkforce: The labor pool within the Region has a high level of education and skills. Most workers have the quality education and expertise and possess the necessary qualifications, to contribute effectively to the workforce. This leads to increased productivity and innovation.
Industry/OccupationDiversity: The Region is home to a wide range of industries and occupations. This healthy mix of different sectors and job types promotes resilience, reduces dependence on a single industry, and creates opportunities for a diverse population with a variety of skill sets.
InternationalConnections: There are strong networks, relationships, and interactions between individuals and organizations in the regions with other countries. These connections facilitate international trade, diplomatic relations, and cultural exchanges, which provide knowledge sharing and economic integration.
UnifiedVisionforDevelopment: The Region has invested time, energy, and resources in developing a unified vision for development and the future of the region—codified in the Wasatch Choice Vision. This shared and cohesive understanding of the future direction and goals of the region’s communities is based on collaboration and consensus among stakeholders. The Region is unified in working toward common objectives.
Regional Weaknesses
AccesstoOpportunities:CommuteTimes/Amenity Distances: The duration and/or distance required for individuals to travel between their place of residence and their workplace or desired amenities such as schools, healthcare facilities, shopping centers, etc. are undesirably long. This has a negative impact on the quality of life, the quality of air, and community budgets (due to the demand for new roads and ongoing road depreciation) across the region. Time and distance are components of achieving improved Access to Opportunities - the number of reachable desired destinations.
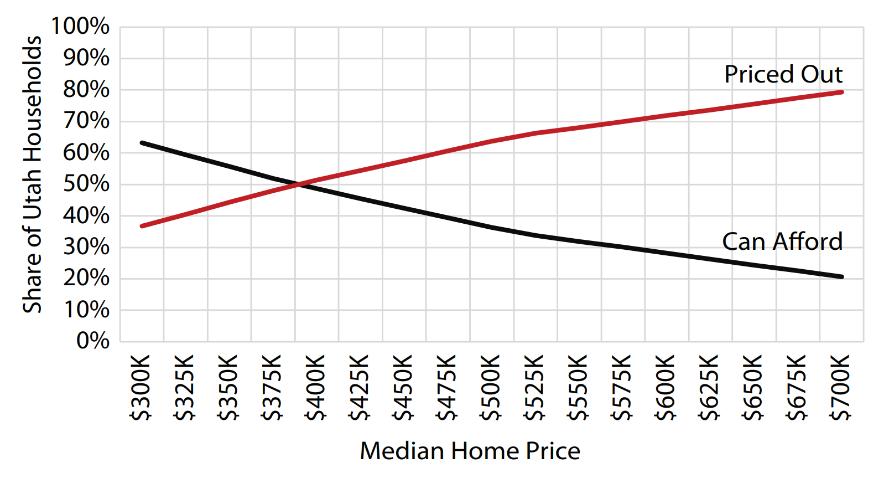
HousingAffordability: The national trend in rising development costs and the rapid growth of population in the Region have created market pressure that drove up housing costs. This has made rent and mortgage payments less affordable for individuals and families relative to their income.
HumanCapitalAvailability: There is a gap between the number of accessible workers and the number of open jobs in the Region. The labor force participation rate is already very high, yet there is additional demand for workers in the job market. The lack of accessible workers constrains economic growth and development.
ReactiveDecision-Making: Communities across the Region are in a reactive position to development needs and are therefore pushed to make decisions based on immediate or emerging circumstances, often driven by short-term considerations and goals. While it is inevitable that communities must respond to things as they arise, solutions for proactive decision-making are needed for the Region, stakeholders, partners, and educational institutions, to achieve its long-term visions.
WaterResources: The sources of available water for use by households, agriculture, industry, and the ecosystem are limited. Changes that have been seen by warming temperatures, growth, and lengthy droughts have impacted water supplies, making the management of water resources a crucial point of concern for the Region.
Regional Opportunities
Automation/ArtificialIntelligenceAI: The rapid improvement and innovations in technology, such as artificial intelligence and robotics, can be used to automate tasks and processes that previously required a high concentration of labor resources. There is potential for increased use of technology to help facilitate economic growth by addressing the Region’s challenge of constrained human capital.
FederalEarmarks: The 112th Congress instituted a moratorium on earmarking that held for a decade. The current congress has re-instituted limited earmarking, allowing for discretionary spending to specific entities or locations. The Region should work with federal legislators to prioritize and propose highpriority projects to be included in future appropriation bills.
HighLevelsofIn-migration: A variety of factors such as economic opportunities, state programs that welcome refugees, and social factors have attracted many people to move into the region. High levels of migration have the potential for positive impacts, such as improving cultural diversity and labor market dynamics, as well as providing new labor in the region’s tight labor market and high job availability.
CityandTownCenters: Political and cultural norms have shifted such that city and town centers have become more acceptable and desirable. People want to live in walkable centers with transportation and amenities, often paying a premium to have such benefits available.
Regional Threats
Income Inequality/Income Mobility: There are several factors that create disparities in wealth and opportunities—exacerbating the unequal distribution of income among individuals or households within the Region and creating barriers preventing individuals from moving up or down the income ladder over time. Key threats include technological displacement, education disparities, concentration of wealth and power, discrimination and bias, and globalization, among other broad economic shifts.
Natural Disasters: Severe weather poses a significant threat to human health and safety, property, and infrastructure. Natural disasters occur both seasonally and without warning, subjecting the community to periods of insecurity, disruption, and economic loss. The Region is at risk of avalanches, droughts, earthquakes, heat waves, landslides, strong winds, wildfires, and extreme winter weather.
Pressures From Growth: The rapid population growth experienced in the Region strains the infrastructure, resources, and services of the region’s governmental entities. Effective planning and management are needed to ensure sustainable development to address increased demands for housing, healthcare, education, transportation, and other essential services.
Changing Workforce Skill Demands: The innovation that benefits the economy creates rapidly changing demands for workforce skills. It is difficult for workers to adapt and acquire new skills in response to technological advancements, automation, and evolving job requirements. As technology and industries rapidly evolve, certain skills may become obsolete while new skills become more in-demand. Workers need to upskill or reskill to meet these changing demands and remain competitive in the job market.
Organizational SWOT
A major goal of the 2023-2028 CEDS process was to identify and define WFEDD’s organizational role in regional economic development; therefore, a SWOT was conducted for the WFEDD itself.
STRENGTHS WEAKNESSES OPPORTUNITIES THREATS
Desire for change Transportation-based Focus Diversity of board membership Economic development professional infrastructure
Engaged membership Economic development training and assistance Public participation
High credibility and soft power Human capital development Status quo bias
Quality of staff Project funding (TA and administration support)
Self-efficacy
Organizational Strengths
DesireforChange: The WFEDD is proactive and forward-thinking—continually seeking to identify new ways they can fulfill their mission. This openness to adapt, improve, and innovate creates a culture of flexibility and creativity that enables the WFEDD to adapt to the changing needs and opportunities of the region.
EngagedMembership: The WFEDD benefits from a base of individuals and stakeholders who are actively involved, committed, and passionate about the WFEDD’s mission and goals. The high level of participation, support, and enthusiasm from members contributes to the WFEDD’s success through their contributions, advocacy, and engagement.
HighCredibilityandSoftPowerThroughoutState andRegion: The WFEDD is highly respected, trusted, and influential in the Region and the State of Utah. This is due to the organization's reputation, expertise, and ability to collaborate effectively, which enables the WFEDD to establish its leadership and influence to have a positive impact on decision-making, partnerships, and policy outcomes.
QualityofStaff: The high degree of competency, expertise, and skills of the individuals employed by the WFEDD enable it to carry out its mission effectively. Having high-quality staff enables the WFEDD to deliver excellent services, drive innovation, and achieve its objectives.
Self-efficacy: The WFEDD has an apt belief in their ability to successfully achieve desired outcomes. This results in a collective sense of confidence,
Wasatch Choice implementation
competence, and energy to accomplish organizational goals. High self-efficacy within the WFEDD encourages resilience, perseverance, and a proactive approach to overcoming challenges and achieving success.
Organizational Weaknesses
Transportation-basedFocus: The Wasatch Front Regional Council was organized in 1969 to address regional problems and for the purpose of establishing a review agency to comply with requirements to obtain federal grants and loans. Within five years of its establishment, the WFRC was designated as the Metropolitan Planning Organization (MPO) for transportation planning in Salt Lake, Davis, and Weber counties, taking over these responsibilities from UDOT. In 2013, over five decades later, the WFEDD was designated as a regional economic development district by the EDA. While the WFRC’s role as the MPO is well established, the WFEDD’s role in the economic development ecosystem is still relatively new. Because of this dynamic, the WFEDD’s culture, structure, and expertise are predominantly focused on transportation-related issues.
EDA’s grants encompass a broad range of projects beyond transportation. Expanding WFEDD’s role to a more holistic approach to support economic opportunity from the transportation and land use perspective, can enhance the ability of the WFEDD to guide the implementation of the Wasatch Choice Vision.
Organizational Opportunities
DiversityofMembership(socioeconomic& demographic): The WFEDD has been operating under 2013 bylaws, under which the Board and Strategy Committee has been operating for the last 10 years. Over the past few years, the staff has worked to provide greater regional representation but recognizes the need to include individuals from various socioeconomic and demographic backgrounds as well as including small businesses. Adding a more inclusive representation of individuals will increase the cognitive diversity of the WFEDD as the Region continues to experience socioeconomic diversification.
EconomicDevelopmentTrainingandAssistance: The State’s focus on economic development professionals provides an opportunity for the WFEDD to also focus on how it can better support economic development professionals throughout the region.
HumanCapitalDevelopment: One of the main issues brought up in the focus group and individual interviews was the need to invest in the Region’s human capital assets. This may include training programs, professional development initiatives, mentorship opportunities, and deeper collaboration with the region’s schools. Currently, the Wasatch Front Regional Council does not focus on workforce development for the Region and could provide additional support in this area.
ProjectFunding(TAandAdministrativeSupport): An important role of an Economic Development District is to serve as a coordinator for organizations, local governments, and private industry to implement the region’s economic vision. This includes providing technical assistance and administrative support for communities to obtain grants, contracts, or partnerships that offer the potential for financial support, expertise, and resources to carry out projects successfully.
Organizational Threats
EconomicDevelopmentProfessionalInfrastructure: As identified in the State of Utah Coordinated Action Plan (2023), “for a state of its size, there are too few highly trained or nationally certified economic development professionals to sustain the business growth demands in fast-developing regions.” The same holds true for the Wasatch Front Economic Development District, especially for the more rural counties and municipalities.
PublicParticipation: The limited engagement, involvement, and representation of the public in the decision-making processes of the WFEDD could result in a lack of diverse perspectives and reduced transparency. Increasing public participation through the public comment process can help the public understand the Region as it experiences growth. This will provide education and transparency to the public as the WFEDD fulfills its various roles.
StatusQuoBias: The tendency or preference for maintaining existing practices, policies, or routines— even in the face of potential improvements or changing circumstances—could hinder the WFEDD’s adaptability, innovation, and responsiveness to emerging challenges and opportunities. It is important for the WFEDD to evolve and address changing needs in this dynamic region.
WasatchChoiceVisionImplementation: While the Region has broad buy-in and support of the Wasatch Choice Vision—the actual implementation of the plan is a complex challenge. The WFEDD must continually foster support from stakeholders, address resource constraints, reduce regulatory barriers, and respond to unforeseen complexities to successfully help the region’s communities execute the plan and achieve the desired outcomes.
STRATEGY AND ACTION PLAN
This section of the document describes the 5-year strategy for the Region. This strategy was created through a collaborative process of interviews with topic-based focus groups (topics included Investment & Capital, Development & Outcomes, Talent & Human Capital, Regional Development & Vision, and Business Growth Connections) as well as regional specialists and leaders. This engagement was coupled with detailed analysis of local and regional economic data. Specific recommendations to address the issues brought up through those analyses were presented to the WFEDD board for feedback and review, culminating in the analyses and recommendations provided in
These strategies intend to address regional constraints and undesirable outcomes which will make the Region more prosperous and resilient to economic shocks.
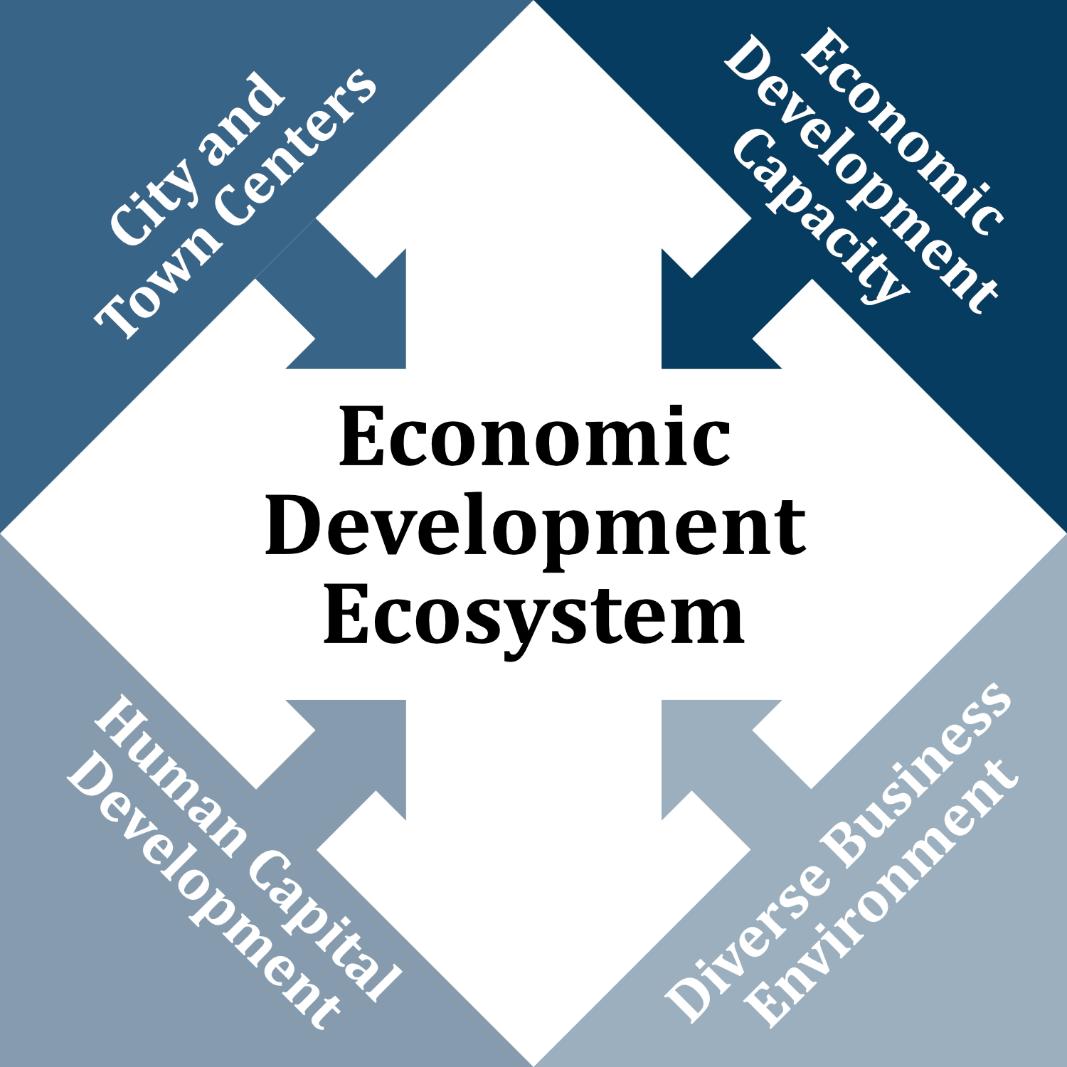
The overarching objective of this strategy is to facilitate enhancements and to foster sustainable and inclusive economic growth along the Wasatch Front to provide options for and access to communities, residents, and organizations that provide for prosperity and resilience. This involves creating an environment that supports the growth of businesses, enhances job opportunities, improves the quality of life for residents, and contributes to the overall well-being of the community. The key components are shown in Figure 1.
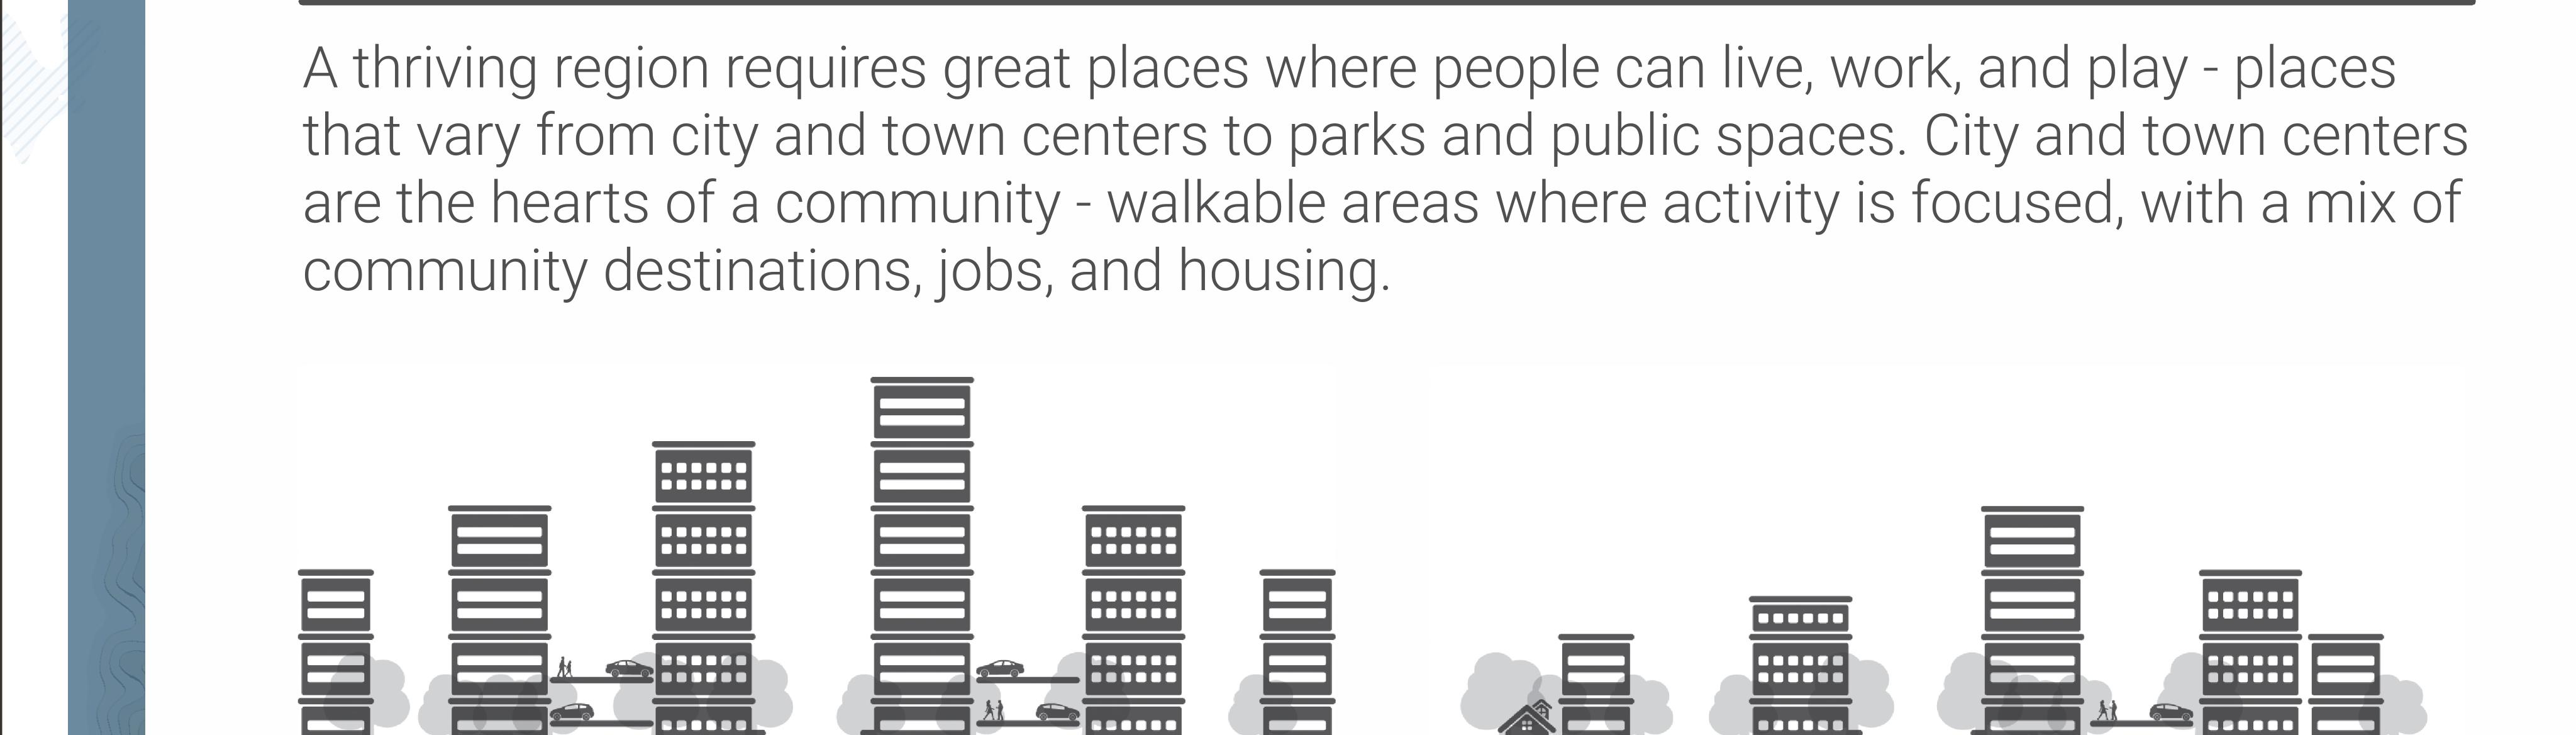
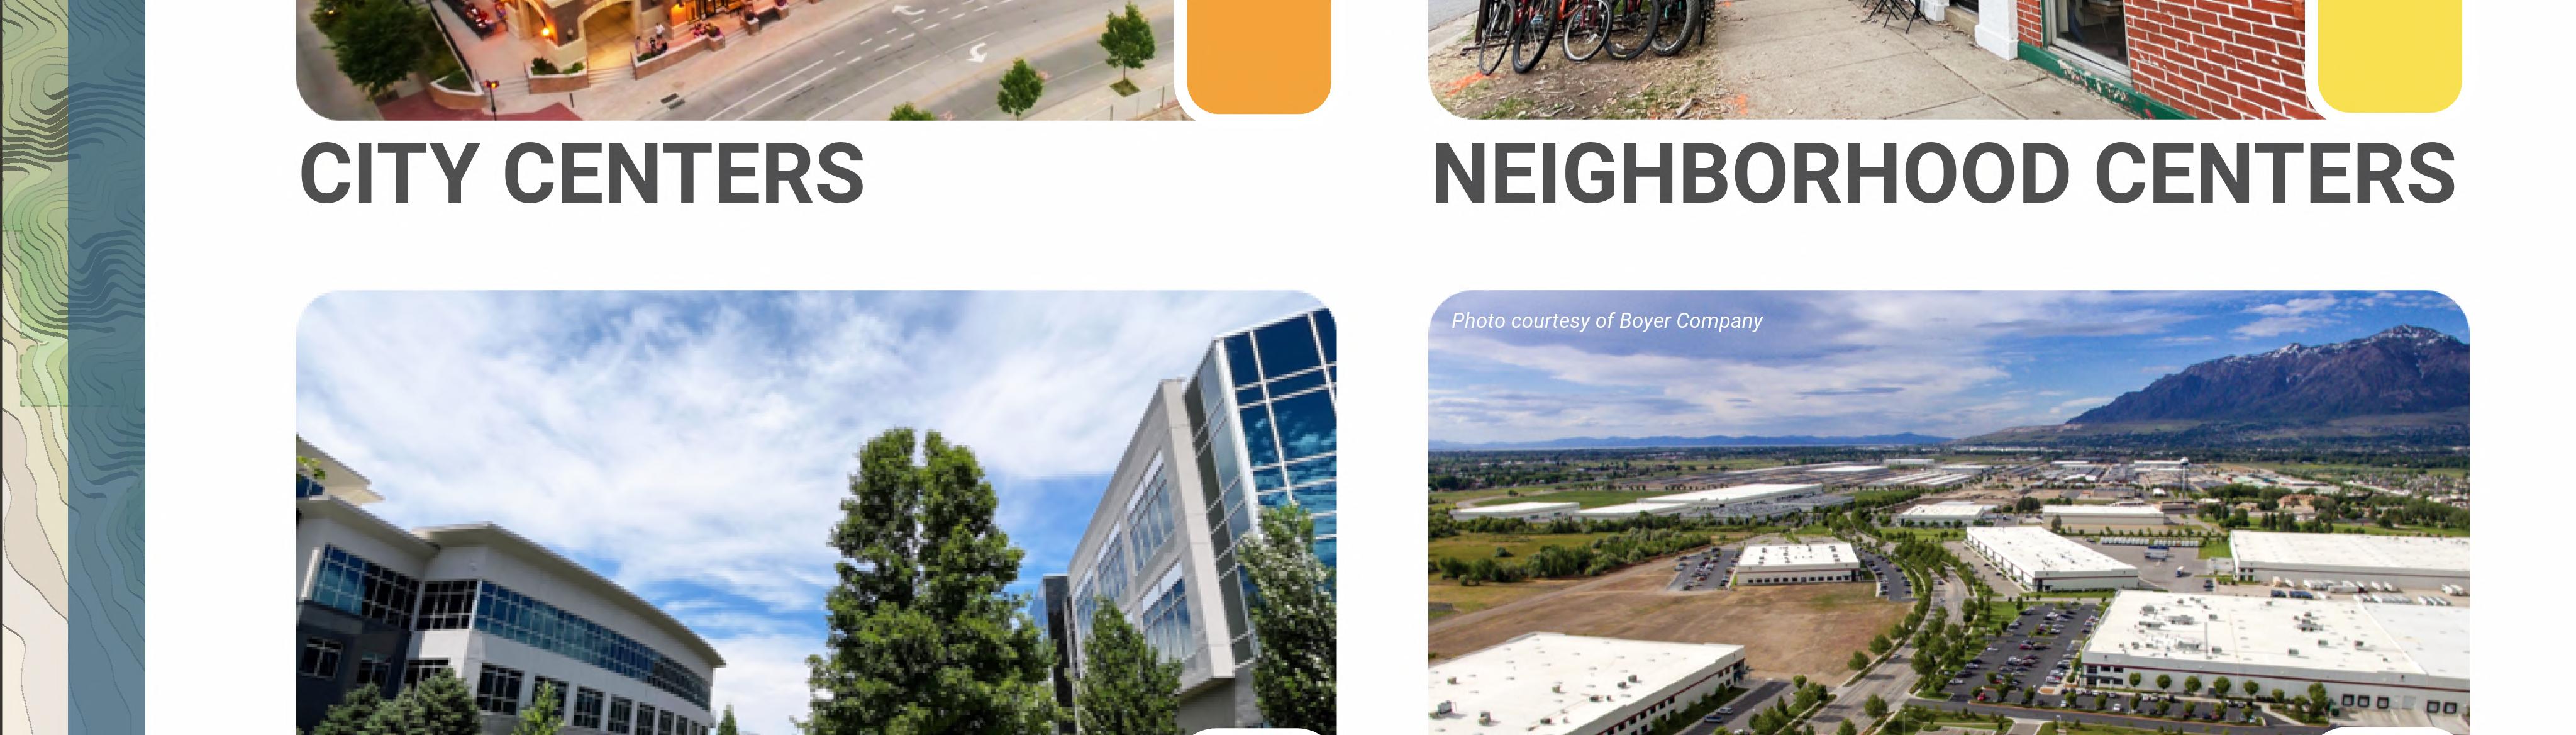
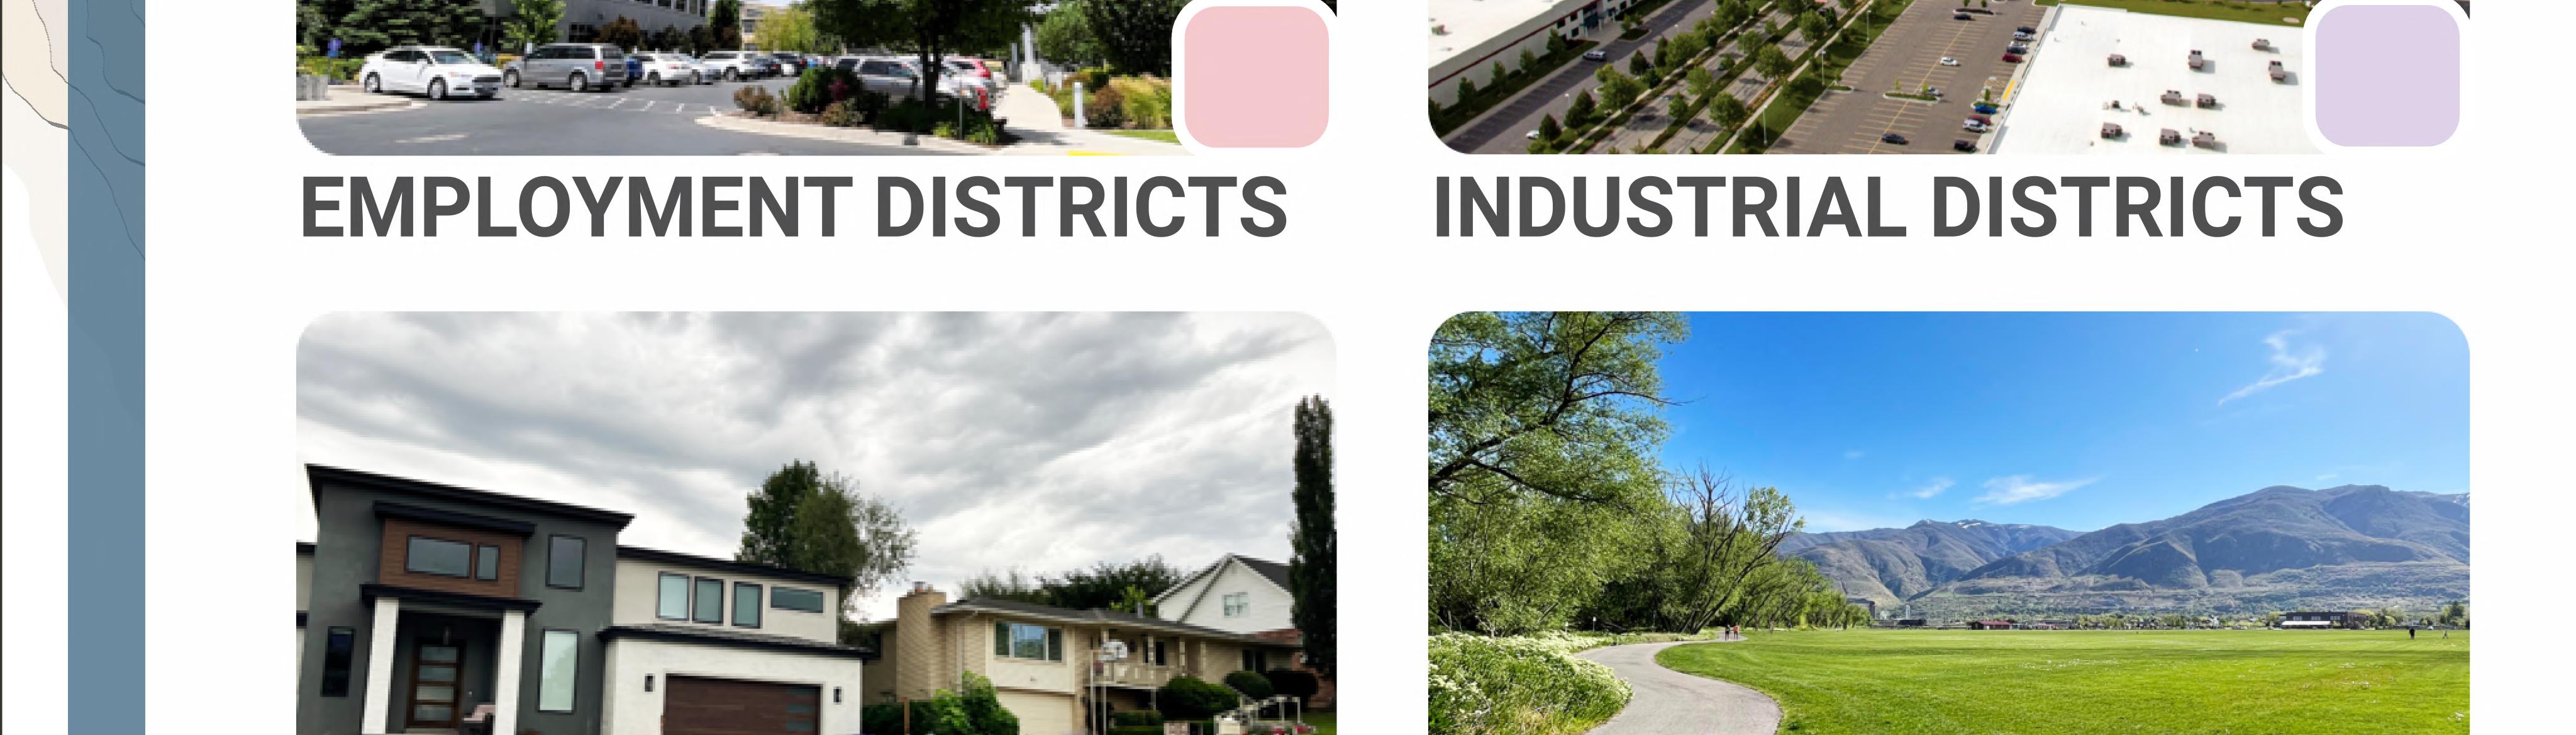
CITY AND TOWN CENTERS
Role of the Wasatch Front Economic Development District
• Communicate benefits of City and Town Centers.
• Continue to build upon the Wasatch Choice Vision.
• Provide resources to help communities understand and enact the Wasatch Choice Vision.
• Continue to advocate for Transportation-Oriented and Center-Based Development.
• Advocate for broad housing solutions.
• Communicate the benefits of parks and open spaces to improve overall public health.
Outcome Objectives
• Increase the number of City and Town Centers across the region.
• Complete plans and guides that support communities’ efforts to develop Centers.
Regional
Resilience
A resilient region is poised to adapt and thrive in the face of disruptions and challenges, able to support the well-being of its residents, businesses, and environment. Resilient regions prioritize sustainable development, innovation, diversity, and a strong social safety net.
Recommendations to enhance resilience:
• Support communities in the development of new City and Town Centers that incorporate transportation nodes, housing, employment hubs, natural resource conservation actions, education, and health facilities.
Key Metrics
• Develop new City and Town Centers
◦ Objective: 3 new centers scheduled for development within the region by 2028
• Maintain or reduce the average commute time per resident
◦ Objective: Keep current average commute times (as of 2021 census estimates)
• Host best practice workshops
◦ Objective: 1 per year
• Provide Technical Assistance to local governments within the Region
◦ Object: Report on annual progress
Figure 1–CEDS Strategy Components
City and Town Centers
Key Findings
The location of jobs, schools, services, public transportation, and entertainment play a critical role in both the quality of life and economic mobility of residents throughout the Region. While the Wasatch Choice Vision is unified and broadly supported, making the Vision a reality is complex and requires strategic support.
Analysis
Center-based development is the best method to achieve the outcomes identified in the Wasatch Choice Vision. The Vision provides details on how center development supports goals for quality of life, walkability, affordability, eco-friendliness, safety, and productivity. A thriving and dynamic economy affords opportunities for individuals to increase their earnings potential and quality of life over time.3 Access to public transportation and shorter distances between work and home support economic mobility as well as provide additional economic opportunities. A shorter physical distance between home, work, and amenities impacts economic prospects and makes most required services (healthcare, groceries, childcare services, parks and open spaces, and jobs) more accessible for residents. The following are general benefits of City and Town Centers:
CommuteTimes
Transportation planning should focus on access to opportunities rather than just congestion relief. Focusing on the time it takes to accomplish a trip, or even the number of workers that can get to a site within a typical commute, will focus on outcomes that are more
3 For more research into the benefits of City and Town Centers, see https://www. brookings.edu/articles/activity-centers/.
impactful for economic development. Methods that reduce commute times include multi-modal transportation planning, centering development near transportation, and even improving jobs housing imbalances.
Public transportation must be both affordable and useful, with pick-up and drop-off points and frequency catering to multiple user types, not just distance commuters. Achieving this type of transportation infrastructure is difficult given current development patterns in the Wasatch Front, creating a compelling need to push for increased density and better agglomeration of services so the infrastructure is more compelling for users and creates a more sustainable financing model for the operators. However, being able to find solutions will be important, so that there is economic mobility available for residents across the Region.
There is a persuasive case for the impact of Centers on transportation outcomes, such as commute times. Regression analysis on the Region’s currently designated Centers revealed that, by overlaying the areas within all the Region’s Traffic Analysis Zones (TAZ), for each 1% increase in a TAZ’s land area designated as a Center, the average commute time was estimated to drop by 0.1% for autos and 0.2% for transit riders in 2050. As an example, a center that has a 50% center designation is expected to have 5% lower commute times for drivers and 10% lower commute times for transit riders, compared to a TAZ without any center designation.
If every county in the Region reduces commute times by just 1%, it would save the Region’s commuters 192,140 minutes in commute times and would prevent approximately 1.9 tons of carbon emissions from polluting the region’s air each year. The table below shows the regression results of the TAZ and commute time analysis, with the commute time from 2019 used as a control variable to account for TAZ-specific differences in the observations.
Transportation: Large swathes of the Region’s cities and towns are zoned as single-family—creating low-density, single-use neighborhoods. These neighborhoods offer a high quality of life, but also make “utility” walking, bicycling and public transportation impractical which creates longer travel times and reduces access to goods, services, and recreation. Since housing, commercial, office, and industrial uses are confined to their own zones, people must drive from zone to zone. What in 1990 would have been a short ride from home to the doctor’s office and back, urban sprawl has made it much longer and across wider distances. Other outcomes of sprawl include increased congestion, reduced walkability, and increased expenses to build and maintain roads and utilities. Focusing multiple uses into the smaller radius of some city and town centers helps make such trips faster and easier, no matter the means of transportation. Centers would complement rather than replace singlefamily areas.
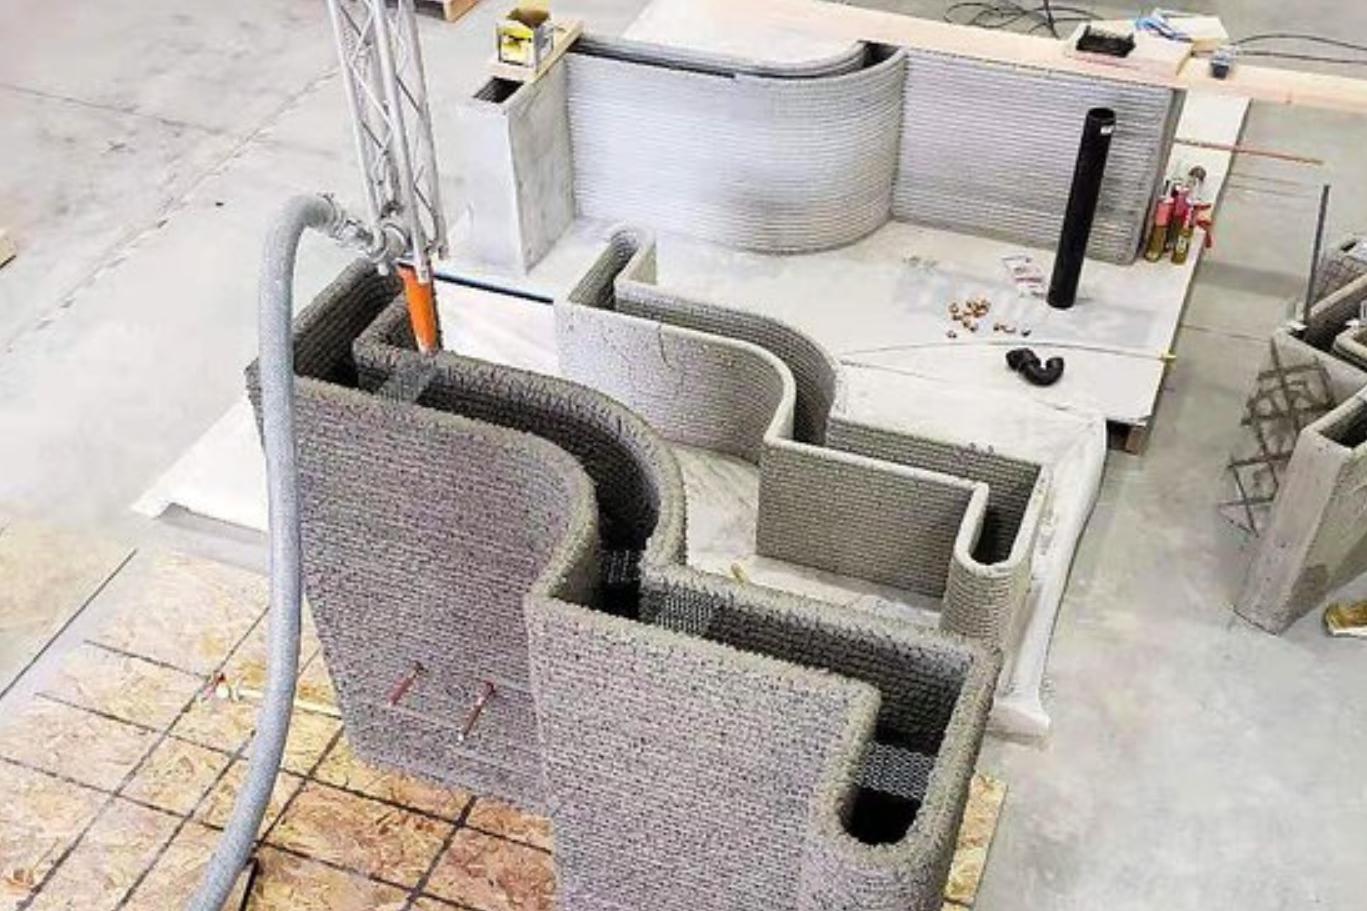
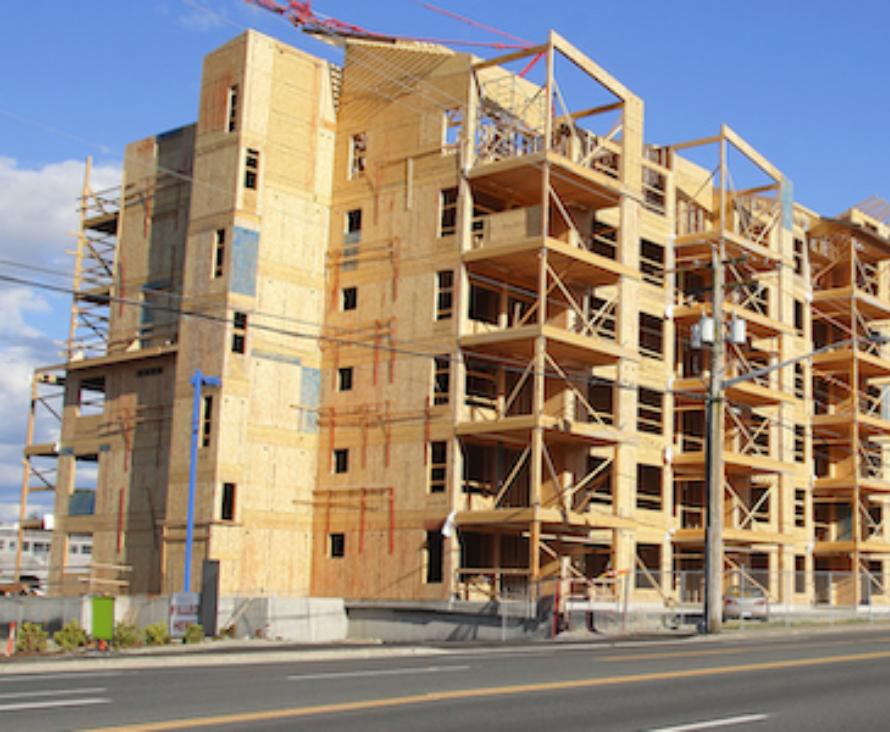
LimitedHousingOptions: Strict density requirements for housing have limited the development of diverse housing options, especially missing-middle housing4, ADUs, and other cost-effective and more affordable housing types, such as manufactured and 3-D printed homes. While many of the Region’s municipalities have recently adjusted their municipal code to be more welcoming for a greater diversity of housing density types, the Region remains in a housing shortage.5
4 For more information about missing middle housing, see https://missingmiddlehousing.com/
5 For more research into Utah’s housing shortage, read https://gardner.utah.edu/wp-content/uploads/StateOfState-Oct2021. pdf
Table 1–TAZ and Commute Time Regression Analysis
EconomicMobility: Recent research into social mobility shows that the mingling of high- and low-income individuals is a critical component necessary to build a region’s social capital and provide access to opportunities for jobs, education, and civic engagement. Chetty, Jackson, Kuckler, et. al. suggest that differences in economic connectedness “can explain relationships between upward income mobility and racial segregation, poverty rates, and inequality.”6 Residential-only neighborhoods with only one housing type (similar density and characteristics) isolates income groups, preventing opportunities for social mobility. Adopting centers-based development, with a variety of housing types and employment options built in proximity, will create neighborhood communities comprising people from a variety of backgrounds and walks of life--thereby enhancing the economic mobility of people in the region.
Future-readyEconomy: A significant shift in work culture occurred due to the Covid pandemic. Before that time, remote work was niche (approximately 5% of US workers in 2019) and has since become a dominant trend (25% in 2023). Additionally, online retail and advanced shipping technologies have changed how people purchase goods and services. Developing centers that are right-sized and mixed-use will increase the Region’s resilience against continuing shifts in consumer habits and demands. WFRC’s Household Jobs Forecast Viewer is a recommended resource for planners and councils to understand how household and job intensities are expected to change over time.
6 Additional research into social mobility can be found at https://opportunityinsights.org/
Key Strategy 1: Promote City and Town Centers
Promote the Development of City and Town Centers
A City and Town Center is a walkable, mixed-use location in a region, city, or neighborhood that provides a variety of amenities and services. Centers feature a mix of residential, commercial, office, recreation, and civic spaces in a higher concentration than surrounding neighborhoods. Centers provide access to regional transportation and transit options, including personal vehicles, public transportation, and bikes, and feature a walkable design that encourages visitors to explore and interact with a human-centered development. The region should do the following to promote the development of City and Town Centers:
A1. Host best practices workshops for planners, community leaders, developers, and economic developers to share the Region’s vision and see compelling reasons why development patterns should change to match the Wasatch Choice Vision.
• Sponsor thought leader symposia.
• Host trips to good examples of center development throughout the nation.
• Train local planners in the best practices that support the Region’s Vision. Host collaborative workshops and events to help them better understand how the framework applies to land use and development proposals in their communities.
A2. Work with each municipality to identify the types of centers that would work best for them and how pressures for status-quo development can be alleviated.
A3. Coordinate with stakeholders to plan for and implement the types of public transportation systems that are best suited for centers.
A4. Provide technical assistance to cities to implement centers through programs such as the Transportation and Land Use Connection.
A5. Support regional transportation planning efforts and consider transportation solutions for all types of transit modes for counties, cities, towns, and recreational assets.
Provide Resources to Support the Development of City and Town Centers
The Wasatch Choice Vision clearly articulates the type of development, which is identified by local leaders, stakeholders, and public participants and will benefit the Region. Because of the rapid growth along the Wasatch Front over the past 5 years, there are projects proposed to local leaders by developers that are not congruent with local land use and the overall vision of the cities and counties. The WFEDD and each of the communities within the Region must play a larger role in supporting developers to better align with the Region’s Vision while exploring their local land use policies.
B1. Create a development ordinance template that communities can adopt to better promote mixed-used and center-based developments.
B2. Create a pattern book (development guide) for communities, with a focus on greenfield development as well as in-fill strategies.
B3. Continuously support investments in improving the Region’s ability to expand high-speed internet coverage.
B4. Provide resources for communities to publish and promote how they would like to see the Wasatch Choice Vision implemented locally. This will enable communities to articulate to developers what type of projects are amenable and work in their context.
B5. Educate cities and counties about opportunities for funding, capital assets, and the development of community reinvestment areas.
ECONOMIC DEVELOPMENT CAPACITY
Role of the Wasatch Front Economic Development District
• Identify and communicate funding opportunities, and provide technical assistance to help communities access federal funding.
• Convene regional partners to support the State’s vision of building out a professional network for economic development practitioners and promulgate best practices.
Outcome Objectives
• Increase Economic Development Administration (EDA) investment in the Region to facilitate grant awards.
• Establish an Economic Development Professional Network
• Support the Region’s counties
• Host a Regional Data Hub and Data Dashboard
Regional Resilience
A resilient economic development ecosystem enables a region to adapt and thrive in the face of disruptions and challenges and is characterized by collaboration and partnerships among businesses, government agencies, and community organizations. These networks support the development of a diverse and sustainable economy and provide individuals and businesses with the tools and resources they need to succeed, even when faced with difficult economic circumstances. It supports entrepreneurship, innovation, small business development, workforce development, environmental sustainability, and social equity—recognizing that a healthy economy stems from a foundation of shared prosperity and opportunity.
Recommendation to enhance resilience:
• Improve the Wasatch Front Region's ability to secure federal aid, espeically from the Economic Development Administration.
Key Metrics
• Number of grants awarded within the Region
◦ Goal: 10 EDA grant awards within the Region by 2028 (2 per year)
• Amount of funding/total dollars awarded
◦ Goal: $5 Million in EDA grant funding secured by the end of 2028 (or $1 Million per year)
Economic Development Capacity Key Findings
The WFEDD can assist the economic development staff of the Region’s communities to pursue funding opportunities, leveraging resources to implement key projects and build the Region’s economy.
Analysis
There is an opportunity to increase the quality and pipeline of economic development professionals in the Region and secure an increased share of federal funding for the Region’s community projects.
Economic Development Professionals Network
The State of Utah, Coordinated Action Plan for Economic Vision 2030 identifies the need to build out the ecosystem of economic development professionals:
“Utah has not had a well-recognized, long-standing, non-governmental group to represent and advance the economic development profession for all areas of the state... It appears that favorable conditions exist for an effective economic development association in the State of Utah if given proper support and sustained focus” (Pg. 22).
The Region would benefit from such an organization. There are 7 economic development organizations in the Region, with no systematic system for collaboration between them (see Table 2).
Currently, there is no good way for economic development professionals to meet, share best practices, pool resources, and learn from each other. It also makes it more difficult to develop professionals with the unique combination of skills to do the work that economic development staff are required to have. The WFEDD is wellpositioned to partner with the state to build out this professional network and lead this effort on behalf of the region as described in the State of Utah Coordinated Action Plan for Economic Vision 2030.
Figure 2—Average Federal Grant Funds Awarded by State (FY 2018-2022)
Figure 3—Average Per Capita Federal Grant Funds Awarded by State (FY 2018-2022)
Source: USASpending.gov
Source: USASpending.gov
Funding Opportunities
During the interviews and focus groups, federal funding was identified as an underutilized opportunity to enable the Region’s counties and municipalities to execute projects.
The average annual funding secured by Utah-based projects from 2018 to 2022 was $6.1 Billion. However, Utah received less federal funding in total grants awarded than neighboring states (except Wyoming) from 2018 to 2022 (Figure 2).
When federal funding received is analyzed on a per-capita basis (Figure 3), Utah secured only $1,873 per resident per year from 2018 to 2022, the lowest of the states in the comparison. These charts indicate that there may be an opportunity for Utah-based organizations to secure more funding from federal sources.
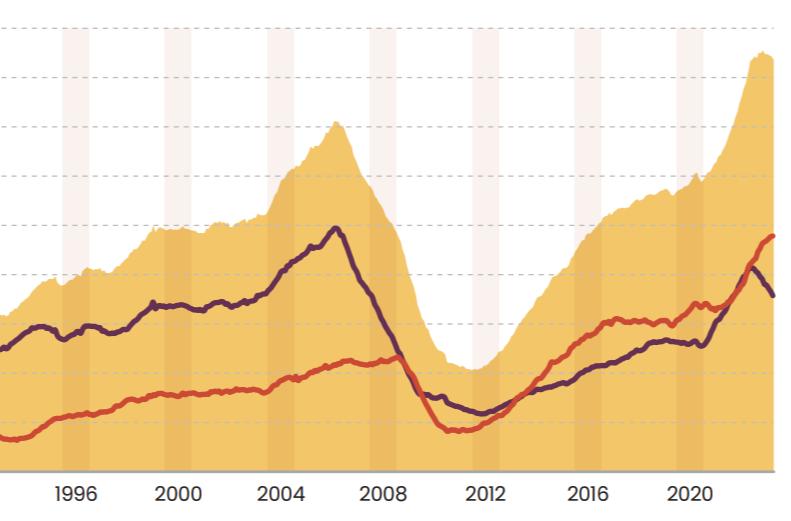
The State of Utah has received an increase in federal grant funding for projects every year between 2016 and 2021 (Figure 4).
The Region’s federal funding is on par with that of the state from 2013 to 2022 (Figure 5), except that the growth and drop is more extreme.
Salt Lake County secured the vast majority of federal funding (approximately $1.3 Billion per year on average, Figure 6). Each of the other counties secured less than $100 Million per year over the same period, which reduced those counties’ abilities to leverage local and state funds with federal sources.
Salt Lake County was awarded the most funding per capita over the period ($1,067 per resident), followed by Morgan County ($552 per resident). Each of the remaining counties is below the regional average of $472 per resident, which is well below the state average of $1,873 per resident (Figure 7).
Figure 4—Grant Awards for Utah-based Projects (FY 2013-2022)
Figure 5—WFEDD Grant Funding Awarded by Year (FY 2013-2022)
Leveraging local funds with federal grants allows communities to amplify their resources, enabling them to undertake more significant and impactful projects that contribute to economic growth. The comparatively low federal funding received by the Region over the last 5 years is evidence of an opportunity to pursue additional grant award opportunities from a variety of federal agencies, including the EDA, USDA, EPA, HUD, and others.
Source: USASpending.gov
Source: USASpending.gov
Source: USASpending.gov
Source: USASpending.gov
Figure 6—Federal Grant Awards by WFEDD County (FY 2018-2022 Average)
Figure 7—Per Capita Federal Grant Awards by WFEDD County (FY 2018-2022 Average)
Salt Lake Morgan Tooele Weber Davis
Key Strategy 2: Facilitate Economic Development Capacity
Assist the Development of an Economic Development Professional Network
Support the State's implementation of the Statewide State of Utah, Coordinated Action Plan for Economic Vision 2030's recommendation to "set up a statewide Economic Development Professional Association." Ensure economic development professionals within the WFEDD Region are networked appropriately into this new/ expanded organization. Provide input on how the organization can support the professional development of the Region's economic developers.
Coordinate discussions between communities, counties, regional organizations, and the state to align regional projects and priorities.
C1. Provide the State with recommended roles and responsibilities of the economic development professional organization.
C2. Provide training, support, and resources as needed by the economic development professionals in the Region’s communities and communicate these needs to the professional organization.
C3. Conduct outreach to local economic development professionals to help them join and participate in the organization.
C4. Organize trainings and best practice workshops for economic development professionals and community leaders across the Region.
Facilitate Grant Applications
The Region has a large opportunity to seek additional funding from federal sources, especially the Economic Development Administration (EDA).
D1. Compile and release a regular newsletter that informs communities of upcoming funding opportunities, showing the benefits of leveraging local investments with federal funds.
D2. Host an annual grant symposium to provide training and share best practices.
D3. Request an annual list of projects, initiatives, or capital improvement plans the communities are working on and identify sources of funding that can help move these projects forward.
D4. Hire or contract with grant writers.
D5. Provide administrative capacity for communities with limited resources to administer grant projects.
Support the Region’s Counties
The primary role of an economic development district is to “help lead the locally-based, regionally driven economic development planning process that leverages the involvement of the public, private, and non-profit sectors to establish a strategic blueprint for regional collaboration.” 7The WFEDD can accomplish this mandate by providing strategic planning, technical assistance, networking opportunities, advocacy, data analysis, and research.
Leverage WFEDD resources and expertise to help communities enhance their economic vitality and improve the overall well-being of their residents. Provide additional support to smaller and resource-constrained
7 Source: U.S. Economic Development Administration https://www.eda.gov/about/economic-development-glossary/edd Accessed August 4, 2023.
governmental organizations as needed.
E1. Provide strategic direction and resources to support regional economic development projects.
E2. Host an Economic Development Summit for individual counties, as needed, to provide targeted economic development support.
• Lead a strategic discussion about the implications of development and how the community should respond to the development pressures that come along with growth and changing market dynamics. Invite participants from other communities who have experienced similar development pressures. EDA has hosted several of these events and could assist with developing this program.
• Each county within the Wasatch Region has unique issues and drastically different needs, as it relates to smart growth and development.
E3. Promote arts, culture, parks, trails, and recreation opportunities and support destination stewardship and tourism sustainability in order to maximize local municipalities’ revenues and to create a sustainable impact as a result of visitor activity.
E4. Balance job creation and housing development with the preservation of parks and open space.
Host a Regional Data Hub & Data Dashboard
The WFEDD serves as a regional data repository for transportation, planning and analytics. WFEDD should expand the data repository to include regional economic and demographic data for cities, towns, counties, and the tourism industry to access.
F1. Create a baseline data dashboard to track progress on each of the CEDS metrics.
F2. Contract with data providers (both public and private) to facilitate access to quality data so communities within the Region can utilize the data, in real-time, for their decision-making processes.
F3. Invite other organizations to provide data for the hub; with the objective of consolidating data from government agencies, research institutions, and businesses to facilitate data sharing, analysis, and decisionmaking for regional planning, policy development, and research.
HUMAN CAPITAL DEVELOPMENT
Role of the Wasatch Front Economic Development District
• Convene partners to identify and understand the barriers to participating in the labor force and improving completion and attainment gaps for select groups.
• Educate partners and stakeholders about the role economic centers play in improving workforce outcomes.
• Support legislation that will offset the costs caused by implementing innovative, businessfocused solutions, such as
◦ Childcare/eldercare services
◦ Transportation services and/or transit passes
◦ Other barriers to workforce participation Outcome Objectives
• Increase labor force participation rate for population subgroups that historically have low labor force participation: Females with own children under 18 years, persons living below the poverty level, and persons with a disability.
• Increase education completion and attainment rates for minority populations.
Regional Resilience
A resilient region provides employment opportunities for individuals such that all who are able and want to work can do so.
Recommendations to enhance resilience:
• Improve access to work.
• Proactively respond to market shifts.
• Adopt responsive and forward-looking business practices to support low-participation groups.
Key Metrics
• Prime-age labor force participation rate
◦ Objective: Increase prime-age labor force participation rate.
◦ Objective: Increase labor force participation rate for low-participation groups.
• Reduce Completion and Attainment Gaps
◦ Educational attainment for minority populations with historically lower acheivement.
Human Capital Key Findings
While the Region boasts a highly qualified and remarkably productive workforce, businesses still face significant challenges due to the shortage of available workers. Many business leaders have cited a scarcity of available workforce as a key constraint to business success, and reported reducing their operating hours due to insufficient available staff. This phenomenon is found across industries and at various levels of the career ladder. Utah’s economic prosperity is being hindered by human capital constraints.
Analysis
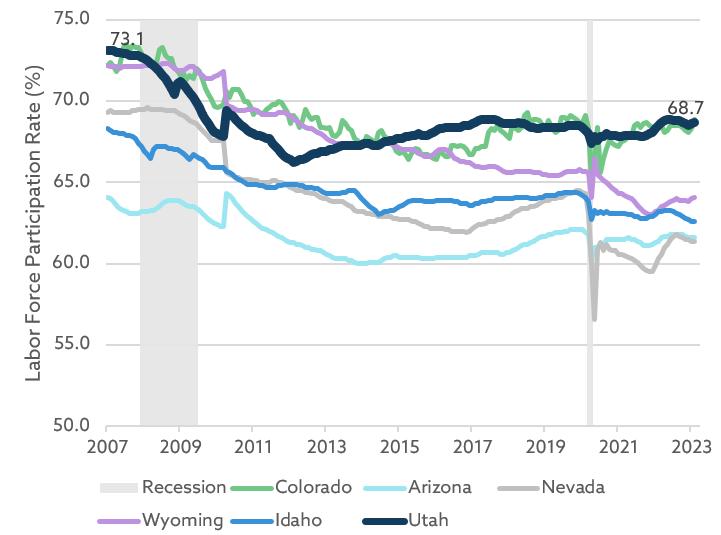
The labor force participation rate is defined as the proportion of the working-age population that is either working or actively looking for work. Utah’s labor force participation rate is consistently higher than the United States as a whole and often leads to surrounding states (Figures 8 and 9). However, Utah’s current labor force participation rate is below the preGreat Recession levels of 2007, indicating that we are not at a general ceiling. The US Census Bureau estimates that the current drop in labor force participation is caused by an aging population, with retirees making up a larger share of the labor force and intentionally not participating, 8and it is expected that the labor force participation rate will continue to decline in the short term as the population continues to age and leave the labor force.
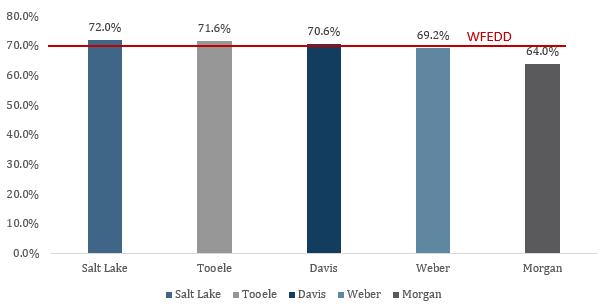
The WFEDD Region labor force participation rate is at 70% (Figure 10), putting the Region several points above the state average. Morgan County is the only outlier in the EDD region, with a rate that is 6 points below the regional average. Labor force participation is negatively correlated with median age and median incomes, so this rate is not surprising and is not a concern per se based on the demographics of Morgan County.
The Bureau of Labor Statistics measures different types of unemployment and underemployment—as there are a variety of reasons why a person may not be participating in the labor force. Definitions for different types of unemployment and underemployment used for this analysis are provided below Table 2. Using these differences in the estimates between these measures can uncover the sensitivity of the unemployed/underemployed and why they are not participating fully in the labor force. Table 2 shows that Utah’s unemployment rates are
8 Source: U.S. Census Bureau. Why Did Labor Force Participation Rate Dip When the Economy Was Good? (census.gov)
Figure 8—Labor Force Participation Rate (Utah versus United States) Figure 9—Labor Force Participation Rate (Utah versus surrounding states)
Figure 10—Labor Force Participation Rate by County (2021)
Source: US Federal Reserve of St. Louis (FRED)
lower than neighboring states across these different measures—meaning that Utah’s labor market is tighter and participating more fully than comparable states.
There are also potentially more workers than shown by the official unemployment rate if addressable and underemployed workers are considered. Approximately 0.5% of Utah’s labor force are addressable workers— these workers are discouraged or marginally attached and could return to the workforce if a suitable job becomes available. 1.5% of Utah’s labor force are underemployed—these workers are employed part-time but would prefer to work full-time.
Table 2—Unemployment and Underemployment by State (four-quarter average ending Feb 2023)
Source: Bureau of Labor Statistics
U-3:totalunemployed, as a percentage of the civilian labor force (this is the definition used for the official unemployment rate).
U-4: total unemployed plusdiscouragedworkers, as a percentage of the civilian labor force plus discouraged workers.
U-5: total unemployed, plus discouraged workers, plusallothermarginallyattachedworkers, as a percentage of the civilian labor force.
U-6: total unemployed, plus discouraged workers, plus all other marginally attached workers, plustotal employedparttimeforeconomicreasons, as a percentage of the civilian labor force.
By taking U-3 out of the U-5 group, the number of “addressable workers” can be calculated. Similarly, by subtracting U-5 from U-6, we can estimate “underemployed” workers (Figure 11).
The share of workers who are addressable and underemployed has been consistently low since 2018, except for the underemployment share in 2022, which rose sharply due to pandemic restrictions (Figure 12).
There is potential to add new workers to the labor force from the workers who are discouraged, marginally attached, and working part-time for economic reasons—however, this is a small percentage of the population, and businesses throughout the Region must be strategic about how they fill job openings and how they address the workers who are addressable and/or underemployed.
Population subgroups that historically have low labor force participation are key groups to target to increase the Region’s labor force participation and provide solutions to the region’s workforce shortages. Table 5 shows the 2021 labor force participation among selected groups. Unlike Utah’s extraordinary labor force performance across the full population, Utah’s lower labor force participation in these categories is on par with—or below that of—neighboring states.
The labor force participation of the selected subgroups in the WFEDD Region is close to the State. Approximately half of individuals who live below the poverty level or who have any disability participate in the labor force.
Table 3—Labor Force Participation Rate by State and Category
Source: U.S.
Figure 11—Addressable Workers and Underemployed Workers (as
Figure 12—Addressable Workers and Underemployed Workers (2018-2022)
Source: Bureau of Labor Statistics
Source: U.S. Census Bureau, American Community Survey, Table S2301. 2021 5-year Estimates (WFEDD region weights based on each county’s share of prime working age population)
Qualification of Workers
An educated workforce provides vital skills and critical thinking for innovation, productivity, and leads to higher incomes, stimulating economic growth. The educational attainment of Utah’s workforce is a compelling reason why businesses choose to locate in the State—with 93% of the population 25 years and older with a high school diploma or higher degree and 37% of the population with a bachelor’s degree or higher.
Utah’s labor force has been changing over time. In addition to an aging population, the state is becoming increasingly demographically diverse. According to the Kem C. Gardner Institute , by 2050 one out of every five Utahns will be of Hispanic/Latino origin and one out of every three Utahns will identify with a racial or ethnic minority.
Many of these minorities have lower educational attainment than the overall population (Table 6). As described in a 2020 Utah System of Higher Education report, the enrollment gap for minority populations is estimated to widen substantially in the next decades, with a similarly widening gap estimated for completion
Table 4—Utah Educational Attainment by Race and Ethnicity
SOURCE: U.S. Census Bureau, American Community Survey, Table S1501. 2021 5-year Estimates.
rates (see Figure 13, where even with the negative educational impacts from COVID the college-going rates have yet to rebound).
The trend of low minority educational attainment may erode Utah's skilled workforce advantage, making it hard to fill positions. Having an increased population with lower educational attainment may harm the Region’s ability to maintain its status as one of the strongest economies in the United States and could affect the Region’s economic resiliency.
SOURCE: Utah System of Higher Education; Minority defined as a student self-identifying as any of the following: Hispanic, American Indian/Alaska Native, Black African American, Pacific Islander, Multiracial, or low-income.
Key Strategy 3: Support Human Capital Development
Increase Labor Force Participation Rate for Low-Participating Groups
A person not participating in the labor force is due to either of the following:
1. Unwillingness or inability to work (either by choice or due to personal or family constraints)
2. Insufficient accommodations or support from employers.
Persons who are unwilling or unable to work do not fall within the scope of the WFEDD’s services and are better addressed by nonprofit organizations and government entities. However, the WFEDD should play a role in supporting cultural and institutional changes that assist persons who have insufficient accommodations and support from employers. Doing so will increase labor force participation by helping those currently outside the workforce become employees. As evidenced in the analysis above, the pool of available workers is very limited; therefore, a key to finding new employees is to identify what accommodations would help make workplaces accessible, especially in the groups identified who have a lower participation rate including parents with young children, people who have a disability, people who live at or below the poverty level, and immigrants and refugees. The WFEDD should do the following to support business and increase the Labor Force Participation Rate.
G1. Convene partners to identify and understand the barriers these groups face.
G2. Create materials and describe creative solutions that can be adopted by employers and governmental entities.
G3. Educate partners and stakeholders about the role economic centers play in reducing barriers to workforce participation.
G4. Support legislation that will offset the administrative burdens or costs caused by implementing innovative, business-focused solutions, such as
• Childcare/eldercare services
• Transportation services and/or transit passes
• Other barriers to workforce participation
Reduce Completion and Attainment Gaps for Minority Populations
Minority populations comprise an increasing share of Utah’s population and labor force, but minority educational attainment levels are below those of the overall population. If this trend continues, the education level of the Region’s workforce will drop over the next 20 years. The Region must improve educational outcomes in minority populations to generate a resilient workforce pipeline.
H1. Participate in and host meetings with the Utah Department of Education, Utah System of Higher Education, and the Department of Workforce Services to raise awareness of and strategies around the completion and attainment gaps of minority populations.
H2. Help provide workforce pathways in Utah’s five key industry clusters to better align the workforce pipeline with upcoming workforce needs.
Include Diverse Stakeholders and Representatives
Local boards should be representative of the community they serve. Diverse stakeholders bring a wide range of perspectives, experiences, and expertise to the table. By including individuals from different backgrounds,
cultures, and sectors, local boards ensure that decision-making processes consider a variety of viewpoints. Homogeneous boards run the risk of having blind spots and biases that can lead to overlooking certain perspectives or issues. Including diverse stakeholders helps mitigate these risks by bringing in fresh insights and challenging existing assumptions, and diverse perspectives and experiences lead to more creative and innovative problem-solving. This inclusive approach leads to more informed, comprehensive, and equitable decisions that reflect the needs and interests of the entire community. The WFRC and WFEDD can lead by example by creating a policy for how they will ensure representative involvement on their boards.
I1. Provide a template for what communities can do to increase the diversity of stakeholders and representatives.
I2. Advocate for inclusive representation of stakeholders on committees, internally and at a regional level.
I3. Lead by example as an organization through diverse hiring practices.
DIVERSE BUSINESS ENVIRONMENT
Role of the Wasatch Front Economic Development District
• Refine objectives for business recruitment.
• Educate businesses on the potential benefits of Automation/Machine Learning & Artificial Intelligence tools.
• Promote green, efficient, and sustainable technologies.
Outcome Objectives
• The number of unfilled jobs is reduced so businesses can reach their intended capacity.
• Businesses are experimenting with and adopting new and emerging technologies, including environmentally and financially sustainable technologies.
• Local governments are strategically incentivizing businesses that meet their market needs.
Regional Resilience
Resilient businesses are poised to adapt and thrive in the face of disruptions and challenges. Resilient businesses are equipped to maintain operations during, and recover from, disasters and disruptions. Recommendations to enhance resilience:
• Adjust business recruitment to match Regional needs and workforce skillsets
• Support the innovation and entrepreneurial support ecosystem
• Adopt new and emerging technologies to lower job openings
Key Metrics
• Unemployed persons per job opening
◦ Objective: 1 unemployed person per job opening
• Business survivability after 5 years
◦ Objective: Increase business survivability rates 10 percent by 2028
• Net establishment and job growth
◦ Objective: 2 percent growth in each category per year
Diverse Business Environment Key Findings
The diverse business mix and density of high-performing companies has put the Region in a strategically advantageous position. To move to the next level, efforts for business recruitment and business development must align with a nuanced and complex framework of objectives to best serve the regional economy, considering the priorities of strategic development outlined in the Wasatch Choice Vision and tight labor force dynamics.
Analysis
The Region’s labor market conditions are constraining businesses’ ability to find and hire workers. Analysis of the number of job openings being offered for each unemployed worker supports the human capital analysis described previously and shows how the current labor force will be unable to fill the region’s needs. The number of unemployed persons per job opening has remained consistently low in Utah, with approximately 2.5 jobs for each unemployed person in early 2023 (Figure 14).
SOURCE: Bureau of Labor Statistics
Hires can come from either people who currently have or recently had a steady job (designated as a job-to-job employee) or from people who have not had a job over the last three quarters (persistent nonemployment). Hires for both categories have increased over the last ten years, showing that the region has created new jobs and opportunities for workers (Figure 15).
Figure 14—Unemployed Persons per Job Opening (2018-2023
However, the type of hire is important for businesses, with the share of each type showing the relative tightness of the market and the pool from which employers have to pull. The share of J2J hires was 55% of total hires in Q1 2022 versus 46% in Q1 2012, meaning that businesses are not hiring people who are rejoining the labor force but have to hire people from other firms and with higher levels of experience. This growing difference between the J2J line and the persistent nonemployment line is evident in the tight labor market. This is supported by the increase in wages over the last several quarters in 2023, wherein wage inflation has exceeded price inflation for the last several quarters as of Q3 2023. However, this tightness is not guaranteed over the next 5-year CEDS planning period. What is important is to understand how hire types show the job market conditions within the Region and how businesses should respond to such signals to become more resilient in the face of changing economic conditions.
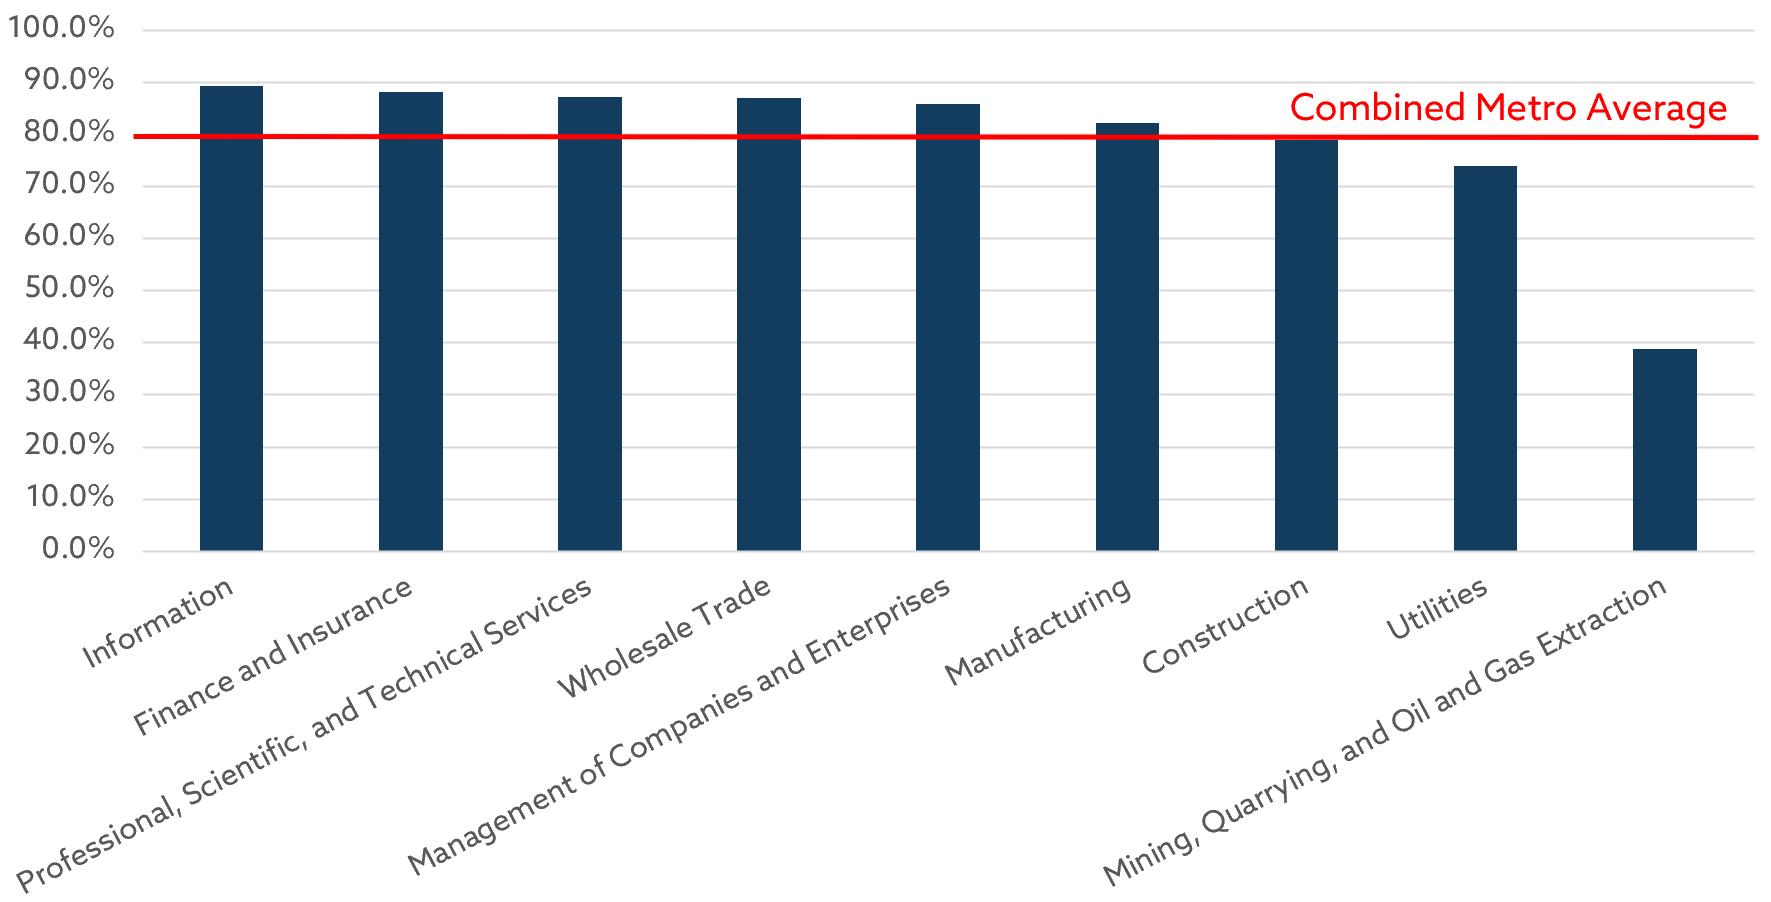
Understanding that jobs are currently being filled by current jobholders, there is a need to analyze where the workers are coming from to fill those jobs. An analysis was conducted of whether businesses are hiring workers from within the Region, or recruiting workers outside the Region. Of the J2J hires by metro of origin shows that, overall, a large majority of hires come from the Wasatch Front Region itself.9 However, the share of local hires does differ significantly by industry, with 9 out of 10 workers in the Information sector hiring from the local pool while fewer than 1 in 3 come from the local pool for the Mining sector (Figure 16).
16—Percent of in-region hires for above-average paying industries located within the Region, Q2 2022
SOURCE: U.S. Census Bureau. (2023). Job-to-Job Flows. Washington, DC: U.S. Census Bureau, Longitudinal-Employer Household Dynamics Program. https://j2jexplorer.ces.census.gov. v 1.03
Understanding the majority of hires are coming from within the region and J2J rather from persistently unemployed workers means new jobs being added to the Region are somewhat zero-sum for the Region itself. There is a positive benefit for the workers themselves, who get new jobs with better wages, benefits, and/or quality of life improvements as a result of job change; however, the gains for the Region are not as clear, because many of the “new jobs” mean a job loss in another business or industry without any unemployed workers to fill in the slack. This is supported by the survey data conducted as part of the State of Utah, Coordinated Action Plan for Economic Vision 2030 (Figure 17).
All Hires Job-to-Job Hires Hires from Persistent Nonemployment
SOURCE: U.S. Census Bureau. (2023). Job-to-Job Flows. Washington, DC: U.S. Census Bureau, Longitudinal-Employer Household Dynamics Program. https://j2jexplorer.ces.census.gov. v 1.03
9 Data are only provided at the metro level, so SLC and Layton-Weber metros were used as a proxy for the Region.
Figure
Figure 15—Total Hires, J2J Hires, and Persistent Nonemployment Hires, 2001Q1-2022Q1
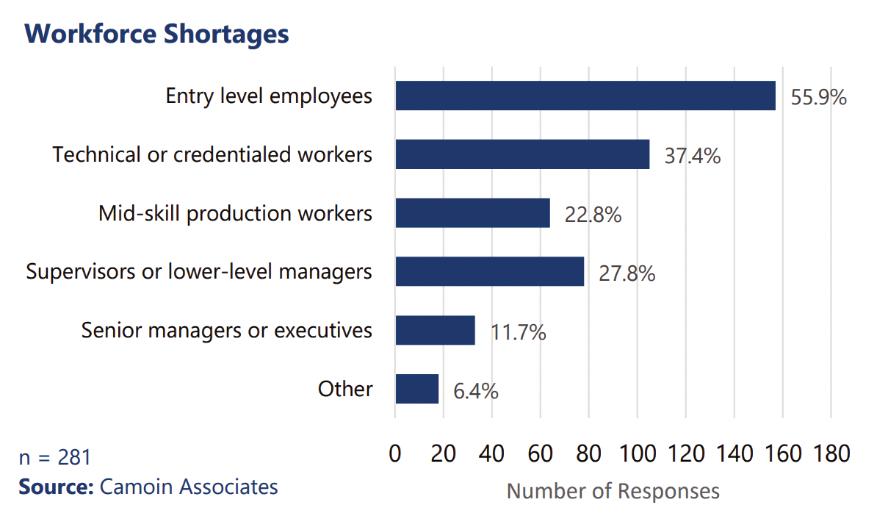
Entry level employees
Technical or crentialed workers
Mid-skill production workers
Supervisors or lower-level managers
Senior managers or executives
There needs to be recognition that, given the tightness of the labor market, hiring workers in one industry leads to workforce gaps in other industries. WFEDD is highly innovative, ranking fifth of all of the nation’s 393 EDDs per an analysis conducted by StatsAmerica.10 Additionally, Utah has done well leveraging technology to increase labor force productivity, increasing the estimated Total Factor Productivity per worker from 92.5 in 2007 to 117 in 2023 (an increase of 26 percent per worker). Utah is now one of the most productive states in the Intermountain West due to its ability to leverage technology to make its workers more productive (Figure 18).
Leveraging new and emerging technologies, such as artificial intelligence, automation, robotics, 3D printing, and other innovations will be critical to filling the Region’s job openings while allowing workers to continue experiencing wage gains in the short term.
Source: Camoin Associates (2023)
Figure 17—Labor Force Productivity (as measured by Total Factor Productivity) by Year (2007-2021)
Key Strategy 4: Leverage a Diverse Business Environment
Refine Objectives for Business Recruitment
Land use constraints and workforce supply make the recruitment of new businesses a tactical priority for the Region. Educational attainment and productivity levels make the Region desirable for quality businesses. However, due to the high labor force participation rate and in-metro job hires, recruitment of a job to the region is likely at a loss to other regional businesses. Additional strategic efforts and incentives to attract businesses must be targeted to only those projects that are strategically advantageous and are supportive of the defined industry clusters.
J1. Communicate business recruitment and expansion priority matrix to communities and partners (such as EDCUtah, GOEO, and the Chambers of Commerce).
• Matrix includes the following priorities:
◦ Projects that align with local workforce skills—so businesses don’t have to recruit employees from outside of the region, continuing to push up housing costs.
◦ Projects that provide above-average wages.
◦ Projects that are in the State’s priority industries or match regional economic development projects (see Regional Projects and Priorities)
J2. Lobby and advocate for GOEO and municipalities to restructure their incentive process to specific industries to better align with needed jobs.
J3. Lobby and advocate for cities and counties to be part of a larger regional effort for recruitment of businesses with state entities like GOEO and EDCUtah.
Improve the Entrepreneurial and Innovation Support Ecosystem
A robust entrepreneurial and innovation support ecosystem is essential for driving innovation, economic growth, and job creation, especially in new and emerging technologies. Providing the necessary resources, knowledge, and networks enables aspiring entrepreneurs to succeed, fosters a culture of entrepreneurship, and contributes to the overall development and prosperity of the Region. The promotion of export-oriented businesses will also be important for supporting businesses by helping them increase the total addressable market and driving revenue from customers that are outside the Region
K1. Explore the potential need and use for an EDA Revolving Loan Fund program for the WFEDD and/or establish a microloan fund to support entrepreneurs in the Region.
K2. Apply for an EDA University Center designation in partnership with the Region's colleges and universities.
K3. Support new and growing businesses by connecting them with the Region’s strong international trade capabilities, including leveraing the resources available through the World Trade Center, to increase exportoriented products and services.
Leverage Technology to Fill Workforce Gaps, Increase Business Capacity, and create good Paying Jobs
10 Source: https://www.statsamerica.org/innovation/ii3.aspx. Accessed June 2023.
Technology can help fill workforce gaps by automating repetitive tasks, increasing productivity, and enabling the efficient use of resources. Automation and artificial intelligence can handle routine and manual tasks, allowing employees to focus on complex and value-added work. Technology can bridge workforce gaps and reduce the number of low-wage and low-skilled jobs needed that cannot provide living wages.
New technology also allows for innovation into new products, services, and business models previously unattainable, creating new and high-paying jobs with high-growth opportunities.
L1. Work with universities, community colleges and technical colleges to create courses to improve workforce skills around technology such as artificial intelligence and automation in the workplace.
• Provide this course to business owners to help them identify ways they can automate low-wage and lowskilled jobs that they are unable to fill.
• Create industry-specific training video series to increase their accessibility to business owners.
L2. Work with funders to lower barriers and enable businesses, universities, nonprofits, and other eligible entities, to access capital and federal and state funding programs to purchase equipment, software, and create development workforce programs to alleviate gaps for expansion including technology, workforce, supply chain management and other development barriers.
Promote Sustainable Technologies
Green tech, or environmentally friendly technology, can provide businesses with financial benefits through cost savings and incentives. As more communities, businesses, and residents adopt the use of green tech, the Region benefits from positive impacts on air quality and decreased water usage—identified as key strategies in the Wasatch Choice Vision. Adopting new and emerging technologies in this space will address workforce and housing constraints while improving the local quality of life. For more information on how to adopt these technologies in the region, see Appendix II.
M1. Distribute information and provide thought leadership regarding how businesses can use sustainable technologies.
• Topic suggestions include Property Assessed Clean Energy (PACE), solar arrays, electric vehicles, xeriscape, and new building materials and approaches.
REGIONAL PROJECTS AND PRIORITIES
The following are major projects and priorities identified by regional stakeholders and leaders in the near term and which are supported by the WFEDD:
Utah and WFRC Targeted Industry Clusters (https://business.utah. gov/targeted-industries/)
• Advanced Manufacturing
• Aerospace and Defense
• Financial Services
• Life Sciences and Healthcare
• Software and IT
• Outdoor Recreation
Regional Projects
• Business and Expansion
◦ (Davis) Business Retention and Expansion (BRE): Bolster BRE program to build relationships with key businesses in Davis County, prioritizing companies that have a significant economic impact.
◦ (Davis) Collaboration and Resources: Facilitate collaboration and connect industry and education to enhance initiatives that allow access to research labs, workforce and training programs, job creation incentives, access to human talent, and resources to entrepreneurs and small businesses.
◦ (Salt Lake) Salt Lake Center Of Opportunity Partnership (CO-OP): This is a small business assistance program that partners with community-based organizations, primarily Chambers, and business services providers, such as bookkeeping, permitting assistance, and marketing advice, to serve businesses in communities facing economic opportunity gaps (Opportunity Businesses).
• Funding
◦ (Salt Lake) We are introducing a more robust methodology to evaluate the financing gap, “but for”, and efficiency of the financial stacks in TIF proposals.
◦ (Salt Lake) Improved Financing Mechanisms for Transit-Oriented Development (TOD): In cooperation with national experts, Salt Lake County is putting together guidance for cities to leverage all possible tools to finance TOD.
• Housing
◦ (Davis) Affordable and Attainable Housing: Increase, improve, and preserve affordable housing options in Davis County. Work with affordable housing advocates and developers, to increase and preserve mixed-income housing developments that promote economically integrated communities and improve housing choices.
• Infrastructure
◦ (Morgan) I-84 Mountain Green Interchange: Build out of a new interchange on I-84 at Mountain Green that connects into SR - 167 (Trapper Loop) at Old Highway 30.
◦ (Tooele) Water System Connections: Connect water systems “all three working together” – County, Tooele City, and Grantsville City (Rural Communities Opportunity Grant + ARPA funds)
◦ (Weber) The West Weber Residential Corridor and Industrial District. A general plan for this 6000-acre area of unincorporated Weber County was recently approved. The vision for this area is to create one of the largest industrial corridors that features workforce housing, recreation and quality of life amenities, pilot and educational programs for sustainable energy, innovation, and conservation initiatives, and alternative transportation options.
◦ (Morgan) Improve County development, staff, processes, and code by reviewing and updating Morgan County Land use code, and building requirements. Change zoning, adopting tools to assist in the development of CRAs, and RDAs , studies and strategic planning. Retain and hire quality staff. Other County needs include affordable housing, identification of affordable housing needs and define infrastructure growth needs, and workforce development
◦ (Weber) Form-based Village Concept. Weber County Planning Department implemented a formbased village and main street concept in their land use plans and codes. The objective is to create public streetscapes that are well-designed with all components of complete street principles.
• Other Assets
◦ (Morgan) Outdoor Recreation and Tourism: Morgan County has an opportunity to experience and capitalize upon an increase in international awareness of our outdoor recreation opportunities and tourism economy.
◦ (Tooele) Tourism: Launch and promote the County’s new tourism website, SEO, and social media (UOT Co-op grant)
◦ (Tooele) Outdoor Recreation and Tourism: Establish Tooele County as a top destination for anyone passionate about speed (UOT Destination Development grant)
◦ Strategic Planning
◦ (Weber) Weber County’s Place-Based approach to community and economic development including implementing a holistic approach to short- and long-term strategic planning with community and stakeholder input and implementation of a public/private infrastructure project design, funding, and implementation process; revision of development codes to include environmental sustainability, corridor preservation, workforce/affordable housing, and form-based code requirements.
• Economic Development
◦ (Davis) Job Centers: Continue partnership with Northern Utah Economic Alliance in request for information responses and lead generation, including direct outreach to decision-makers in target
industries and site selectors to increase opportunities for job centers.
◦ (Tooele) Shovel Ready Projects: Plan, design, and implement infrastructure to bring three industrial parks to shovel-readiness (Rural County Grant).
◦ (Weber) Weber County Economic Development Department implemented a menu of services and programs to assist its municipalities in their individual economic development needs. The objective of this initiative is to foster a collaborative approach to development in the county and provide the county’s cities with development resources.
• Workforce
◦ (Davis) Diversity, Equity, and Inclusion (DEI): Coordinate and collaborate with multicultural organizations to increase access, opportunity, and advancement for underrepresented populations and to encourage and promote DEI within Davis County.
◦ (Salt Lake) Workforce Inclusion and Successful Employment (WISE) Program: This is a proof-of-concept to demonstrate that additional investment to support success in workforce development programs by lower-income populations creates a net-positive tax impact.
◦ (Salt Lake) Workforce Development Strategy for Target Industries and Jobs: In cooperation with EDCU and DWS, Salt Lake County is combining data from historical business attraction efforts and ongoing workforce trends to create an economic strategy for Salt Lake County.
• Tourism
◦ Promote the development of tourism assets and activities in the Region.
◦ Support the establishment and growth of tourism-based jobs and supporting industries, such as arts, entertainment, and recreation.
• Housing
◦ Promote medium- and high-density housing developments, especially for in-fill locations and in designated City/Town centers.
◦ Promote the adoption and development of low-investment housing solutions, such as ADUs, basement/garage units, etc. that can provide short- and medium-term housing solutions.
State of Utah, Coordinated Action Plan for Economic Vision 2030 recommendations for the WFRC Region
• Salt Lake
◦ Growing talent within
◦ Financing development/transportation
◦ Small business opportunities
• Davis
◦ Shovel-ready sites
◦ Business retention and expansion
◦ Affordable/attainable housing
• Weber
◦ Place-based economic development
◦ Collaboration among cities for economic development
◦ Small business opportunities
• Tooele
◦ Industrial Park development
◦ Connect water systems
◦ Launch a tourism website
• Morgan
◦ Interchange Development on I-84
◦ Outdoor recreation/tourism
◦ Update/improve land cost use
REGIONAL CEDS 2023-2028 EVALUATION FRAMEWORK
The following tables provide a summarized view of the recommendations that are provided within this strategy document, as well as the tasks associated with the recommendation, proposed metrics to track progress on those items, and the organization/group that will lead the efforts on each task.
This section should be used as the main way of tracking tasks and working with partners on achieving the goals of this 5-year CEDS.
CITY AND TOWN CENTERS
RECOMMENDATION TASK
A1. Host best practices workshops for planners, community leaders, developers, and economic developers to share the Region’s vision and demonstrate compelling reasons to change development patterns to match Wasatch Choice Vision.
A2. Work with each municipality to identify what types of centers would work best for them and how pressures for status-quo development can be alleviated.
Promote the Development of City and Town Centers
A3. Coordinate with stakeholders to plan for and implement the types of public transportation systems that are best suited for centers.
A4. Provide technical assistance to cities to implement centers through programs such as the Transportation and Land Use Connection.
A5. Support regional transportation planning efforts and consider transportation solutions for all types of transit modes for counties, cities, towns, and recreational assets
B1. Create a development ordinance template that communities can adopt to better promote mixed-used and center-based developments.
B2. Create a pattern book (development guide) for communities, with a focus on greenfield development as well as in-fill strategies.
METRIC PARTICIPATING ORGANIZATIONS
Host 5 workshops (1 per year) by 2028
WFRC/WFEDD
ECONOMIC DEVELOPMENT CAPACITY (PAGE 1 OF 2)
RECOMMENDATION TASK
Provide Resources to Support the Development of City and Town Centers
B3. Provide resources for communities to publish and promote how they would like to see the Wasatch Choice Vision implemented locally. This will enable communities to articulate to developers what type of projects are amenable and work in their context.
B4. Educate cities and counties about opportunities for funding, capital assets, and the development of community reinvestment areas.
B5. Continuously support investments in improving the region’s ability to expand high-speed internet coverage.
3 new City and Town Centers by 2028
WFRC/WFEDD Local Governments
Maintain average commute times in each county through 2028
Report on progress annually
WFRC/WFEDD, UTA, UDOT
WFRC/WFEDD Local Governments
Report on progress annually
WFRC/WFEDD UDOT UTA
Complete by 2025
Complete by 2026
Report on progress annually
WFRC/WFEDD
WFRC/WFEDD
WFRC/WFEDD
Host 5 workshops (1 per year) by 2028
WFRC/WFEDD GOPB GOEO
Report on progress annually
Utah Broadband Center
WFRC/WFEDD
METRIC PARTICIPATING ORGANIZATIONS
C1. Provide the State with recommended roles and responsibilities of the economic development professional organization. Complete by 2024
WFRC/WFEDD
Assist the Development of an Economic Development Professional Network
C2. Provide training, support, and resources as needed by the economic development professionals in the Region’s communities and communicate these needs to the professional organization. Report on progress annually
C3. Conduct outreach to local economic development professionals to help them join and participate in the organization. Report on progress annually
C4. Organize trainings and best practice workshops for economic development professionals and community leaders across the Region.
D1. Compile and release a regular newsletter that informs communities of upcoming funding opportunities, showing the benefits of leveraging local investments with federal funds.
Host 5 workshops (1 per year) by 2028
10 newsletters (1 every 6 months) by 2028
D2. Host an annual grant symposium to provide training and share best practices. 5 grant symposiums (1 per year) by 2028
WFRC/WFEDD
WFRC/WFEDD
WFRC/WFEDD Other local agencies
WFRC/WFEDD
Facilitate Grant Applications
D3. Request annual lists of projects, initiatives, or capital improvement plans the communities are working on and identify sources of funding that can help move these projects forward. Report on progress annually
D4. Hire or contract with grant writers. 1 by 2024 and 2 by 2028
D5. Provide administrative capacity for communities with limited resources to administer grant projects. Report on progress annually
WFRC/WFEDD Other AOGs GOPB GOEO UAMMI
WFRC/WFEDD County Econ Development Partners
WFRC/WFEDD
WFRC/WFEDD
ECONOMIC DEVELOPMENT CAPACITY (PAGE 2 OF 2)
RECOMMENDATION TASK
E1. Provide strategic direction and resources to support regional economic development projects.
E2. Host an Economic Development Summit for individual counties, as needed, to provide targeted economic development support.
METRIC PARTICIPATING ORGANIZATIONS
Report on progress annually
Report on progress annually
WFRC/WFEDD Local Governments
WFRC/WFEDD Other Key Economic Development Stakeholders
HUMAN CAPITAL DEVELOPMENT
RECOMMENDATION TASK
G1. Convene partners to identify and understand the barriers these groups face.
Support the Region’s Counties
Host a Regional Data Hub & Data Dashboard
E3. Promote arts, culture, parks, trails, and recreation opportunities and support destination stewardship and tourism sustainability in order to maximize local municipalities’ revenues and to create a sustainable impact as a result of visitor activity.
E4. Balance job creation and housing development with the preservation of parks and open space.
F1. Create a baseline data dashboard to track progress on each of the CEDS metrics.
F2. Contract with data providers to facilitate access to quality data so communities within the Region can utilize the data for their decision-making processes.
F3. Invite other organizations to provide data for the hub; with the objective of consolidating data from government agencies, research institutions, and businesses to facilitate data sharing, analysis, and decision-making for regional planning, policy development, and research.
Report on progress annually
DMO/Tourism Boards and Offices
Increase Labor Force Participation Rate for Low-Participating Groups
Green space per resident Local Governments
Complete by 2025 WFRC/WFEDD
Complete by 2025 WFRC/WFEDD
Complete by 2026 WFRC/WFEDD
Reduce Completion and Attainment Gaps for Minority Populations
G2. Create materials and describe creative solutions that can be adopted by employers and governmental entities.
METRIC PARTICIPATING ORGANIZATIONS
Labor force participation rate for underperforming groups
Labor force participation rate for underperforming groups
G3. Educate partners and stakeholders about the role economic centers play in reducing barriers to workforce participation.
Labor force participation rate for underperforming groups
G4. Support legislation that will offset the administrative burdens or costs caused by implementing the proposed solutions, where possible.
Labor force participation rate for underperforming groups
H1. Participate in and/or host meetings with the Utah Department of Education, Utah System of Higher Education, and the Department of Workforce Services to raise awareness of and strategies around the completion and attainment gaps of minority populations. Educational attainment for minority populations
H2. Help provide workforce pathways in Utah’s five key industry clusters to better align the workforce pipeline with upcoming workforce needs.
I1. Provide a template for what communities can do to increase the diversity of stakeholders and representatives.
Educational attainment for minority populations
Complete by 2026
Talent Ready Utah Educational Institutions
Talent Ready Utah Educational Institutions
WFRC/WFEDD
WFRC/WFEDD
Talent Ready Utah Educational Institutions
Talent Ready Utah Educational Institutions
WFRC/WFEDD/ Local Organizations
Include Diverse Stakeholders & Representatives
I2. Advocate for inclusive representation of stakeholders on committees, internally and at a regional level.
Report on progress annually
I3. Lead by example as an organization through diverse hiring. Report on progress annually
J1. Communicate business recruitment and expansion priority matrix to communities and partners.
Refine Objectives for Business Recruitment
J2. Lobby and advocate for GOEO and municipalities to restructure their incentive process to specific industries to better align with needed jobs.
K1. Explore the potential need and use for an EDA Revolving Loan Fund program for the WFEDD, and/or establish a microloan fund, to support entrepreneurs in the Region.
Improve the Entrepreneurial and Innovation Support Ecosystem
Send out once per year GOEO / EDCUtah
Report on progress annually GOEO/WFEDD
Complete by 2025 WFEDD/Local RFL Organizations
K2. Apply for an EDA University Center designation in partnership with the Region's colleges and universities.
Complete by 2027 USHE/WFEDD
K3. Support new and growing businesses by connecting them with the Region’s strong international trade capabilities, including leveraing the resources available through the World Trade Center, to increase exportoriented products and services.
L1. Work with universities, community colleges and technical collegesto create courses to improve workforce skills around technology such as artificial intelligence and automation in the workplace.
Report on progress annually World Trade Center
This page is intentionally blank
Report on progress annually USHE
Leverage Technology to Fill Workforce Gaps
L2. Work with funders to lower barriers and enable businesses, universities, nonprofits, and other eligible entities, to access capital and federal and state funding programs to purchase equipment, software, and create development workforce programs to alleviate gaps for expansion including technology, workforce, supply chain management and other development barriers.
Report on progress annually Universities/ UAMMI/GOEO/ WFEDD
Promote Sustainable Technologies
M1. Distribute information and provide thought leadership regarding how businesses can use sustainable technologies.
Report on progress annually Universities/GOEO/ SLChamber/WFEDD
APPENDIX I - DATA INPUTS
• The following snapshots show the data used to understand the economic conditions of each county at the time this document was written, so as to provide context for how the recommendations were written. Updated data can be found on the WFEDD website. The section also contains charts and survey responses that used to develop the strategies detailed in this Strategy.
• Davis County
This page is intentionally blank
APPENDIX II - INNOVATIVE HOUSING TECHNOLOGY WHITE PAPER
APPENDIX III - REGIONAL DATA PROFILE AND KEY METRIC SOURCES
/
Access to Opportunities Wasatch Front Regional
Attainable Housing
Census Bureau, American Community Survey, Table S2503
Business Survivability Bureau of Labor Statistics, Business Employment Dynamics 1994-2021
Educational Attainment U.S. Census Bureau, American Community Survey, Table S1501 2017-2021
Exports as % of GDP Bureau of Economic Analysis, Table CAGDP1 2021 Grant Awards/Funding USASpending.gov 2013-2022
Housing and Transportation Costs as Percentage of Income Housing and Transportation Index, Avg. Housing and Transportation Costs as Percentage of Income 2019
Labor Force Participation Rate U.S. Census Bureau, American Community Survey, Table S2301 2017-2021
Leisure and Hospitality Spending Per Capita Kem C. Gardner Policy Institute, County Tourism Dashboard 2022
Mean Travel Time to Work U.S. Census Bureau, American Community Survey, Table S0801 2017-2021
Percent of Population with an Associate’s Degree U.S. Census Bureau, American Community Survey, Table S1501 2021
Population Growth US Census Bureau, Annual Estimates of Resident Population Change for Counties 2022
Total Part-Time Workers U.S. Census Bureau, American Community Survey, Table S2303 2021
Total Population US Census Bureau, Annual Estimates of Resident Population for Counties 2022
Vehicle Miles Traveled Housing and Transportation Index, Avg. Vehicle Miles Traveled by Household 2019