
Santa Barbara Area Market Report
SANTA BARBARA AREA REAL ESTATE THROUGH JUNE 2025


TOTAL SALES
676 (+8% over 2024)
Review in Numbers
SOUTH SANTA BARBARA COUNTY JUNE 2025 YTD
SINGLE FAMILY RESIDENCE SALES
489 (+10% over 2024)
CONDOMINIUM SALES
187 (+4% over 2024)
Greetings, and thank you for delving into our Second Quarter 2025 Market Report.
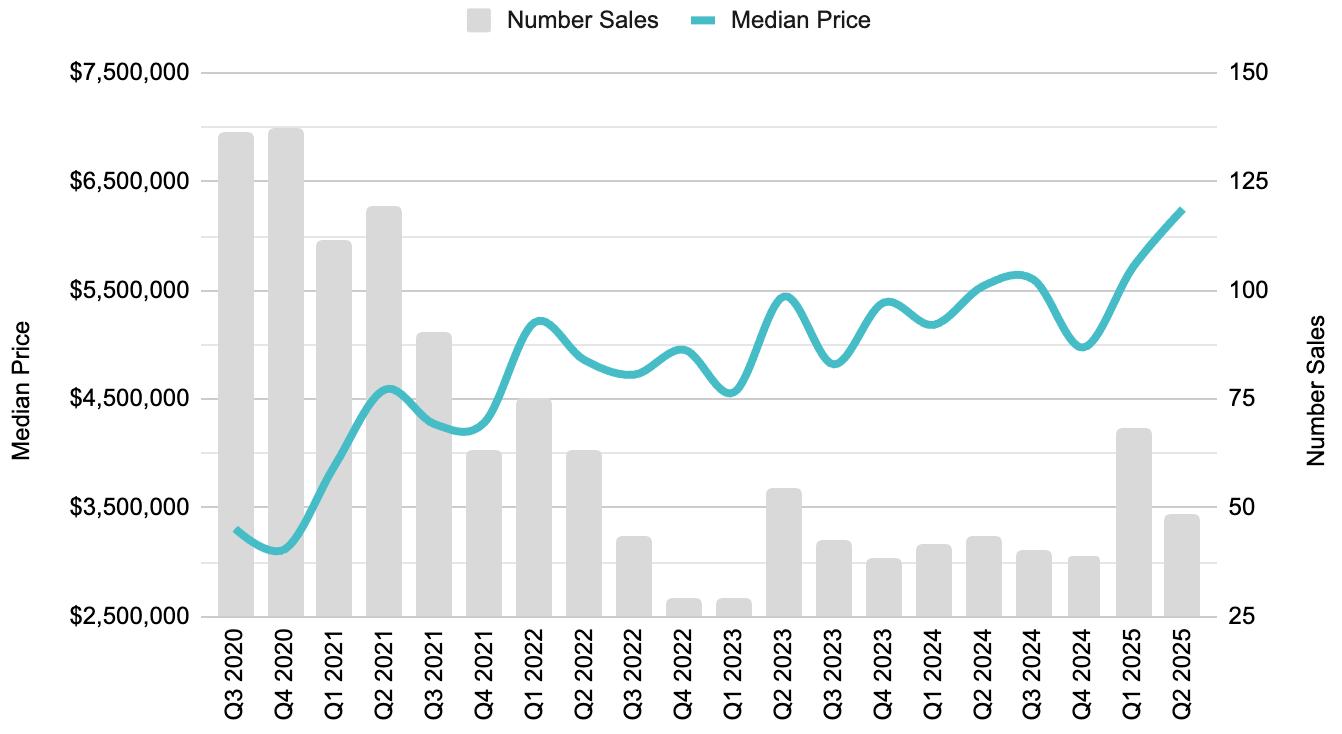
It’s hard to believe it’s July already! Since April 2nd, we have been monitoring the macro environment and its effect on our local real estate market. After starting the year off with double digit increases in the number of sales and median pricing, in Q2 we saw a more muted increase in the number of sales from Q2 2024, up 4%. Median Pricing remained essentially flat, up slightly by 1%.
Compared to Q1 2025, however, we experienced a ‘normal’ seasonal increase in sales (+17%), but witnessed some softening in pricing (with Median Price down 9% from Q1. It should be noted this pricing trend was not across the board, and is partly attributable to a mix shift in sales from Q1 to Q2, with Montecito comprising 22% of sales in Q1 (unusually high), to 13% of sales in Q2 (with Santa Barbara and Goleta sales taking that share in Q2). We also saw a notable uptick in inventory and months of supply in the quarter, bringing us closer to supply/demand equilibrium, the first time we’ve seen technical signs of a ‘balanced’ market since pre-covid in 2019.
We trust this report provides valuable context for evaluating the real estate market, but the nuances of each submarket, neighborhood and property are unique. And it’s precisely during these periods of higher volatility that opportunities can emerge on either side of the transaction. Our team is well-seasoned and strategically positioned to capitalize on them for you. Should you have specific inquiries about your submarket, or a specific property, please do not hesitate to contact us. The entire Village Properties team is dedicated to providing you with tailored insights and consistent, exceptional service.
Best regards,
Renee Grubb
S ingle Family
SOUTH SANTA BARBARA COUNTY
JUNE 2025 YTD
AVERAGE SALES PRICE • YTD
$3,658,727 -2% change from 2024
MEDIAN SALES PRICE • YTD
$2,430,000
+8% change from 2024


SOUTH SANTA BARBARA COUNTY JUNE 2025 YTD
AVERAGE SALES PRICE • YTD
$1,437,781 +27% change from 2024
MEDIAN SALES PRICE • YTD
$1,159,000 +19% change from 2024
SALES & INVENTORY
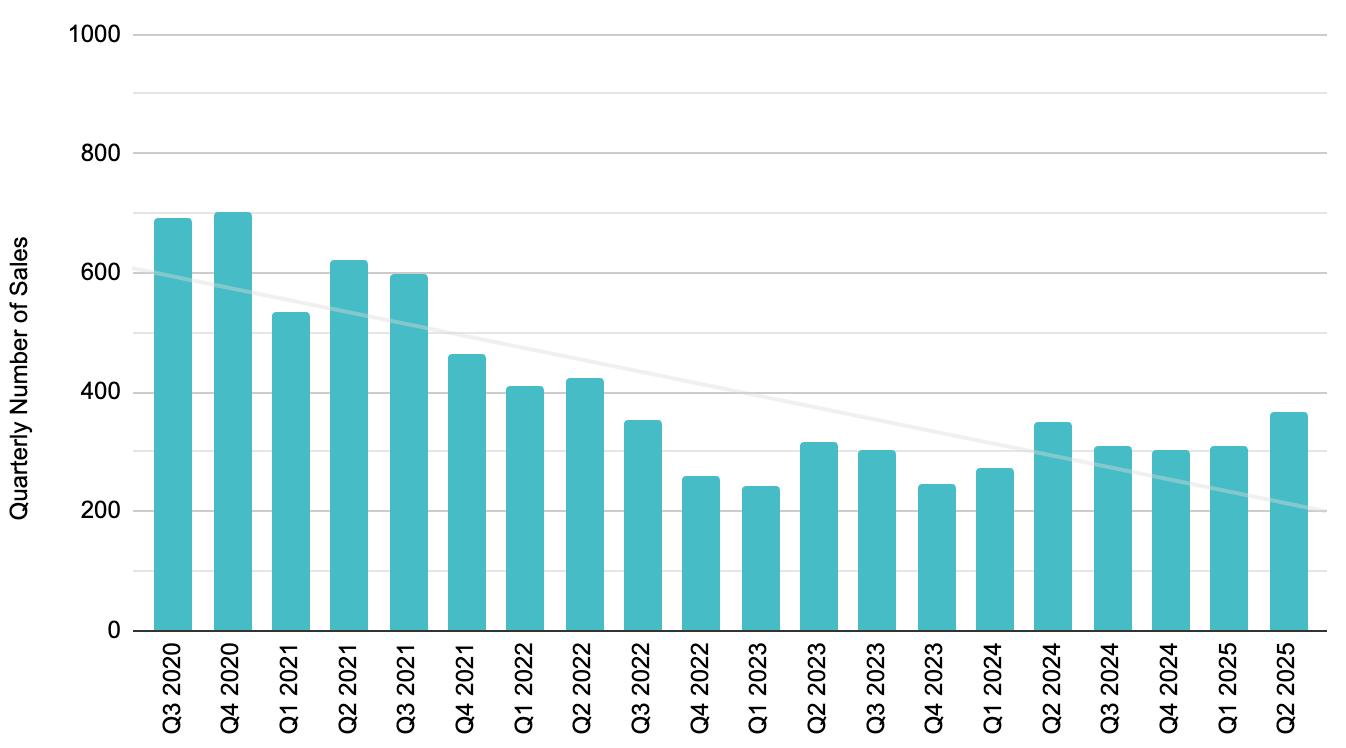
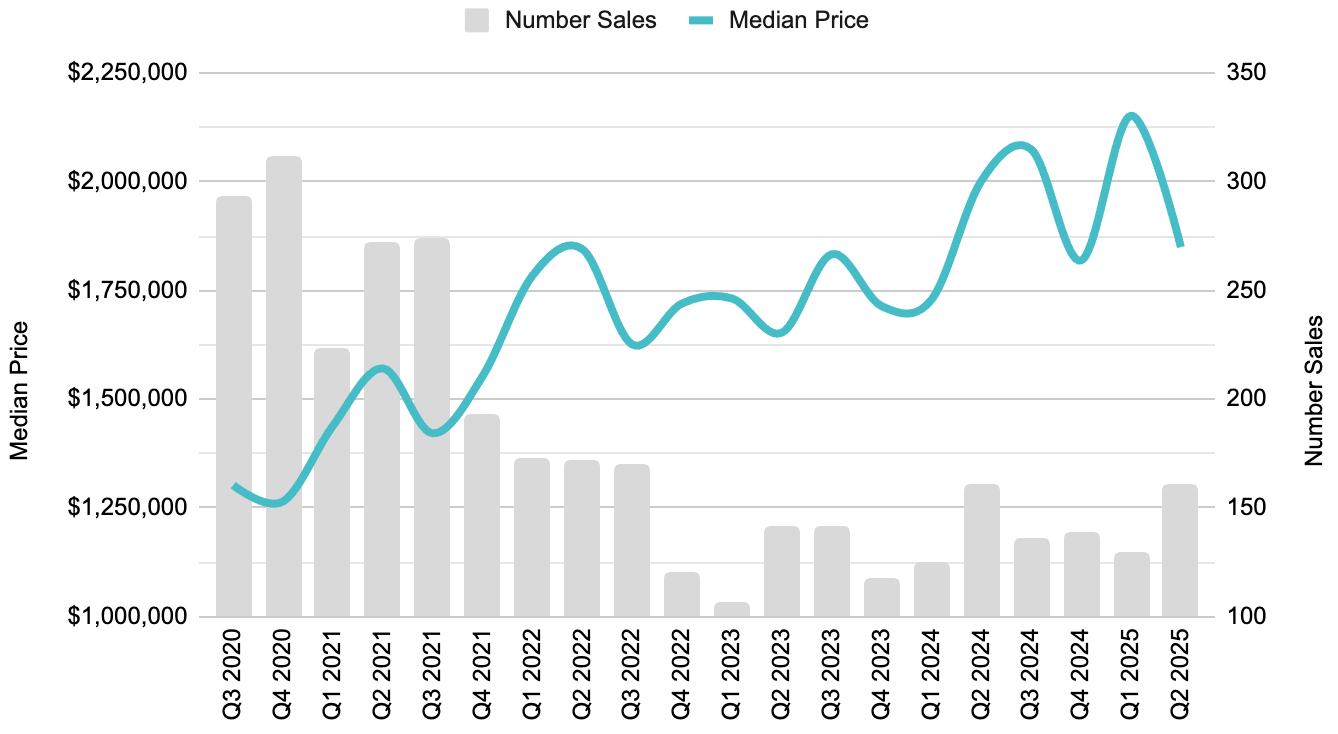
In the Second Quarter, there were 365 closings across the South County, an increase of 4% from Q2 2024 (vs. 351), and a 17% increase from Q1 (although this type of increase is a common seasonal trend from winter to spring). Over the past five years, the average change in sales from Q1 to Q2 is 19%.
Inventory and Months of Supply (MoS) took a big step towards supply/demand equilibrium during the quarter, with just over one month of supply being added. We started the year at 2.6 MoS and ended the quarter at 3.7 MoS (+40% from January). Typically four to six MoS equals a neutral, balanced market. Excluding May - July 2020, the last time we’ve experienced a balanced market was pre-covid in 2019.
Santa Barbara Area real estate market
SOUTH SANTA BARBARA COUNTY · THROUGH JUNE 2025
PRICING
Median Pricing came in slightly above Q2 2024, up just 1% to $1.83MM (vs. $1.82MM in Q224). It should be noted that the percentage of South County sales by submarket was quite comparable to Q2 2024, unlike in Q1 when Montecito sales surged. Performance should always be more closely analyzed by submarket, however.


Carpinteria
This was the fifth straight quarter where there were ~30 closed sales in Carp (33 in Q2, +10% from Q1 2024, +14% from Q1). Median Price decreased by 11% from Q2 2024, to $1.175MM. The most notable sale this quarter was 5529 Calle Arena for $4.3MM.


Summerland
Summerland had only three closed sales this quarter, even with Q2 2024. Median Price for the quarter was $1.75MM, down 33% from $2.6MM one year ago (as all sales this quarter were below $2MM.


JUNE 2025
13

$7,525,000 +6% change from 2024
$3,207,787
$2,538,880
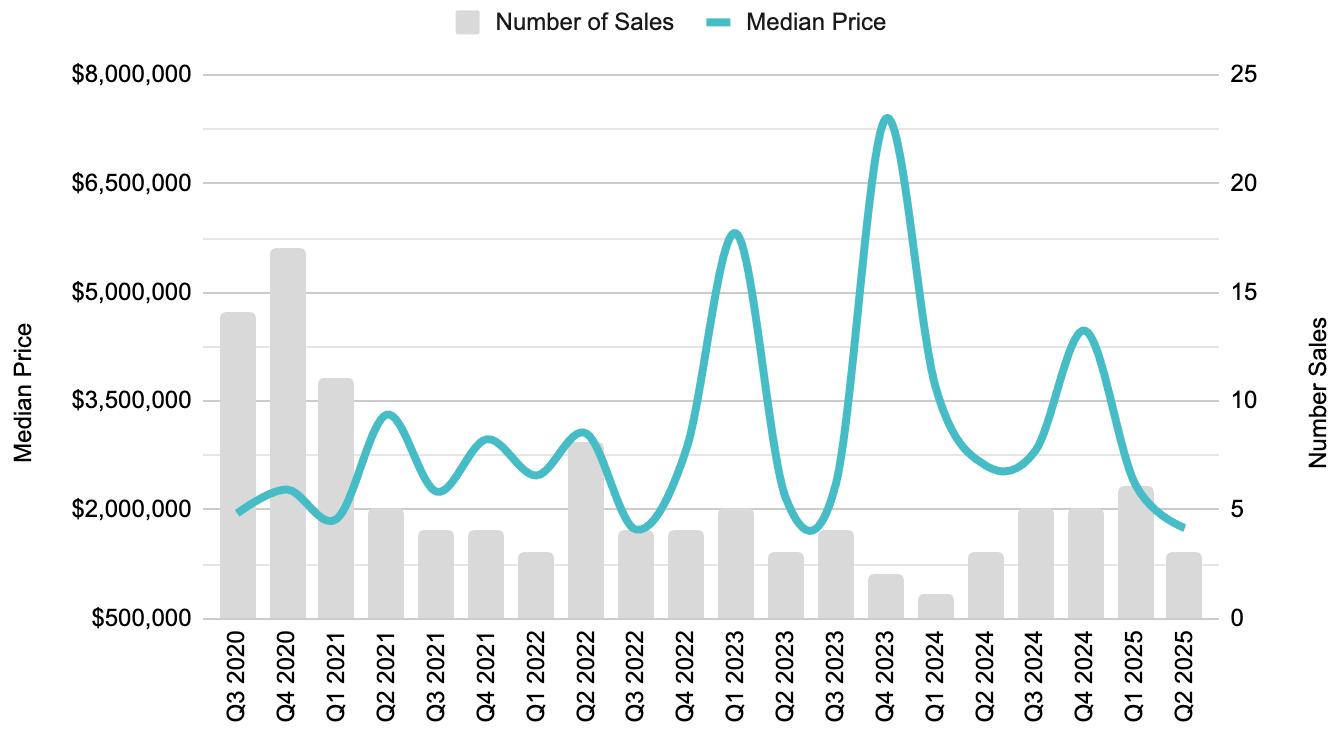
Montecito
Montecito continues to perform, with 48 sales in the quarter, up 12% from Q2 2024. Median Price increased at a similar pace, to $6.25MM (+13%, or a +$750k change from Q224). For context, this increase in pricing takes into consideration there were three sales in Q224 over $30MM, when there was only one sale over $20MM this quarter. That said, it should be highlighted that Montecito sales fell 29% from Q1 2025, while the overall South County sales increased by 17% over the same time period, potentially a signal that discretionary capital went to a “wait-and-see” mode to more fully understand macro implications of tariffs. The most notable transaction this quarter was 1803 Fernald Point Ln for $23.76MM.

Santa Barbara
There were 160 closed sales in Santa Barbara this quarter, even from Q2 2024, but up 24% from Q1 2025. Median Price, at $1.85MM, was down 8% from one year ago (when there were four sales over $8MM), and down 16% from Q1 (when there was a $23MM sale). There were eight sales over $5MM in the quarter with the most notable being 1809 Mira Vista Avenue for $8.25MM.
Barbara
JUNE 2025

207
$1,471,003
$1,207,500


JUNE 2025
3

$6,300,973
Hope Ranch
Hope Ranch continued to build on its recent sales momentum from Q1 with 10 sales (+43% from Q2 2024, +25% from Q1). While skewed due to the low number of sales, Median Price rose 4% to just over $6MM, with the most notable sale being 4426 Via Bendita for $12.5MM.

4450 VIA ALEGRE
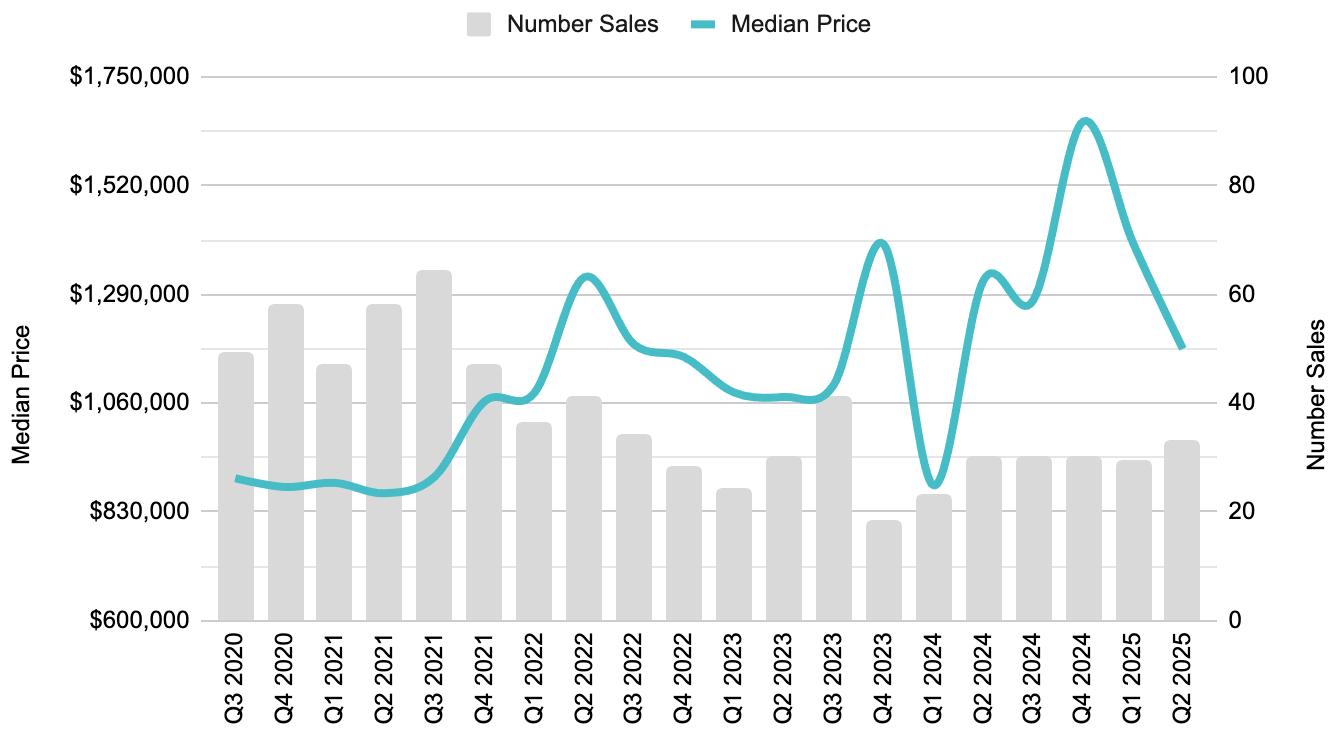
Goleta
After a light Q1, Goleta rocketed back to life in Q2. There were 111 closed sales (+4% from Q2 2024 but +56% from Q1 2025). At $1.55MM, Median Price rose 9% from Q2 2024, however this figure is slightly skewed due to four sales in the Foothills around San Antonio Creek over $3.5MM, with two of them closing for over $5MM. Even excluding these sales, Median Price for Goleta would still be $1.525MM, or +8% from one year ago.


$1,094,262

Santa Ynez Valley Review in Numbers
SANTA YNEZ VALLEY JUNE 2025 YTD
TOTAL SALES
98 (+11% over 2024)
SINGLE FAMILY RESIDENCE SALES
82 (+28% over 2024)
CONDOMINIUM SALES
16 (-11% over 2024)
S ingle Family
SANTA YNEZ VALLEY
JUNE 2025 YTD
AVERAGE SALES PRICE • YTD
$2,250,452 -8% change from 2024
MEDIAN SALES PRICE • YTD
$1,820,000 +17% change from 2024


SANTA YNEZ VALLEY JUNE 2025 YTD
AVERAGE SALES PRICE • YTD
$782,057 +6% change from 2024
MEDIAN SALES PRICE • YTD
$719,900 +5% change from 2024

$714,950

8

Los Olivos & Santa Ynez

Santa Ynez

SINGLE
TOTAL SALES · YEAR TO DATE
3 AVERAGE SALES PRICE · YTD $1,789,222
MEDIAN SALES PRICE · YTD $1,820,000 SINGLE FAMILY RESIDENCES
YTD
TOTAL SALES · YEAR TO DATE
33
AVERAGE SALES PRICE · YTD
$3,016,154
MEDIAN SALES PRICE · YTD
$2,650,000


Global Connections

“Our global partners ensure your home is seen by interested buyers across the world.”
RENEÉ GRUBB Founder & CEO

We are fortunate to be in a place that people all over the world desire to be. We cultivate strategic global relationships that ultimately benefit you by putting your home in front of those people.