

252 UNITS 2012 YEAR BUILT AUSTIN-SAN ANTONIO METROPLEX L U X U R Y A P A R T M E N T H O M E S


 Ravi Gupta
Vikram Raya COO / Founder CEO / Founder
Ravi Gupta
Vikram Raya COO / Founder CEO / Founder
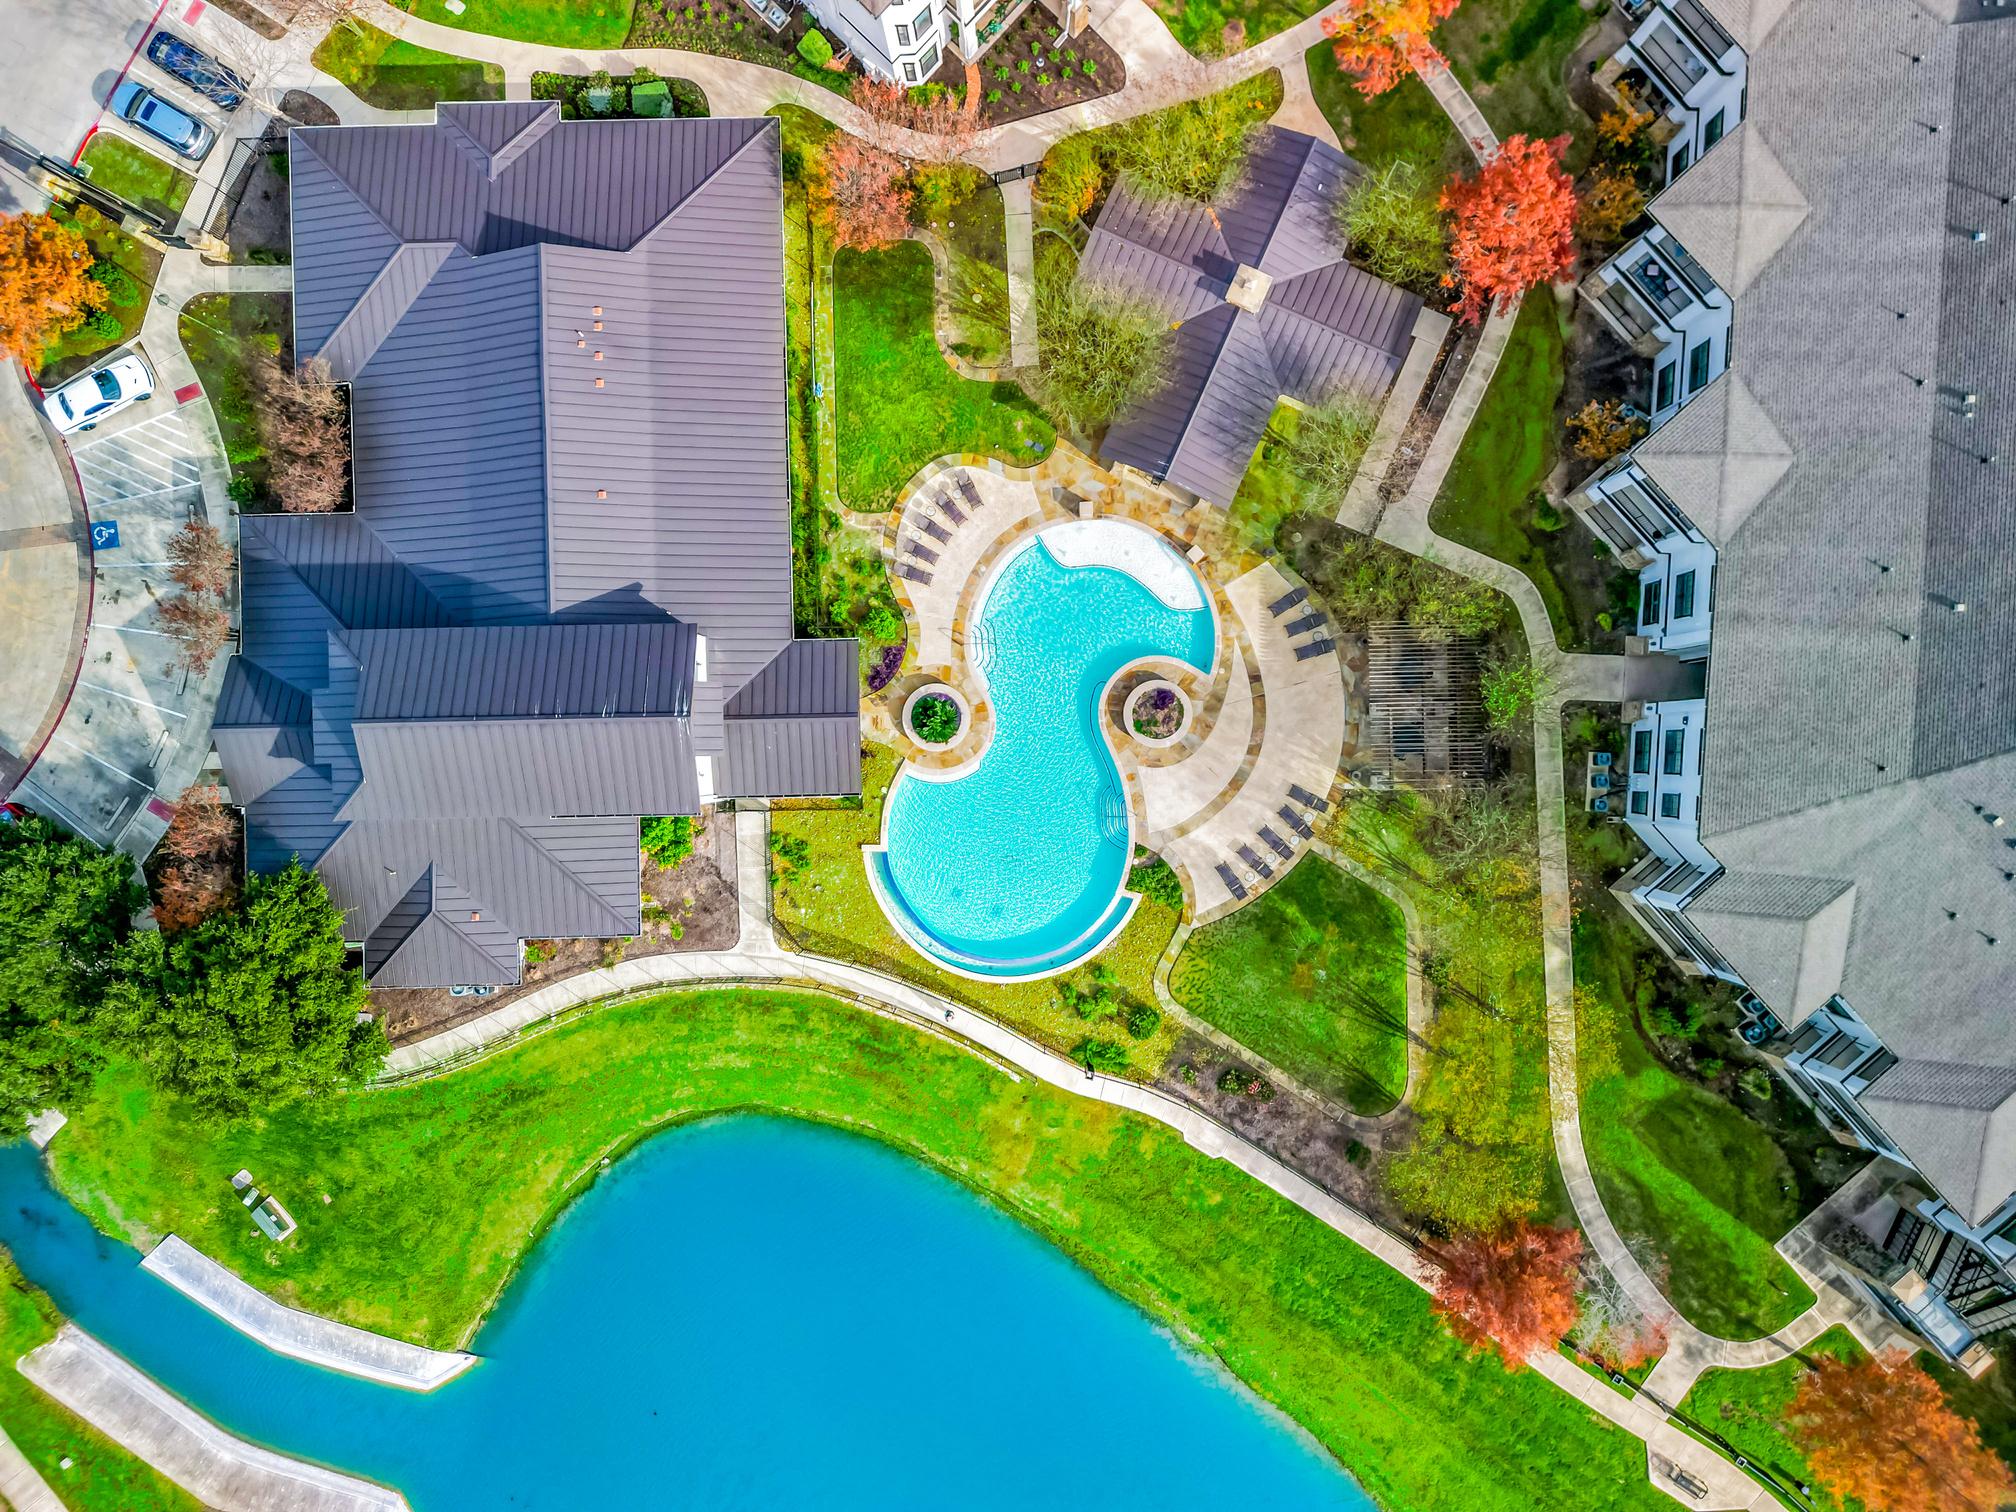

TABLE CONTENTS

Executive Summary
Financial Analysis
Property Description
Location Overview
Portfolio & Performance


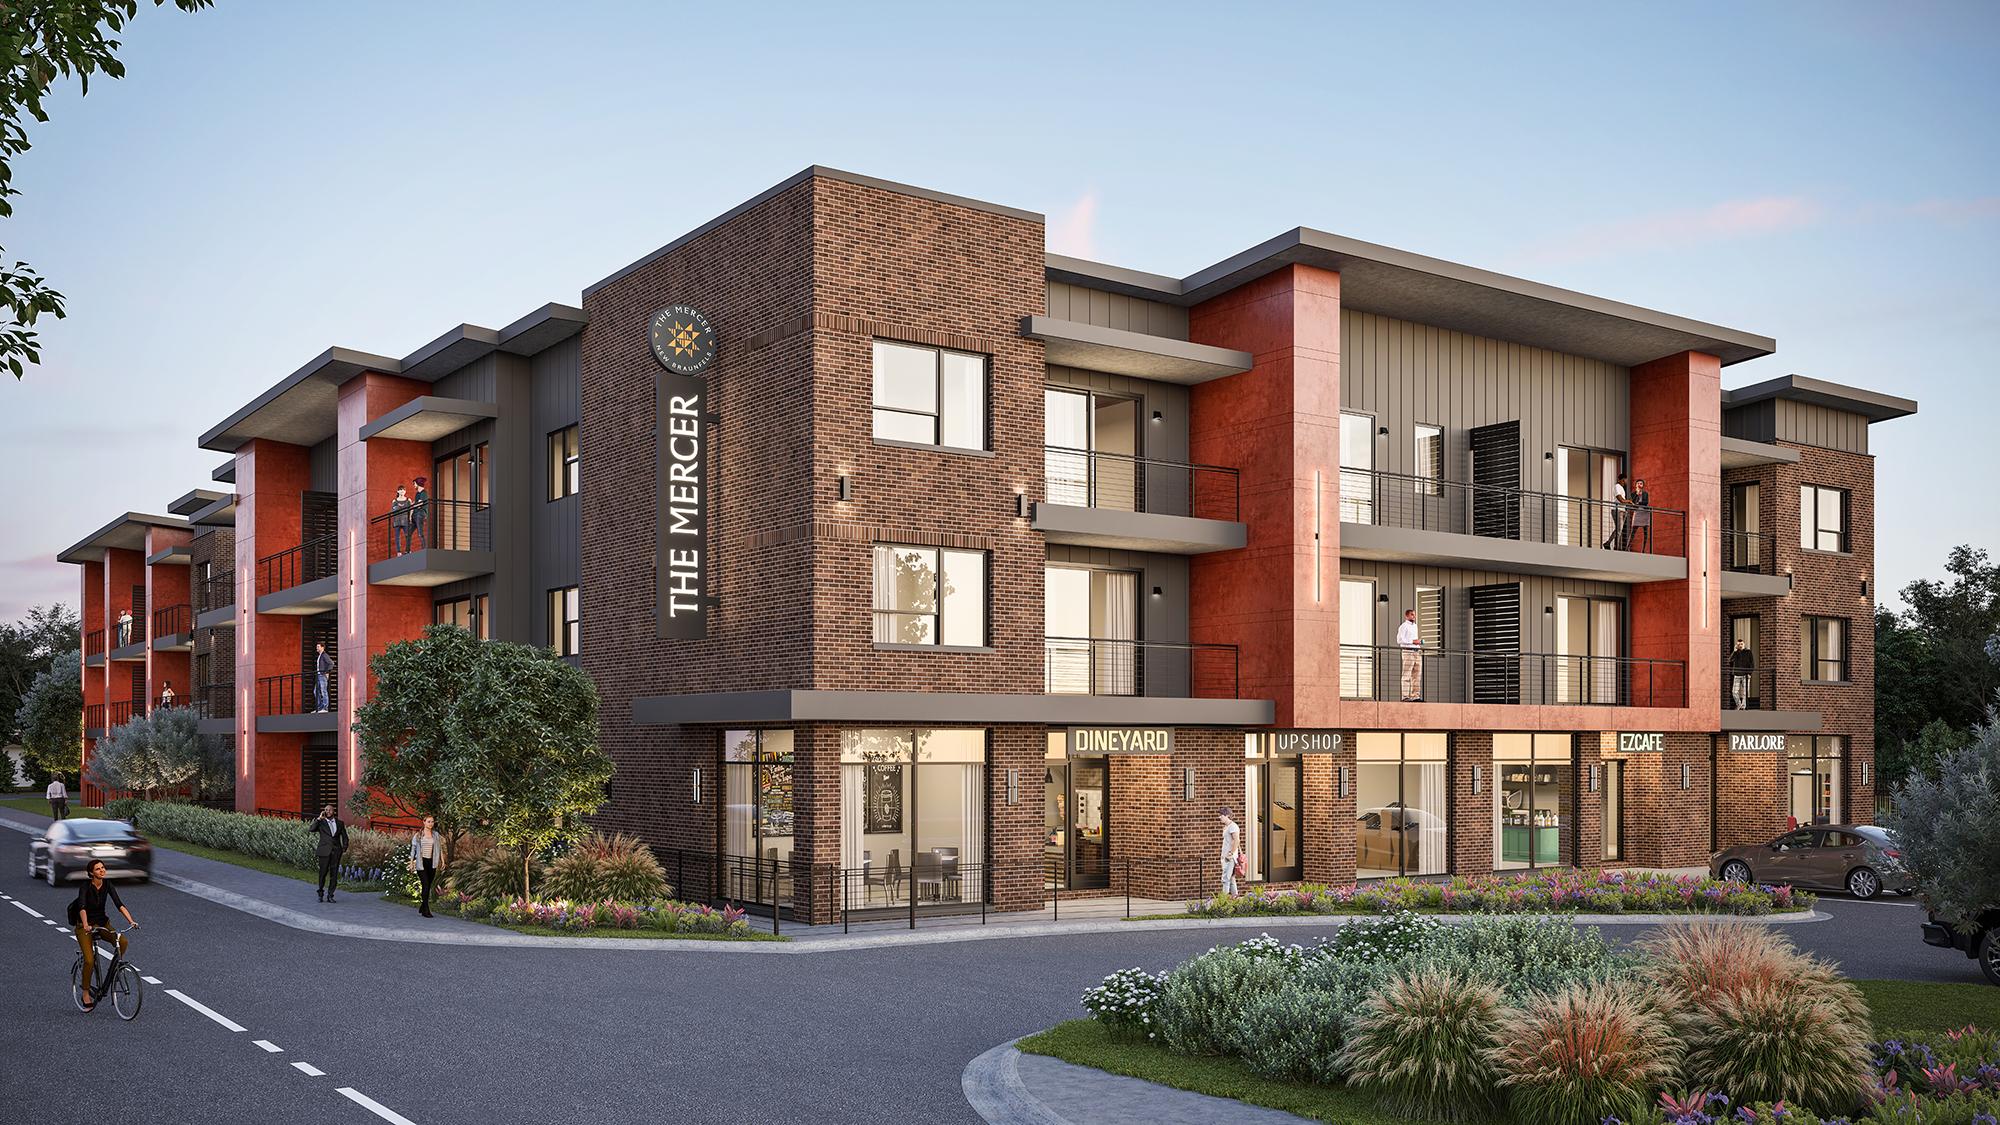
SUMMARYexecutive V I L L A S | 2 0 1 2 A U S T I N - S A N A N T O N I O M E T R O P L E X
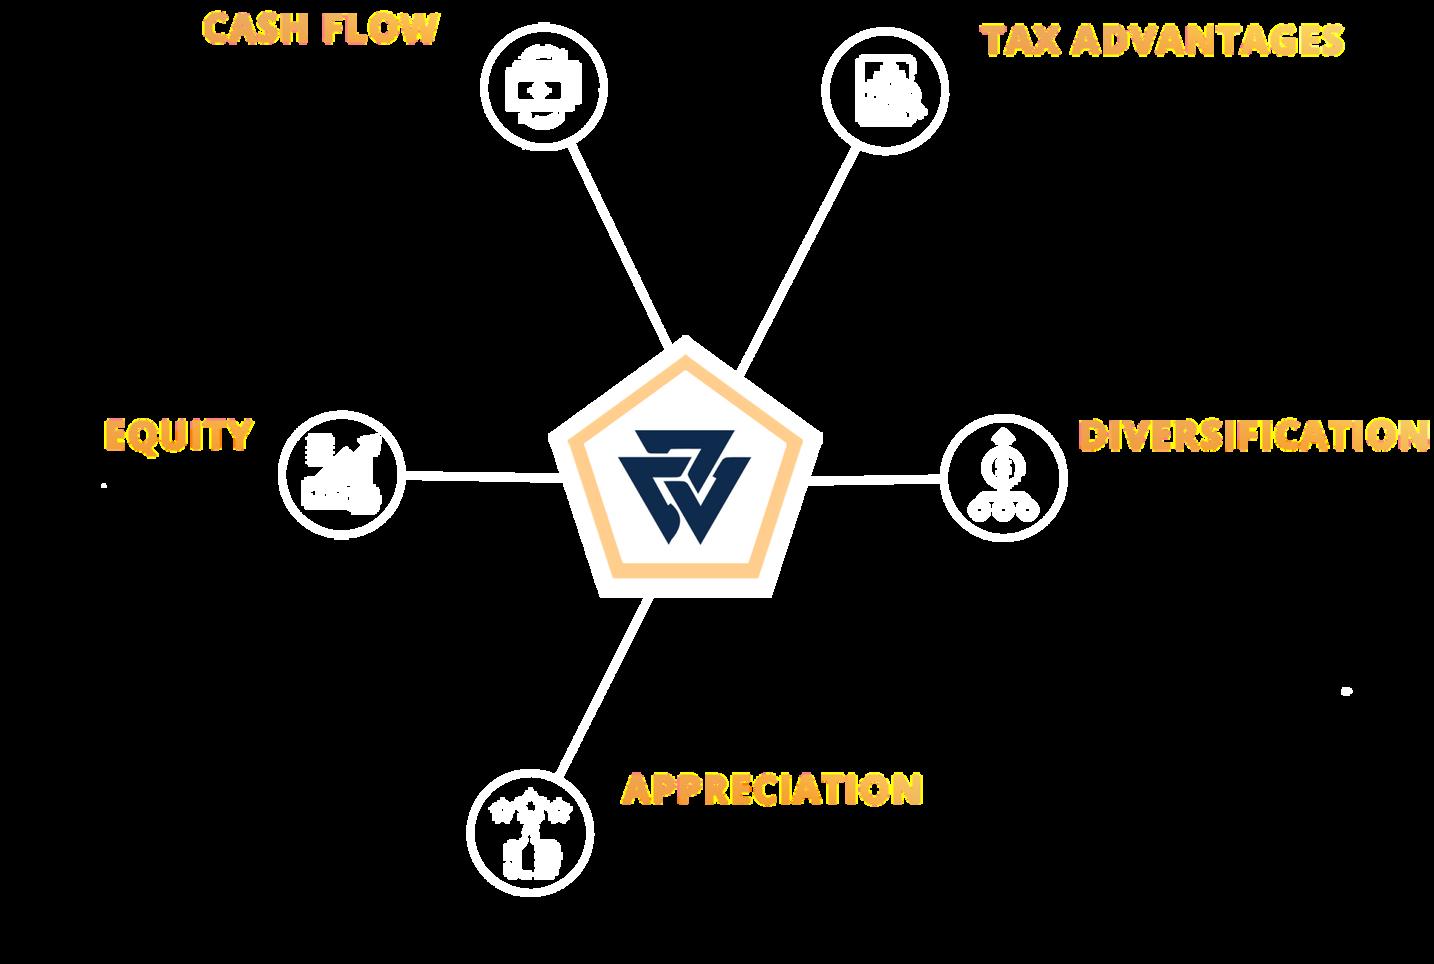
INVESTMENTsu
Viking Capital presents Villas at Sundanc generation multifamily asset built in 2012. Th New Braunfels, Texas, in the Texas Innova Interstate 35 between Austin and San Anton the "Third Fastest Growing City in the population growth of nearly 40% in five yea is driven by new major employers, enterta tourism. The New Braunfels submarket occupancy in the Austin-San Antonio MSA. This deal benefits from robust tenant deman growth and a low-cost basis. With minimal n
Viking Capital secured this asset at a s positioning this property as an exce opportunity.


CAP RATE(T-12) EXPENSE RATIO (T12) PHYSICAL OCCUPANCY DSCR YR 1 DSCR AVG. PURCHASE PRICE HOLD PERIOD EQUITY LP CLASS A LP CLASS B RESERVE CLASS 5.0% 55% 93% 1.63 1.75 $37,350,000 5 YEARS $19,995,774 $2,000,000 $13,000,000 $5,000,000
OFFERING summary

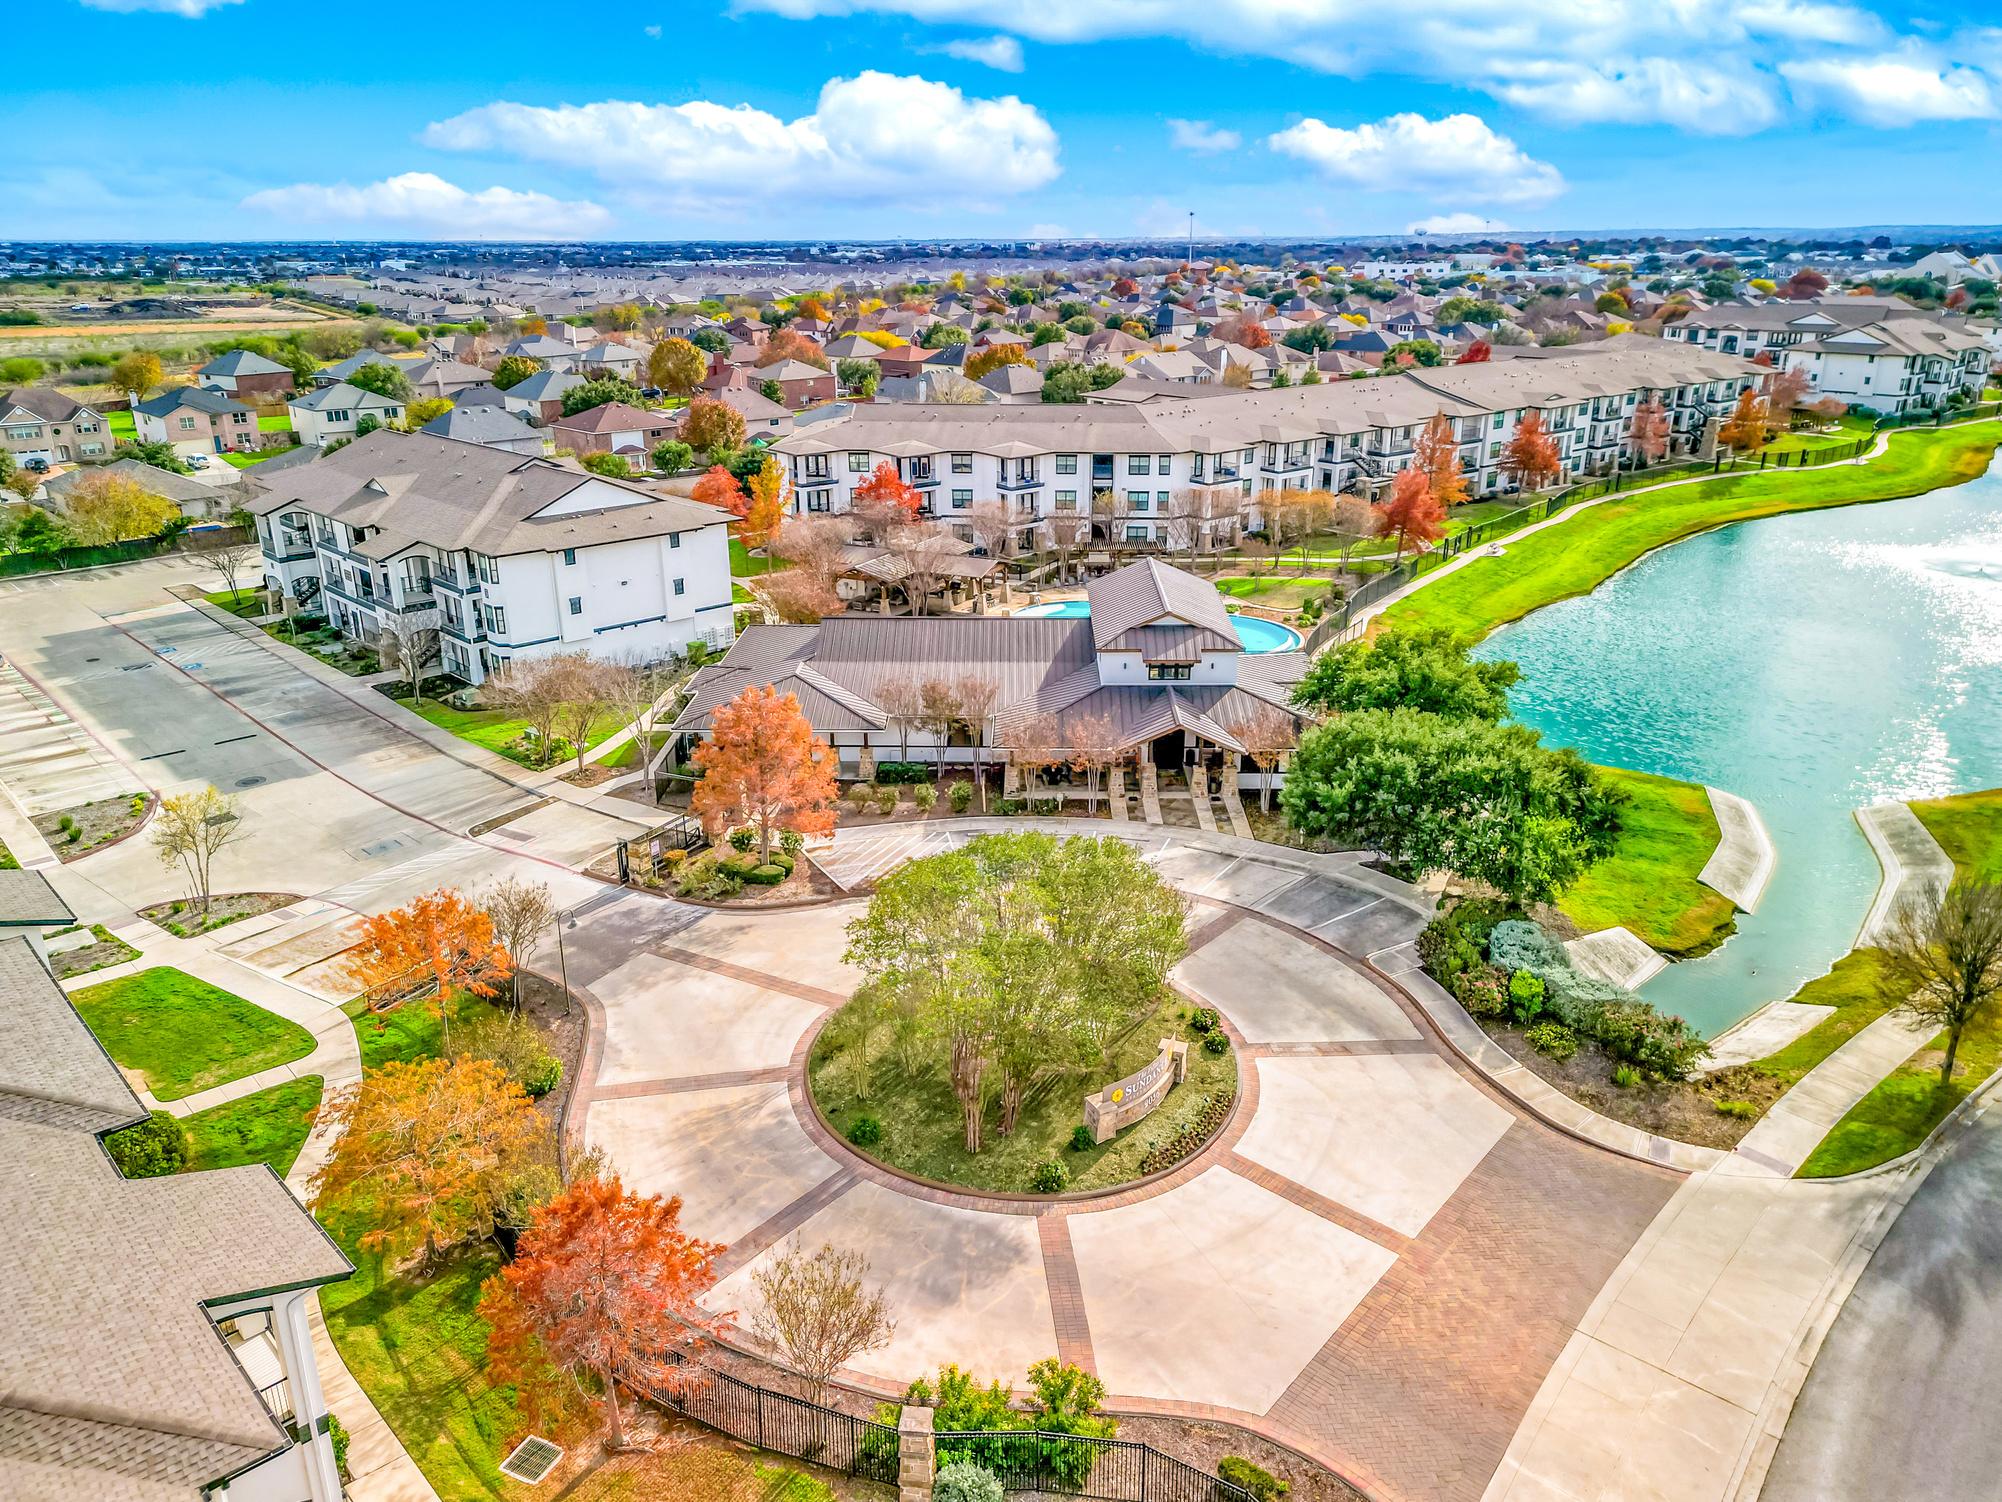
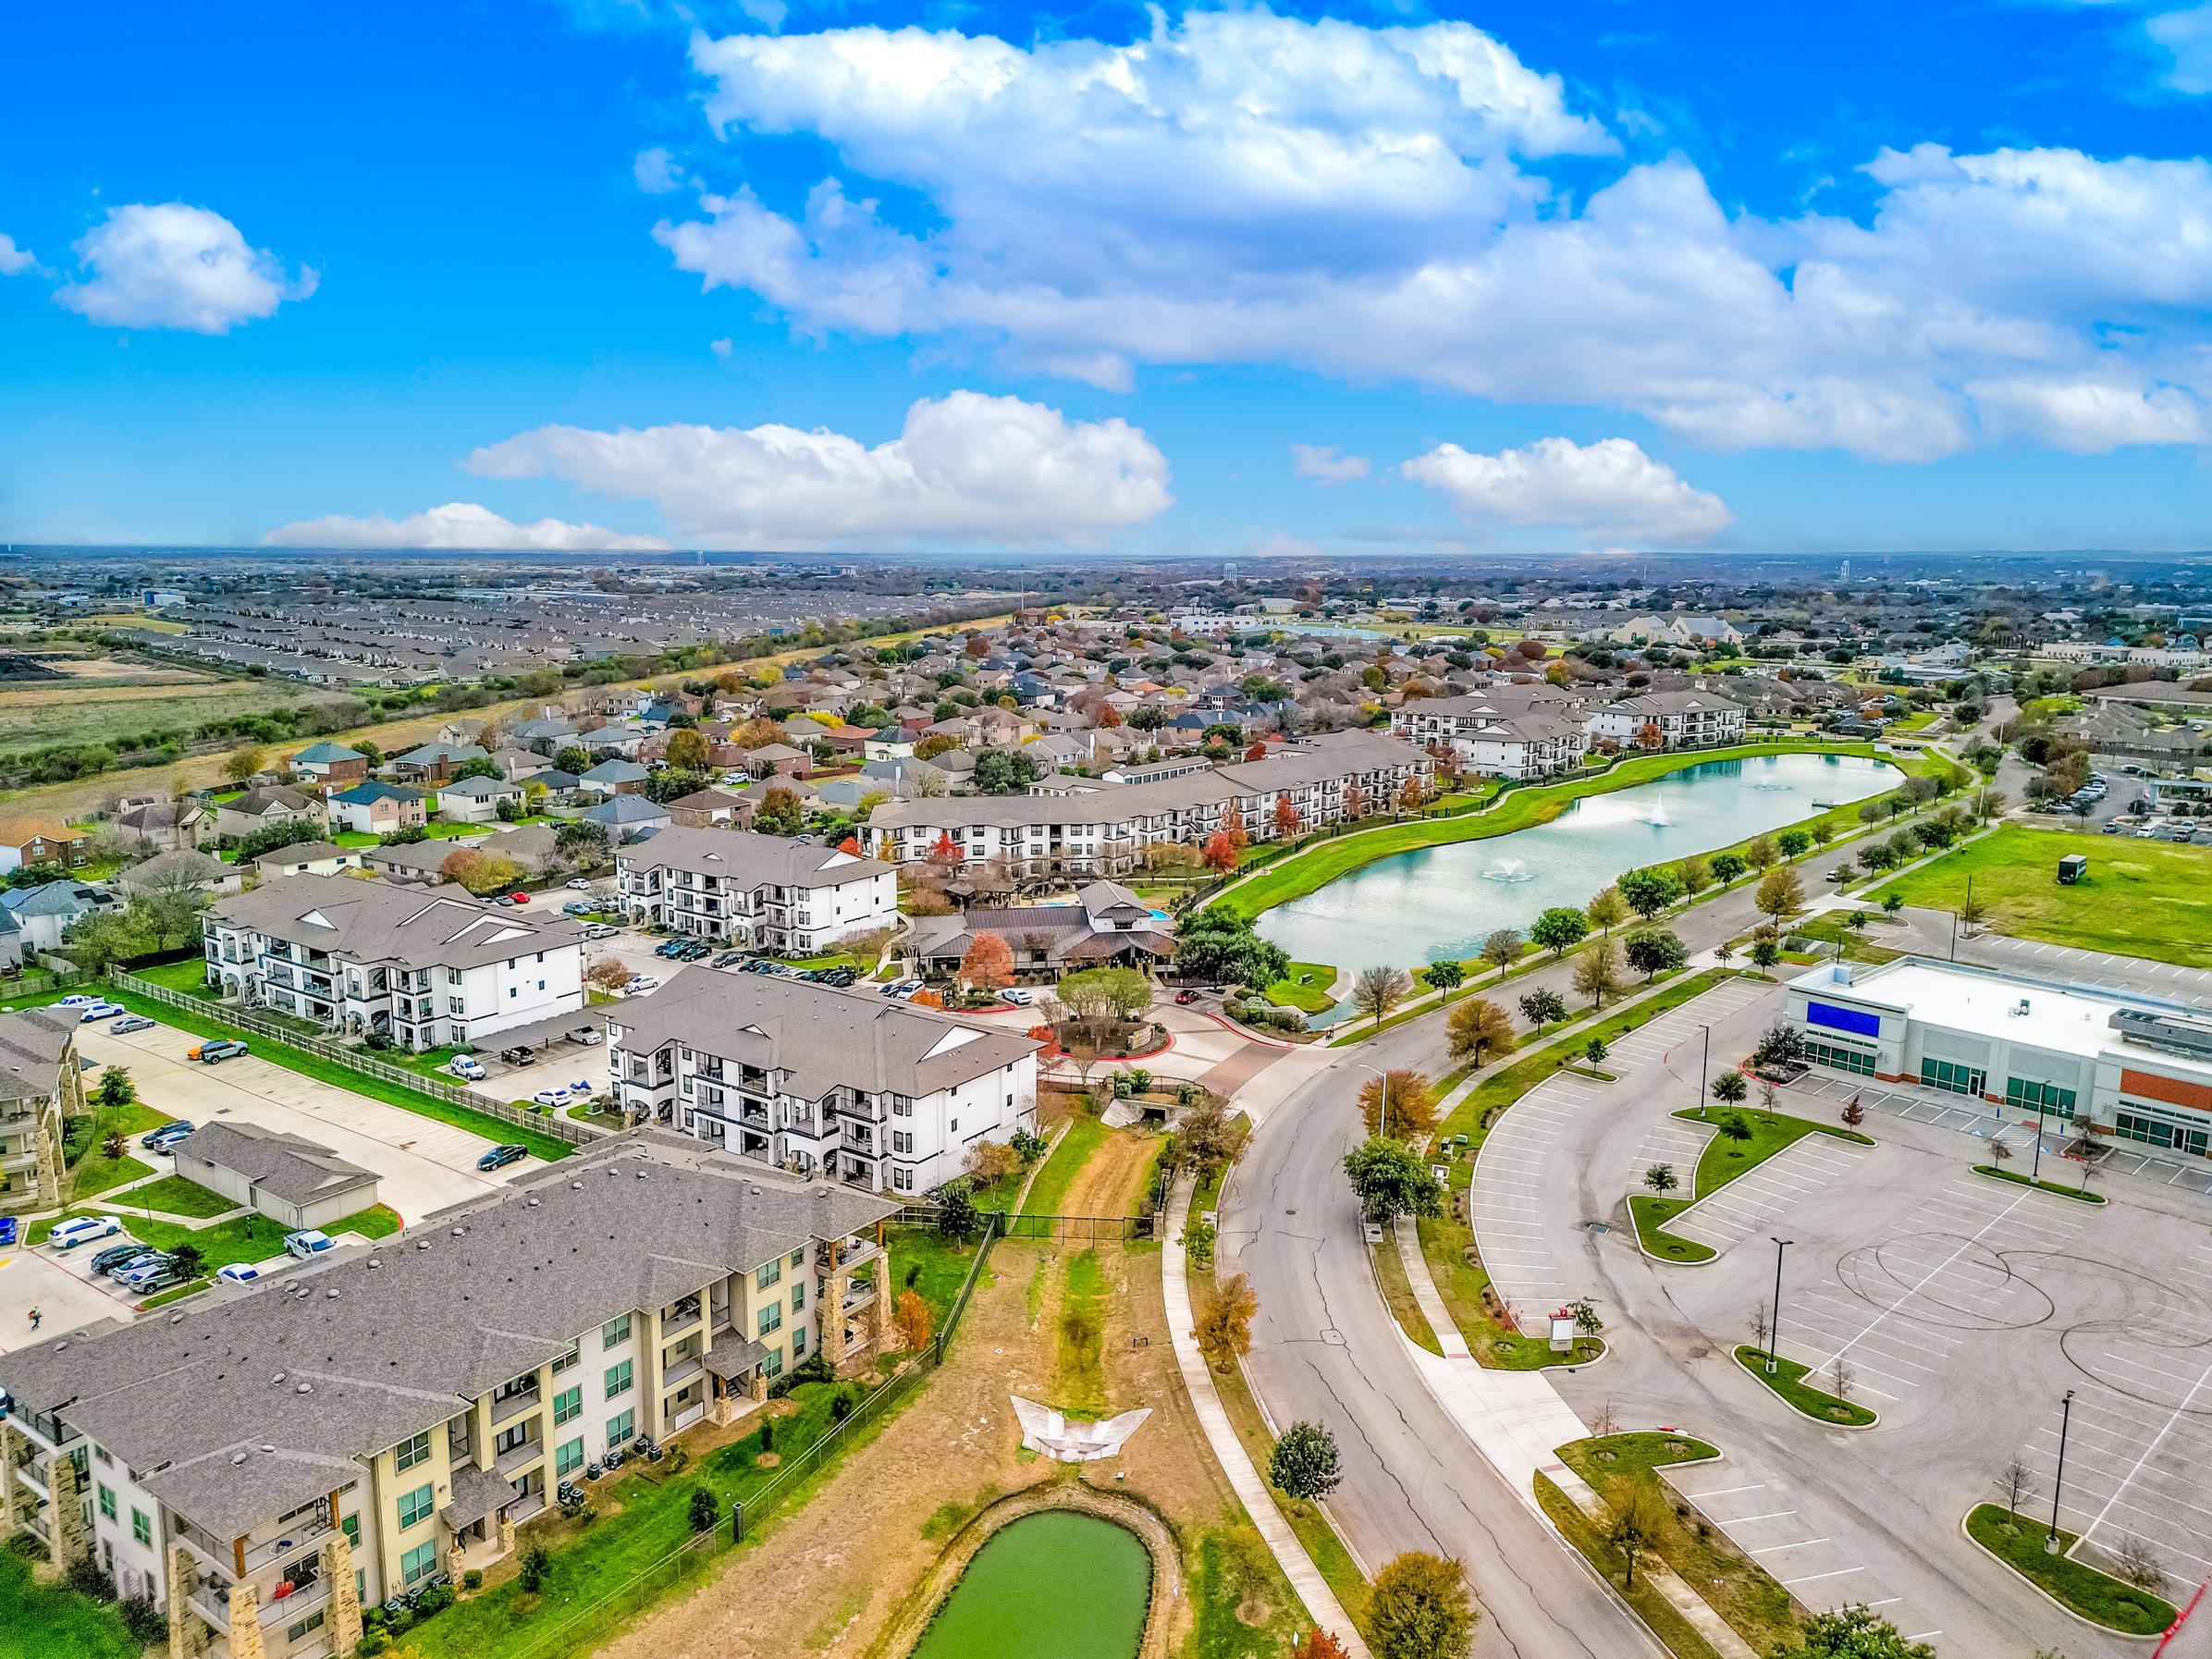
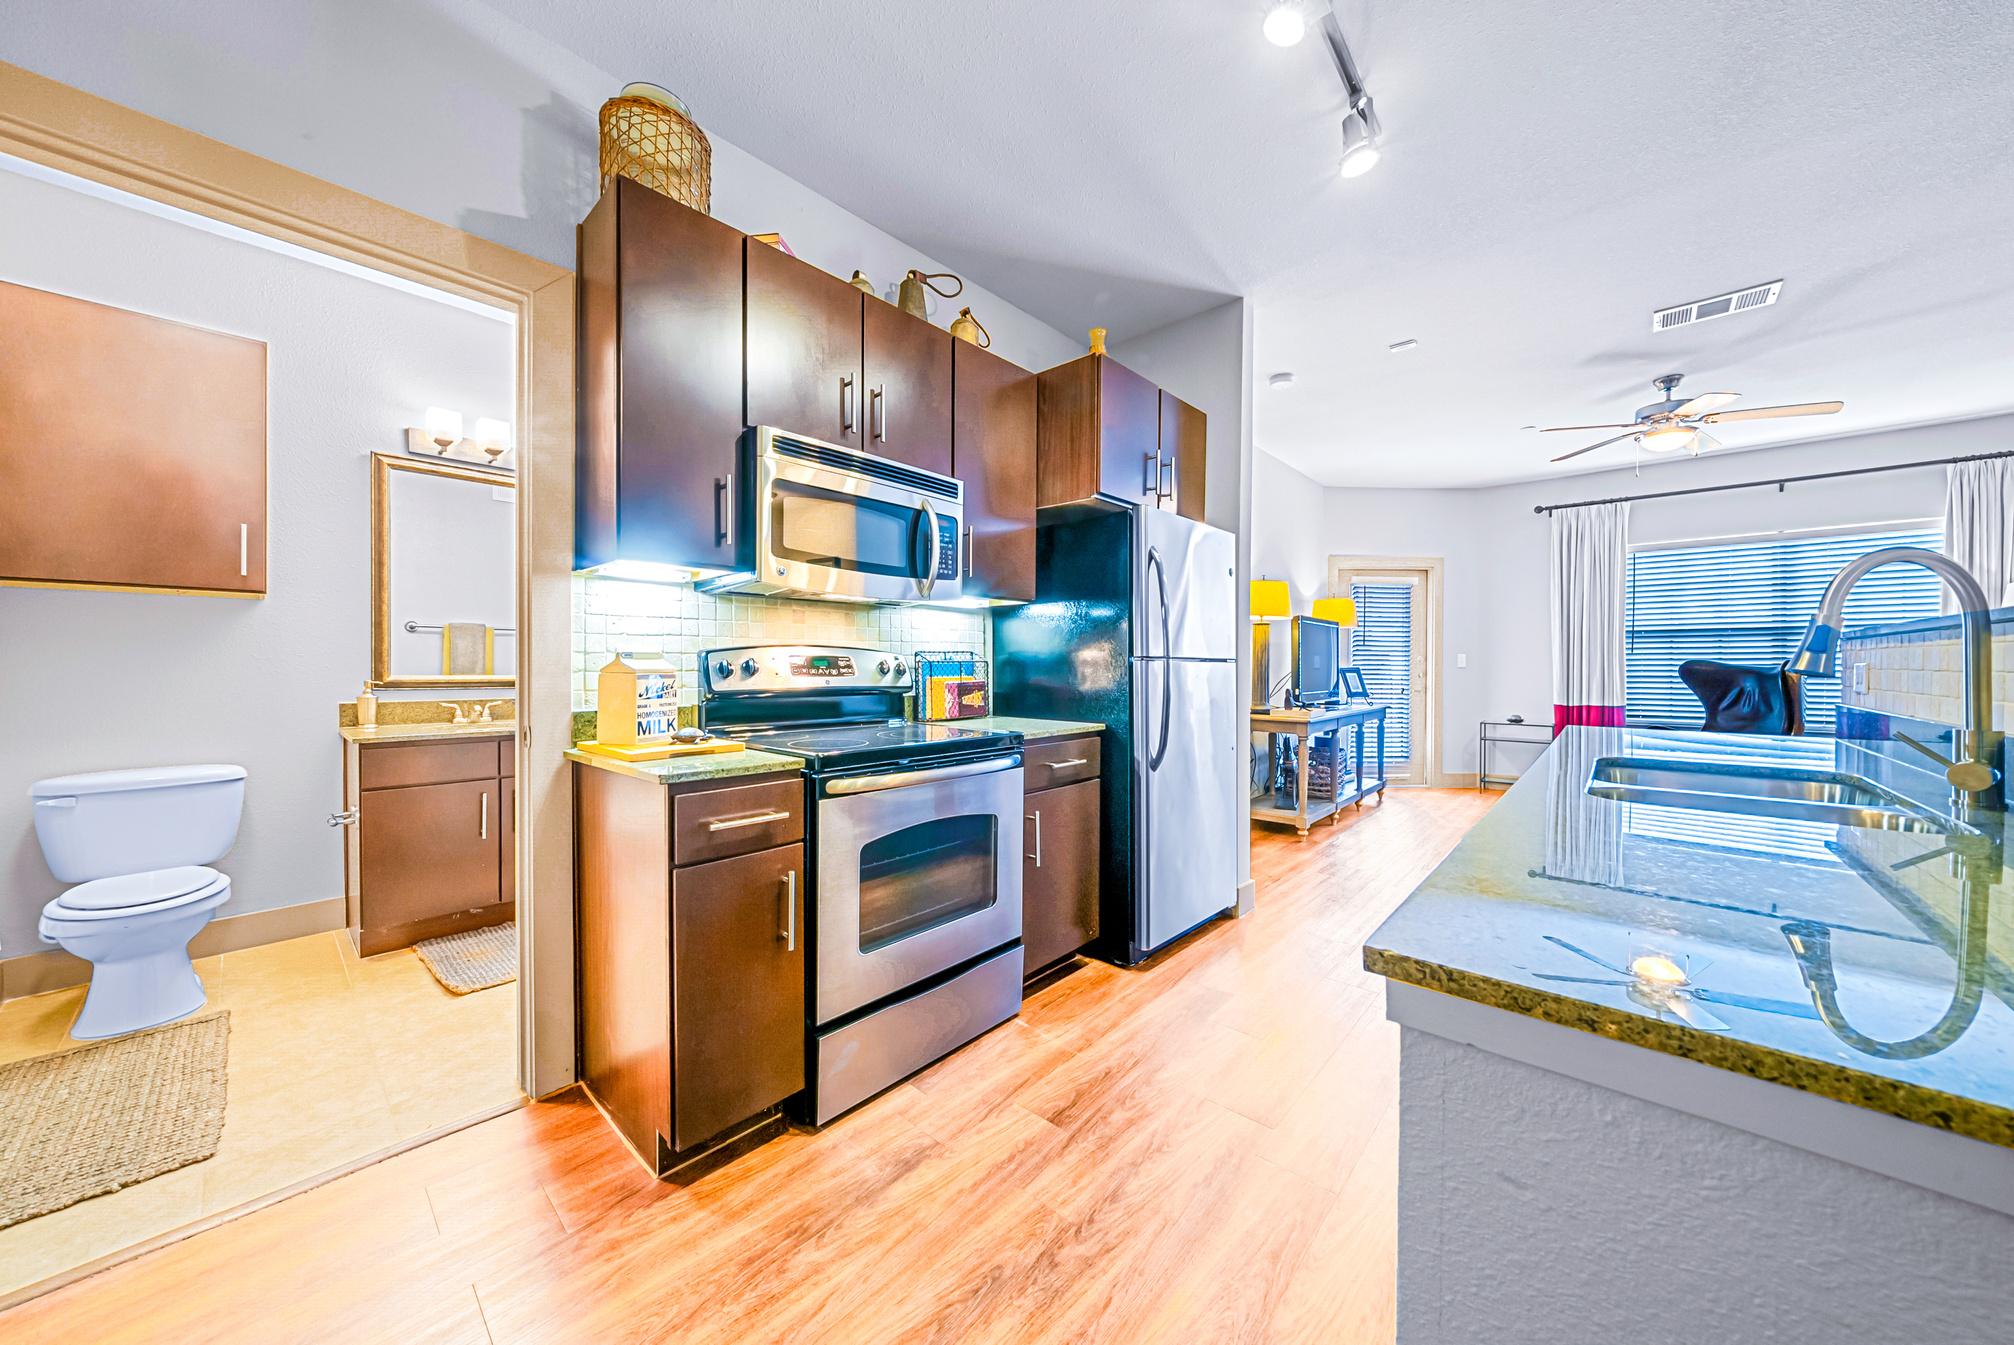
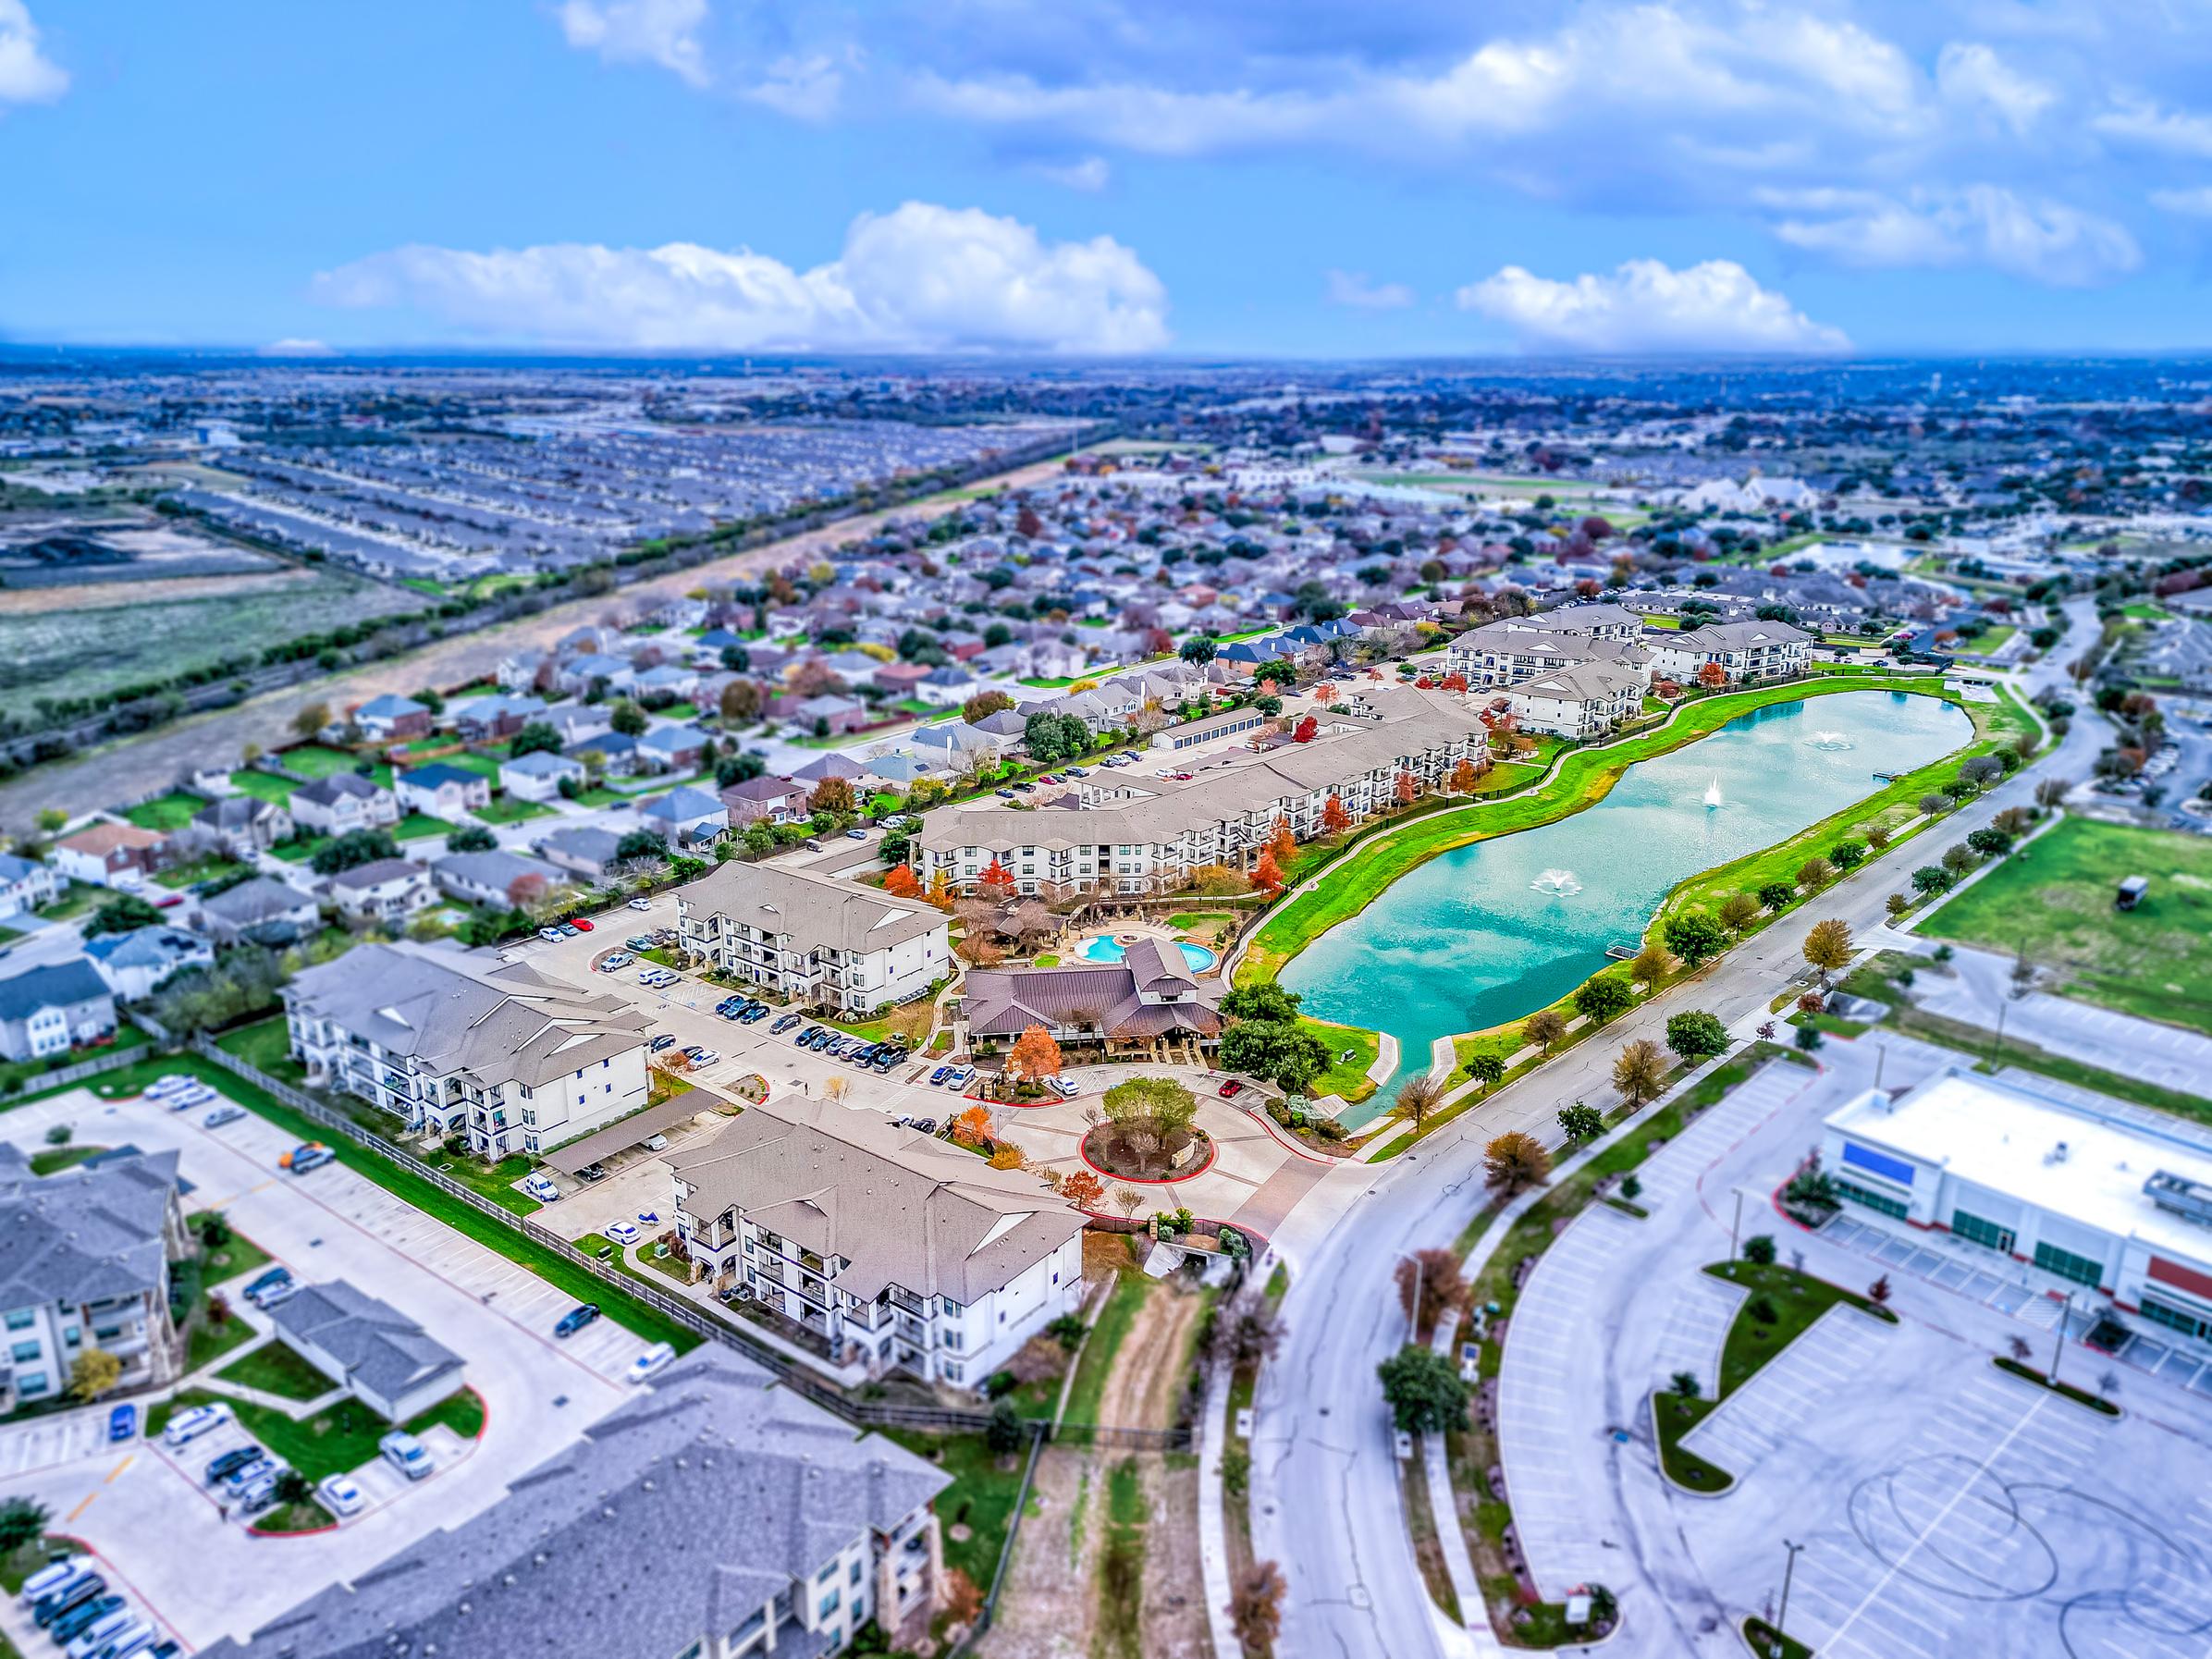
Austin,Tx 252 UNITS 2012 YEAR BUILT 931 AVG UNIT SF 234,666 RENTABLE SF 21.8 UNITS PER ACRE 11.5 ACRES 9 8 RESIDENTIAL 1 CLUBHOUSE BUILDINGS: 26 ON SITE & PARKING: DETACHED GARAGES 50 CARPORTS PROPERTYsummary


A S S E T
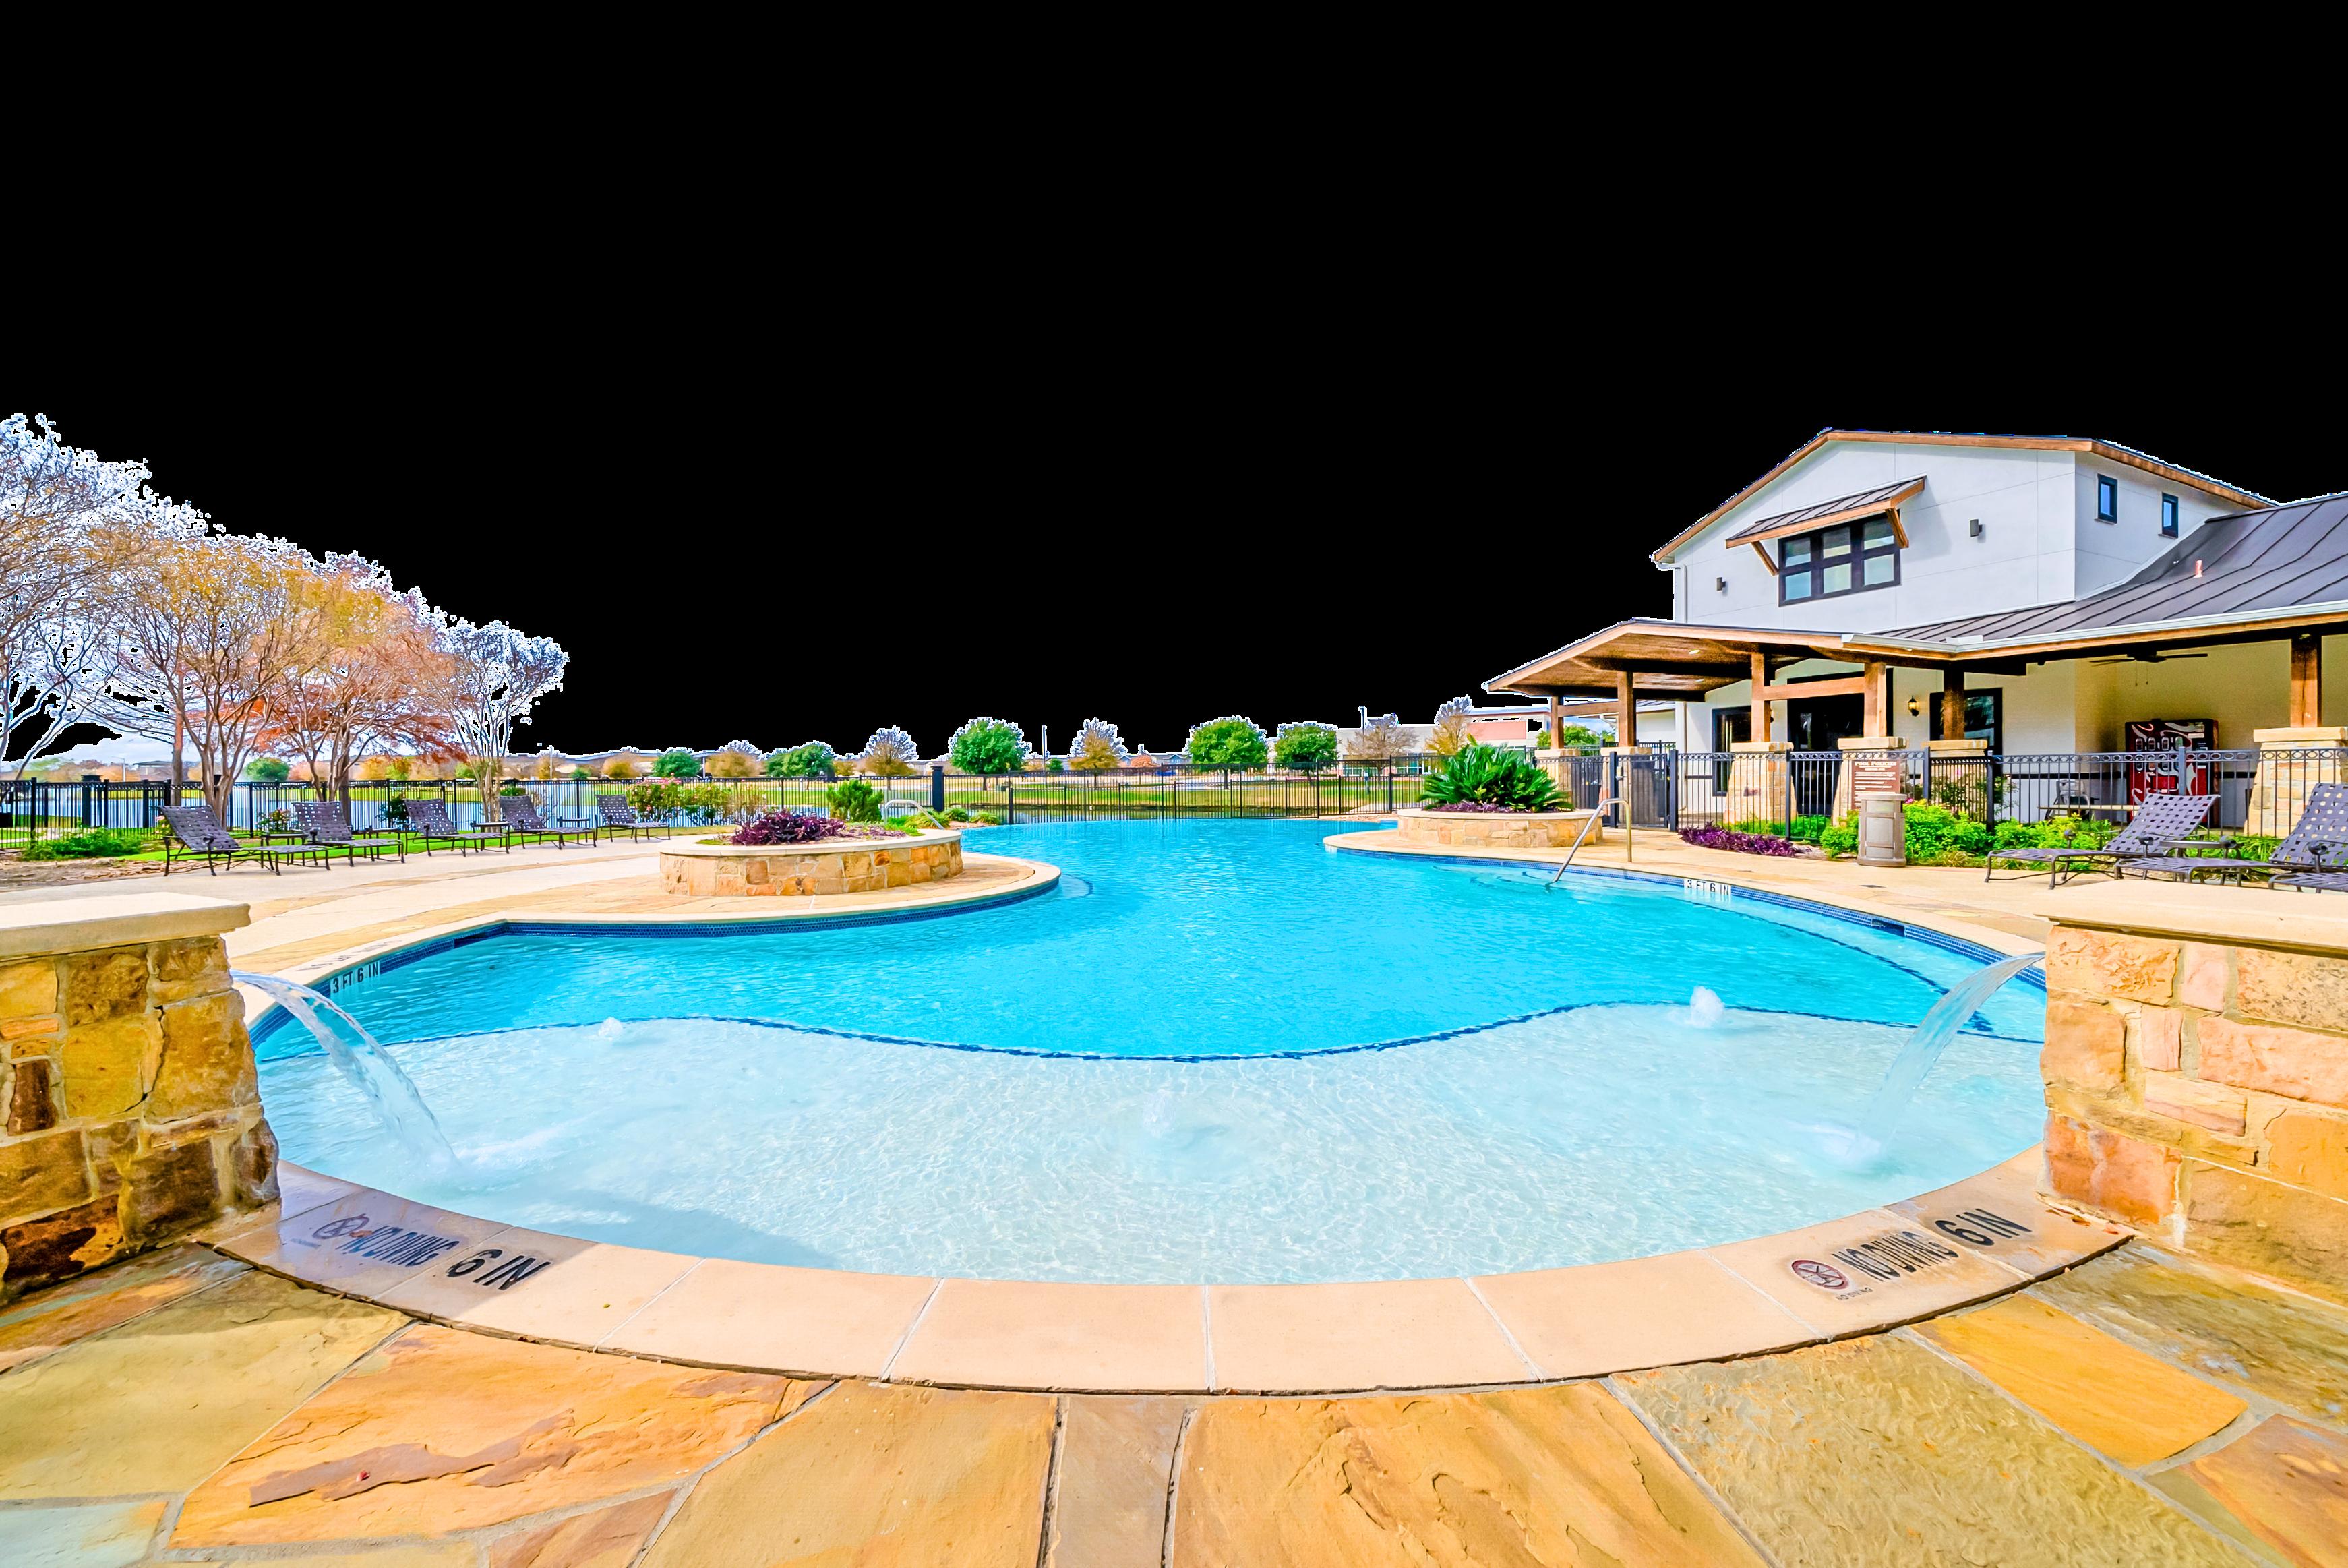
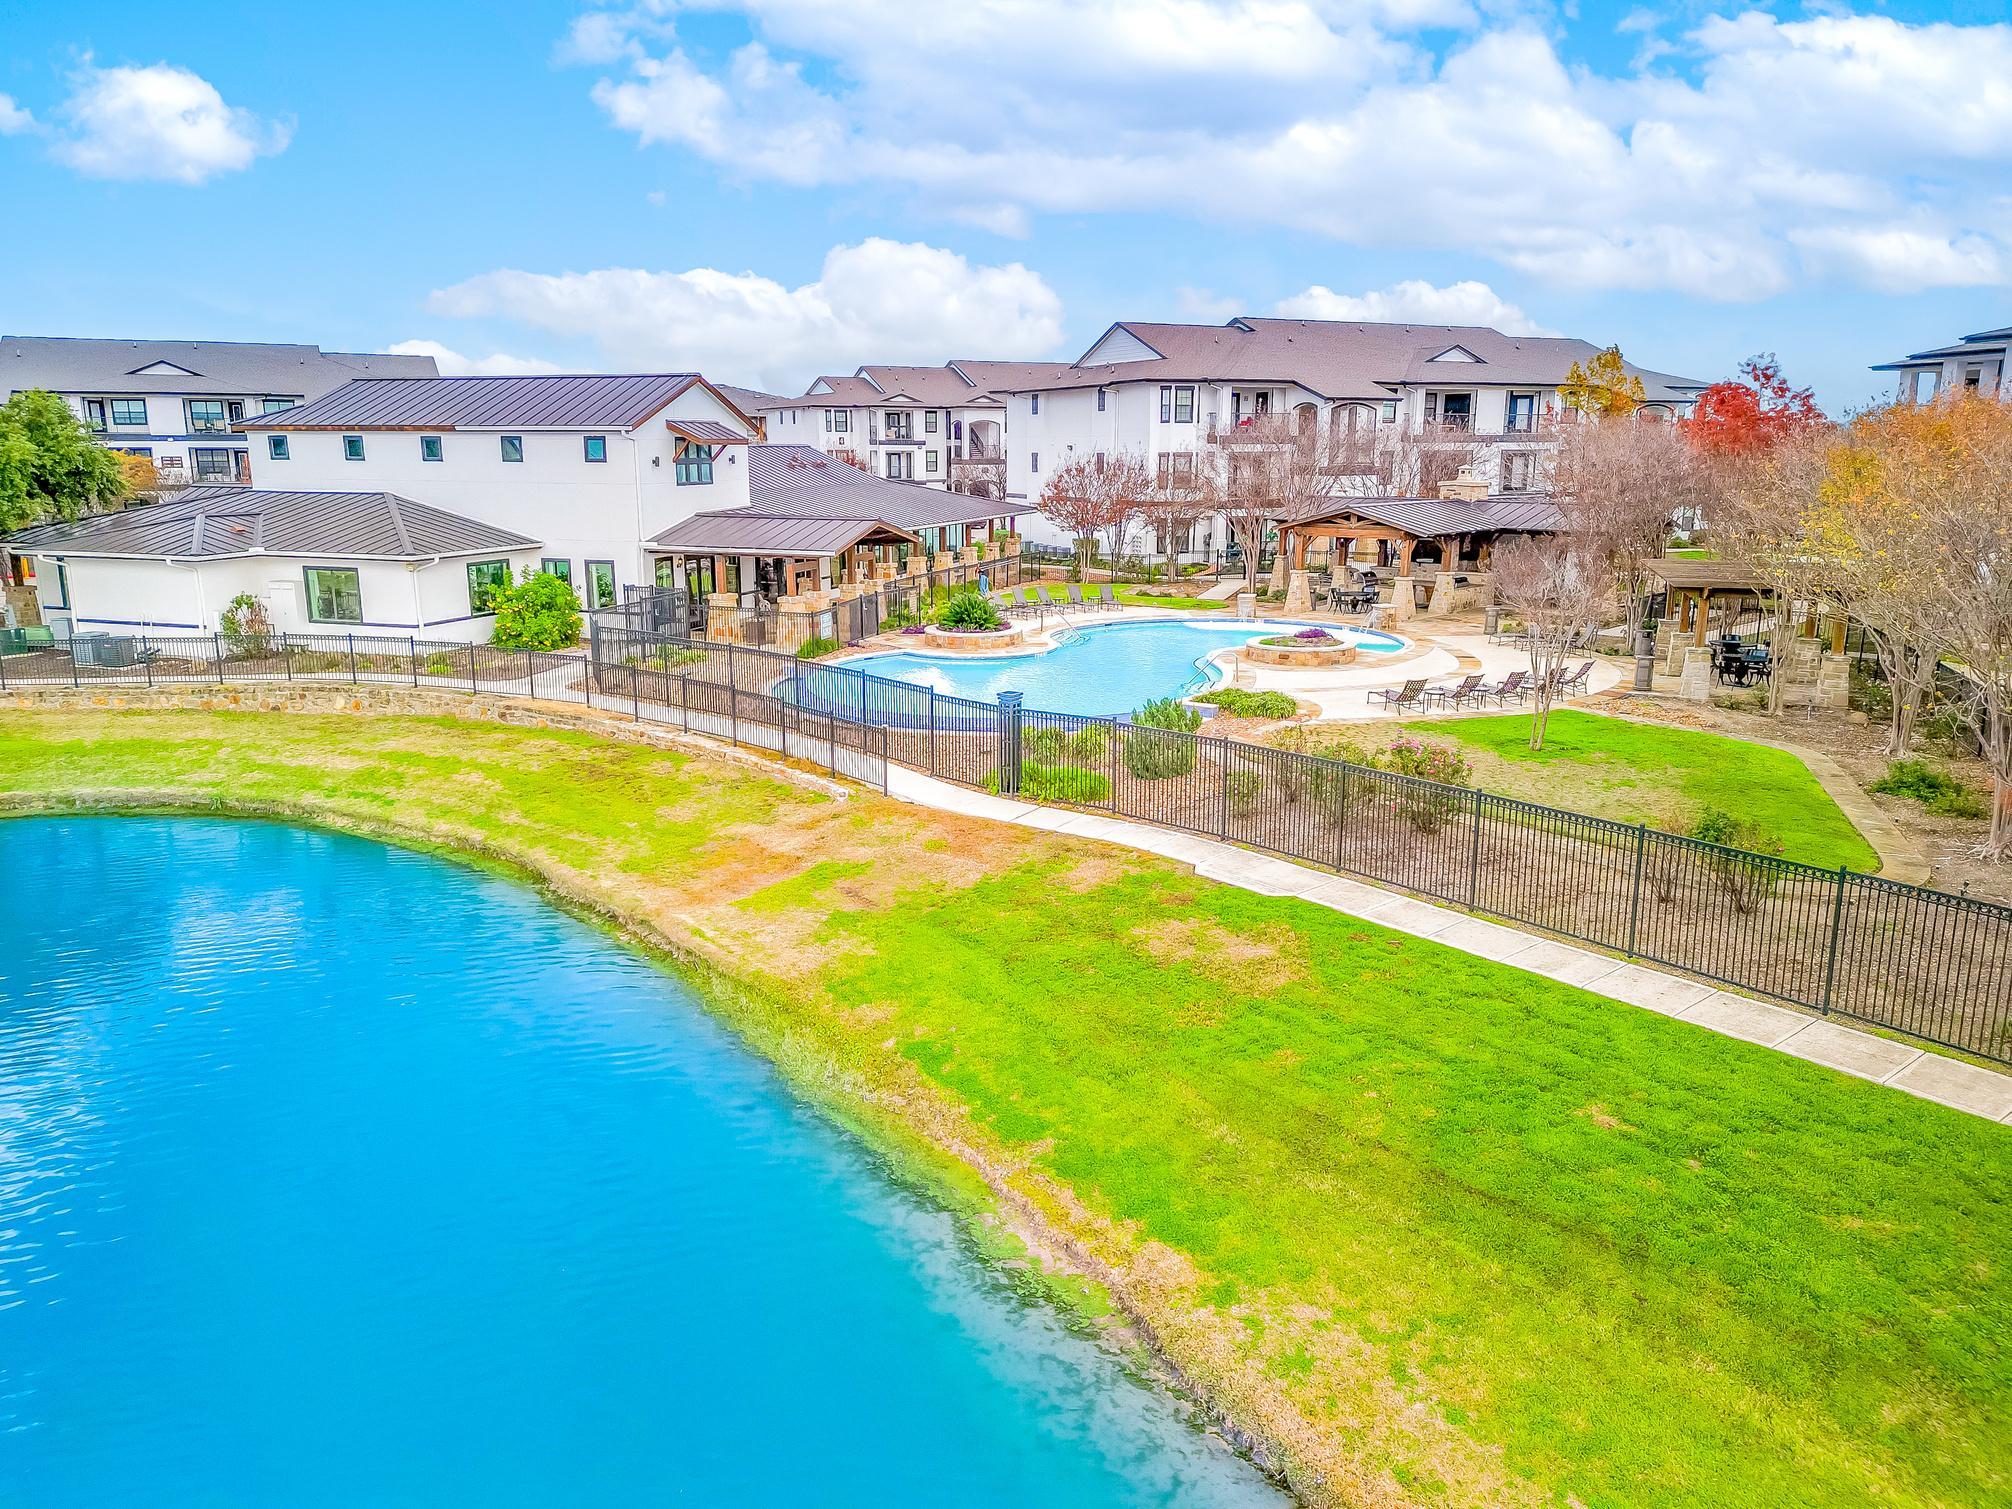
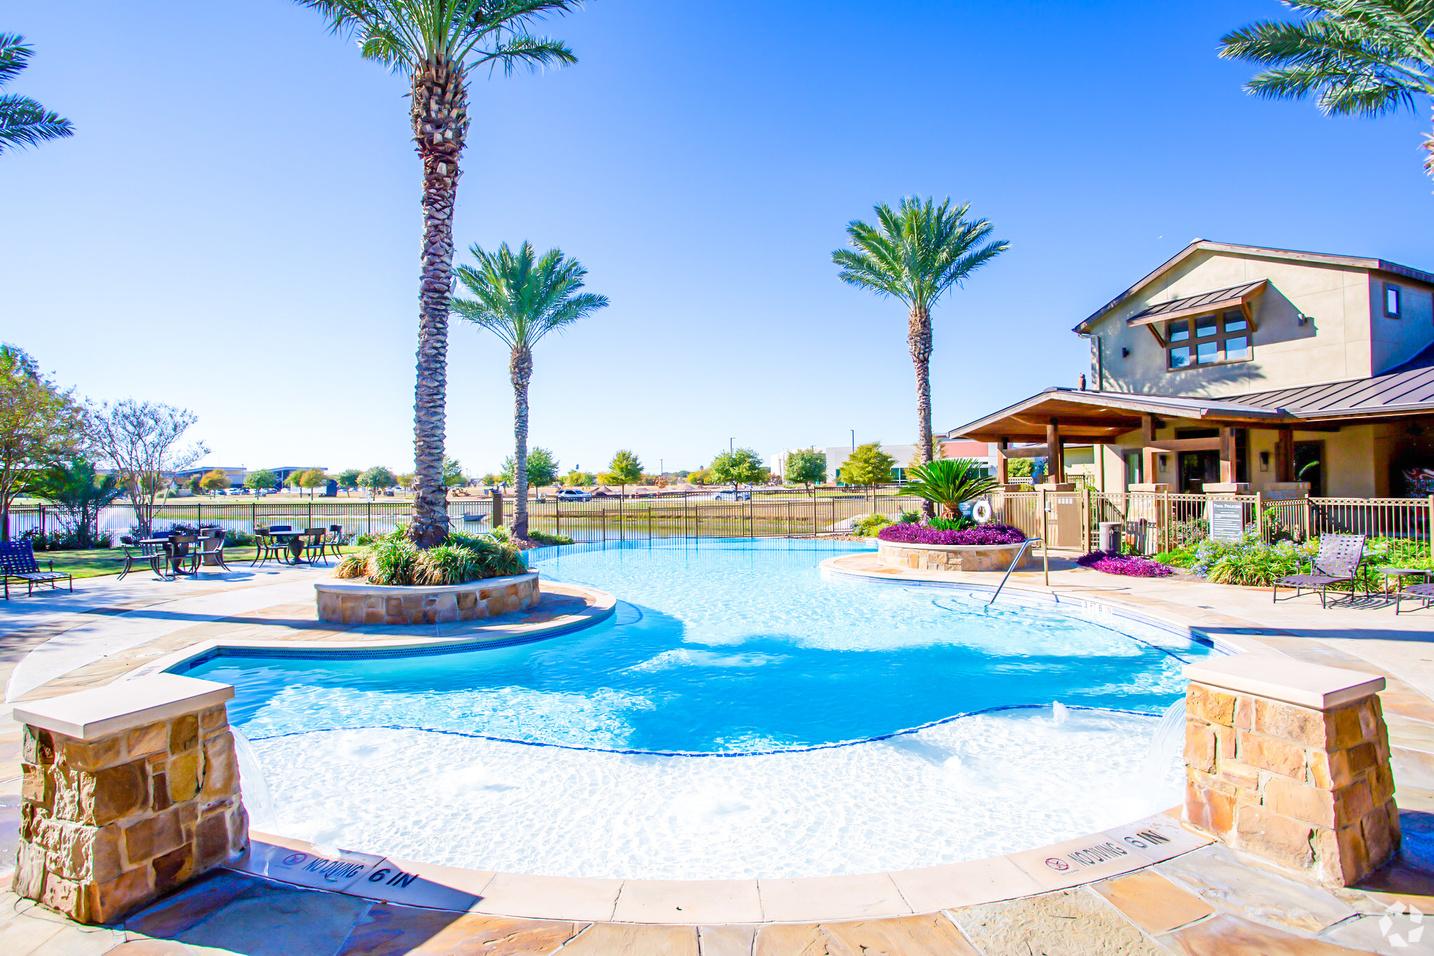
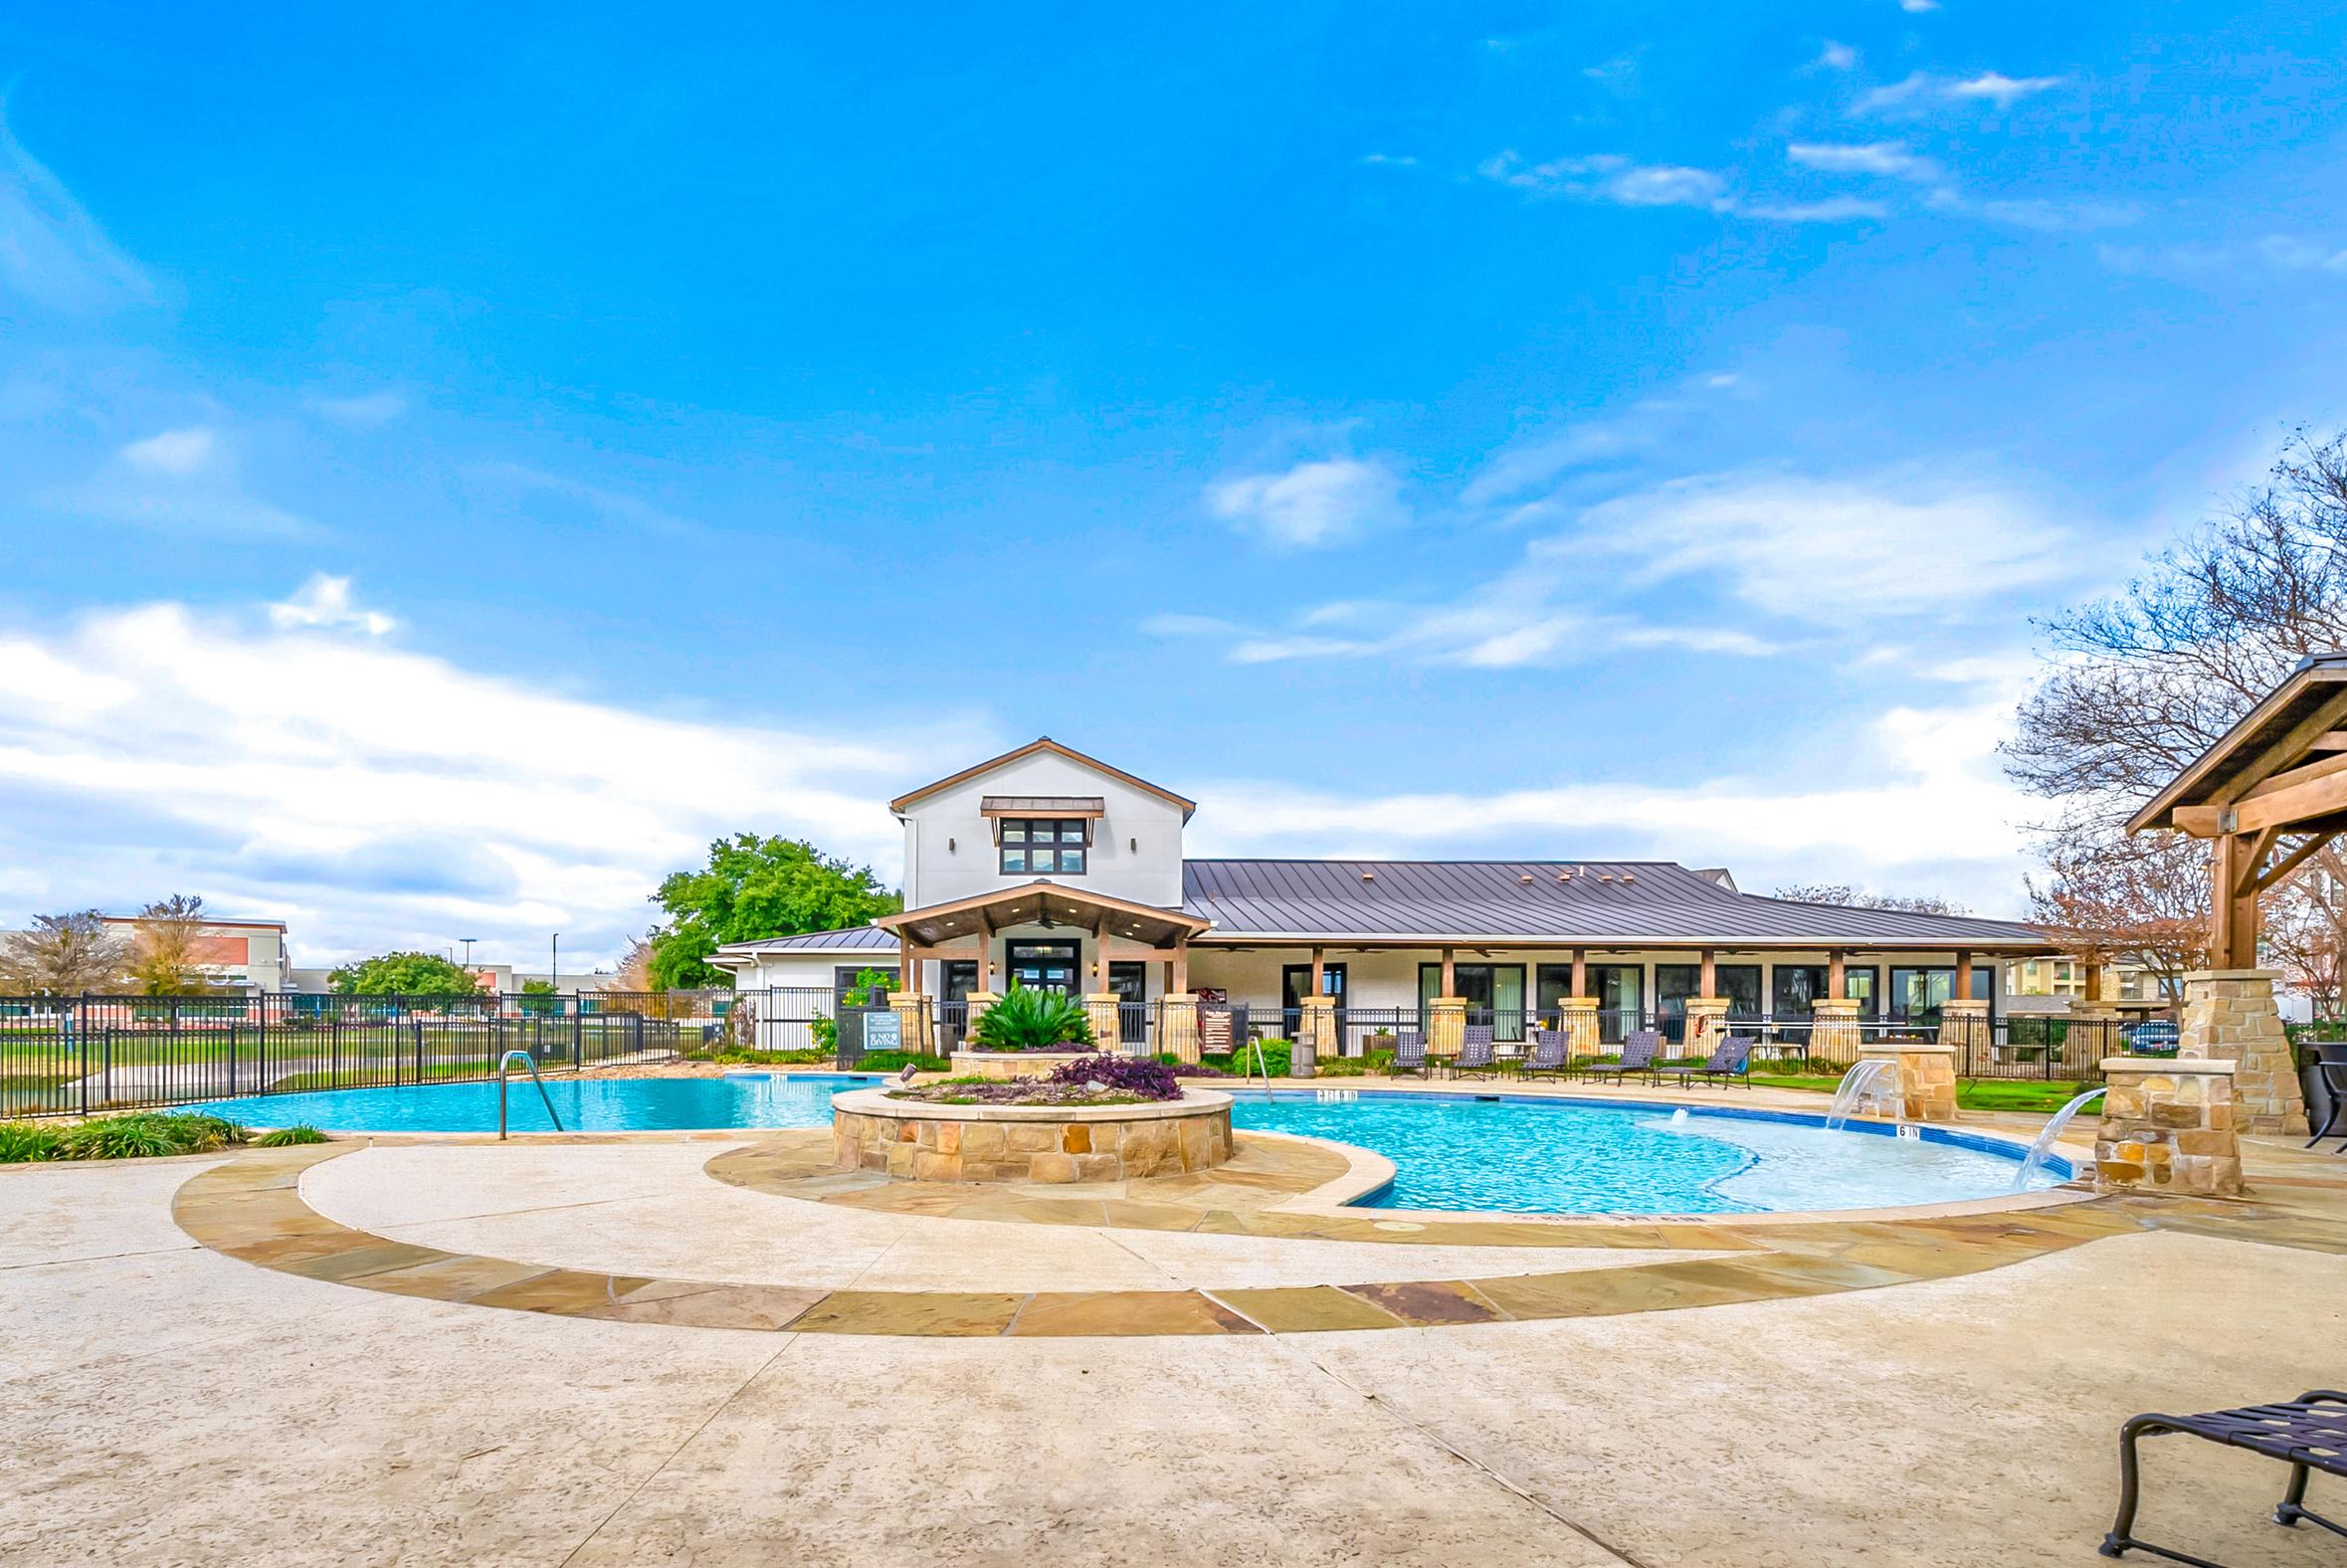
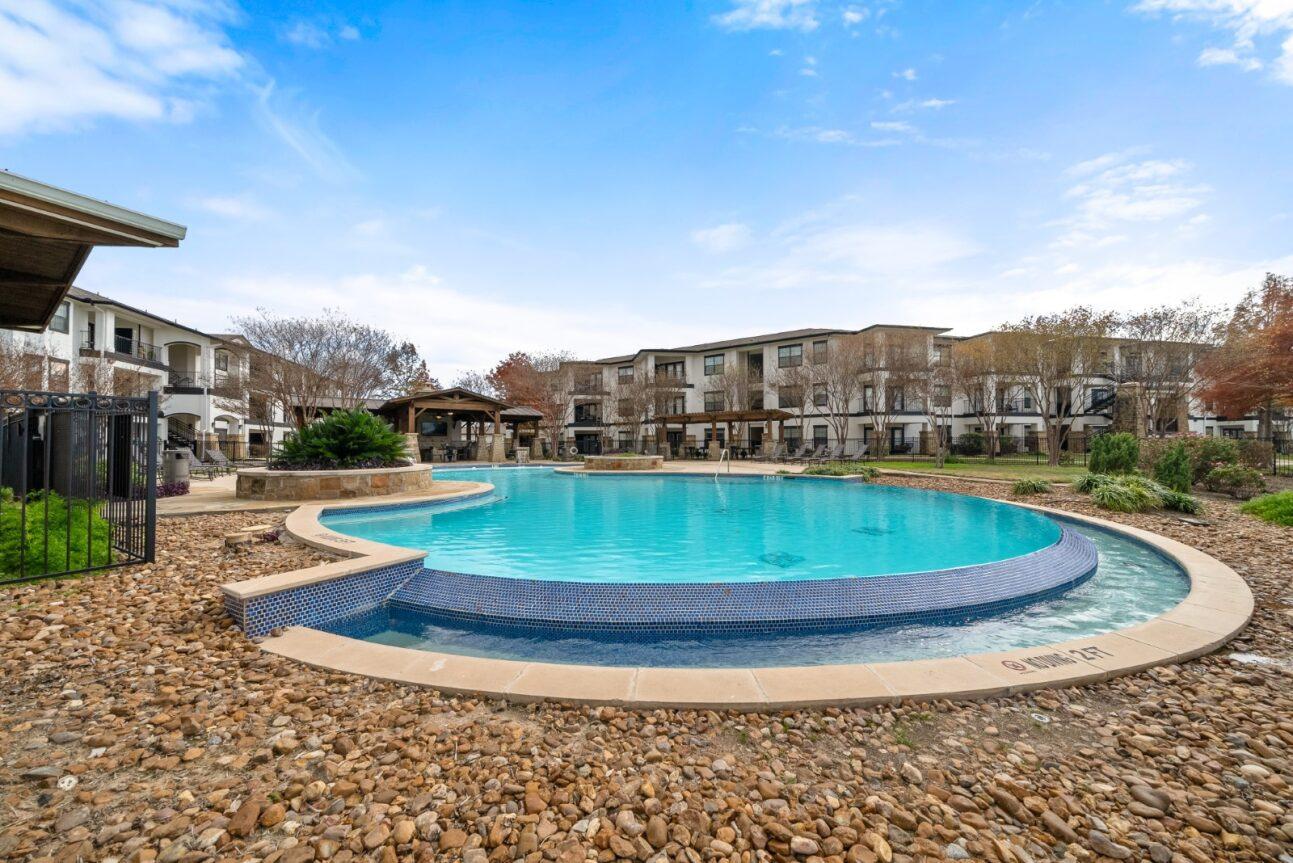
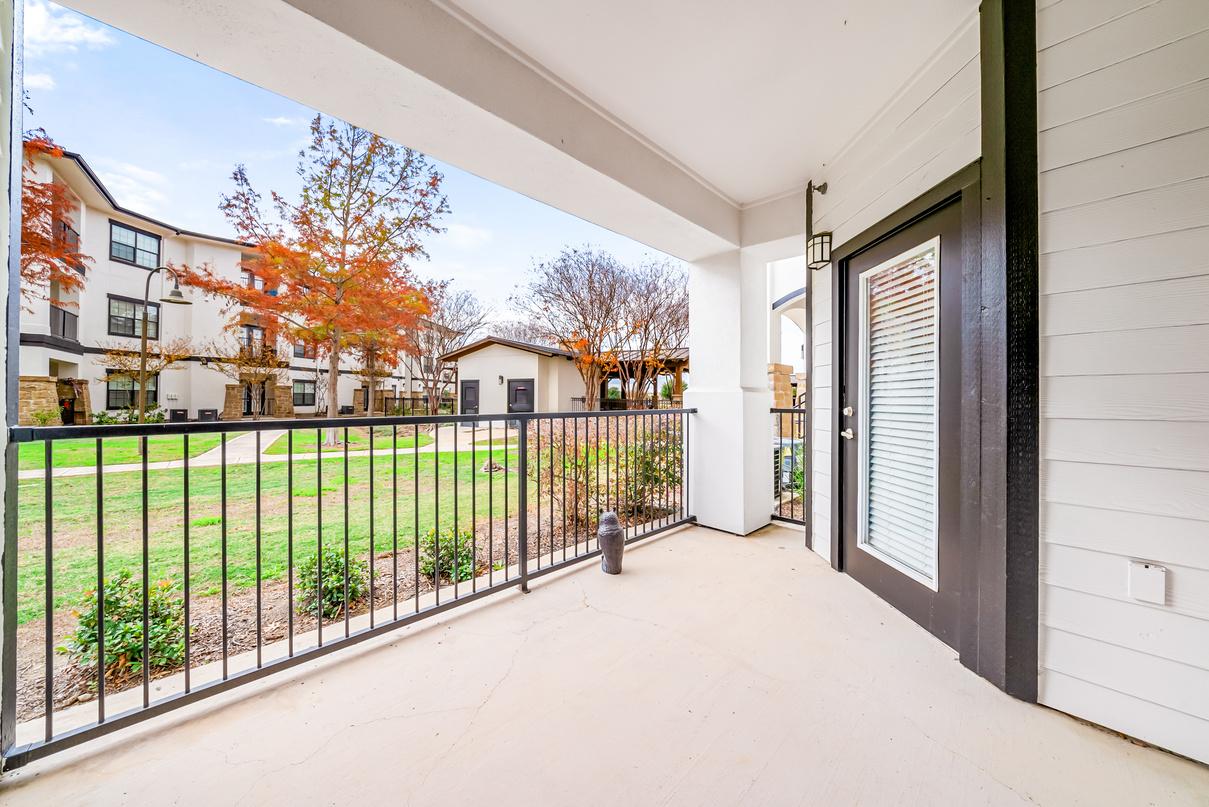
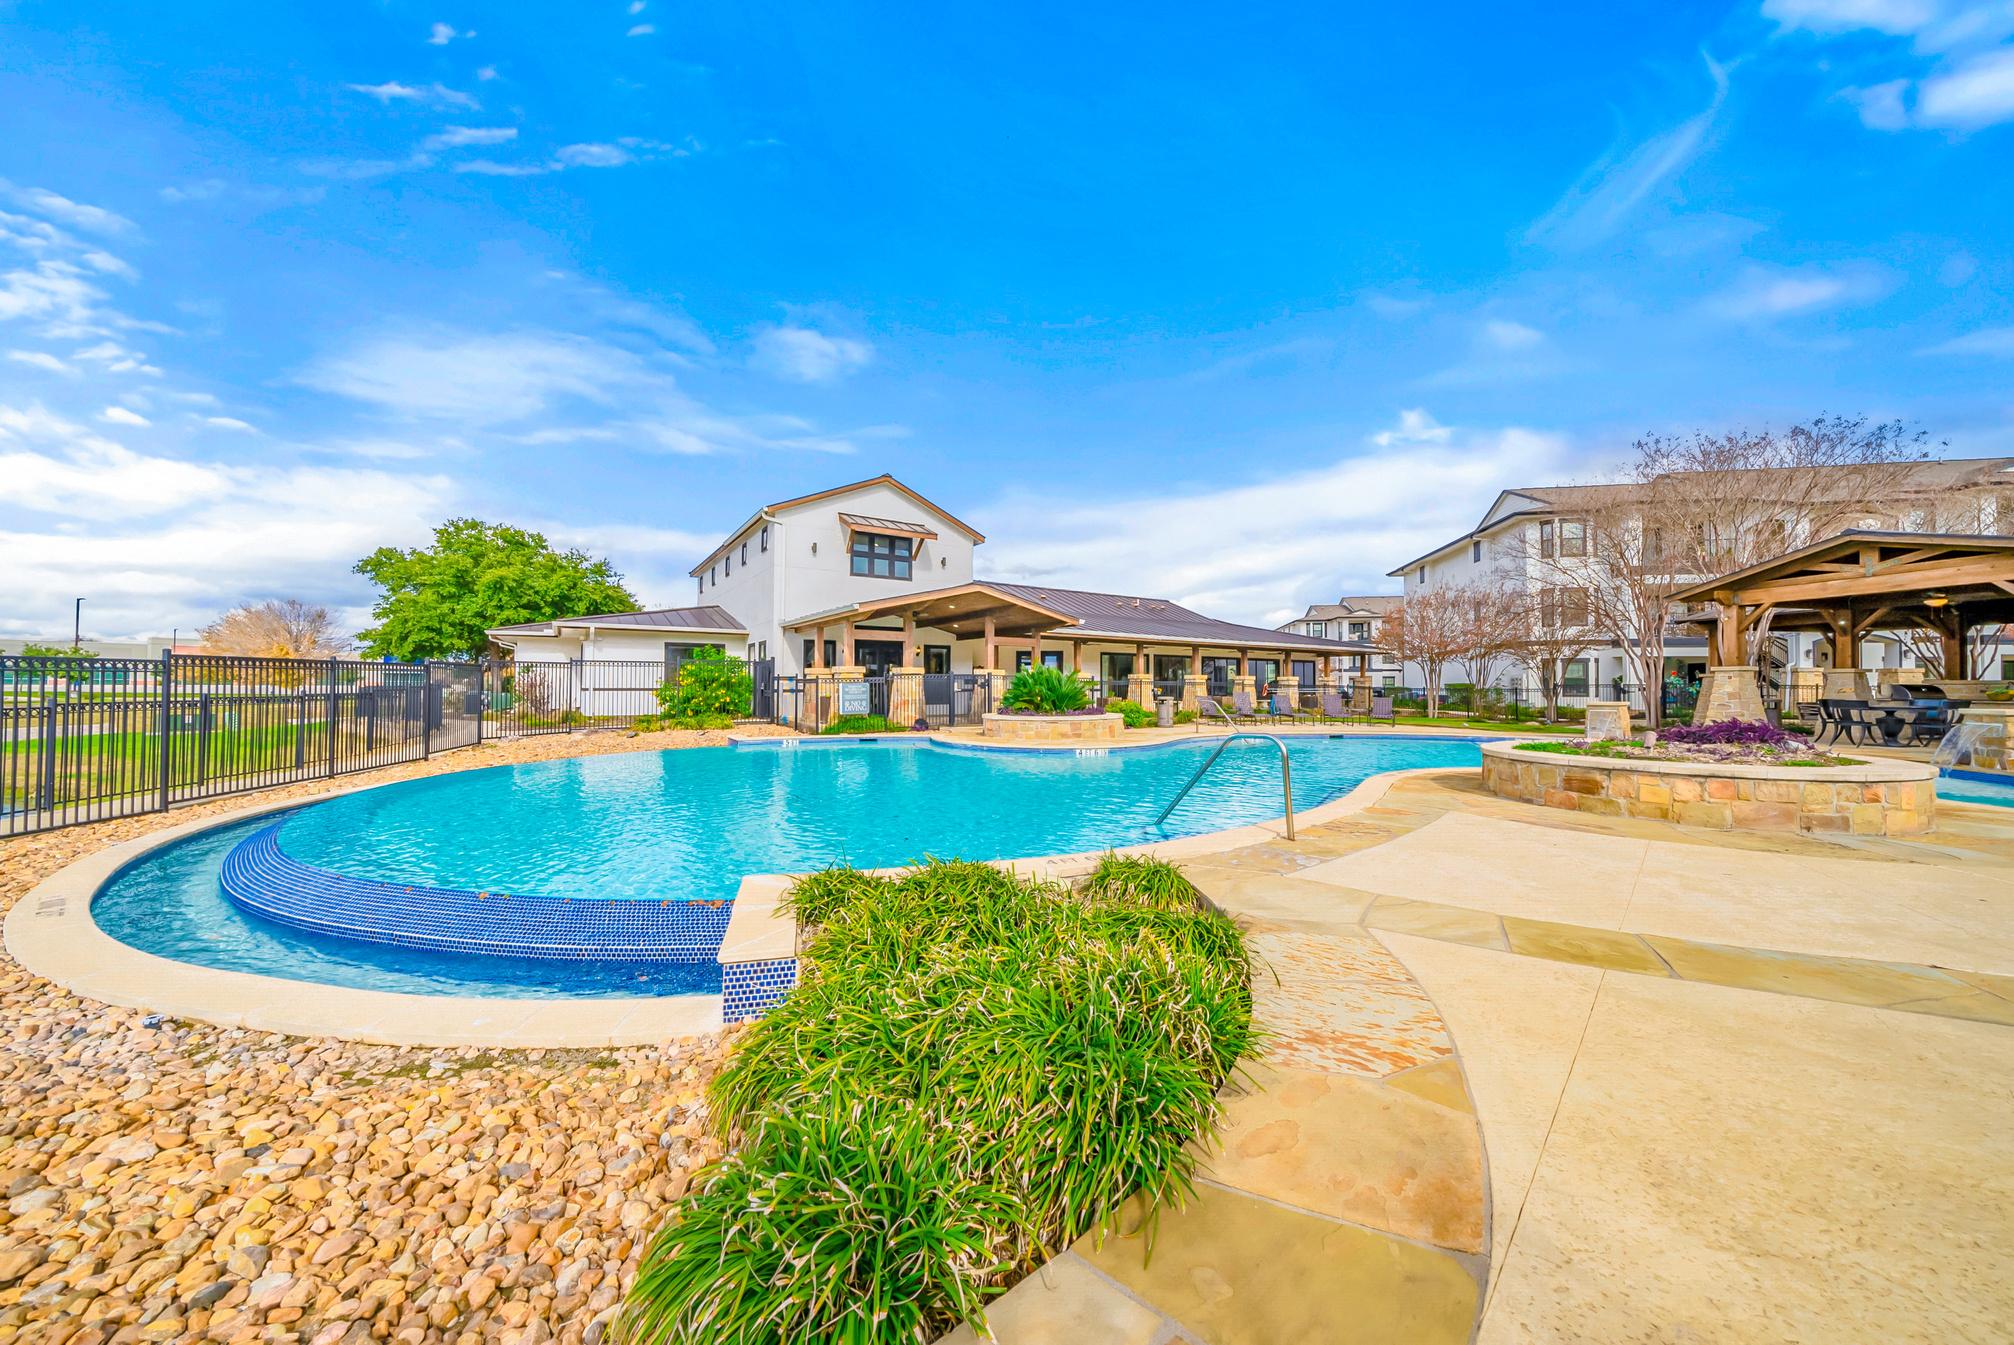
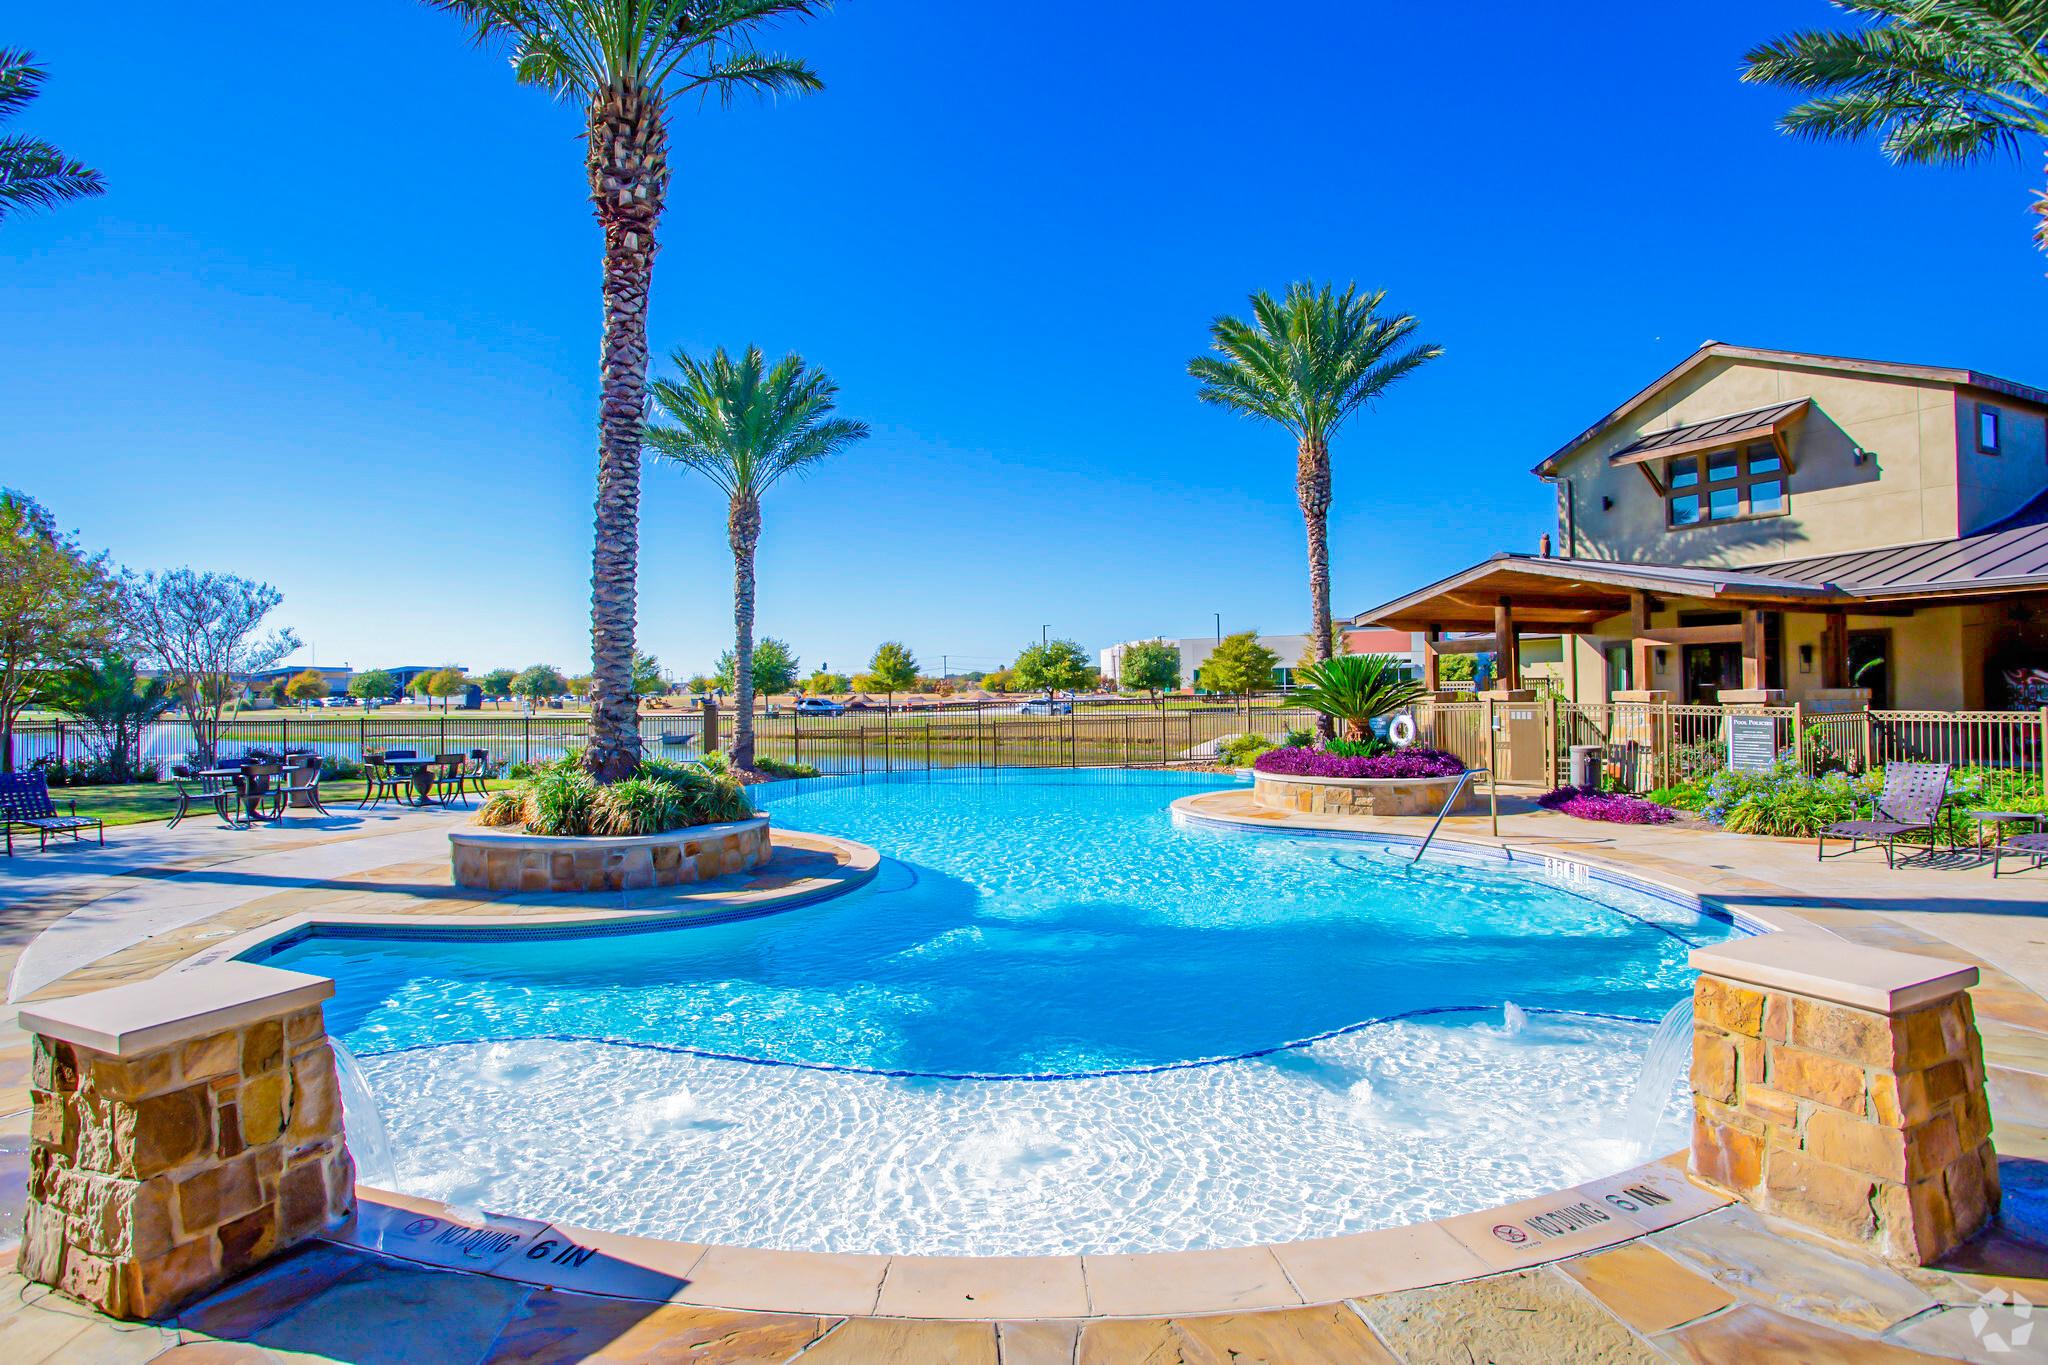
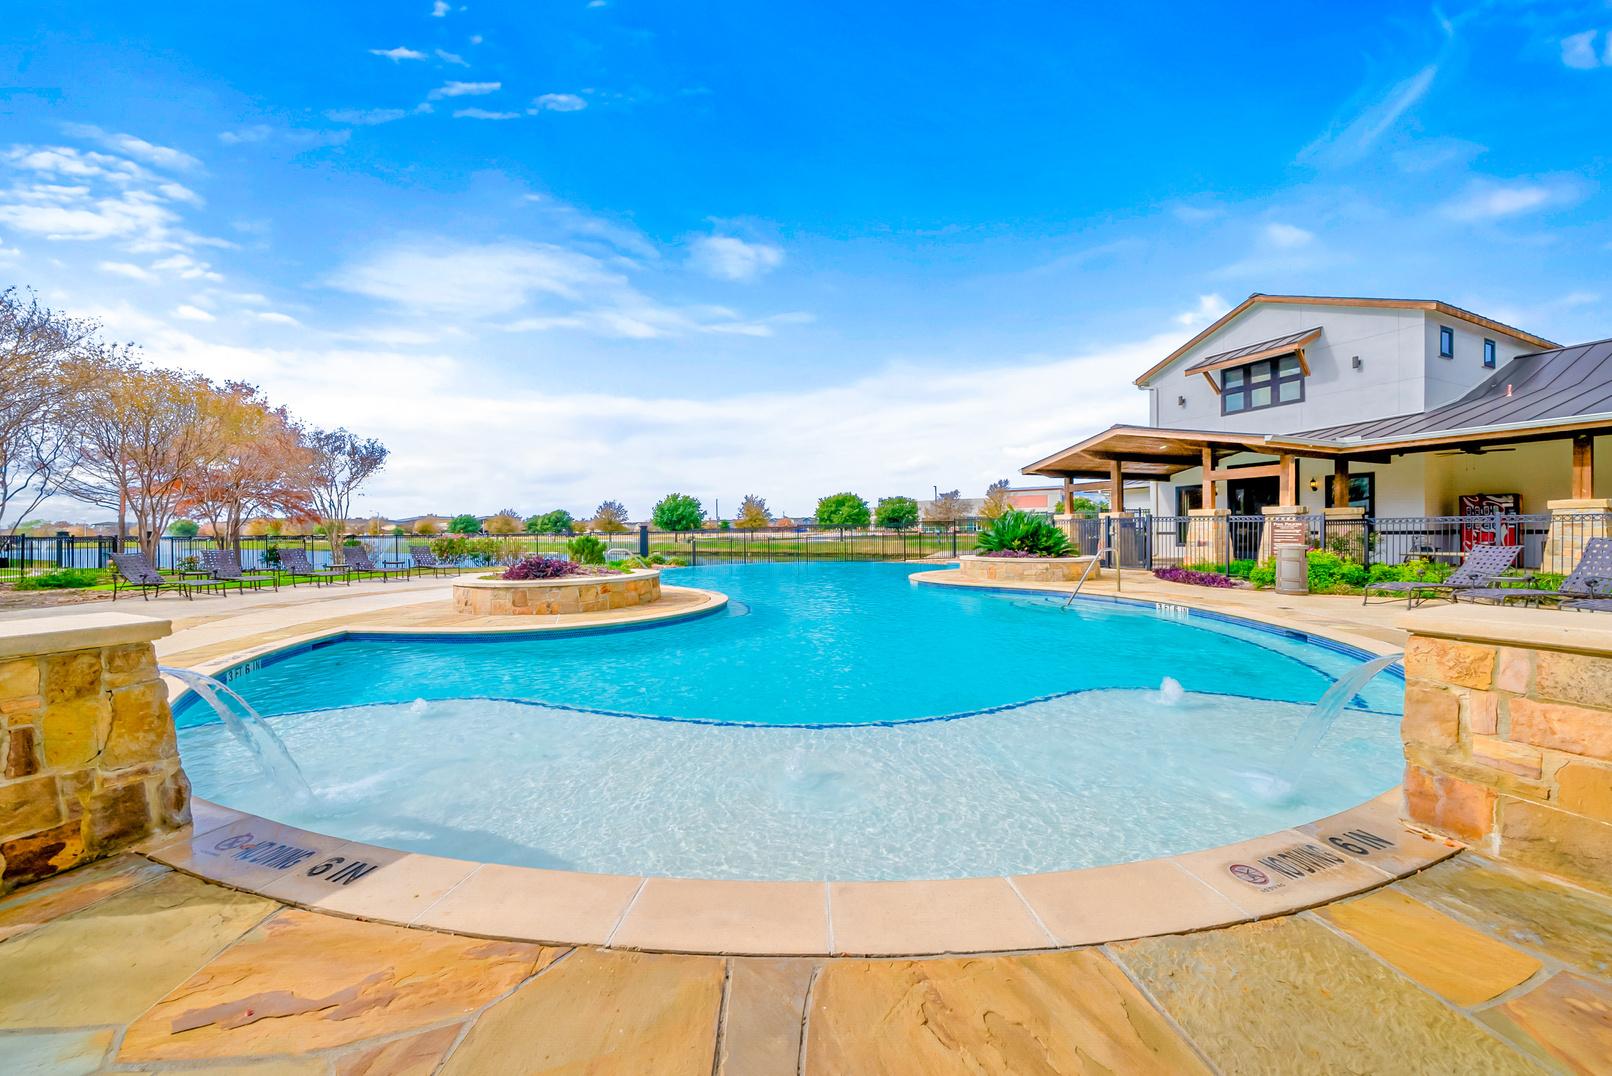
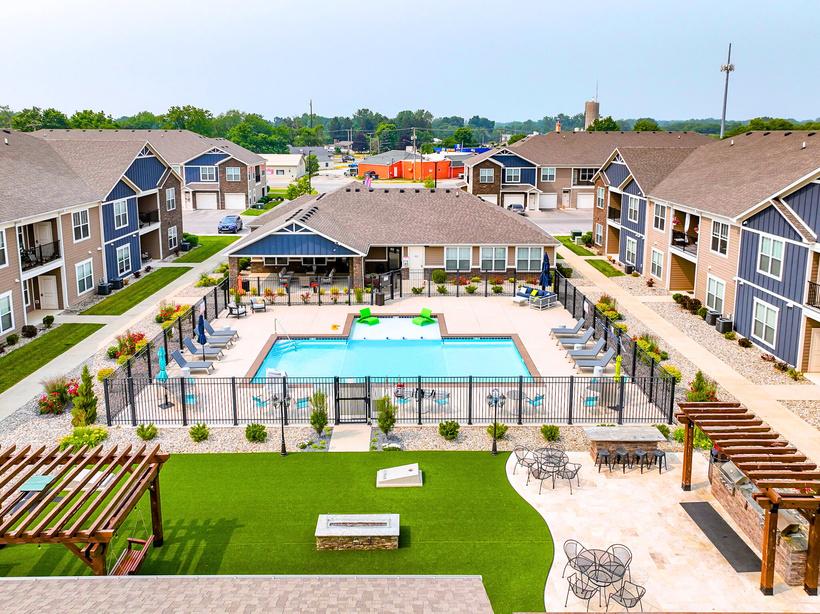
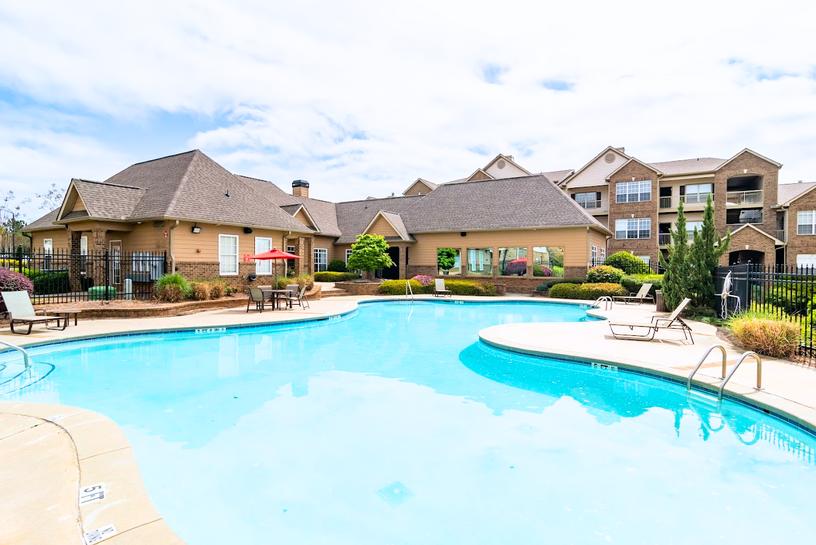
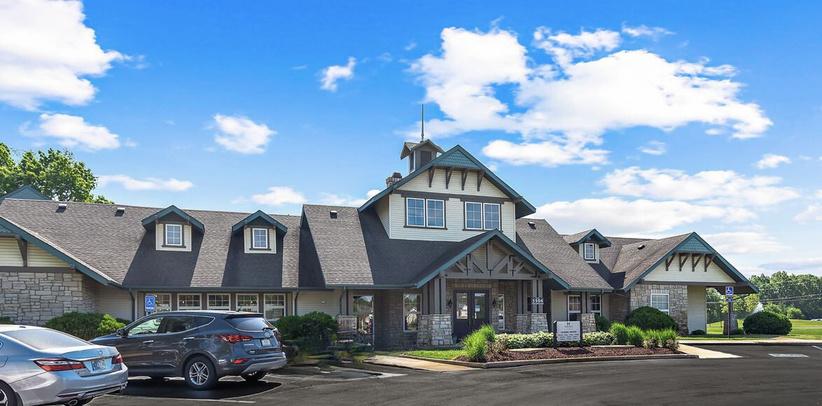
Resort-style pool
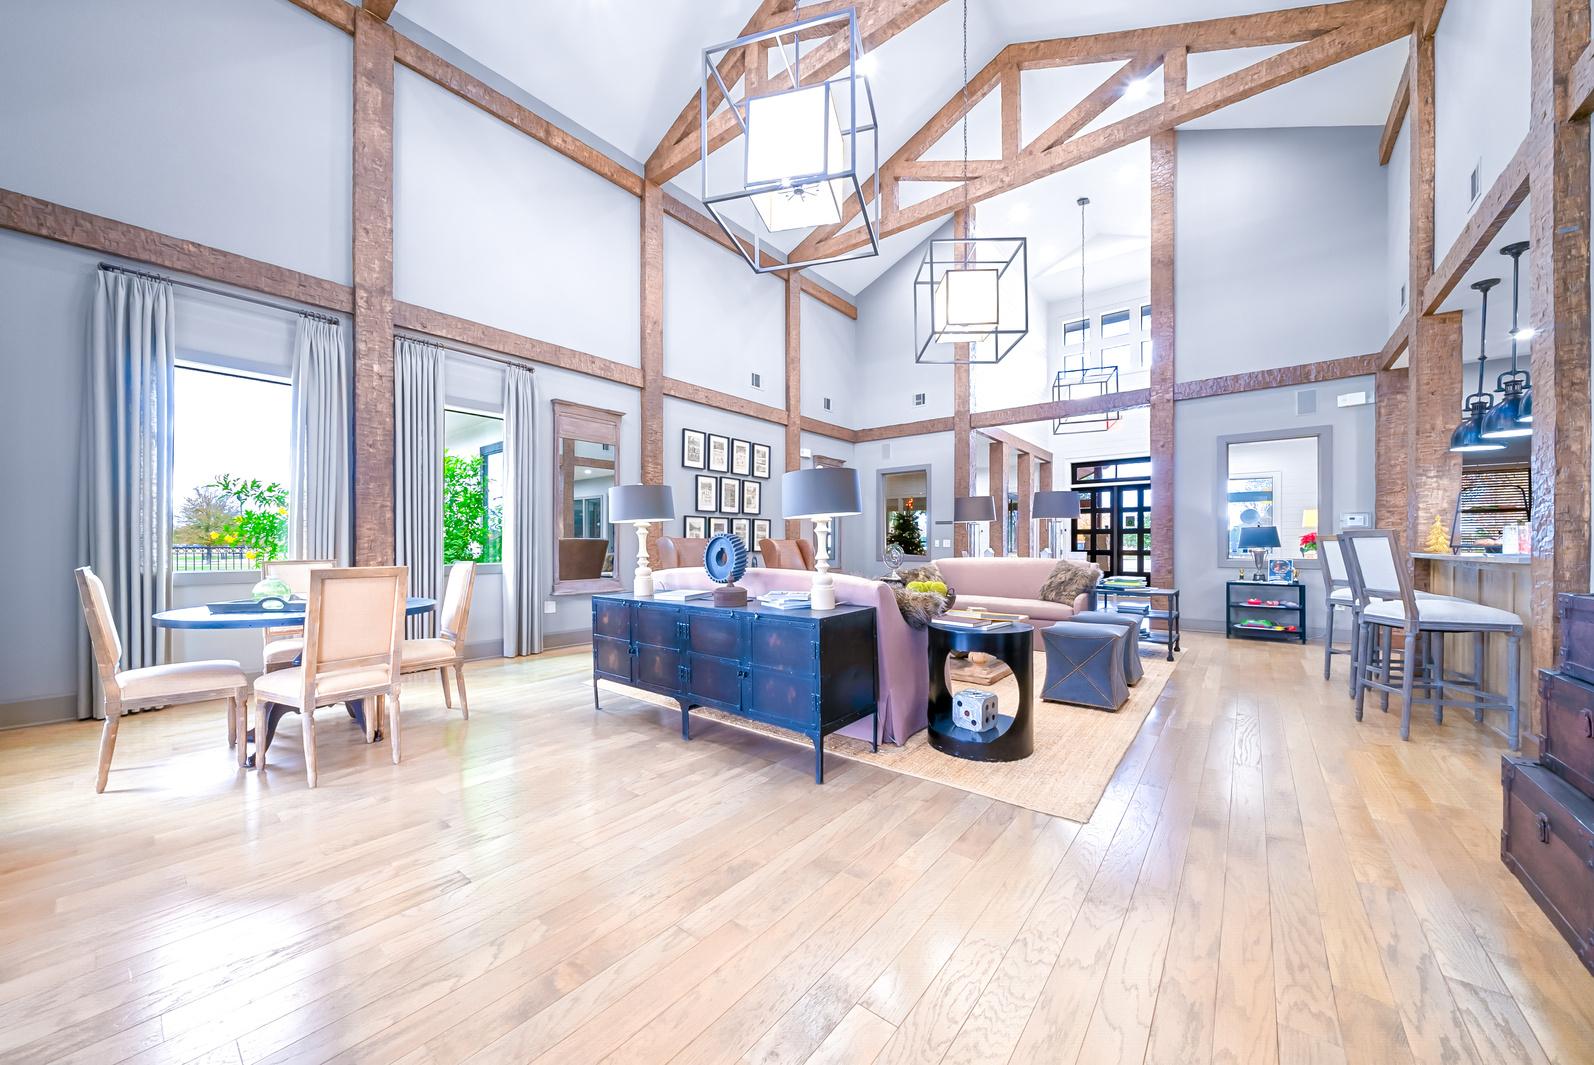
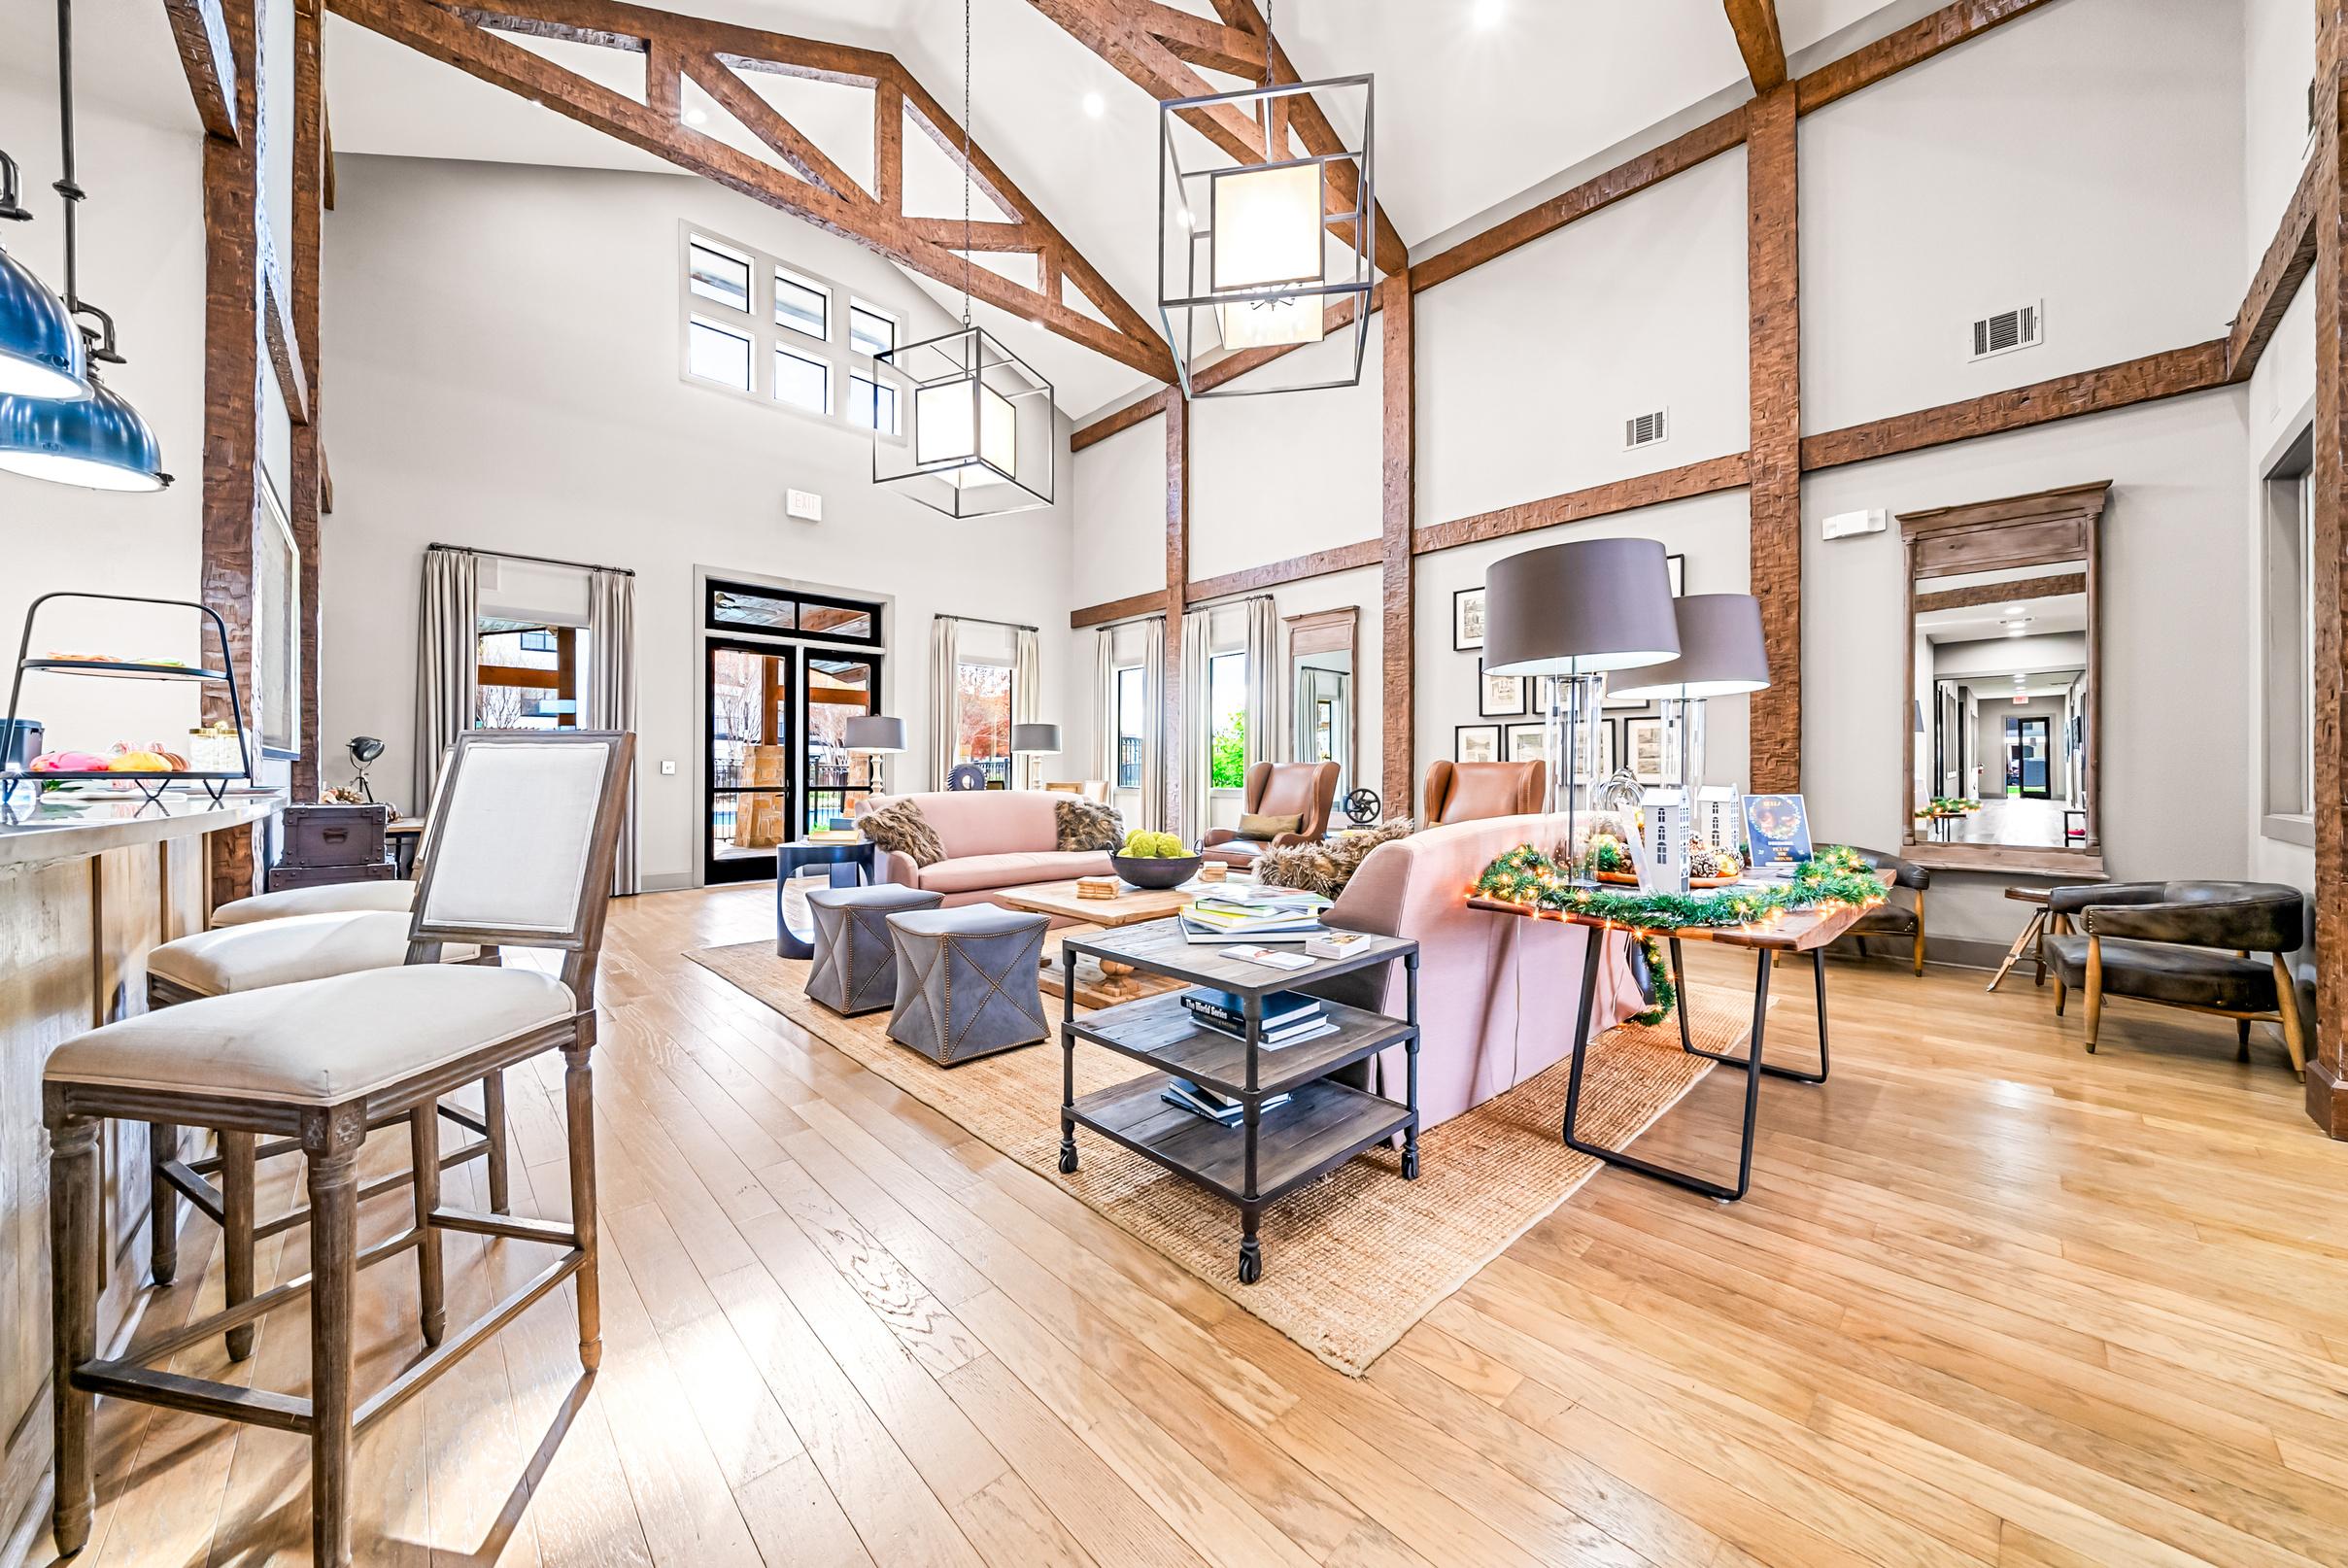
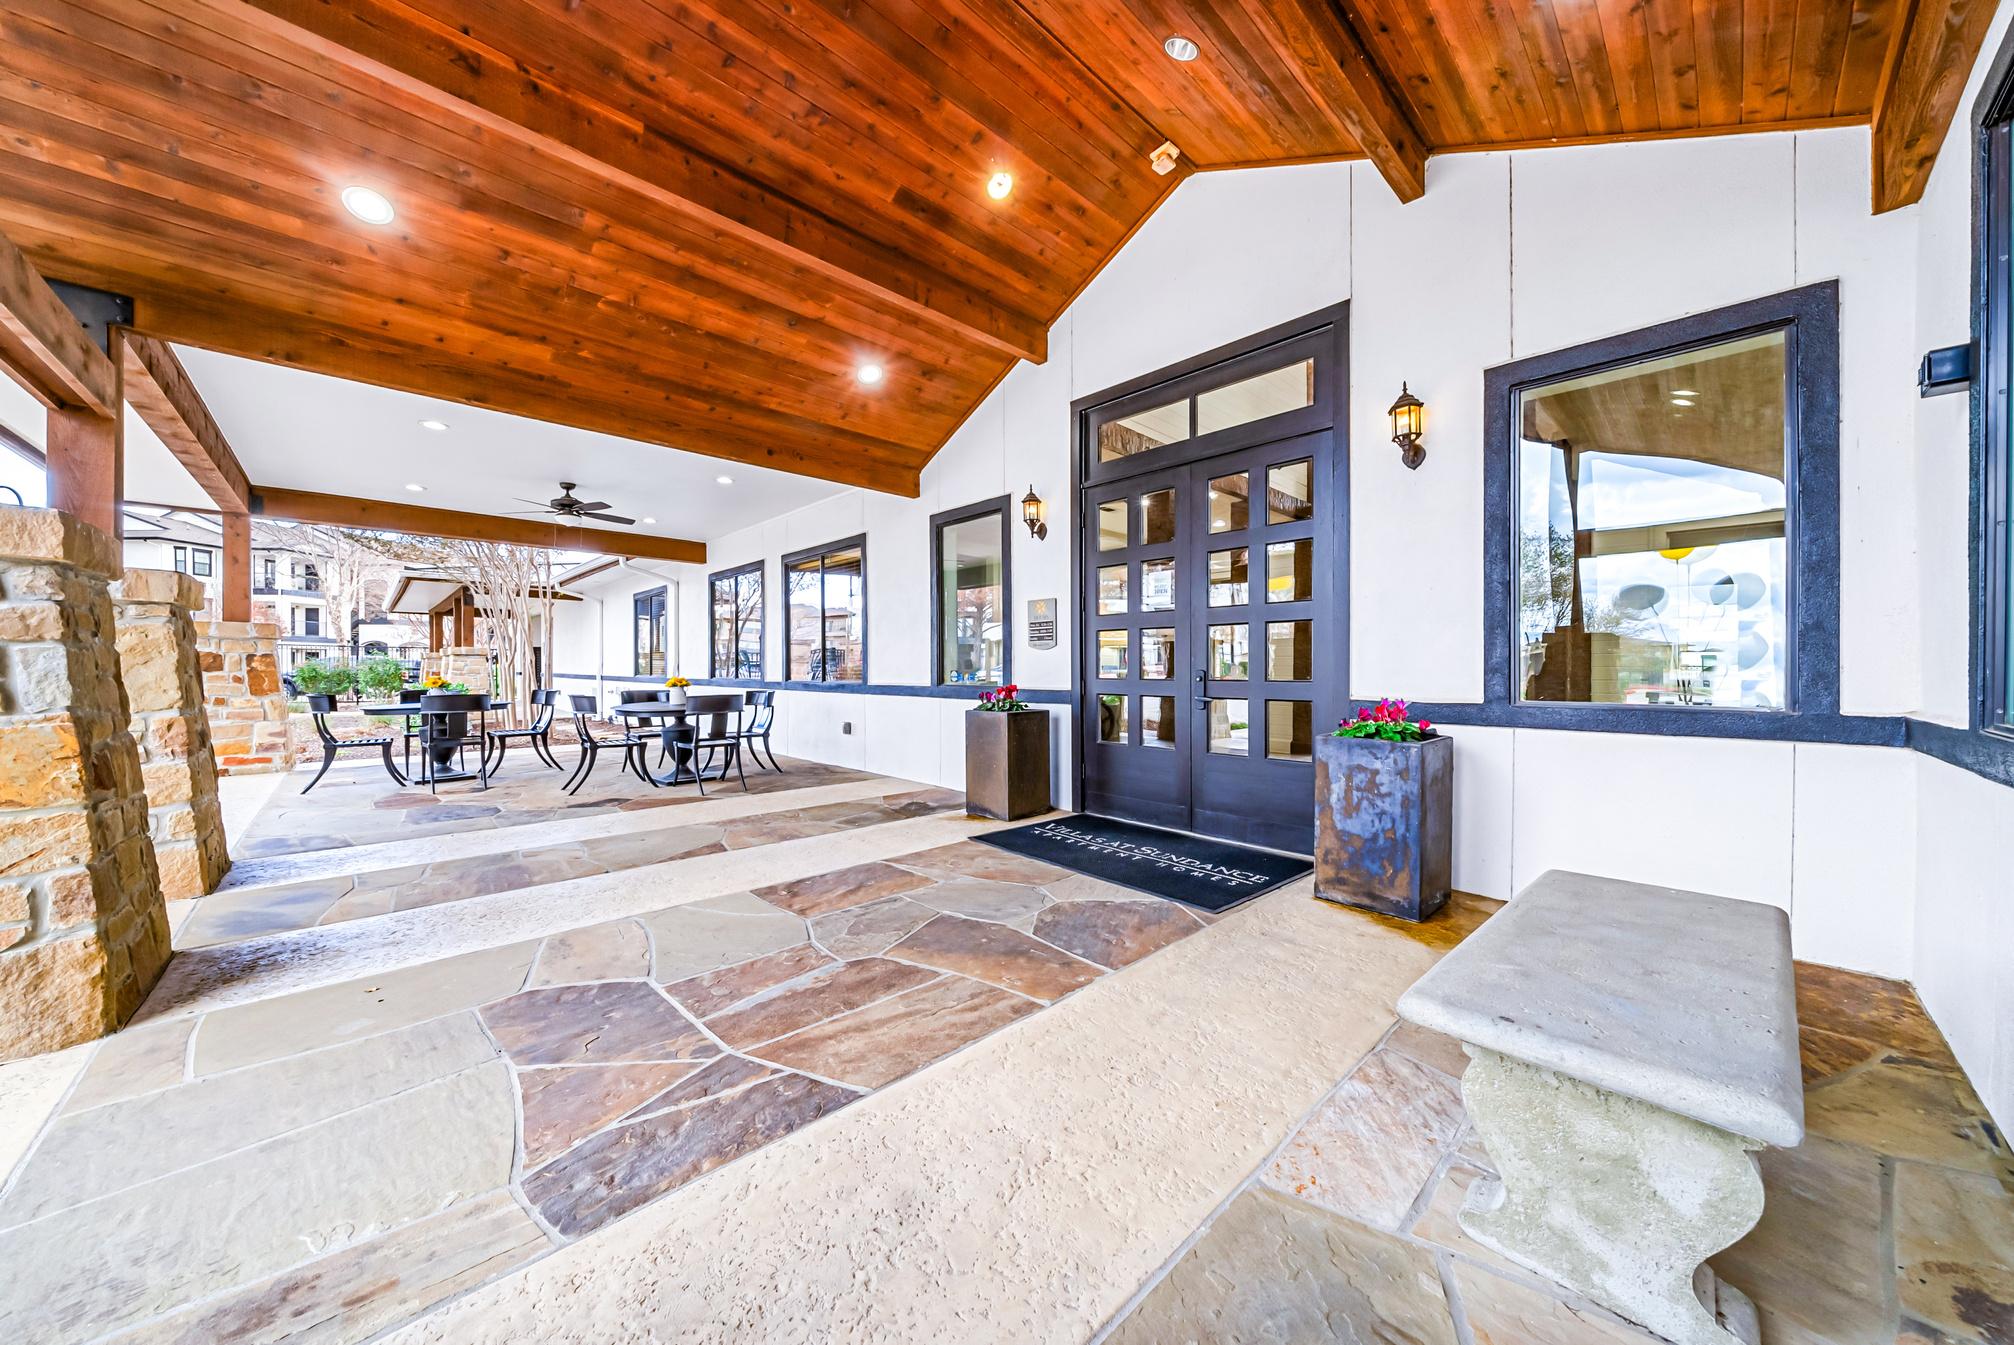
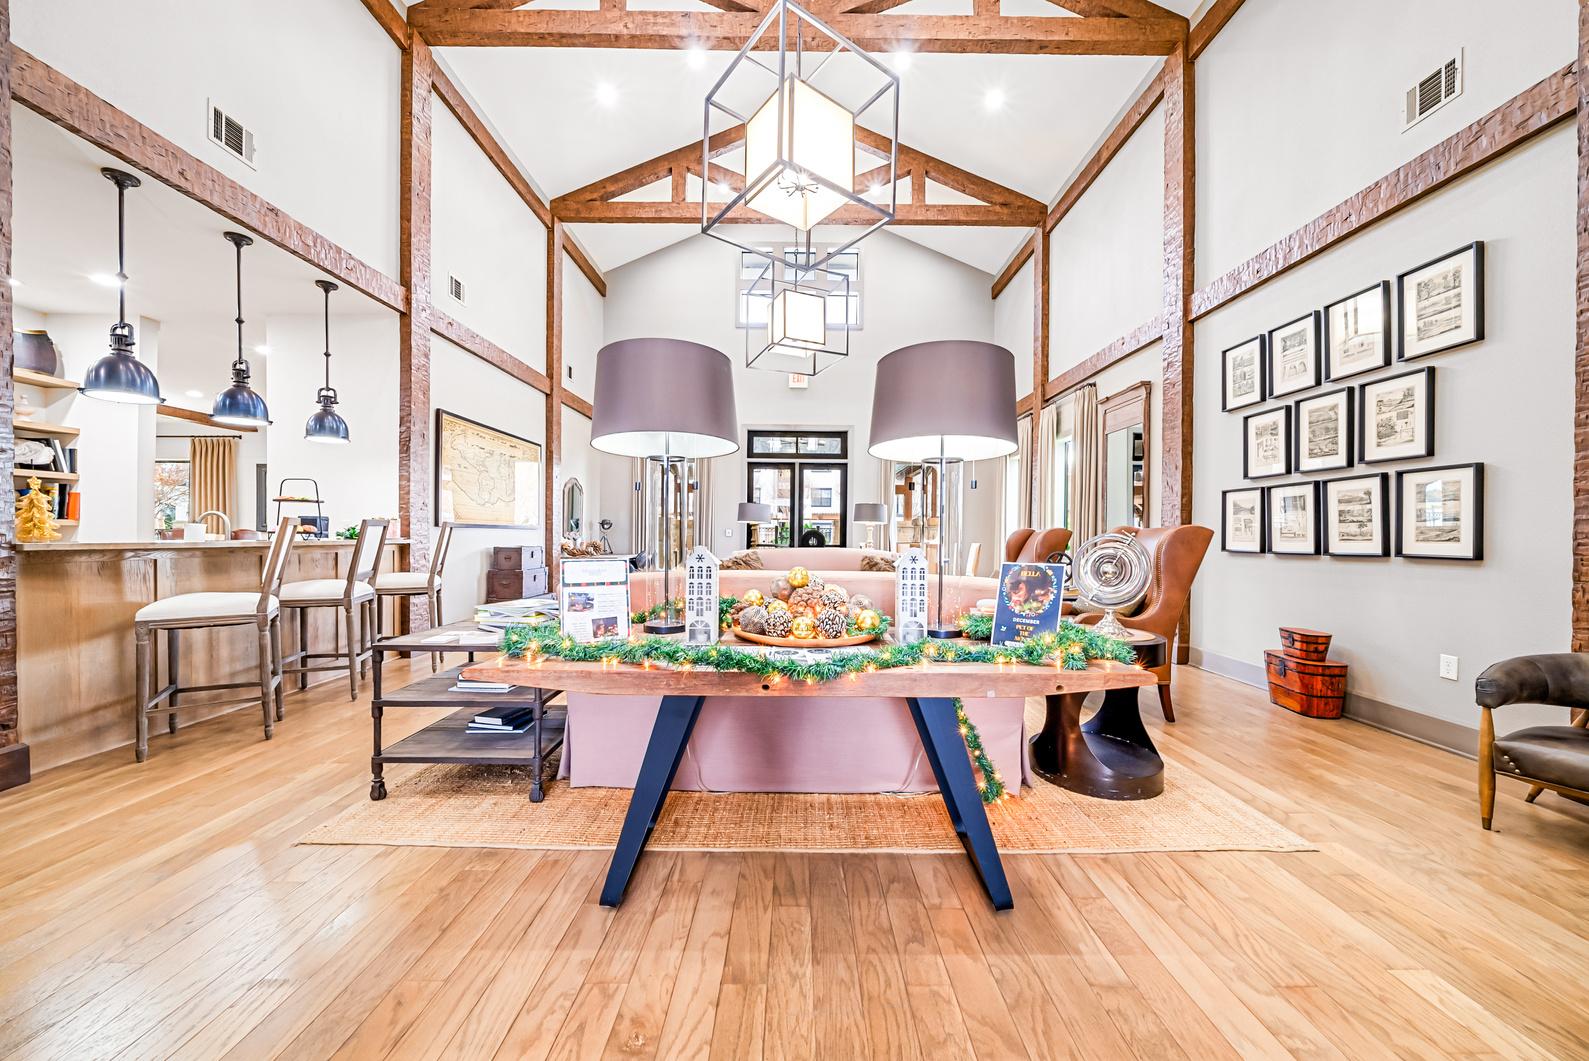
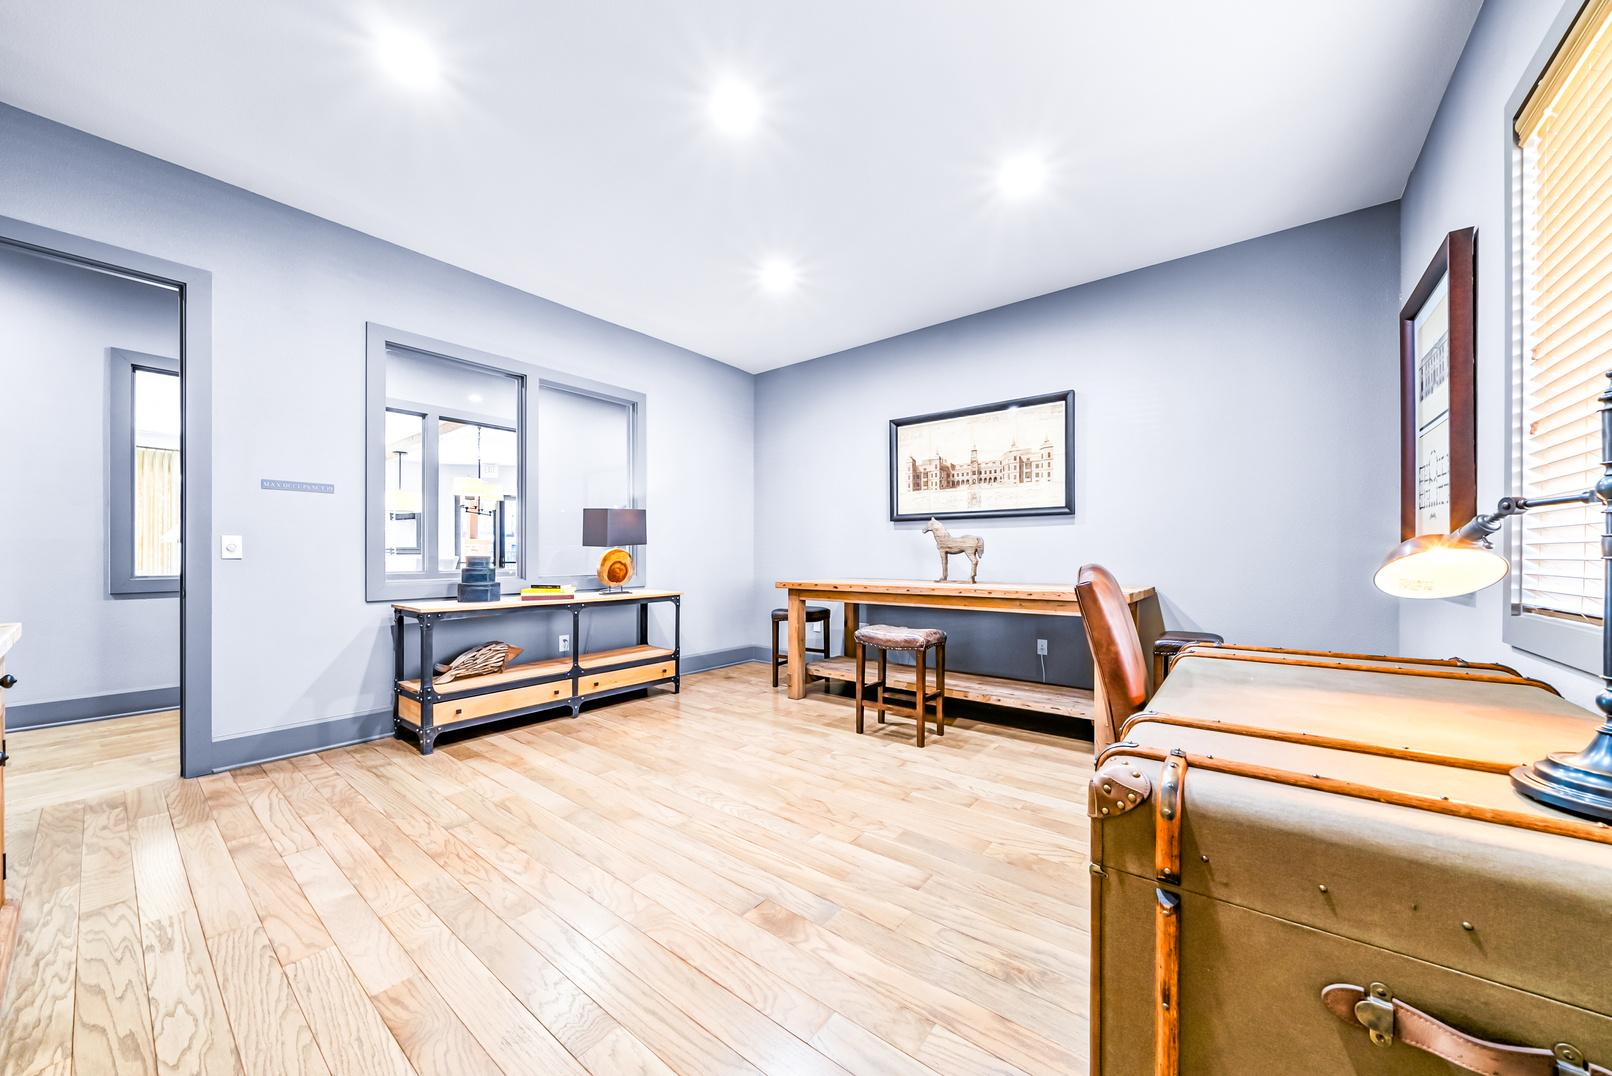
Expansive clubhouse
Common area
Wi-Fi Business center
Lounge
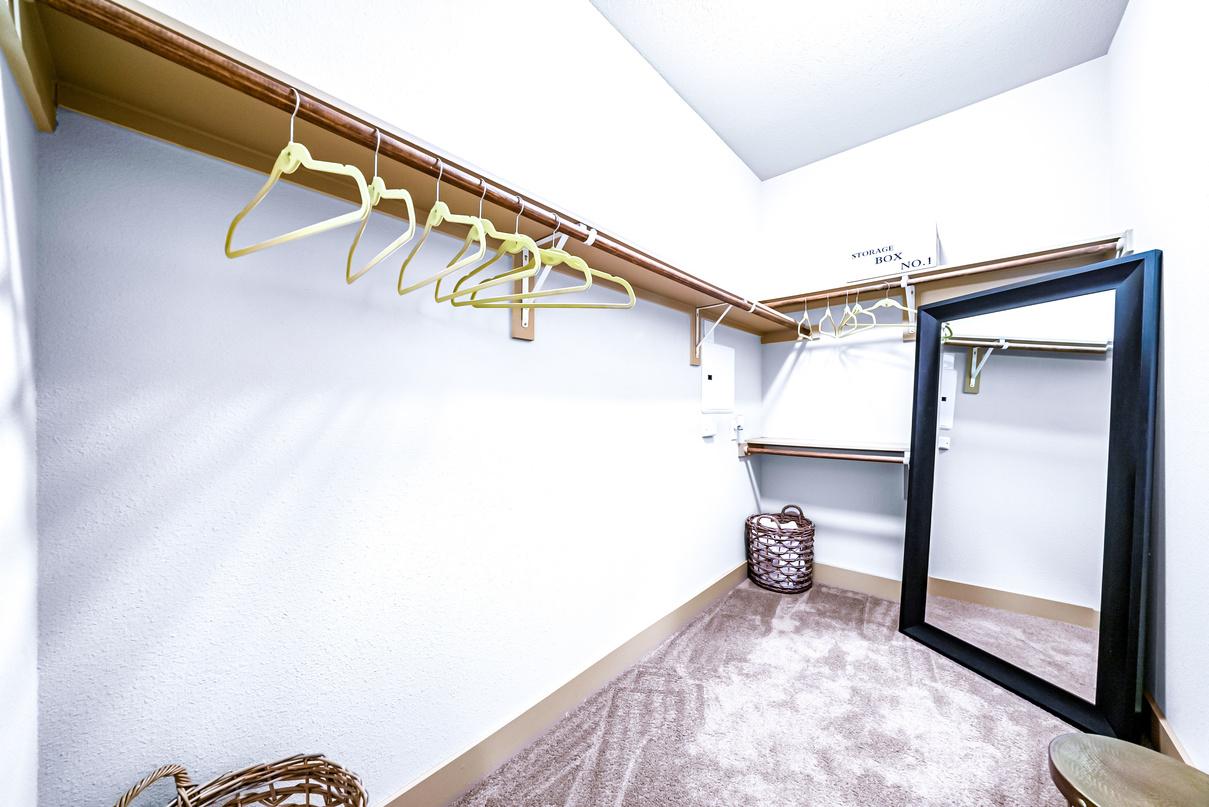
Storage space
Pet play area
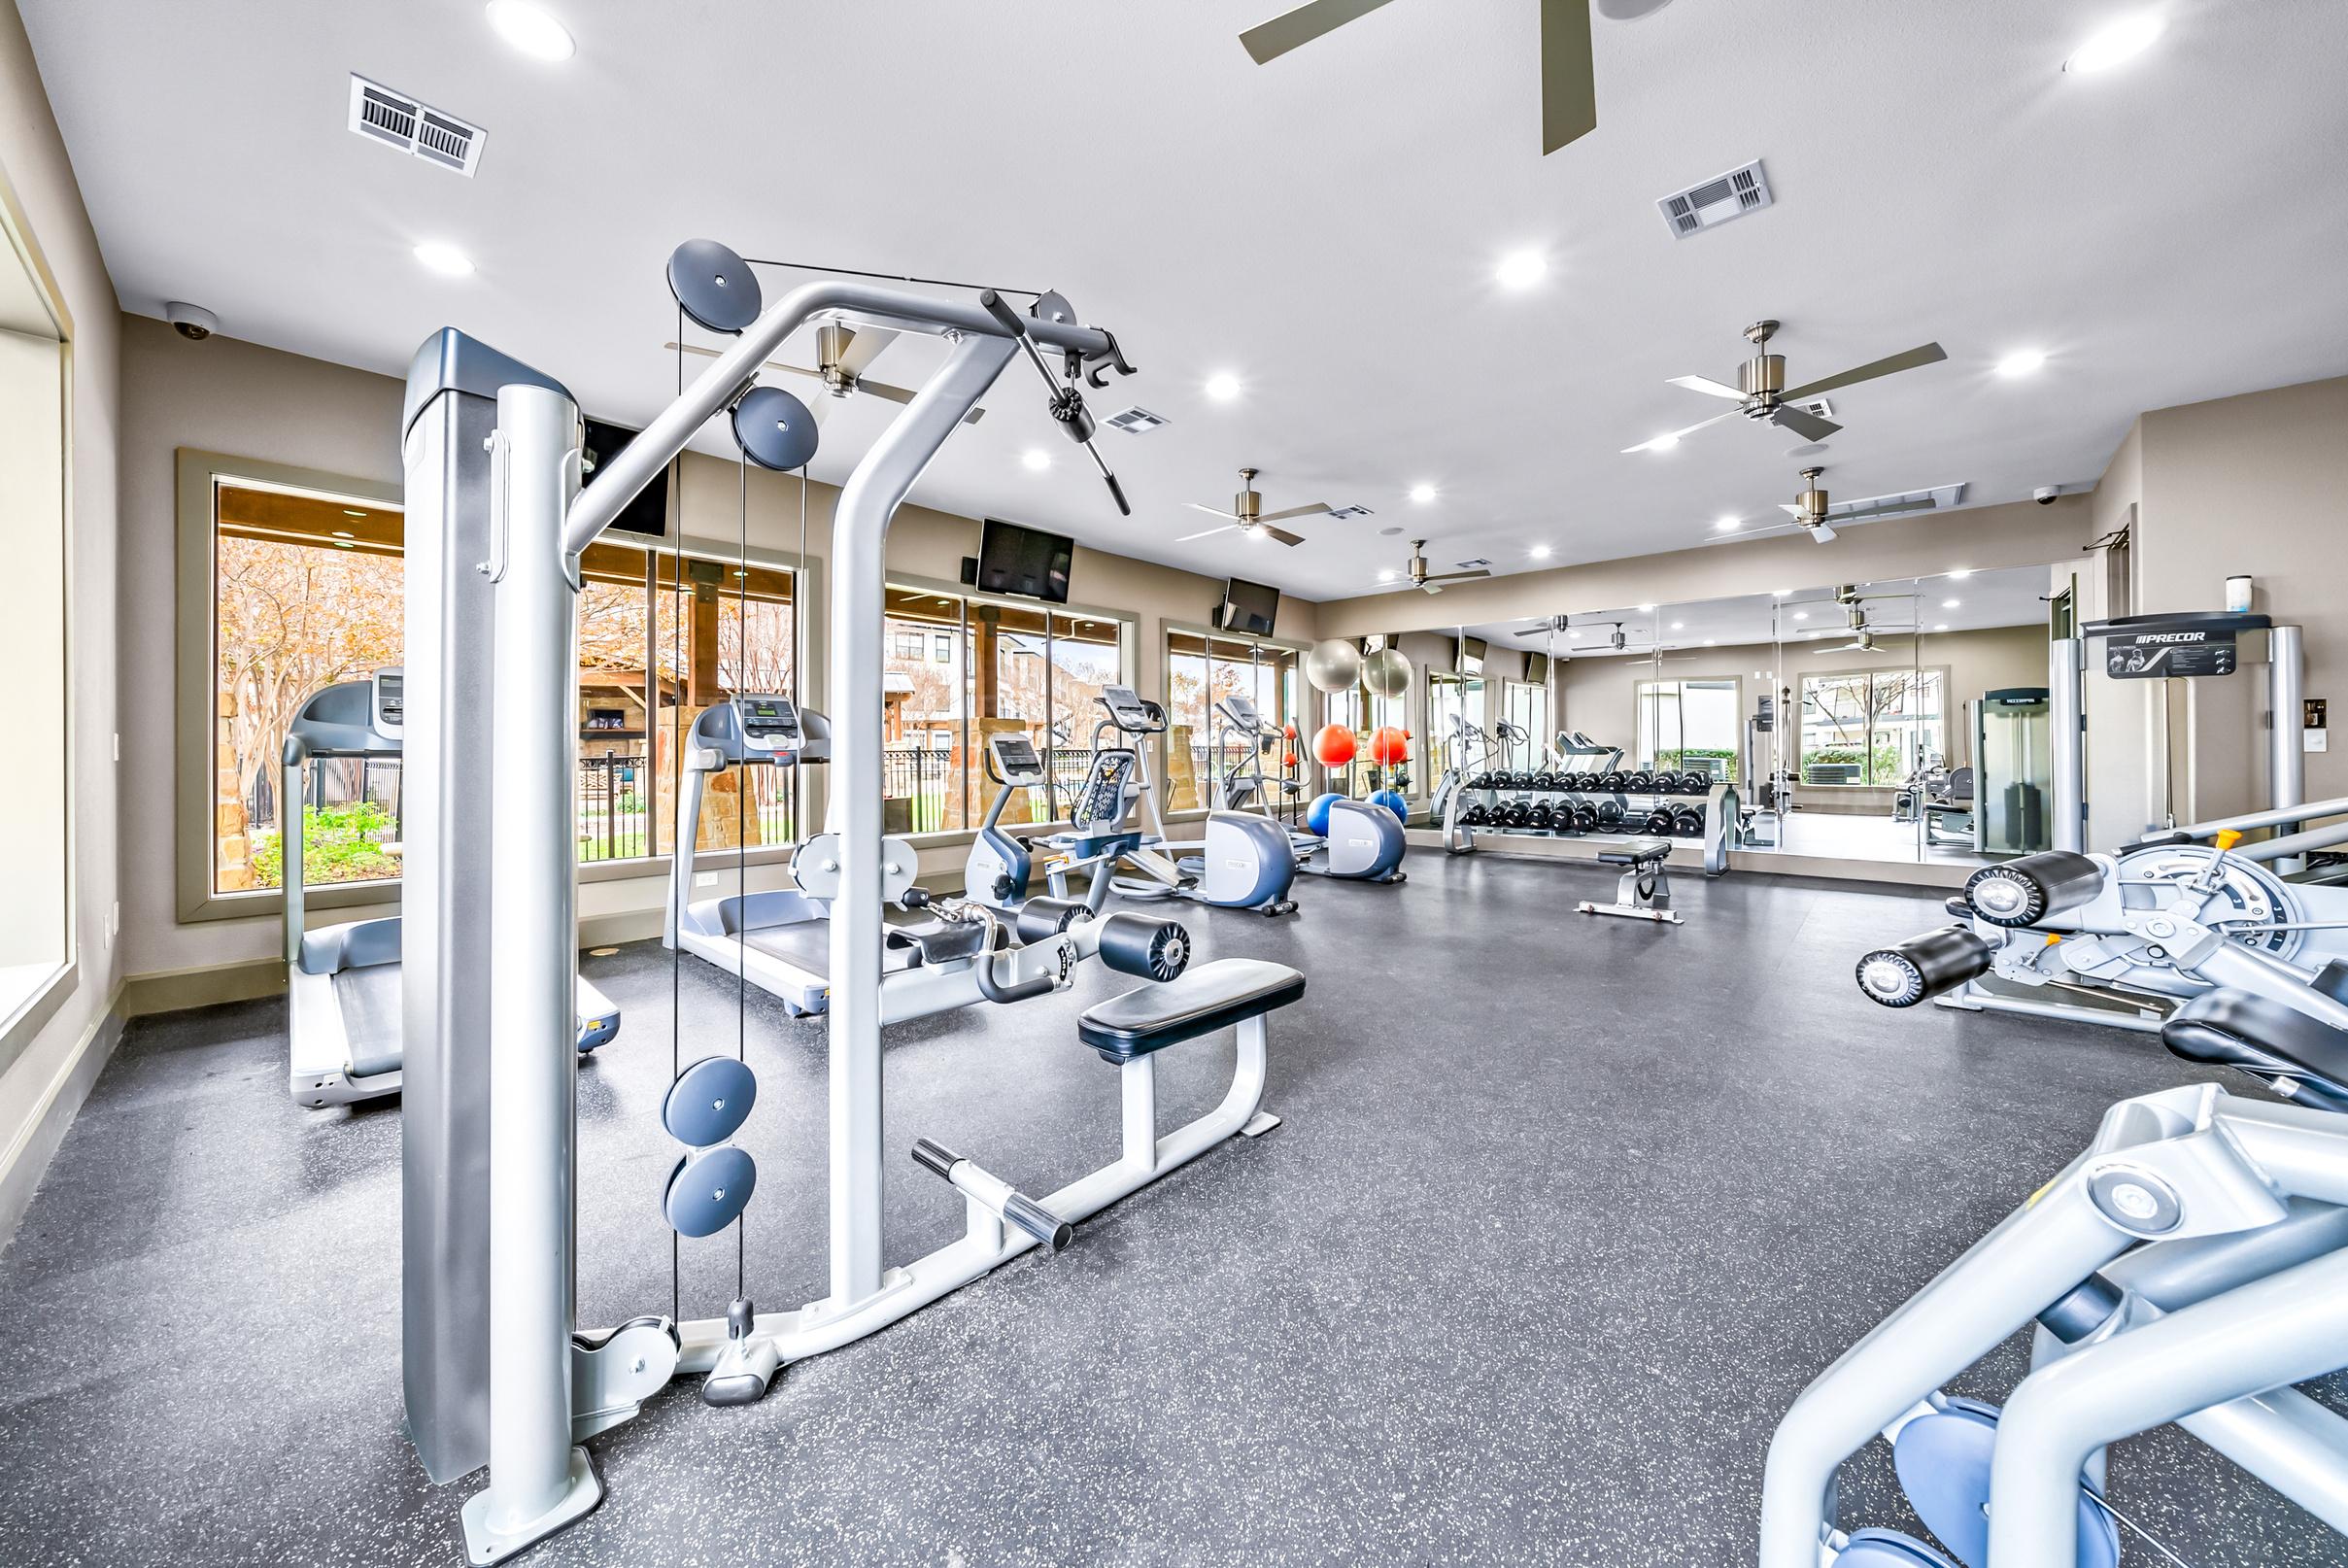
Fitness center
Bike storage
Gated community
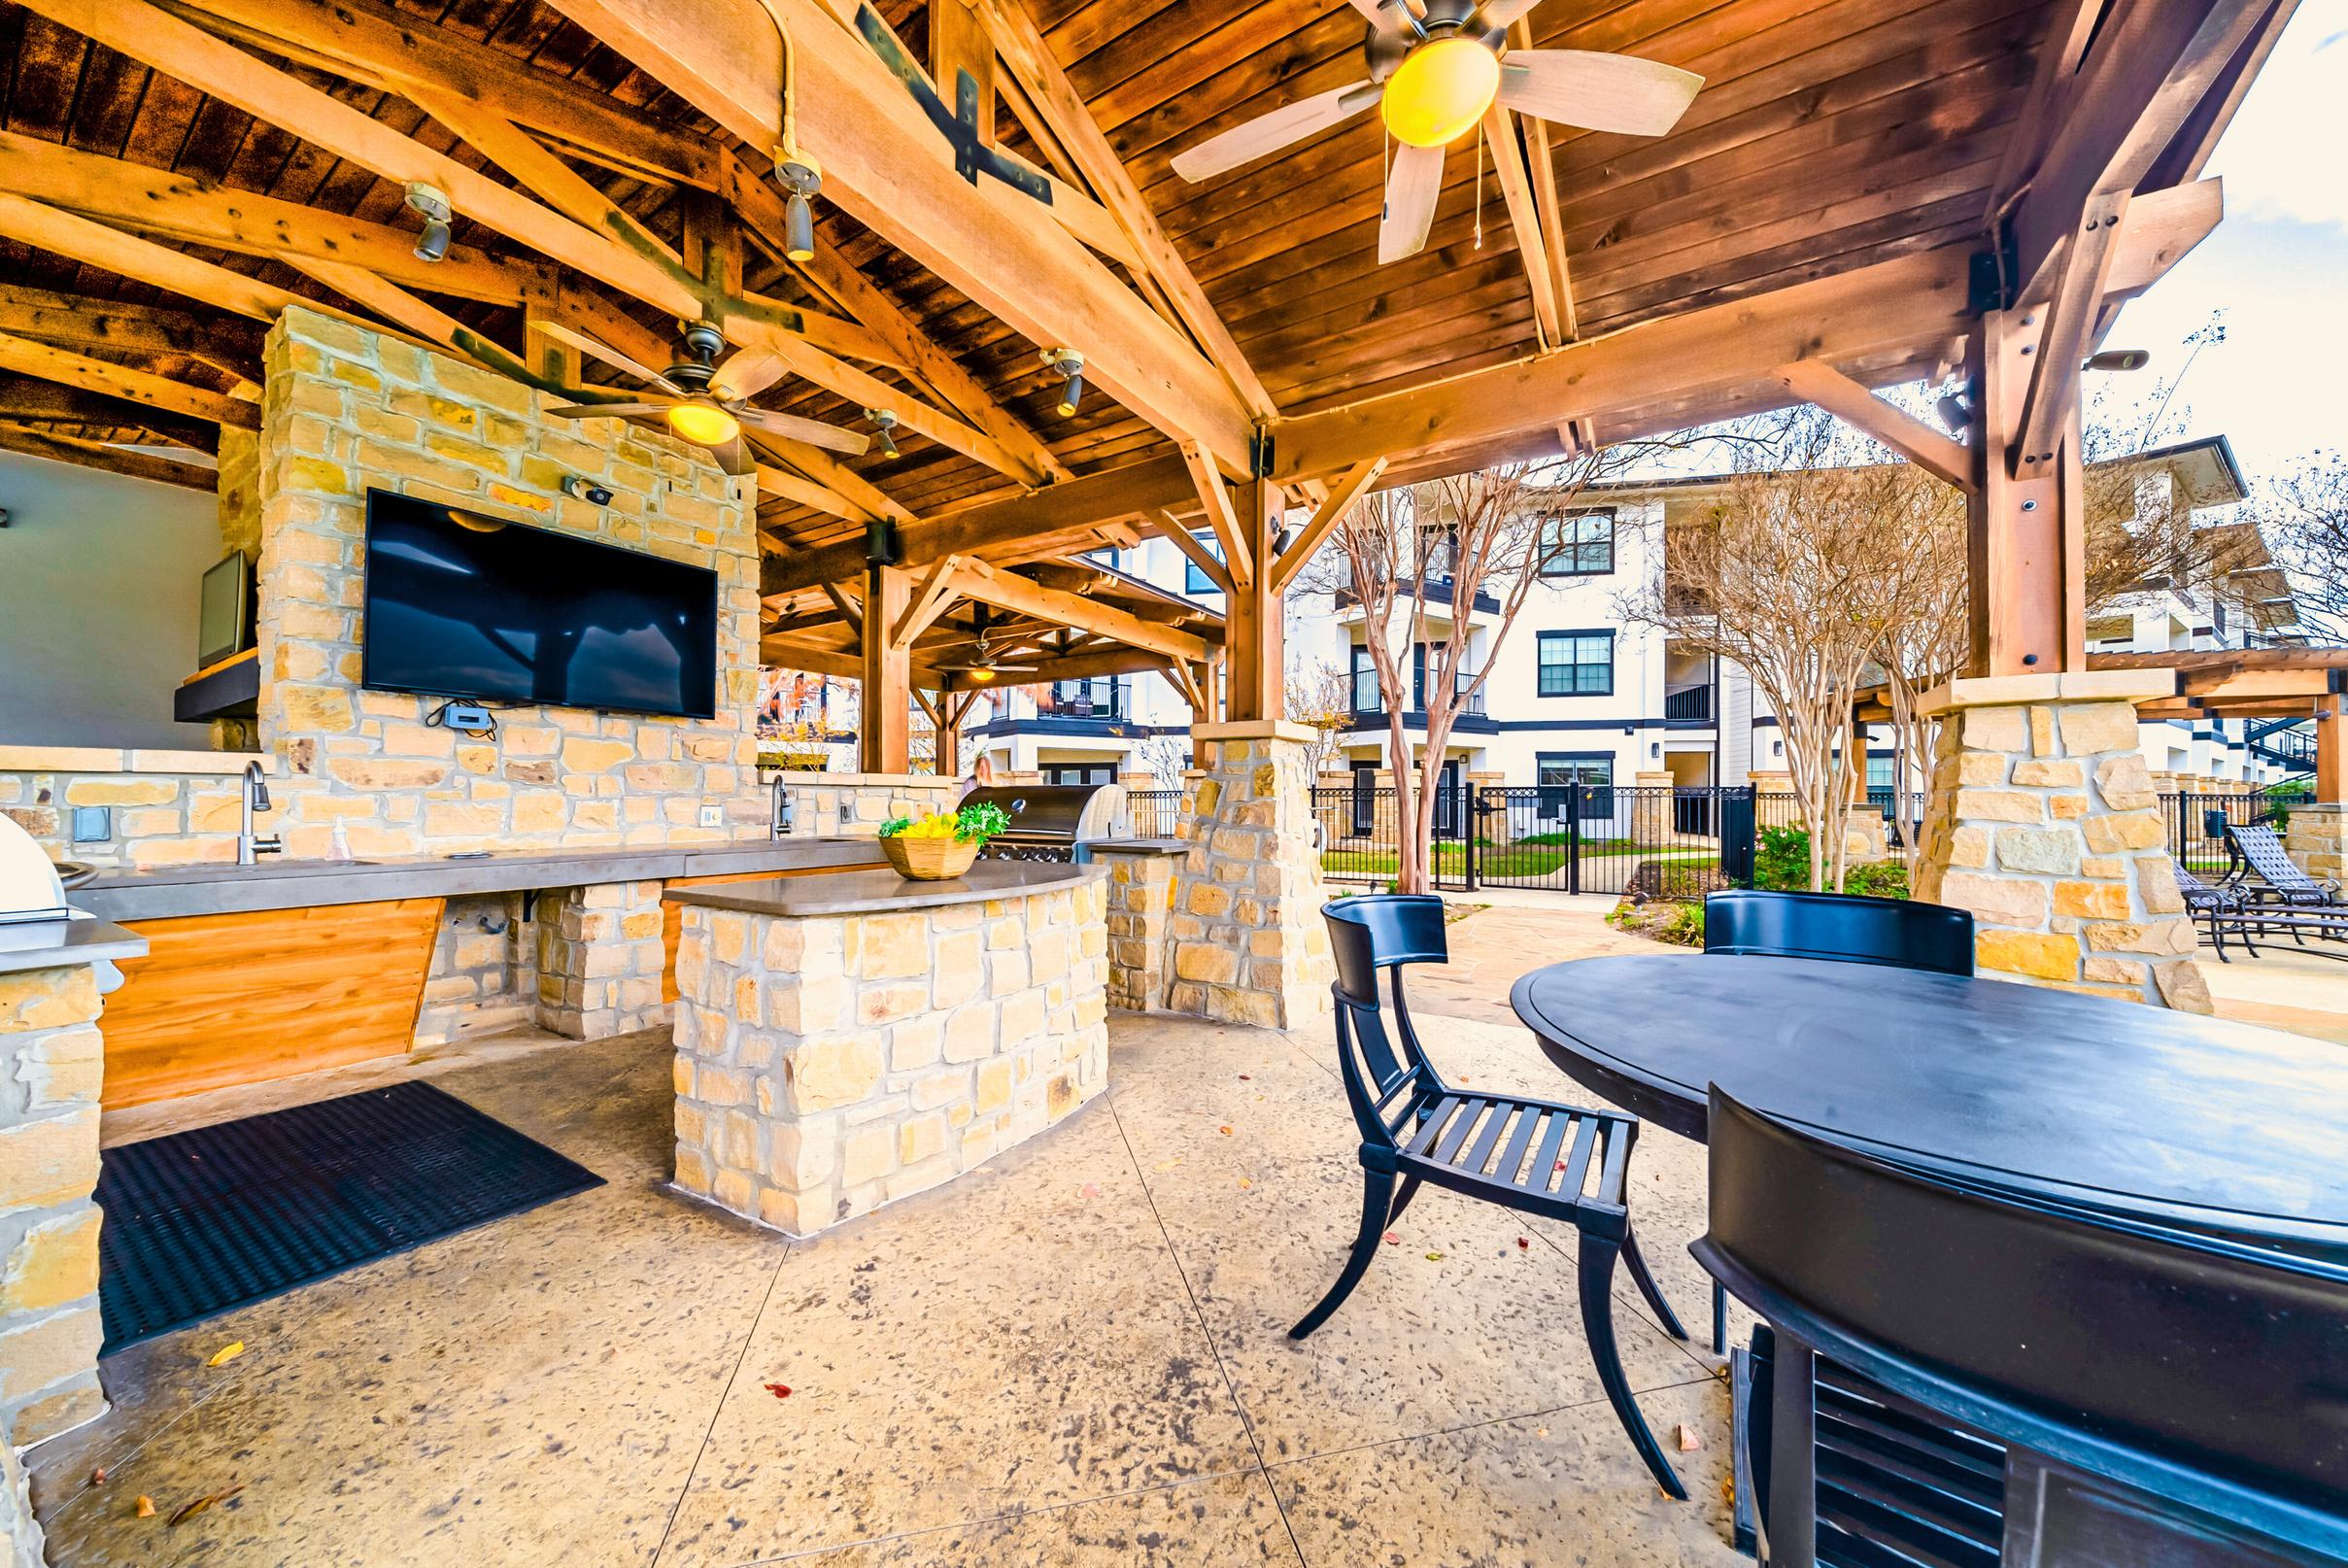
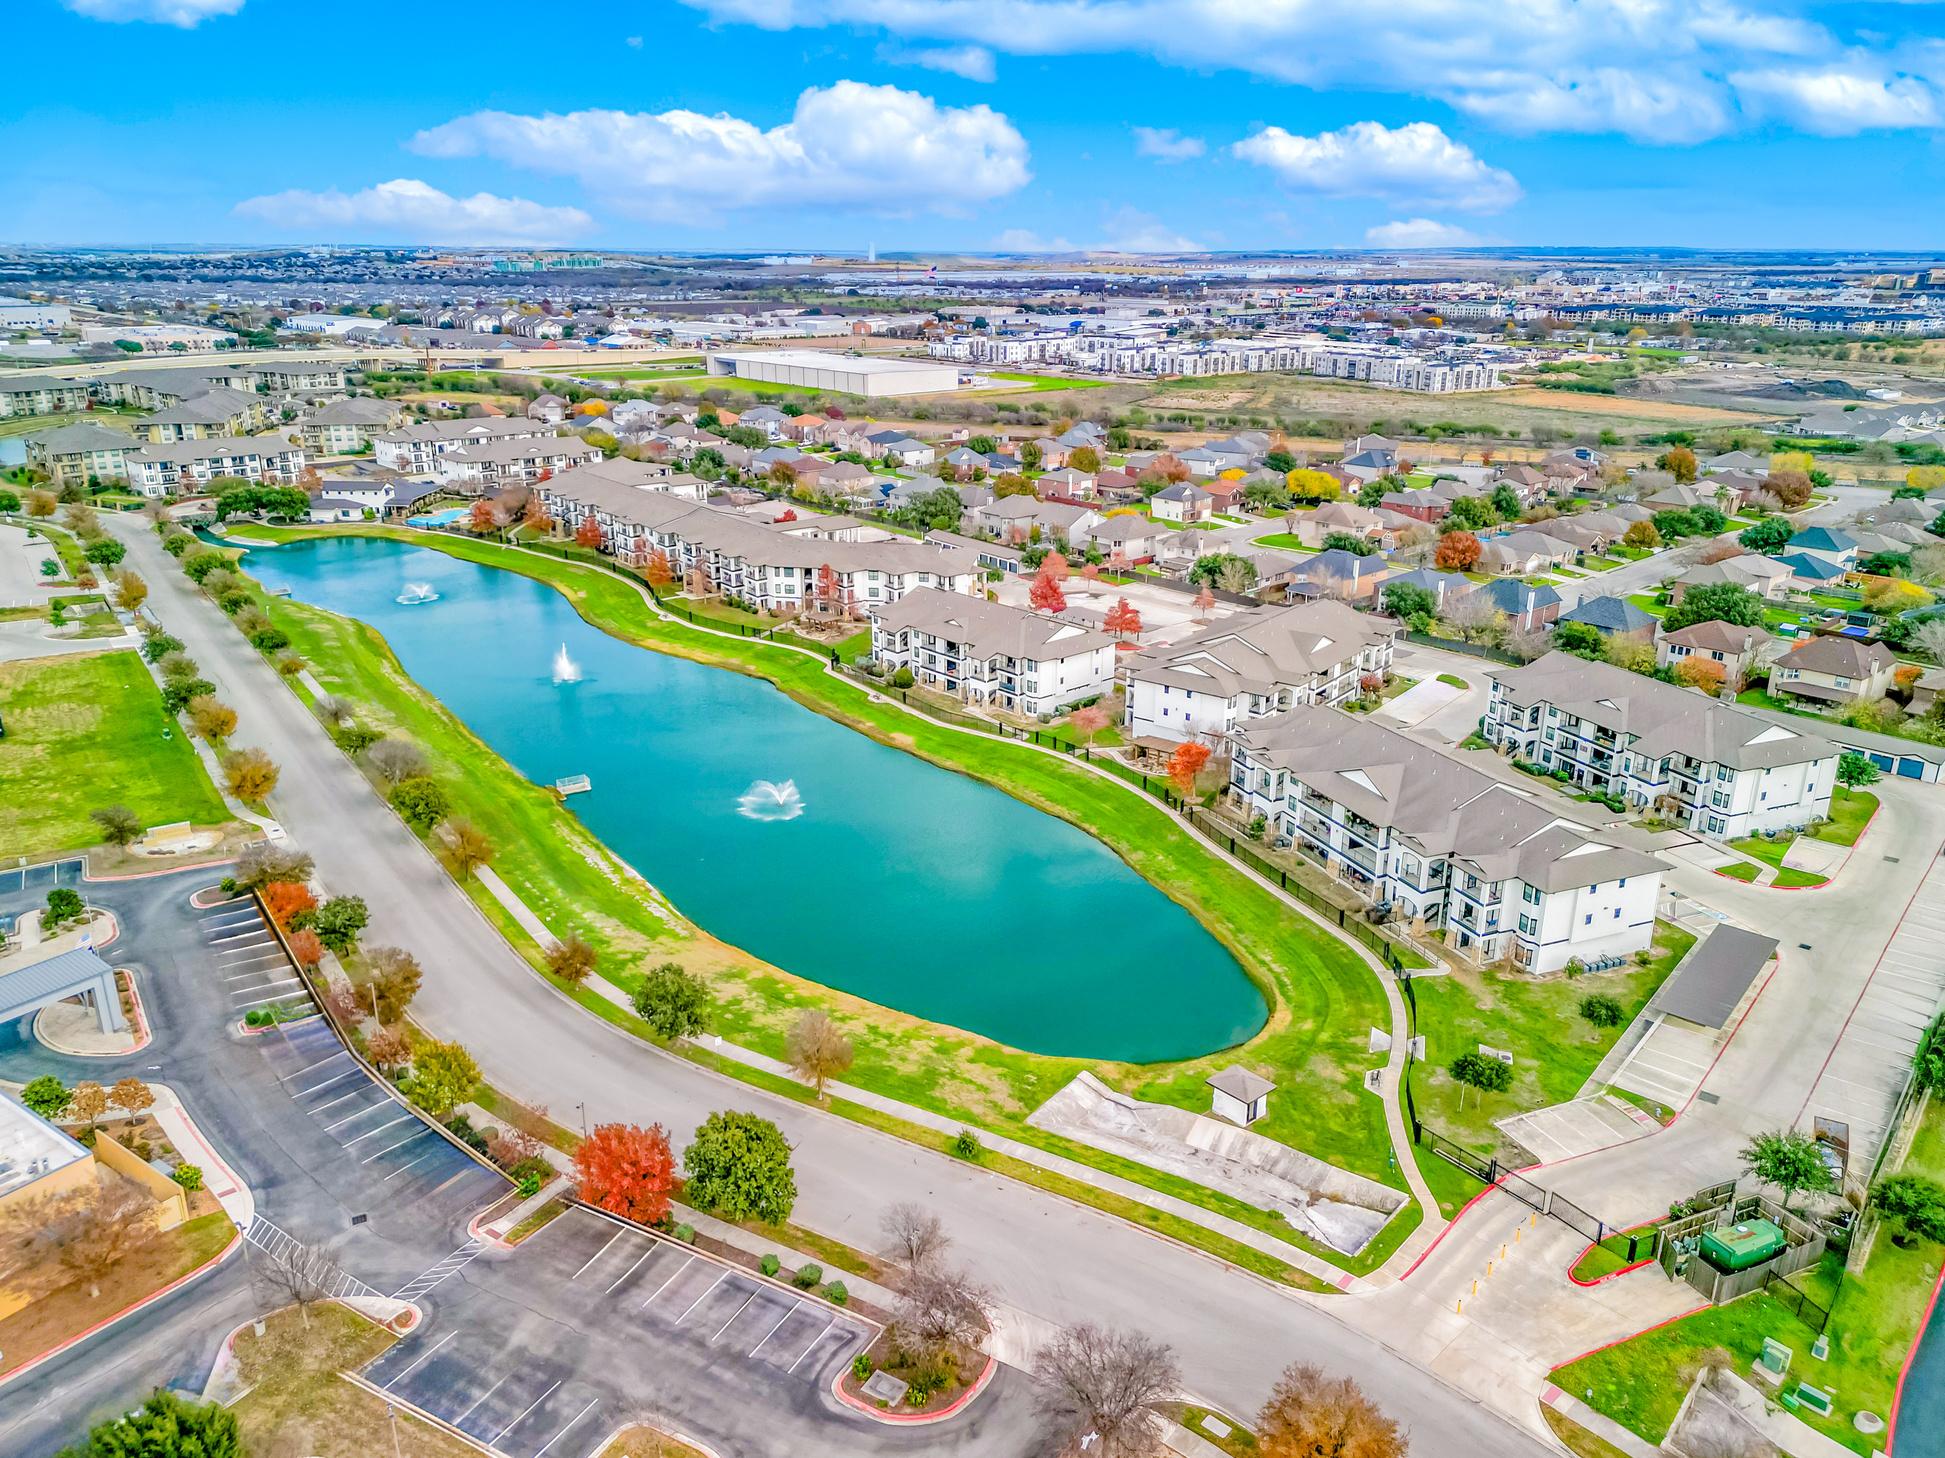
Grills Pond
9' Ceilings
11.6 Acres
Concrete foundation with stucco siding
FINANCIAL
5.70% Interest Rate
Clear core-plus strategy mitigating risk through strong submarket rental growth of nearly 40%.
VALUE-ADD
Exterior Renovation Budget of $2,298,840 includes:
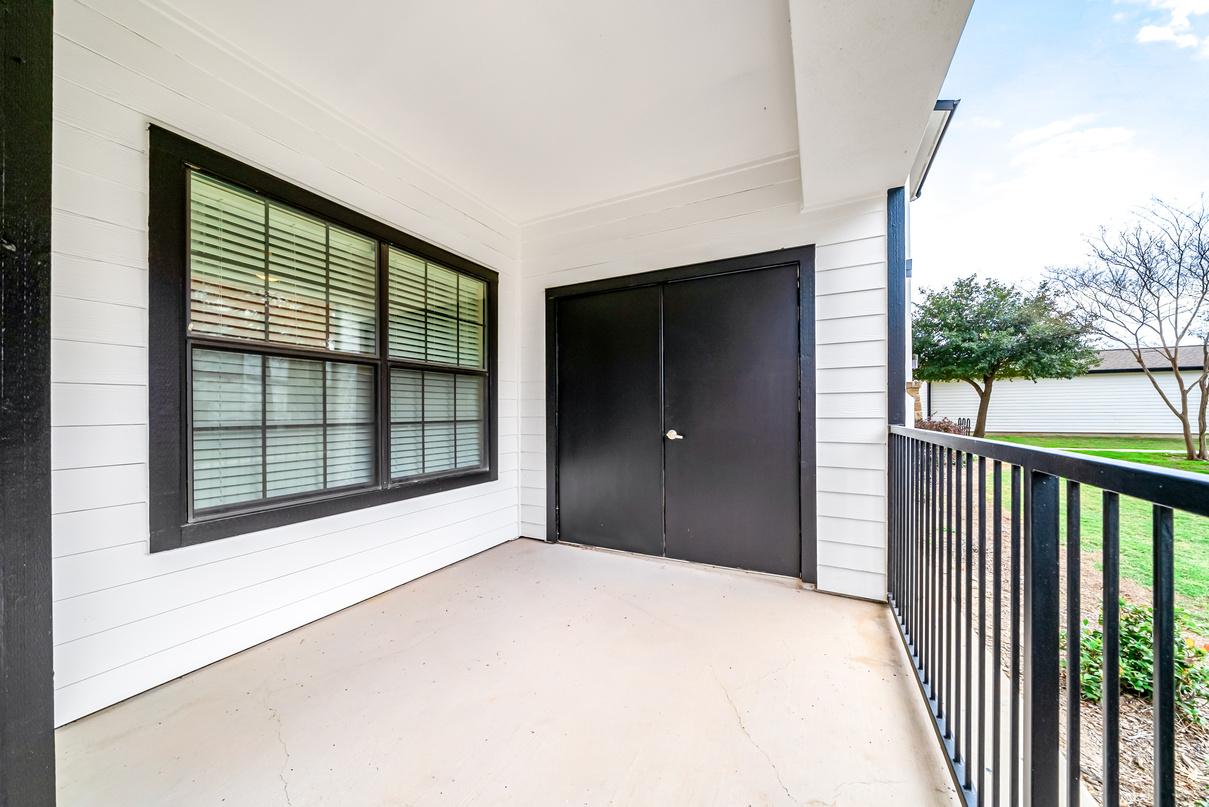
Exterior private yards
Concrete/sidewalk repairs
Landscaping refresh
Parking lot seal & stripe
Pedestrian gate repairs
HVAC repair
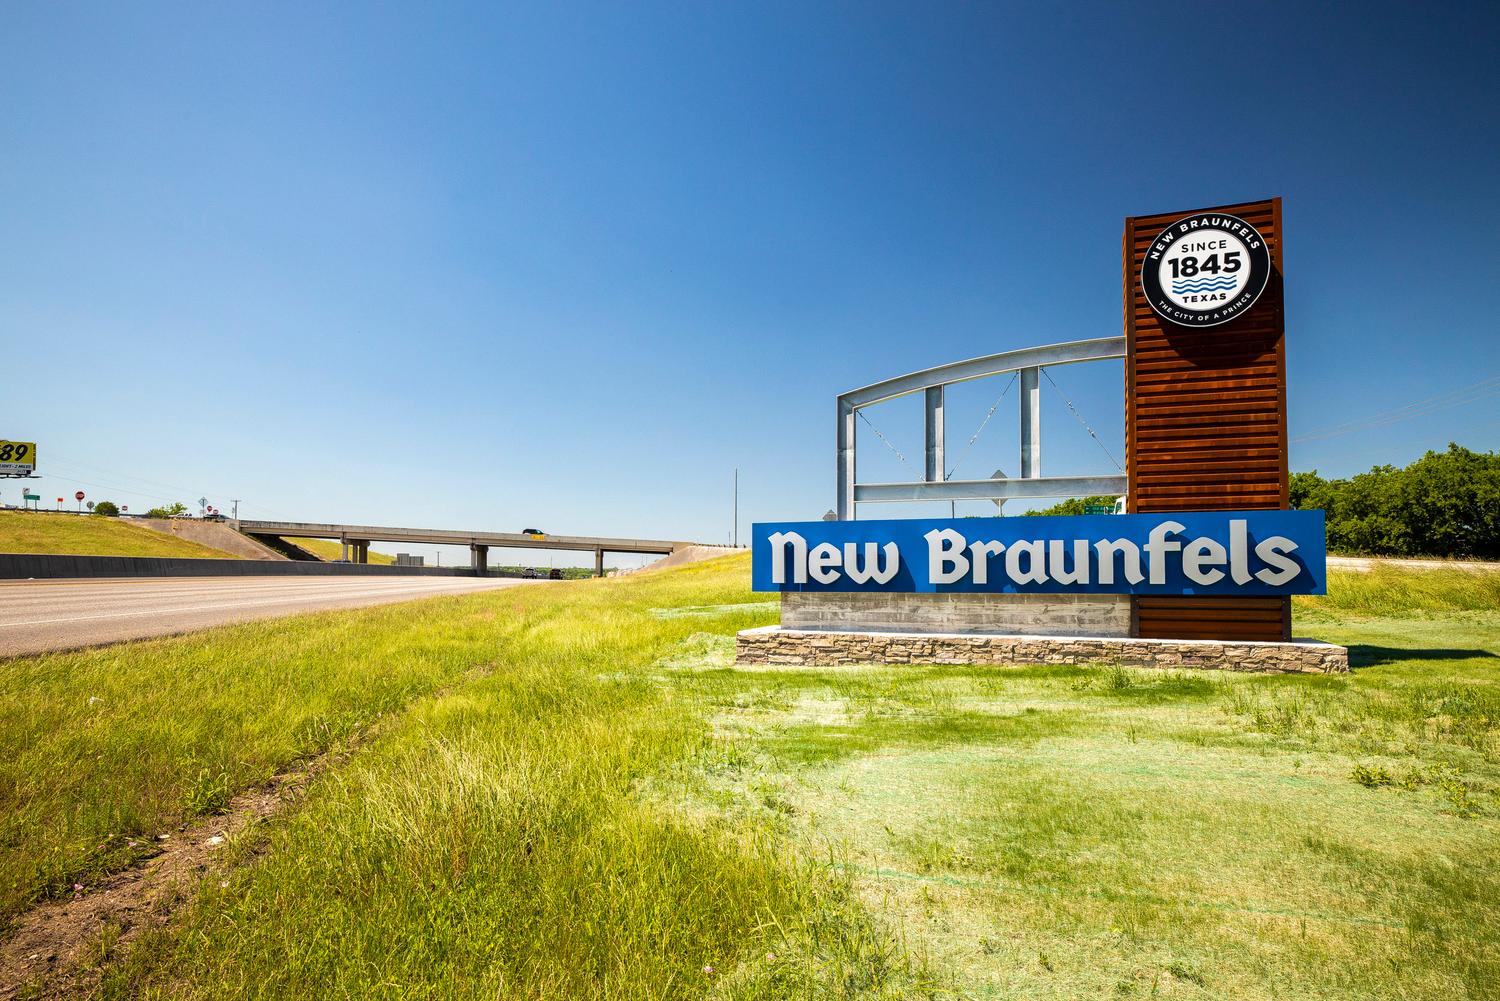
L O C A T I O N
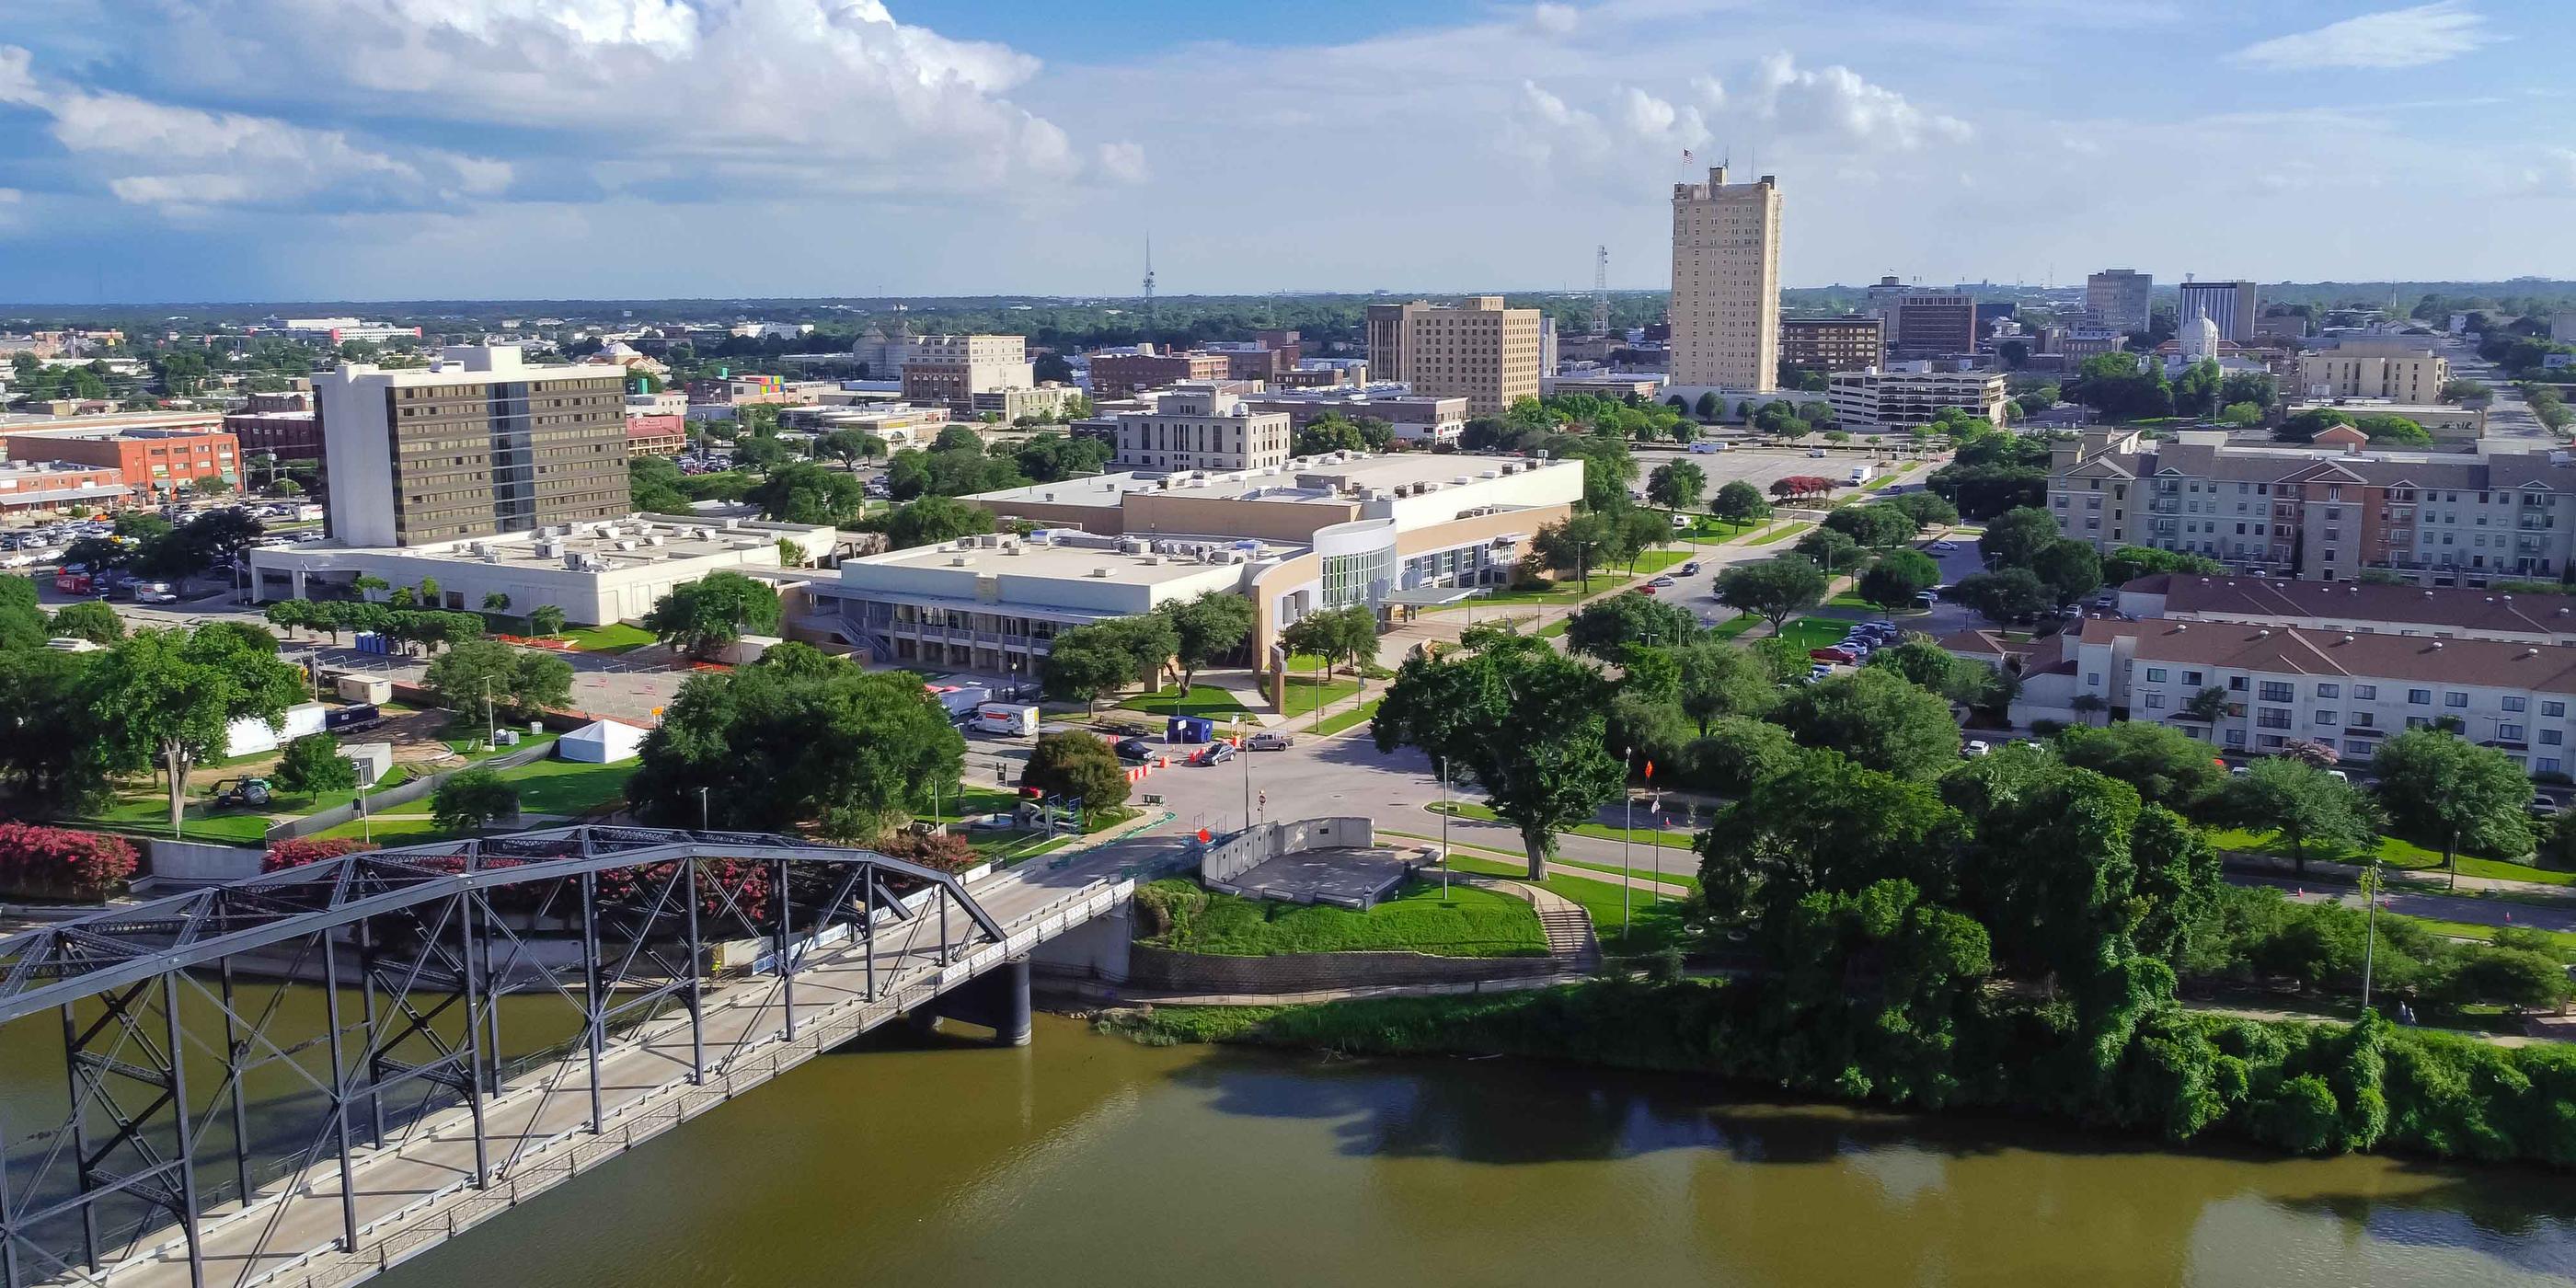
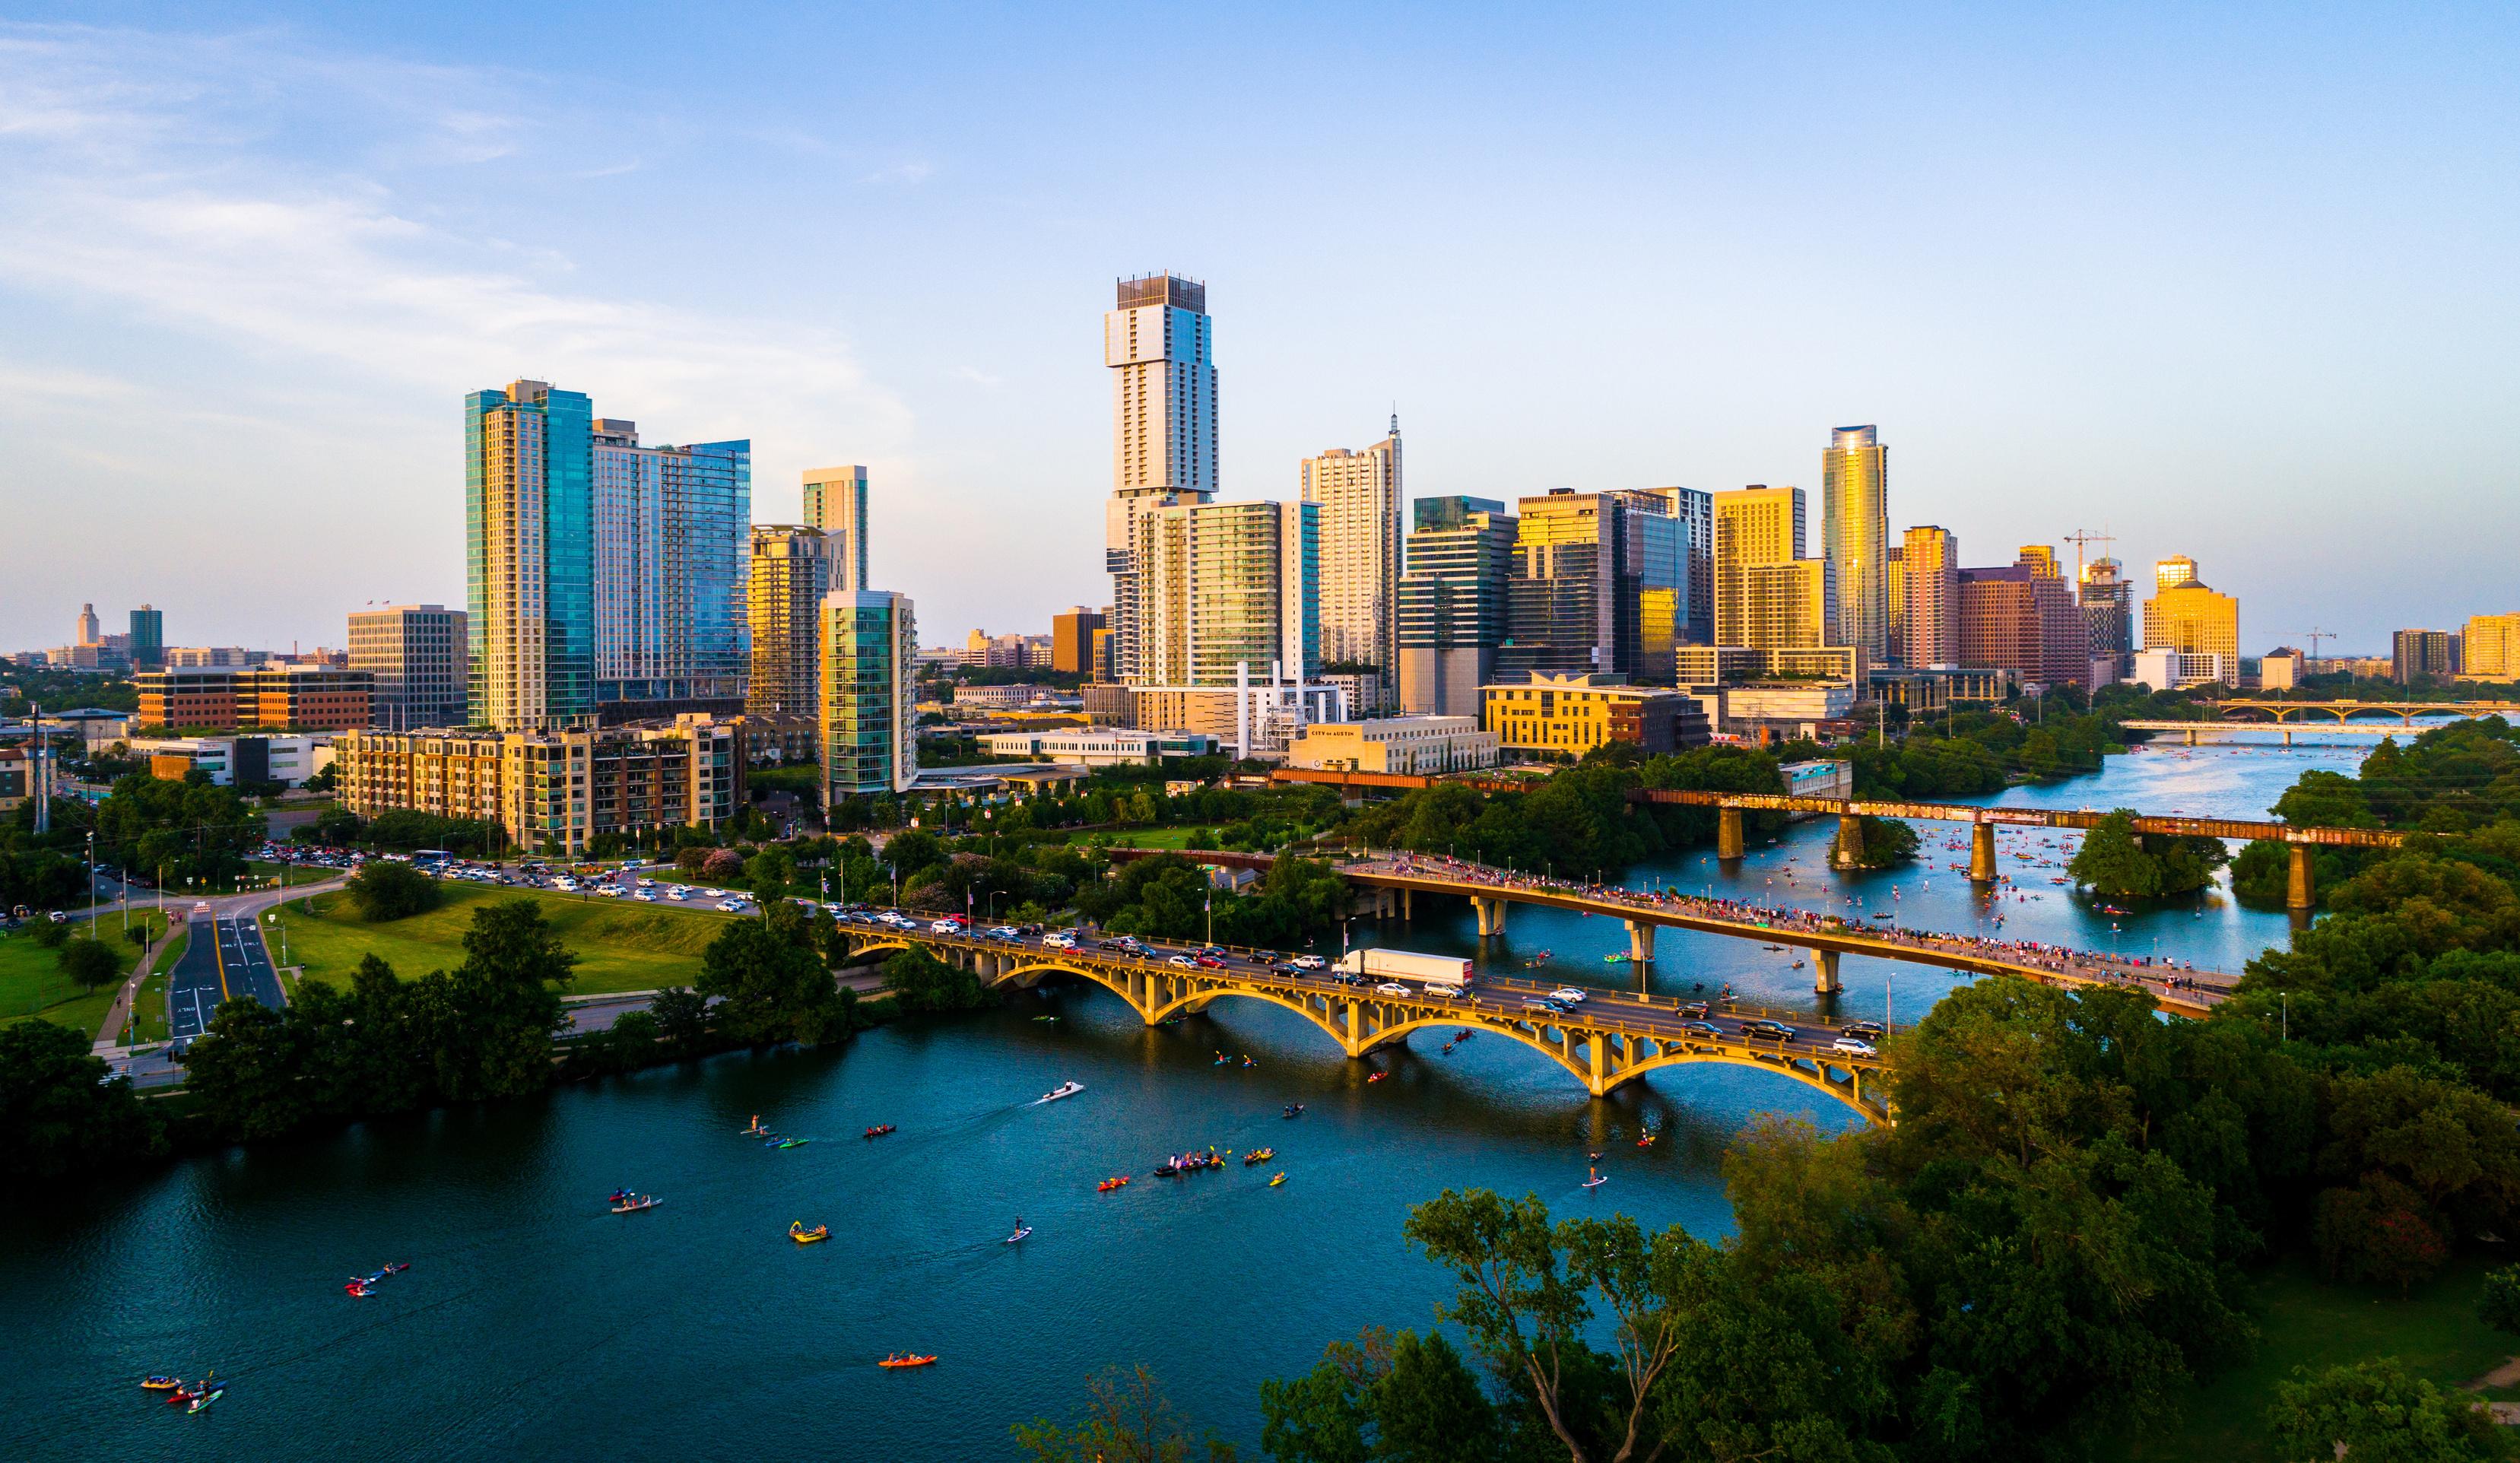
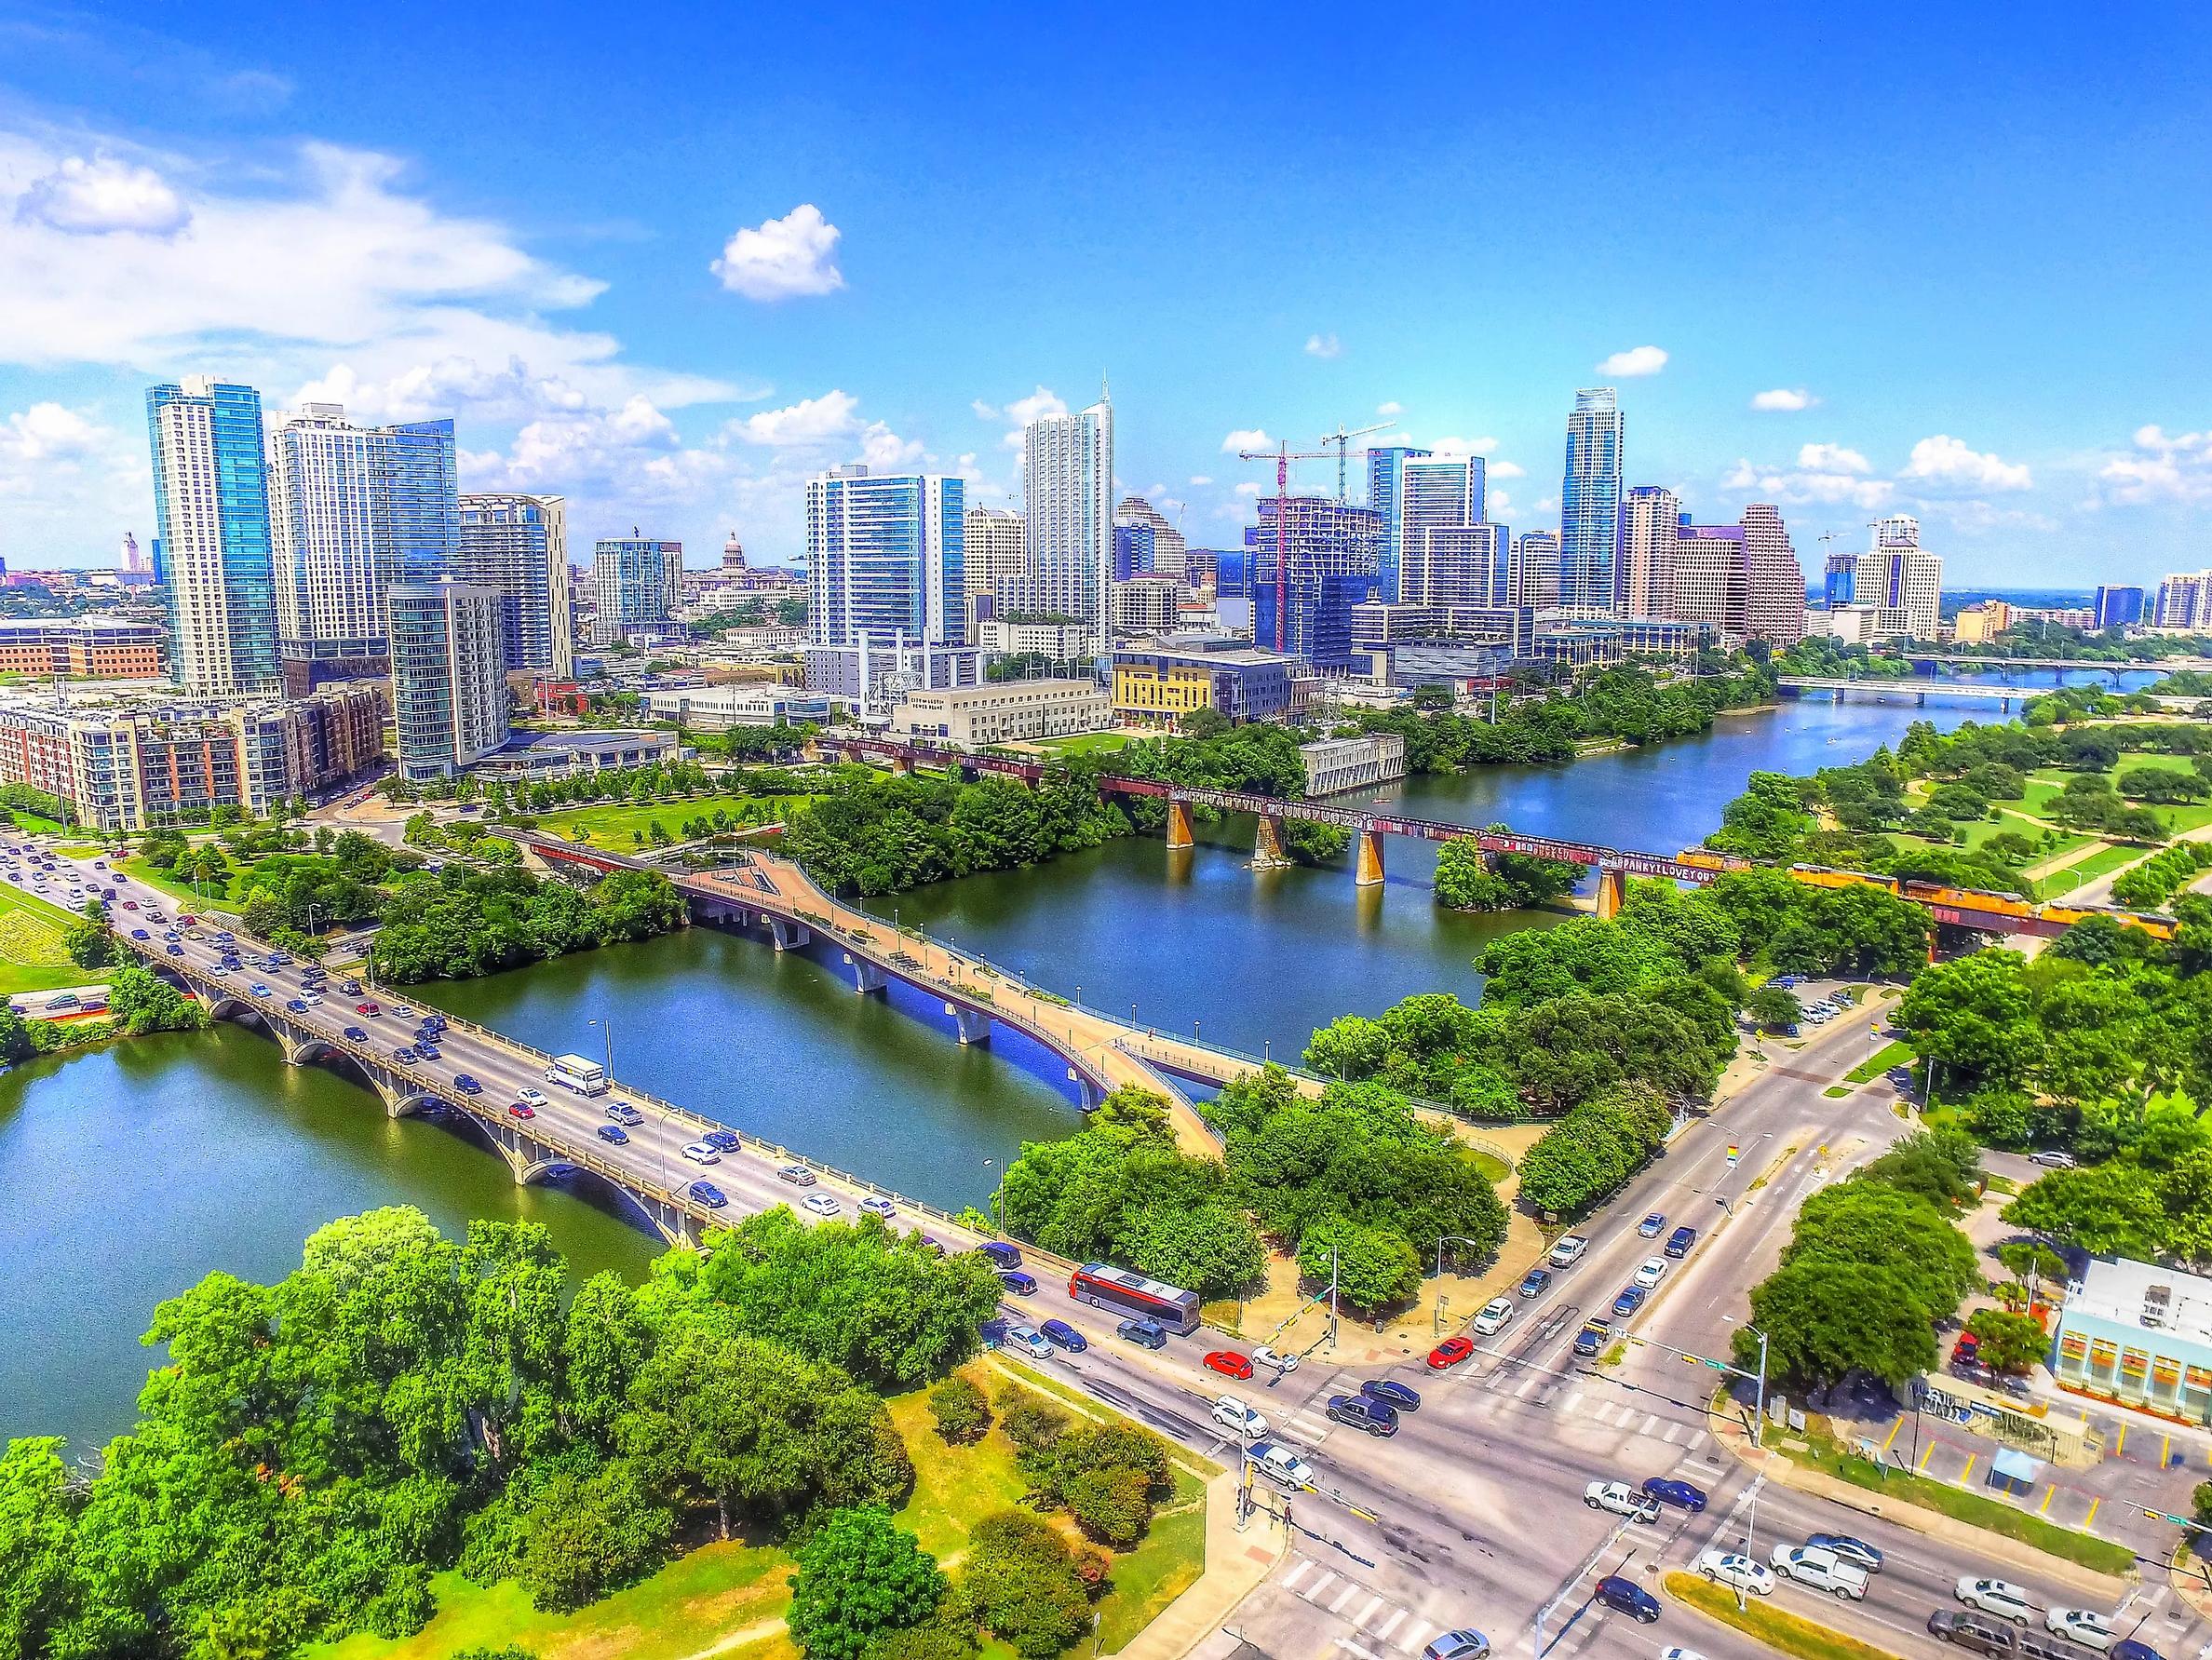
At the heart of the Texas Innovation Corridor, between Austin and San Antonio, the city’s population has increased by nearly 40 percent in the past five years. The addition of new major employers, entertainment centers, and exceptional demographics has driven continued growth.
Description # Units % Mix Avg SF Avg Rent Rent/SF 1 BR / 1 BA 138 55% 784 $1,248 $1.59 2 BR / 2 BA 114 45% 1,110 $1,531 $1.38 Total / Avg. 252 100% 931 $1,382 $1.46 Year Completed Total Units Average Unit Size (SF) Physical Occupancy Avg. In Place Rents Avg. Market Rents Units Primed for Light Upgrade 2012 252 931 SF 93% $1,382 $1,448 252 CONSIDERABLEORGANICRENTGROWTHPOTENTIAL PROPERTY SUMMARY = $66 PER UNIT IMMEDIATELY UNIT MIX

P O T E N T I A L R E T U R N S 25% 20% 15% 10% 5% 0% RISK / VOLATILITY 20% 30% 40% 50% 60% 70% 80% 90% 100% CORE CORE PLUS VALUE ADD NEW
DEVELOPMENT VILLAS AT SUNDANCE

THREE-TIERED RETURN OPTIONS
THREE-TIERED RETURN OPTIONS
THREE-TIERED RETURN OPTIONS
A three-tiered return structure gives investors options when placing their equity. Investors have the ability to invest in either tier of equity Class A, Class B, Reserve Class, or a combination of Class A and Class B. Diversifying in both A and B classes allows for a risk-adjusted, blended return.
THREE-TIERED EQUITY


Allows Investors to Match Investment Goals


8
Minimum Investment Minimum Investment Minimum Investment $50,000 $50,000 $500,000 Prioritized Cash Flow 10% Preferred Return No Profit Share 7% Preferred Return 70/30 Profit Share 8% Preferred Return 80/20 Profit Share
structure


LP Equity Pref. Hold Period Equity Multiple Avg. CoC AAR offering CAPITAL STRUCTURE Purchase Debt Total Equity DEBT LP: CLASS A LP: CLASS B LP: RESERVE $2,000,000 10% 5 Years 1.5x 10% 10% $13,000,000 7% 5 Years 1.8x-2.0x 5.6% 16%-20% $5,000,000 8% 5 Years 1.9x-2.1x 5.6% 18%-22% $5M $37,350,000 $24,178,000 $19,995,774 $13M $2M $24M


Annual Percent Return Annual Distribution Equity Split Total Expected Return Including Return of Principal ($100k) Year 1 Year 2 Year 3 Year 4 Year 5 Annual Percent Return Annual Distribution Equity Split (70/30) Total Expected Return Including Return of Principal ($100k) Annual Percent Return Annual Distribution Equity Split (80/20) Total Expected Return Including Return of Principal ($500k) 10% 10% 10% 10% 10% $10,000 $10,000 $10,000 $10,000 $10,000 $150,000 4% 5% 6% 6% 7% $4,000 $5,000 $6,000 $6,000 $7,000 $190,000 4% 5% 6% 6% 7% $20,000 $25,000 $30,000 $30,000 $35,000 $1,000,000 $0 $62,000 $360,000
$100,000 INVESTMENT returns
INVESTOR

40 2027 2027 60% 60% 40% 40% 20% 20% 2024 2024 2025 2025 2026 2026 0% 0% bonus TAX BENEFITS DEPRECIATION
SENSITIVITY analysis
Cap Rates Exit Price IRR Equity Multiple AAR 4.60% $70,163,761 16.16% 2.00x 19.98% 4.70% $68,670,915 15.67% 1.96x 19.17% 4.80% $67,240,271 15.20% 1.92x 18.40% 4.90% $65,868,020 14.73% 1.88x 17.67% 5.00% $64,550,660 14.27% 1.85x 16.96% 5.10% $63,284,961 13.83% 1.81x 16.28% 5.20% $62,067,942 13.39% 1.78x 15.62% 5.30% $60,896,849 12.96% 1.75x 14.98% 5.40% $59,769,130 12.38% 1.71x 14.13%
CLASSB
Cap Rates Exit Price IRR Equity Multiple AAR 4.60% $70,163,761 17.26% 2.09x 21.82% 4.70% $68,670,915 16.79% 2.05x 21.01% 4.80% $67,240,271 16.33% 2.01x 20.24% 4.90% $65,868,020 15.88% 1.98x 19.51% 5.00% $64,550,660 15.44% 1.94x 18.80% 5.10% $63,284,961 15.02% 1.91x 18.12% 5.20% $62,067,942 14.60% 1.87x 17.46% 5.30% $60,896,849 14.19% 1.84x 16.83% 5.40% $59,769,130 13.80% 1.81x 16.23% RESERVECLASS analysis
SENSITIVITY

ANALYSISfinancial V I L L A S | 2 0 1 2 A U S T I N - S A N A N T O N I O M E T R O P L E X

LOAN PRINCIPAL $24,178,000 LOAN TO VALUE 66% LTV INTEREST RATE 5.70% FIXED OR ADJUSTABLE Fixed AMORTIZING PERIOD 30 INTEREST ONLY 24 Months *Subjecttochangebeforeclosing
DEBT
$19.5 M increase in value
INCOME 1 2 3 4 5 Gross Potential Income 4,449,026 4,594,909 4,822,036 5,071,156 5,317,292 - Loss to Lease -109,156 -2.50% -22,975 -0.50% -24,110 -0.50% -25,356 -0.50% -26,586 -0.50% - Vacancy -348,094 -7.80% -321,644 -7.00% -337,543 -7.00% -299,625 -5.90% -265,865 -5.00% - Concessions -74,280 -1.70% -37,611 -0.80% -18,846 -0.40% -15,213 -0.30% -15,952 -0.30% - Models, Office, Employee Units -31,361 -0.70% -32,774 -0.70% -34,394 -0.70% -36,171 -0.70% -37,927 -0.70% - Bad Debt -7,537 -0.20% -22,975 -0.50% -24,110 -0.50% -25,356 -0.50% -26,586 -0.50% Effective Gross Rental Income 3,878,598 4,156,931 4,383,033 4,669,435 4,944,376 Other Income 422,799 435,659 448,910 462,564 476,634 Private yards 18,333 48,221 50,021 51,542 53,110 Total Net Income 4,319,731 4,640,811 4,881,964 5,183,542 5,474,119 Renovations Units renovated 0 42 84 84 42 Renovation Premiums earned 0 4,200 8,400 8,400 4,200 EXPENSES /unit /unit /unit /unit /unit Real Estate Taxes 633,418 2,514 647,701 2,570 654,208 2,596 660,780 2,622 667,418 2,648 Insurance 222,398 883 226,887 900 231,466 919 236,138 937 240,905 956 Contract Services 60,589 240 61,812 245 63,060 250 64,333 255 65,631 260 Electric 50,023 199 51,032 203 52,063 207 53,113 211 54,185 215 Gas 764 3 779 3 795 3 811 3 827 3 Water and Sewer 220,291 874 224,737 892 229,273 910 233,901 928 238,622 947 Trash Removal 77,465 307 79,029 314 80,624 320 82,251 326 83,912 333 Other Utilities 12,374 49 12,624 50 12,879 51 13,139 52 13,404 53 Management Fee 129,592 514 139,224 552 146,459 581 155,506 617 164,224 652 Repairs and Maintenance 152,848 607 155,933 619 159,081 631 162,292 644 165,567 657 General/Admin 76,424 303 77,967 309 79,540 316 81,146 322 82,784 329 Advertising and Leasing 50,949 202 51,978 206 53,027 210 54,097 215 55,189 219 Payroll 382,120 1,516 389,833 1,547 397,702 1,578 405,729 1,610 413,918 1,643 Total Expenses 2,069,256 8,211 2,119,537 8,411 2,160,176 8,572 2,203,236 8,743 2,246,586 8,915 %EGI 47.90% 45.70% 44.20% 42.50% 41.00% Net Operating Income (NOI) $2,250,475 $2,521,274 $2,721,789 $2,980,305 $3,227,533
closing $19.5M INCREASE IN VALUE P R O F O R M A
*Subject to change before
upside
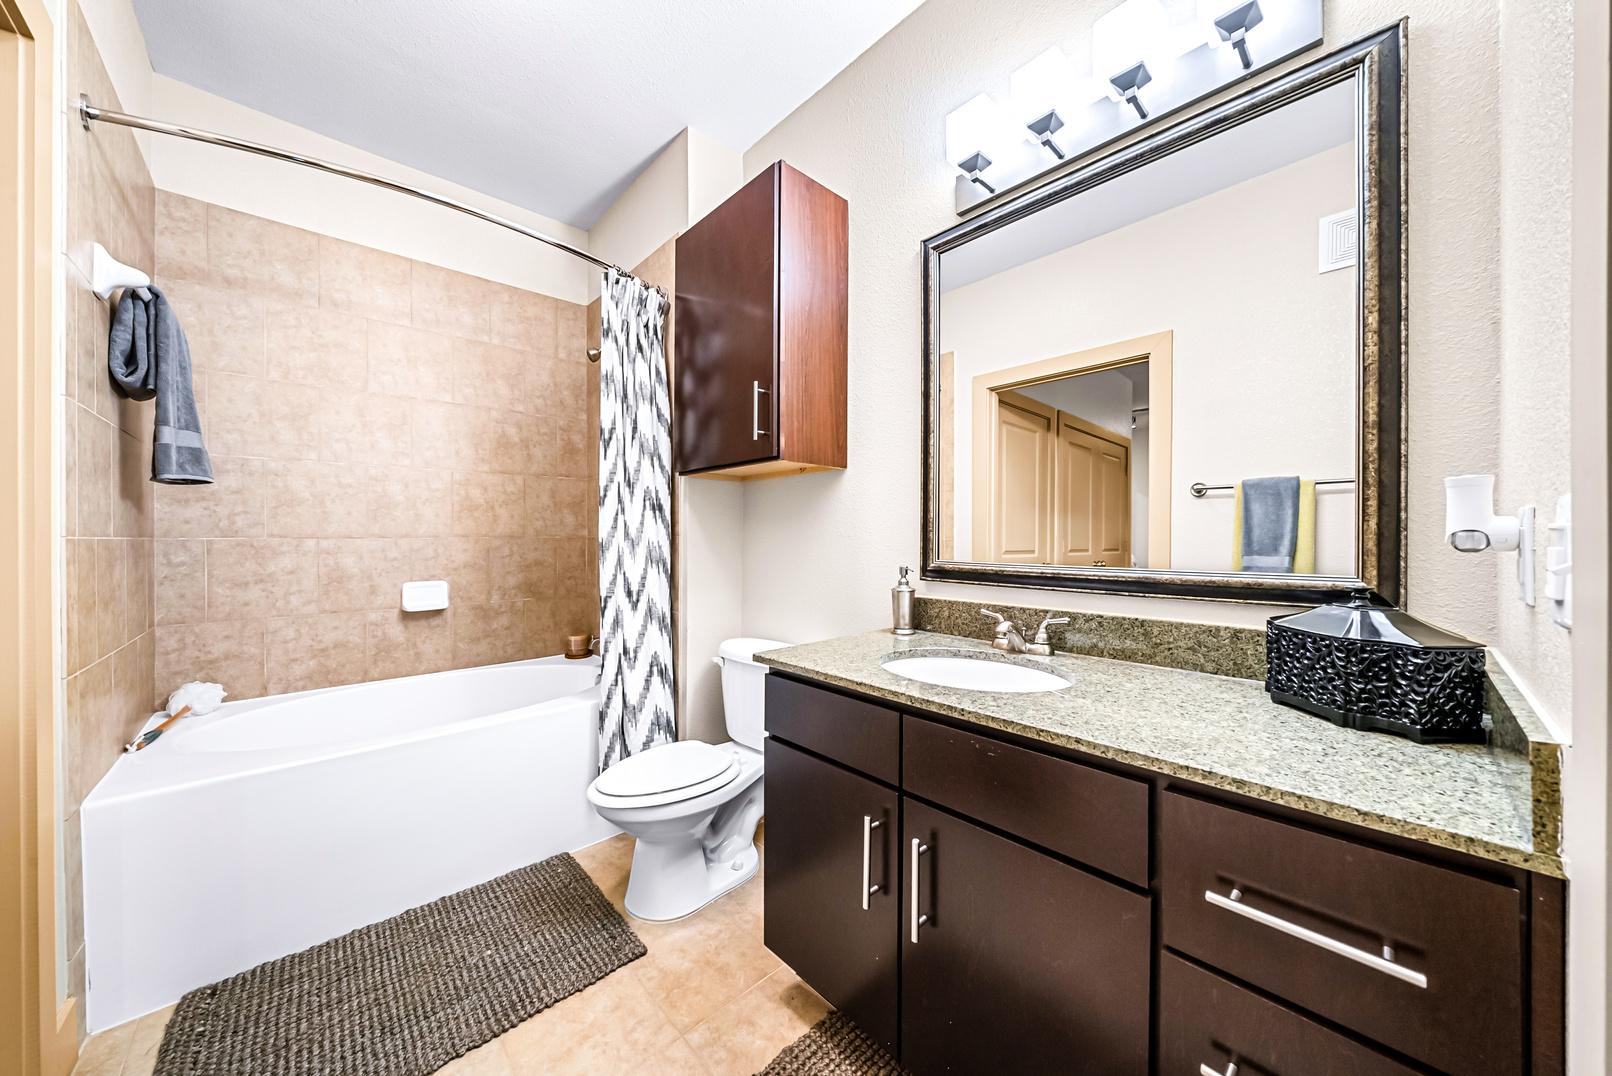
LIGHT UPGRADES
252 VALUE-ADD 1 Bedroom / 1 Bathroom 138 Units 675-844 SF 2 Bedroom / 2 Bathroom 114 Units 1,025 - 1,162 SF
UNITS AVAILABLE FOR
=
100%


C L A S S I C U N I T S1 0 0 %
$5,000

UPGRADE PER UNIT
Units Available for Upgrades 100%
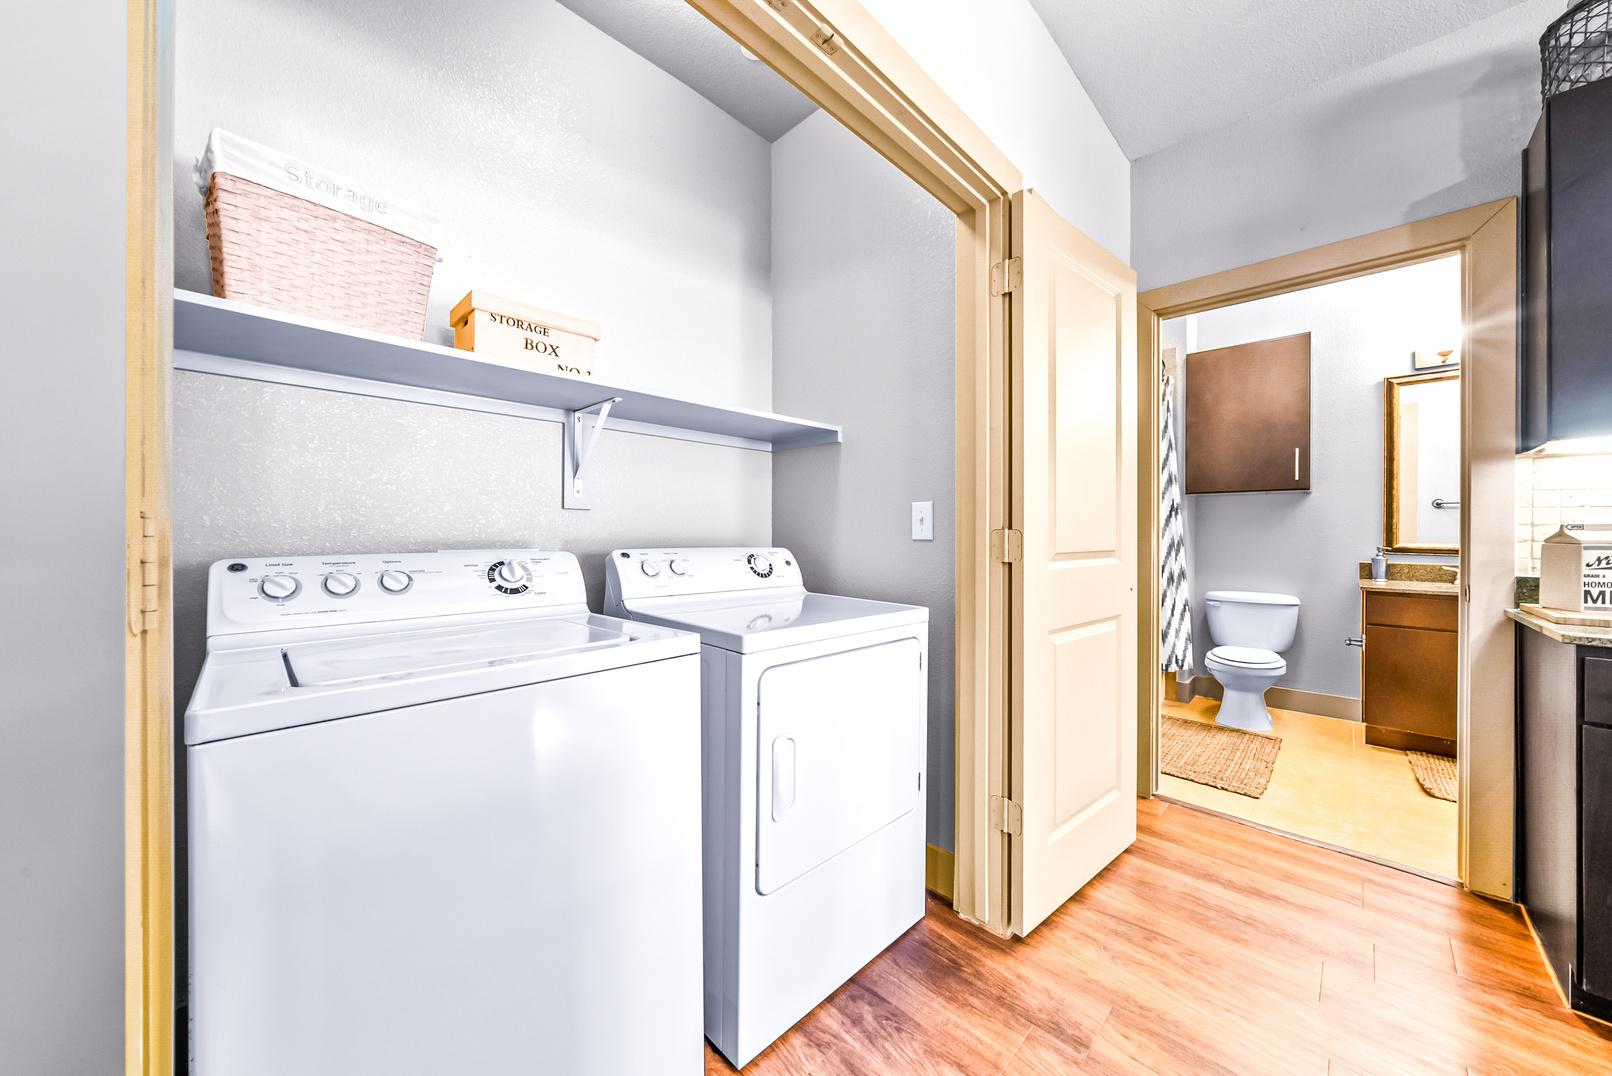
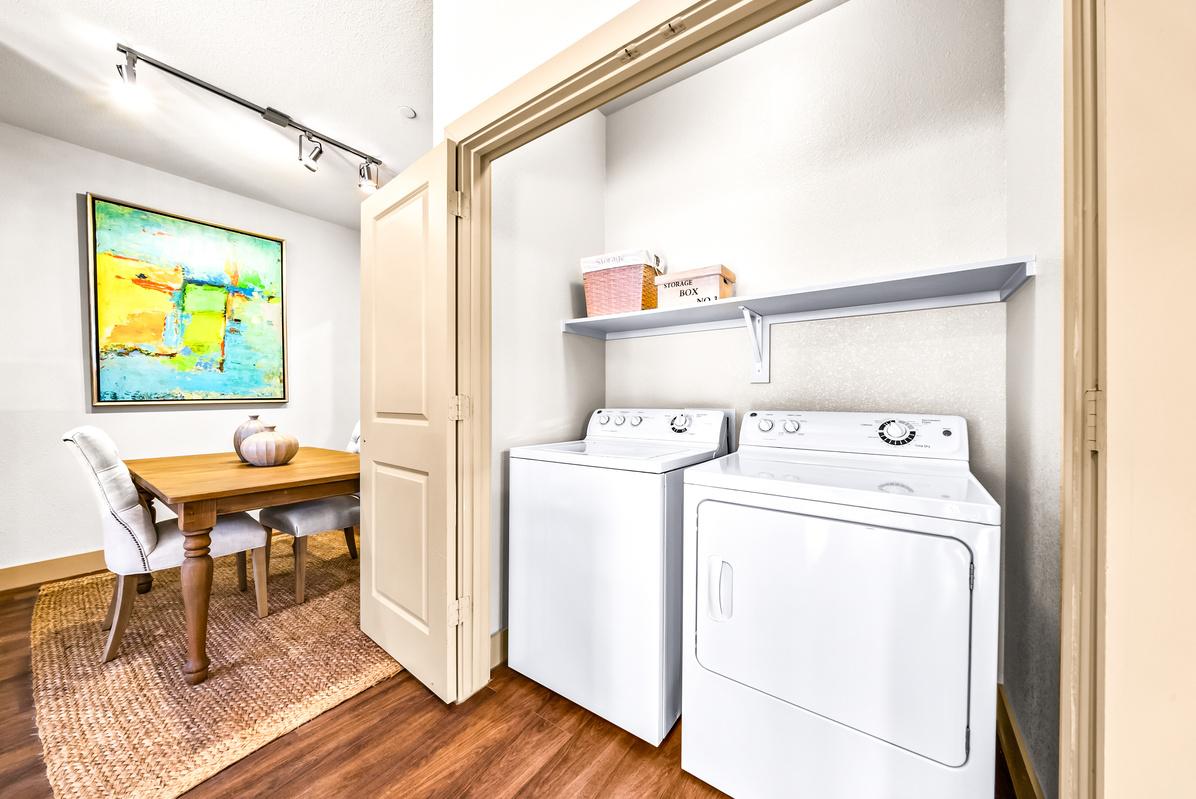
Full-Sized Washer & Dryer
Stainless Steel
Ceiling
Ceramic
Built-In
Kitchen
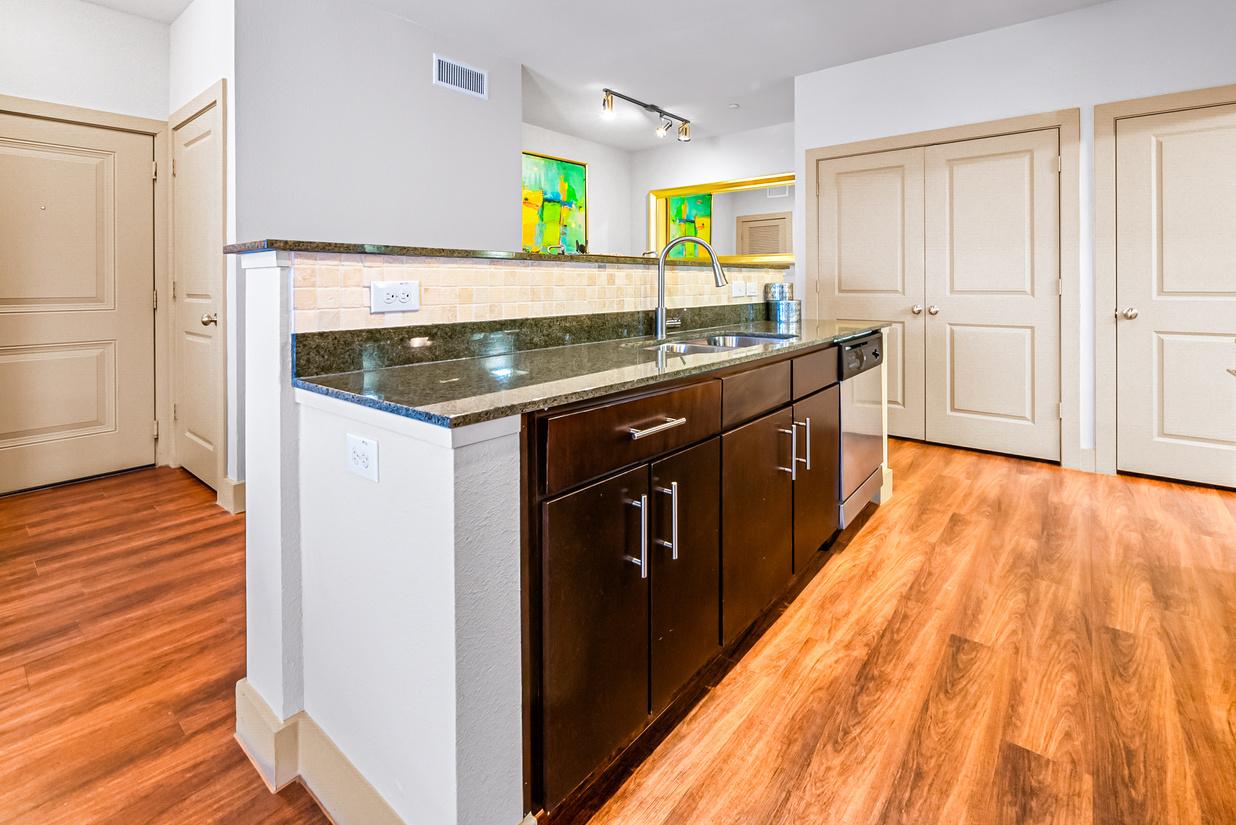
Granite
Kitchen
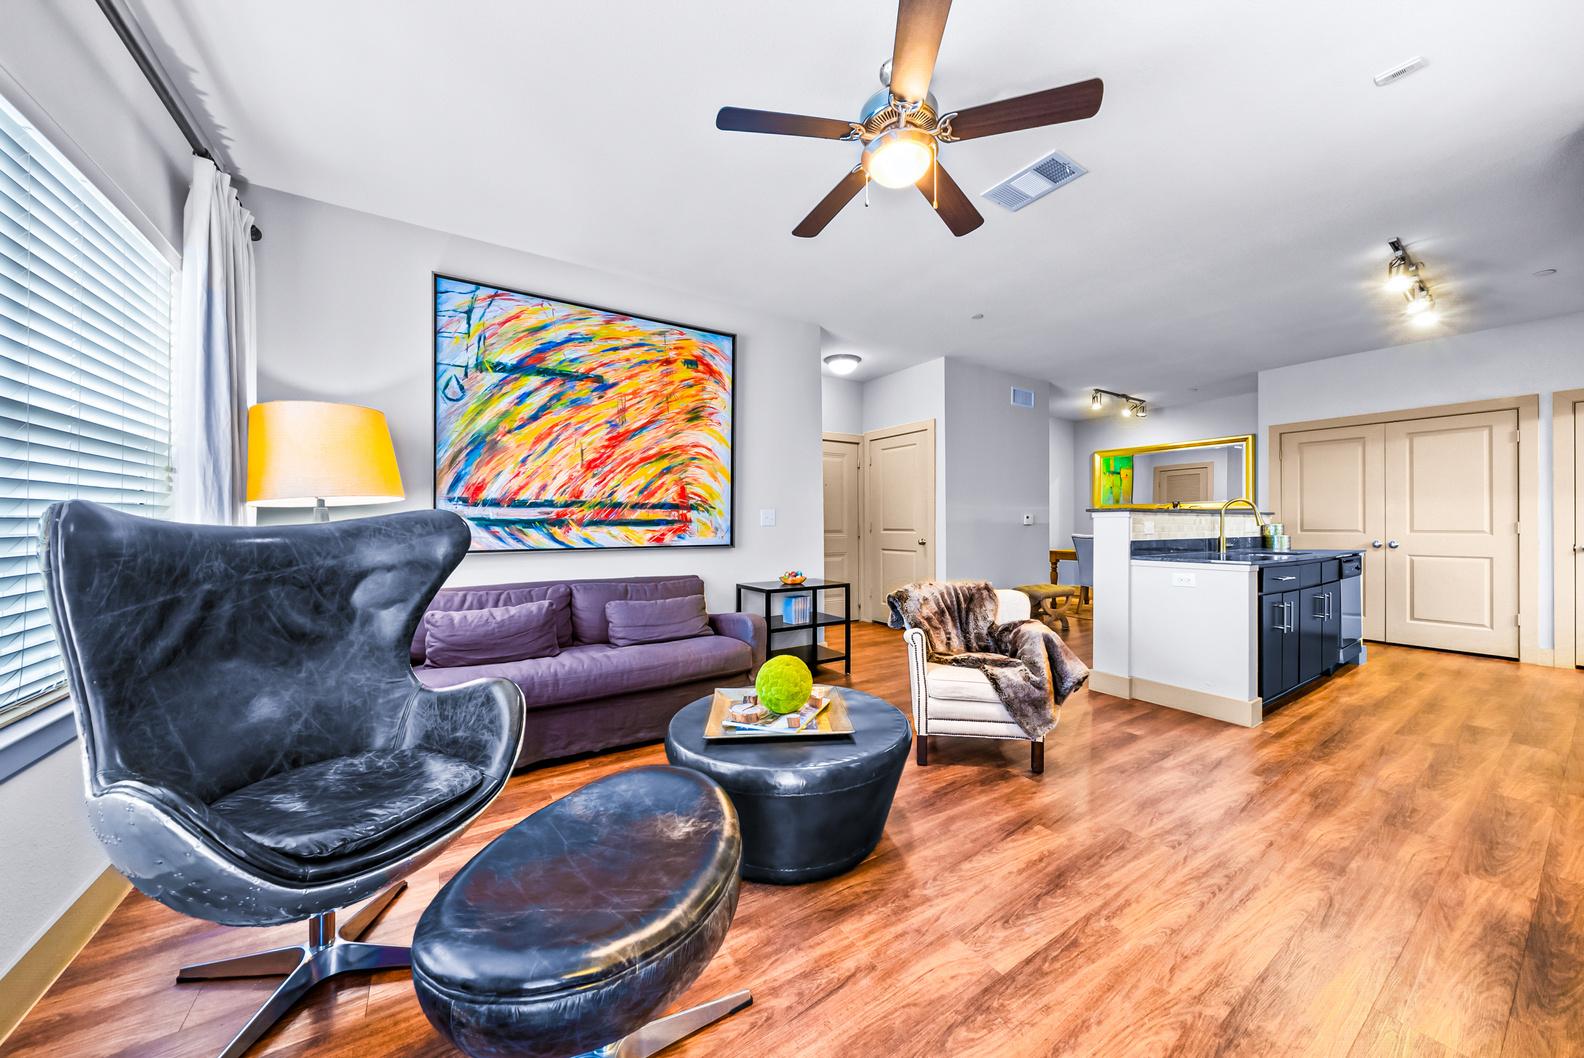
Wood-Style Flooring
Appliances
Fans
Tile
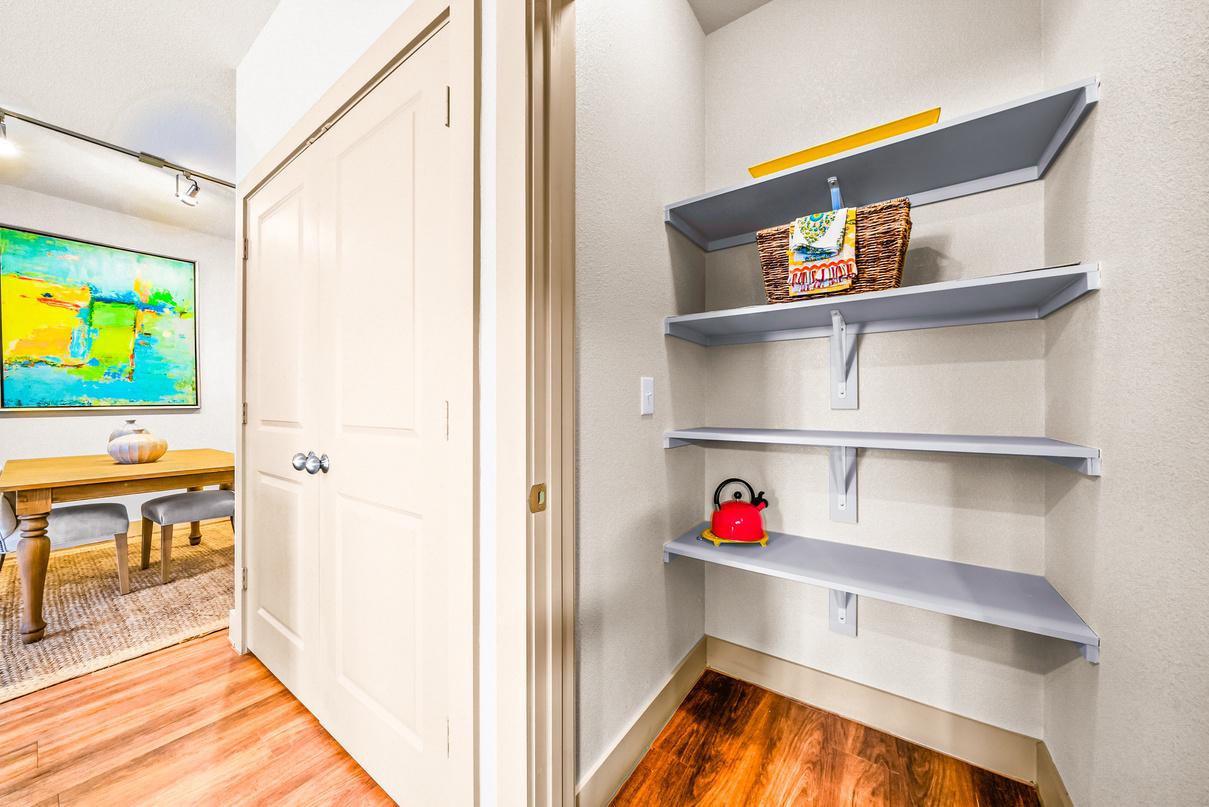
Shelves
Island
Countertops
Pantry European-Style Cabinetry
DESCRIPTION property V I L L A S | 2 0 1 2 A U S T I N - S A N A N T O N I O M E T R O P L E X


Water/Sewer Hot Water Gas Electric Trash Cable & Internet City of New Braunfels Individual Water Heaters City of New Braunfels City of New Braunfels New Braunfels & Valet Living Spectrum Application Fee Administration Fee Security Deposit Pet Fee Pet Rent Month-to-Month e Story Garden Style Elevators in Building #2 crete Slab ted Concrete and Stucco hed & Composite Asphalt gle per et information
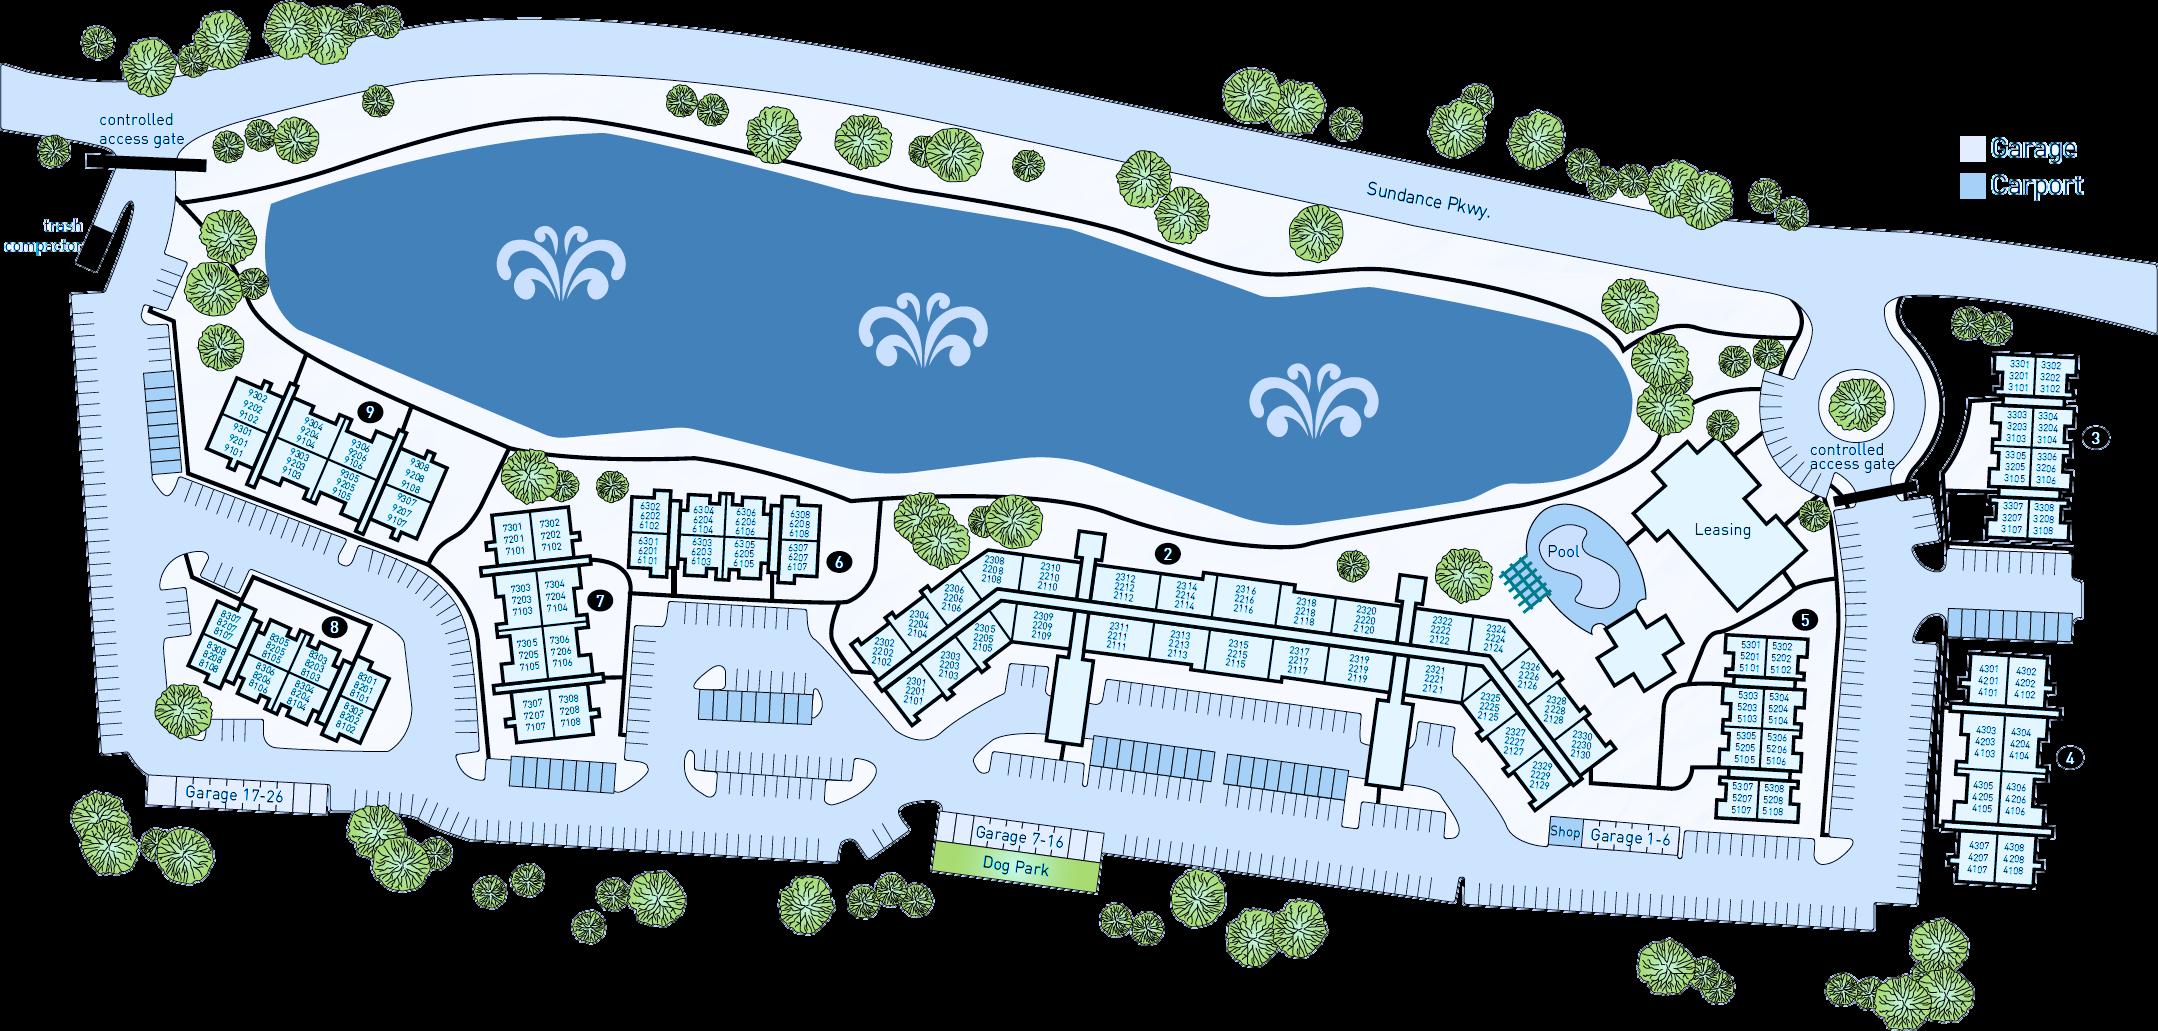
Address Year Built Number of Units Total Square Feet Average Unit Size Site Size Density 2056 Sundance Parkway 2012 252 234,666 Square Feet 931 Square Feet 11.57 Acres 21.8 Units Per Acre Overview Carports Detached Garages Open Spaces Total Spaces Parking Ratio 50 26 379 455 1.81 Spaces per Unit Laundry Washer /Dryer All Units - Full Sized Utilities Leasing Fees $60 / Applicant $200 $250 $300 Non-Refundable $20 $300 Upcharge Overview Resident Property Resident Resident Resident
Parking/Garage
SITE plan VILLAS AT SUNDANCE
COMMUNITY amenities
Resort-style pool
Expansive clubhouse
Common area Wi-Fi
Business center
Lounge
Storage space
Planned social activities
Pet play area
Fitness center
Bike storage
Gated community
Grills Pond
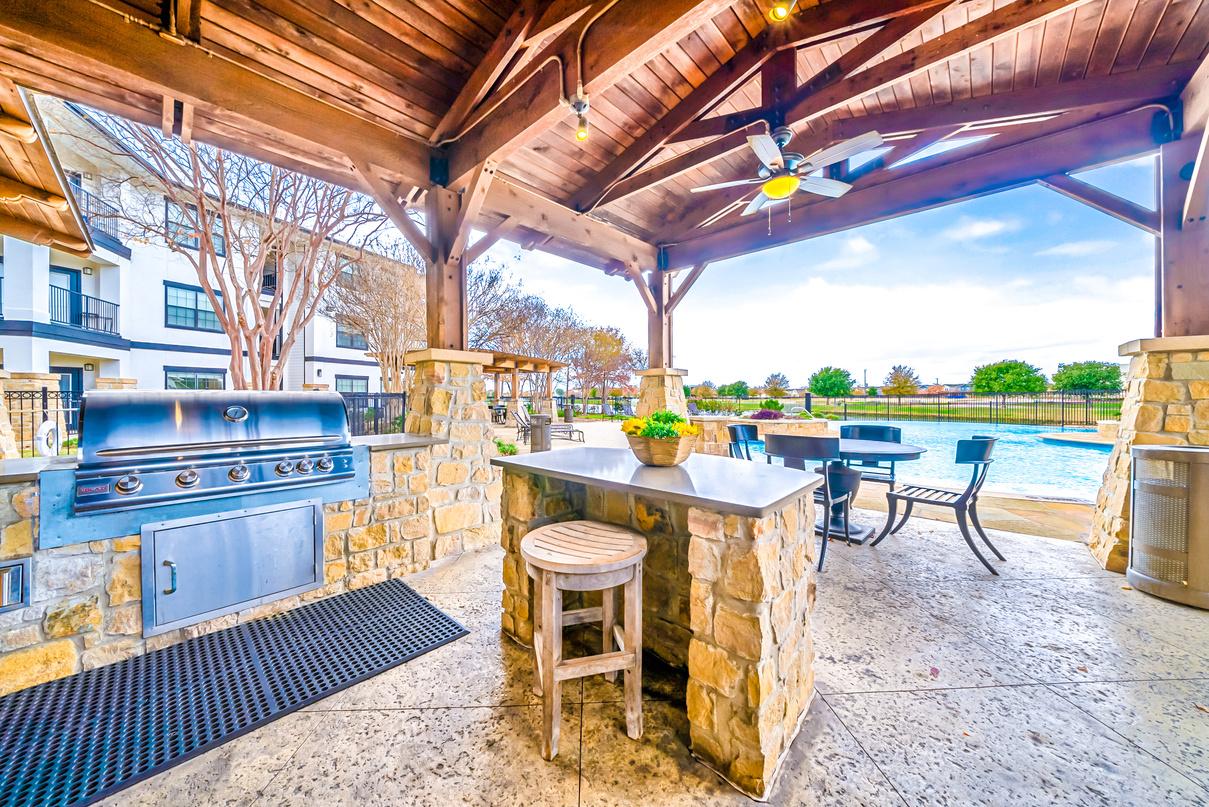

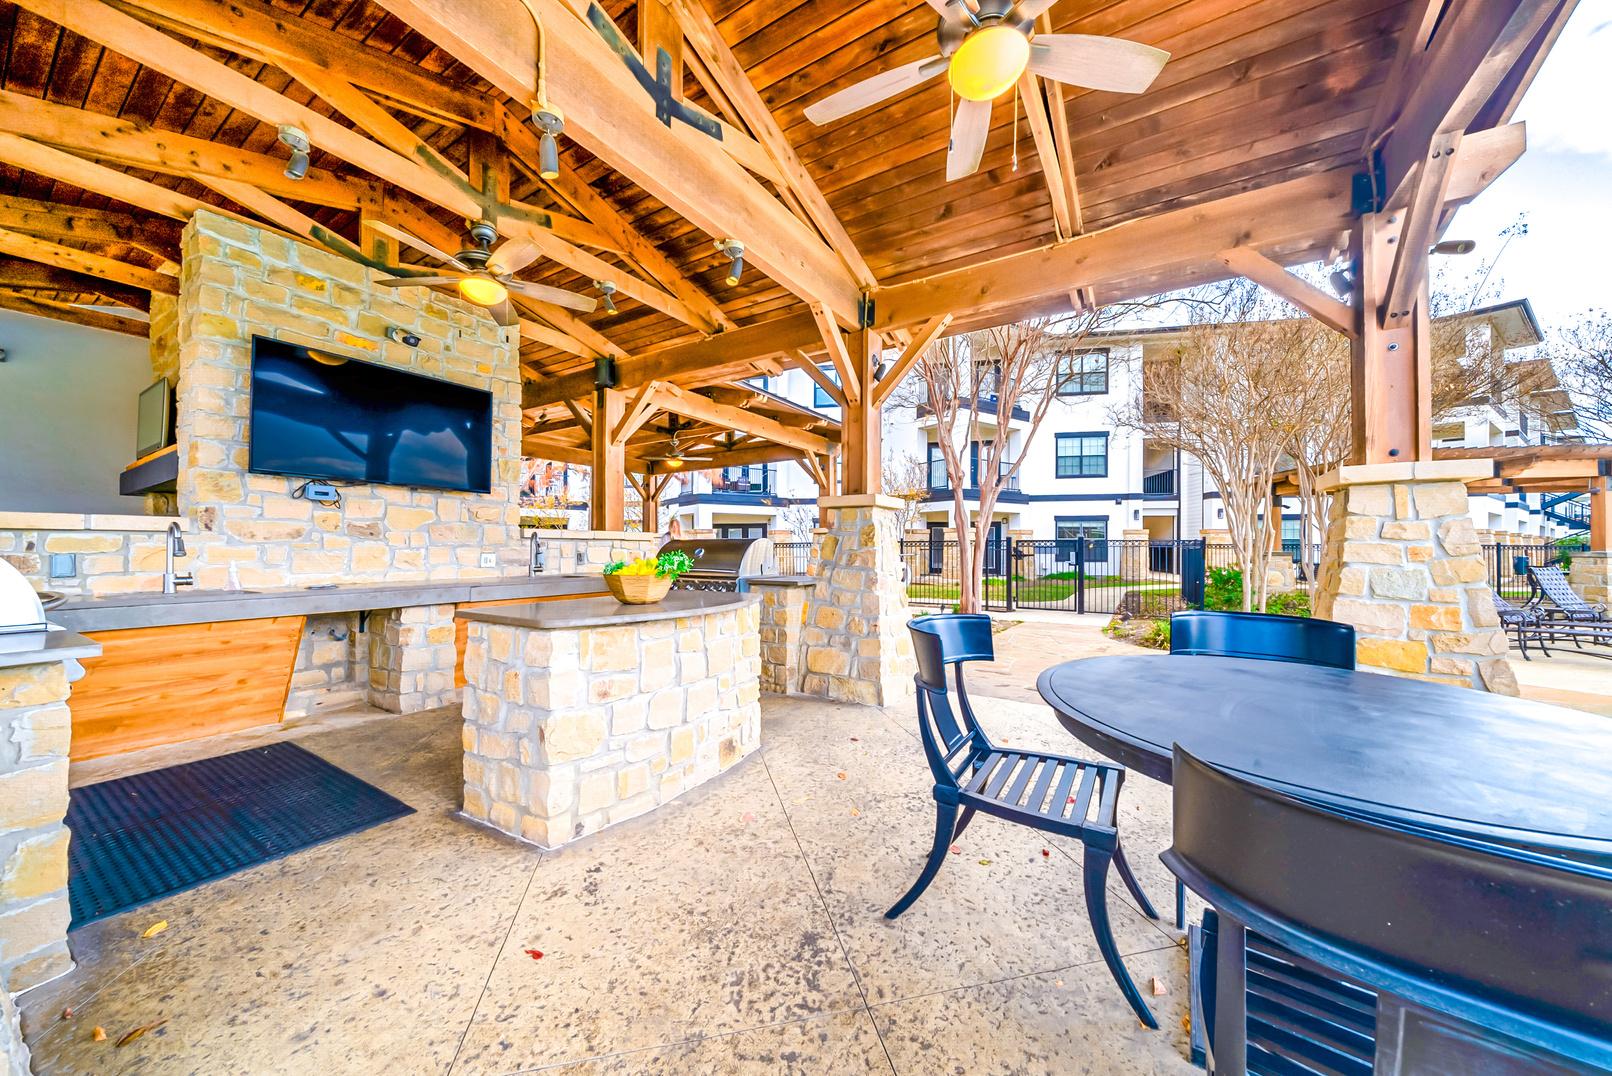
RESORT-STYLEPOOL OUTDOORKITCHEN
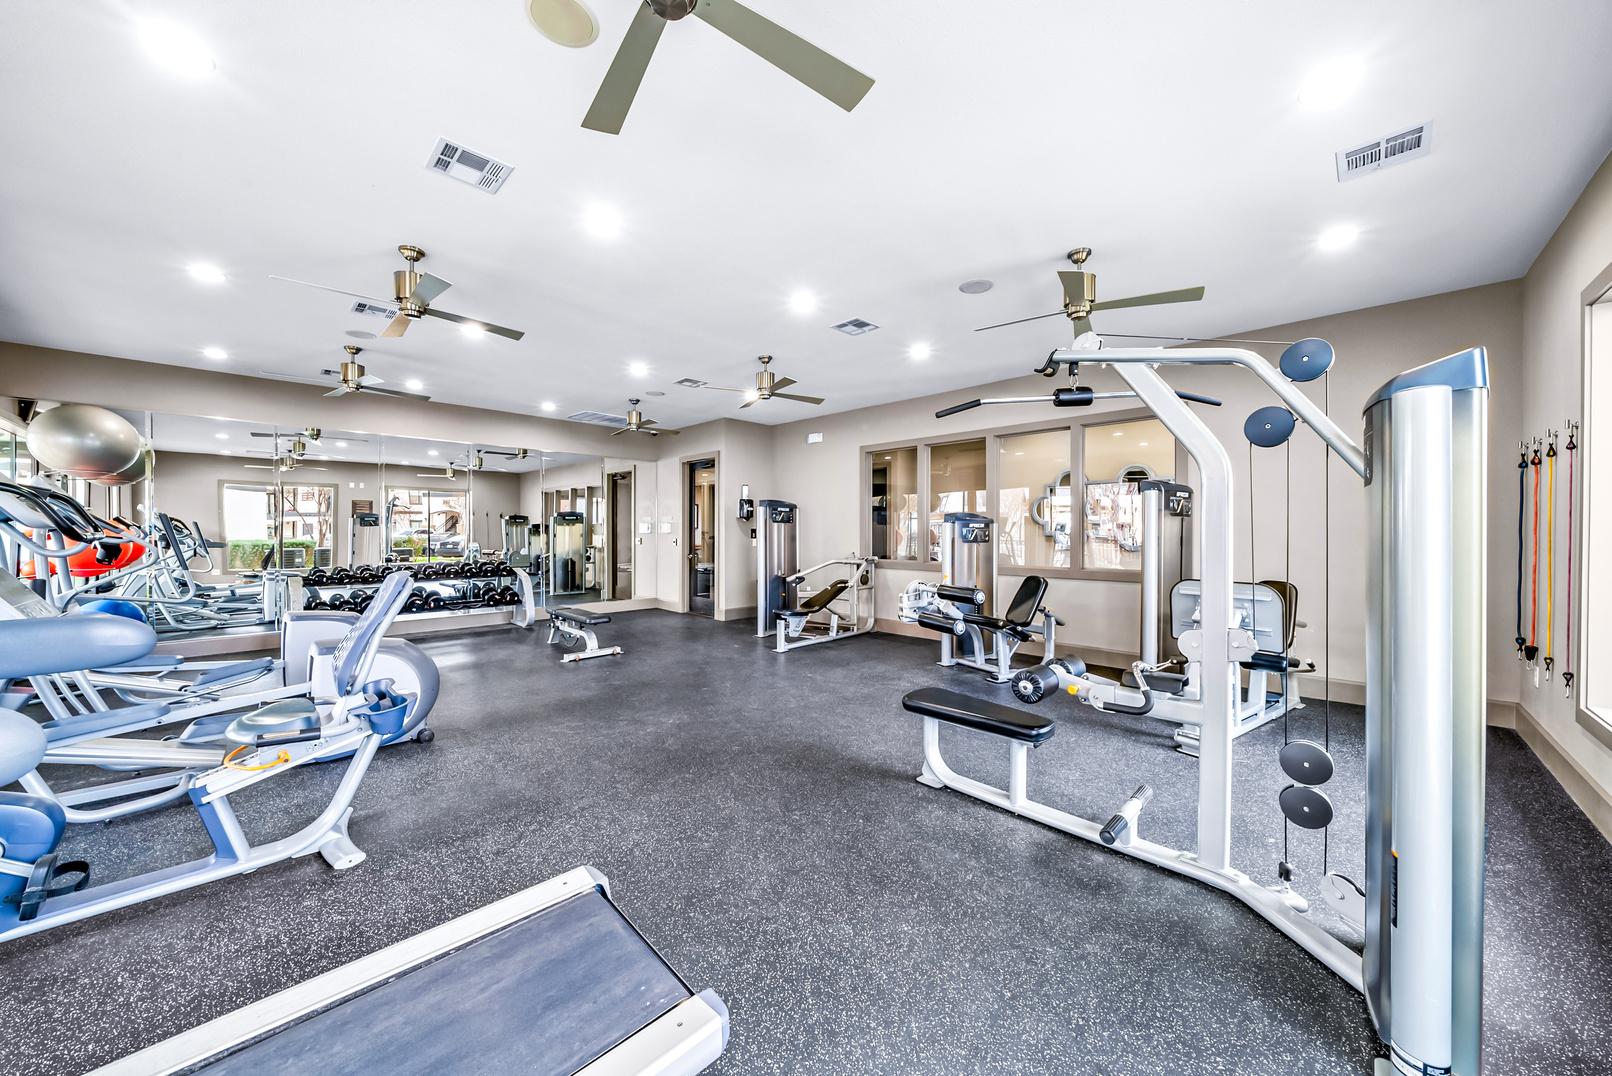
MODERNFITNESSCENTER
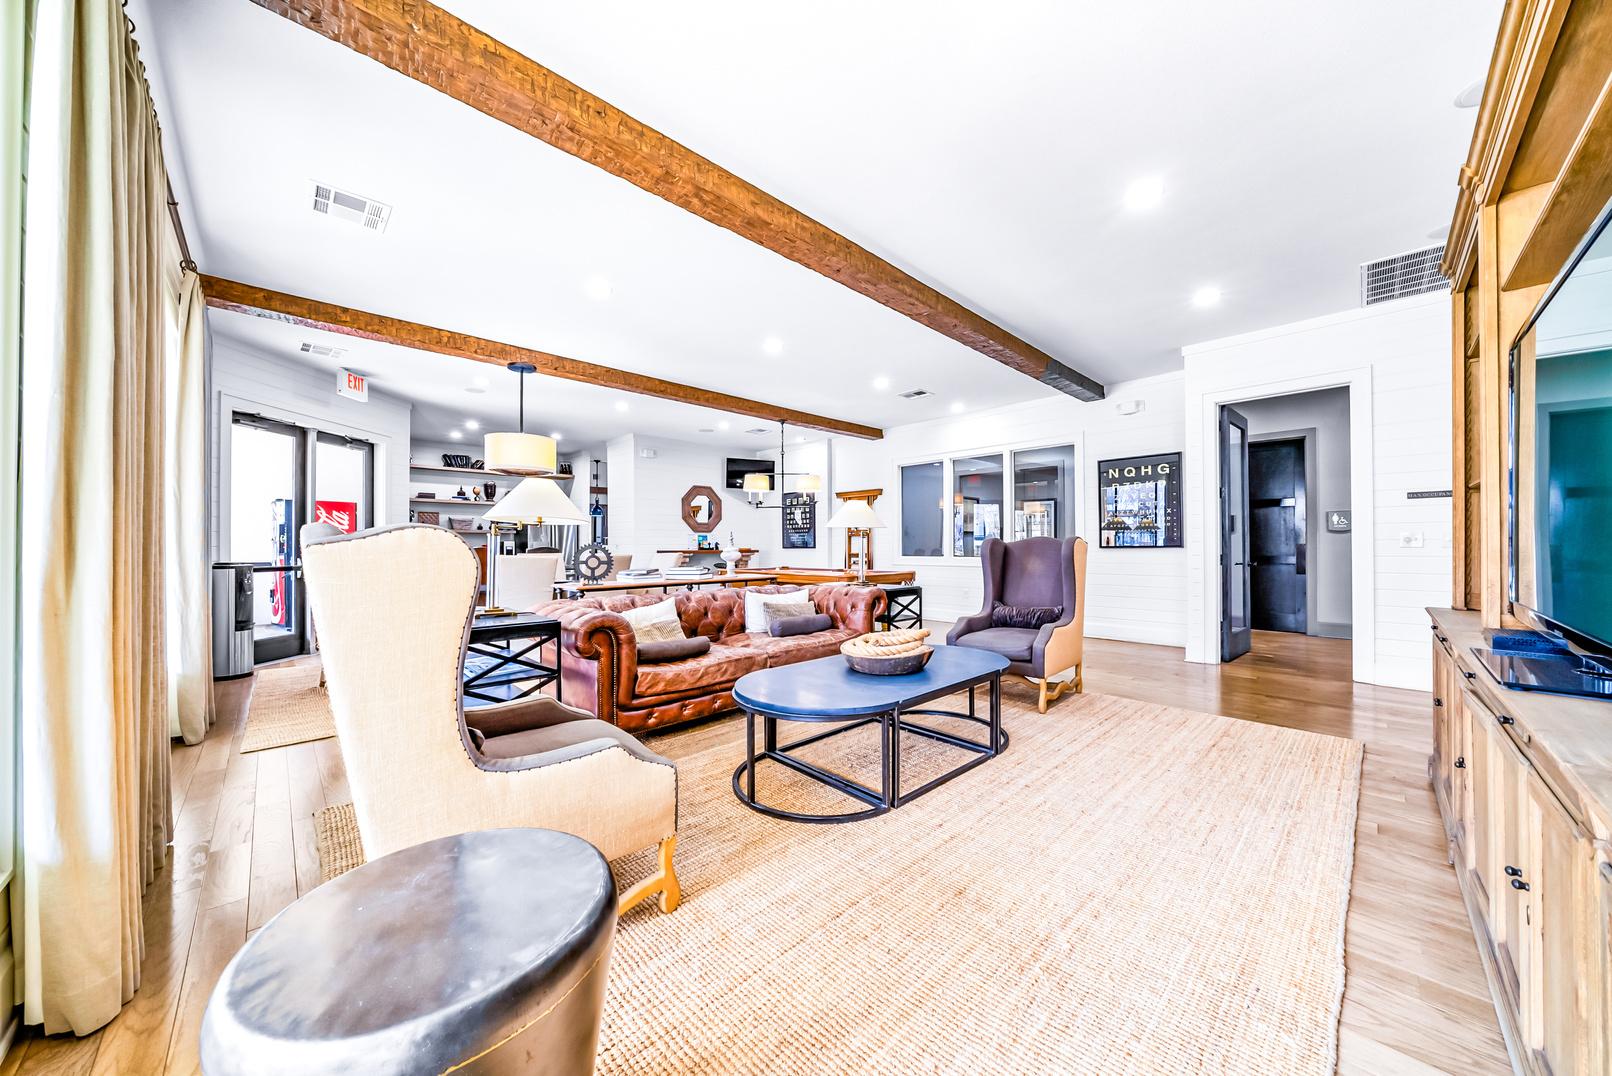
RESIDENTCLUBHOUSE
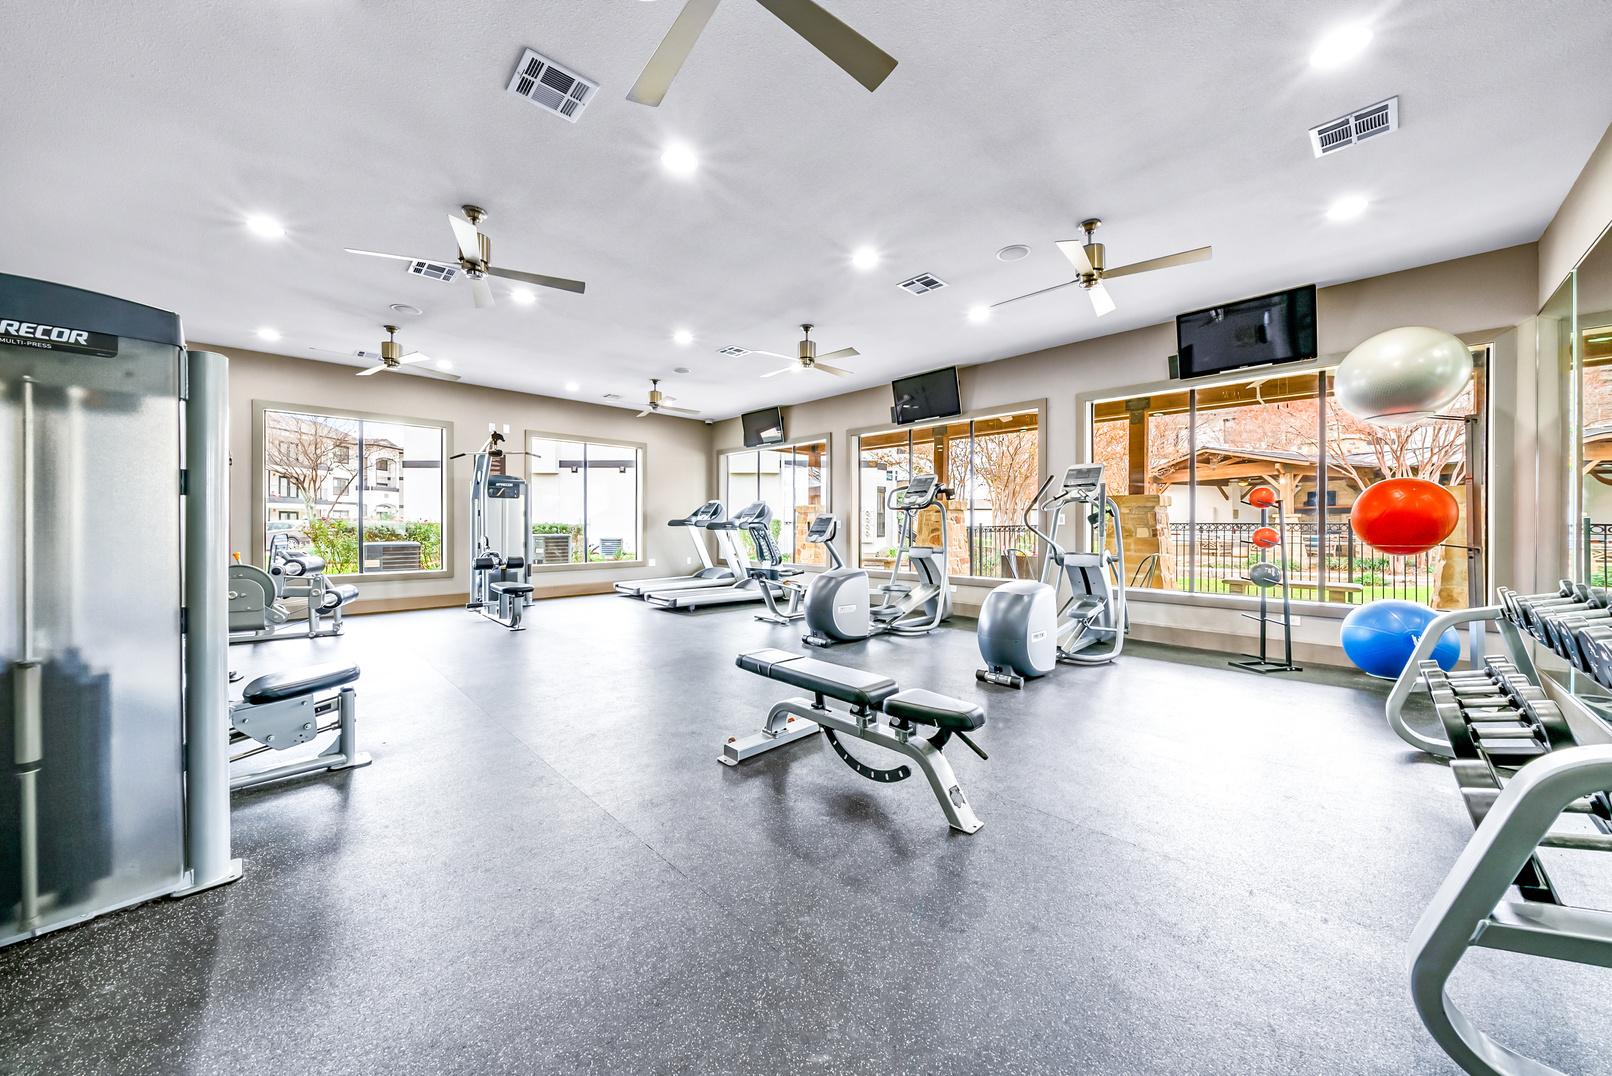
E L I T E F I T N E S S C E N T E R
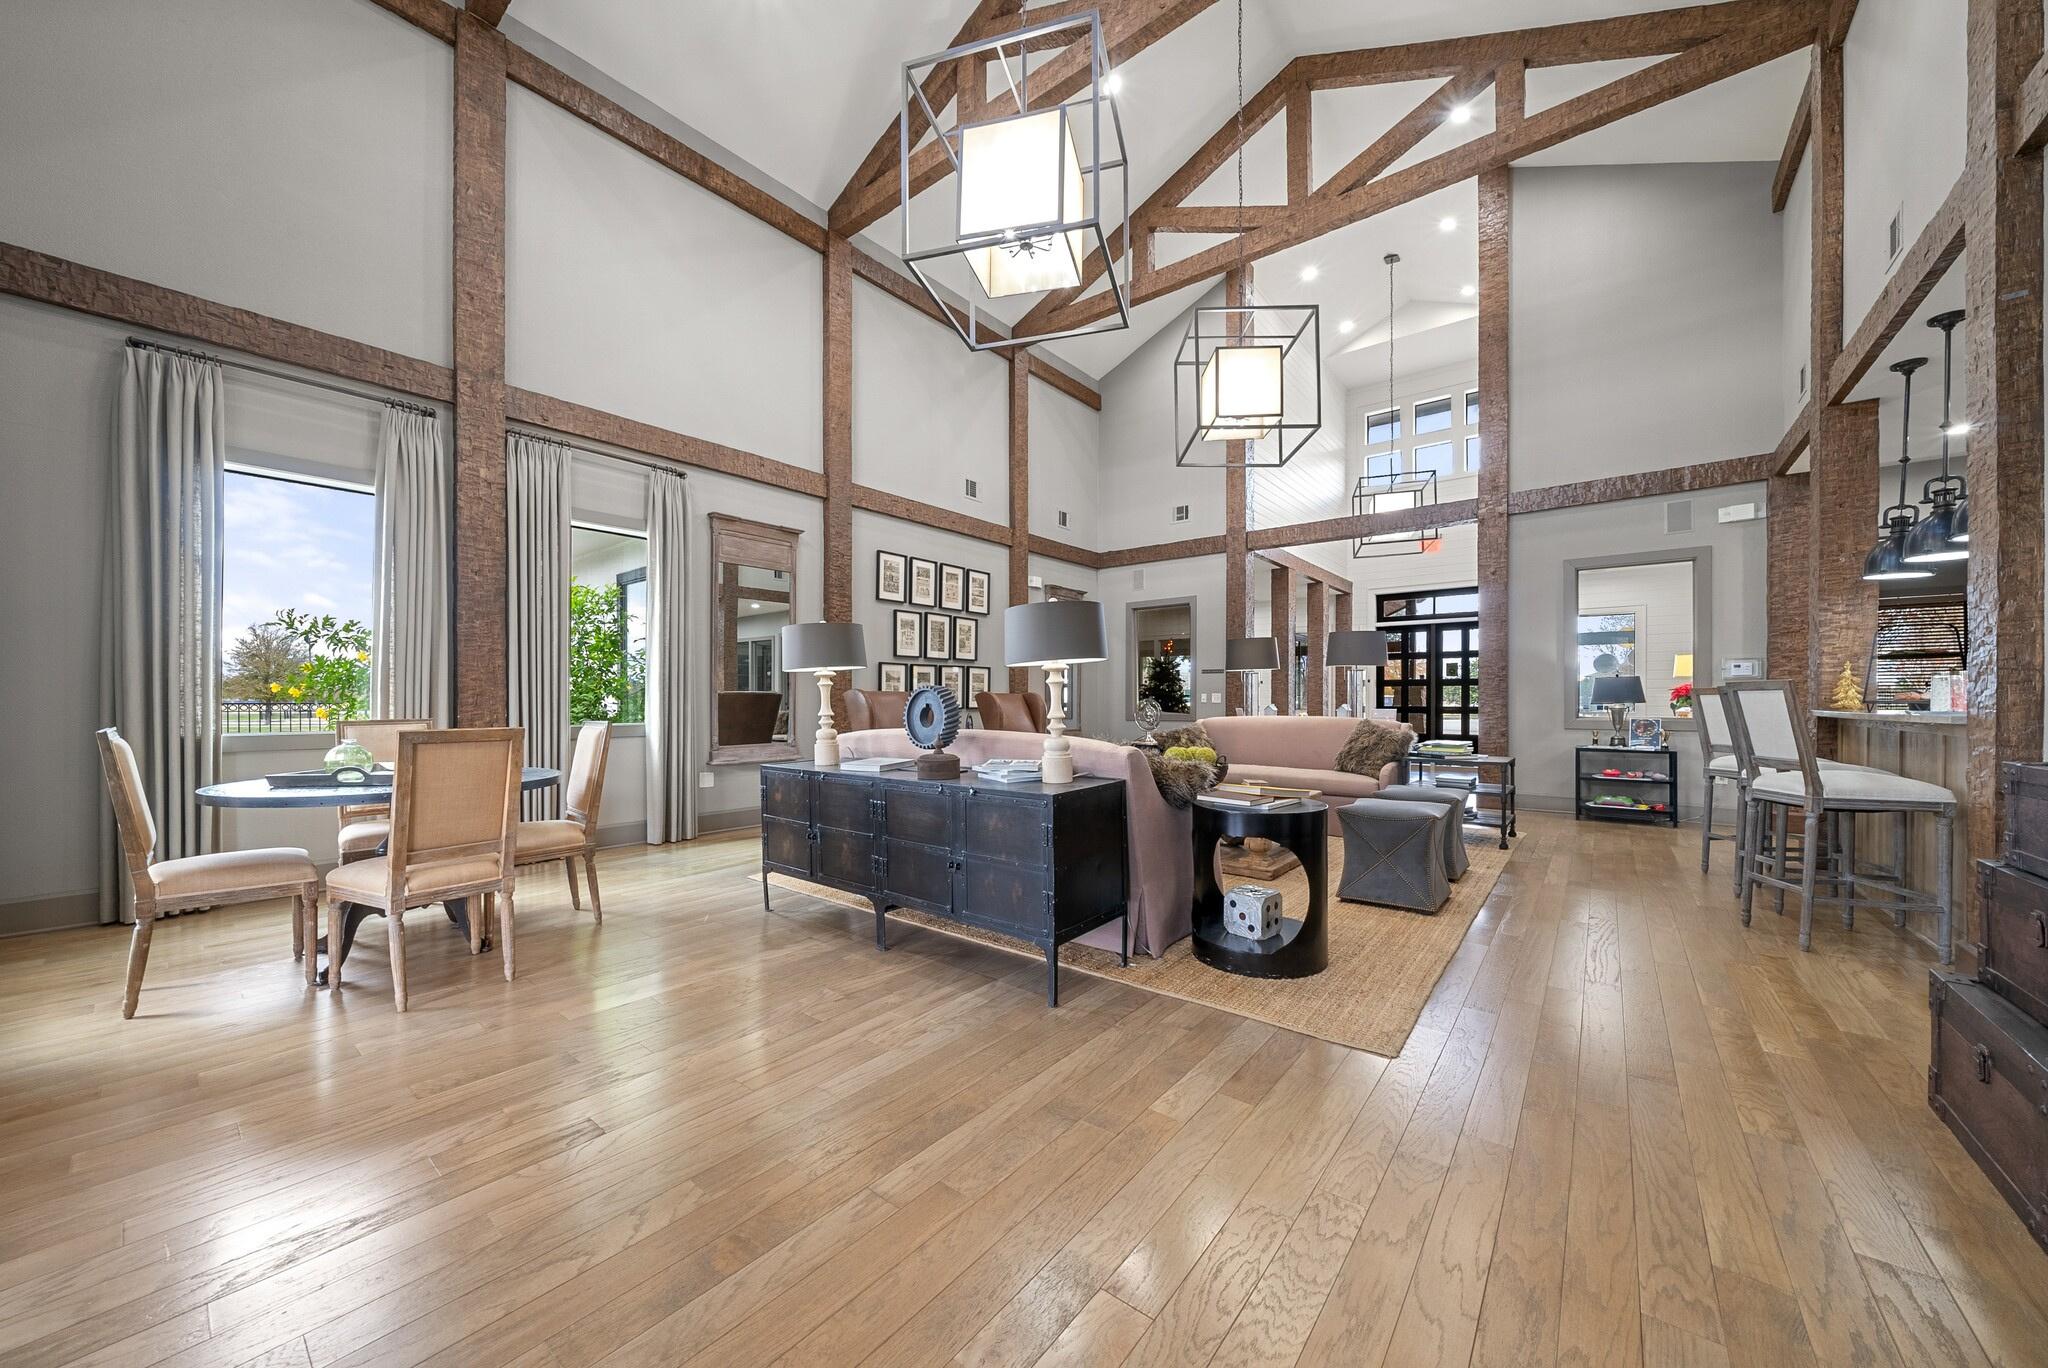
R E S I D E N T C L U B H O U S E


L O U N G E A R E A
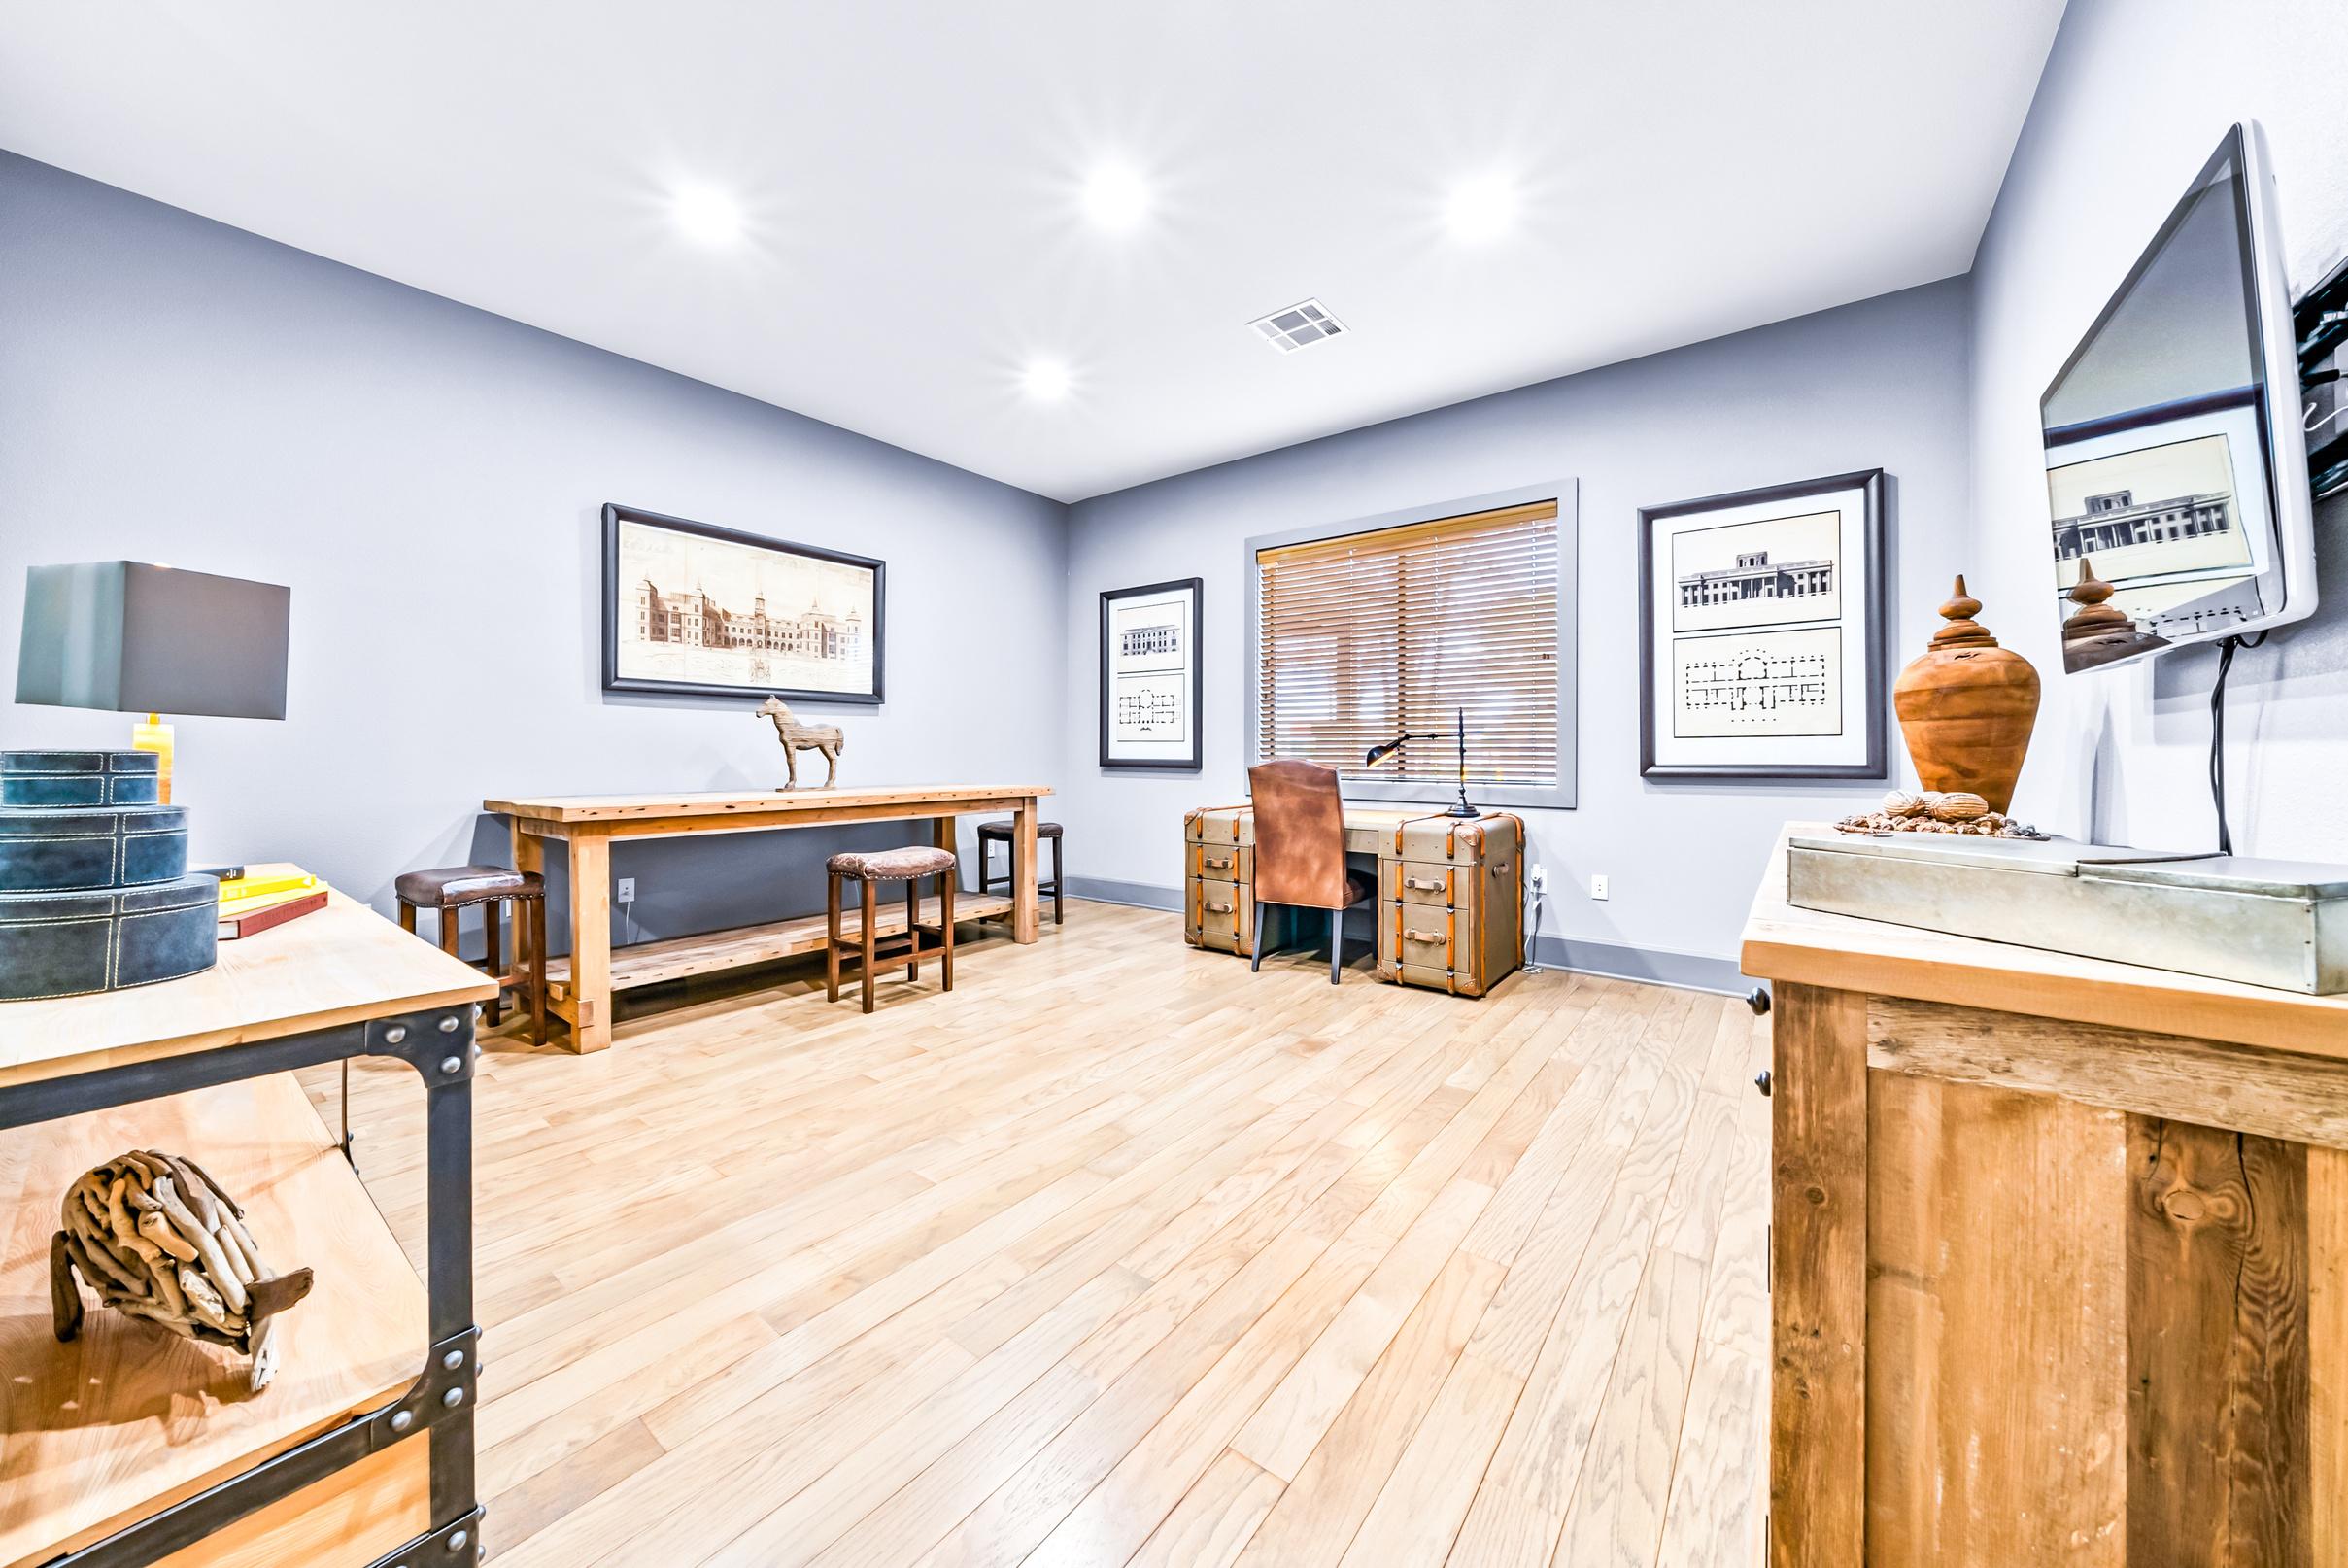
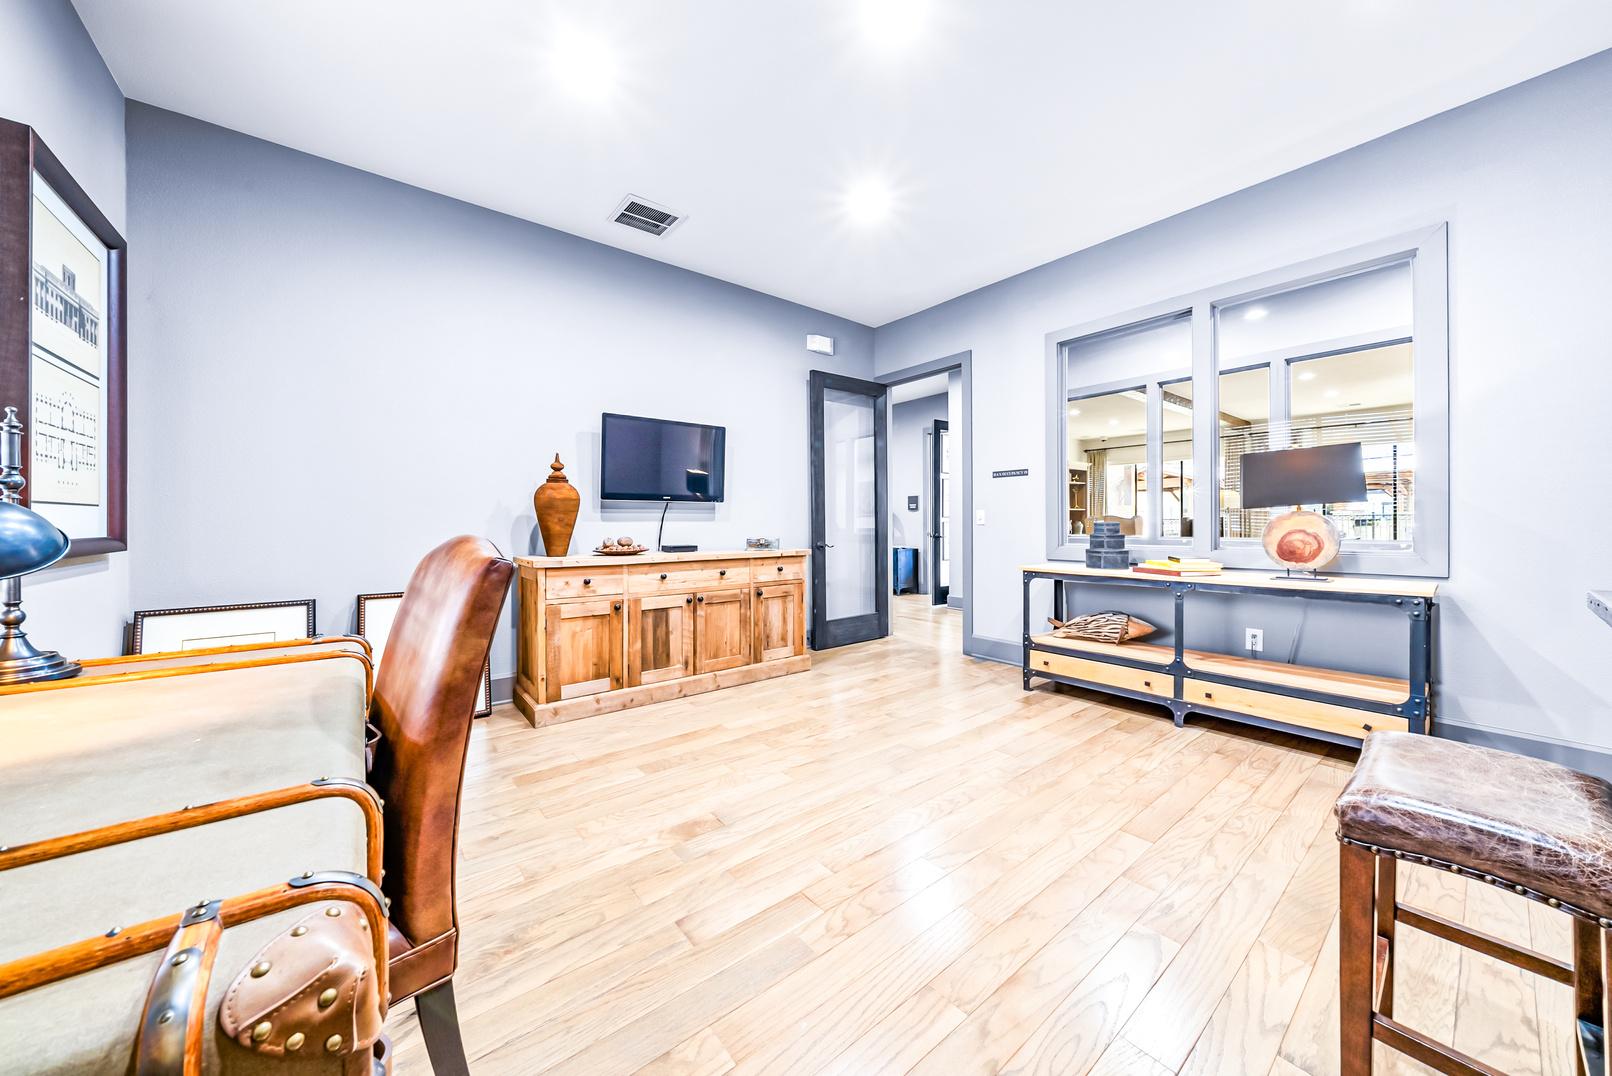
B U S I N E S S C E N T E R
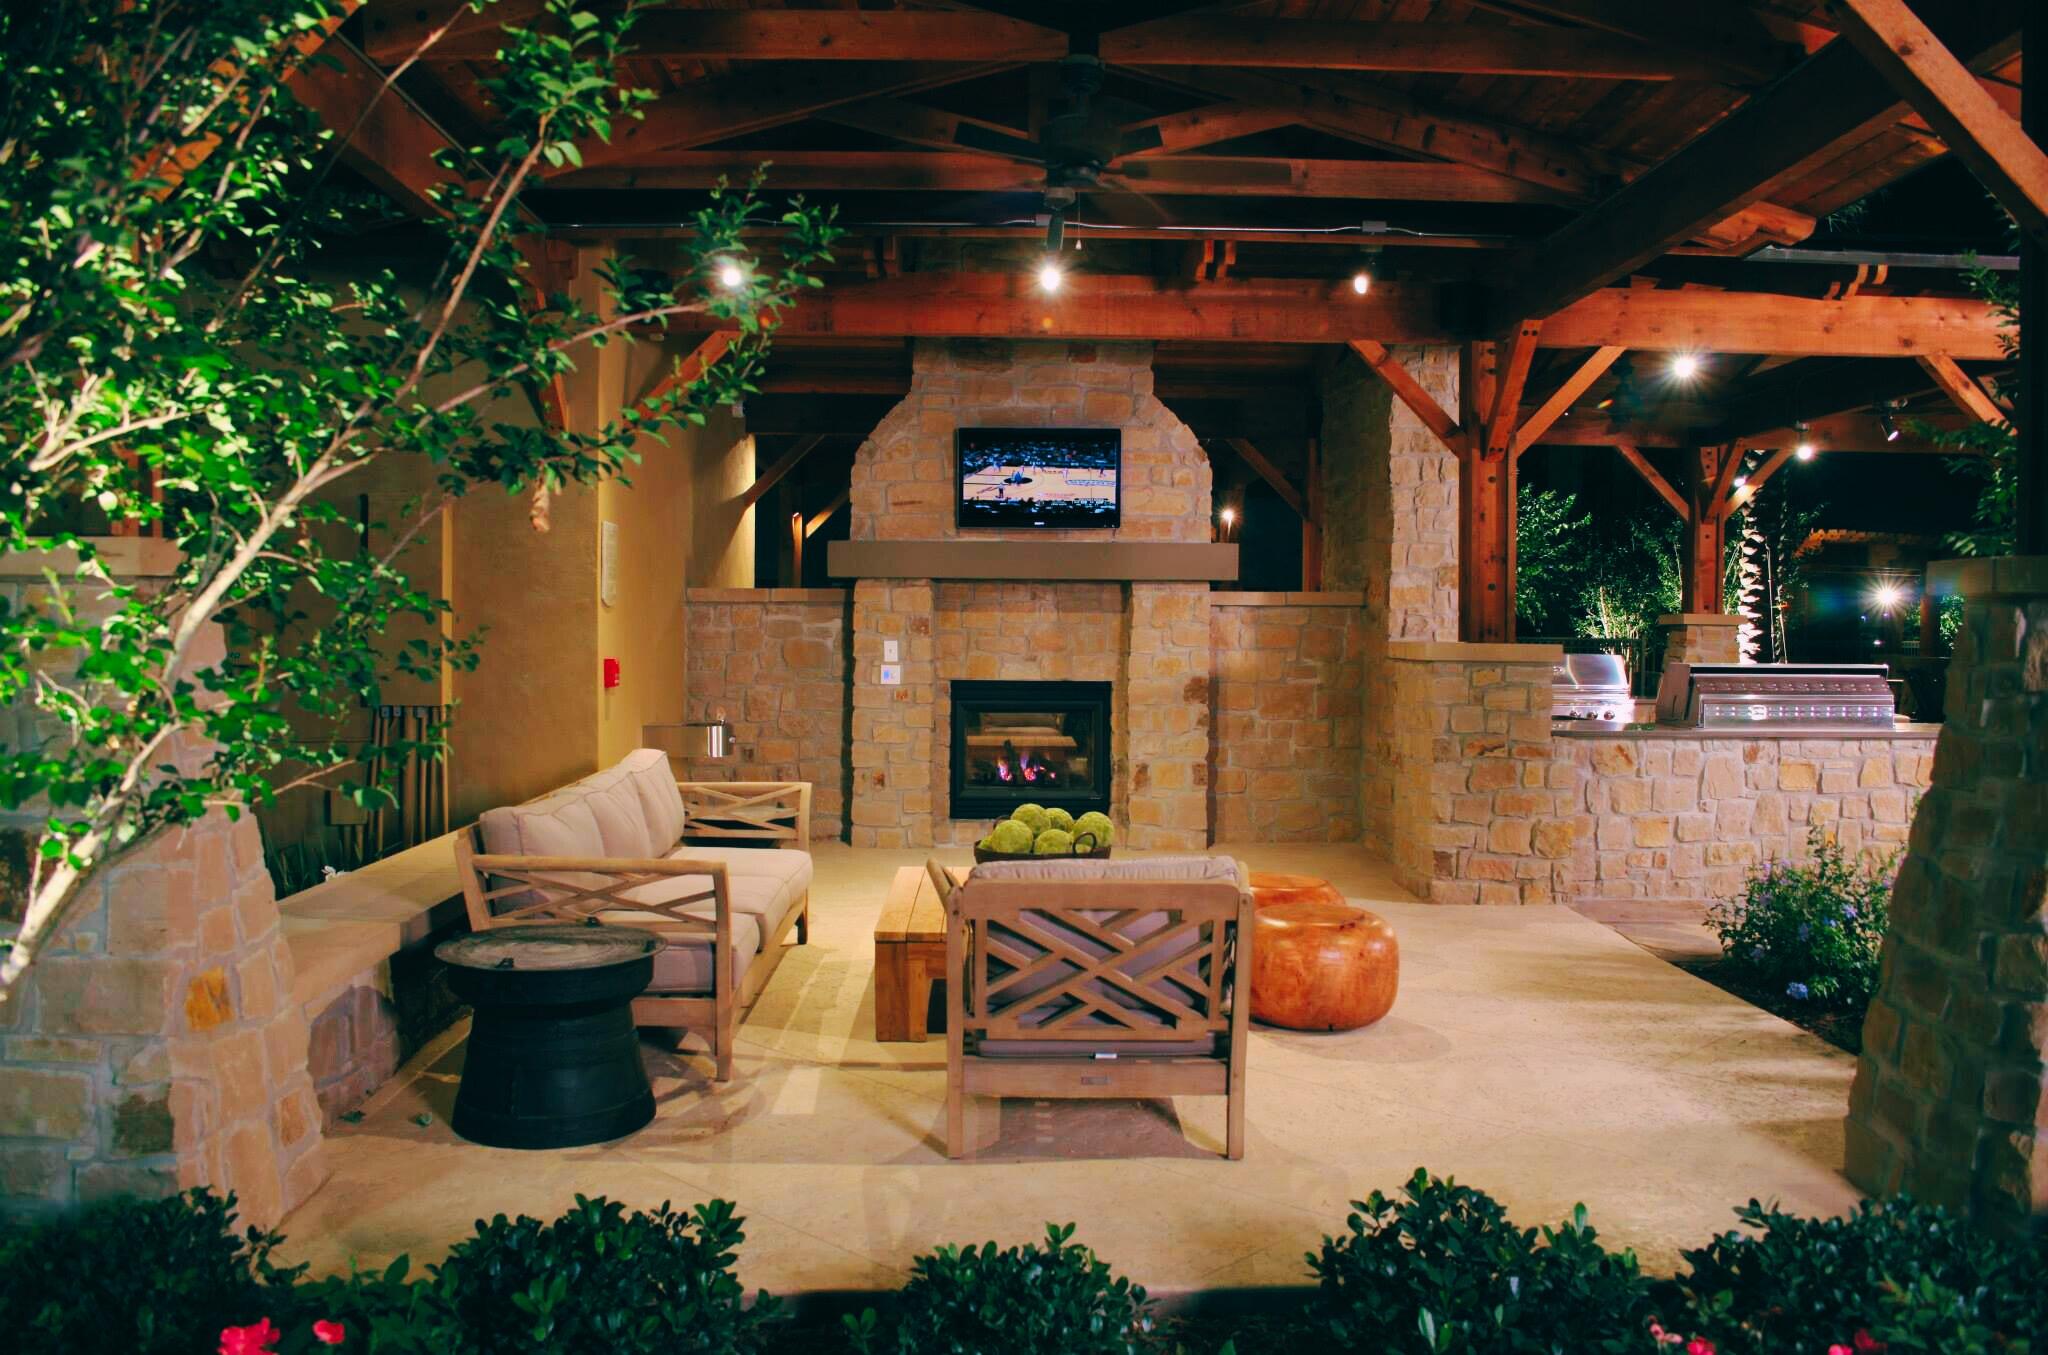
P O O L S I D E O U T D O O R K I T C H E N
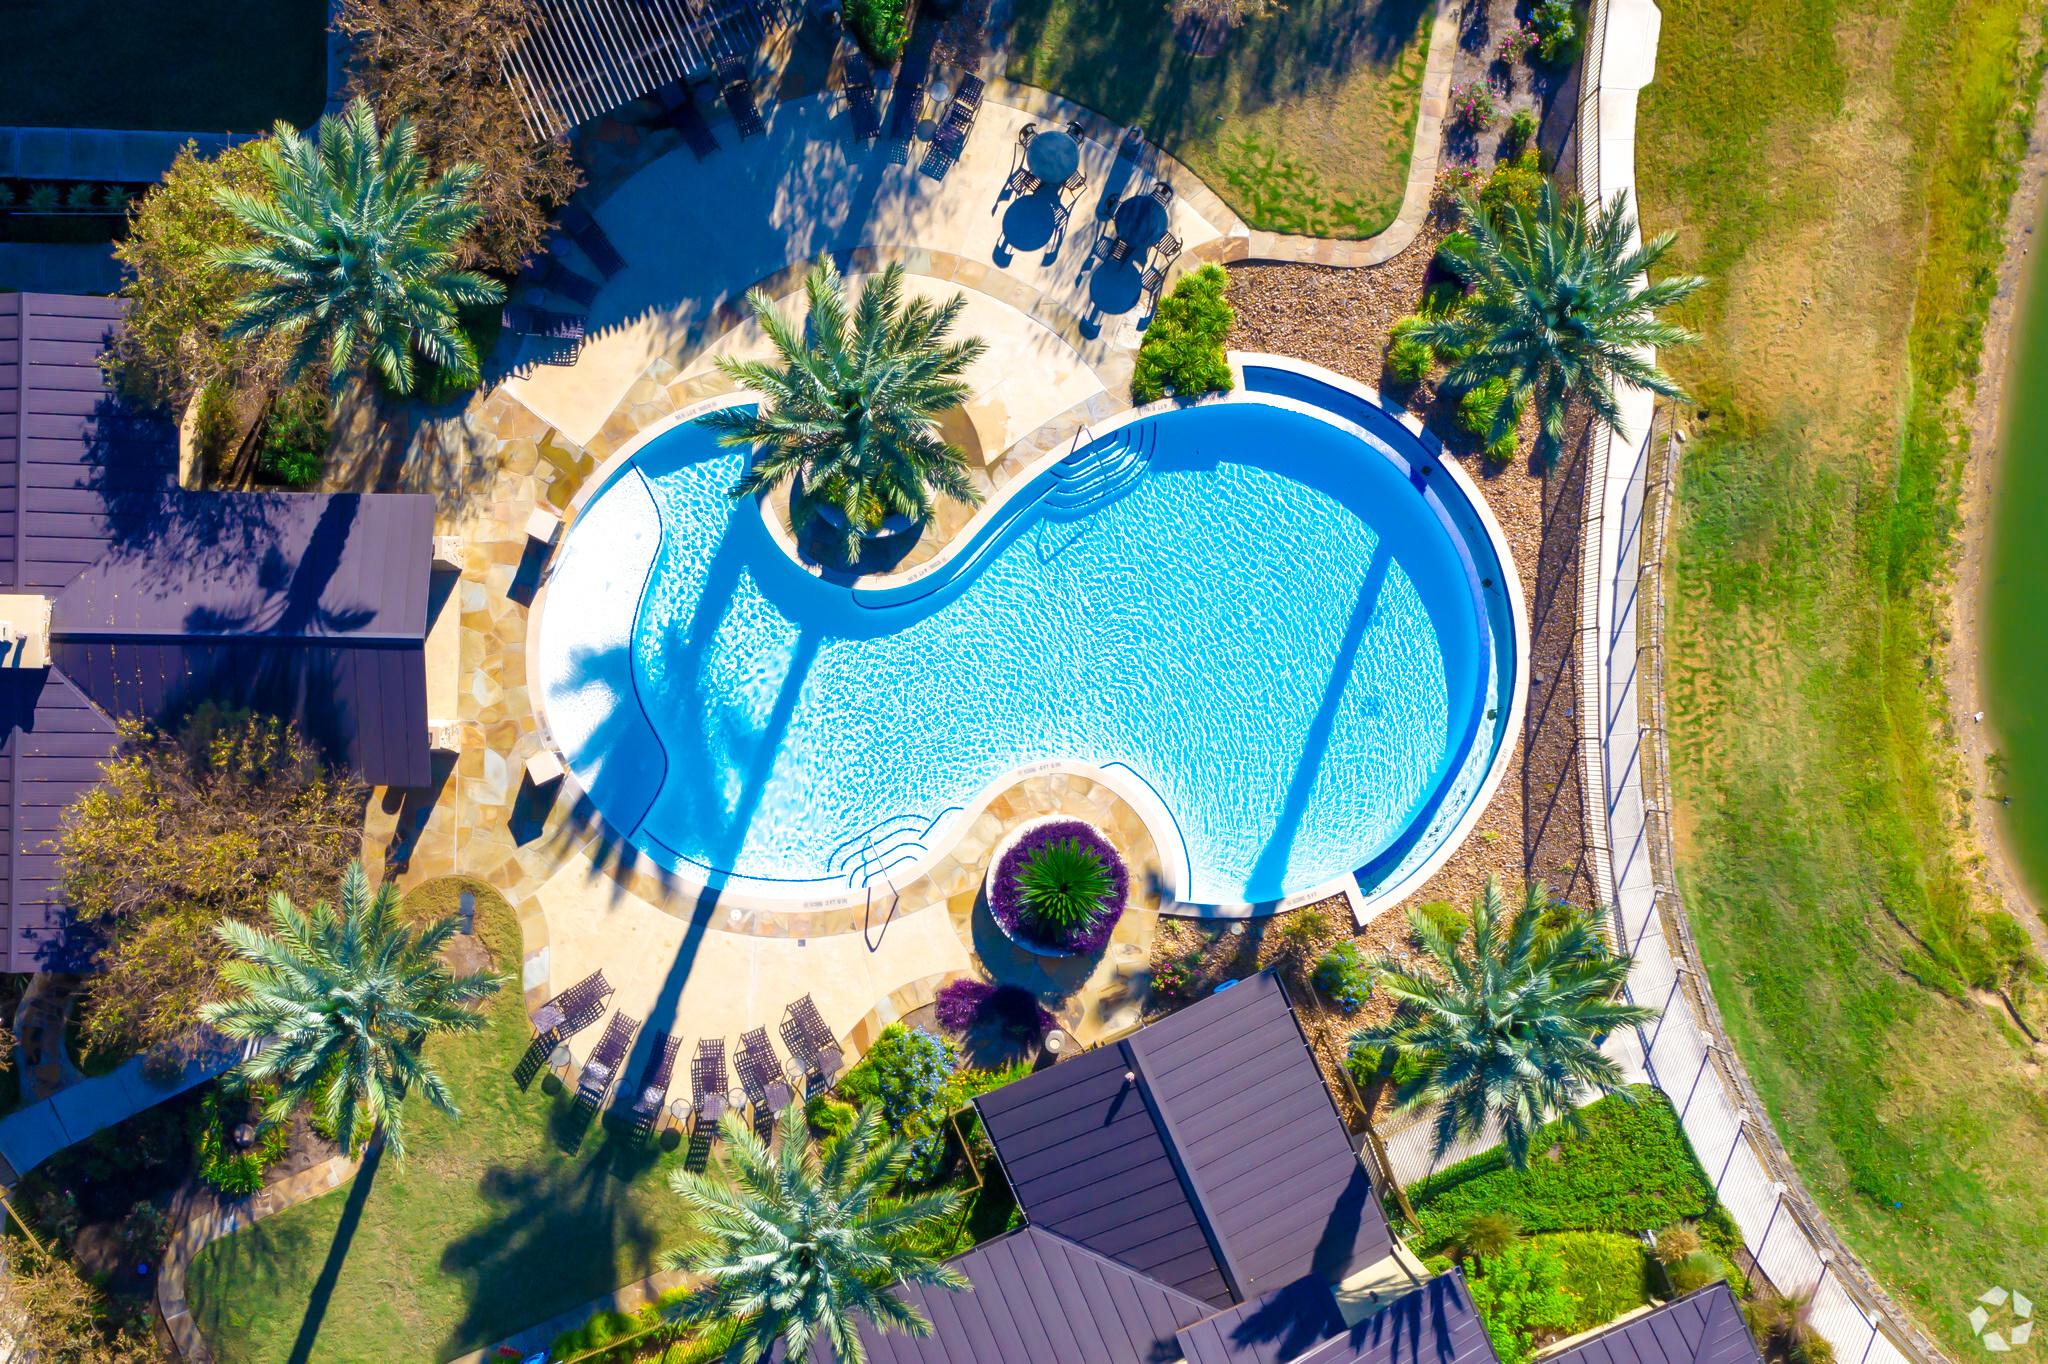
R E S O R TS T Y L E P O O L


Units - 55%
mix
UNIT 138
1Bedroom 2Bedroom 114 Units - 45%
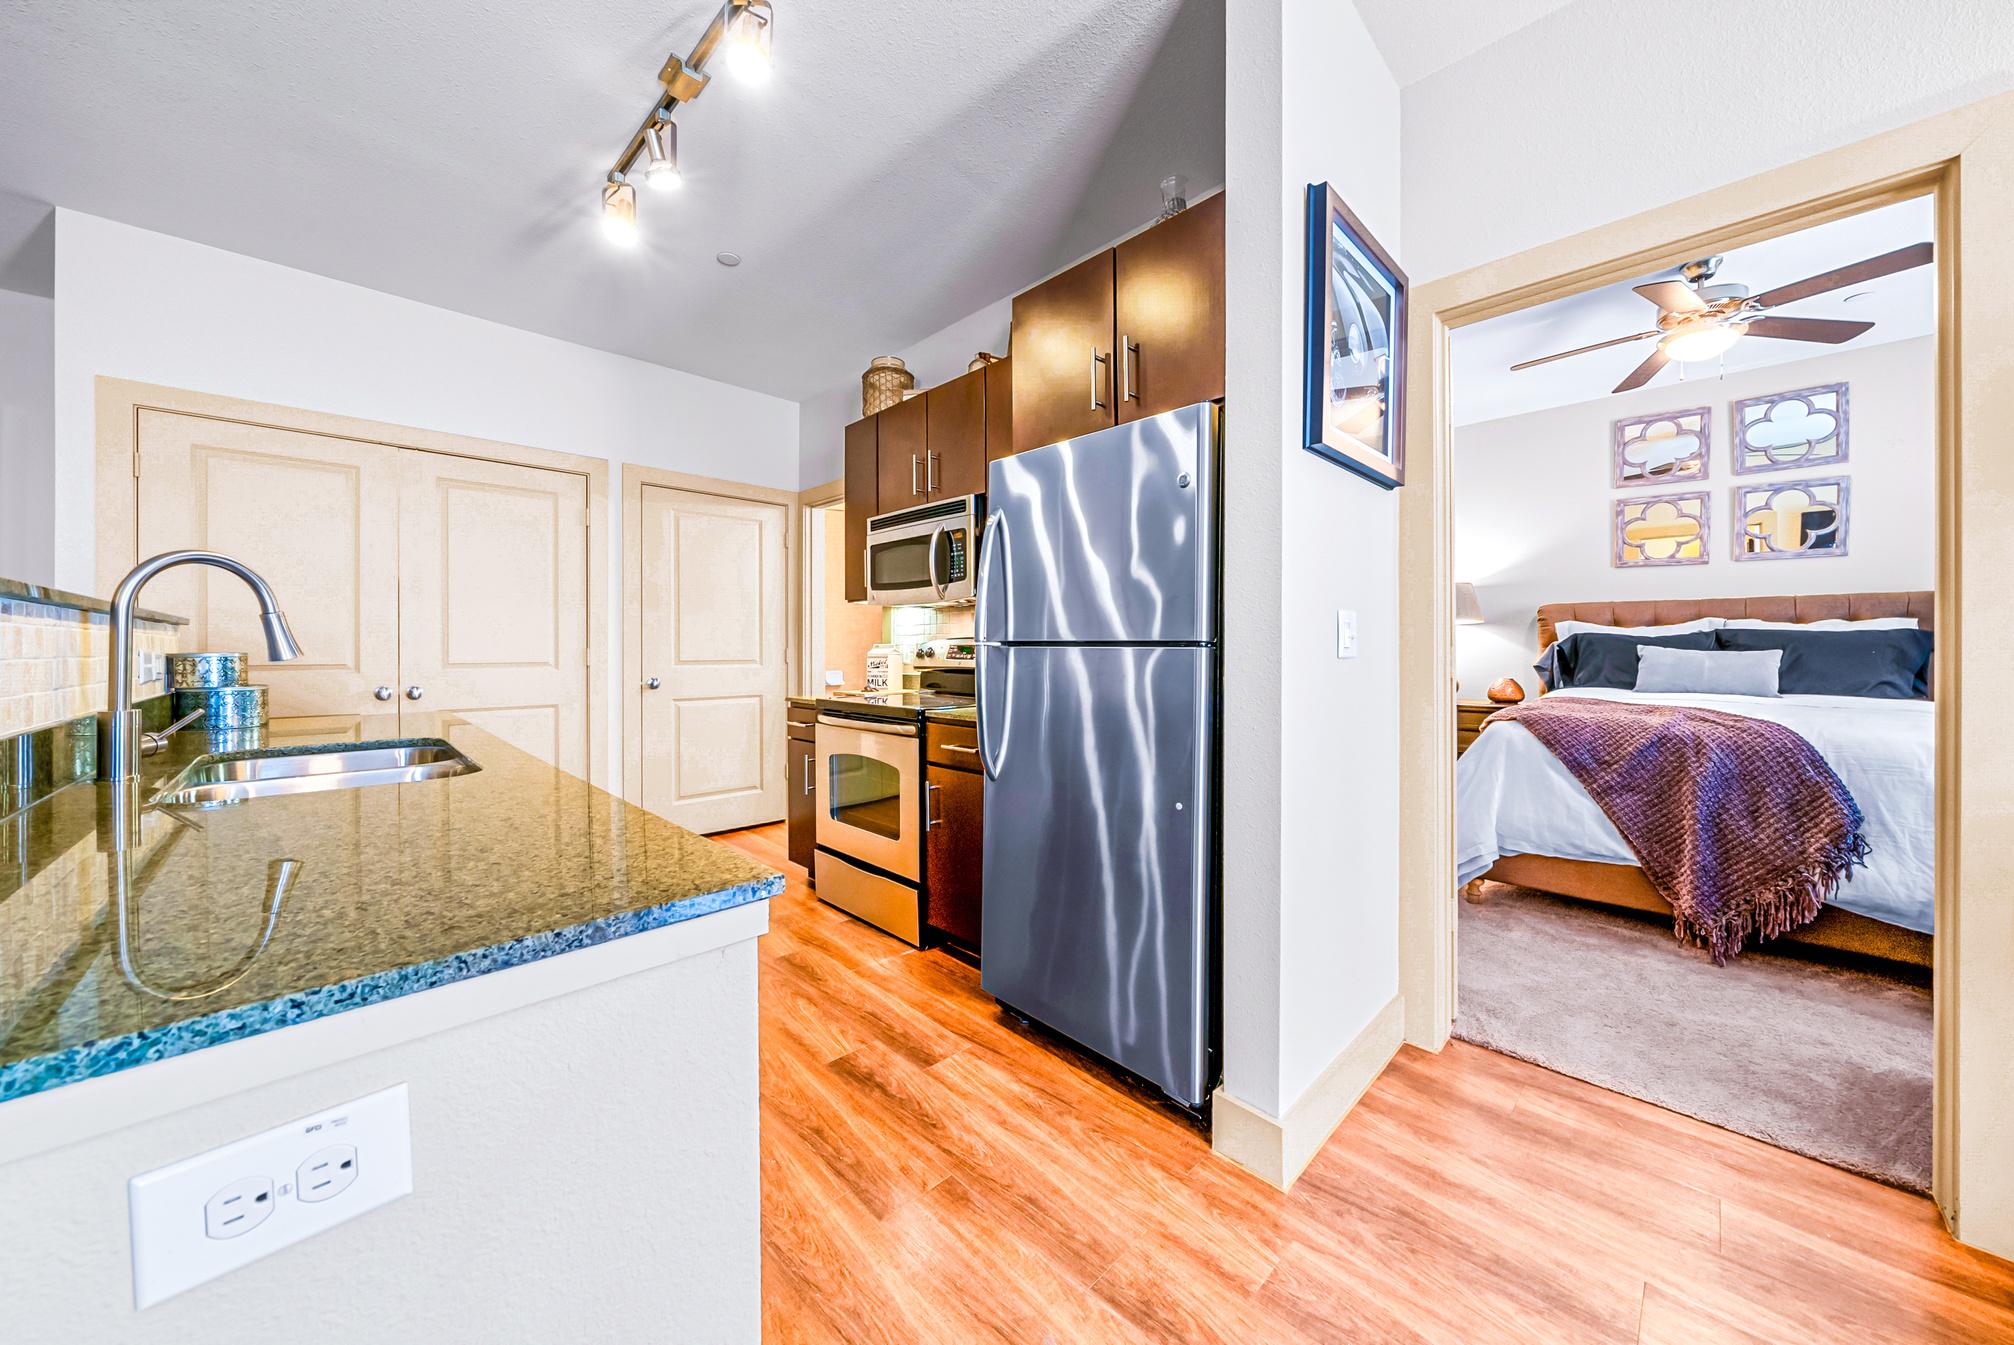
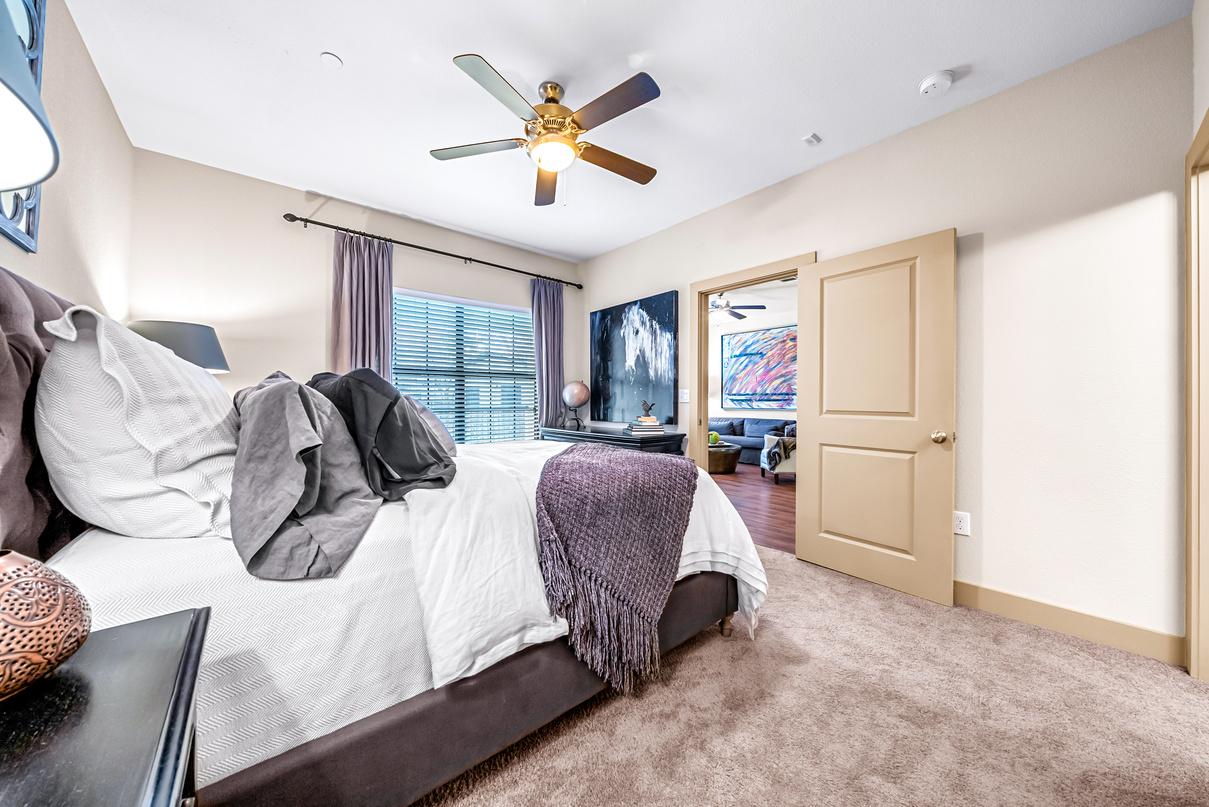
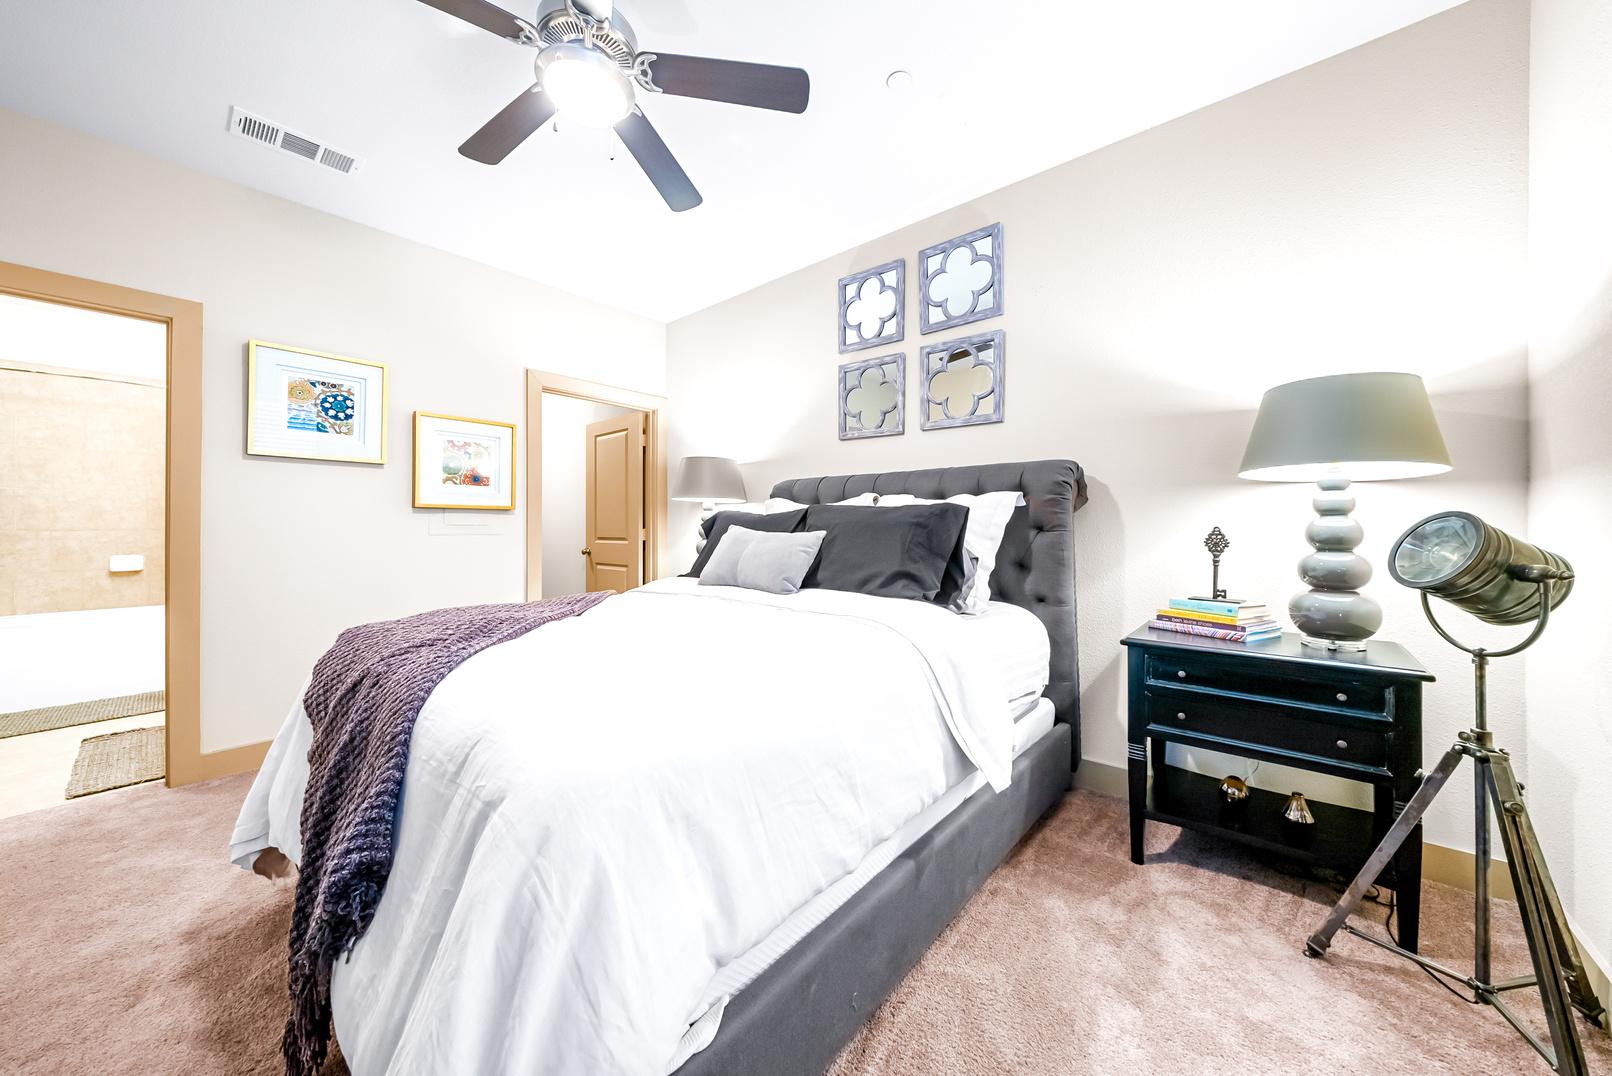
UNITamenities
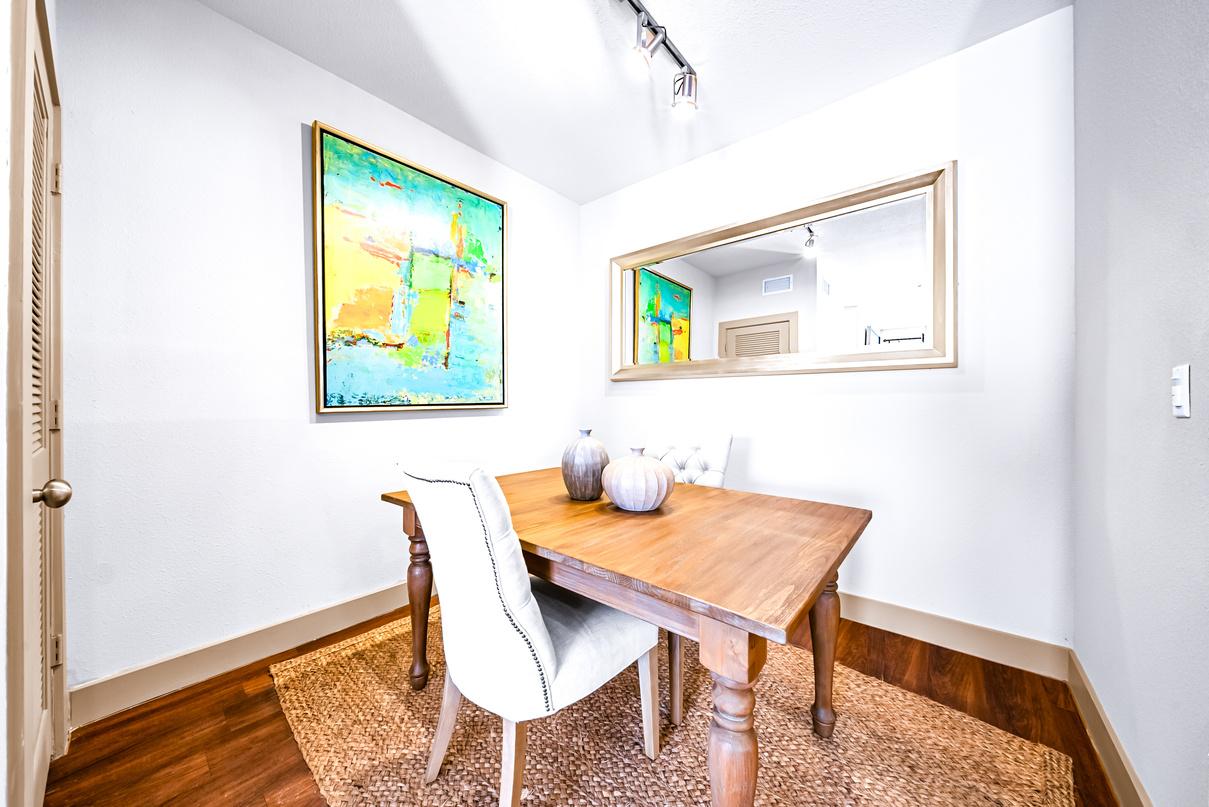
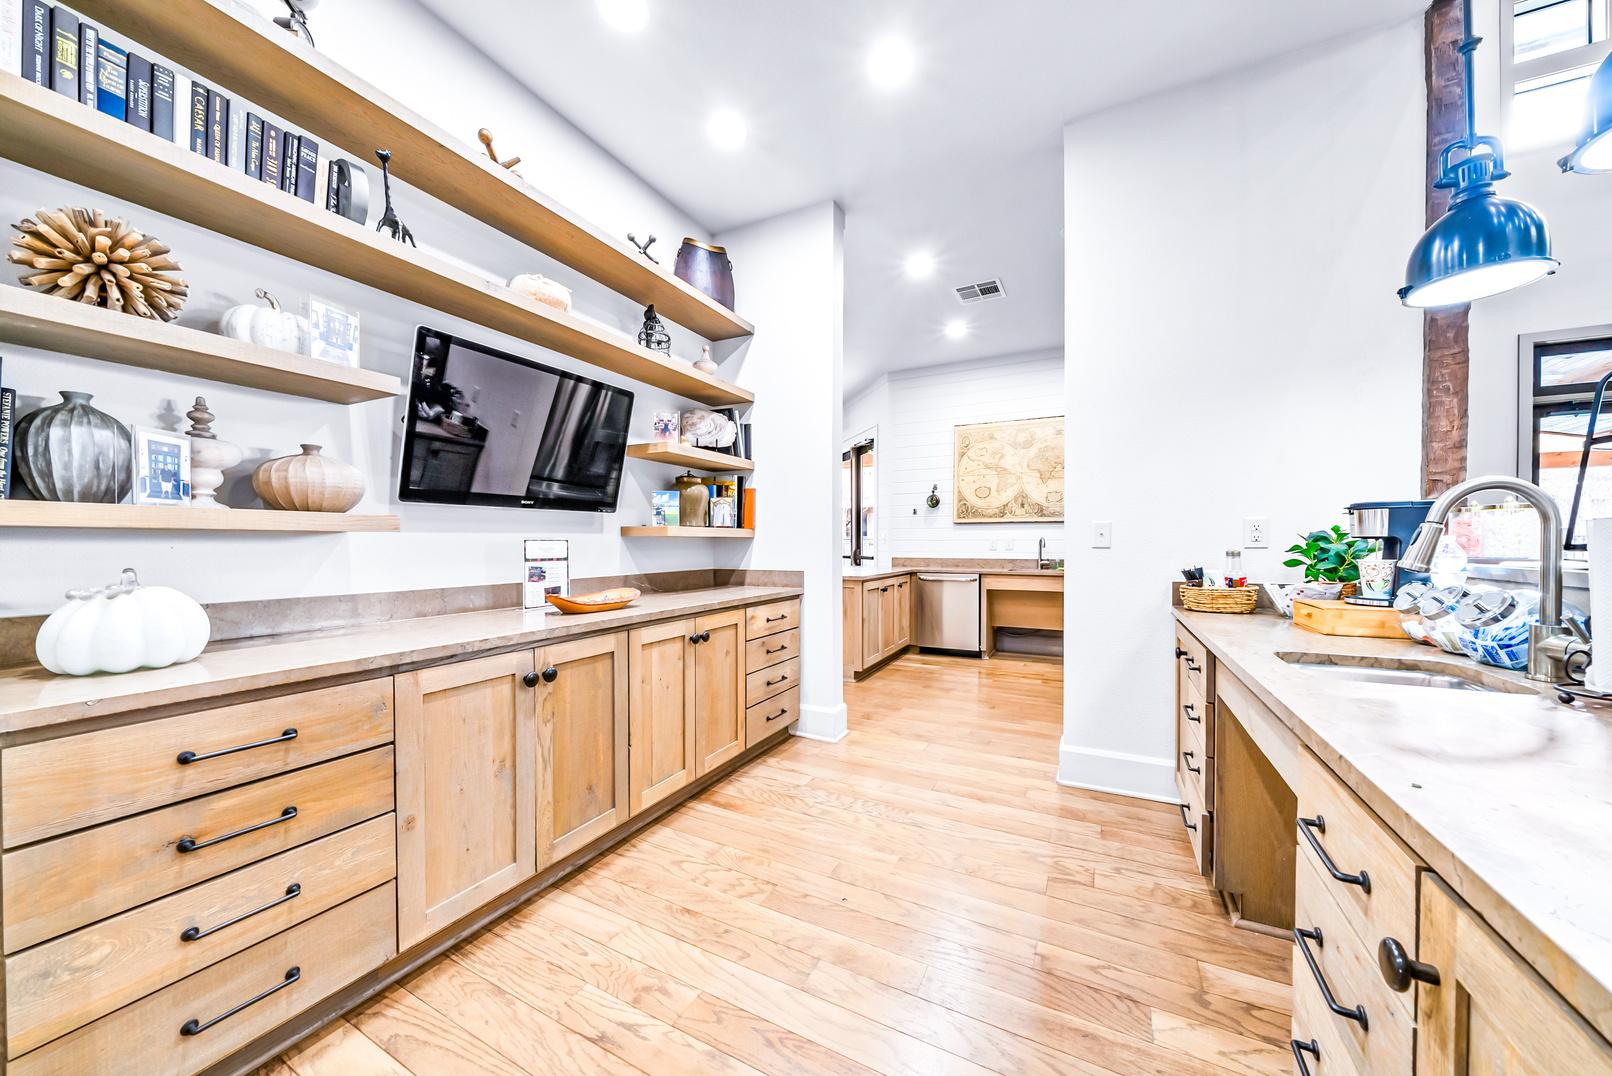
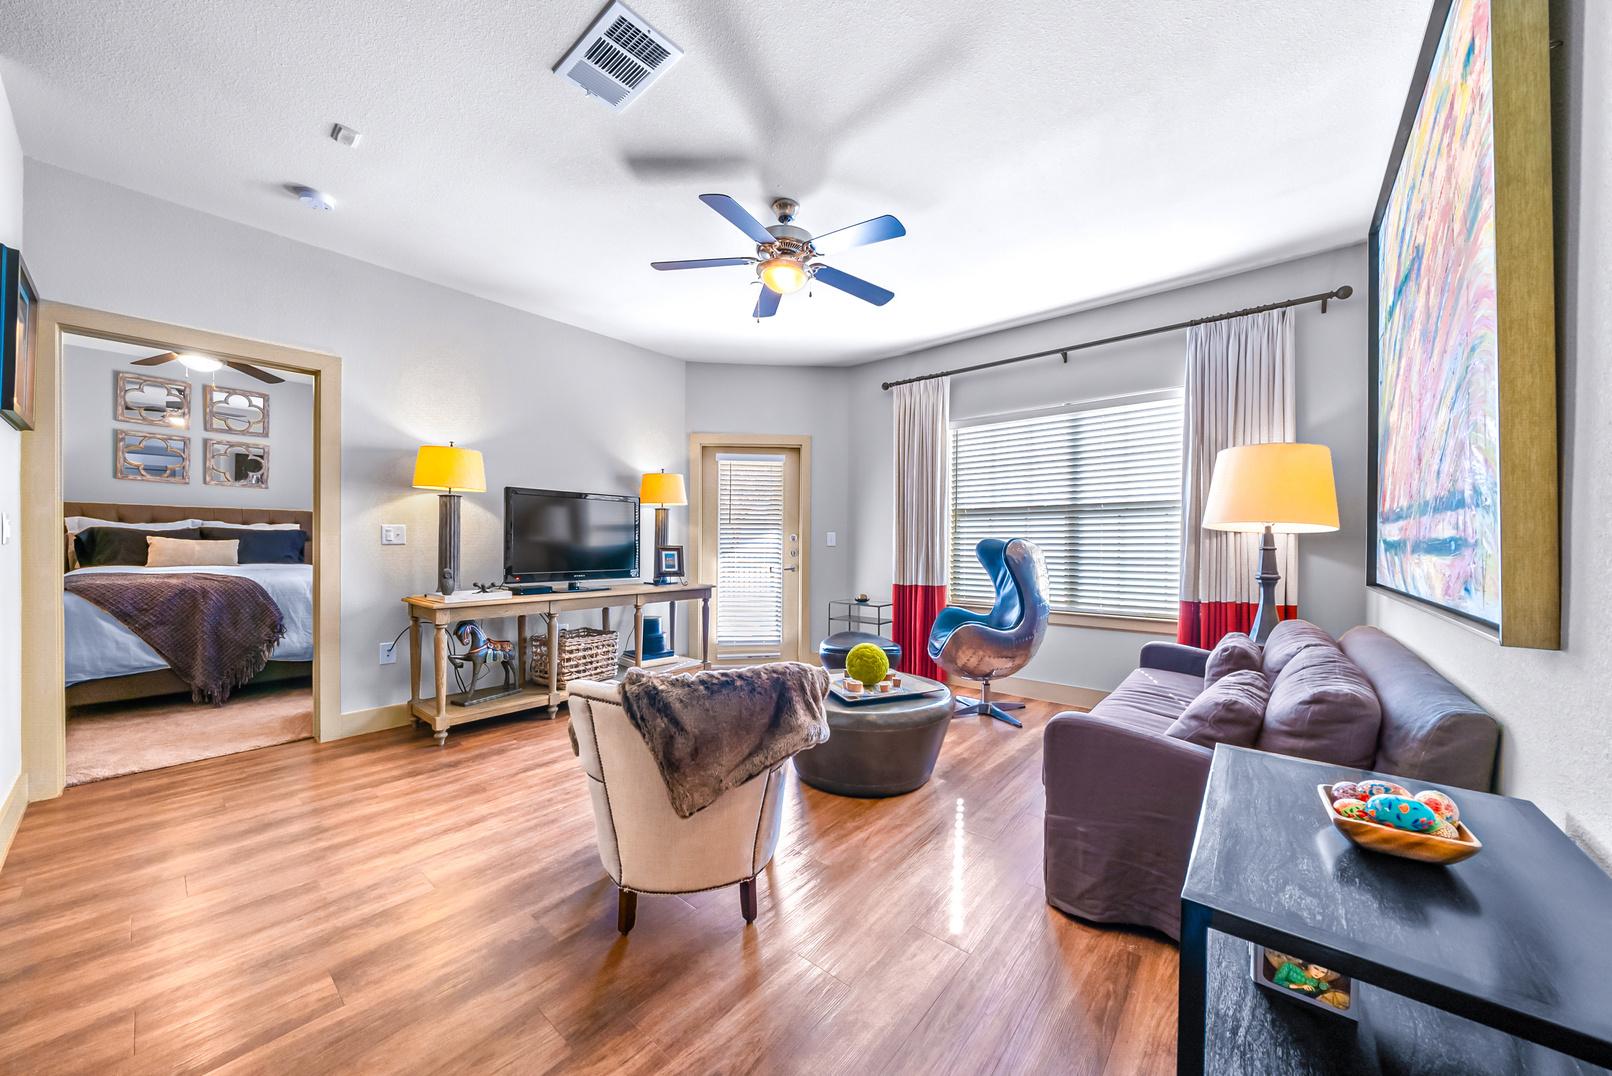
Open floor plans
European-style cabinetry
Stainless-steel appliances

Granite countertops
Kitchen pantry
Full-size washer and dryer
Generous closet space
Wood & ceramic tile flooring
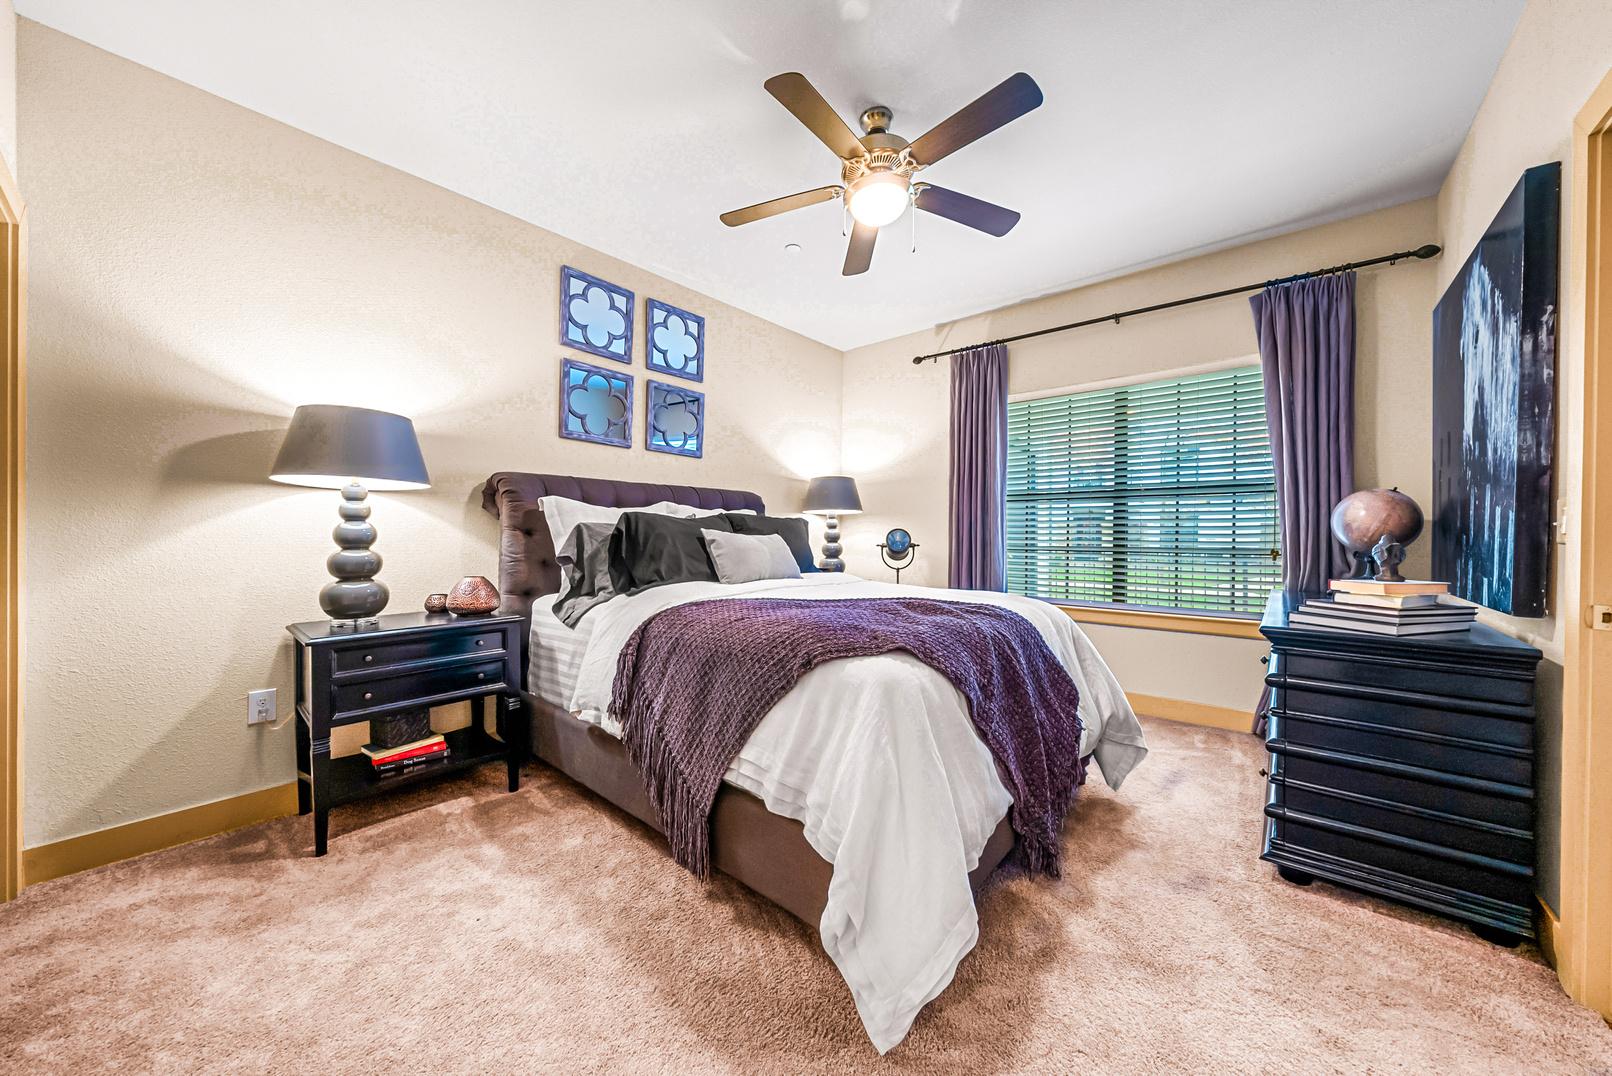
Ceiling fans
Kitchen island*
Built-in shelves*
Outside storage*
Incredible waterfront views*

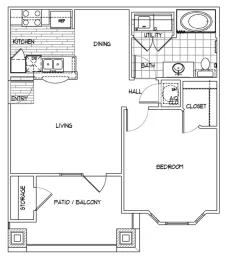
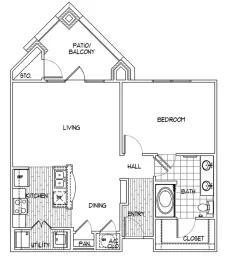
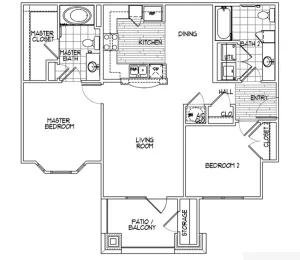
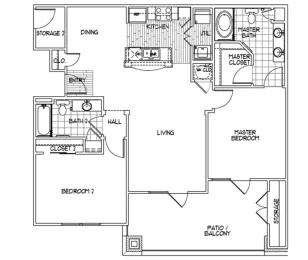
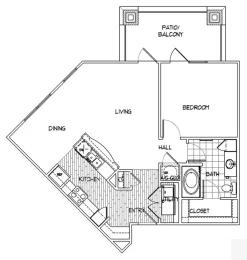
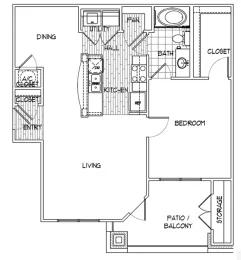
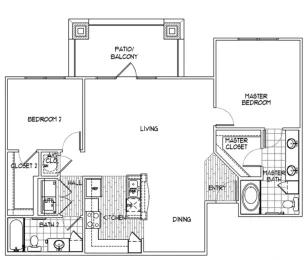
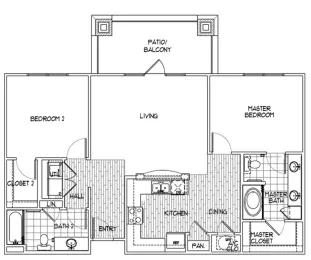
Plans Floor 1 BEDROOM, 1 BATH | 675 SF A1 1 BEDROOM, 1 BATH | 839 SF A2 1 BEDROOM, 1 BATH | 841 SF A3 1 BEDROOM, 1 BATH | 844 SF A4 2 BEDROOM, 2 BATH | 1,025 SF B1 2 BEDROOM, 2 BATH | 1,135 SF B2 2 BEDROOM, 2 BATH | 1,157 SF B3 2 BEDROOM, 2 BATH | 1,162 SF B4 O N E B E D R O O M T W O B E D R O O M
36 COMPARISON rent V I L L A S | 2 0 1 2 A U S T I N - S A N A N T O N I O M E T R O P L E X
Rent COMPARABLES
32 Property Year Built Units Avg Size Market Rent Market Rent/SF Effective Rent Effective Rent /SF Avg Occupancy* Moderno 2023 280 904 $1,558 $1.72 $1,537 $1.70 90% Berkshire Creekside 2017 416 880 $1,461 $1.66 $1,461 $1.66 93% Canyon House 2017 288 837 $1,419 $1.70 $1,358 $1.62 90% Alexan Gruene Crossing 2024 297 934 $1,705 $1.82 $1,508 $1.61 1% Tacara at Gruene 2023 300 870 $1,518 $1.75 $1,401 $1.61 57% Lodge At Guadalupe 2013/2018 308 811 $1,305 $1.61 $1,305 $1.61 95% Bainbridge Creekside 2024 291 971 $1,672 $1.72 $1,543 $1.59 3% Creekside Vue 2015 150 940 $1,475 $1.57 $1,475 $1.57 93% Lakeview Villas 2018 313 898 $1,390 $1.55 $1,390 $1.55 93% La Sierra 2008 152 889 $1,440 $1.62 $1,357 $1.53 90% Landings At Creekside 2015 268 986 $1,489 $1.51 $1,489 $1.51 93% Villas At Sundance 2012 252 931 $1,356 $1.46 $1,382 $1.48 90% WTD. AVERAGES 904 $1,486 $1.64 $1,437 $1.59 92%
1 2 3 4 5 6 7 8 9 10 11 12
*Average occupancy excludes assets in lease-up
 Moderno
R E N T C O M P A R A B L E S 1 9 10 4 5 8 7 11 2 3 6 12
Berkshire Creekside
Canyon House
Alexan Gruene Crossing
Tacara at Gruene
Lodge At Guadaloupe
Bainbridge Creekside
Bainbridge Creekside
Lakeview Villas
La Sierra
Landings At Creekside
Villas At Sundance
36 OVERVIEWsubmarket V I L L A S | 2 0 1 2 A U S T I N - S A N A N T O N I O M E T R O P L E X

% OF POPULATION WITH COLLEGE EDUCATION
EMPLOYMENT
AGE AVERAGE HOUSEHOLD INCOME JOB GROWTH BY 2027 FIVE-MILERADIUS
location New Braunfels, TX $83,825 FIVE-MILERADIUS 78% FIVE-MILERADIUS FIVE-MILERADIUS 46.5% 35 32% FIVE-MILERADIUS
WHITE COLLAR
MEDIAN
OVERVIEW
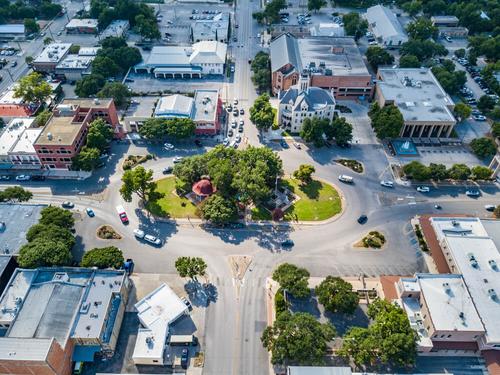
NEW BRAUNFELS stats
New Braunfels experienced record-breaking growth of 32.25% in 2023 without an increase in unemployment.
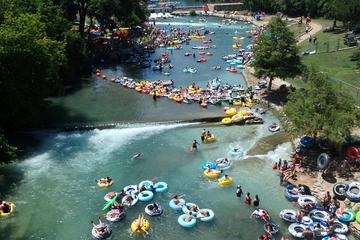
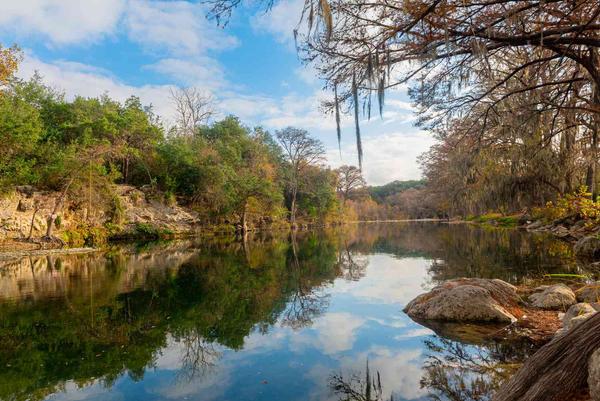
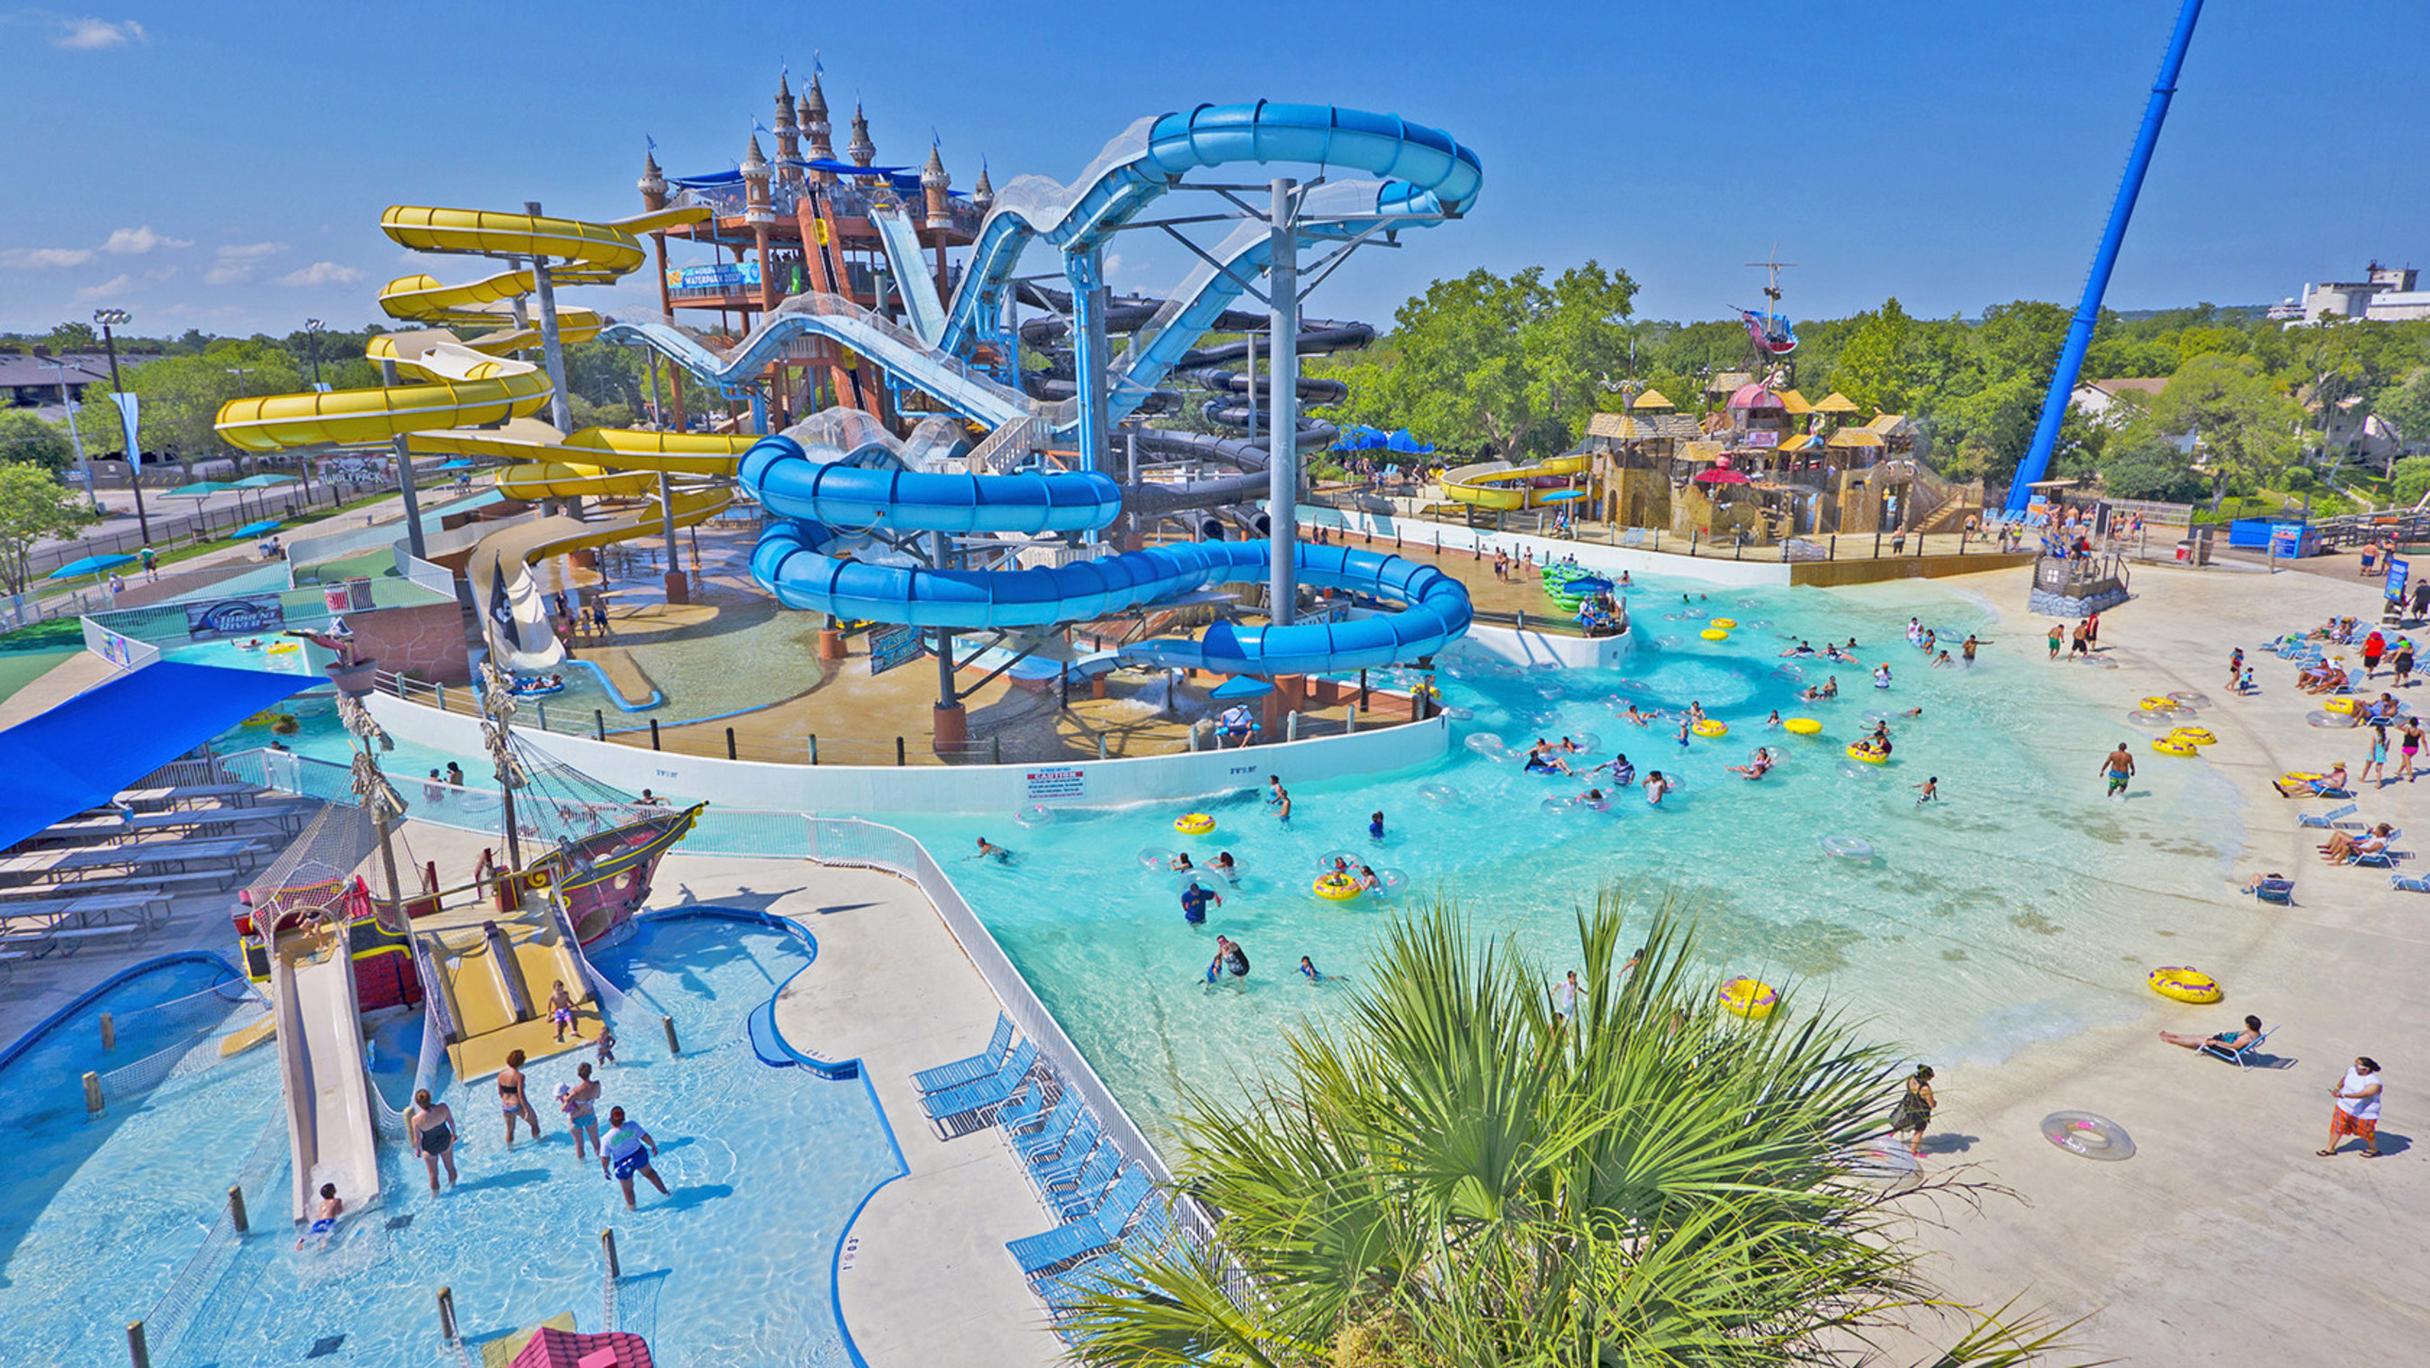
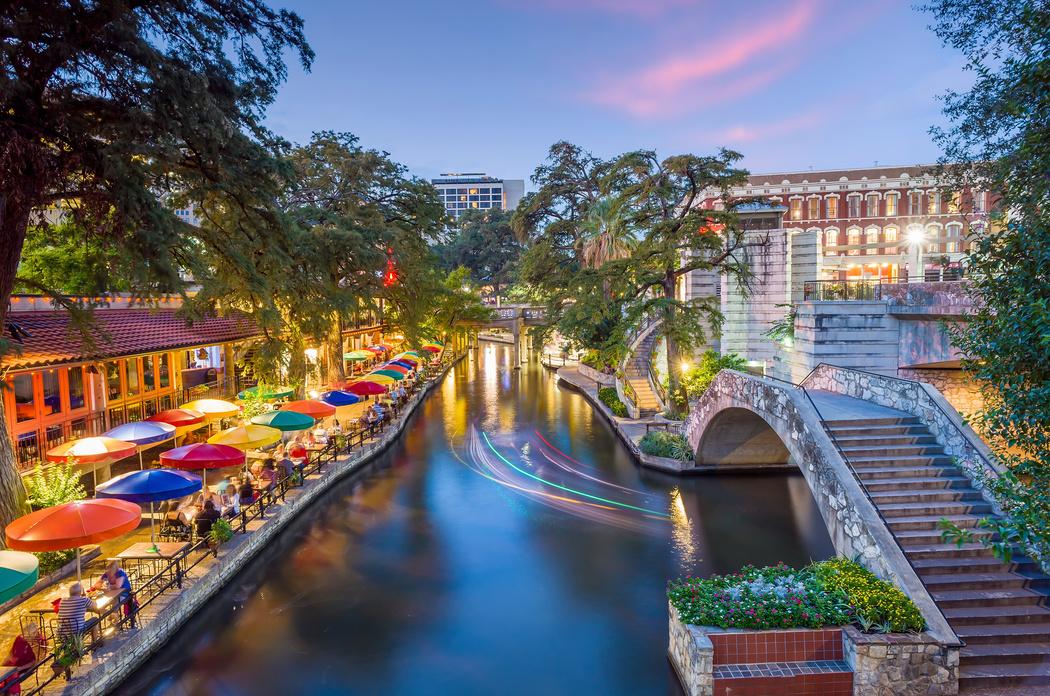
Located on the Comal and Guadalupe Rivers, tourism in New Braunfels boasts an economic impact of $700 million and employs over 7,700 direct workers.
Money Magazine names New Braunfels one of the “Best Places to Live” which isn’t surprising given the strong job market increasing 1.7% year-over-year, 1.5% over the national average.

Texas
37% RENTER OCCUPIED HOUSING
$85,825 AVG. HOUSEHOLD INCOME
78% WHITE COLLAR JOBS
5-MILE RADIUS
S T R O N G S U B M A R K E T demographics
FAVORABLE APARTMENT
market
TOURISM BENEFITS EMPLOYMENT
Located on the Comal and Guadalupe Rivers, tourism in New Braunfels boasts an economic impact of $700 million in economic impact year-over-year.
STRONG OCCUPANCY
The New Braunfels submarket also boasts the highest occupancy rate in the entire Austin - San Antonio MSA.
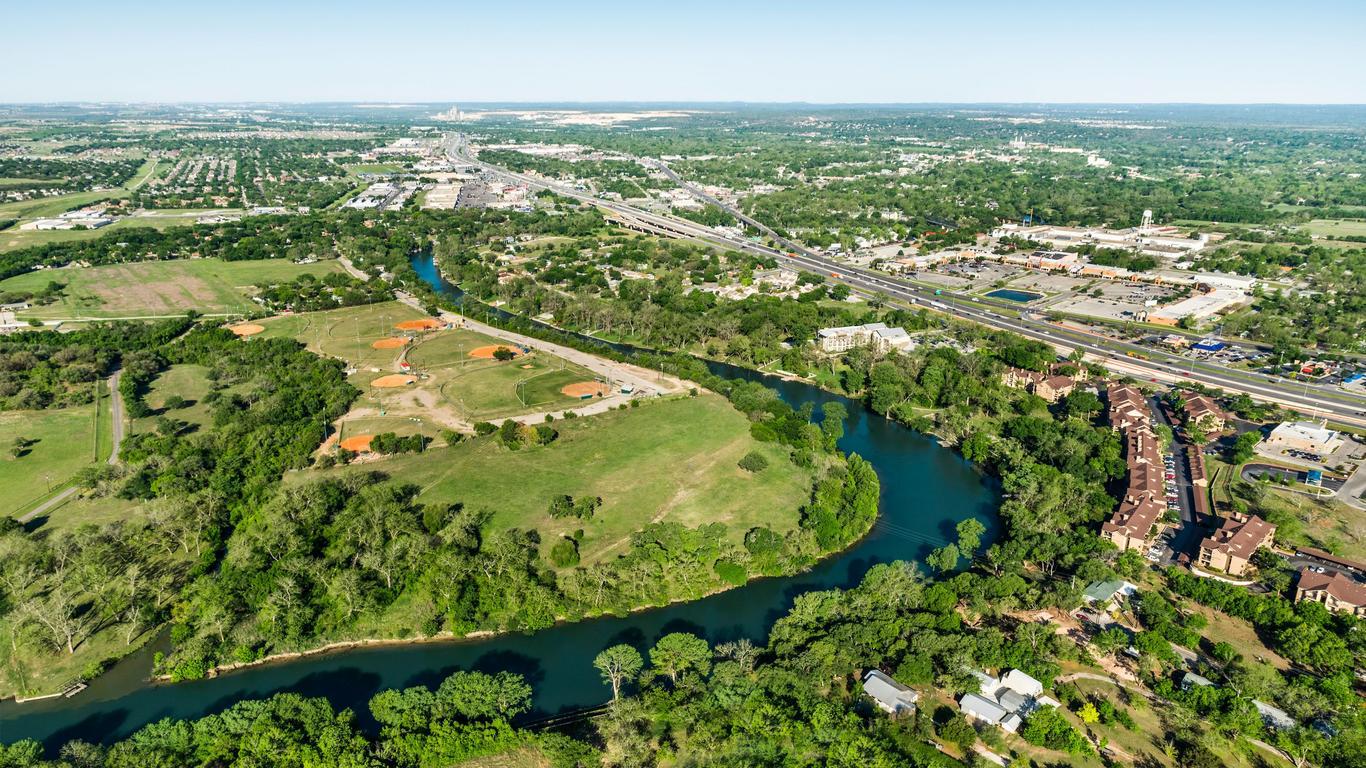
POSITIVE MIGRATION
Over the past five years, the city's population has surged by almost 40 percent, fueled by new major employers, entertainment centers, and favorable demographics. With an average of 15 new residents arriving daily, New Braunfels has been the nation's third fastest-growing city since 2000. The total population has surged by 58 percent.
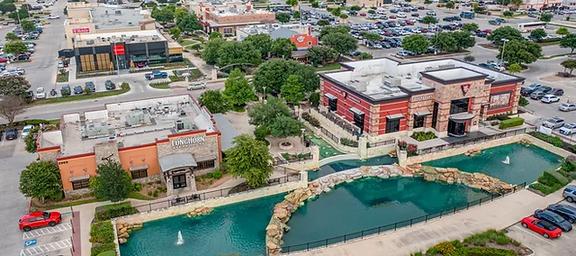


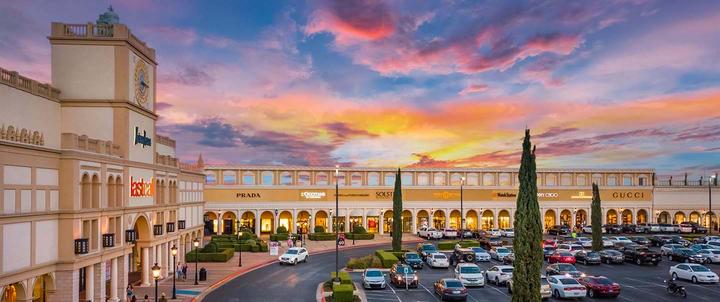


Schlitterbahn Waterpark 3.1Miles Landa Park 4.2Miles Comal Park 3.1Miles San Marcos Premium Outlets 12.5Miles JCPenney TJ Maxx Ross Dress for Less Famous Footwear Best Buy T-Mobile N E A R B Y A T T R A C T I O N S Town Center at Creekside 2.2Miles BEAUTY Bath and Body Works Sally Beauty Supply Ulta HOME Dollar Tree Five Below Hobby Lobby HomeGoods Mattress Firm Target


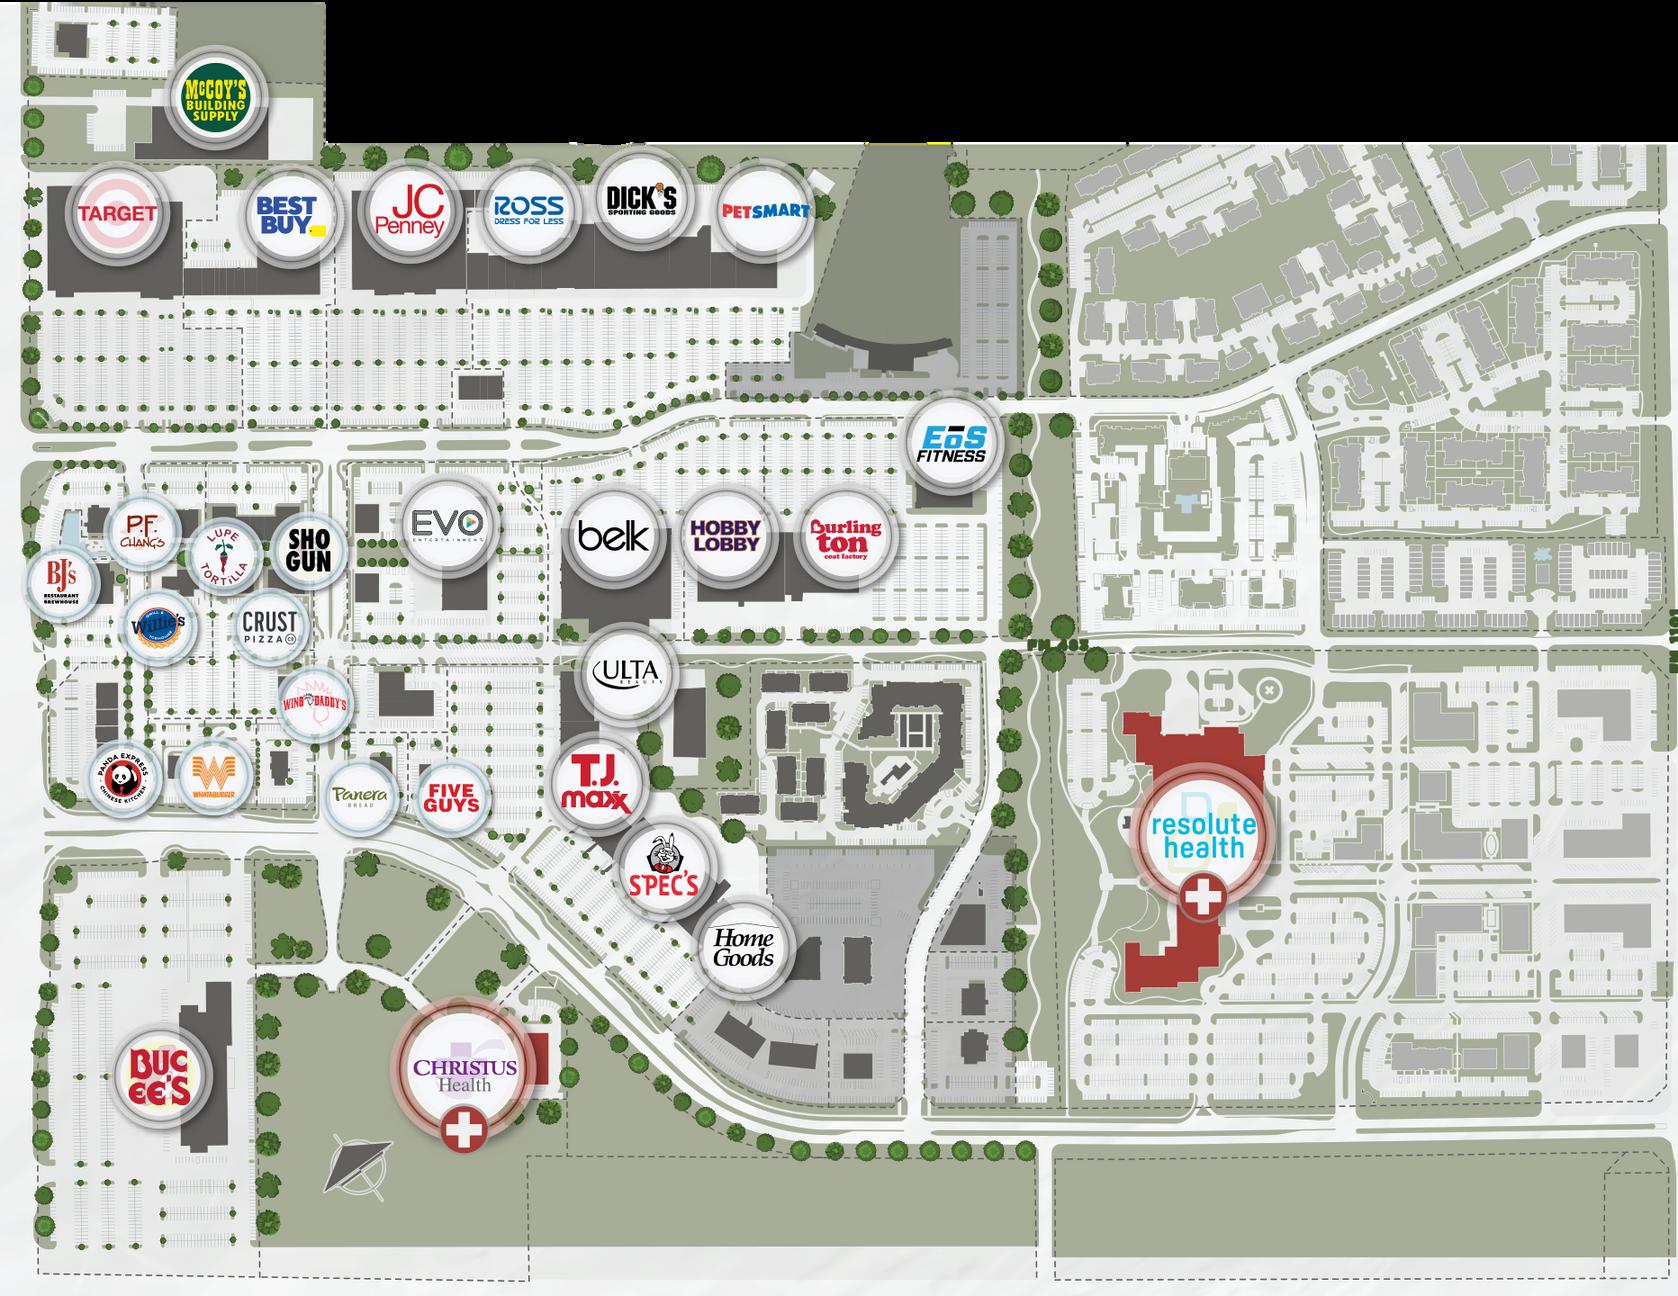

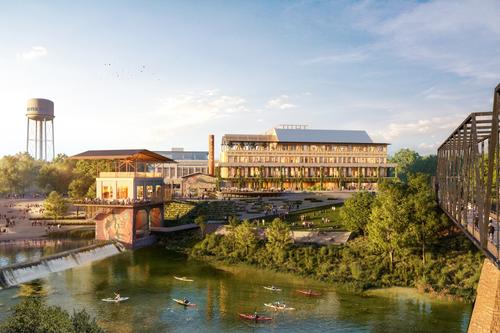
MIXED-USE DEVELOPMENT
Total Area
Total Completed Space
Additional Planned Space
Total Businesses Annual Visitors Total Job Creation
Acre
Phases)
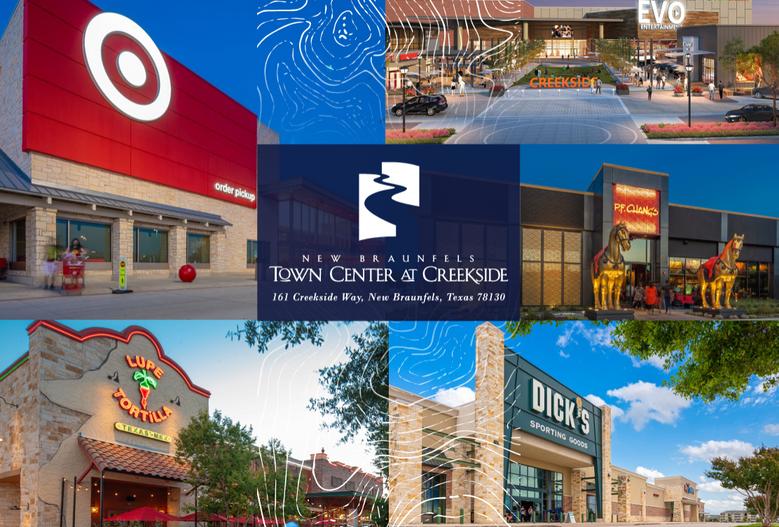
L O C A T I O N O V E R V I E W
Expected Delivery (All
>400
>1
>750,000 SF >75 >10 Million >3,000 2025
Million SF

THE WORLD’S LARGEST WATERPARK

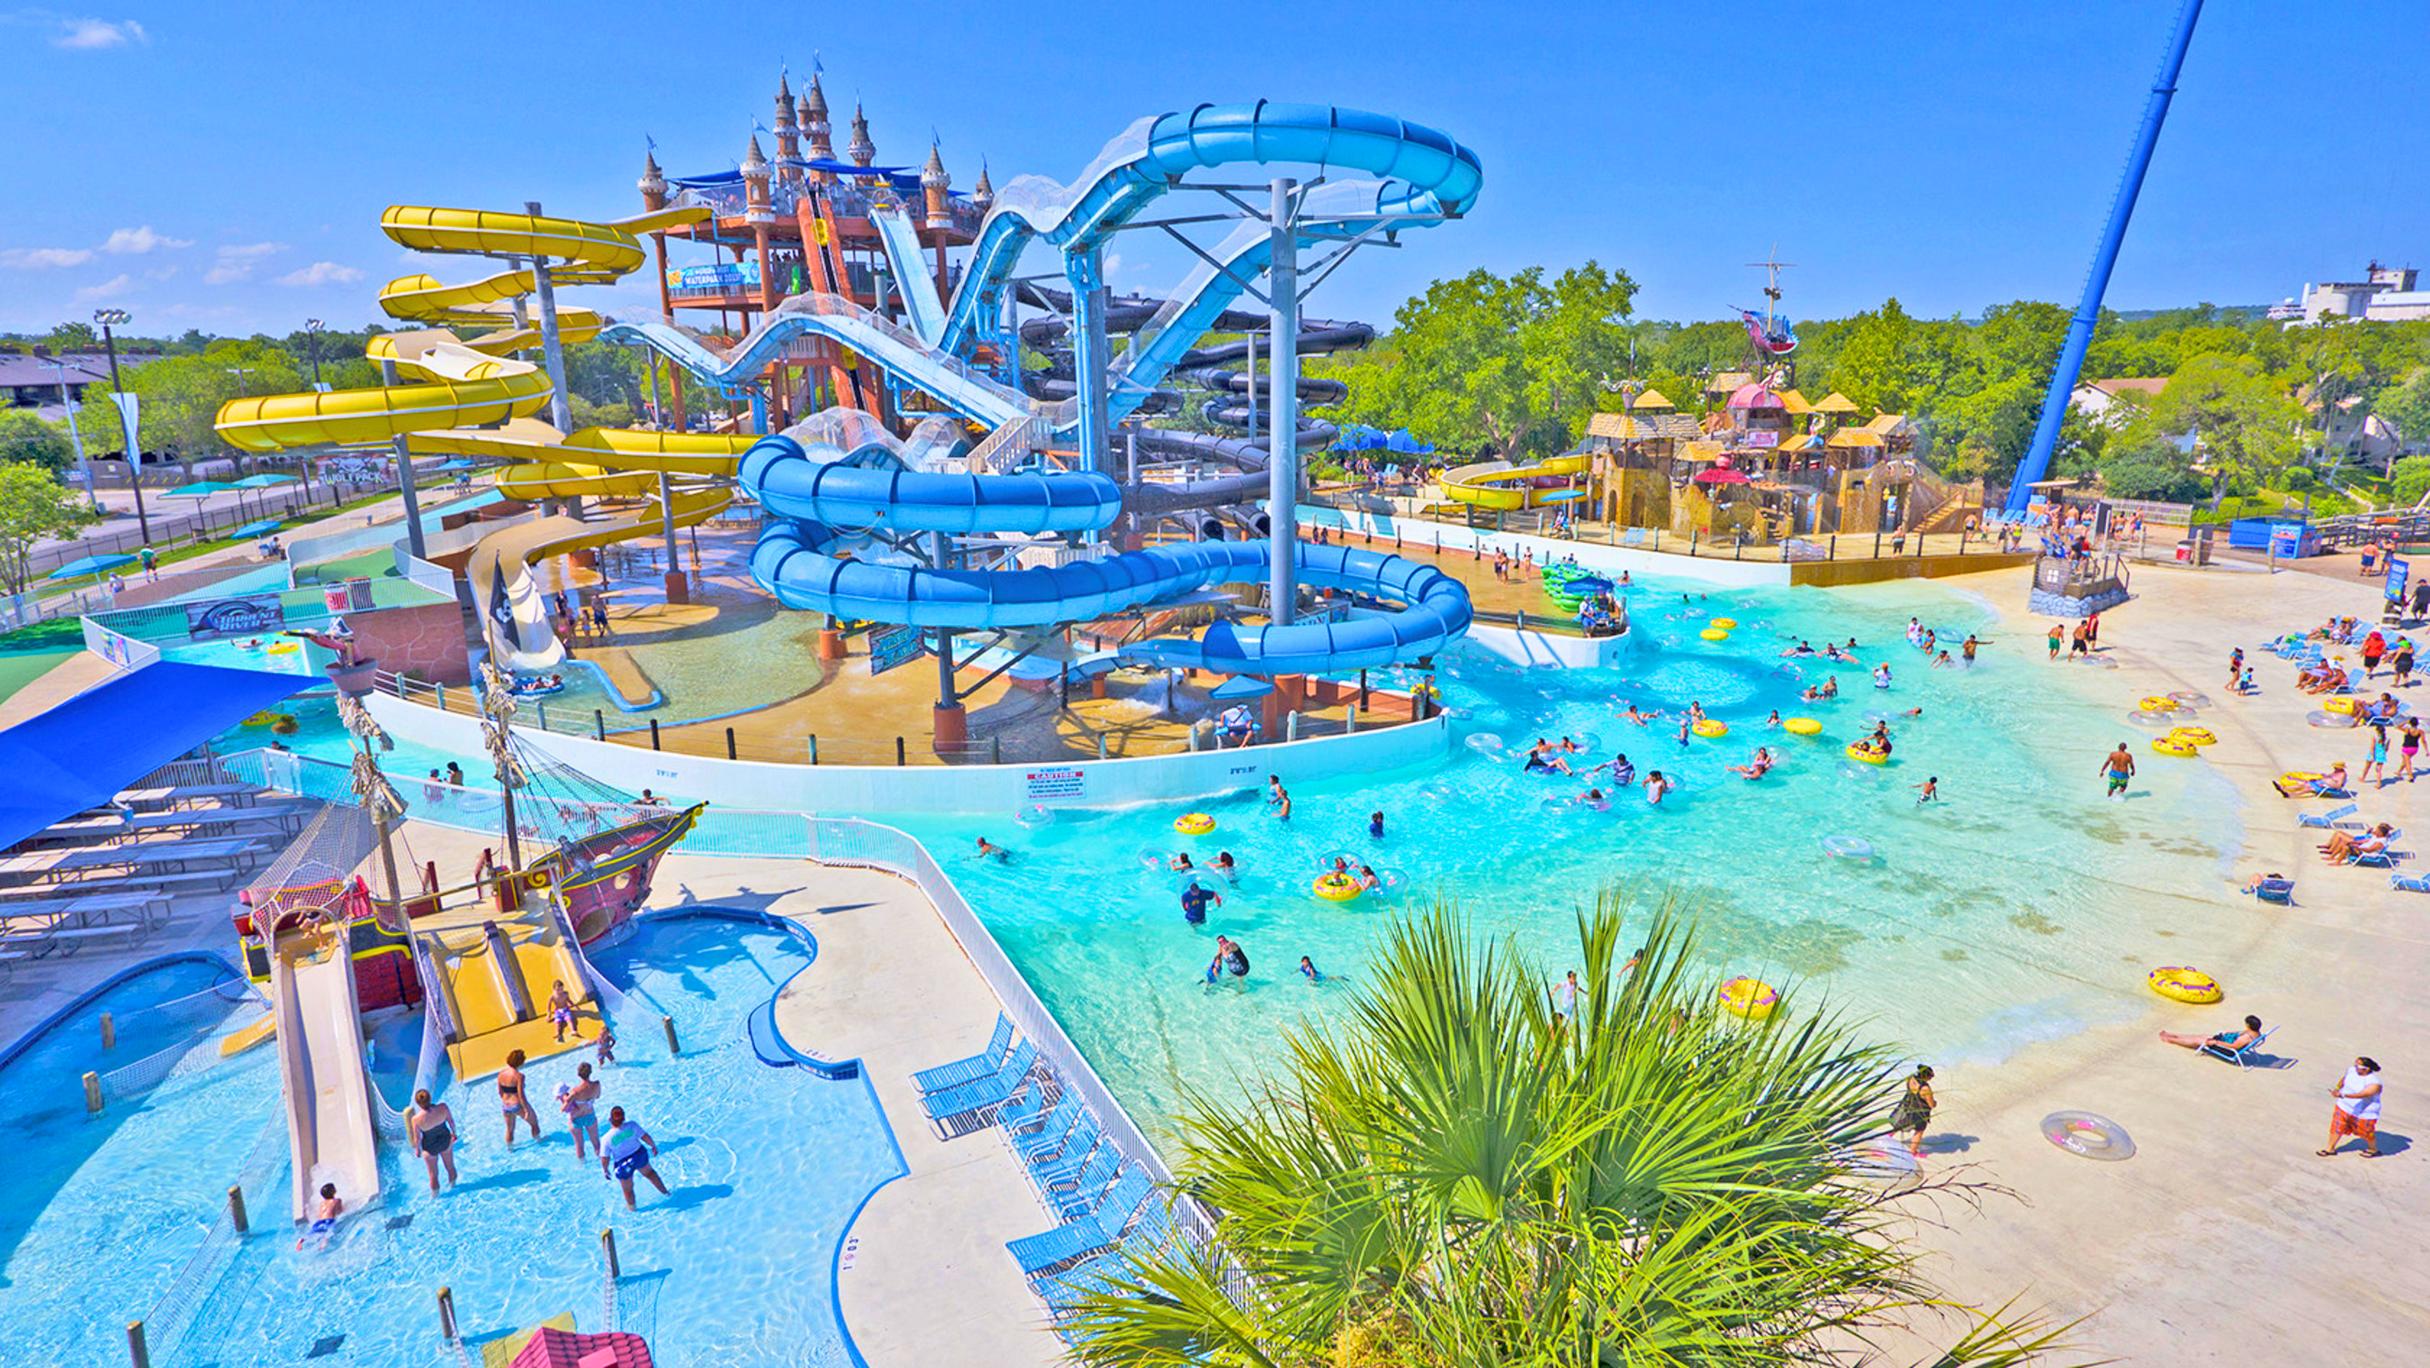
L O C A T I O N O V E R V I E W 2.5Miles
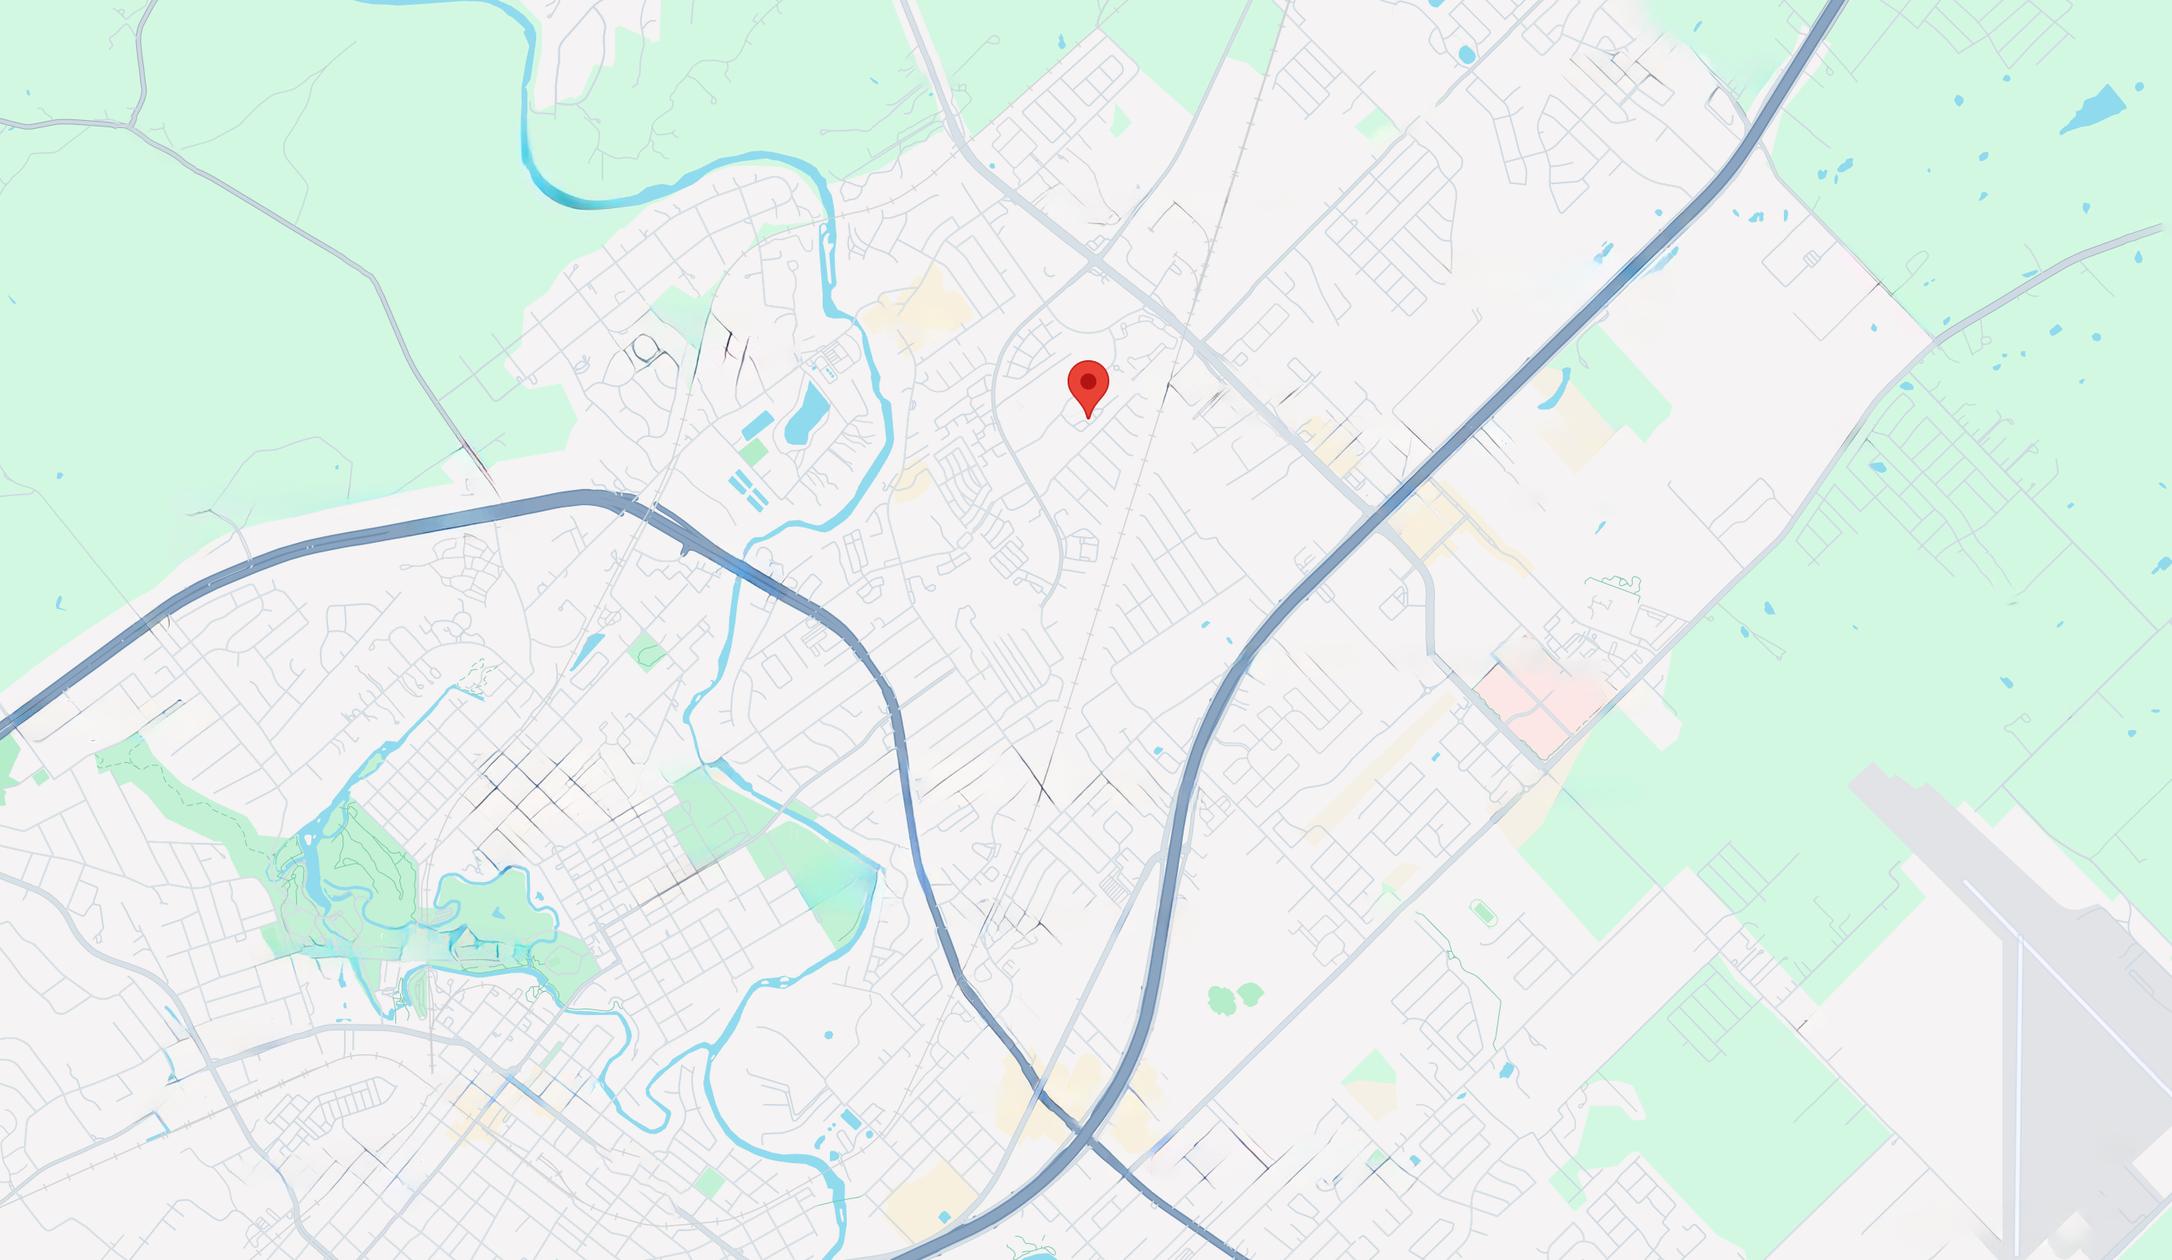
VILLAS AT SUNDANCE


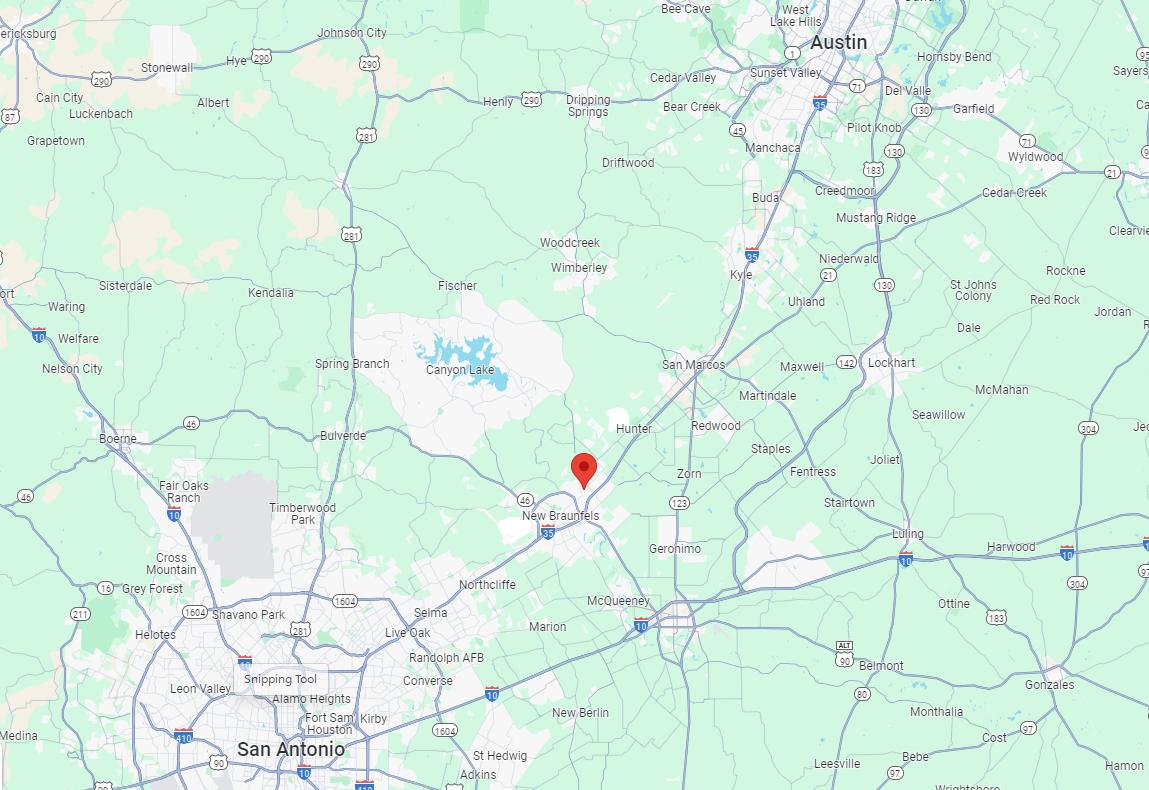


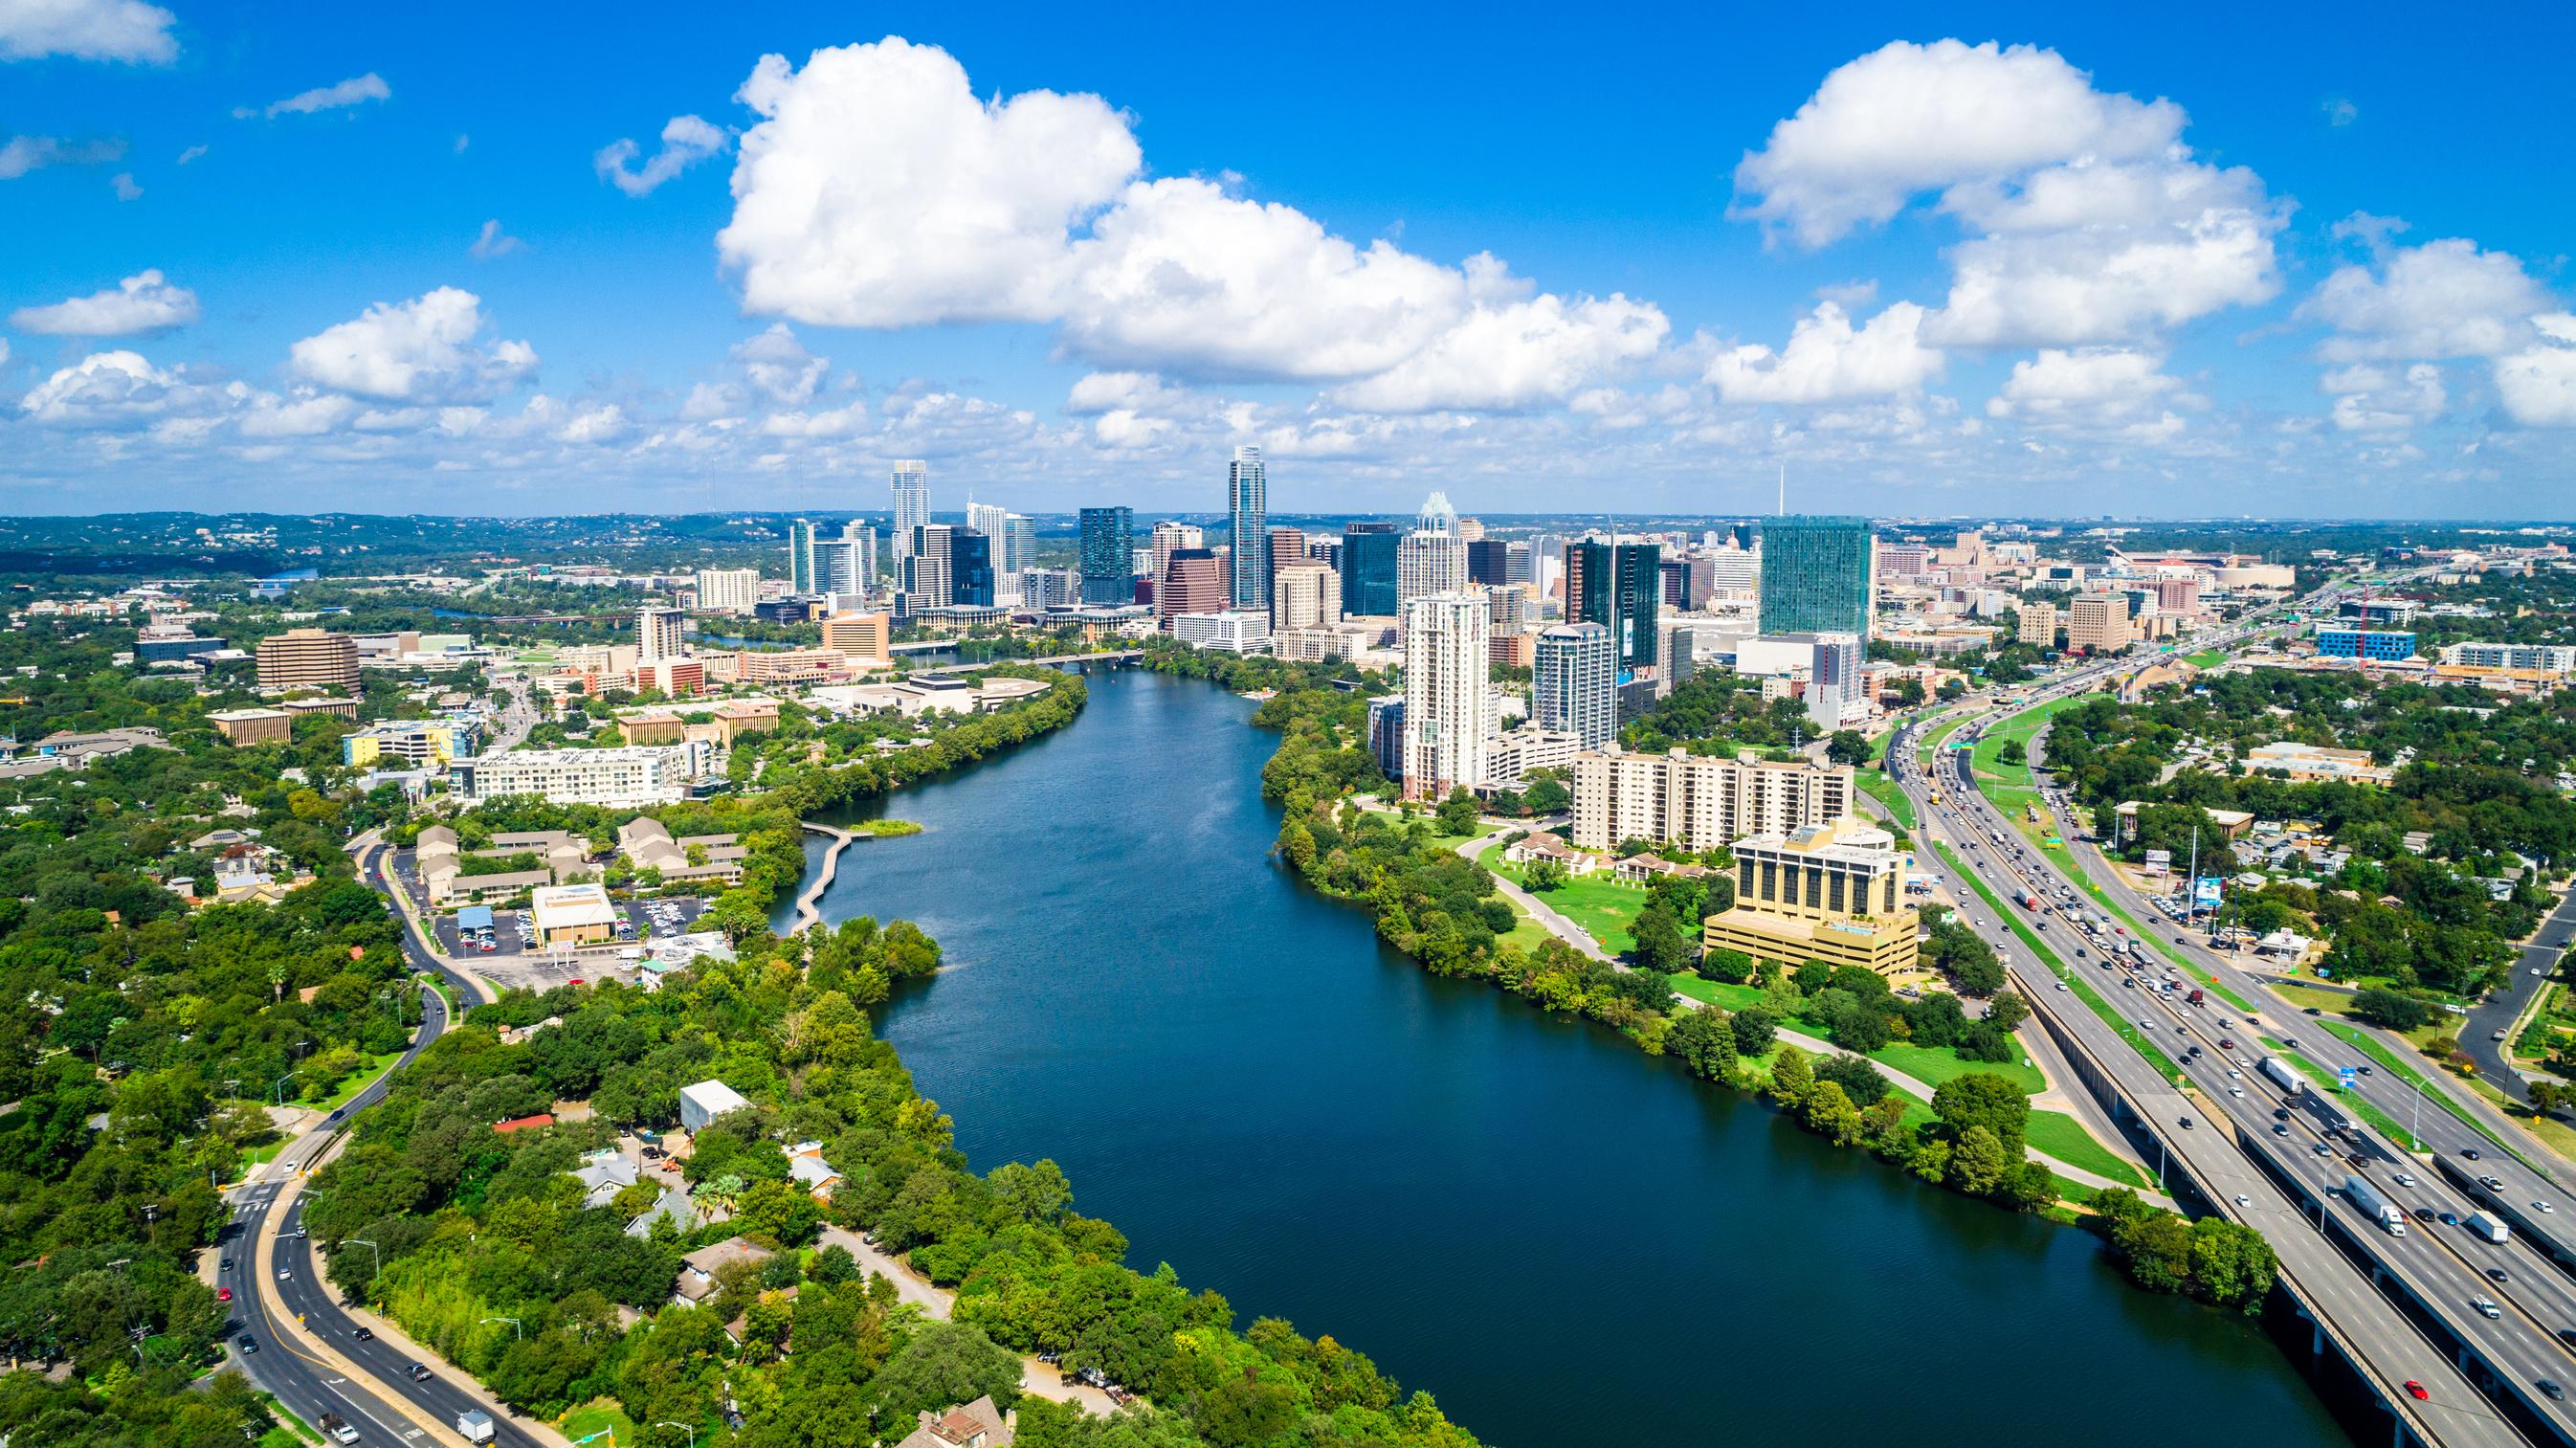
CLOSE PROXIM
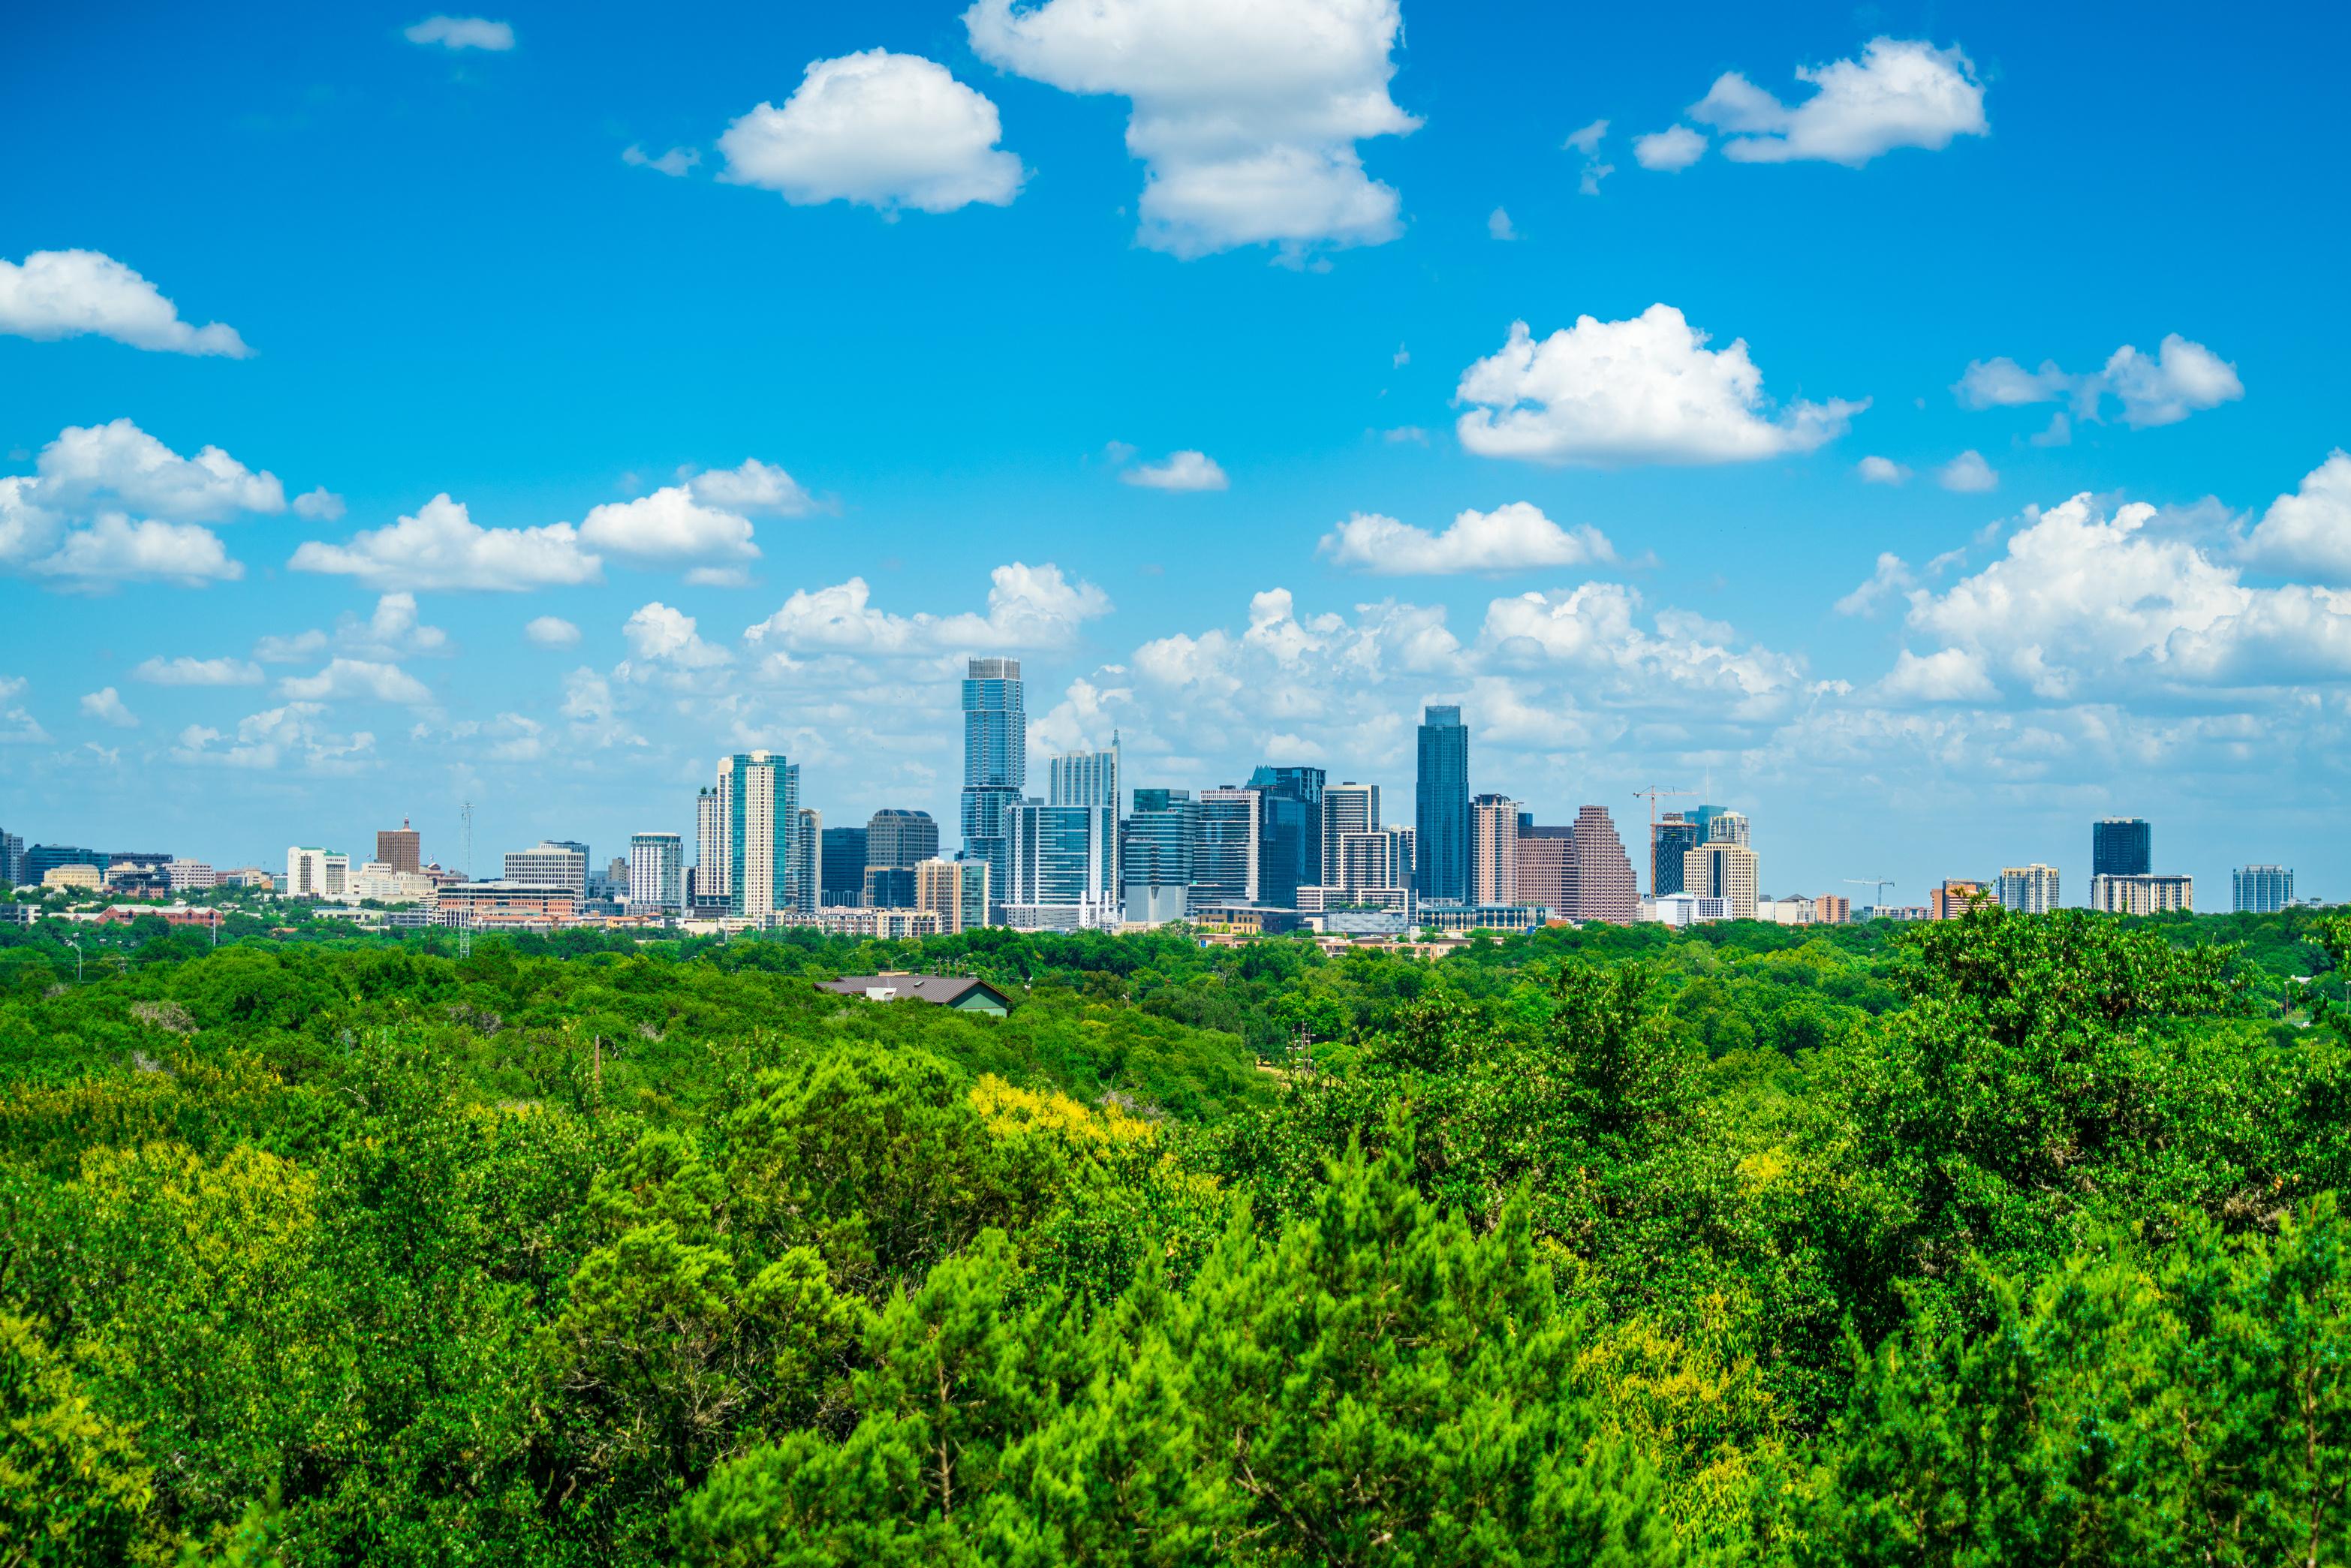
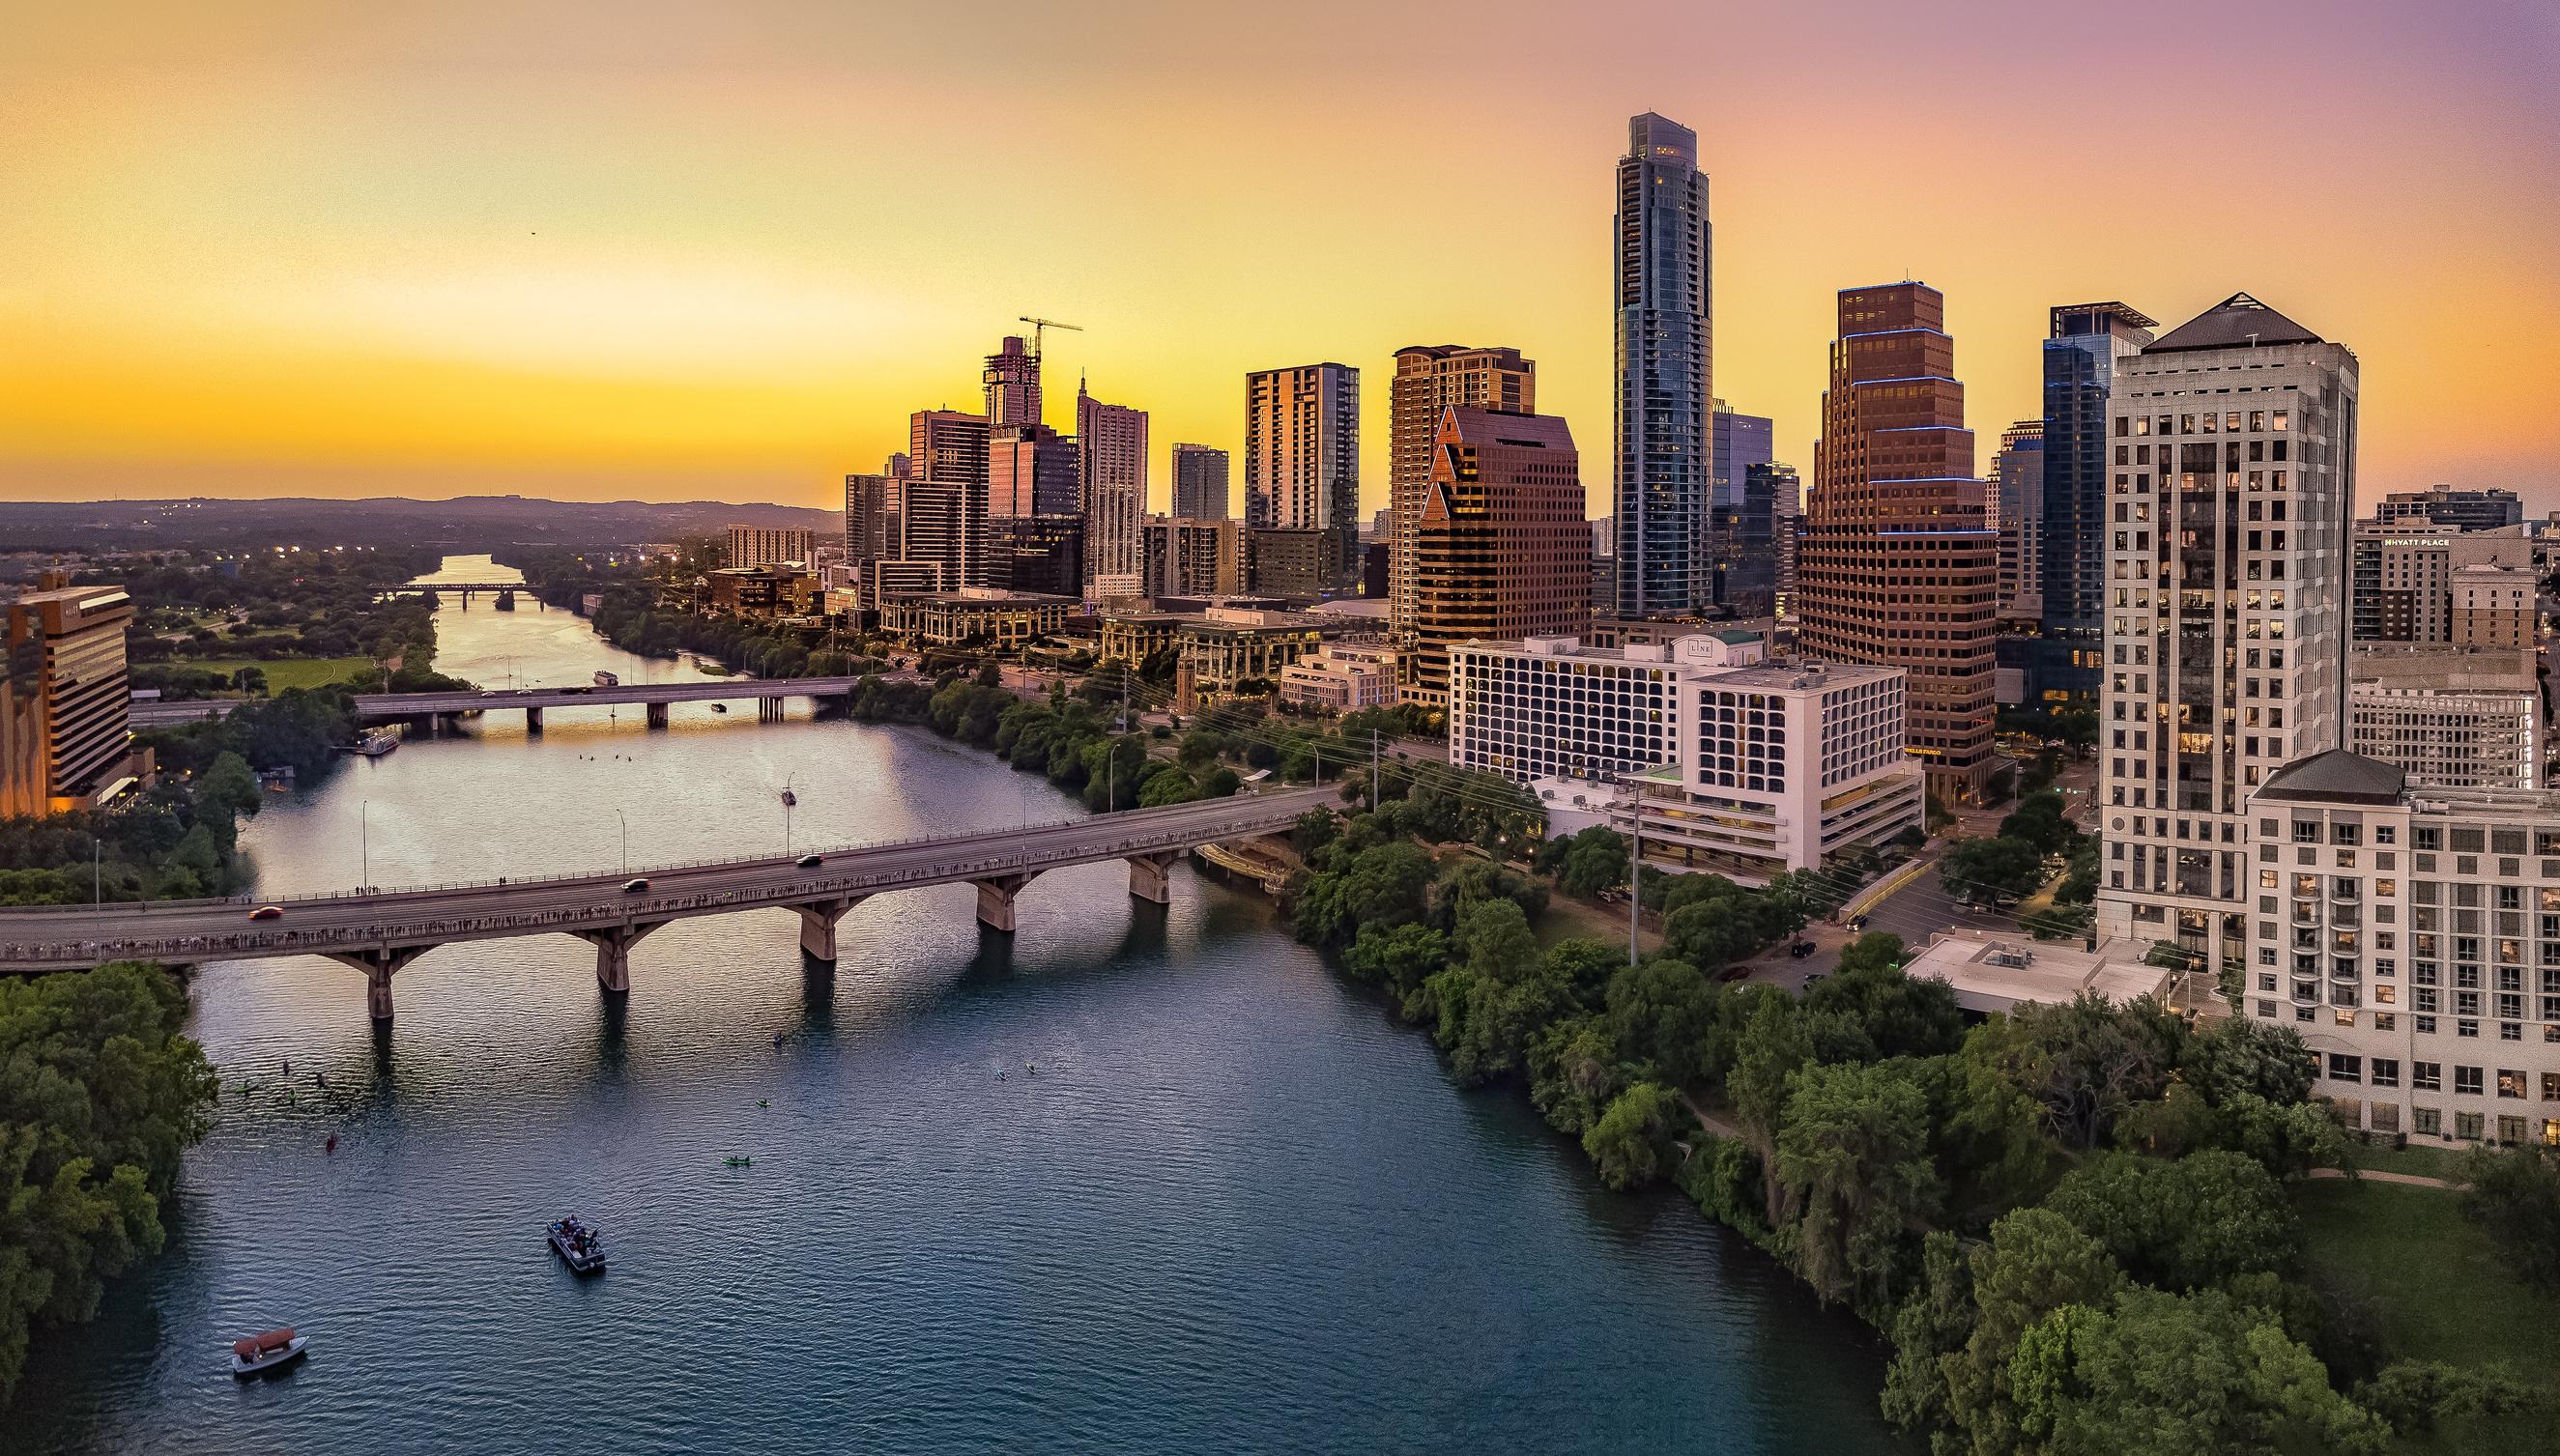
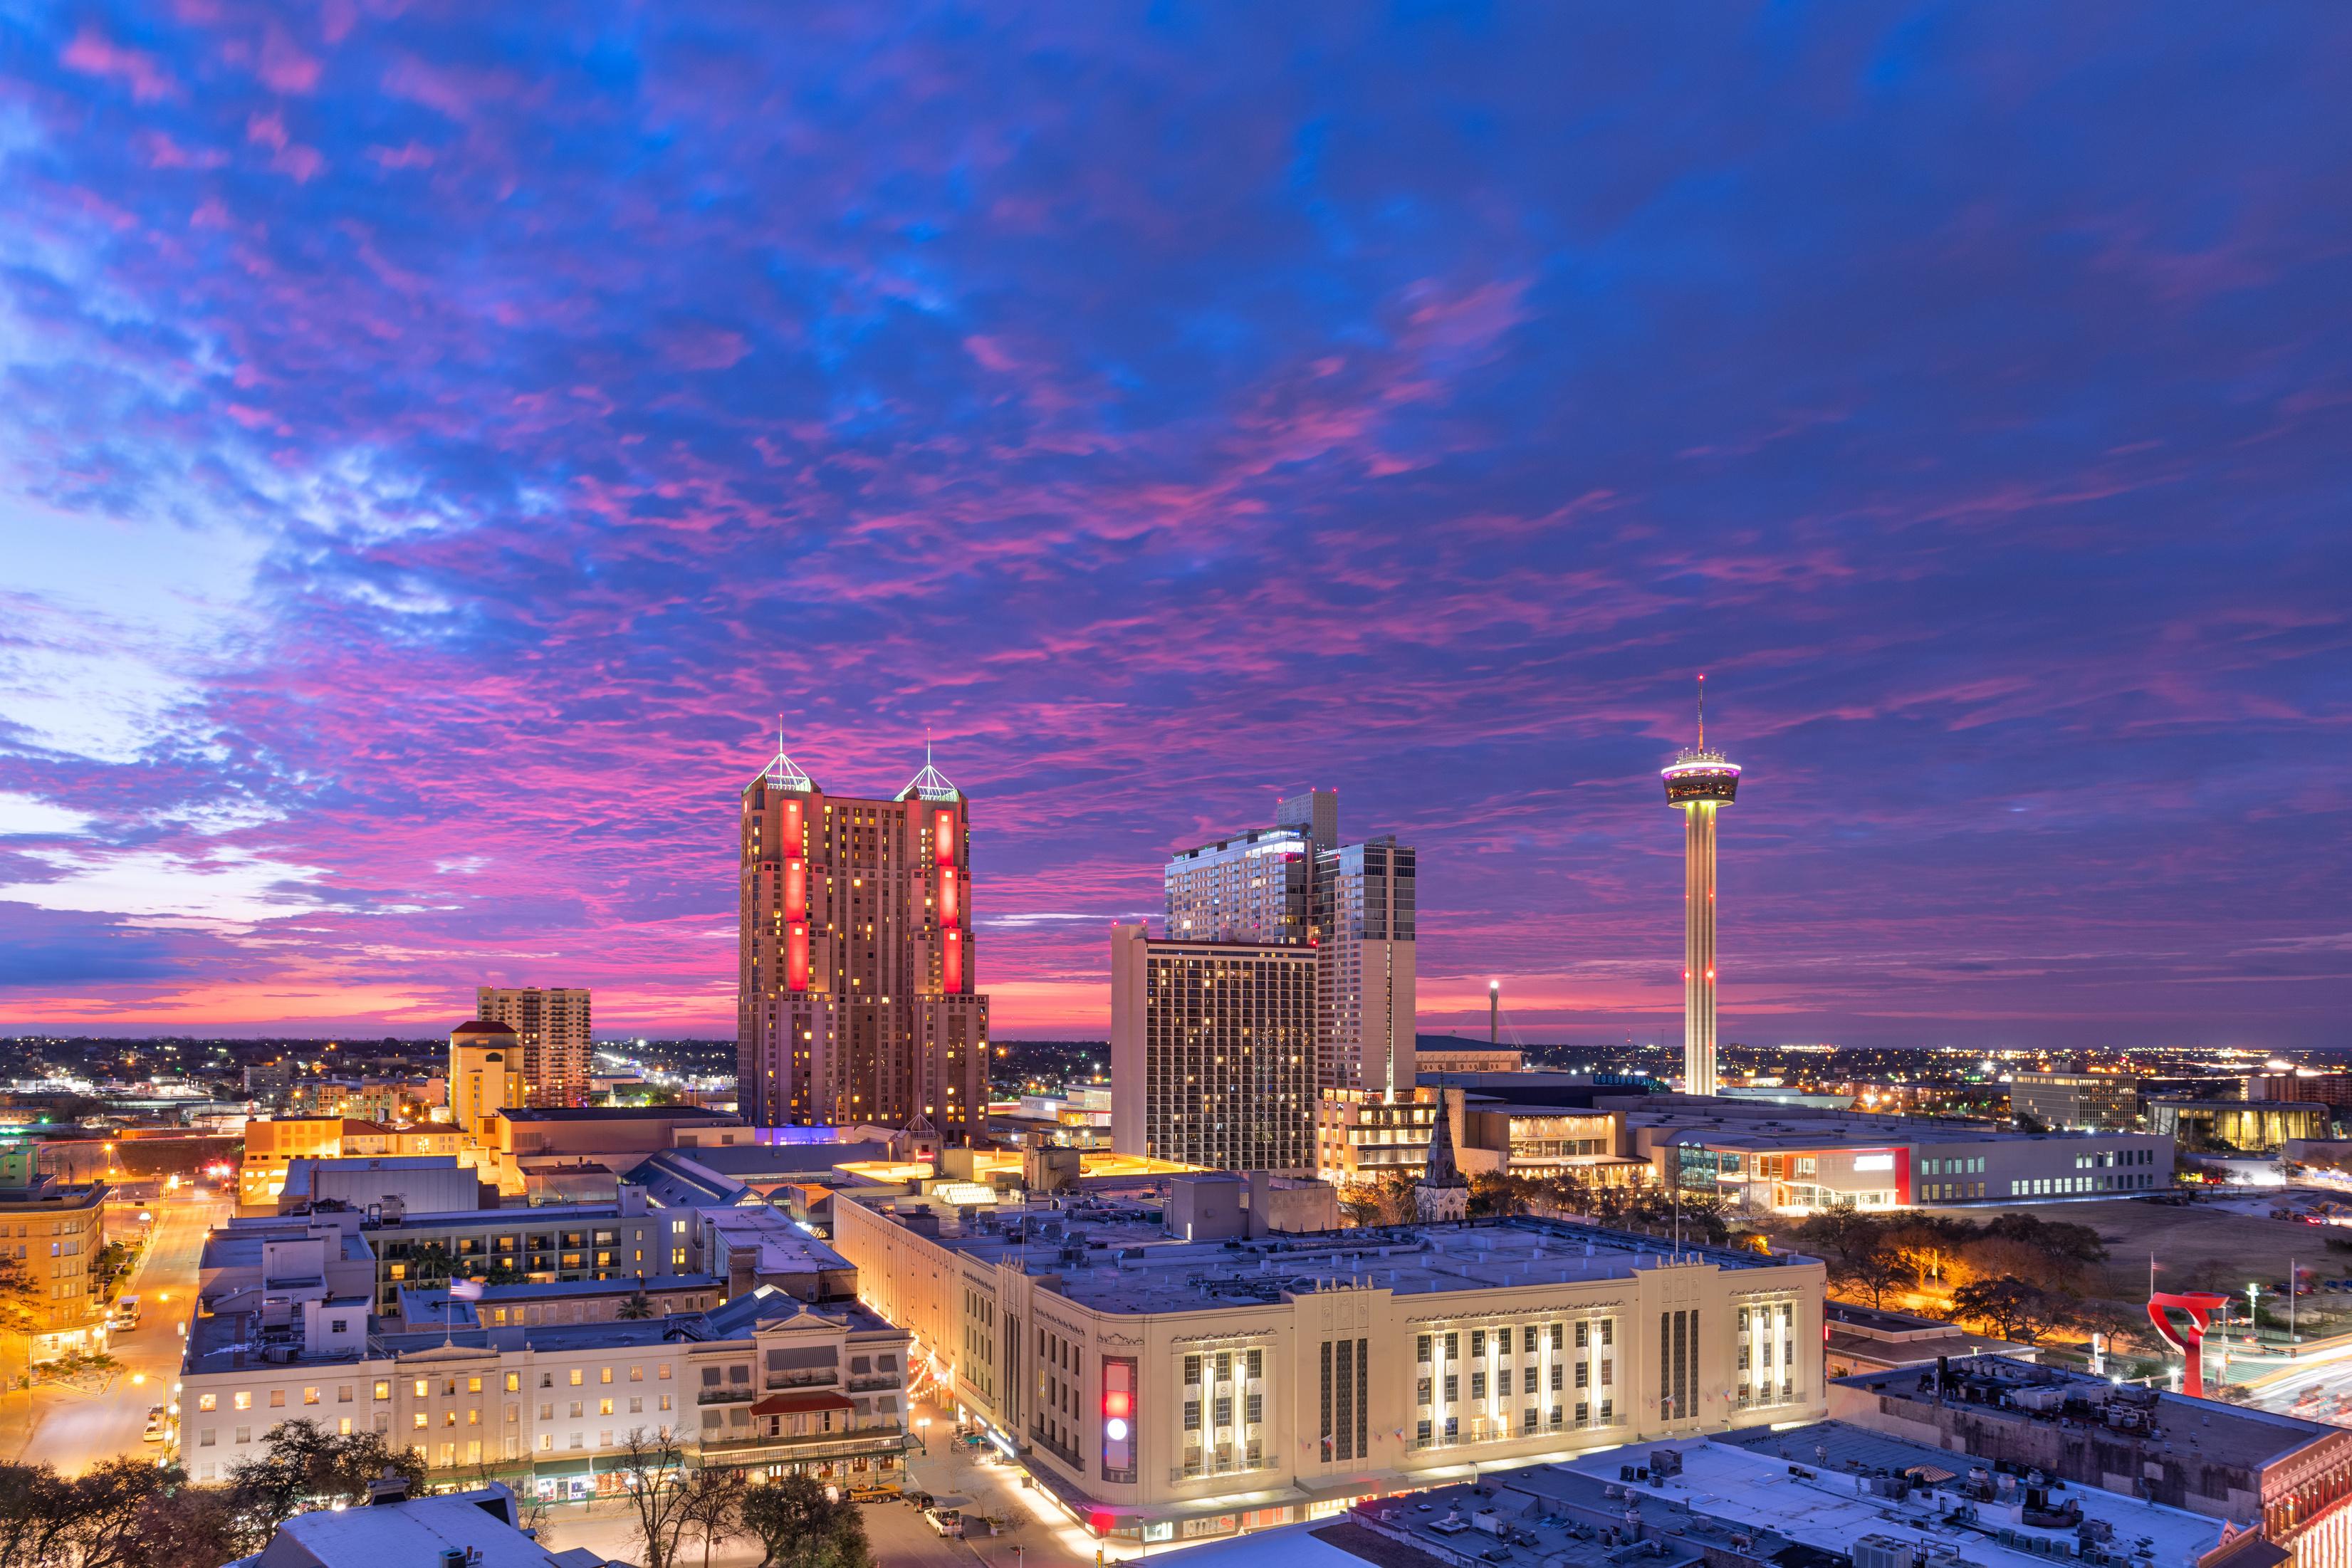
45 Miles to Downtown Austin
30 Miles to Downtown San Antonio
Austin
San Antonio
170 Miles to Houston
OVERVIEWgreater area V I L L A S | 2 0 1 2 A U S T I N - S A N A N T O N I O M E T R O P L E X


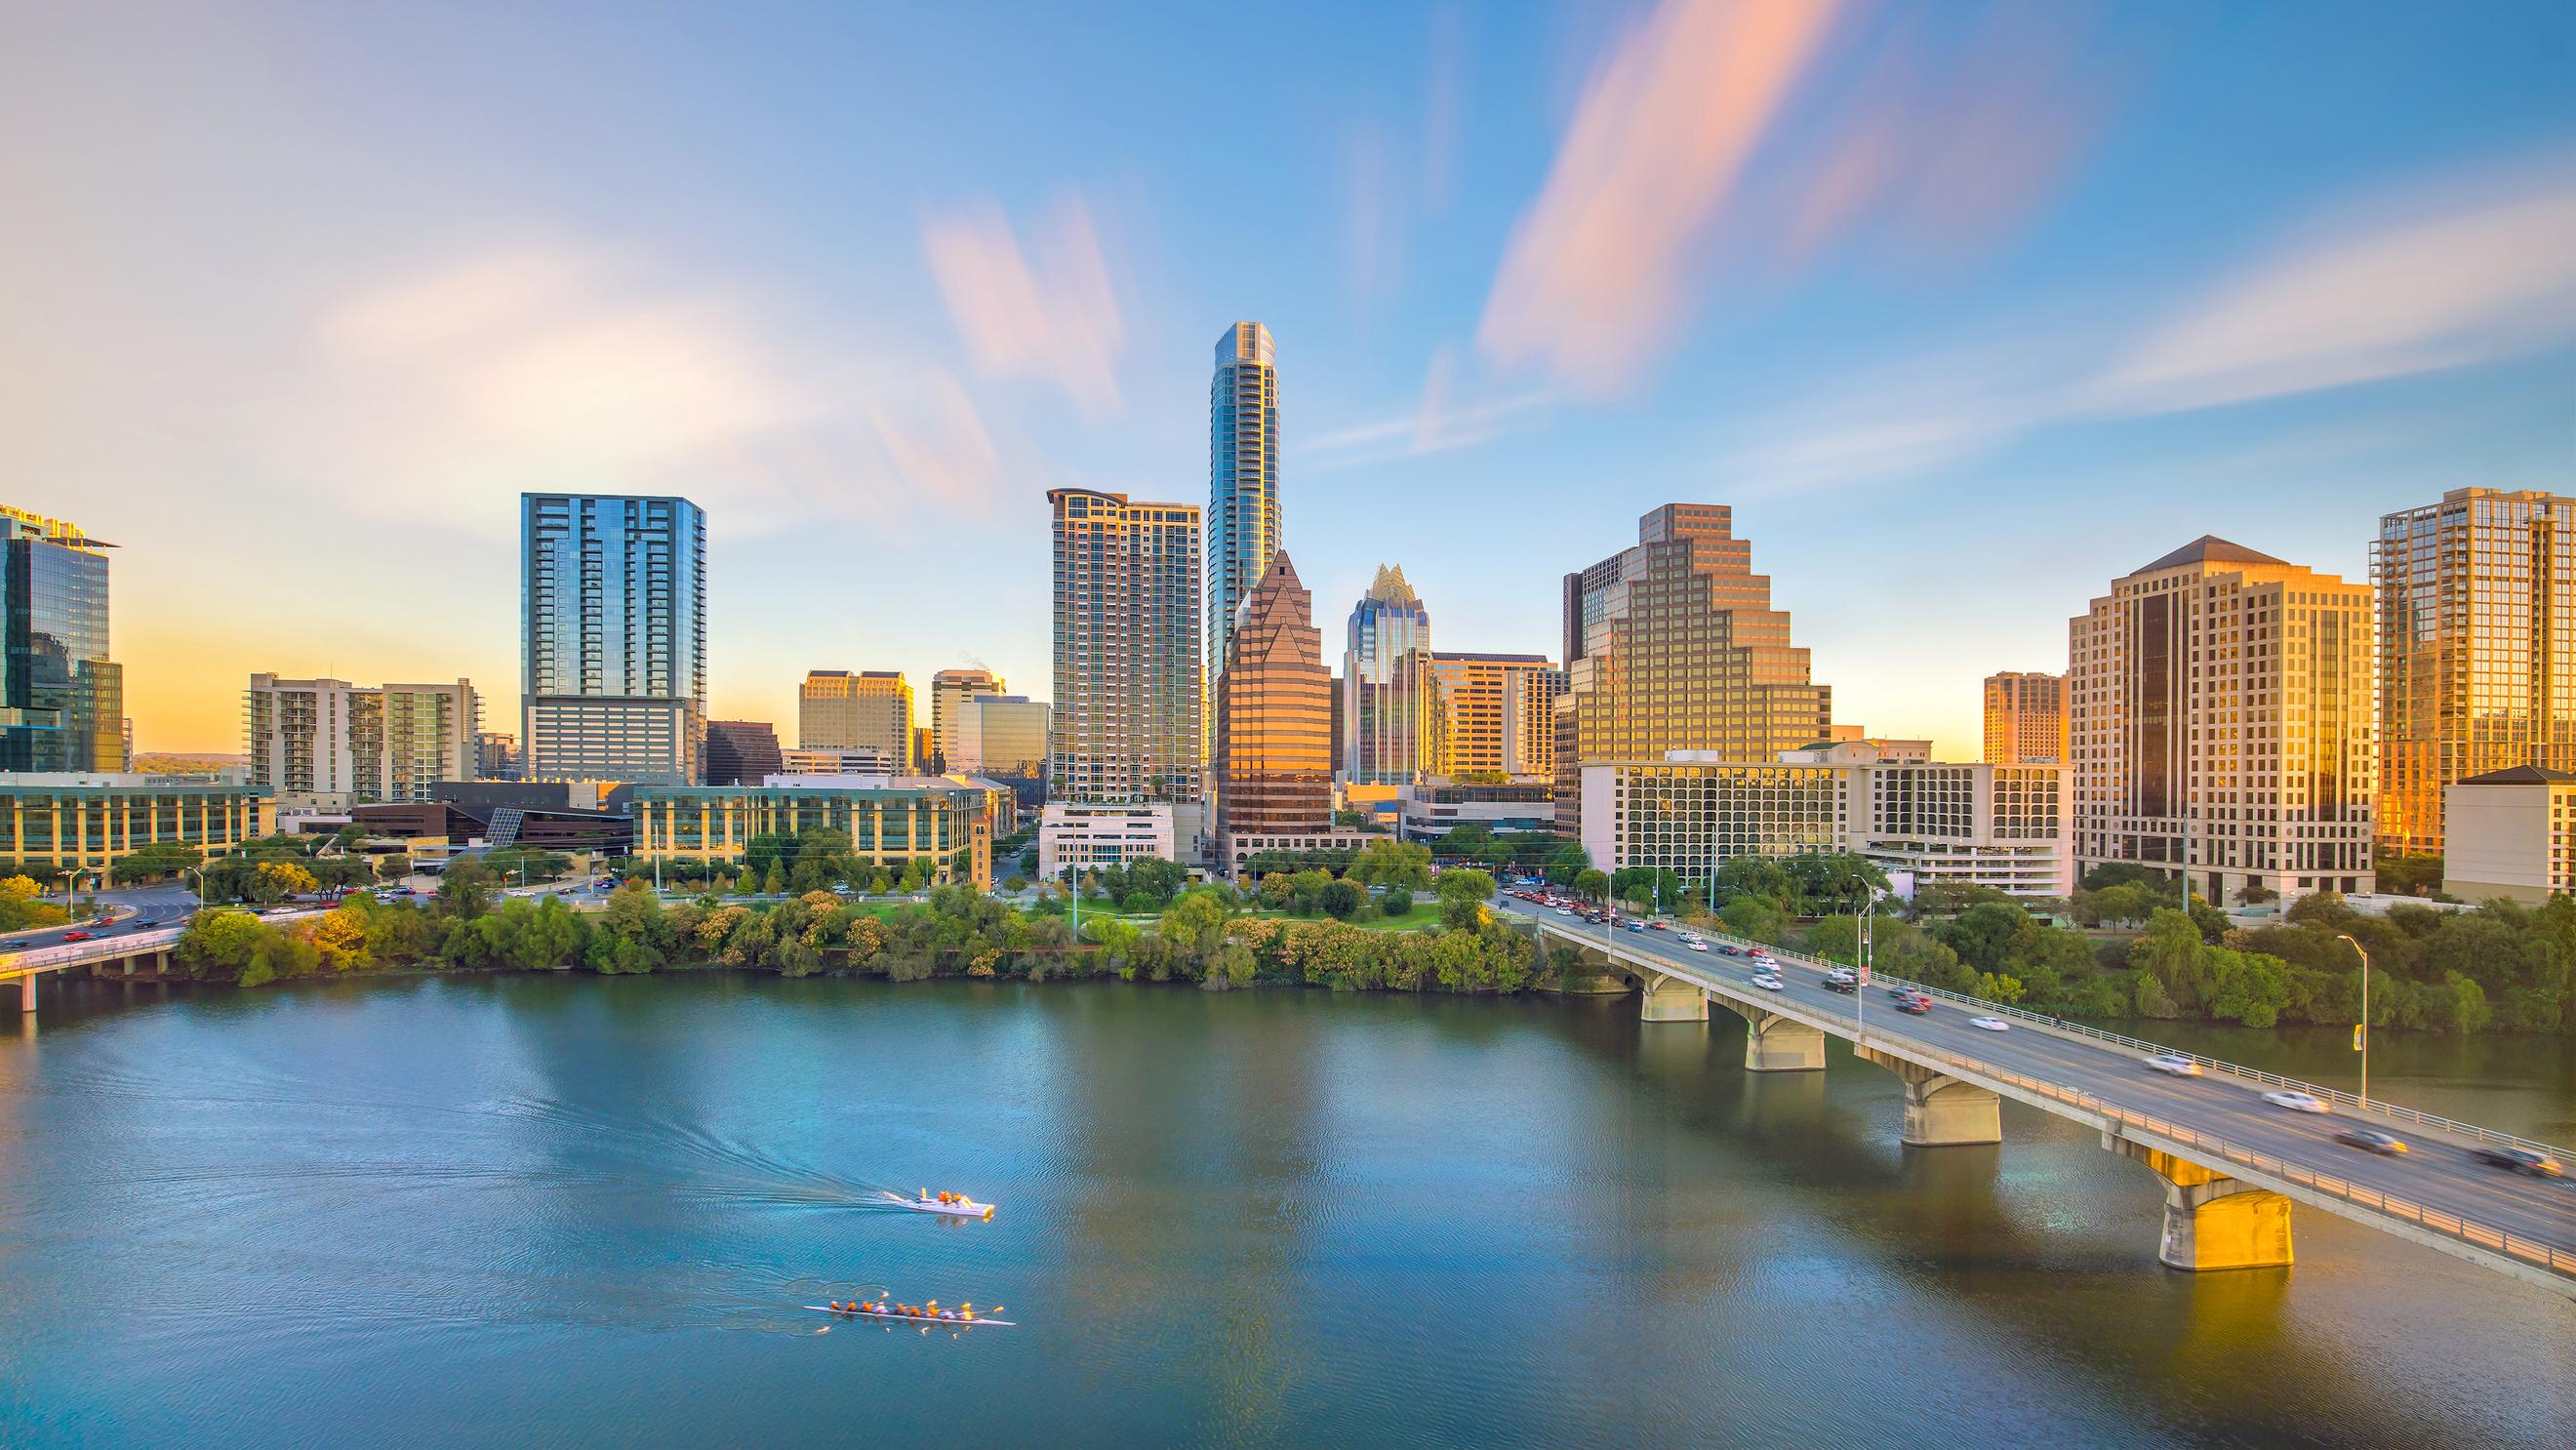
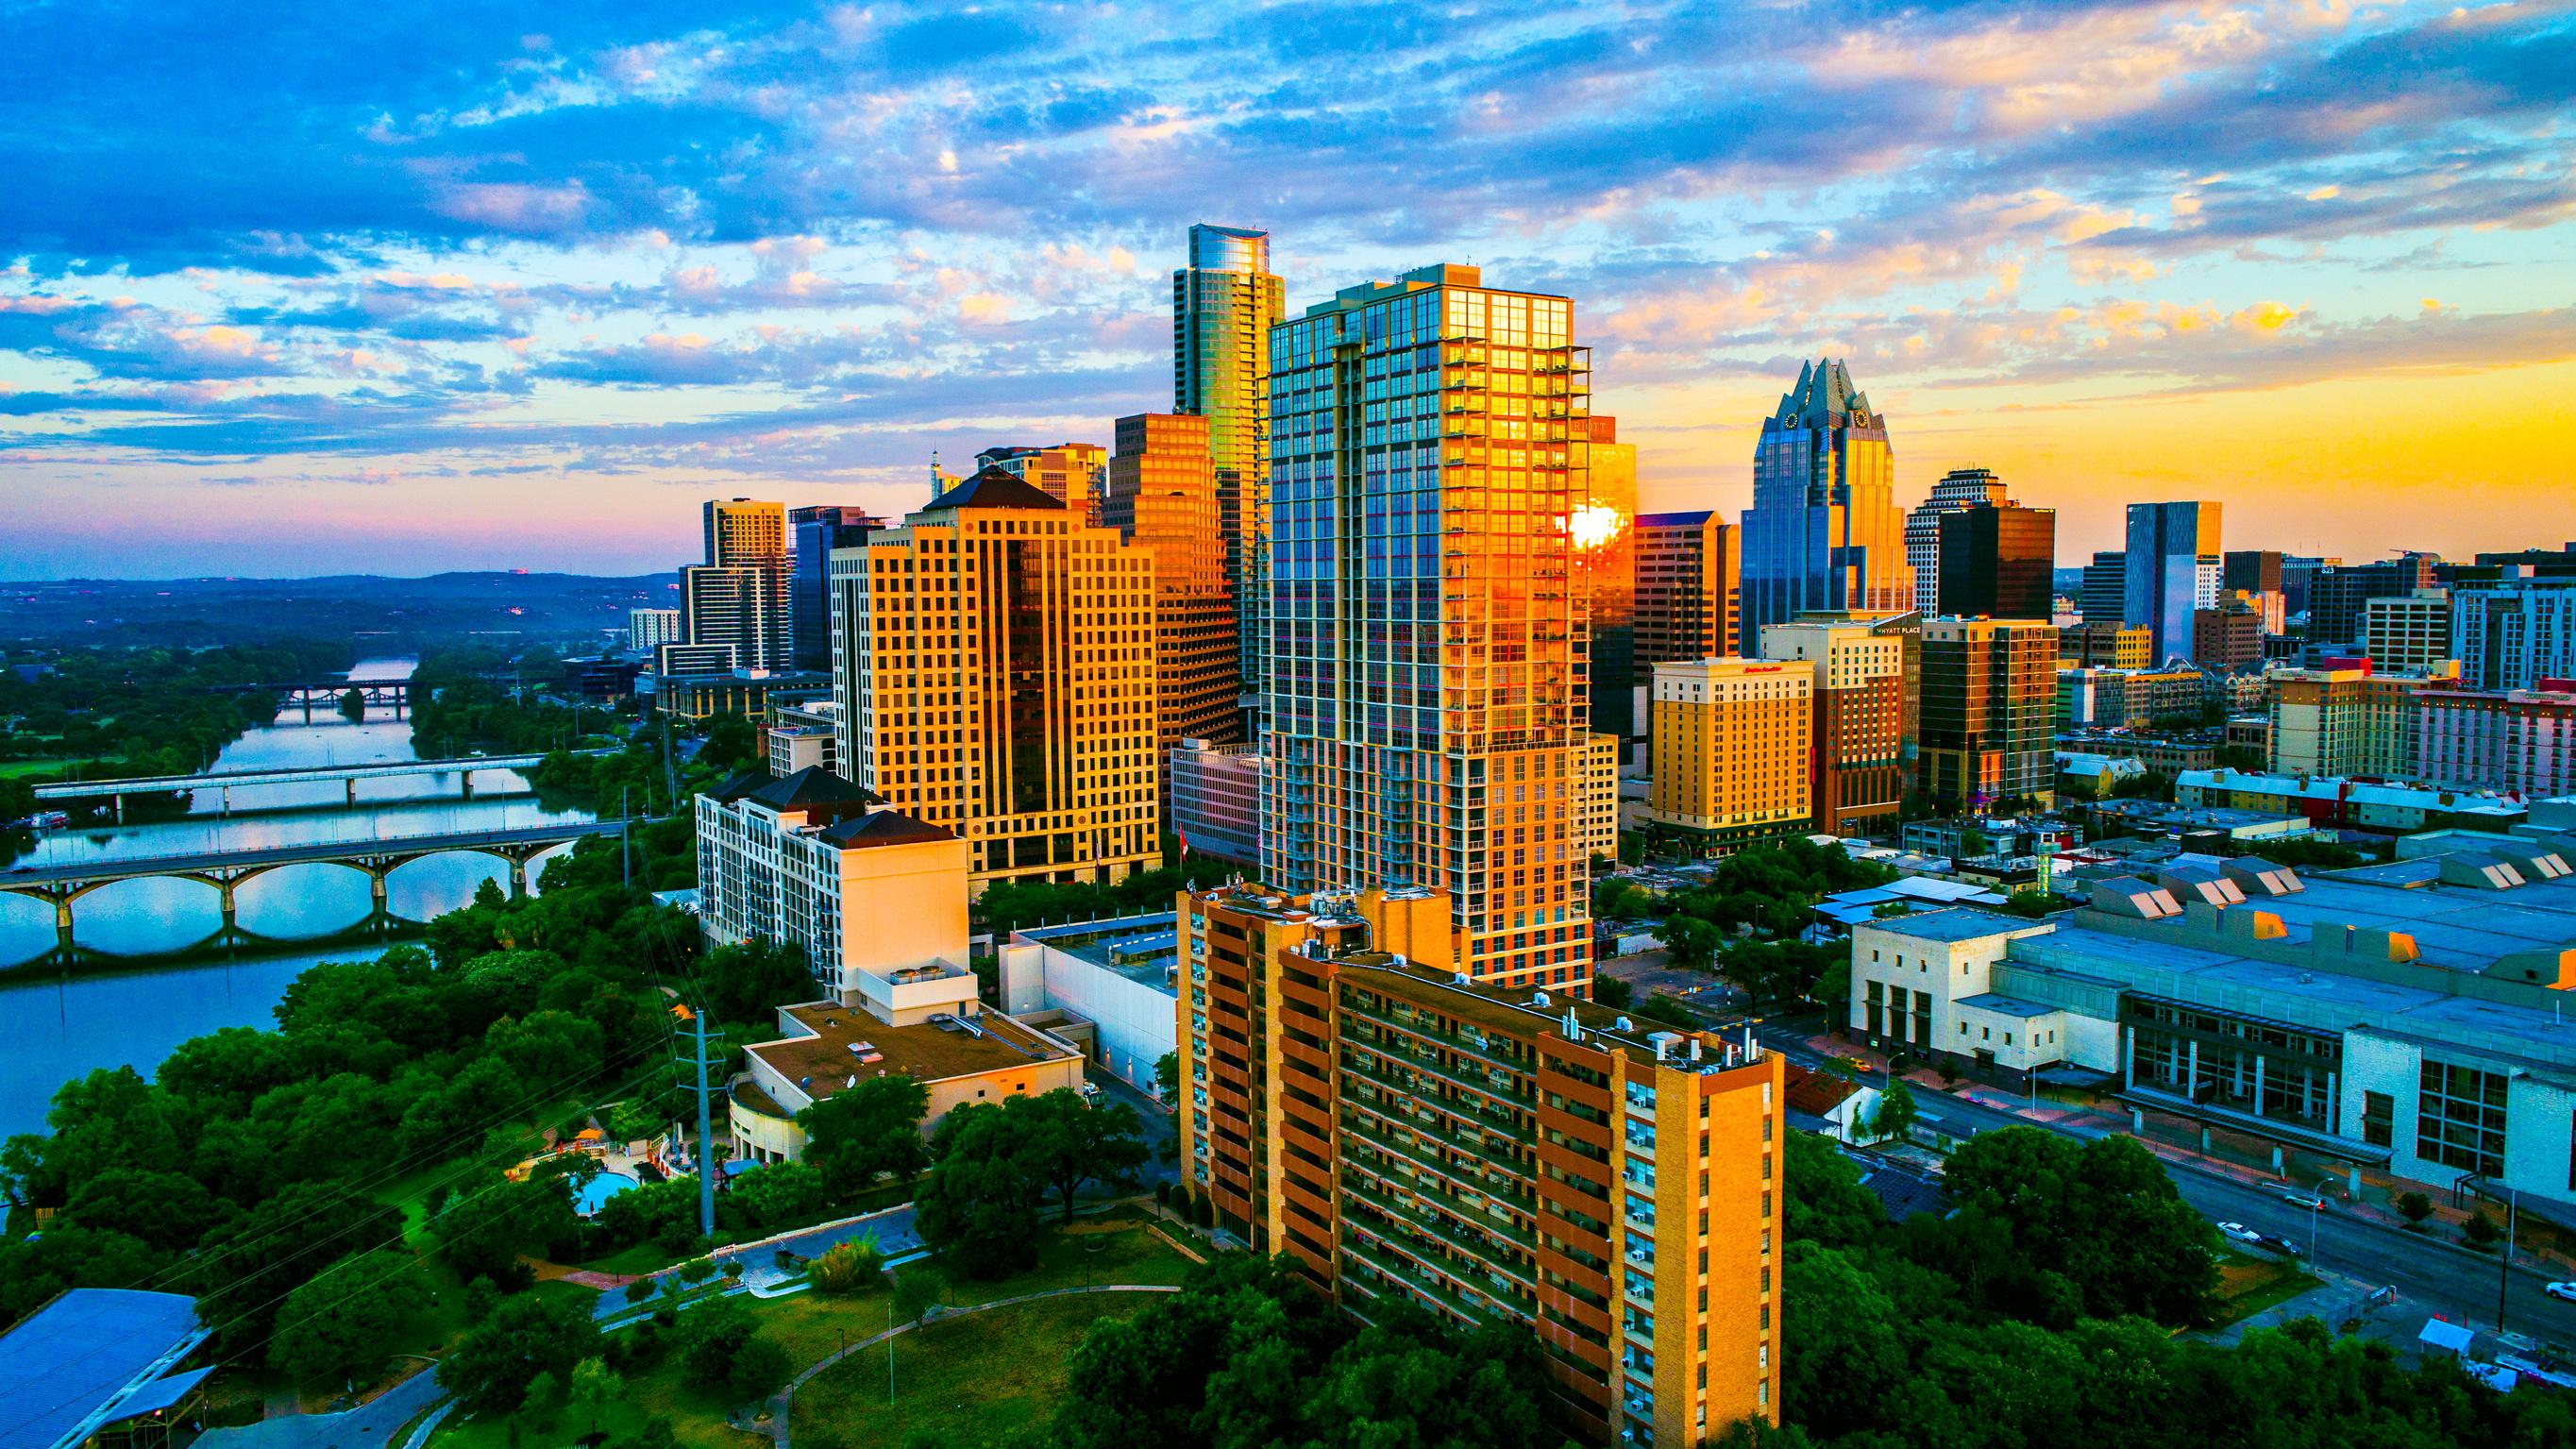
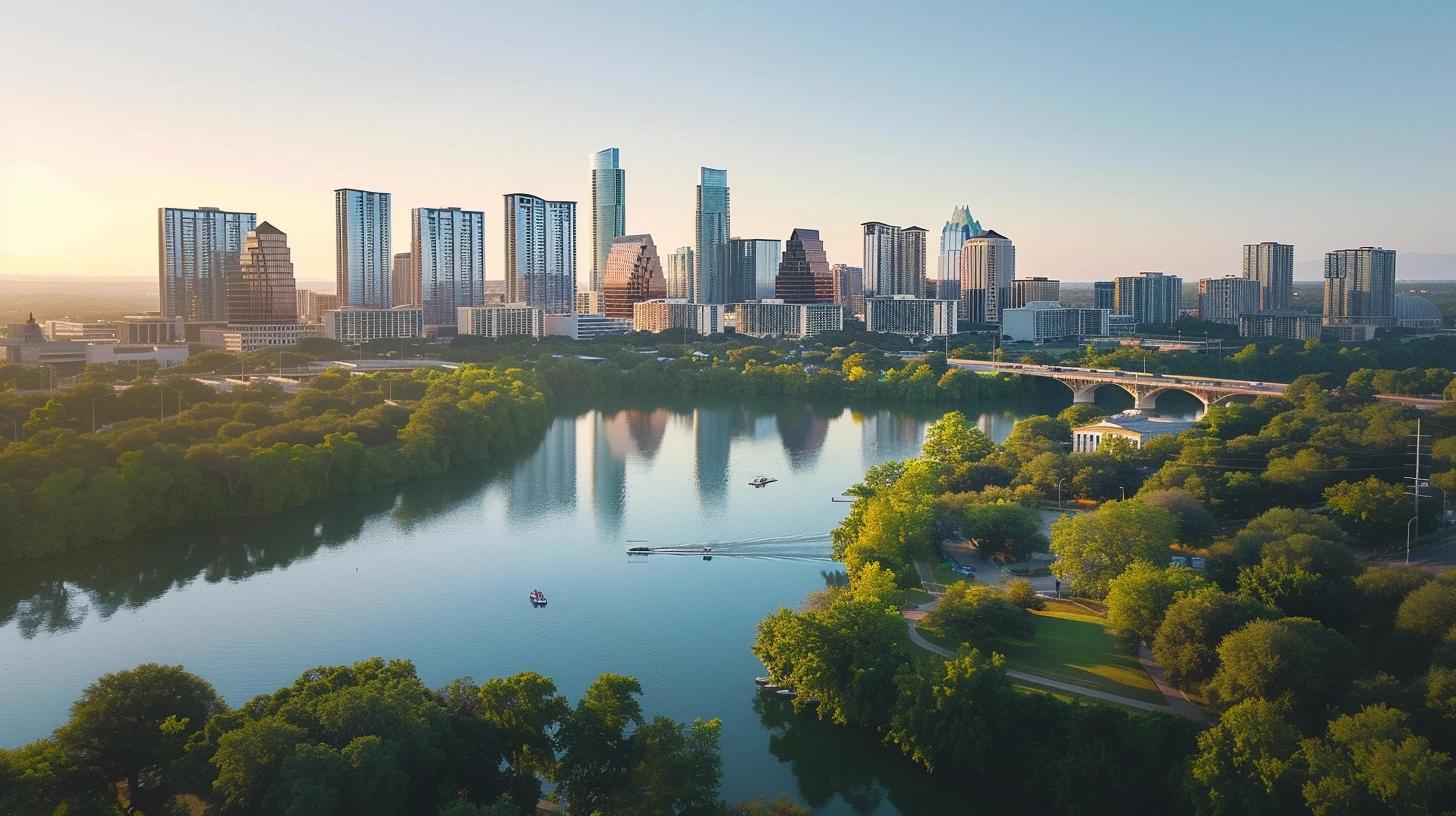
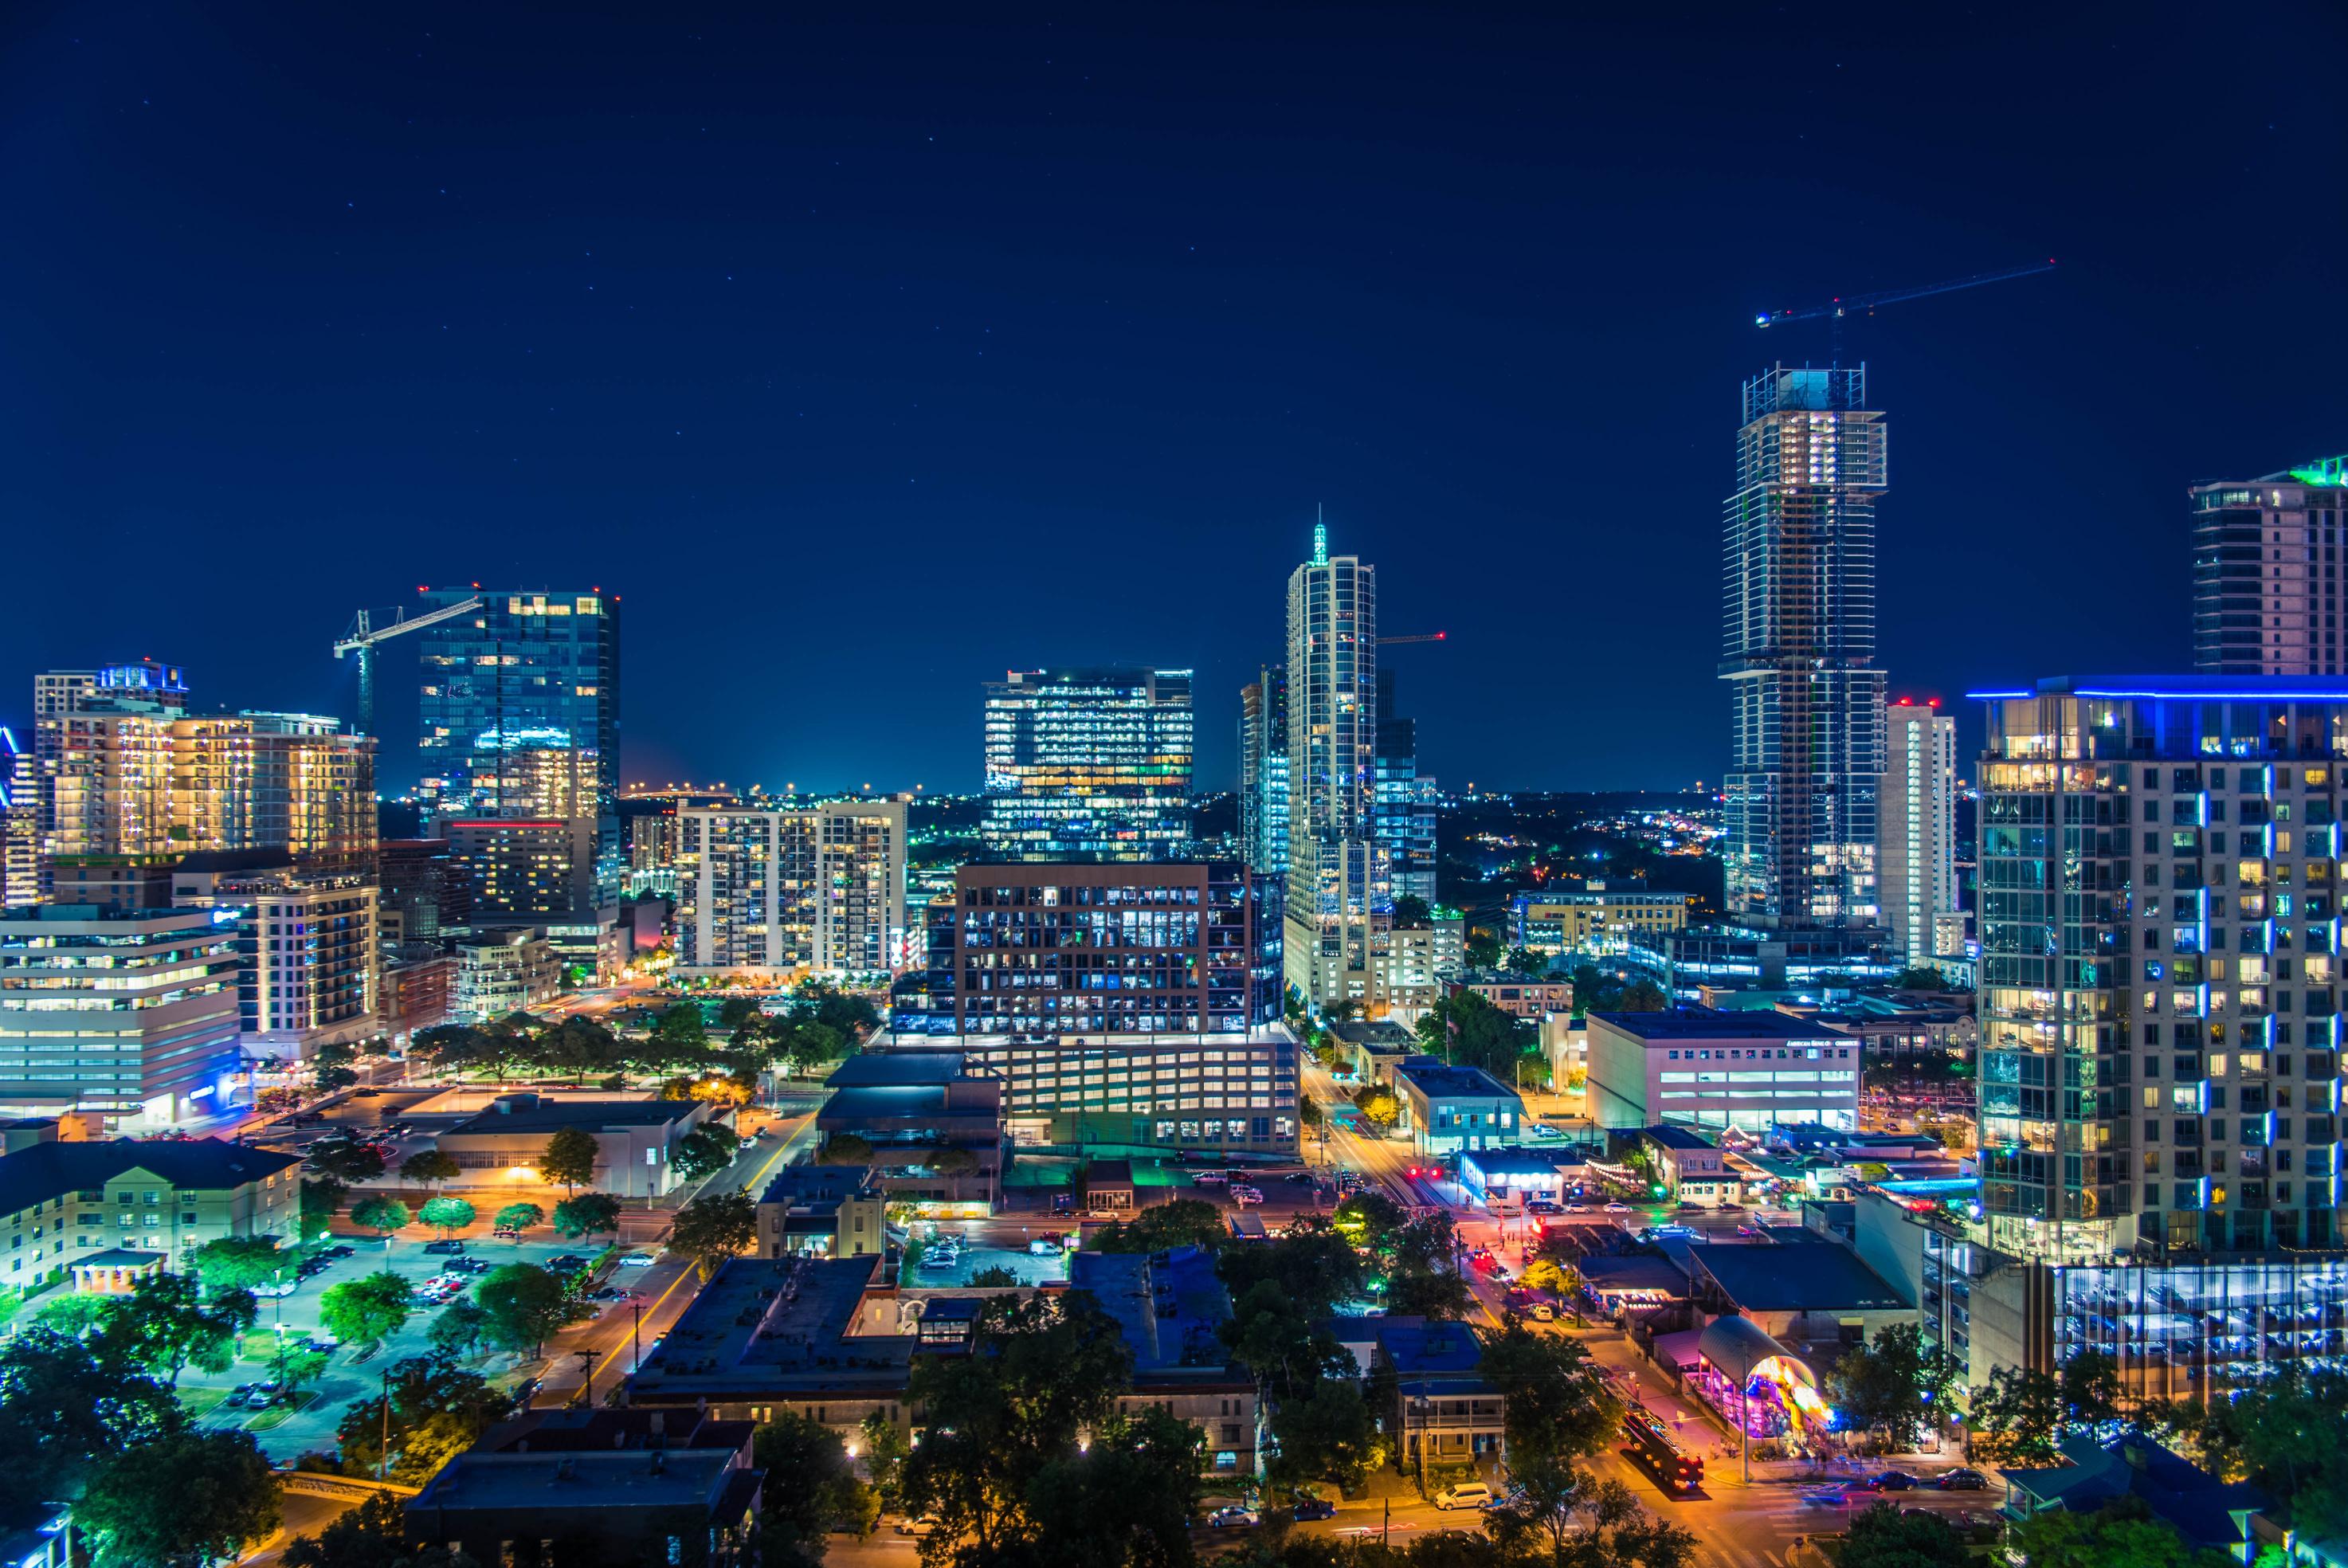
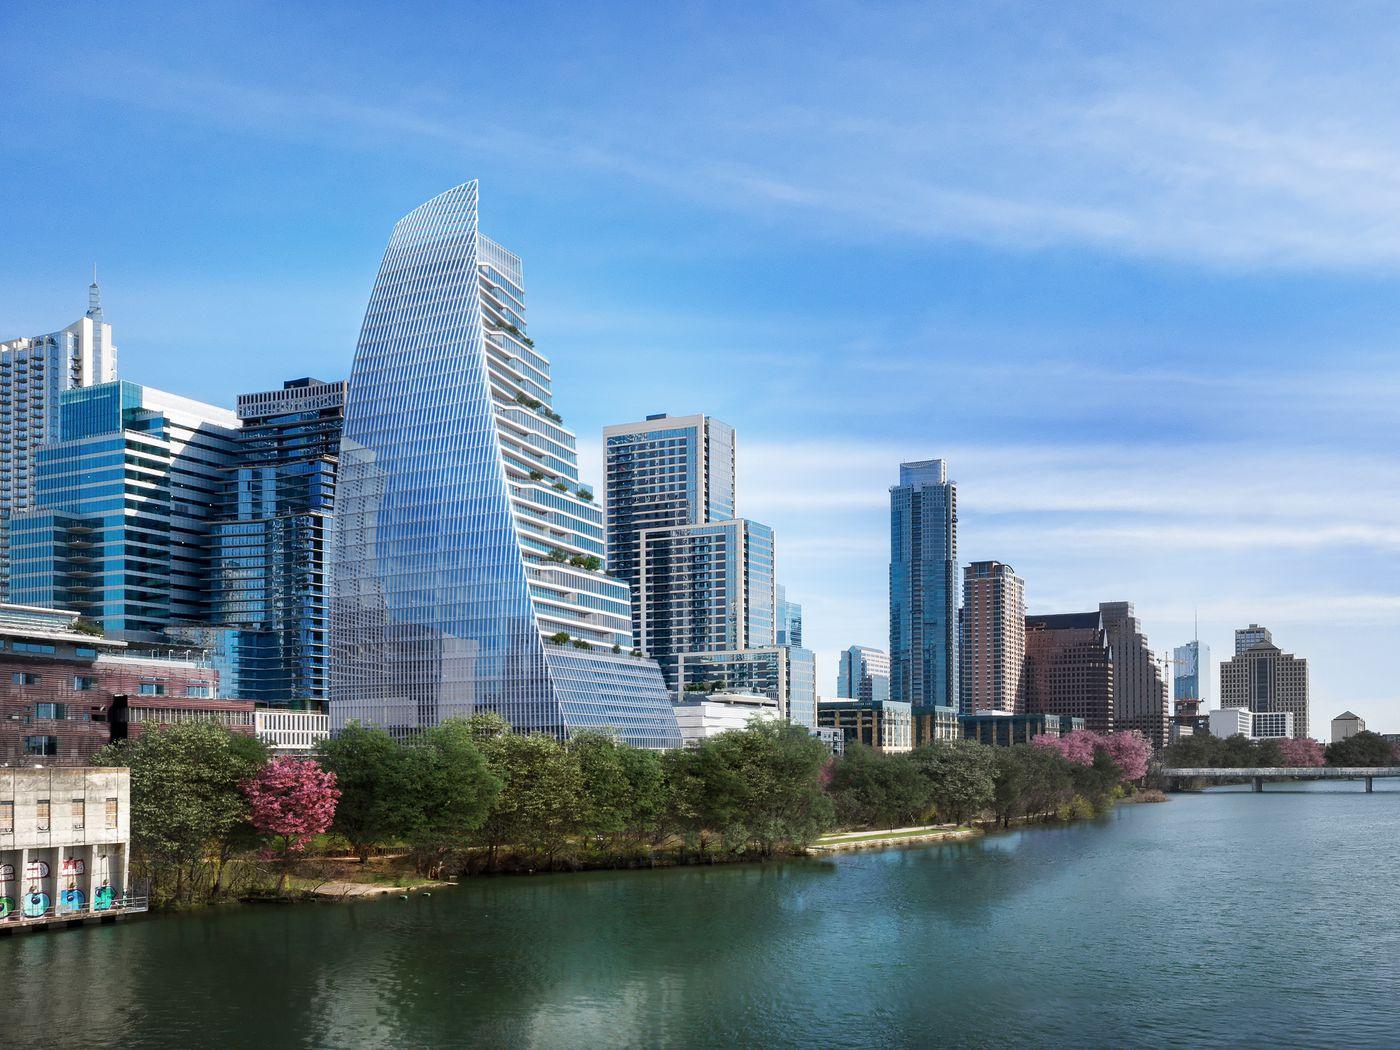
#1 Best place to start a business Growth in the working age population Tech Town since 2020 City for college graduates AUSTIN f a s t e s t g r o w i n g t e c h h u B #1 #2 #1
AUSTIN


2020 (2.29 Million) 85+ 50k 40K 30k 20k 10k 0 0-4 5-9 10-14 15-19 20-2425-2930-3435-3940-4445-4950-5455-5960-6465-6970-7475-7980-84 Male Population Female Population 0 95M 0.9M 0 85M 0.8M 0.75M 0.7M 2000 2005 2010 2015 2020


VILLAS AT SUNDANCE IS LOCATED RIGHT IN THE MIDDLE OF SAN ANTONIO AND AUSTIN, TEXAS PROVIDING A LARGER JOB POOL
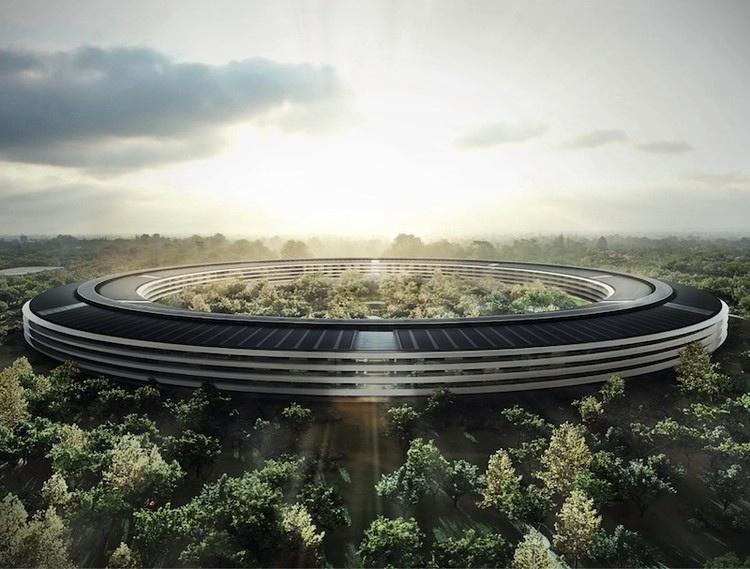
APPLE SA UNIVERSITY OF TEXAS HEALTH SCIENCE CENTER TEXAS SCHOOL DISTRICT M OR TEXAS GOVERNMENT AMAZON DELL ORACLE JOINT BASE SAN ANTONIO
USAA GOOGLE META IBM EMPLOYS 10,100 EMPLOYS 7,000 EMPLOYS 32,277 EMPLOYS 13,000 EMPLOYS 130,000 EMPLOYS 1,500 EMPLOYS 2,000 EMPLOYS 8,738 EMPLOYS 75,000 EMPLOYS 18,300 EMPLOYS 39,500 EMPLOYS 19,000 EMPLOYS 16,837 EMPLOYS 5,600
HUBS
AUSTIN A WORKER & BUSINESS FRIENDLY CITY


4 MILLION SF FACILITY

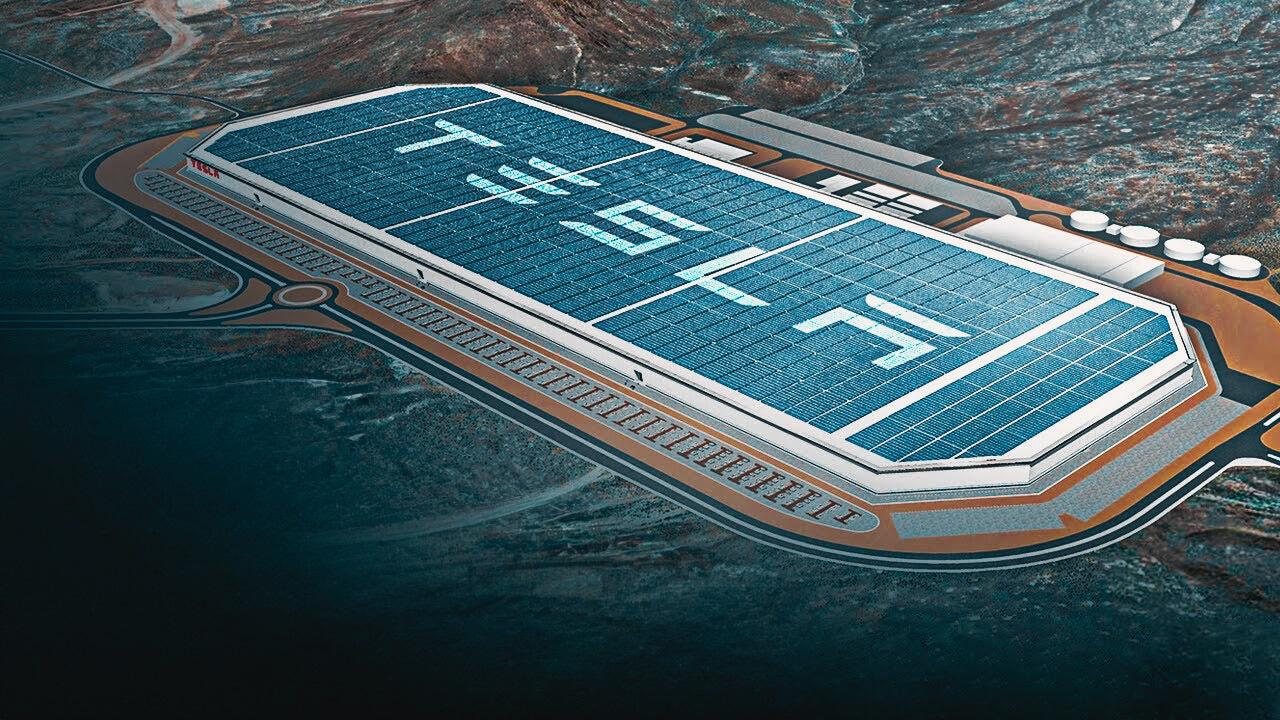
A U S T I N S N A P S H O T 52MILES


PRE-PRODUCTION JULY 2023 SERIAL PRODUCTION NOVEMBER 2023


A U S T I N S N A P S H O T &


A U S T I N S N A P S H O T


NUE A U S T I N S N A P S H O T
CONTRIBUTES A MINIMUM OF
IN GSP
N D U S T R Y
CYBERSECURITY INDUSTRY EMPLOYS 130,000 TEXANS AND
$35.5 BILLION
I


A U S T I N S N A P S H O T


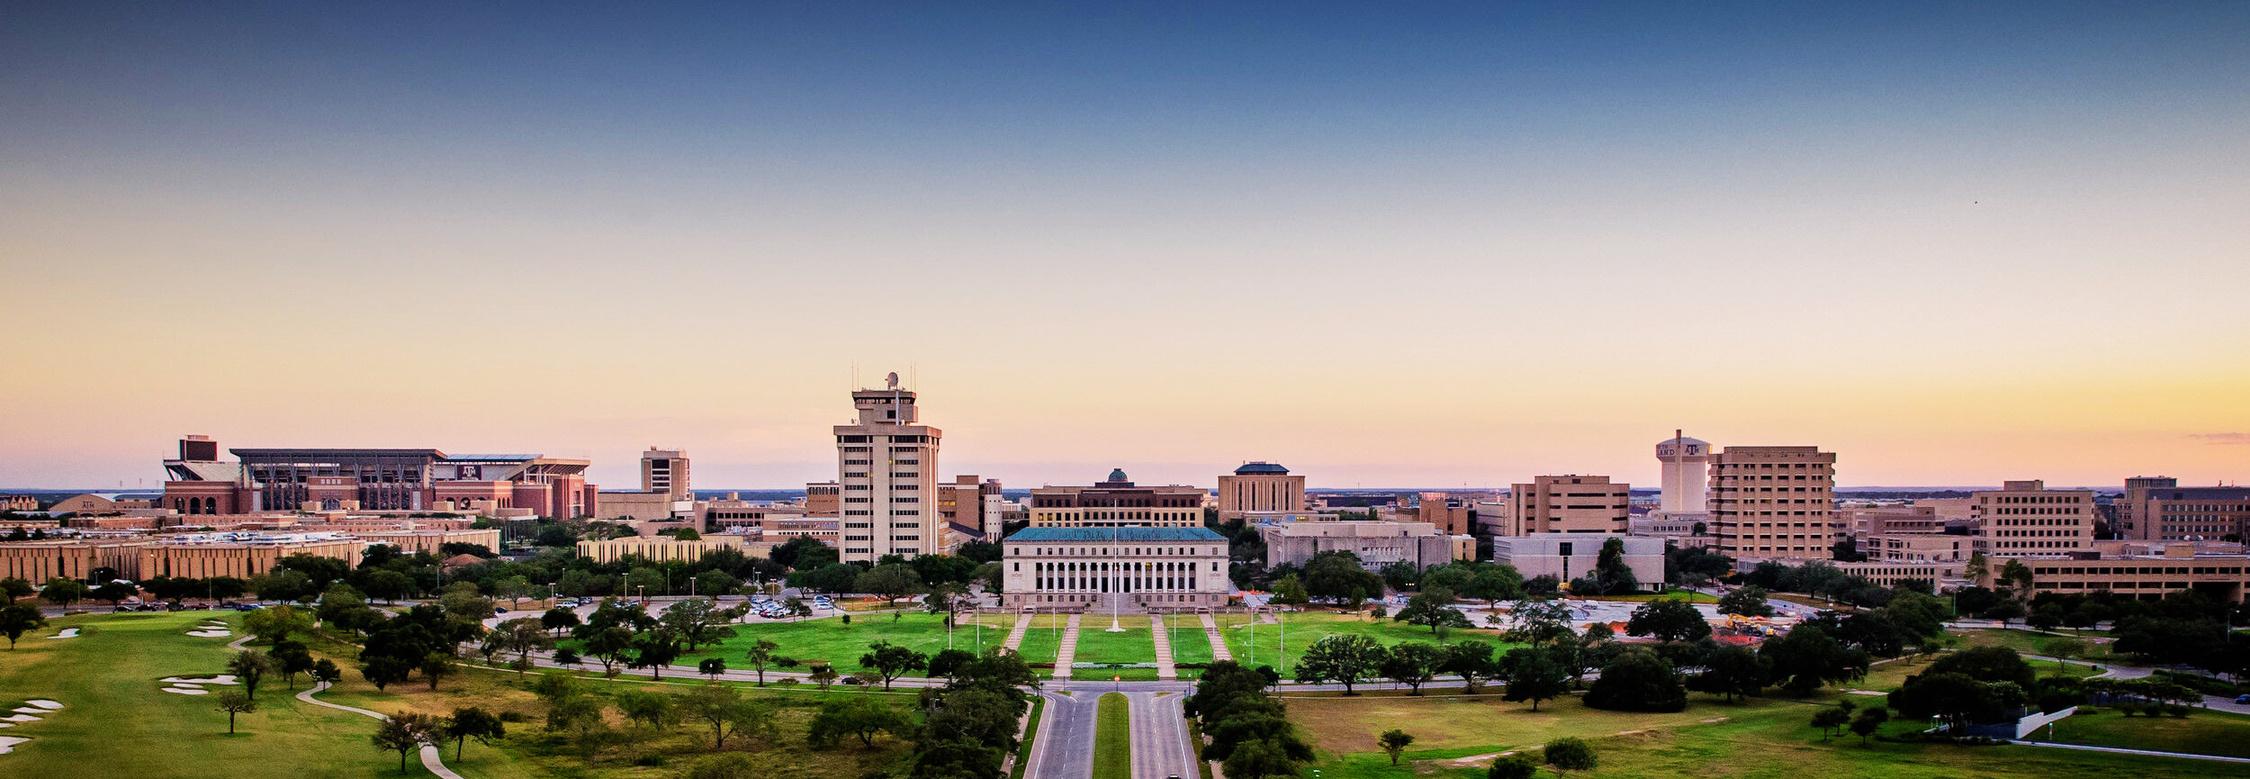
1.6M STUDENTS

THE UNIVERSITY OF TEXAS BAYLOR UNIVERSITY
TEXAS TECH UNIVERSITY
TEXAS A&M
UNIVERSITY OF HOUSTON RICE UNIVERSITY
TEXAS CHRISTIAN UNIVERSITY
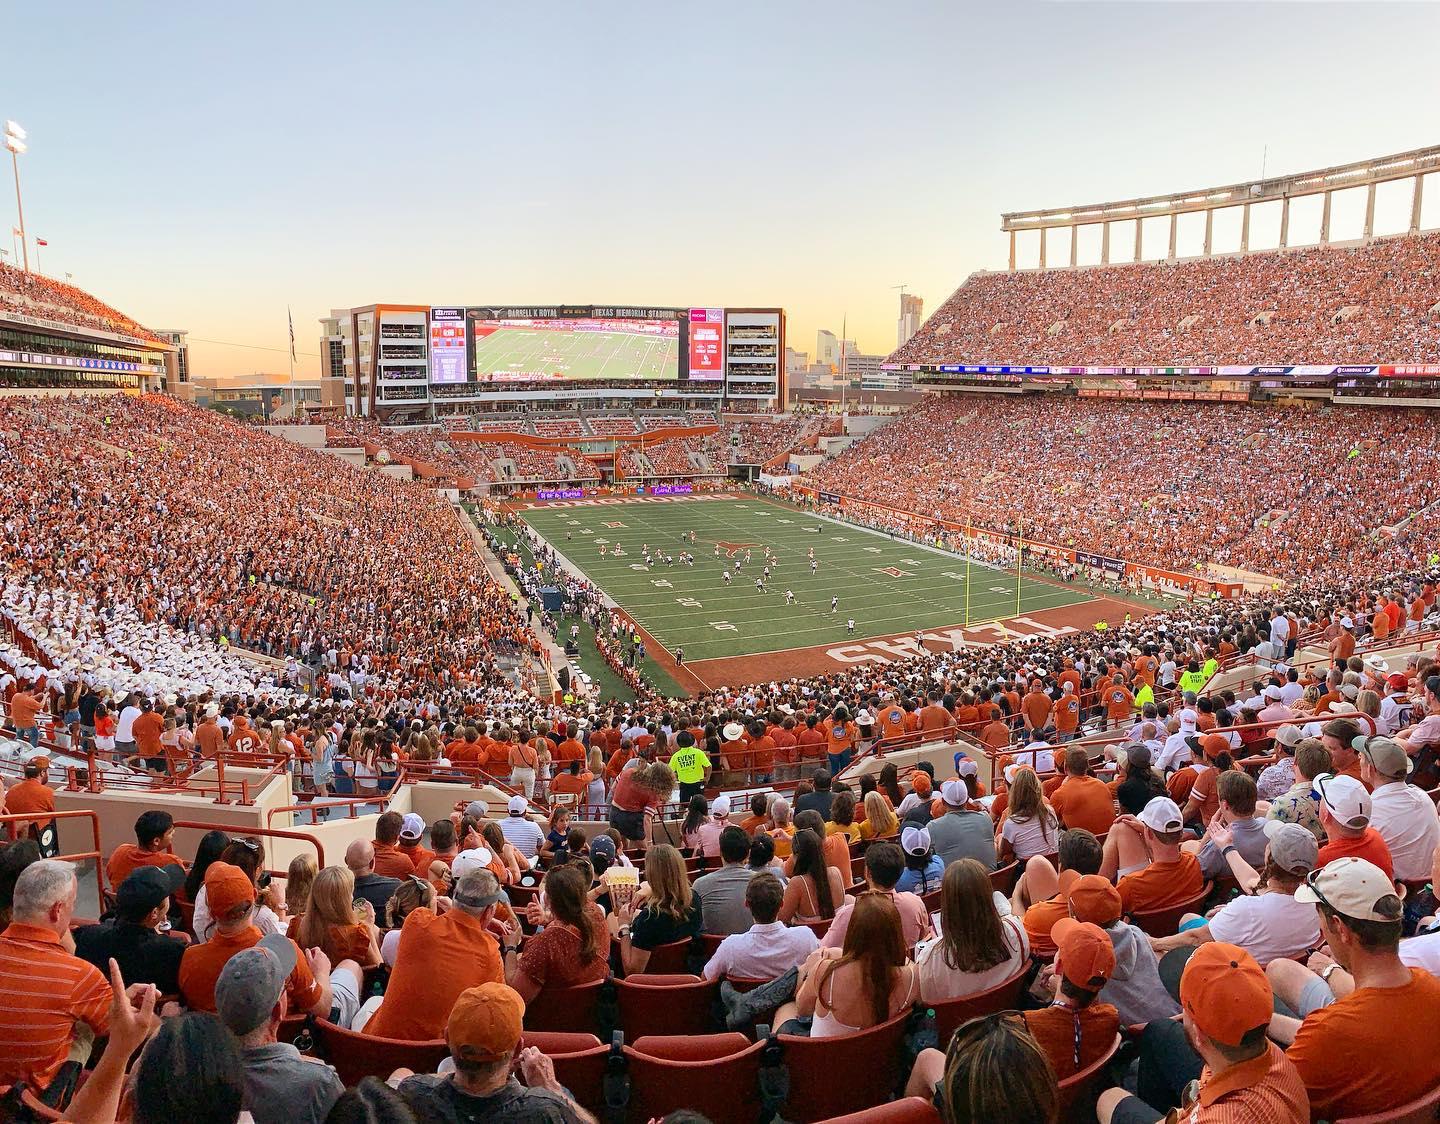
TEXAS FOOTBALL


A U S T I N


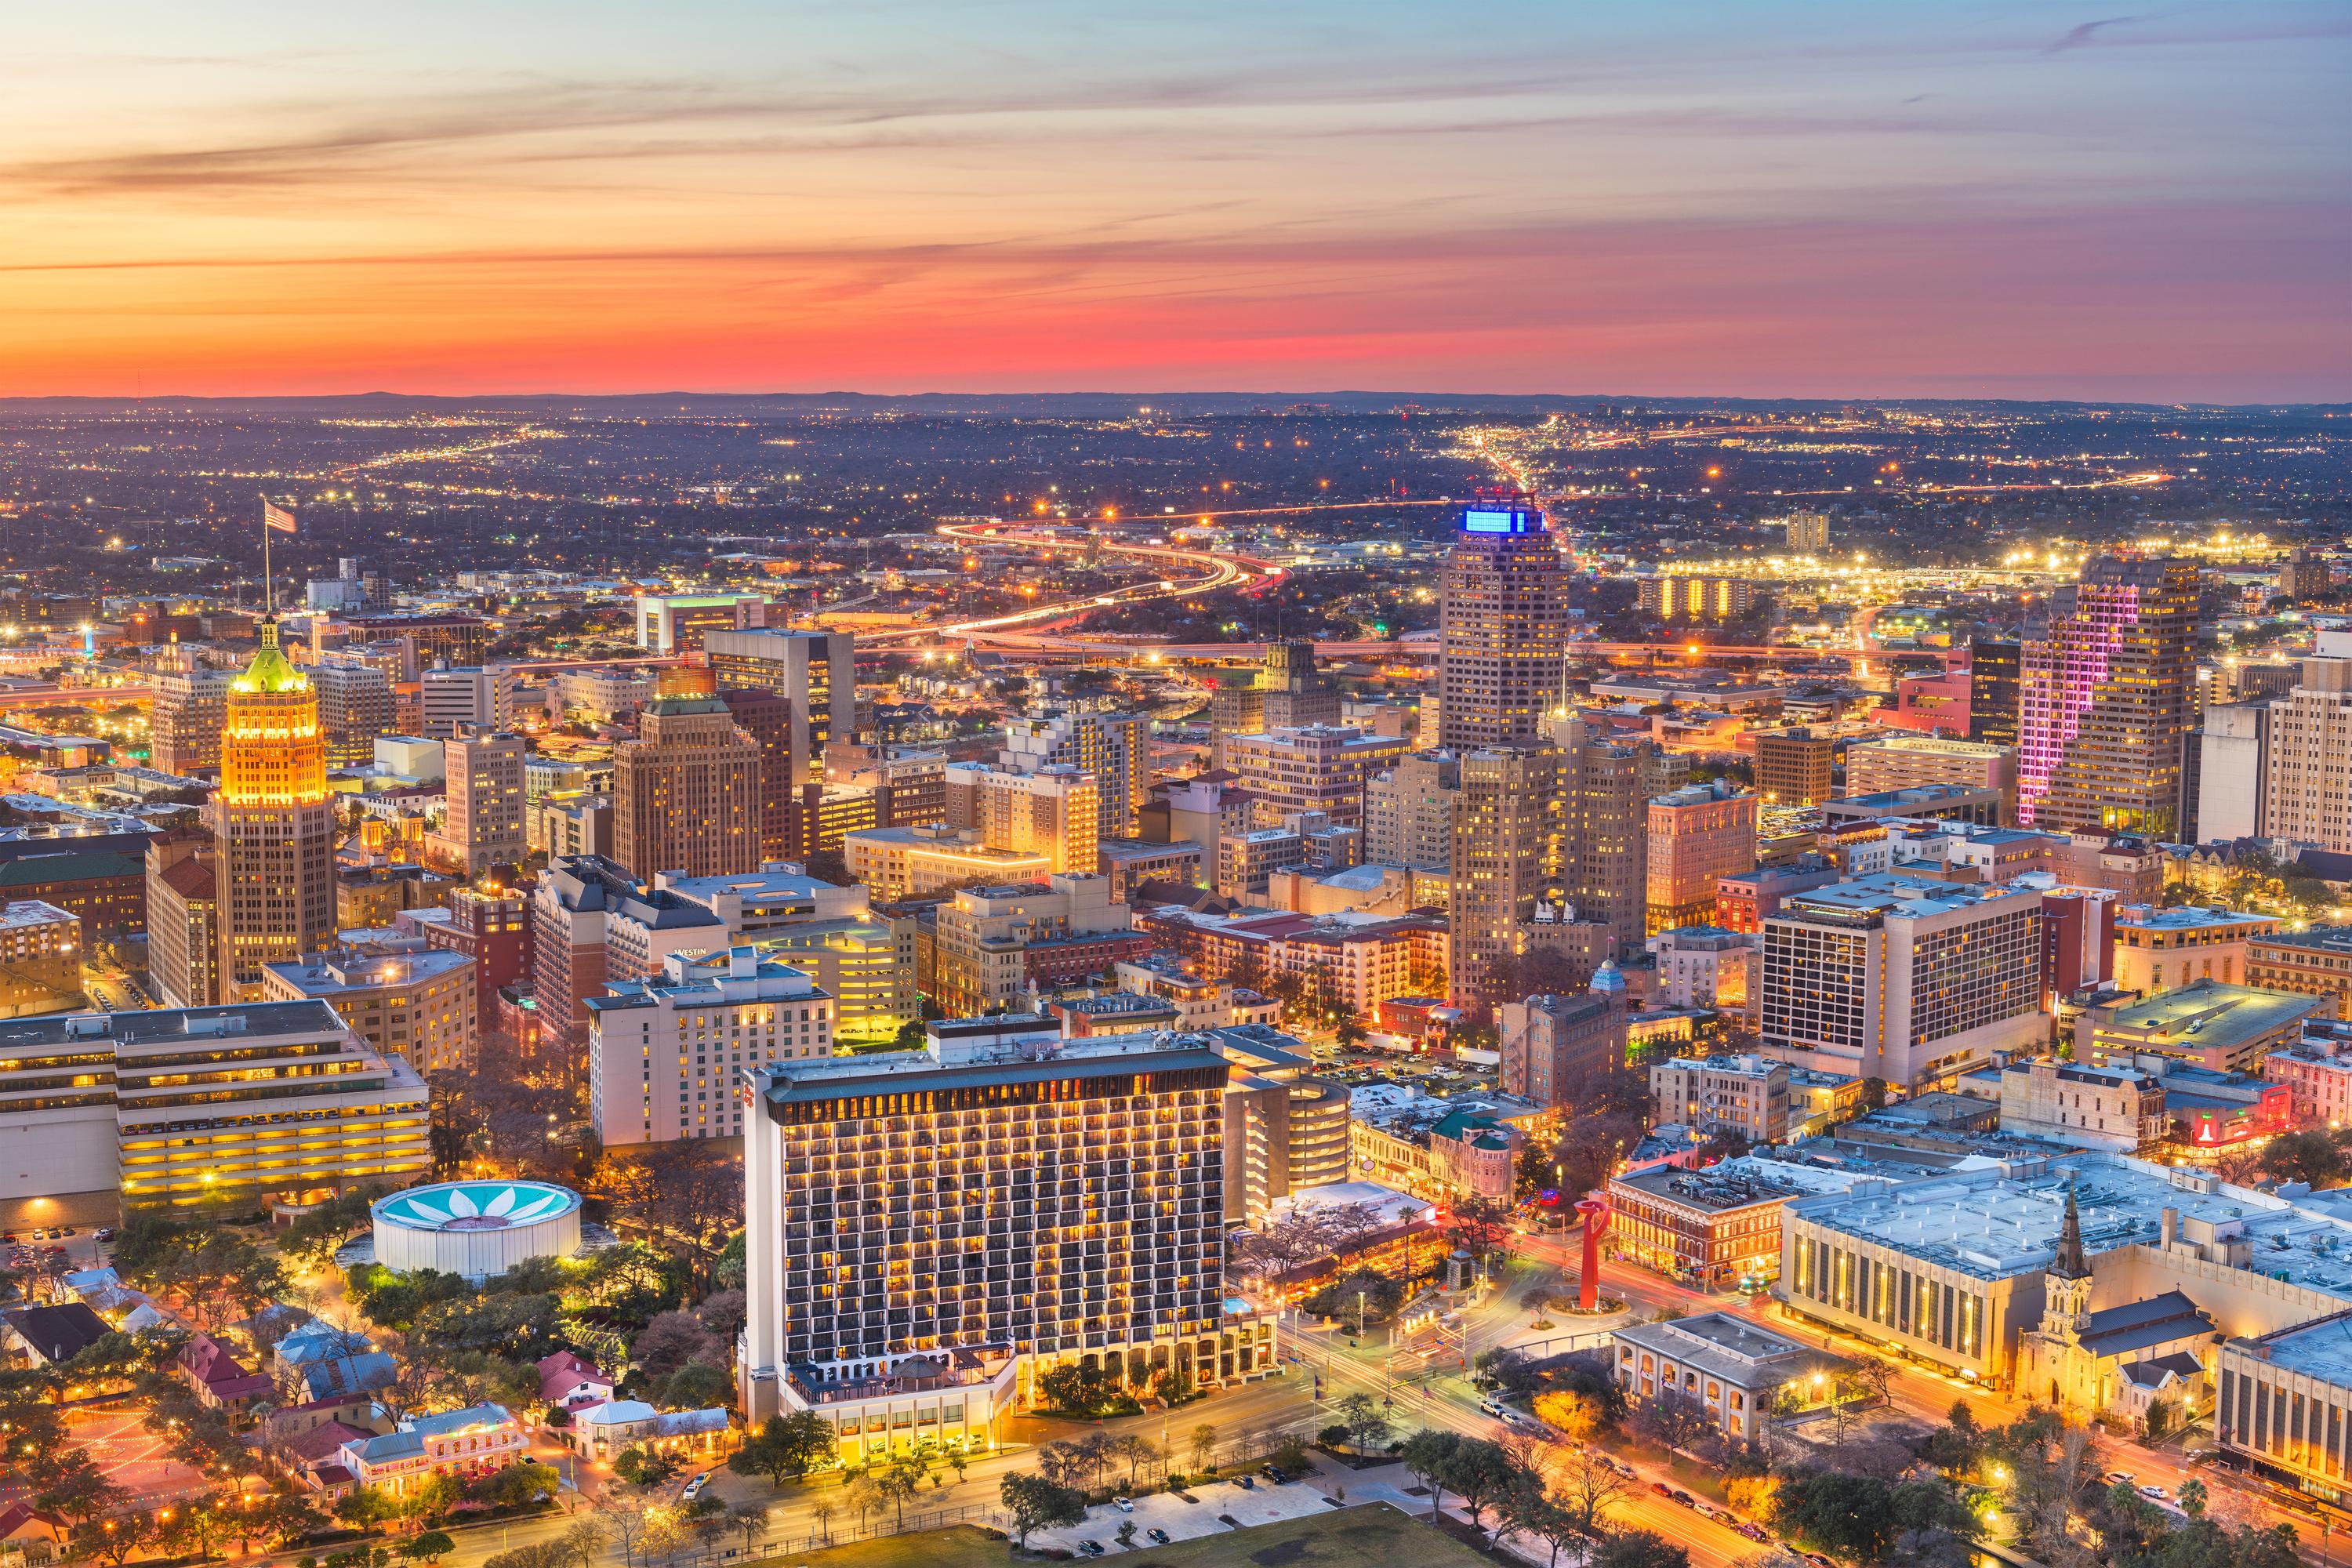
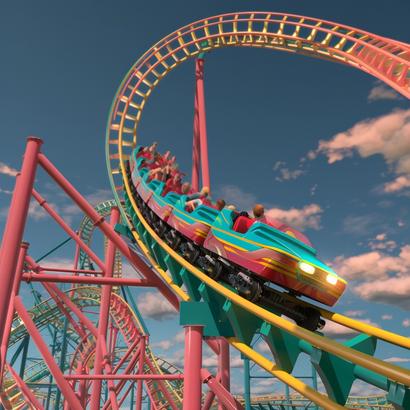
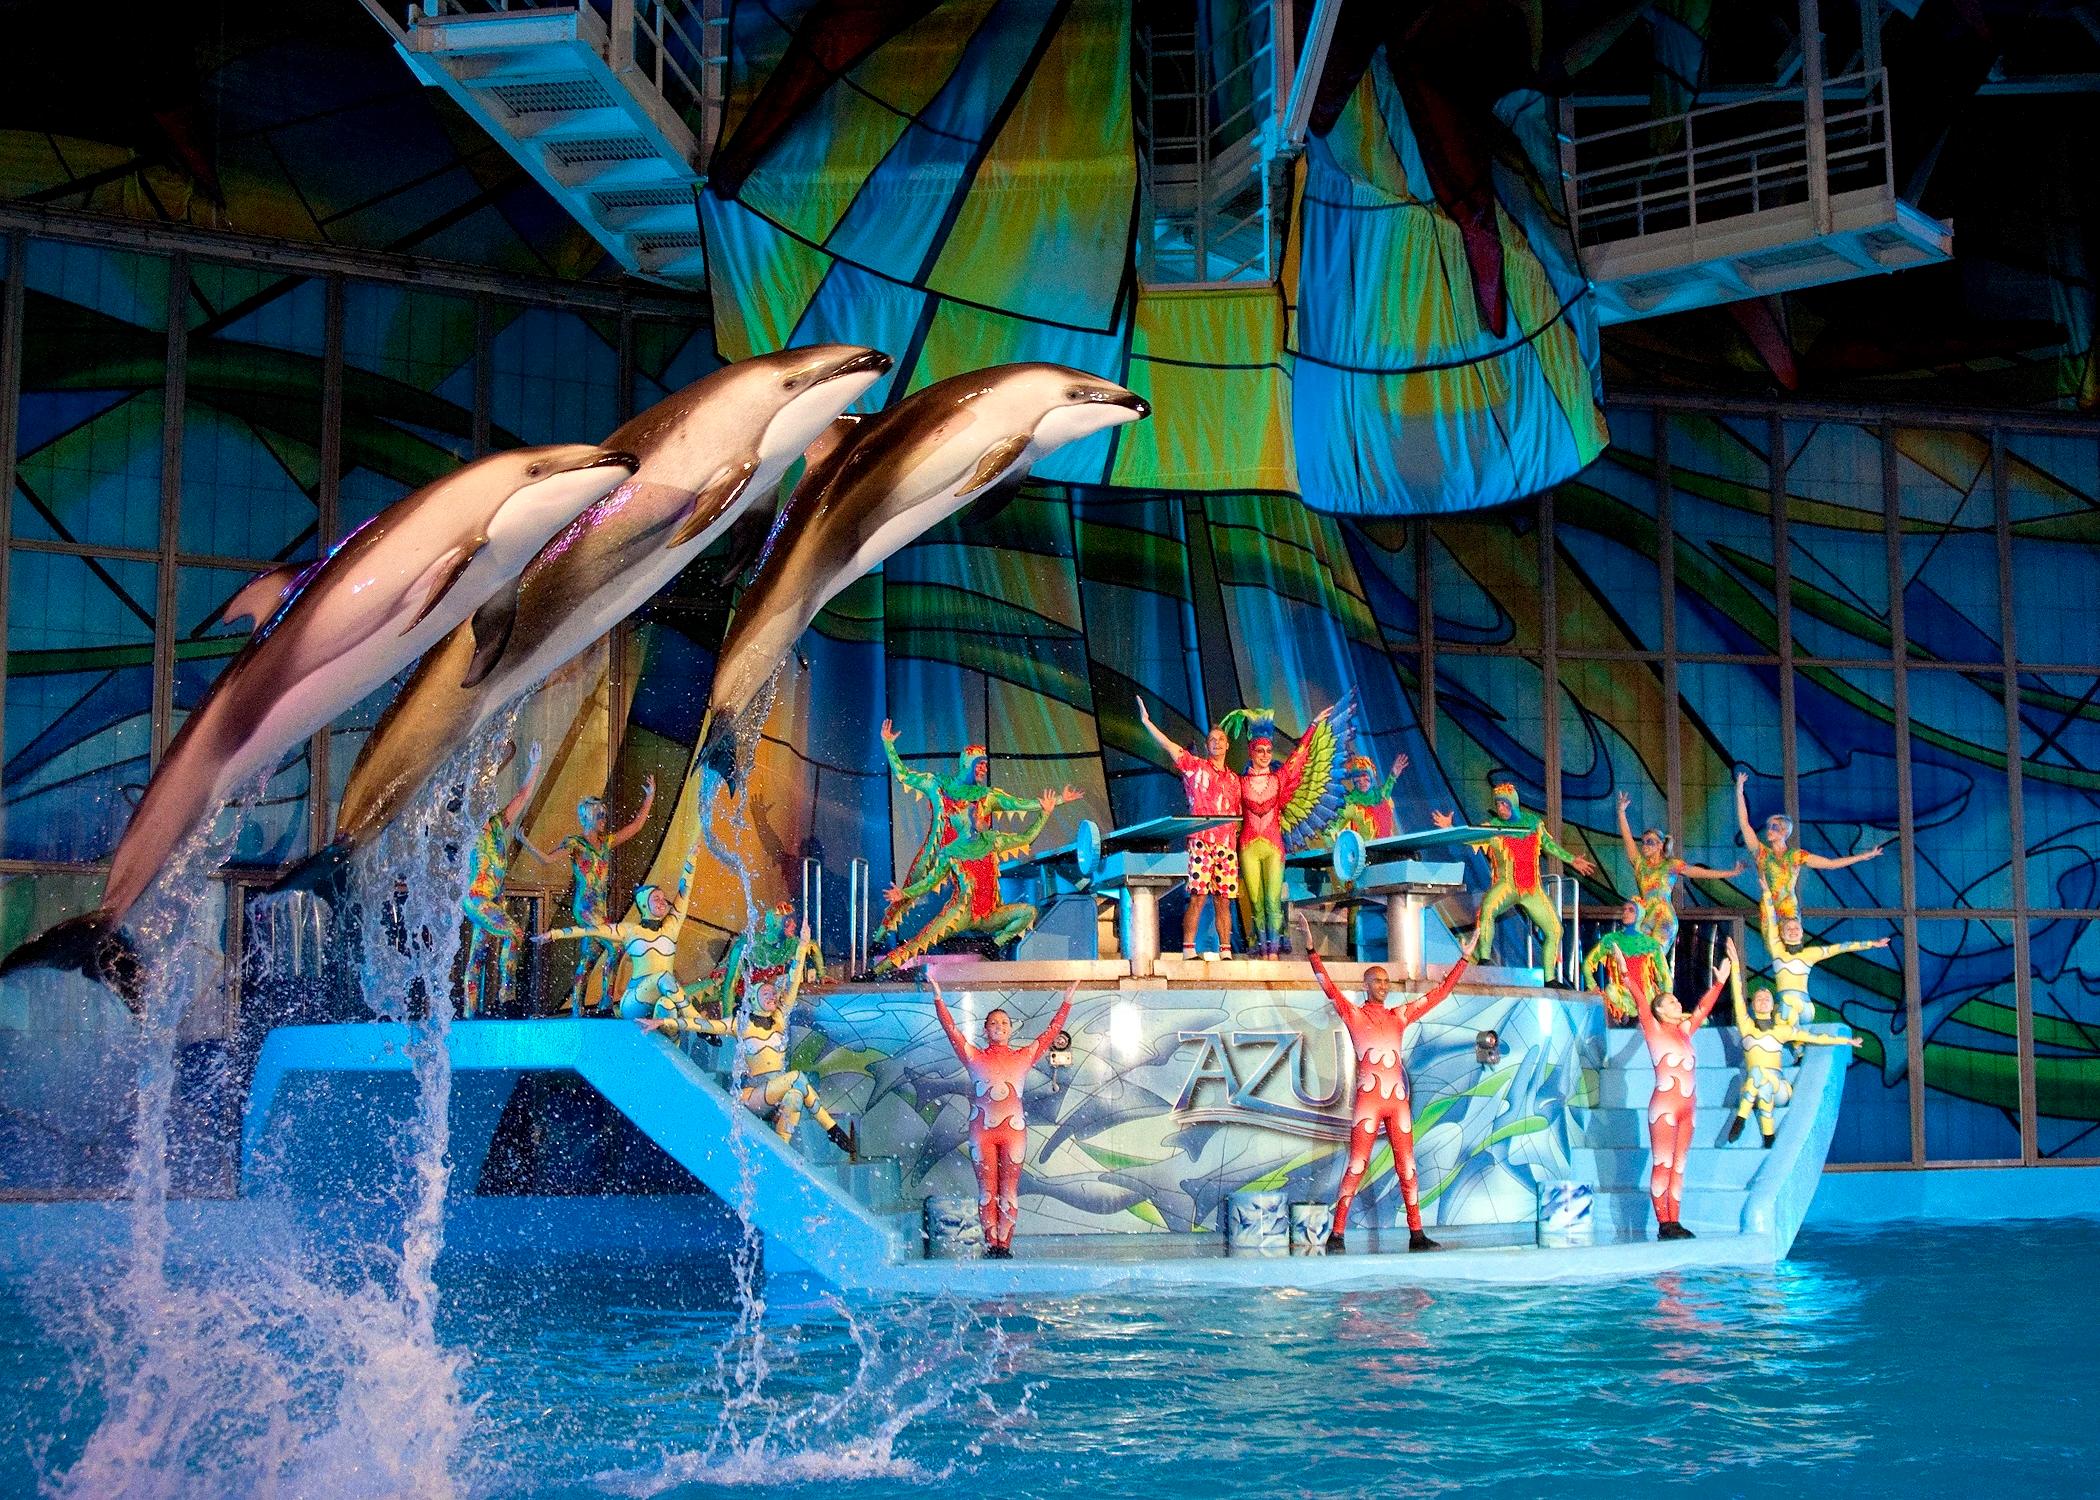
#1 #7 Top 5 Theme Park Location #1 Best Vacation Spot in the US - Travel and Lesiure 2023 Seventh Largest City in the US


S A N A N T O N I O W O R K F O R C E SAN ANTONIO


10% GROWTH YOY
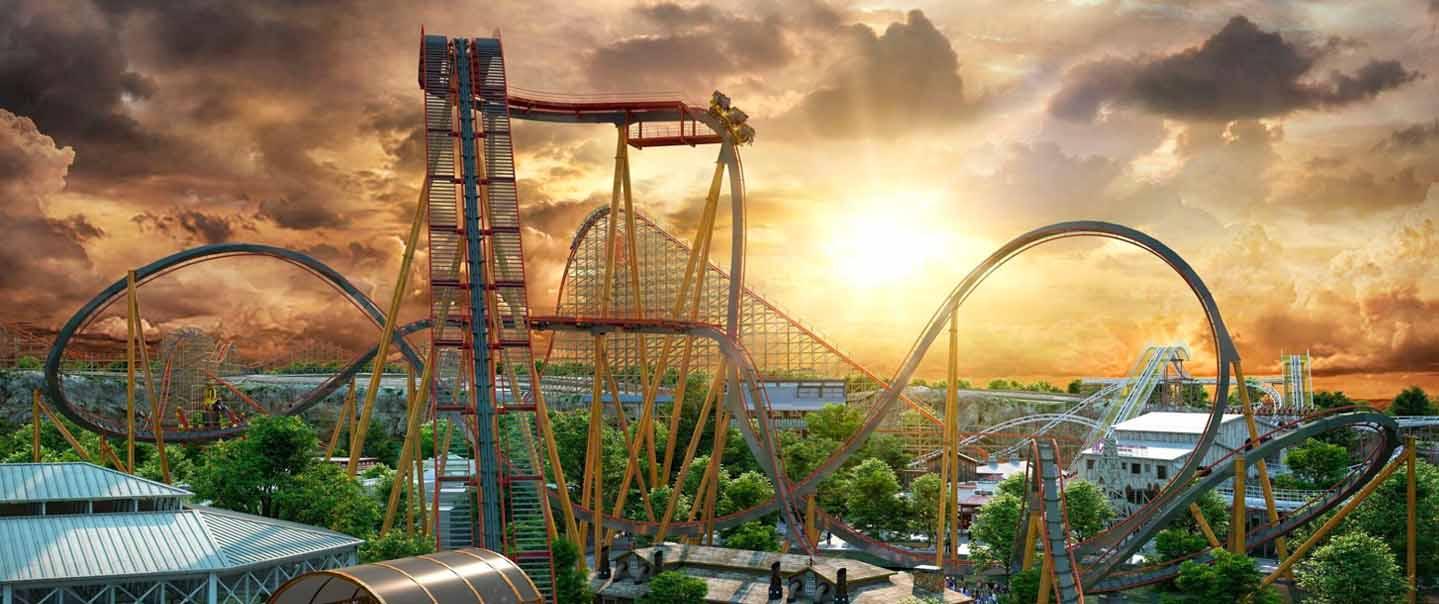


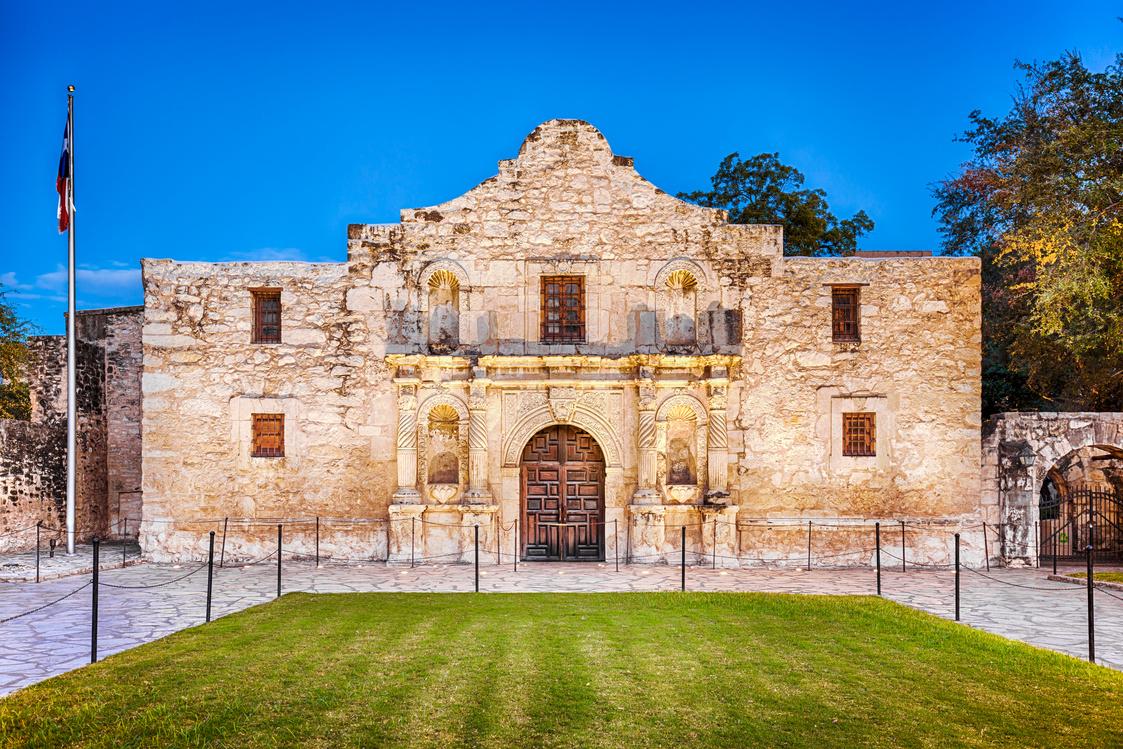

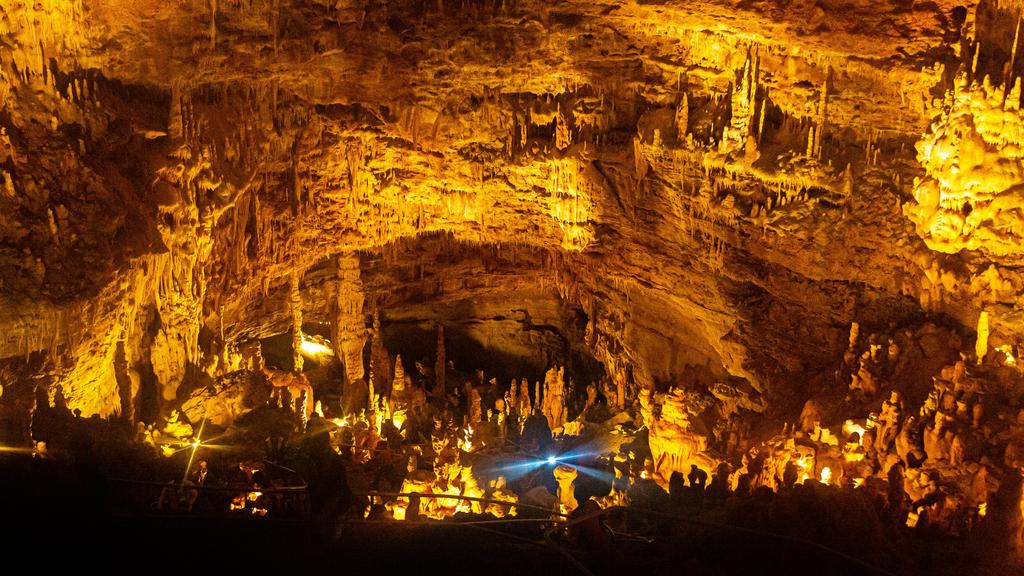

A T T R A C T I O N S T O U R I S M
ATTRACTIONS & TOUR


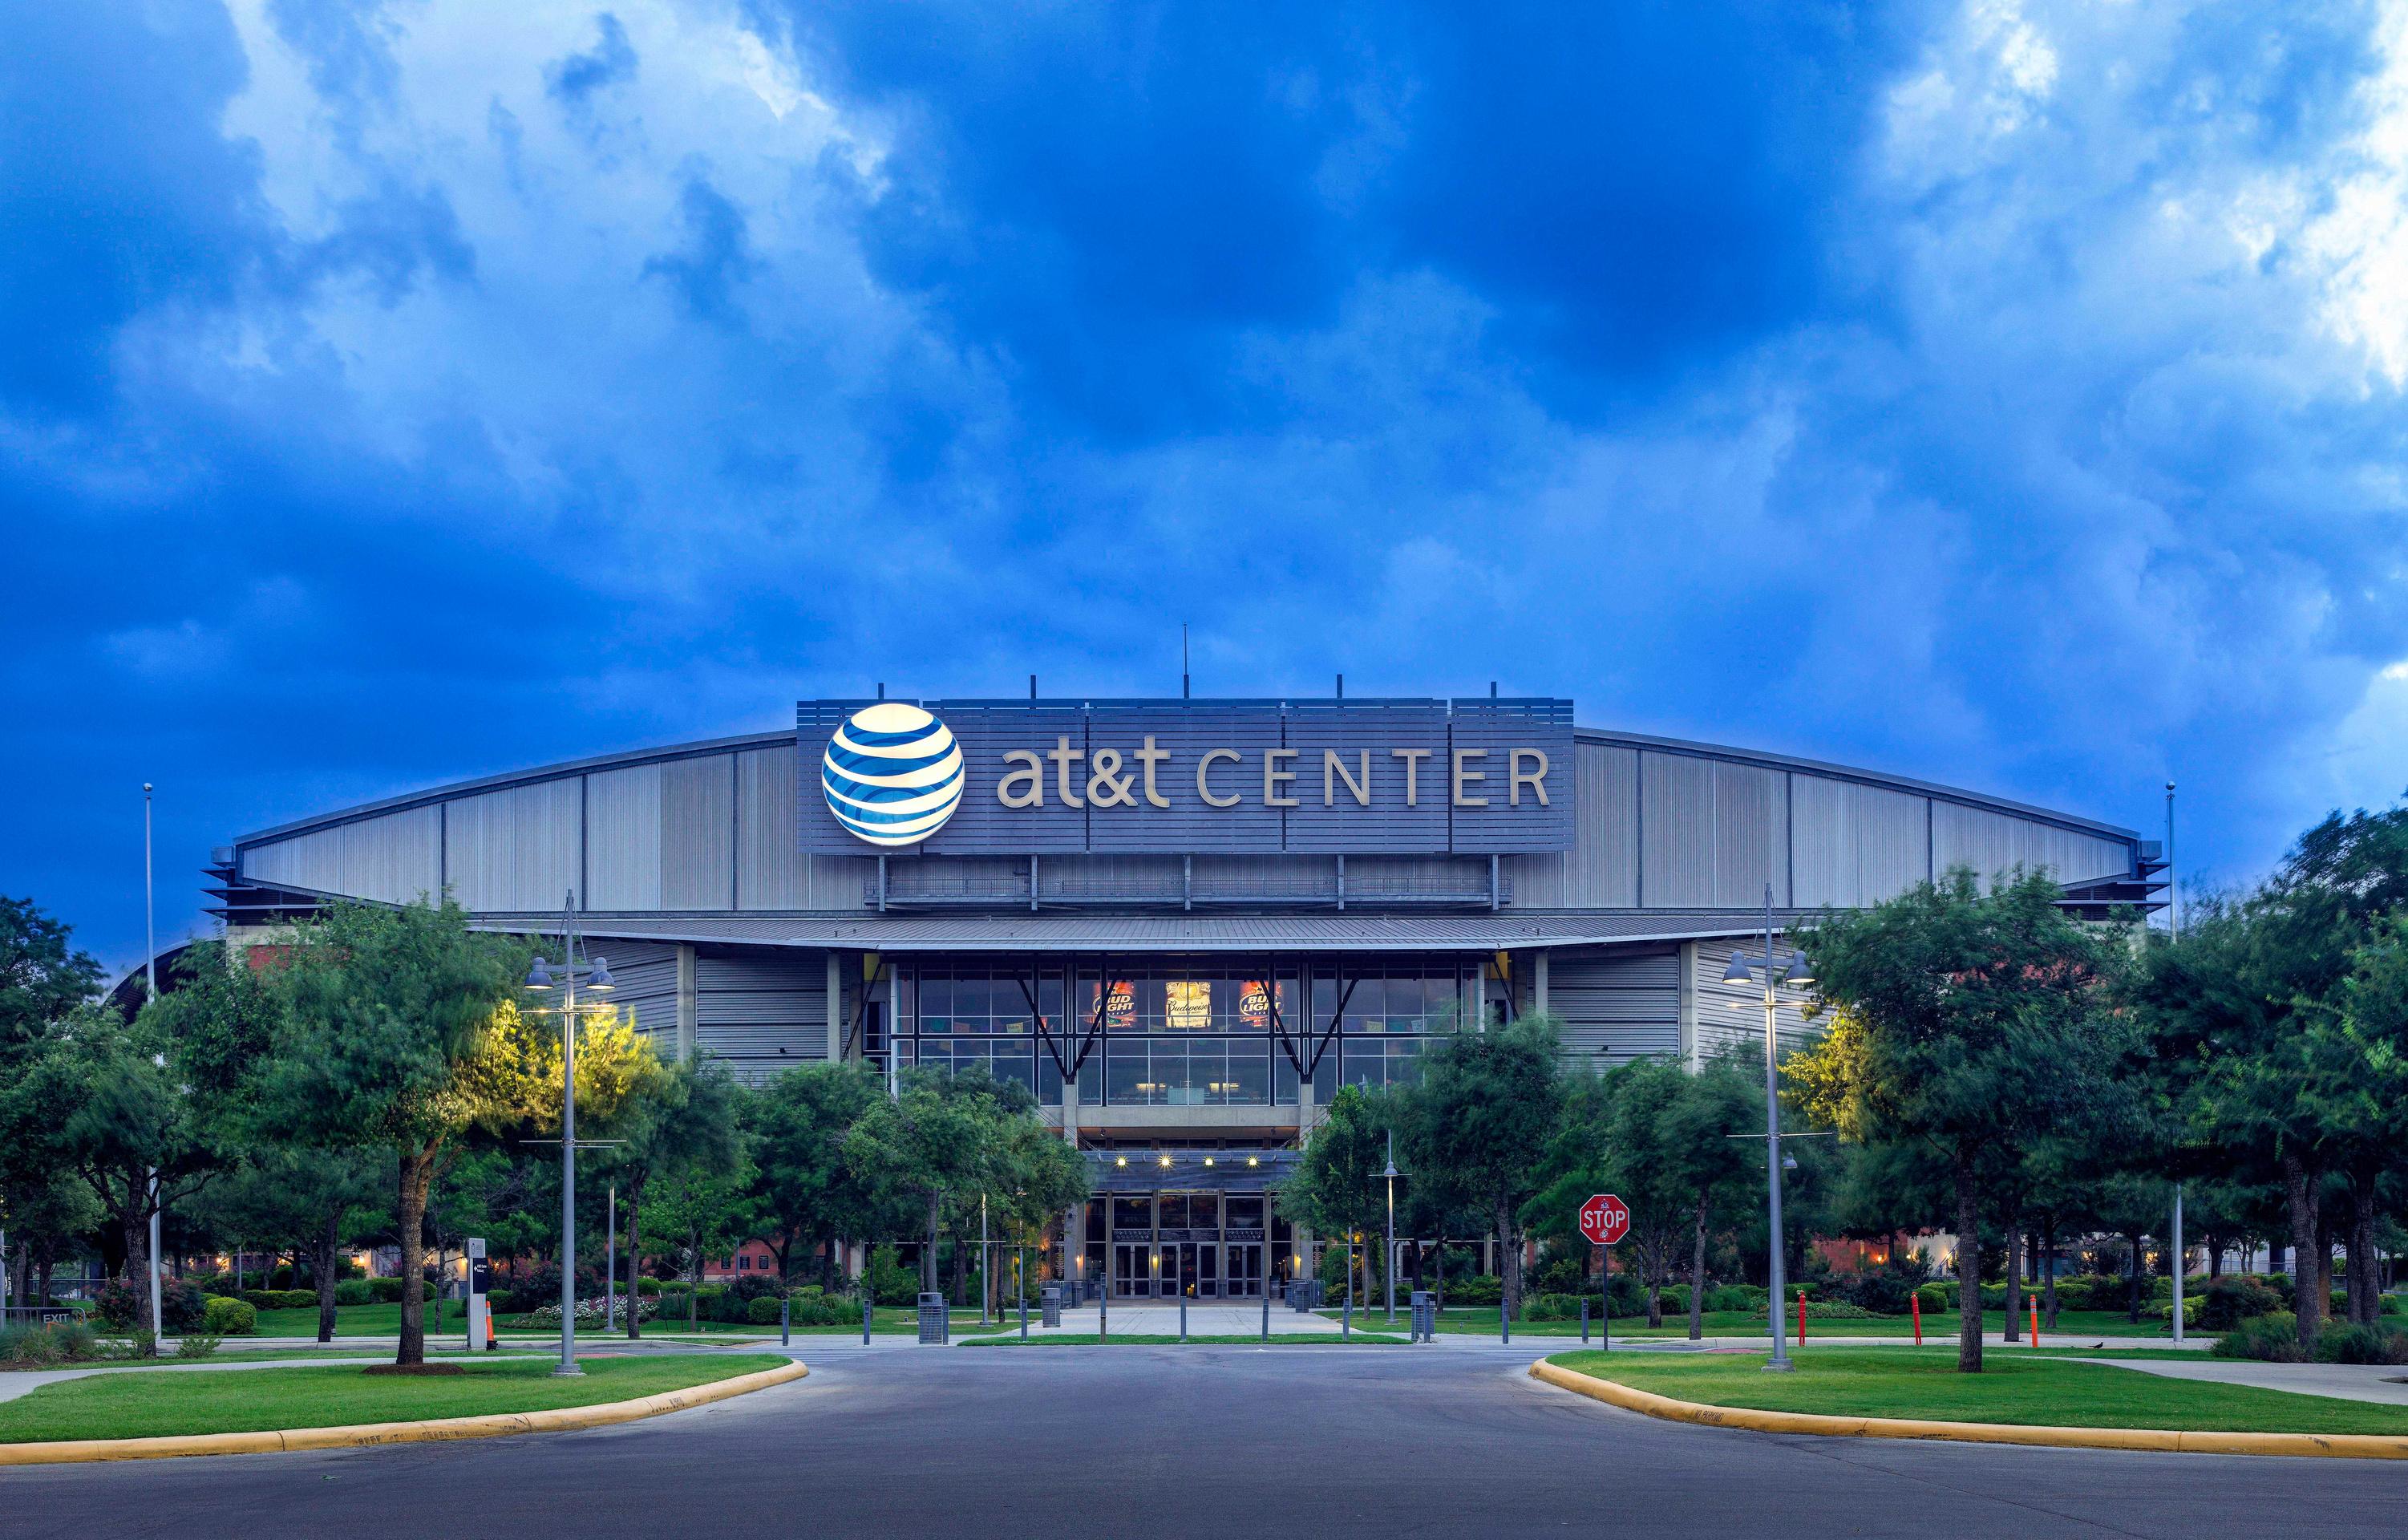
S A N A N T O N I O


2.3M GUESTS IN 2023
S A N A N T O N I O


CONTACT US invest@vikingcapllc.com vikingcapitalinvestments.com text ‘SUNDANCE‘ 826-205-0259 P R E M I E R A P A R T M E N T H O M E S

PORTFOLIO PERFORMANCEand


OUR TRACK RECORD
In Assets Acquired Units under Management Average LP AAR million 26 Properties Acquired
5,406 24%
$830
ABOUT VIKING CAPITAL

Viking Capital was founded in 2015 and has become a premier multifamily investment firm with agile investment sourcing, structuring, execution, and asset management capabilities and the flexibility to scale and cater to investor preferences.
Through its team of acquisitions, asset management, and disposition experts, Viking Capital invests in tier 1, secondary and tertiary markets across the United States.

EXECUTIVE TEAM

VikramRaya CEO,Co-Founder

ChrisParrinello Directorof InvestorRelations

RaviGupta COO,Co-Founder

NathanLoy Directorof Acquisitions
JudahFuld VPofAcquisitions

AmirNassar InvestorRelations Manager
EdMonarchik Directorof AssetManagement

AmberButler Investor Concierge

AshleyPenrod DirectorofMarketing

ChariteeBoyd AssetManagement Analyst


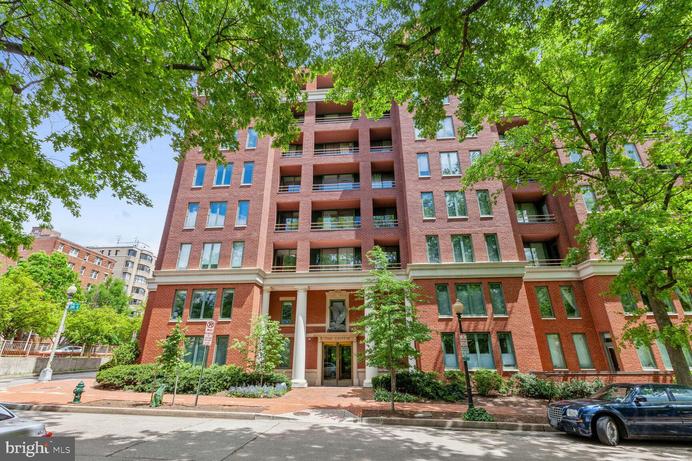
Sold/Current Market Units Purchase Price C U R R E NT & P R E VI O U S P R O J E C T S Sold 2018 Sold 2018 Sold 2018 Sold 2019 Sold 2019 Sold 2021 Sold 2021 Sold 2022 Sold 2022 Sold 2022 Current Current Current Current Current Current Current Current Current Current Current Current Current Current Current Atlanta Atlanta Atlanta Atlanta Atlanta Atlanta Tyler, TX Austin Dallas Dallas Dallas Atlanta Atlanta Washington DC Atlanta Atlanta Indiana Atlanta San Antonio Houston Atlanta Atlanta Atlanta South Bend Atlanta Atlanta 242 188 152 118 62 266 90 284 304 415 350 16 192 49 368 222 400 181 210 192 120 167 252 188 188 188 $22350,000 $17,782494 $15317506 $7,600,000 $5900,000 $35,000,000 $7000000 $36,300000 $41,000,000 $61,750000 $31,350,000 $6,700,000 $25,800,000 $19300,000 $55,000,000 $41,000,000 $76,000,000 $37,000,000 $26,000,000 $34 ,000,000 $19,600,000 $39,250,000 $57250,000 $33250,000 $28200,000 $52,000,000 TOTAL 5,406 $837,460,000 Dawson Forest Pending 26


Elevate at Huebner Grove 210 $26,000,000 Fund Asset Mar-22 Elevate at the Pointe 181 $37,000,000 $11,500,000 Dec-21 Elevate on Main 400 $76,000,000 $20,700,000 Sept-21 Elevate Twenty-Three 222 $41,000,000 $11,000,000 Jun-21 Marbella Place 368 $52,700,000 $19,110,000 Jan-21 The Griffin 49 $19,300,000 $7,716,000 Jul-20 Veritas at East Cobb 192 $25,800,000 $11,250,000 Dec-19
CURRENTASSETSUNDERMANAGEMENT
The Hills at East Cobb 3 Years 268 10%* Reserve at Walnut Creek 3 Years 284 35% Estates at Las Colina's 3 Years 415 24% The Avery 4.5 Years 304 20% Total 2,033 Avg. 24%
EXITS & PERFORMANCE

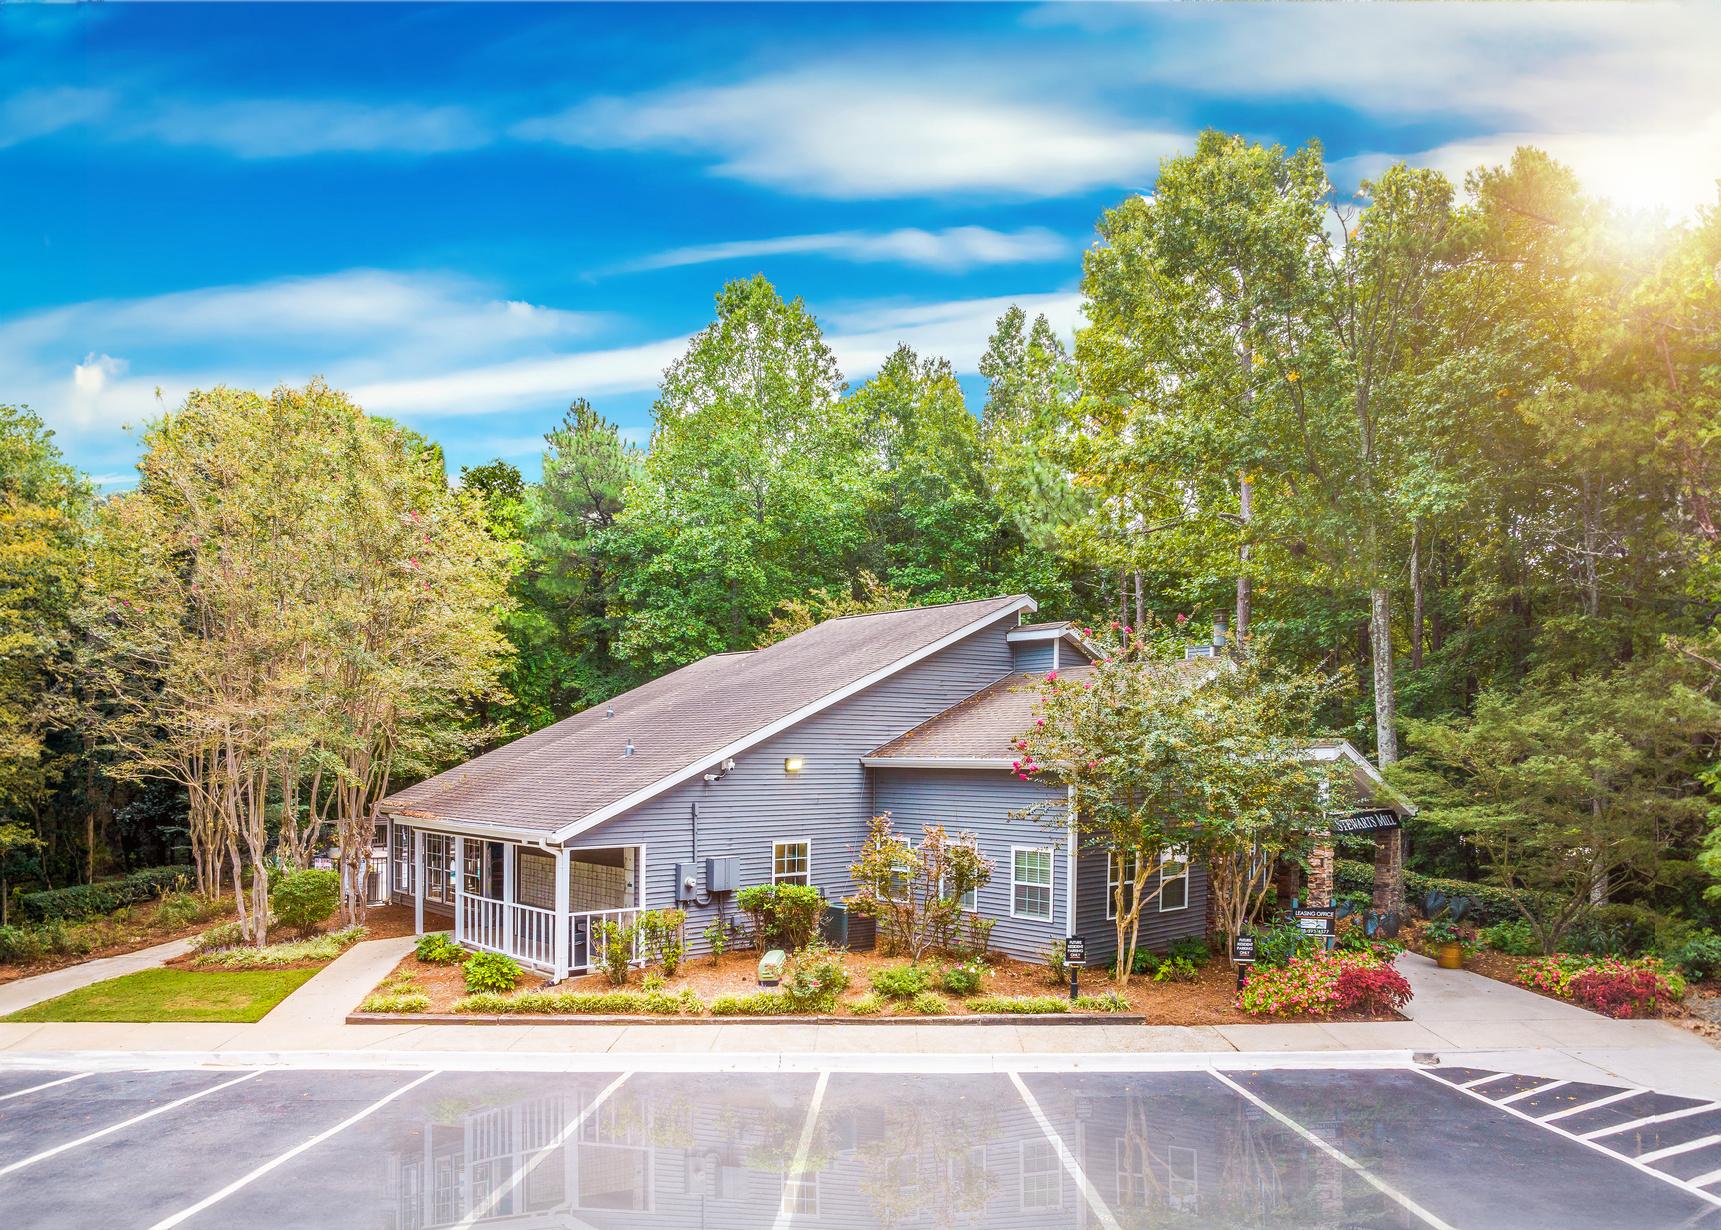


STEWART’S MILL 1988 188 $28.2M AssetClass YearConstructed No ofUnits PurchasePric B AtlantaMSA, AssetCass YearConstructed No ofUnts PurchasePrce SouthBend,IN 2018 $33.25M B+ 188 PARK 33 AssetCass YearConstructed No ofUnts PurchasePrce Atlanta,GA 2006 $39.25M B+ 176 ELEVATEEAGLESLANDING AssetClass YearConstructed No ofUnits PurchasePrice Atlanta, 2005 $57.25M B 252 ELEVATE GREENE AssetCass YearConstructed No ofUnits PurchasePrce Smyrna,GA 1986 $41.1M B 222 ELEVATE TWENTY-THREE AssetCass YearConstructed No ofUnits PurchasePrce Marietta,GA 1980 $25.8M B 192 VERITAS AS EAST COBB AssetCass YearConstructed No o Units PurchasePrice Stockbridge,GA 1999 $52.7M B+ 368 MARBELLA PLACE


1986 120 $19.6M AssetClass YearConstructed No ofUnits PurchasePrice B Atlanta,GA ELEVATE WOODSTOCK AssetCass YearConstructed No ofUnts PurchasePrce Houston,TX 2007 $34M A 192 KINGS COVE AssetClass YearConstructed No o Units PurchasePrice SanAntonioTX 1981 $26M B 210 ELEVATE HUEBNER GROVE AssetCass YearConstructed No ofUnts PurchasePrce Atlanta,GA 1969 $37M B 181 ELEVATE AT THE POINTE AssetCass YearConstructed No ofUnts PurchasePrce SouthbendIN 2000 $76M B+ 400 ELEVATE ON MAIN AssetCass YearConstructed No ofUnts PurchasePrce Washington,DC 2010 $19.3M A 49 THE GRIFFIN
