

Q2 | 2023 New York City
Update 160CentralParkSouthPH4001.com
Market
Vannessa Kaufman RE Featured listing
480 Park Avenue 9C
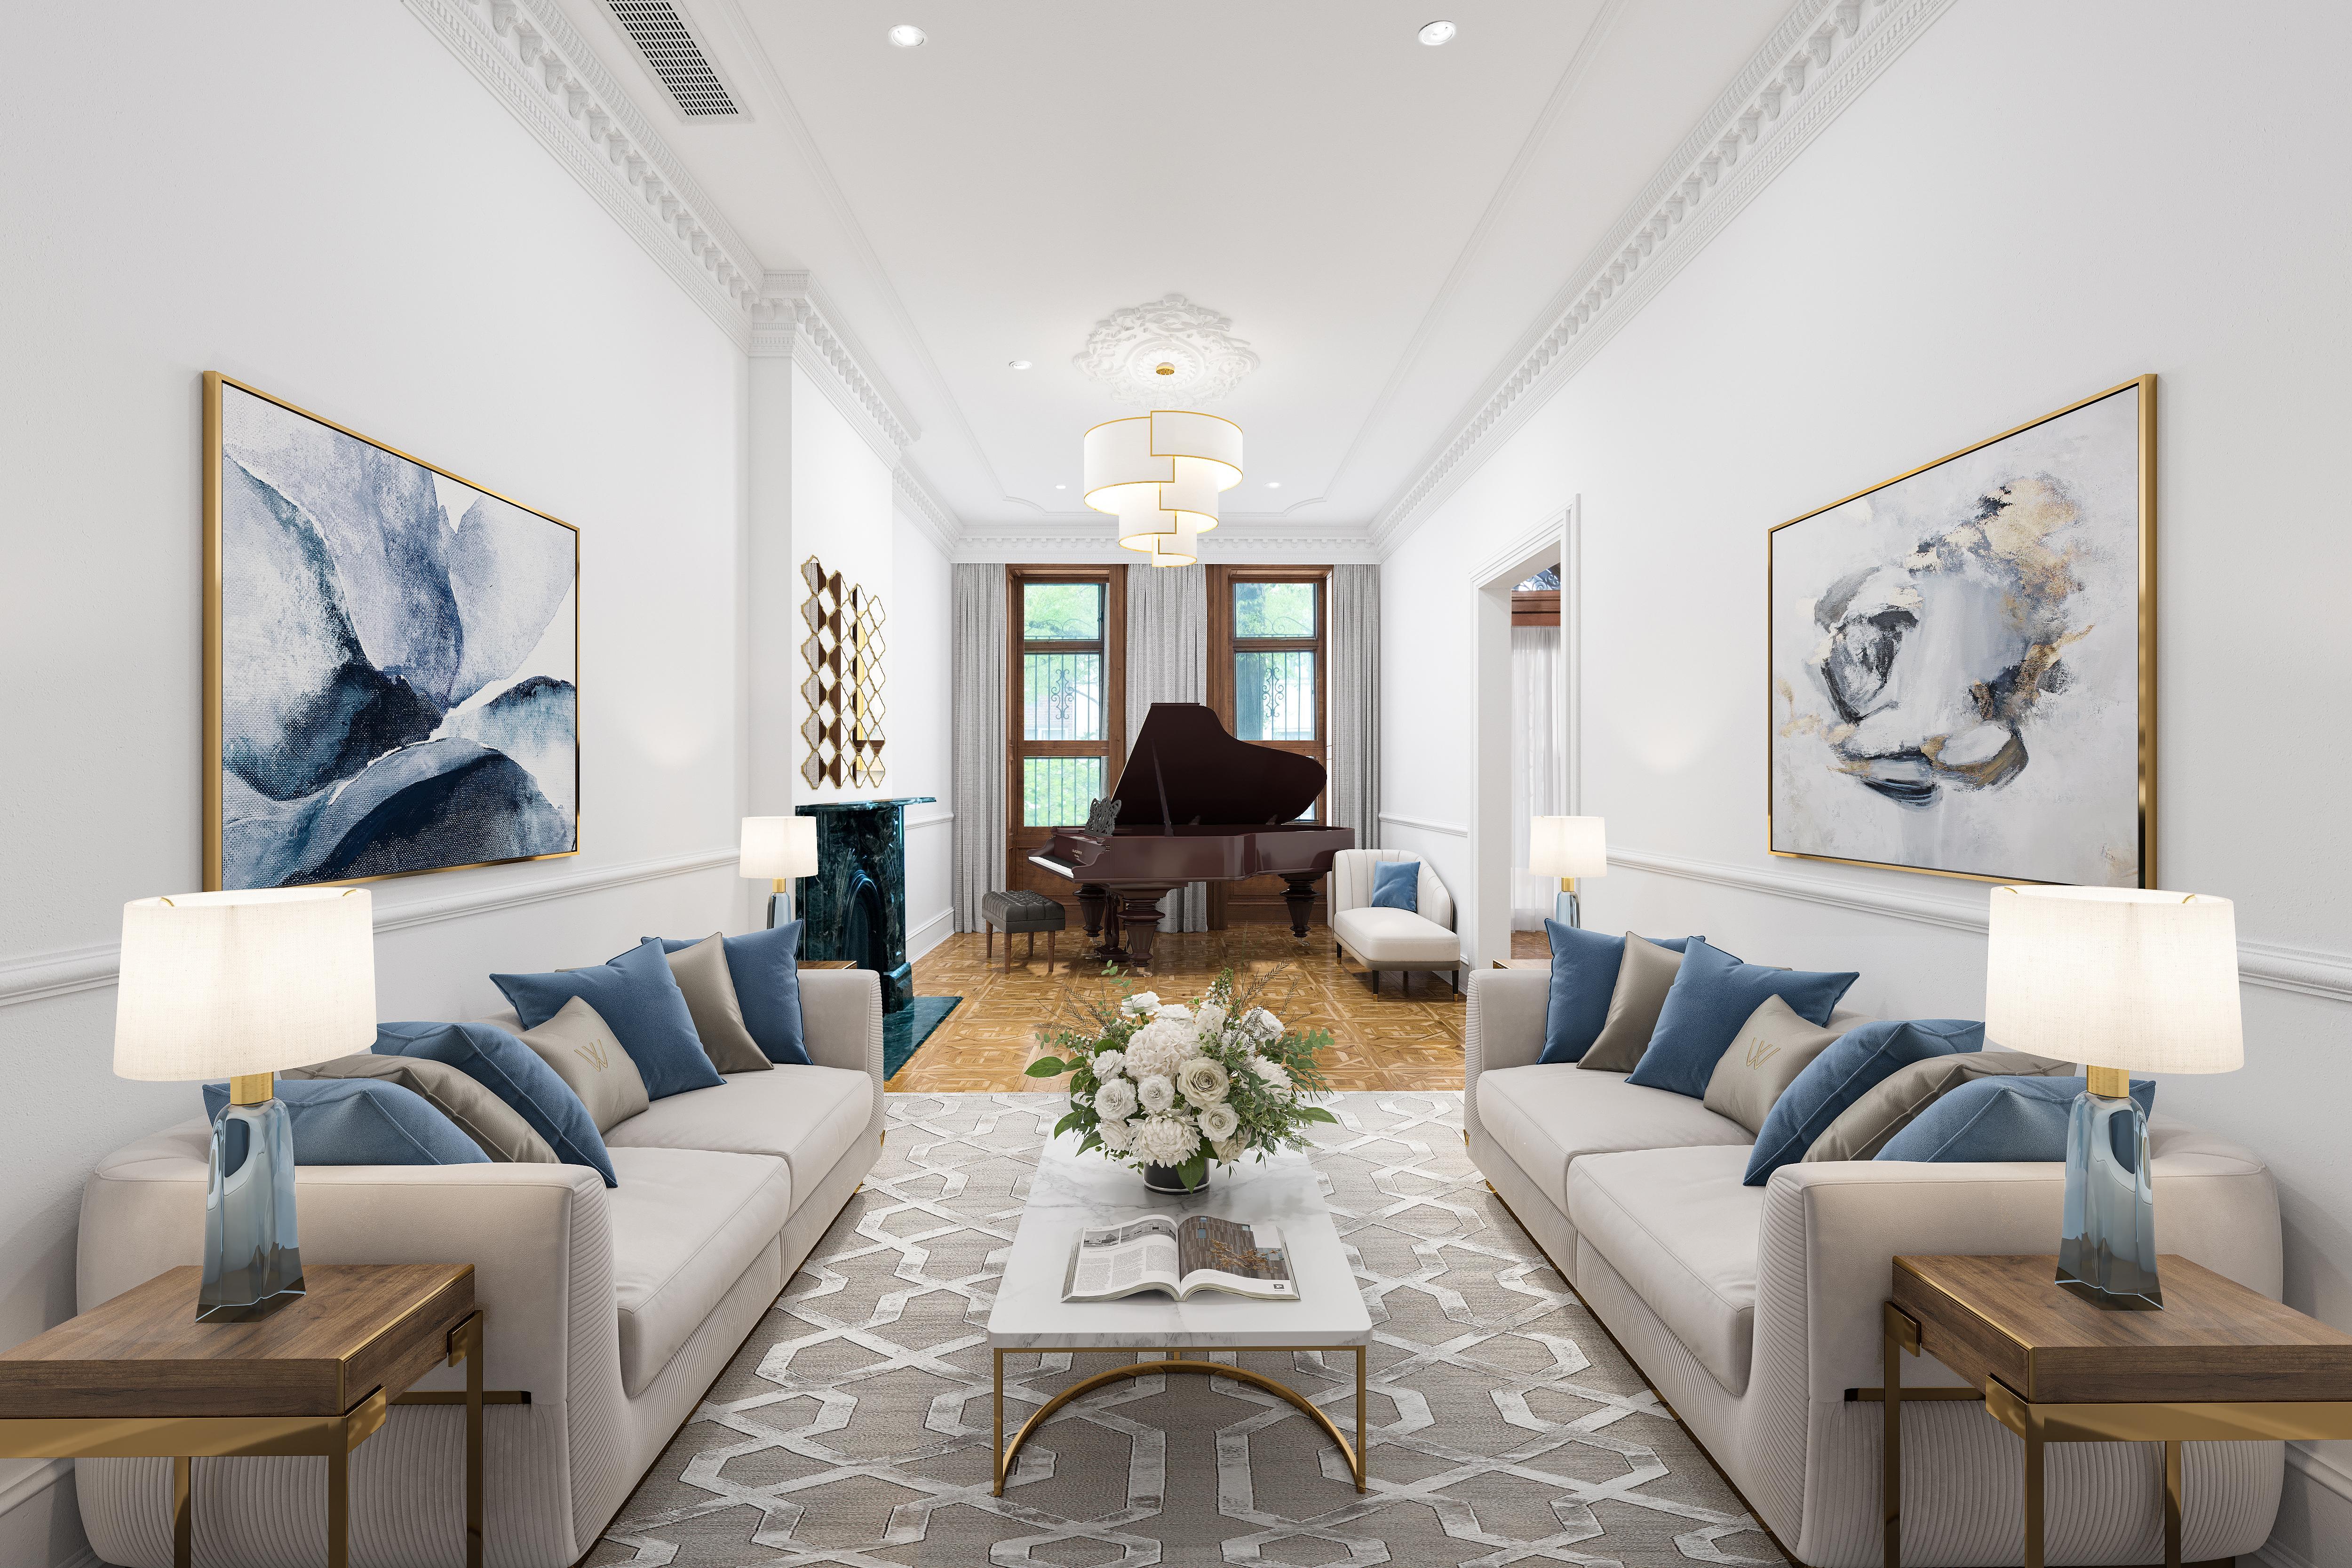
NewYork,NY
Welcometo9Cat480ParkAvenue.ThisturnkeyhomemeetseverystandardofaclassicParkAvenue apartment.Thehomeoffers3bedroomsand3fullbaths.
Nodetailwasoverlookedfromtheherringbonehardwoodfloorstothebespokecarvedbookshelvesand doubledoorsleadingtotheoversizedpublicrooms,creatingatimelessdesignthroughout.Thediningroom sitsinthecenterofthehomeconnectingalloftherooms.Oneithersideofthediningroomaretheliving roomandlibrary.Botharespaciouseachofferingawoodburningfireplace.Thewallpaneledboiserieof naturalwood,inthelibrary,exudesstyleandmodernityallatonce.
ThekitchenwasfinishedwithchicFrenchlimestonefloors,marblecountertops,andcustomcabinetry.There isastaffroomorhomeofficeandfullbathroomoffofthekitchen.Thebedroomsarelocatedoffofthedining roomthroughanarchedhallway.Boththeprimaryandsecondbedroomshaveen-suitemarblebathrooms andwalk-inclosets.Thesecondbedroomisoutfittedwithbuilt-ins.Theseroomsarebrightandsunnywith southfacingexposures.
480ParkAvenueisanEmeryRothbuildingandisoneofParkAvenue'smostprestigious.Itisknowntohave oneofthegrandestlobbiesinthecityandoffersthehighestcaliberofservice.Someoftheamenitiesinclude a24-hourdoorman,conciergeservice,aresidentmanager,afitnesscenter,andabreathtakinglandscaped roofdeck.Pieds-a-terreareallowed.
Offeringprice 3 Beds 3 FullBaths 2 Fireplaces 2,400 SquareFeet
$4,200,000

All New York City 05 Market Overview 06 Market Snapshot | All Areas 07 Inventory | Absorption Rate 08 Days on Market | Listing Discount Luxury Market 10 Luxury Market

Ownership Type Analysis Neighborhood Analysis 11 Condos 13 Co -ops 15 Upper East Side 15 Upper West Side 16 Midtown 16 Uptown 17 Downtown 17 FiDi | Battery Park 18 Total Sales 18 Average Sales Price 3
Market Overview {Q2 | 2023}
Compared to the second quarter of 2022, the second quarter of 2023 witnessed a noteworthy decline of 23% in the volume of transactions observed within the Manhattan real estate market. Correspondingly, both the under $3M and $3M to $10M market segments experienced a similar decrease of 23% in the number of closed sales. Moreover, the overall average sales price across the market witnessed a marginal decline of 1%. However, it is important to note that the average sales price within the $3M to $10M segment displayed an increase of 8%, while the median sales price within the same segment exhibited a more substantial rise of 11%. In stark contrast, the high-end market, encompassing properties valued over $10M, faced a significant decrease in average sales price, plunging by 16%.

3,516 Closed Sales
-23% Change in Closed Sales {2023 v 2022}
$2.08M
Average Sales Price
-1% Change in Average Sales Price {2023 v 2022}
manhattan
652HudsonSt5S6S.com
Number of Closed Sales vs. Inventory
Average / Median Sales Price
Number of Closed Sales Average Sales Price Median Sales Price
1,000 2,000 3,000 4,000 5,000 6,000 7,000 8,000 9,000 Q2:21 Q3:21 Q4:21 Q1:22Q2:22 Q3:22 Q4:22 Q1:23Q2:23
UNDER $3 Million {2023 v 2022} -23% -2% 1% 2Q:23 2,923 $1.17M $985K 2Q:22 3,783 $1.20M $975K BETWEEN $3 - 10 Million {2023 v 2022} -23% 8% 11% 2Q:23 523 $5.23M $4.70M 2Q:22 676 $4.82M $4.23M OVER $10 Million {2023 v 2022} -24% -16% 2% 2Q:23 70 $16.45M $14.80M 2Q:22 91 $19.50M $14.49M ALL Price Points {2023 v 2022} -23% -1% -2% 2Q:23 3,516 $2.08M $1.21M 2Q:22 4,550 $2.10M $1.23M
Overview / New York City Q2 Market Update Average Sales Price Median Sales Price # of Closed Sales Inventory
$$500,000 $1,000,000 $1,500,000 $2,000,000 $2,500,000 Q2:21 Q3:21 Q4:21 Q1:22Q2:22 Q3:22 Q4:22 Q1:23Q2:23 5
Inventory
Number of Active Listings
$20 Million and Above
$10 - 20 Million
$6 - 10 Million
$4 - 6 Million
$2 - 4 Million
$1 - 2 Million
Under $1 Million TOTAL
CONDOS & CO-OPS
The historic absorption range of equilibrium for the New York City market area is 6-8 months. We ended Q2 2023 with 7,338 active units on the market. The absorption rate of active inventory was 7.5 months in Q2 2023. This statistic means that it would take 7.5 months to absorb the active inventory that is currently on the market based upon the rate of sales over the last 6 months. Based on the same calculation, it would take less than 7 months to absorb the current inventory priced below $2M, about 10 months for inventory priced between $2M-$6M, nearly 14 months for inventory priced between $6M-20M, and under 2 years to absorb properties priced above $20M given the current inventory in Manhattan.
Absorption Rate
The absorption rate is calculated by taking the total number of currently active listings and dividing by the average number of closed sales over the 6-month period.
All New York City
230 462 607 1,559 1,860 2,504 7,338
116
Absorption Line of Equilibrium 34.1% 25.3% 21.2% 8.3% 6.3% 3.1% 1.6% 0 5 10 15 20 25 Under $1M $1-2M $2-4M 4-6M 6-10M 10-20M$20M+
Average Days on Market vs. Listing Discount
Overview / New York City Q2 Market Update All New York City
Days
Market Listing Discount
Average
on
Q2 2021 Q3 2021 Q4 2021 Q1 2022 Q2 2022 Q3 2022 Q4 2022 Q1 2023 Q2 2023 Average Days on Market 159 123 117 112 105 89 110 135 131 Listing Discount -6.2% -5.4% -5.3% -5.0% -7.0% -5.9% -8.9% -9.7% -9.2% Listing Discount Average Days on Market 0 20 40 60 80 100 120 140 160 180 -12.0% -10.0% -8.0% -6.0% -4.0% -2.0% 0.0% Q2:21 Q3:21 Q4:21 Q1:22Q2:22 Q3:22 Q4:22 Q1:23Q2:23 7

There is opportunity in any market. Choose a real estate partner who gets results. Feature Property: 16East96St7BE.com © 2023 Sotheby’s International Realty. All Rights Reserved. Sotheby’s International Realty® is a registered trademark and used with permission. Each Sotheby’s International Realty office is independently owned and operated, except those operated by Sotheby’s International Realty, Inc. The Sotheby’s International Realty network fully supports the principles of the Fair Housing Act and the Equal Opportunity Act. SOTHEBYSREALTY.COM/NYC MANHATTAN BROKERAGES
The Luxury Market
Closed Sales Count, Average Sales Price & Highest Sales Price
The number of sales in the luxury price sector, encompassing sales above $10M, increased by 37% compared to last quarter. However, the average sales price in this market segment fell by 16% as compared to last quarter.
Average Sales Price vs. # of Closed Sales
All New York City Co-Ops & Condos Over $10M The Luxury Market / New York City Q2 Market Update Q2 2021 Q3 2021 Q4 2021 Q1 2022 Q2 2022 Q3 2022 Q4 2022 Q1 2023 Q2 2023 # of Closed Sales 77 87 72 85 91 75 53 51 70 Average Sales Price $17.50M $18.38M $22.57M $14.41M $19.51M $18.52M $17.72M $19.61M $16.45M Highest Sales Price $82.50M $66.00M $188M $46.96M $101M $75.89M $72.00M $67.88M $35.20M
sothebysrealty.com # of Closed Sales Average Sales Price10 20 30 40 50 60 70 80 90 100 $0 $5,000,000 $10,000,000 $15,000,000 $20,000,000 $25,000,000 Q2:21 Q3:21 Q4:21 Q1:22Q2:22 Q3:22 Q4:22 Q1:23Q2:23 9
Condos
During the second quarter of 2023, a total of 1,646 condominium transactions were successfully closed, indicating a decline of 21% compared to the corresponding period in 2022. However, it is important to note that this figure represents a notable increase of 55% when compared to the previous quarter. In terms of condominium prices, there was a 3% decrease in the average sale price when compared to the second quarter of 2022. Similarly, the average price per square foot experienced a decline of 4% during the same period. Nevertheless, it is noteworthy that condominiums priced between $3M and $10M demonstrated a positive trend, experiencing an 11% increase in average sales price and a 3% increase in average price per square foot.

1,646 Closed Sales
-21% Change in Closed Sales {2023 vs. 2022}
$2.86M Average Sales Price
-3% Change in Average Sale Price {2023 vs. 2022}
{Q2 | 2023} manhattan
225FifthAvePHF.com
Number of Closed Sales
Average / Median Sales Price
Number of Closed Sales Average Sales Price Median Sales Price Average Price/Sq. Ft.
Condos / New York City Q2 Market Update
UNDER $3 Million {2023 v 2022} -21% -4% -7% -1% 2Q:23 1,210 $1.44M $1.33M $1,482 2Q:22 1,527 $1.50M $1.42M $1,503 BETWEEN $3 - 10 Million {2023 v 2022} -22% 11% 17% 3% 2Q:23 378 $5.41M $4.97M $2,319 2Q:22 487 $4.88M $4.25M $2,254 ABOVE $10 Million {2023 v 2022} -25% -17% 1% -19% 2Q:23 58 $16.04M $14.80M $3,705 2Q:22 77 $19.30M $14.69M $4,601 ALL Price Points {2023 v 2022} -21% -3% -7% -4% 2Q:23 1,646 $2.86M $1.72M $2,041 2Q:22 2,091 $2.94M $1.85M $2,121
Average Sales Price Median Sales Price500 1,000 1,500 2,000 2,500 Q2:21 Q3:21 Q4:21 Q1:22Q2:22 Q3:22 Q4:22 Q1:23Q2:23 $0 $500,000 $1,000,000 $1,500,000 $2,000,000 $2,500,000 $3,000,000 $3,500,000 Q2:21 Q3:21 Q4:21 Q1:22Q2:22 Q3:22 Q4:22 Q1:23Q2:23 11
Co-Ops
1,870 Closed Sales
-24% Change in Closed Sales {2023 v 2022}
151 East 58th Street, PH55W
$1.39M Average Sales Price
151 East 58th Street, PH55W
0% Change in Average Sales Price {2023 v 2022}

{Q2 | 2023} manhattan
In the second quarter of 2023, there were 1,870 closed coop transactions, reflecting a 24% decrease in sales volume compared to Q2 2022. However, it is important to highlight that this figure represented a substantial 42.6% increase compared to the previous quarter. Despite the overall average sale price remaining relatively unchanged when compared to Q2 2022, the co-ops priced above $10 million experienced a significant 11% decrease in average sales price. Conversely, within this segment, the median prices exhibited a remarkable 21% increase. 143west13thst102.com
Number of Closed Sales
Average / Median Sales Price
Number of Closed Sales Average Sales Price Median Sales Price
Co-Ops / New York City Q2 Market Update
UNDER $3 Million {2023 v 2022} -24% -1% 1% 2Q:23 1,713 $984K $783K 2Q:22 2,256 $990K $775K BETWEEN $3 - 10 Million {2023 v 2022} -23% 2% 6% 2Q:23 145 $4.77M $4.36M 2Q:22 189 $4.69M $4.10M ABOVE $10 Million {2023 v 2022} -14% -11% 21% 2Q:23 12 $18.47M $14.85M 2Q:22 14 $20.65M $12.25M ALL Price Points {2023 v 2022} -24% 0% 1% 2Q:23 1,870 $1.39M $840K 2Q:22 2,459 $1.39M $835K
Average Sales Price Median Sales Price500 1,000 1,500 2,000 2,500 3,000 Q2:21 Q3:21 Q4:21 Q1:22Q2:22 Q3:22 Q4:22 Q1:23Q2:23 $0 $200,000 $400,000 $600,000 $800,000 $1,000,000 $1,200,000 $1,400,000 $1,600,000 Q2:21 Q3:21 Q4:21 Q1:22Q2:22 Q3:22 Q4:22 Q1:23Q2:23 13
Neighborhood Highlights
Upper East Side | north of 58th street and south of 96th Street, Fifth Avenue to East End Avenue
Upper West Side | north of 58th Street and south of 110th Street, CPW to Riverside Drive (including CPS)
new york city
CONDOS Q2 2023 Q2 2022 % Change Closed Sales 254 278 -9% Average Sales Price $3.69M $3.51M 5% Median Sales Price $2.16M $1.89M 14% CONDOS Q2 2023 Q2 2022 % Change Closed Sales 290 331 -13% Average Sales Price $3.28M $3.82M -14% Median Sales Price $1.65M $2.10M -21% COOPS Q2 2023 Q2 2022 % Change Closed Sales 539 728 -26% Average Sales Price $1.75M $1.87 -7% Median Sales Price $975K $1.00M -2% COOPS Q2 2023 Q2 2022 % Change Closed Sales 395 494 -20% Average Sales Price $1.70M $1.41M 21% Median Sales Price $998K $895K 12%
Midtown | north of 34th Street and south of 57th Street
Uptown | north of 96th Street on the East Side and north of 110th Street on the West Side
Neighborhood Highlights / New York City Q2 Market Update
CONDOS Q2 2023 Q2 2022 % Change Closed Sales 204 299 -32% Average Sales Price $1.86M $2.80M -33% Median Sales Price $1.40M $1.40M 0% CONDOS Q2 2023 Q2 2022 % Change Closed Sales 96 216 -56% Average Sales Price $1.03M $1.29M -21% Median Sales Price $800K $970K -18% COOPS Q2 2023 Q2 2022 % Change Closed Sales 243 353 -31% Average Sales Price $851K $851K 0% Median Sales Price $655K $625K 5% COOPS Q2 2023 Q2 2022 % Change Closed Sales 148 202 -27% Average Sales Price $532K $643K -17% Median Sales Price $441K $540K -18% 15
Neighborhood Highlights
Downtown | South of 34th Street through TriBeCa
Financial District / Battery Park
new york city
CONDOS Q2 2023 Q2 2022 % Change Closed Sales 601 799 -25% Average Sales Price $3.43M $3.11M 10% Median Sales Price $2.40M $2.38M 1% CONDOS Q2 2023 Q2 2022 % Change Closed Sales 201 168 20% Average Sales Price $1.43M $1.85M -23% Median Sales Price $1.24M $1.20M 3% COOPS Q2 2023 Q2 2022 % Change Closed Sales 508 663 -23% Average Sales Price $1.28M $1.36M -6% Median Sales Price $933K $900K 4% COOPS Q2 2023 Q2 2022 % Change Closed Sales 37 19 94% Average Sales Price $1.29M $998K 29% Median Sales Price $890K $875K 2%
Total Number of Sales by Neighborhood
Average Sales Price by Neighborhood
Neighborhood Highlights / New York City Q2 Market Update
Uptown Upper East Side Midtown FiDi / Battery Park Upper West Side Downtown Uptown Upper East Side Midtown FiDi / Battery Park Upper West Side Downtown 0 200 400 600 800 1,000 1,200 1,400 1,600 Q2:21 Q3:21 Q4:21 Q1:22Q2:22 Q3:22 Q4:22 Q1:23Q2:23 $0 $500,000 $1,000,000 $1,500,000 $2,000,000 $2,500,000 $3,000,000 Q2:21 Q3:21 Q4:21 Q1:22Q2:22 Q3:22 Q4:22 Q1:23Q2:23 17
Vannessa Kaufman RE vannessa.kaufmanre.com 650 Madison Avenue NEw York, NY 10022 917-865-8065 | vannessa kaufman@sothebys.realty Back Cover Feature Property: 30ParkPlace75B.com © 2023 Sotheby’s International Realty. All Rights Reserved. Figures in this report are based on publicly reported closed sales information via the Automated City Register Information System (ACRIS) and Property Shark, an independent research firm. Sotheby’s International Realty® is a registered trademark and used with permission. Each Sotheby’s International Realty office is independently owned and operated, except those operated by Sotheby’s International Realty, Inc. This material is based upon information which we consider reliable but because it has been supplied by third parties, we cannot represent that it is accurate or complete and it should not be relied upon as such. Since all final closed data for the current quarter had not been reported at the time this report was compiled, the available closed data was extrapolated i0n an attempt to approximate full results for the current quarter. Actual results may materially vary from the approximated results. All offerings are subject to errors, omissions, changes including price or withdrawal without notice. If your property is listed with a real estate broker, please disregard. It is not our intention to solicit the offerings of other real estate brokers. We are happy to work with them and cooperate fully. Equal Housing Opportunity.