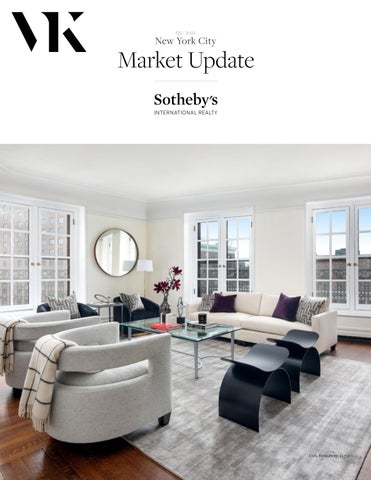
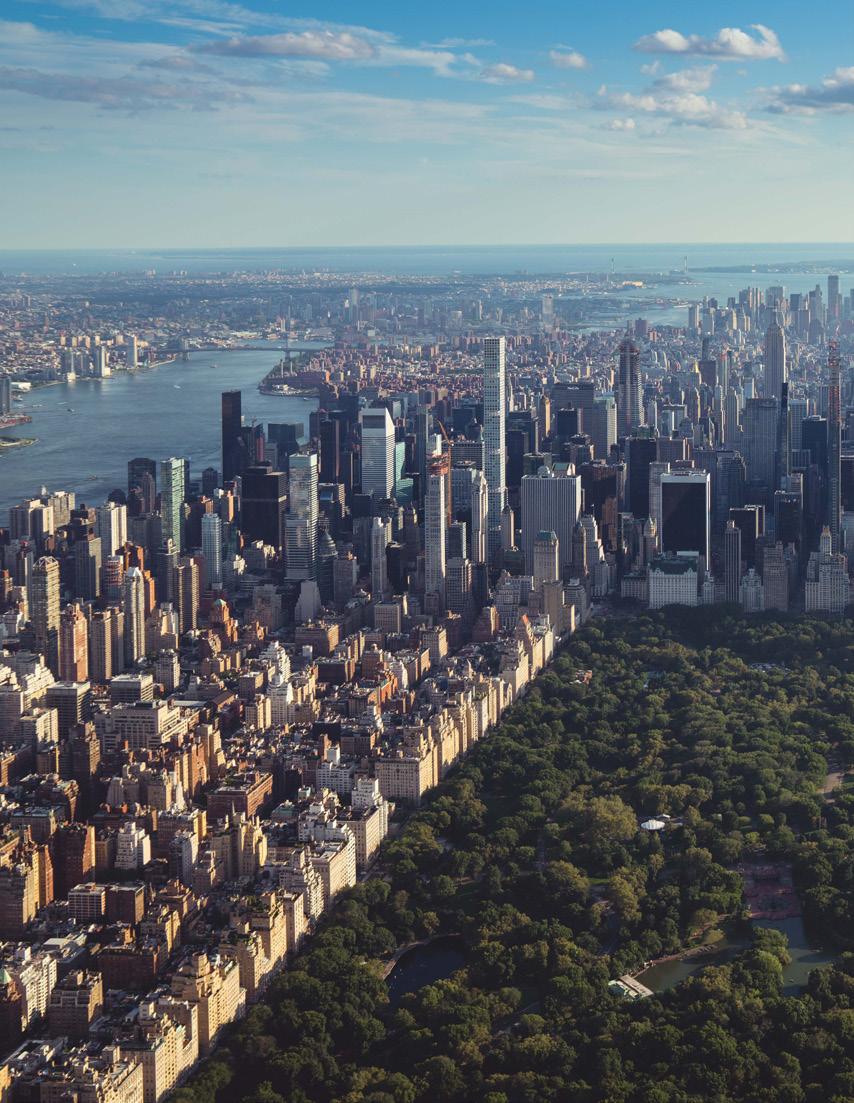
New York City

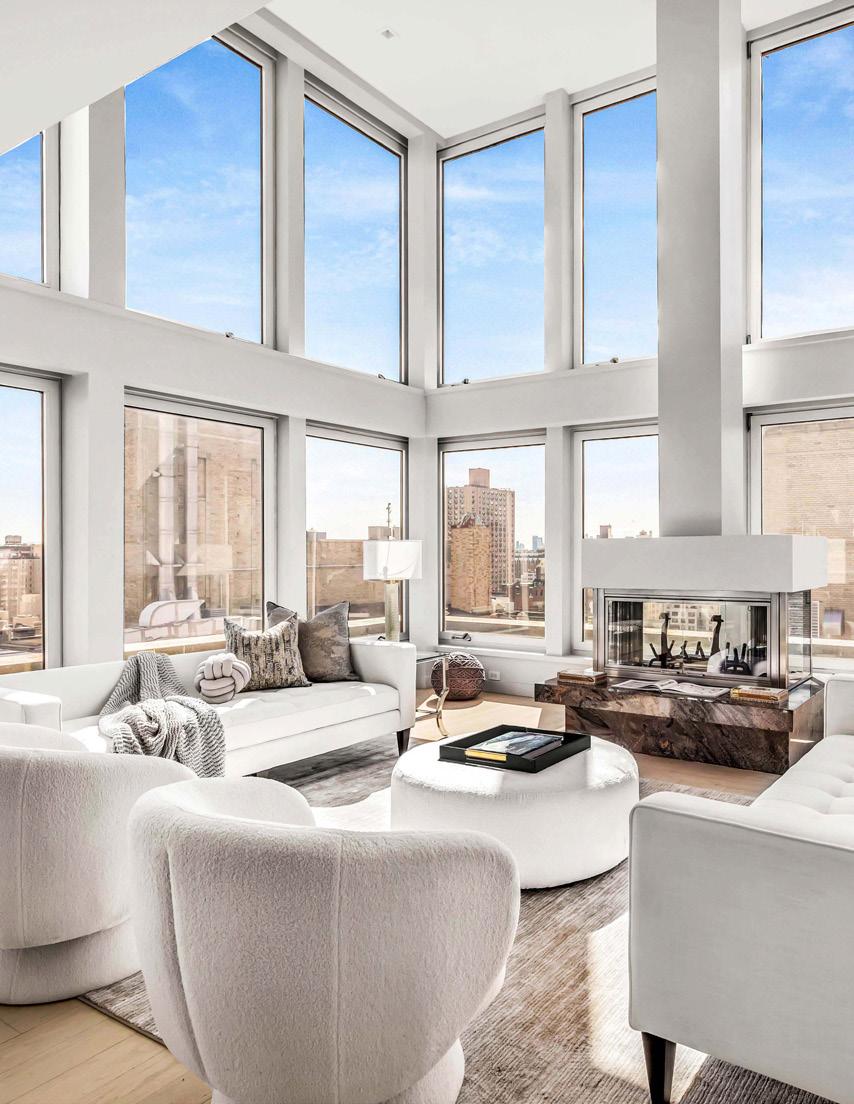
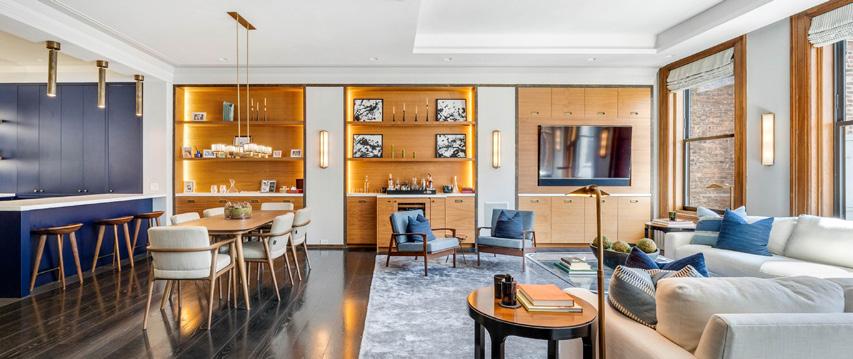
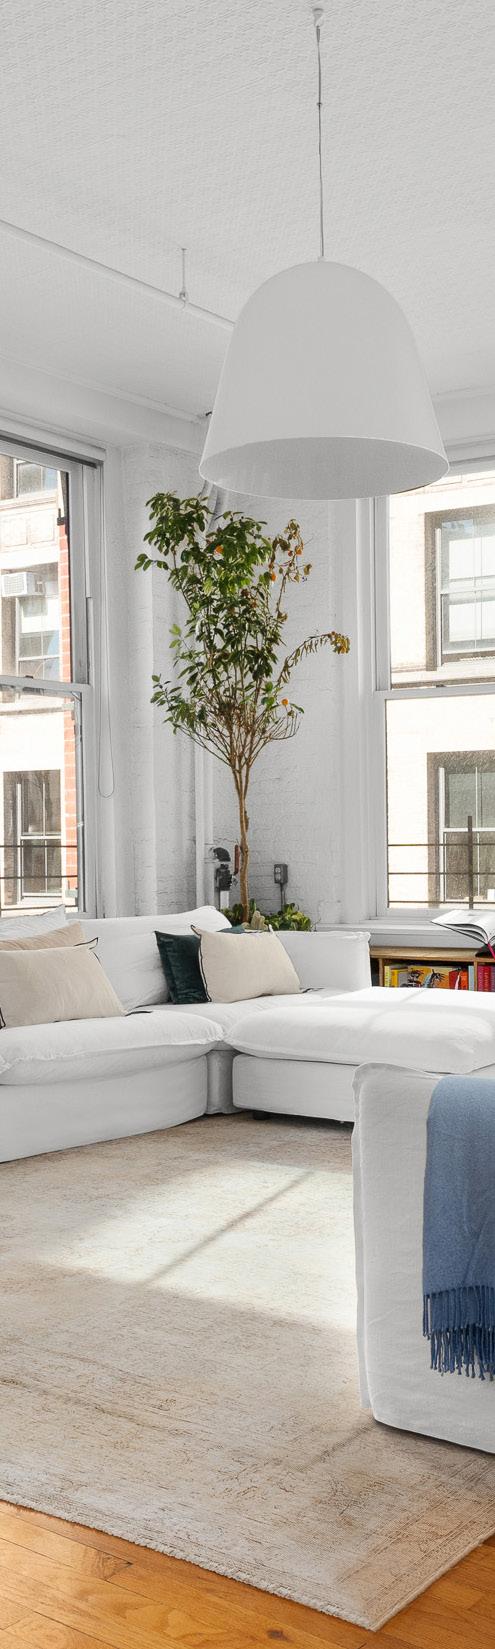
Behind the wrought-iron gate sits a stately home of grand scale proportion. From the first step into the foyer the home is immediately inviting. Soaring 11.5 feet tall ceilings allow for an abundance of natural light, meticulously maintained original details offer and old-world charm, 7 fireplaces evoke a warm atmosphere, and two private outdoor spaces lend to lavish modern living. The home is 20 feet wide and measures over 5,700 sf, offering seven bedrooms, four full baths, three half baths, and two laundry rooms.
The state-of-the-art kitchen is found on the garden level. With two center islands, two sinks, double ovens, and a separate yet open dining area, this level is perfect for everyday living and entertaining alike. There is direct access to the garden patio for al-fresco dining.
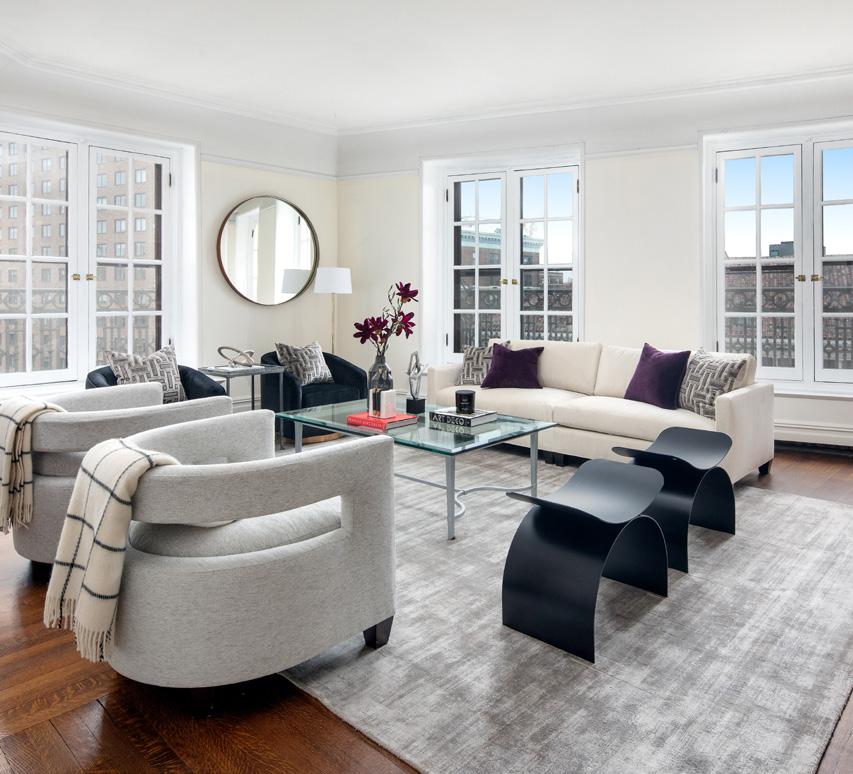
The parlor level is dedicated to the formal living space. The south facing great room is grand and the living room is warm, adorned with bespoke oak built-ins. The intricately designed hard wood floors connect the two rooms to become one cohesive living space.
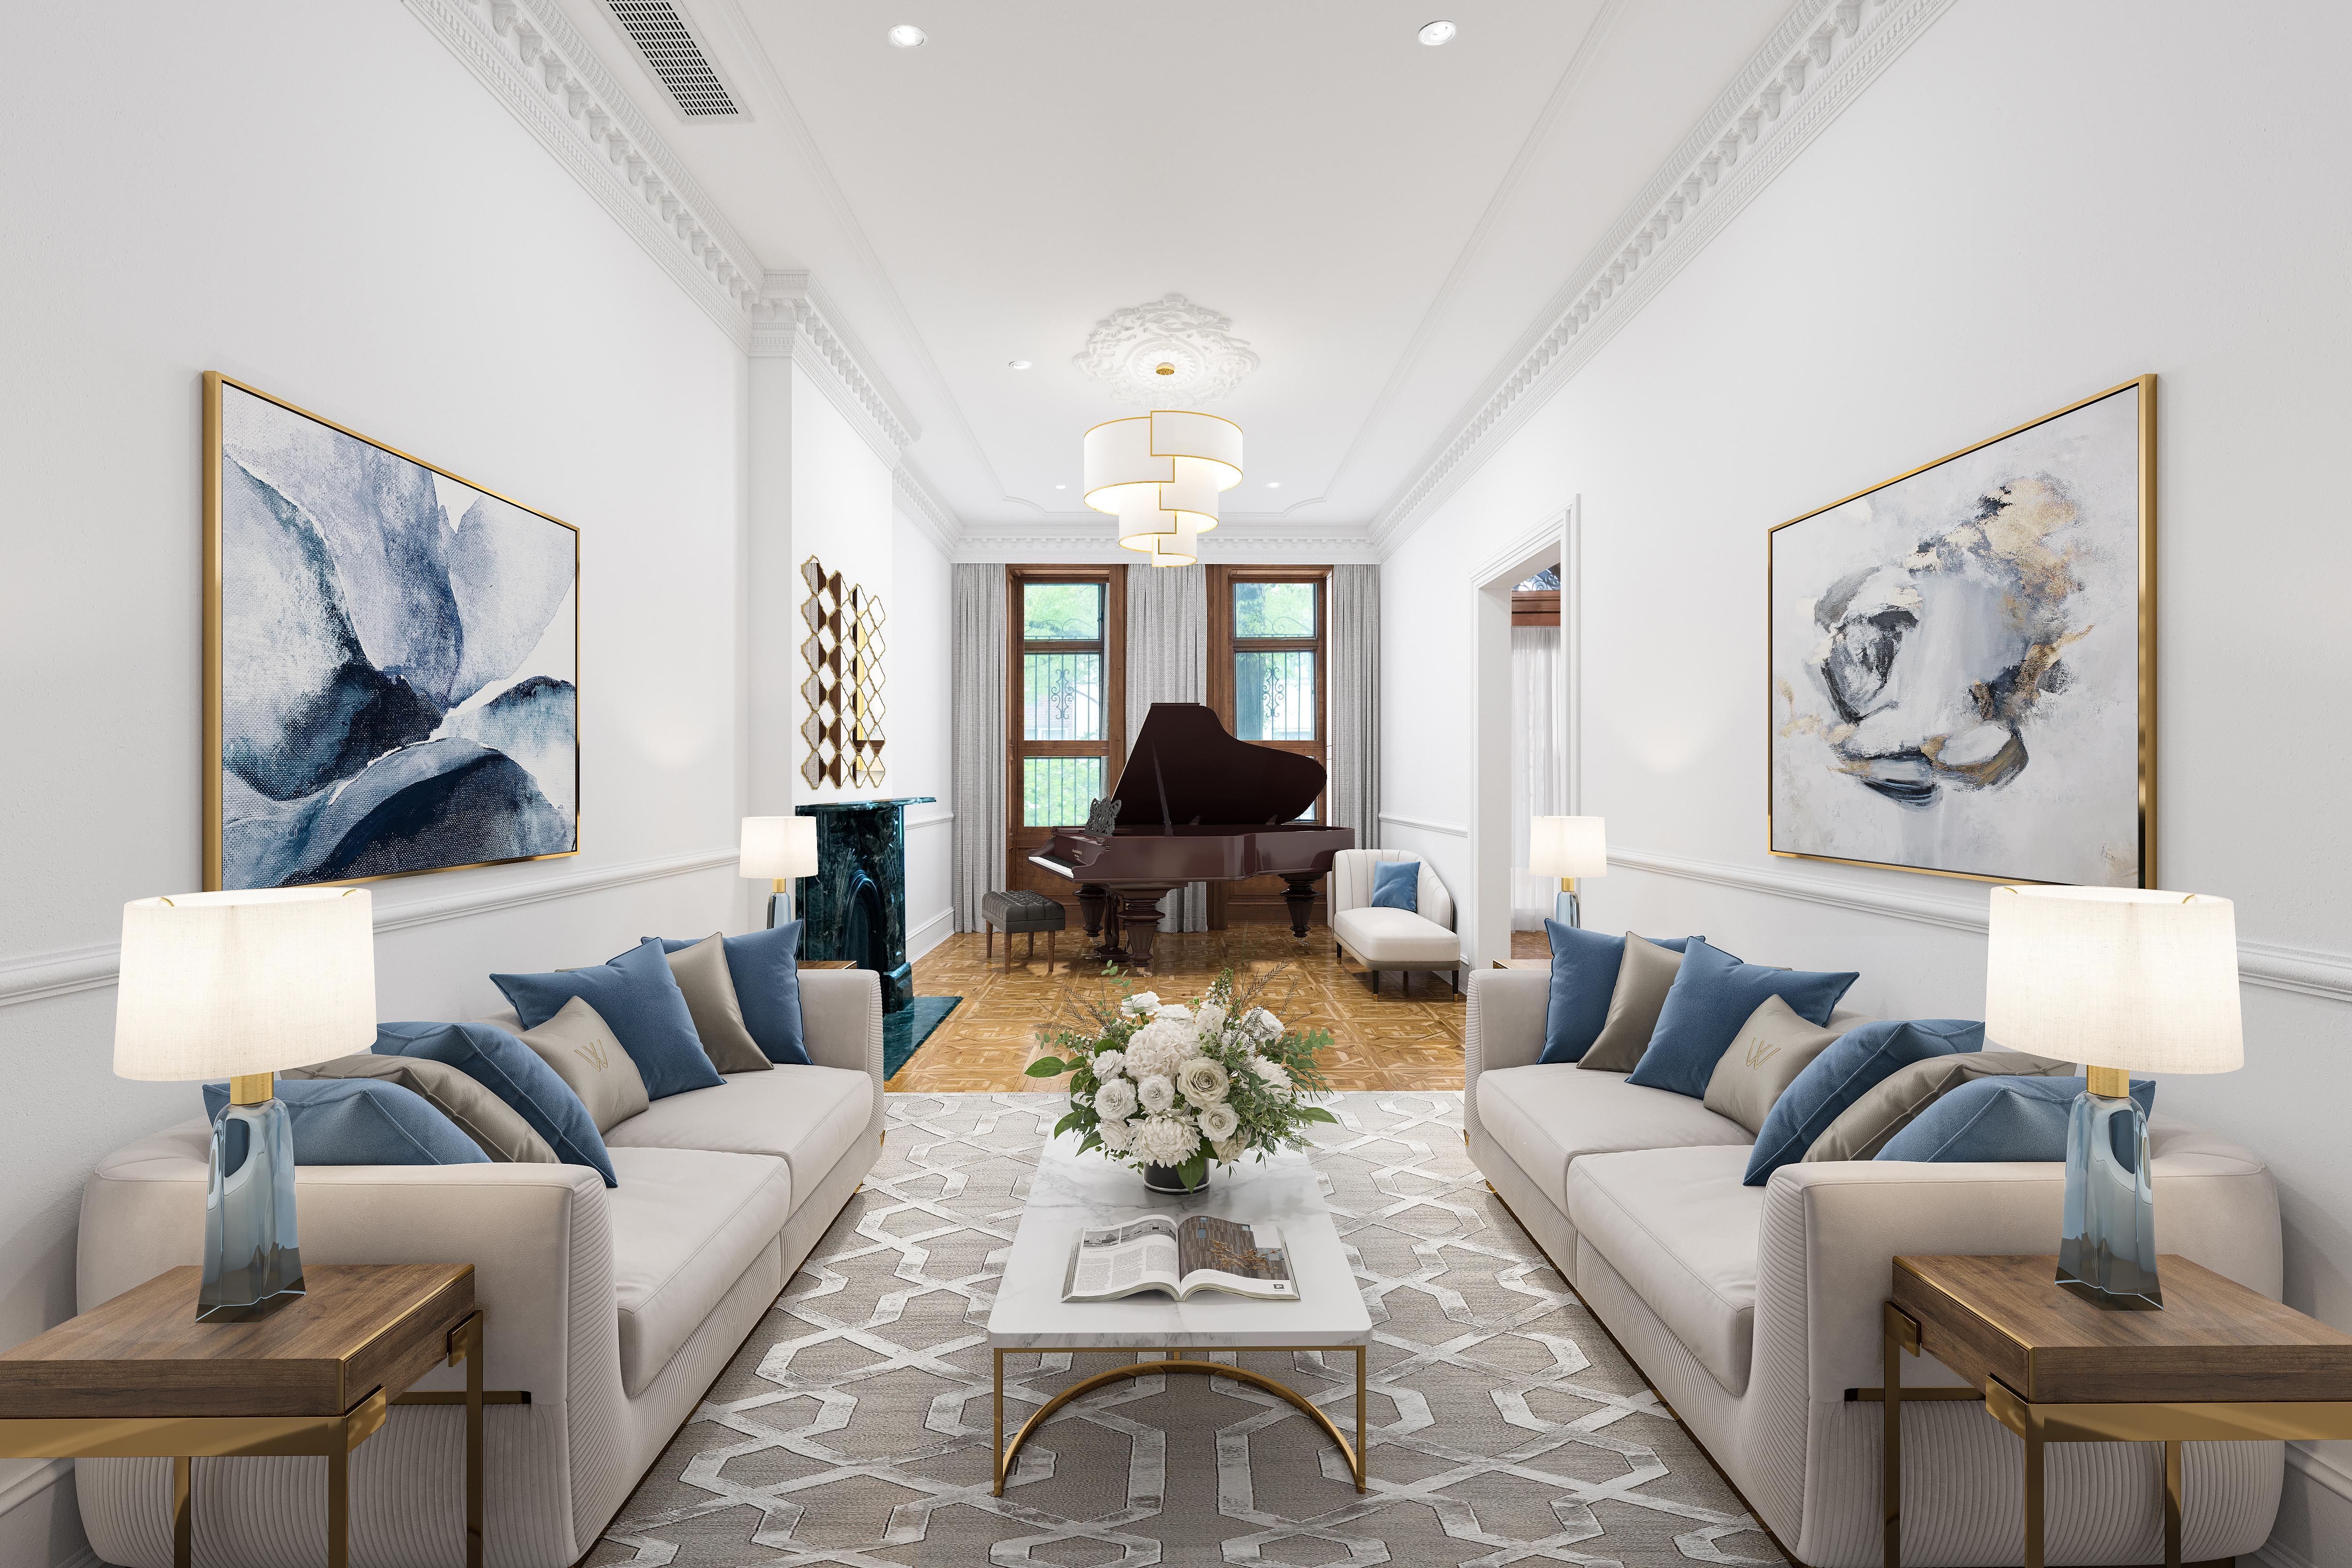
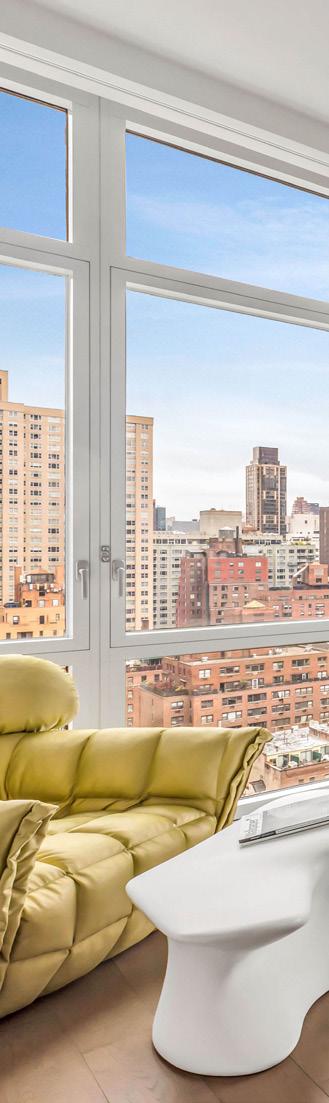
The three remaining floors house the seven bedrooms of the home. Each offer ample living and storage space. The primary bedroom is exceptionally large with its own fire place and an en-suite marble bathroom with double sinks.
The home, built in 1860, is situated on a coveted tree-lined block. It’s location in Murray Hill Historic District gives easy access to many world-class restaurants and shopping as well as public transportation & Grand Central Station. The homes systems were recently updated including heating, Central A/C, and a new roof.
In comparison to Q3 2021, in Q3 2022, the number of transactions dropped 4% marketwide, with the over $10M market having the most sizeable drop, being down 11%. Although the over $10M market had the largest drop in number of sales, the average sales price increased by 5%.
Change in Closed Sales
Change in Average Sales Price
$2,500,000
$2,000,000
$1,500,000
$1,000,000
$500,000
$-
Sales Inventory
{2022 v 2021}
-1% -1%
Number of Closed Sales Average Sales Price Median Sales Price UNDER $3 Million
3Q:22 3,830 $1.18M $975K 3Q:21 3,972 $1.19M $985K
{2022 v 2021}
BETWEEN $3 - 10 Million
$10 Million
3Q:22
3Q:21
3Q:22
Price Points
4% 6%
$4.88M $4.37M
$4.71M $4.10M
5%
$19.32M $15.25M
$18.38M $14.08M
-0.2% -1%
$1.97M $1.18M
$1.98M $1.20M
The historic absorption range of equilibrium for the New York City market area is 6-8 months. We ended Q3 2022 with 6,681 active units on the market. The absorption rate of active inventory was 4.4 months in Q3 2022. This statistic means that it would take 4.4 months to absorb the active inventory that is currently on the market based upon the rate of sales over the last 6 months. Based on the same calculation, it would take less than 5 months to absorb the current inventory priced below $4M, about 9 months for inventory priced between $4M-$10M, just over one year for inventory priced between $10-20M, and about 14 months to absorb properties priced above $20M given the current inventory in Manhattan.
absorption rate is calculated by taking the total number of currently active listings and dividing by the average number of closed sales over the 6-month period.
Listing
Choose a real estate partner who gets results.
 © 2022 Sotheby’s International Realty. All Rights Reserved. Sotheby’s International Realty® is a registered trademark and used with permission. Each Sotheby’s International Realty office is independently owned and operated, except those operated by Sotheby’s International Realty, Inc. The Sotheby’s International Realty network fully supports the principles of the Fair Housing Act and the Equal Opportunity Act.
SOTHEBYSREALTY.COM/NYC
MANHATTAN BROKERAGES
© 2022 Sotheby’s International Realty. All Rights Reserved. Sotheby’s International Realty® is a registered trademark and used with permission. Each Sotheby’s International Realty office is independently owned and operated, except those operated by Sotheby’s International Realty, Inc. The Sotheby’s International Realty network fully supports the principles of the Fair Housing Act and the Equal Opportunity Act.
SOTHEBYSREALTY.COM/NYC
MANHATTAN BROKERAGES
City
Condos Over
Average Sales Price $32.62M $18.58M $16.80M $17.50M $18.38M $22.57M $14.41M $19.51M $19.32M
Highest Sales Price $99.90M $65.59M $41.00M $82.50M $66.00M $188.00M $46.96M $101M $75.89M
Sales in the luxury price sector, above $10M, decreased by 14% compared to last quarter. However, the average sales price in this sector is still higher than Q3 2021.
In Q3 2022, 1,922 condominium transactions closed representing a 16% decrease from 2021.
As compared to Q3 2021, the average sales prices in the condominium sector increased 6%. Price per square foot for all price points rose 9% above 2021 levels to $2,117.
Change in Closed Sales {2022 vs. 2021}
Change in Average Sale Price {2022 vs. 2021}
$4,000,000
$3,500,000
$3,000,000
$2,500,000
$2,000,000
$1,500,000
$1,000,000
$500,000
$0
UNDER $3 Million
Average Sales Price Median Sales Price
Number of Closed Sales Average Sales Price Median Sales Price Average Price/Sq. Ft.
1%
1,460 $1.44M $1.33M $1,494 3Q:21 1,756 $1.45M $1.32M $1,428
v
BETWEEN $3 - 10 Million
ABOVE $10 Million
$5.04M $4.70M $2,338
$4.78M $4.30M $2,115
$20.18M $15.75M $4,301
$18.81M $14.60M $4,184
-0.3%
$2.83M $1.64M $2,117
2,287 $2.67M $1.65M $1,946
The 2,563 closed coop transactions in Q3 2022 represented an 7% increase in number of sales compared to Q3 2021. The average and median sales prices ticked up at 1% and 4% respectively. For co-ops above $10M, average and median prices dropped 12% and 7% respectively.
Change in Closed Sales
Change in Average Sales Price
-
$1,600,000
$1,400,000
$1,200,000
$1,000,000
$800,000
$600,000
$400,000
$200,000
$0
Q3:20 Q4:20 Q1:21 Q2:21 Q3:21 Q4:21 Q1:22 Q2:22 Q3:22
Average Sales Price Median Sales Price
Number of Closed Sales Average Sales Price Median Sales Price UNDER $3 Million
{2022 v 2021} 7% 3% 4% 3Q:22 2,371 $1.02M $815K 3Q:21 2,216 $985K $780K
BETWEEN $3 - 10 Million
ABOVE $10 Million
{2022 v 2021} 10% 1% 7% 3Q:22 181 $4.54M $4.00M 3Q:21 165 $4.49M $3.75M
{2022 v 2021} -17% -12% -7%
3Q:22 11 $13.95M $12.19M 3Q:21 13 $15.95M $13.11M
{2022 v 2021}
ALL Price Points
1% 4%
3Q:22 2,563 $1.32M $860K 3Q:21 2,394 $1.31M $830K
city
Upper East Side | north of 58th street and south of 96th Street, Fifth Avenue to East End Avenue
CONDOS Q3 2022 Q3 2021
Closed Sales 213 325 -34%
Average Sales Price $2.71M $2.56M 6%
Median Sales Price $1.70M $1.75M -3%
COOPS Q3 2022 Q3 2021 % Change
Closed Sales 722 743 -3%
Average Sales Price $1.72M $1.65M 4%
Median Sales Price $999K $990K 1%
Upper West Side | north of 58th Street and south of 110th Street, CPW to Riverside Drive (including CPS)
CONDOS Q3 2022 Q3 2021
Closed Sales 357 362 -1%
Average Sales Price $3.57M $3.93M -9%
Median Sales Price $1.80M $1.83M -2%
COOPS Q3 2022 Q3 2021 % Change
Closed Sales 518 456 13%
Average Sales Price $1.41M $1.57M -10%
Median Sales Price $995K $1.08M -8%
Midtown | north of 34th Street and south of 57th Street
CONDOS Q3 2022 Q3 2021 % Change
Closed Sales 268 344 -22%
Average Sales Price $2.13M $1.63M 31%
Median Sales Price $1.20M $1.23M -3%
COOPS Q3 2022 Q3 2021 % Change
Closed Sales 298 349 -15%
Average Sales Price $754K $746K 1%
Median Sales Price $630K $615K 2%
Uptown | north of 96th Street on the East Side and north of 110th Street on the West Side
CONDOS Q3 2022 Q3 2021 % Change
Closed Sales 164 208 -21%
Average Sales Price $1.07M $1.17M -8%
Median Sales Price $908K $985K -8%
COOPS Q3 2022 Q3 2021 % Change
Closed Sales 217 184 18%
Average Sales Price $659K $590K 12%
Median Sales Price $570K $529K 8%
CONDOS
Q3 2022 Q3 2021 % Change
Closed Sales 770 822 -6%
Average Sales Price $3.42M $3.23M 6%
Median Sales Price $2.30M $2.21M 4%
COOPS Q3 2022 Q3 2021 % Change
Closed Sales 722 638 13%
Average Sales Price $1.30M $1.25M 4%
Median Sales Price $910K $883K 3%
CONDOS Q3 2022 Q3 2021 % Change
Closed Sales 150 226 -33%
Average Sales Price $1.45M $1.76M -18%
Median Sales Price $997K $1.37M -27%
COOPS Q3 2022 Q3 2021 % Change
Closed Sales 86 24 258%
Average Sales Price $1.27M $1.03M 24%
Median Sales Price $1.24M $817K 51%
800 1,000 1,200 1,400 1,600
600
400
200
0
Q3:20 Q4:20 Q1:21 Q2:21 Q3:21 Q4:21 Q1:22 Q2:22 Q3:22
Uptown Upper East Side Midtown
FiDi / Battery Park Upper West Side Downtown
$4,000,000
$3,500,000
$3,000,000
$2,500,000
$2,000,000
$1,500,000
$1,000,000
$0 $500,000
Q3:20 Q4:20 Q1:21 Q2:21 Q3:21 Q4:21 Q1:22 Q2:22 Q3:22
Uptown Upper East Side Midtown
FiDi / Battery Park Upper West Side Downtown