


1. Section One: Background
a, Overview
b. Approach
c. Social Determinants of Health
d. TOD + Health + Urban Design
e. Targeted Universalism
f. Using the HCAT (Methods)
g. ART + IDO Along Central Avenue
h. Geographies
i. Healthy Community Assessment
j. High Priority /Domains
k. Research Team
2. Section Two: the Urban Context
a. Mapping the Indicators
b. Land Use
c. Socio-Economic
d. Transportation
e. Residential
f. Education
g. Public Realm
h. Food Access
i. Environmental Quality
3. Section Three: [Station Area] Community Portraits and Design Ideas
a. International District
i. Summary of history, character, and existing conditions
ii. Strategic Urban Design Plan (from DPAC Studio)
iii. Architecture infill proposals (from DPAC Studio)
iv. Maps of data (from Research Phase)
1. Land Use
2. Socio-Economic
3. Transportation
4. Residential
5. Education
6. Public Realm
7. Food Access
8. Environmental Quality
b. University
i. Summary of history, character, and existing conditions
ii. Strategic Urban Design Plan (from DPAC Studio)
iii. Architecture infill proposals (from DPAC Studio)
iv. Maps of data (from Research Phase)
1. Land Use
2. Socio-Economic
3. Transportation
4. Residential
5. Education
6. Public Realm
7. Food Access
8. Environmental Quality c. Old Town
i. Summary of history, character, and existing conditions
ii. Strategic Urban Design Plan (from DPAC Studio)
iii. Architecture infill proposals (from DPAC Studio)
iv. Maps of data (from Research Phase)
1. Land Use
2. Socio-Economic
3. Transportation
4. Residential
5. Education
6. Public Realm
7. Food Access
8. Environmental Quality d. Atrisco
i. Summary of history, character, and existing conditions
ii. Strategic Urban Design Plan (from DPAC Studio)
iii. Architecture infill proposals (from DPAC Studio)
iv. Maps of data (from Research Phase)
1. Land Use
2. Socio-Economic
3. Transportation
4. Residential
5. Education
6. Public Realm
7. Food Access
8. Environmental Quality4. Section Four: Tools and Interventions
a. Public Realm
b. Housing
c. Food Systems
5. Section Five: Appendices
a. Glossary
b. Sources
c. CRP Studio Final Report
The City of Albuquerque is poised for significant growth and change in the next ten years (plus), at least partially due to these recent public investments:
• An updated Comprehensive Plan, ABC-Z
• A new zoning code, the Integrated Development Ordinance (IDO)
• A bus rapid transit system, the Albuquerque Rapid Transit (ART)
How will neighborhood’s—residents and business owners—be impacted? How can we leverage this investment to create value and community benefits, improve social equity, and improve the quality of life along the corridor? How can community members play a meaningful role in shaping the neighborhoods they want and need?
Over an 16-month period (August 2016–December 2017), the City of Albuquerque will conduct a Transit-Oriented Development Planning Initiative, to identify strategies and actions to realize this potential over the next ten years. A recent study conducted by the Center for Neighborhood Technology, The Scale of the Prize (commissioned by the City of Albuquerque) concluded that the ART project could catalyze as much at $2 billion in real estate and economic development, along with $1 billion in household savings, along the transit corridor. How/can this ‘value’ be translated into both quantitative and qualitative benefits?
As one part of the TOD planning study, the City entered an agreement with the University of New Mexico (UNM) to study the potential neighborhood outcomes of these public investments. Together with stakeholders, students, volunteers, and faculty, our focus will be on people living and working in relevant neighborhoods—products of this study will be compiling “community portraits” of current conditions; identifying opportunities to maximize positive impacts (like better access to healthy foods, safe recreation, better quality housing at prices affordable to most); identifying risks for negative impacts (like involuntary displacement of business and/or residents); and identifying policy and design strategies for realizing these community benefits and mitigating risks. The UNM Research Team used Social Determinants of Health literature/research and related promising practices in built environment interventions to guide and evaluate our work.
The UNM research team will collect and analyze data to identify areas of opportunity and risk; identify promising practices for maximizing benefits (community and economic). We will work with community stakeholders to conduct a research study to identify ways in which current public investments—comprehensive plan, zoning code, and bus rapid transit—might impact and/or reposition communities along the Central Avenue corridor. Our approach uses social determinants of health to select, gather, and analyze data and then make recommendations for additional improvements and/or policy controls that we think will 1) improve quality of life, health and wellbeing in neighborhoods proximate to ART station areas, 2) welcome and shape new development, and 3) provide neighborhood stability in the context of change.
The study initiated from the question, how do current community conditions measure against the contextual indicators that have been shown to correlate to health outcomes?
Transit-Oriented Development
Social Determinants of Health
Targeted Universalism
Healthy, Equitable TOD
Social Determinants of Health is a term coined by the World Health Organization to describe a number of contextual factors— socioeconomic and built environment—that are strongly correlated to health outcomes at a community scale. Therefore, we see differential health outcomes from neighborhood to neighborhood, depending on the mix and amount of risk and protective factors found in those neighborhoods. The social determinants that are the primary focus of this study are as follows:
Household Income
Access to Healthy Food
Educational Opportunity_ attainment, facilities
Parks and Open Space_ access to nature
Environmental Quality_ exposure to hazards
Transportation_ transit, walkability, bike ability, safety
Social Cohesion_ voter participation, organizations
Neighborhood Characteristics_ culture, alcohol, goods/services, vacant/underutilized properties
Transit-Oriented Development (TOD) supports healthy community design goals by fostering a mix of land uses, a range of housing options and price points, connectivity through public transit, and walkable and bikeable neighborhoods supported by and complete streets.
Health outcomes could be considered the ultimate measure of the quality of life that a community supports. Specifically, built environment features that have been demonstrated to impact health include: accessibility, affordability and quality of housing; design of streets and streetscape; access to nature; opportunities for active recreation; infrastructure that supports and invites active transportation; and the presence/absence of hazardous land uses.
Public health officials and scholars have pointed to the built environment as a crucial agent in health promotion and disease prevention—one that offers a return on investment far higher than direct provision of health care and treatment of disease. This work has motivated leading professional organizations to adopt public health interest as priorities for built environment design, planning and policy, including the Centers for Disease Control and Prevention (CDC), the American Public Health Association (APHA), the American Institute of Architects (AIA), the Association for Collegiate Schools of Architecture (ACSA), the American Society of Landscape Architects (ASLA), the Congress for the New Urbanism (CNU), and the Urban Land Institute (ULI).
How do Social Determinants relate to the Built Environment, TransitOriented Development, and Design?
Location Efficiency
Mix of Uses
Mix of Housing types, sizes and price points
Reliable, safe and frequent public transit
The CDC defines healthy places as “those designed and built to improve the quality of life for all people who live, work, worship, learn, and play within their borders -- where every person is free to make choices amid a variety of healthy, available, accessible, and affordable options.” (https://www.cdc.gov/healthyplaces/) Focus areas for the initiative include: Parks, Trails and Health; Physical Activity; and Transportation.
In the Building Healthy Places Toolkit, published in 2015, the Urban Land Institute presents “21 recommendations for promoting health at the building or project scale. These “gold star” recommendations are organized according to three categories:
Healthy Food and Drinking Water
Healthy Environment and Social Well-Being
Appendix XX provides an outline of ULI’s 21 recommendations, which includes: a mix of land uses, well-connected street networks at human scale, play spaces for children, onsite gardening, healthy food retail, healthy indoor air quality, increased access to nature, and spaces for social engagement.
The promise of combining principles (and resources) for transit-oriented development, equitable development, and public and population health is to create healthy and equitable communities, in which people of a range of backgrounds and income-levels can find and afford a quality of life that supports their physical and mental wellbeing. The kind of investment that follows investment in public transit (including the ART) can help realize this promise in cities like Albuquerque.
According to PolicyLink, “by facilitating public transportation use, TOD can reduce dependence on fossil fuels, lower residents’ transportation costs, promote walking and health, ease traffic congestion, and improve environmental quality.” (PolicyLink, Equitable Development Toolkit: Transit Oriented Development, April 2008). However, they also note that TOD does not automatically lead to healthy and equitable outcomes, pointing to the following conditions/criteria/strategies to foster equitable TOD:
• Explicit equity goals in overall plan or vision, including affordable housing and/or new jobs for local residents.
• Comprehensive research to establish existing conditions and measurable goals.
• New zoning that takes into account existing conditions—along with higher density, mixed use, and reduced parking—within the TOD vision.
• Comprehensive transit service plan, to connect with new transit service demands and needs of residents.
• Public investment in improvements in TOD and surrounding infrastructure.
• Meaningful community voice and engagement in planning and decision-making (through participation, appointments on boards/councils, etc.)
Further, Reconnecting America notes that successful case studies built upon larger neighborhood planning efforts. This suggests the TOD plans for the Central Corridor build upon the comprehensive plan, and previous local plans to incorporate both community level goals and city/county vision.
As described by the National Equity Project, “In its simplest definition, targeted universalism alters the usual approach of universal strategies (policies that make no distinctions among citizens’ status, such as universal health care) to achieve universal goals (improved health), and instead suggests we use targeted strategies to reach universal goals.” and “A targeted universal strategy is one that is inclusive of the needs of both the dominant and the marginal groups, but pays particular attention to the situation of the marginal group.” (National Equity Project, accessed 26Jan17)
The principles for building healthy places help establish goals for the outcomes of transit-oriented development. The principles for equitable development and targeted universalism suggest that interventions and investments be tailored to the needs and resources of individual communities and neighborhoods. Those with the greatest need should receive more attention and assistance.
This study starts by looking at the variation in social and built environment determinants among corridor neighborhoods to help identify those that would most benefit from additional public policy and investment to complement the regulatory and transit investments, toward creating healthy and equitable TOD. The Healthy Communities Assessment Tool provides a starting point for comparison of available data
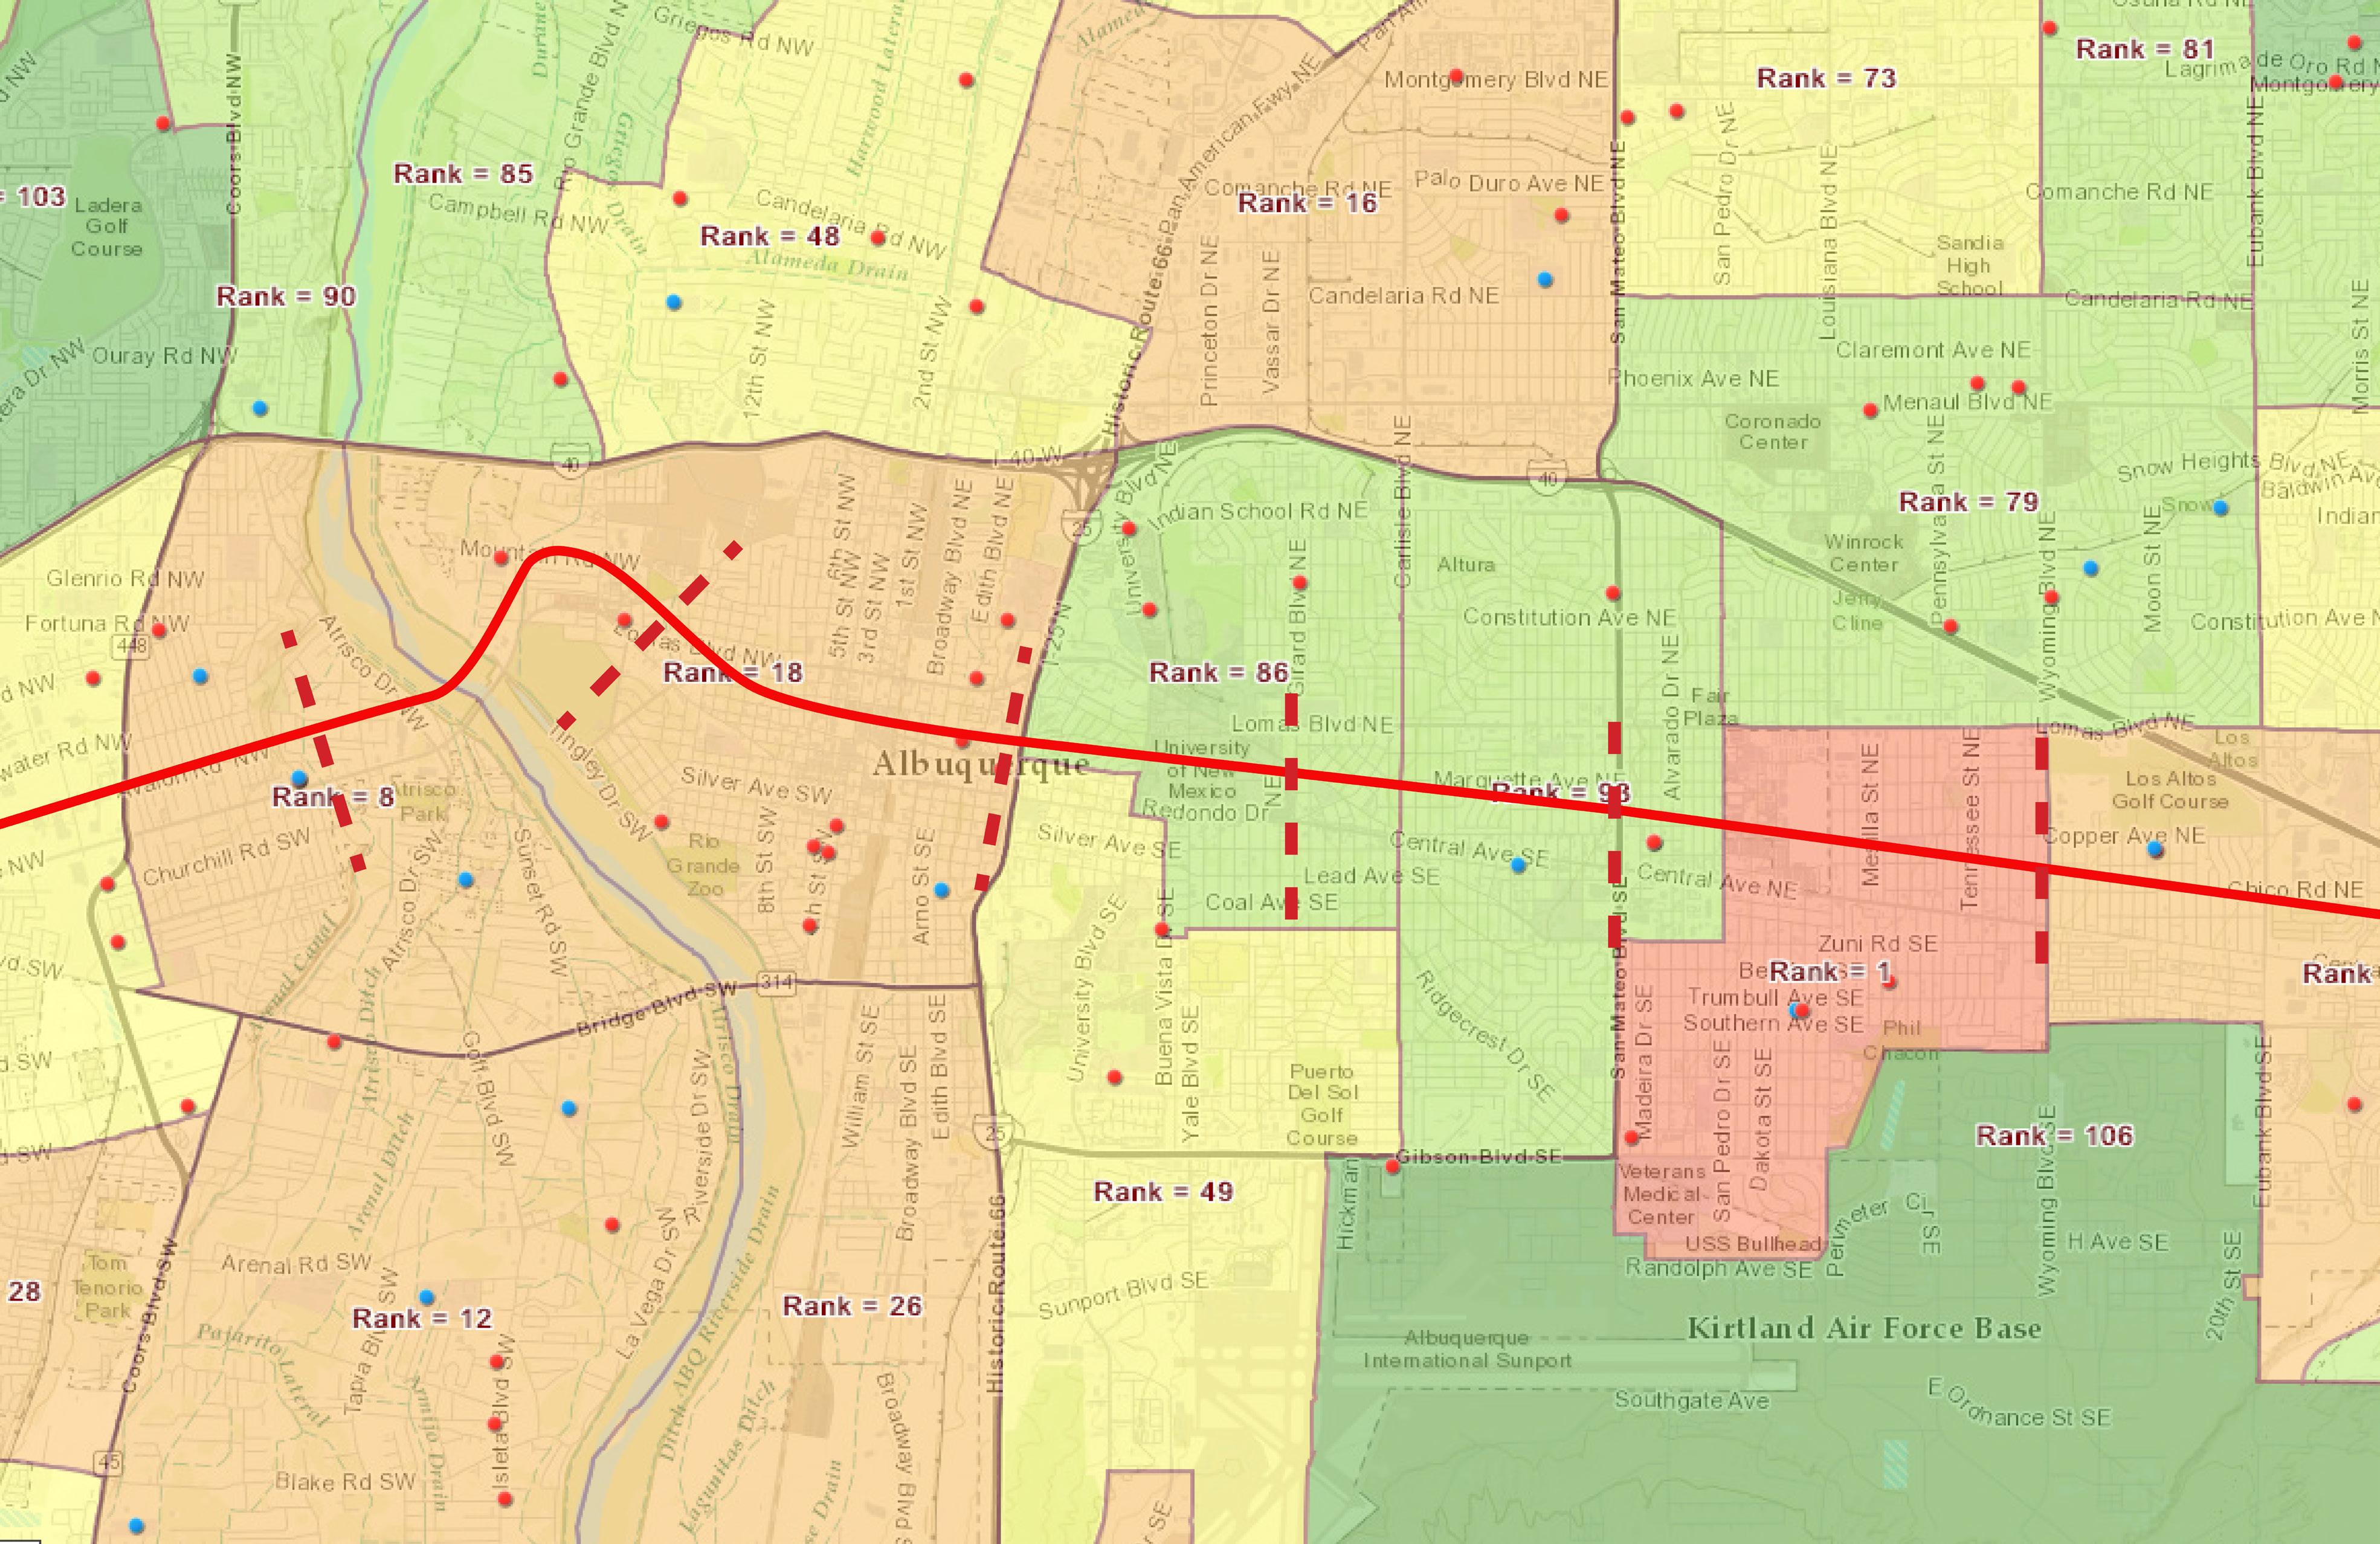
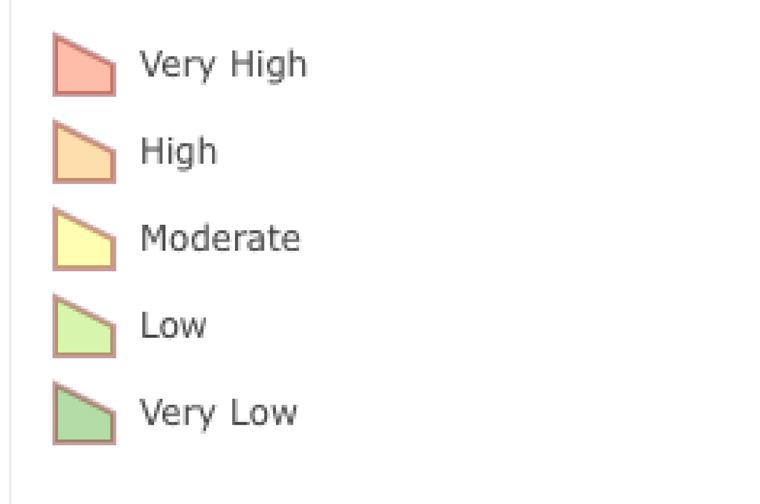
We start by reviewing the Healthy Communities Assessment Tool (HCAT), developed by US HUD for Albuquerque, as one of four cities piloting the online evaluation tool (HCAT 2016). Three of the five community areas (statistical Small Areas) abutting the ART line along Central Avenue fall into the “high priority” tier for intervention (ranking low among the 33 identified communities of Bernalillo County in social determinants). See Figure xx for comparison of priority areas by community.
• Central Coors W (Atrisco), #29 (high priority)
• Lomas Broadway (Old Town/Downtown), #28 (high priority)
• Lomas Girard NE (University), #10 (low priority)
• Lomas San Mateo NE (Nob Hill), #17 (medium priority)
• Central Pennsylvania NE (Louisiana), #32 (high priority)
These stops are not scheduled for infrastructure improvements in phase 1:
• S Ninety-Eighth W
• Gibson University SE, #22 (medium priority)
• Central Tabo SE
The Nob Hill and University areas perform strongest in the HCAT among the Central corridor communities, at #10 (low priority) and #17 (medium priority) respectively. That said, both neighborhoods score and rank low in two domains: housing and exposure to environmental hazards.
The Atrisco, Old Town, and International District communities, however, rank at the bottom of Albuquerque’s 33 neighborhoods in combined indicators for healthy communities. As such, they fall in the highest priority tier for intervention and improvements. HCAT indicators in all four focus communities rank low for housing, especially regarding age of housing and vacancy rates.
The Atrisco/west and Louisiana/ID communities rank low for Healthy Systems and Public Safety, citing the indicators of violent crime, school truancy, and low birth weight. UNM traffic study and the HIAP study also indicates high counts of pedestrian- and bicycle-involved vehicle crashes in the International District.
The ART bus rapid transit project promises improved transit reliability, capacity and quality along the Central corridor. In conjunction with new zoning regulations (the Integrated Development Ordinance or IDO), BRT service promises greater demand and opportunity for new development near the ART’s enhanced stations. Development activity will affect corridor neighborhoods differently. The Central Corridor Neighborhood Study aims to identify the unique opportunities and risks that TOD poses for each community, based on relevant previous studies, experience in other places, and the experience of local residents.
Using a combined health and equity framework, our analysis and recommendations seek to balance economic development goals with community benefits and stability for current residents and business owners. The research therefore, looks at social, economic, and physical conditions to establish baselines and project change. Furthermore, we incorporate community engagement (and community-based participatory research?) as a critical component in understanding the subject communities and co-creating solutions/recommendations.
The research phase focuses on information-gathering—from secondary sources (especially for socio-economic data and locating physical features), field work (to confirm secondary data), and interaction with community residents (through monthly Community Advisory Forums and interaction with key informants). The research focuses on risk and protective factors identified in the literature on TOD and social and environmental determinants of health, along with associated health outcomes, as follows:
Socioeconomic risk and protective factors:
• Educational Attainment
• Household Income / Poverty
• Race / ethnicity
• Immigration status
• Gender
Environmental risk and protective factors:
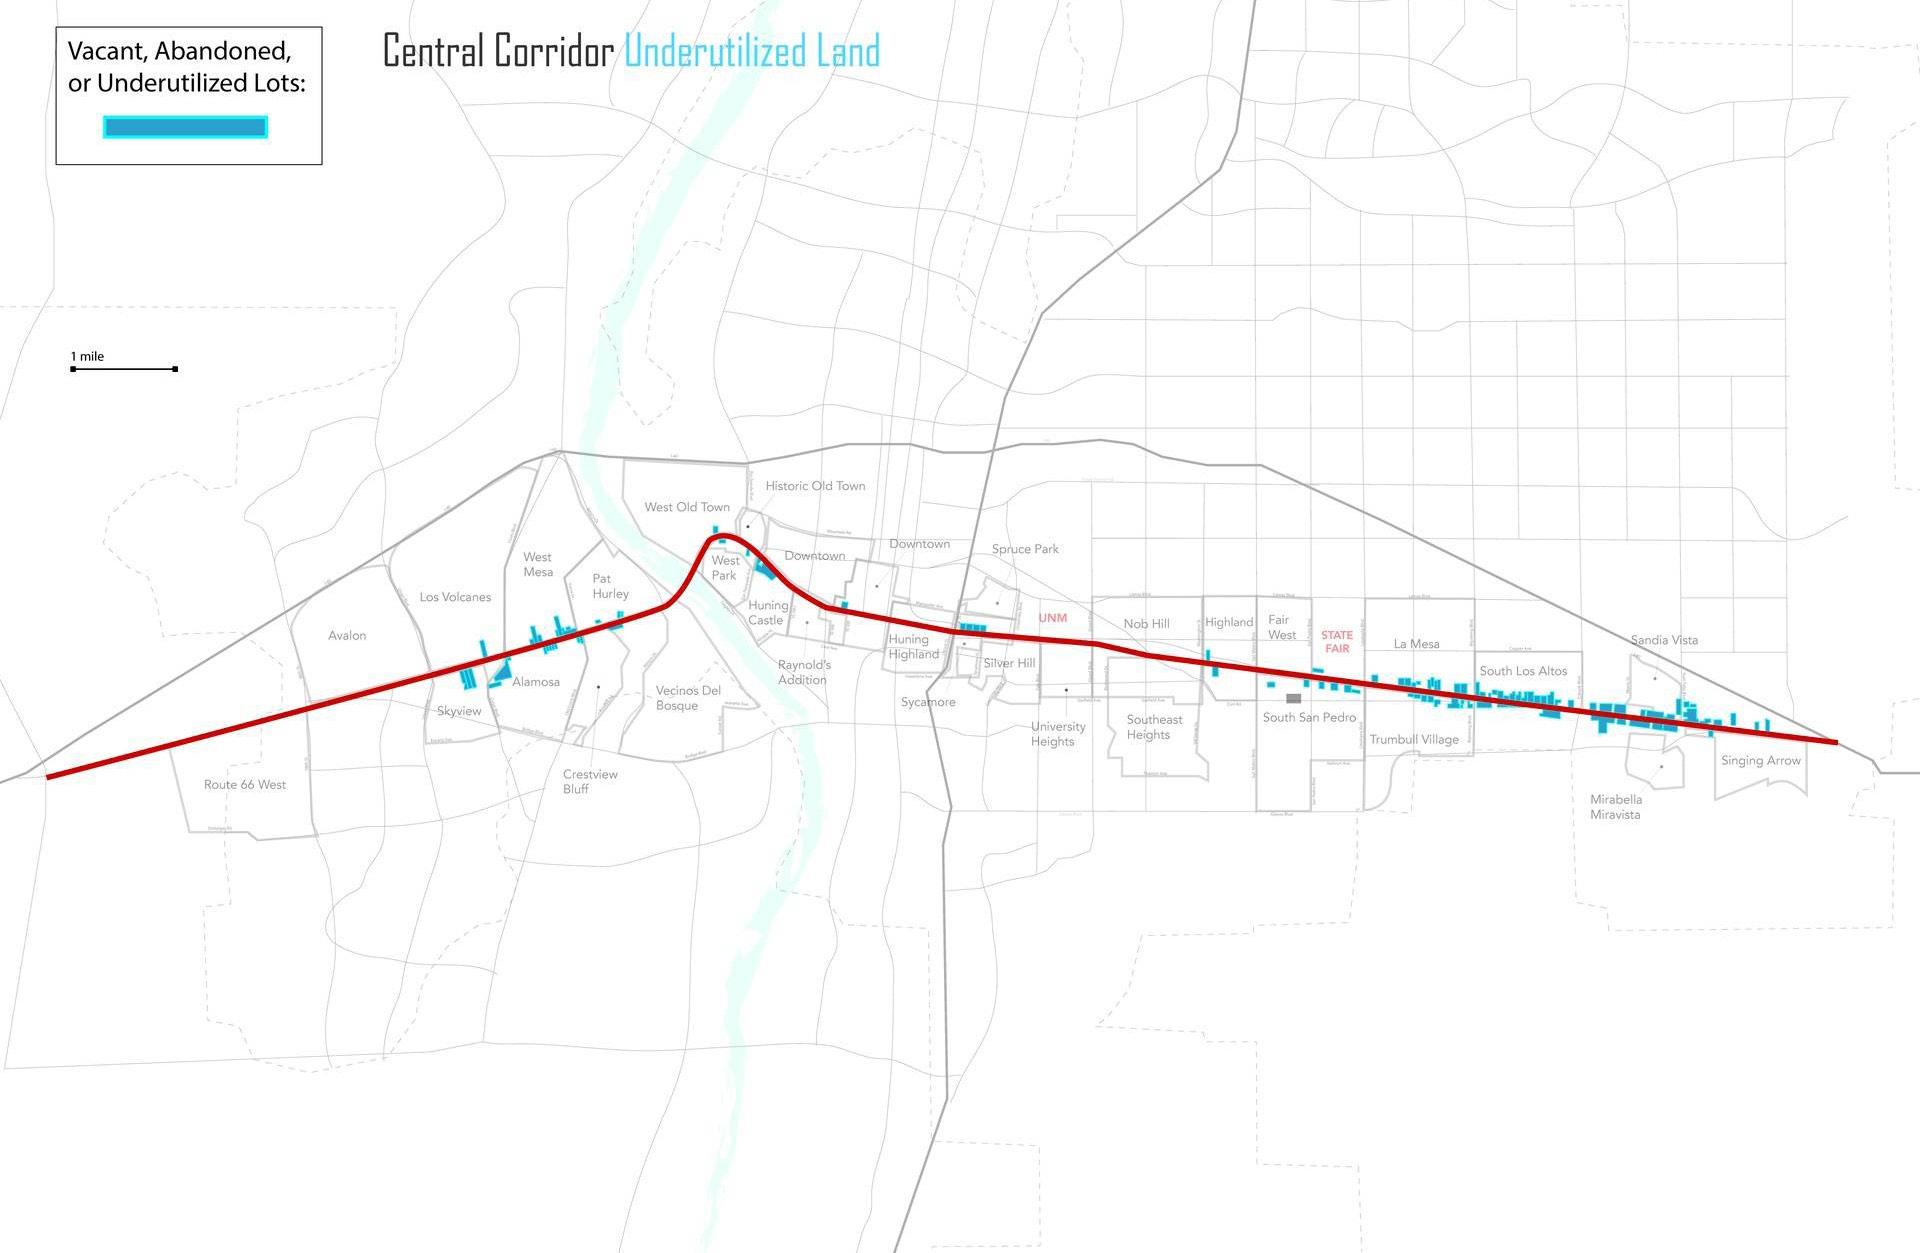
•Vacant and underutilized properties
• Housing quantity, quality, and affordability
• Public spaces and community/cultural facilities
• Public safety and perceptions of safety
• Infrastructure for active recreation and transportation
• Accessibility of goods, services, and healthy food
• Life Expectancy
• Childhood Asthma
• Chronic Disease Deaths
• Vehicle Crashes, Pedestrian and Bicyclist Injuries
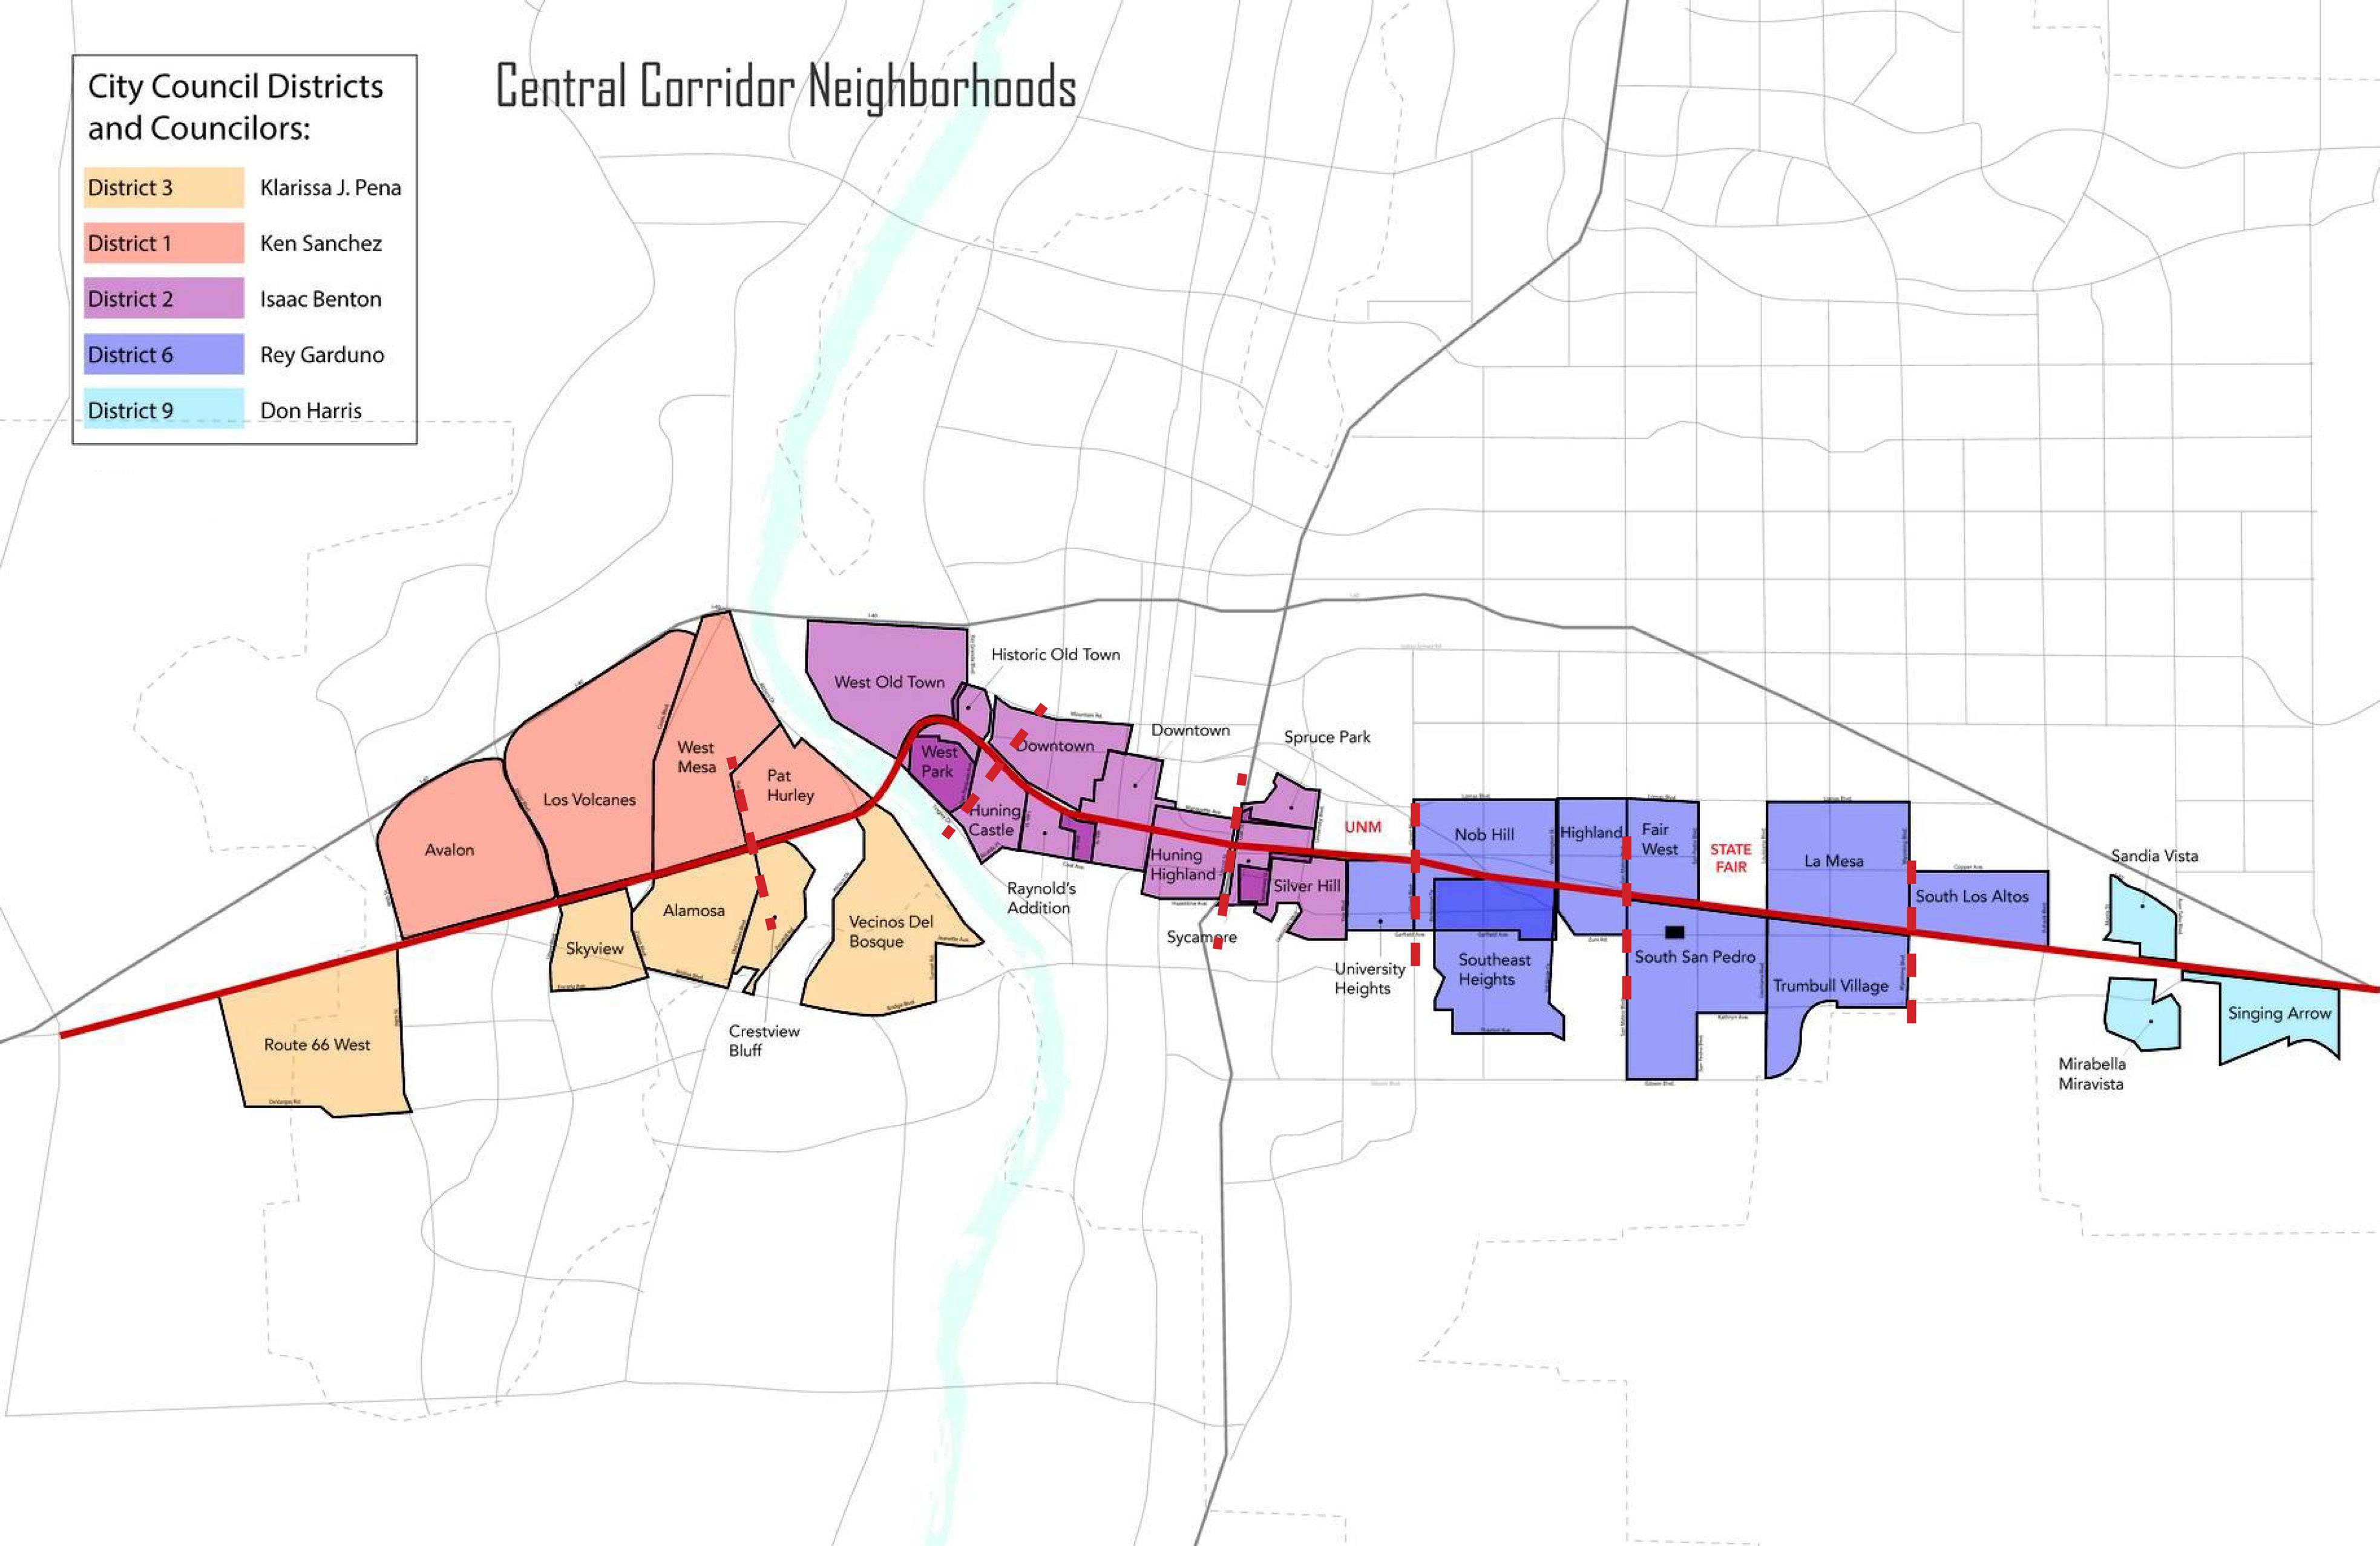
The Albuquerque Rapid Transit (ART) project will replace and improve the existing RapidRide service along Central Avenue. Construction and streetscape improvements in the initial phase is focused along Central from Coors on the west side to Louisiana on the east side, and along Louisiana to Uptown. It touches or runs through four city council districts, five zip codes, twenty-two recognized neighborhood associations, and thirty census tracts. These census tracts are also grouped into six statistical small areas. These geographies correspond to different research activities and methods, and are used differently in subsequent action—whether community-based action, public investments, regulation, etc.
Census Tracts: primary geography for gathering and collecting socioeconomic data from secondary sources, which come primarily from the US Census American Community Surveys.

Source: NMCDC


Small Areas (multiple census tracts): some data is compiled and made publicly available only at this scale.
Zip Codes: rarely used
Neighborhood Associations and (City Council) District Coalitions (of neighborhood associations): primary geography for community outreach and engagement.
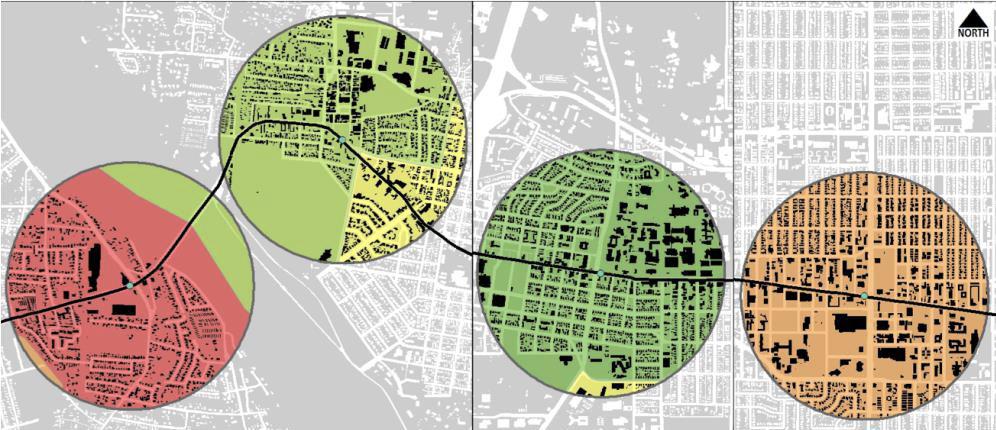
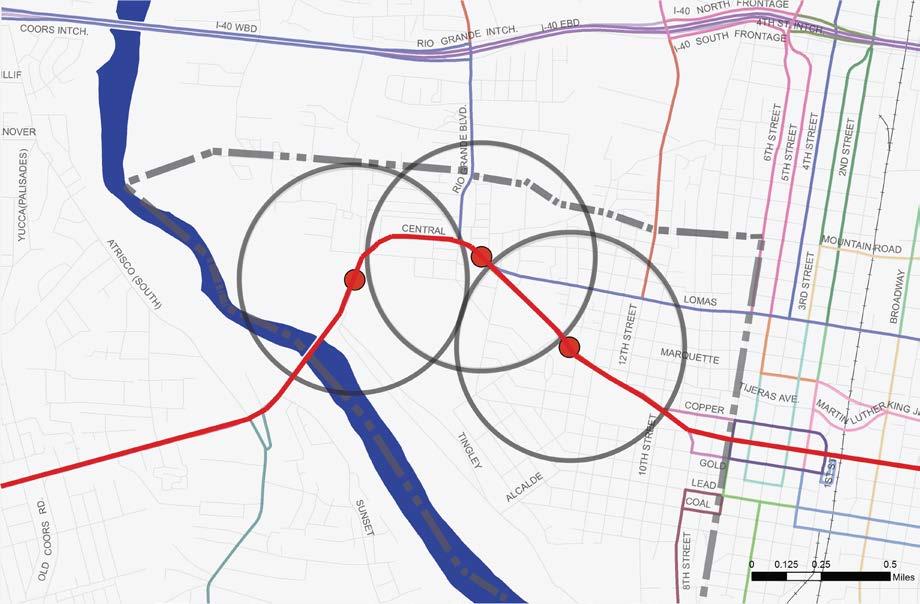
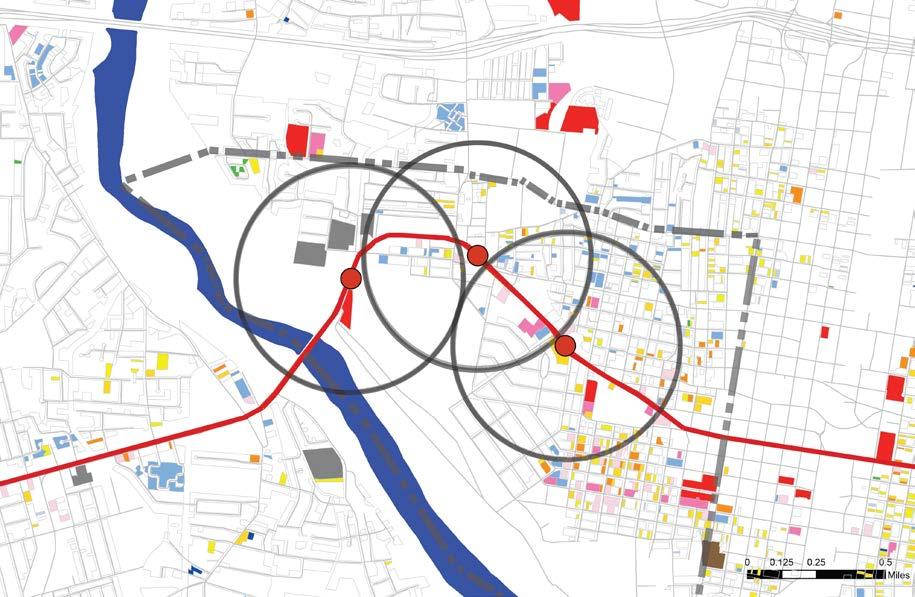
½ mile Radius around ART Station Stops: a focus for field observation and data collection and community-serving public investment recommendations.
¼ mile Radius around ART Station Stops: a focus for TOD recommendations.
Educational Opportunities
Employment Opportunities
Environmental Hazards
Health Systems and Public Safety
Housing
Social Cohesion
Michaele Pride, Prof of Architecture, PI
Sara Osborne, LA
Renia Ehrenfeucht, Prof of CRP
Serge Martinez, Assoc. Prof of Law
Jamal Martin, Assoc. Prof of Population Health
Alex Webb, Asst. Prof of Architecture
Jessica Carr, MS Arch student, Project Assistant
Nick DiDonato, MS Arch student, Project Assistant
Beth Elise Forman, MCRP student, Project Assistant
Cynthia Jacobs, MLA/HPR student, Project Assistant
Cecilia McKinnon, AmeriCorps VISTA
Tom Scharmen, NM Dept. of Health
Mark Childs, Professor of Architecture
Moises Gonzalez, Asst. Prof of CRP
Catherine Harris, Asst. Prof of LA
Marcus Garcia, MCRP student
Brayra Lara, M Arch/MS Arch student
Dan Majewski, Urban ABQ
Jesus Rendon, M Arch student
Adrian Pinnecoose, MS Arch student
Kathleen Gygi, CRP graduate, evaluation specialist
Michael Hendrigsman,MS Arch student
Michelle Negrette, Strata Design
Brian Reilly, City of Albuquerque Dept of Economic Development
Alf Simon, Professor and Director of UNM Landscape Architecture
These issues and indicators are mapped on the following pages. As with the Community Portrait(s), our Corridor Context maps several key socioeconomic and environmental indicators, divided into eight domains, and show how these environmental and social factors vary along the corridor:
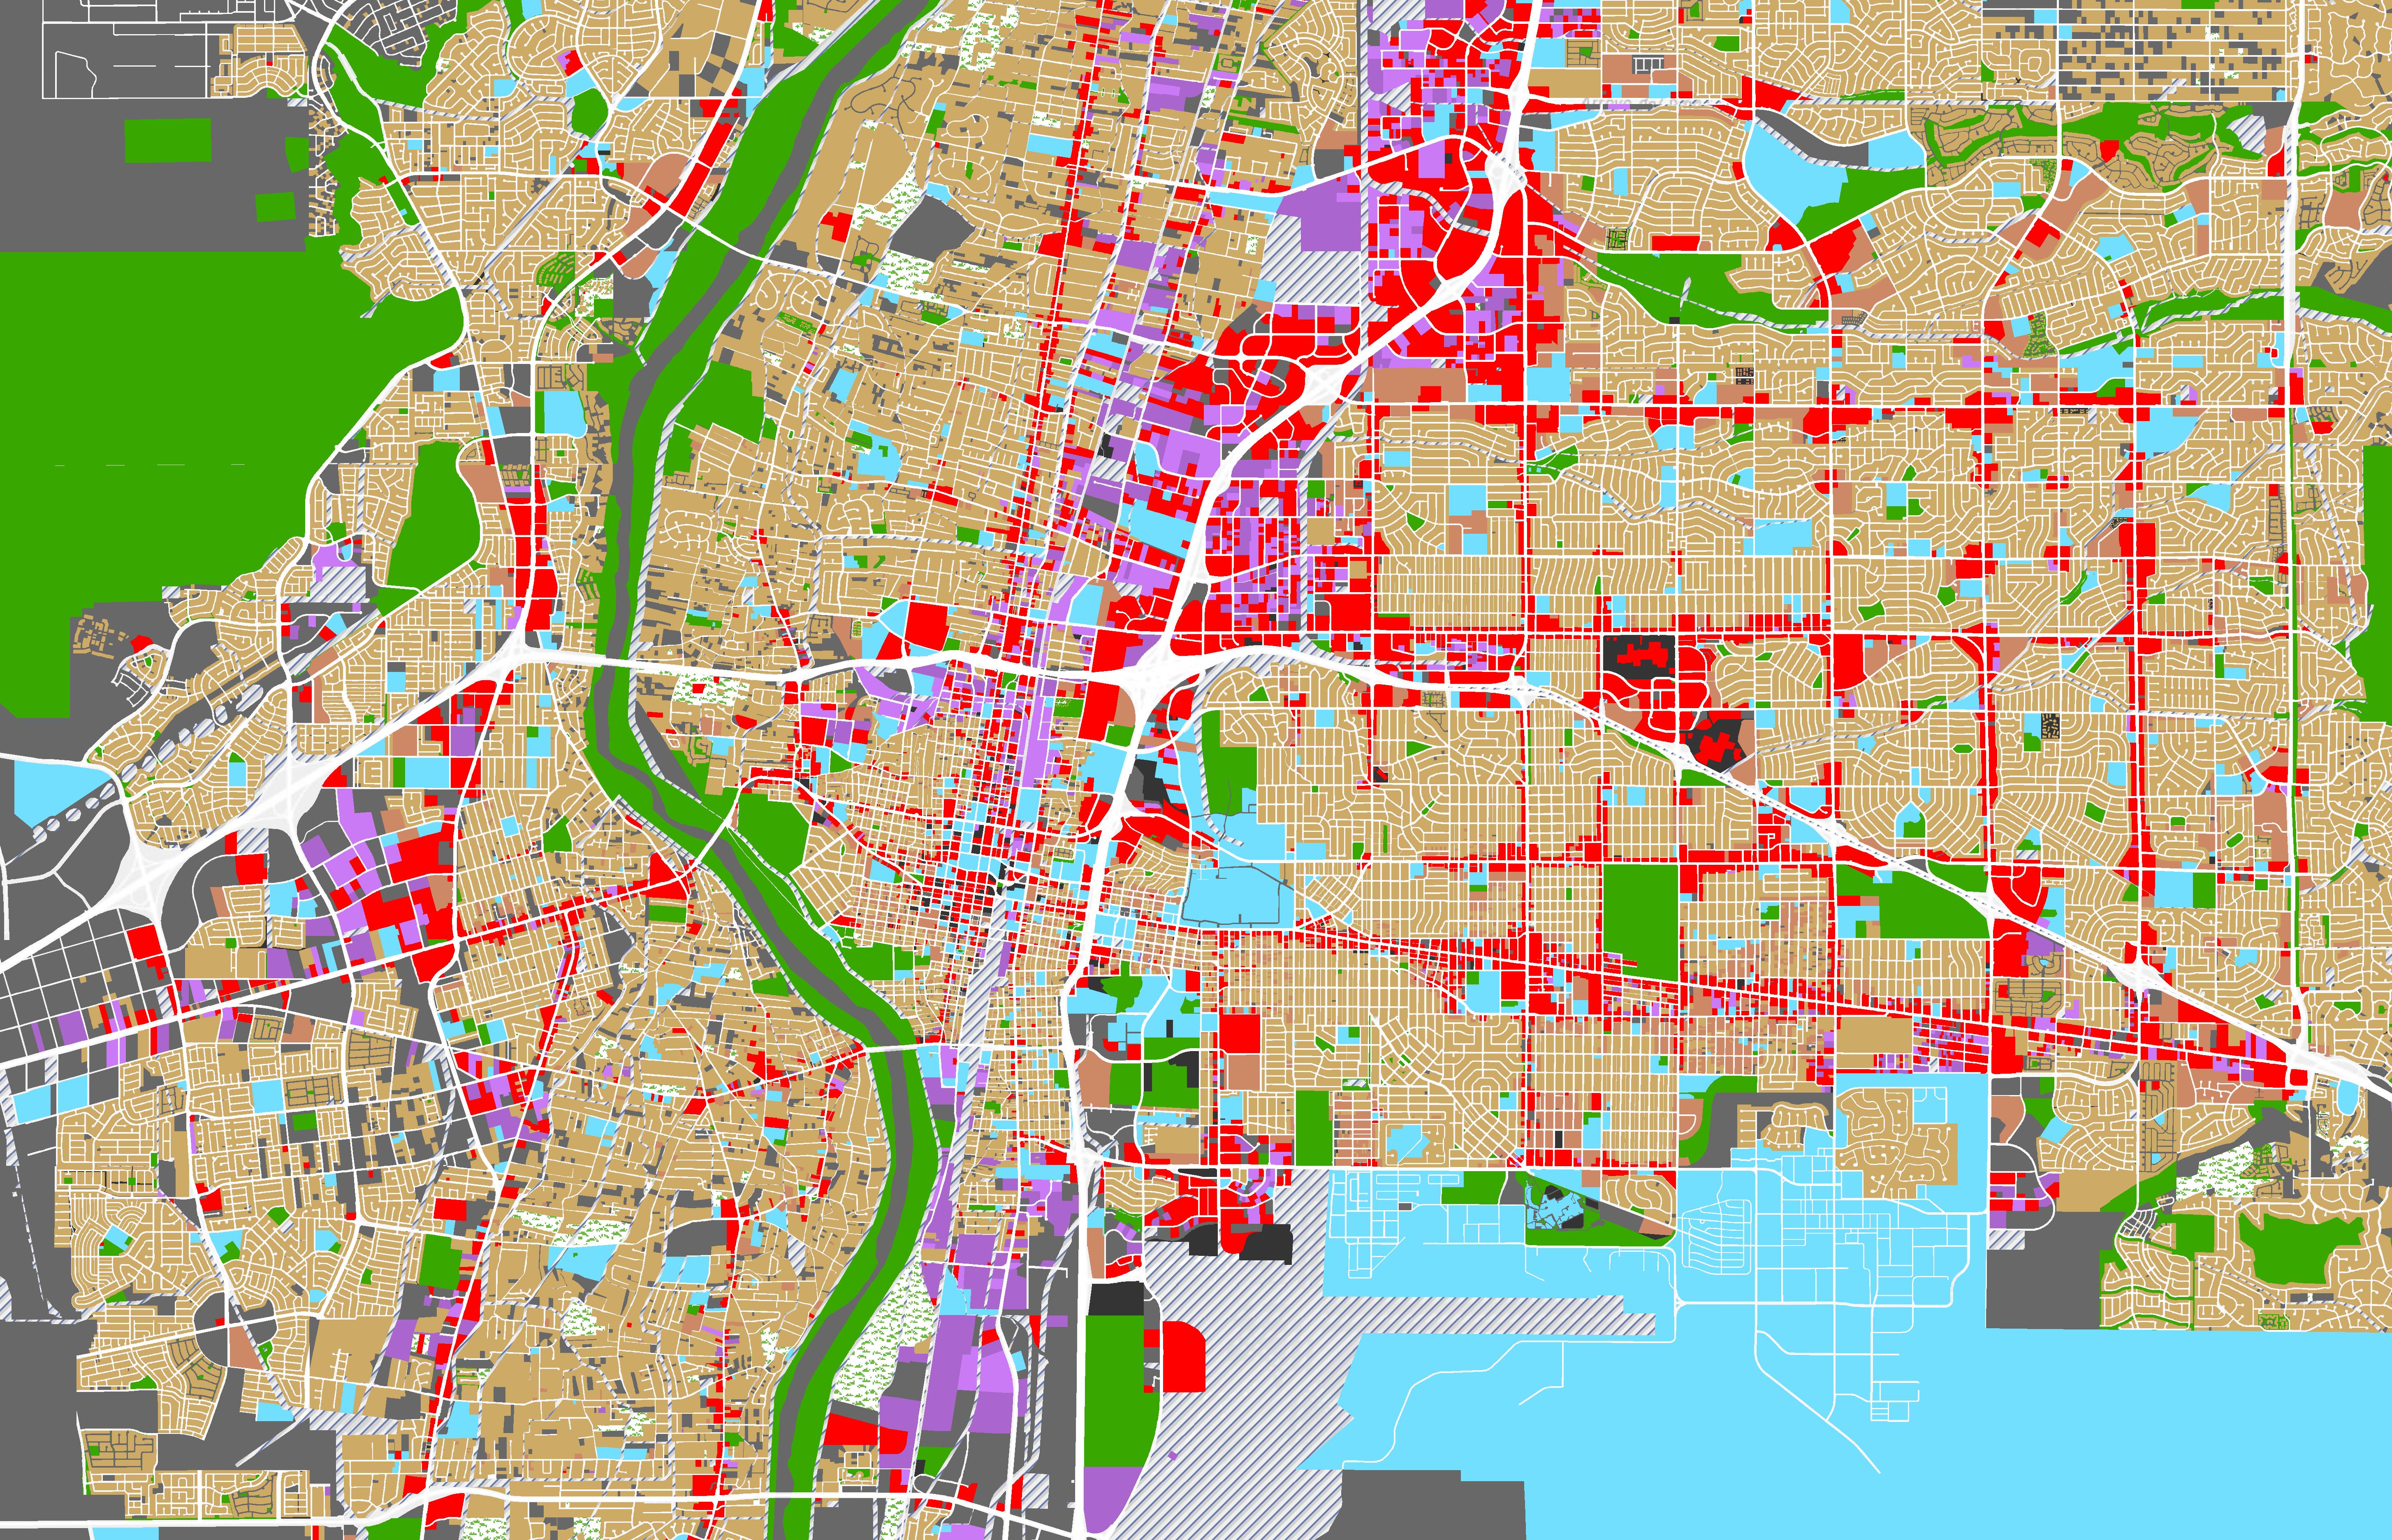
• Land Use
• Socio-Economic (including demographics and health outcomes)
• Transportation
• Residential
• Education
• Public Realm
• Food Access
• Environmental Quality
The Central Corridor Neighborhood Study by UNM

Source: Esri, HERE, DeLorme, OpenStreetMap and GIS contributors
Dated: DEC:2016

The Central Corridor Neighborhood Study by UNM
hill international district east gateway

ART Route Community Boundaries


Source: US Census Bureau, 2008-2012 American Community Survey
Dated: NOV:2016

The Central Corridor Neighborhood Study by UNM
international district east gateway

Source: NMCDC.com
Accessed: NOV:2016


SOCIO-ECONOMIC - Neighborhood Associations
The Central Corridor Neighborhood Study by UNM

Source: BICI: AGIS.com Accessed: JAN 2017


SOCIO-ECONOMIC - Albuquerque Council (Political) Districts
The Central Corridor Neighborhood Study by UNM
nob hill international district east gateway

Source: US Census Bureau, 2008-2012 American Community Survey Accessed: NOV:2016
ART Route Community Boundaries


The Central Corridor Neighborhood Study by UNM

ART Route Community Boundaries

The Central Corridor Neighborhood Study by UNM
nob hill international district east gateway

Source: NMCDC.com
Accessed: NOV:2016
ART Route
Community Boundaries
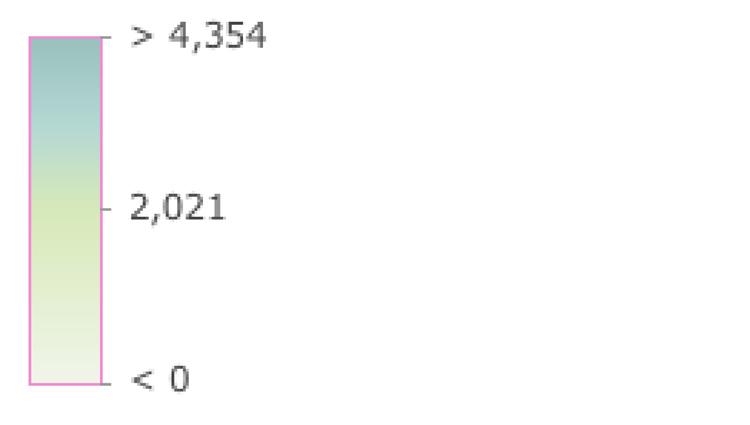
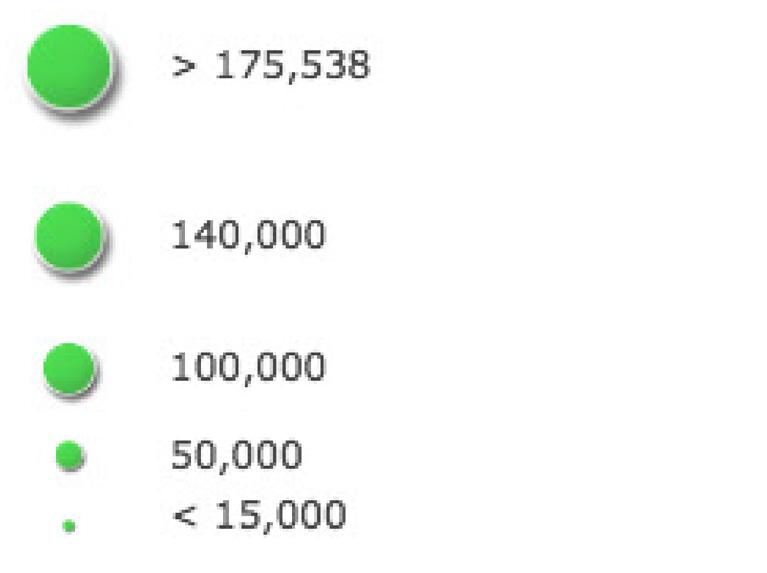
Population Density - persons per square mile 2014


The Central Corridor Neighborhood Study by UNM
international district east gateway

Source: NMCDC.com Accessed: NOV:2016

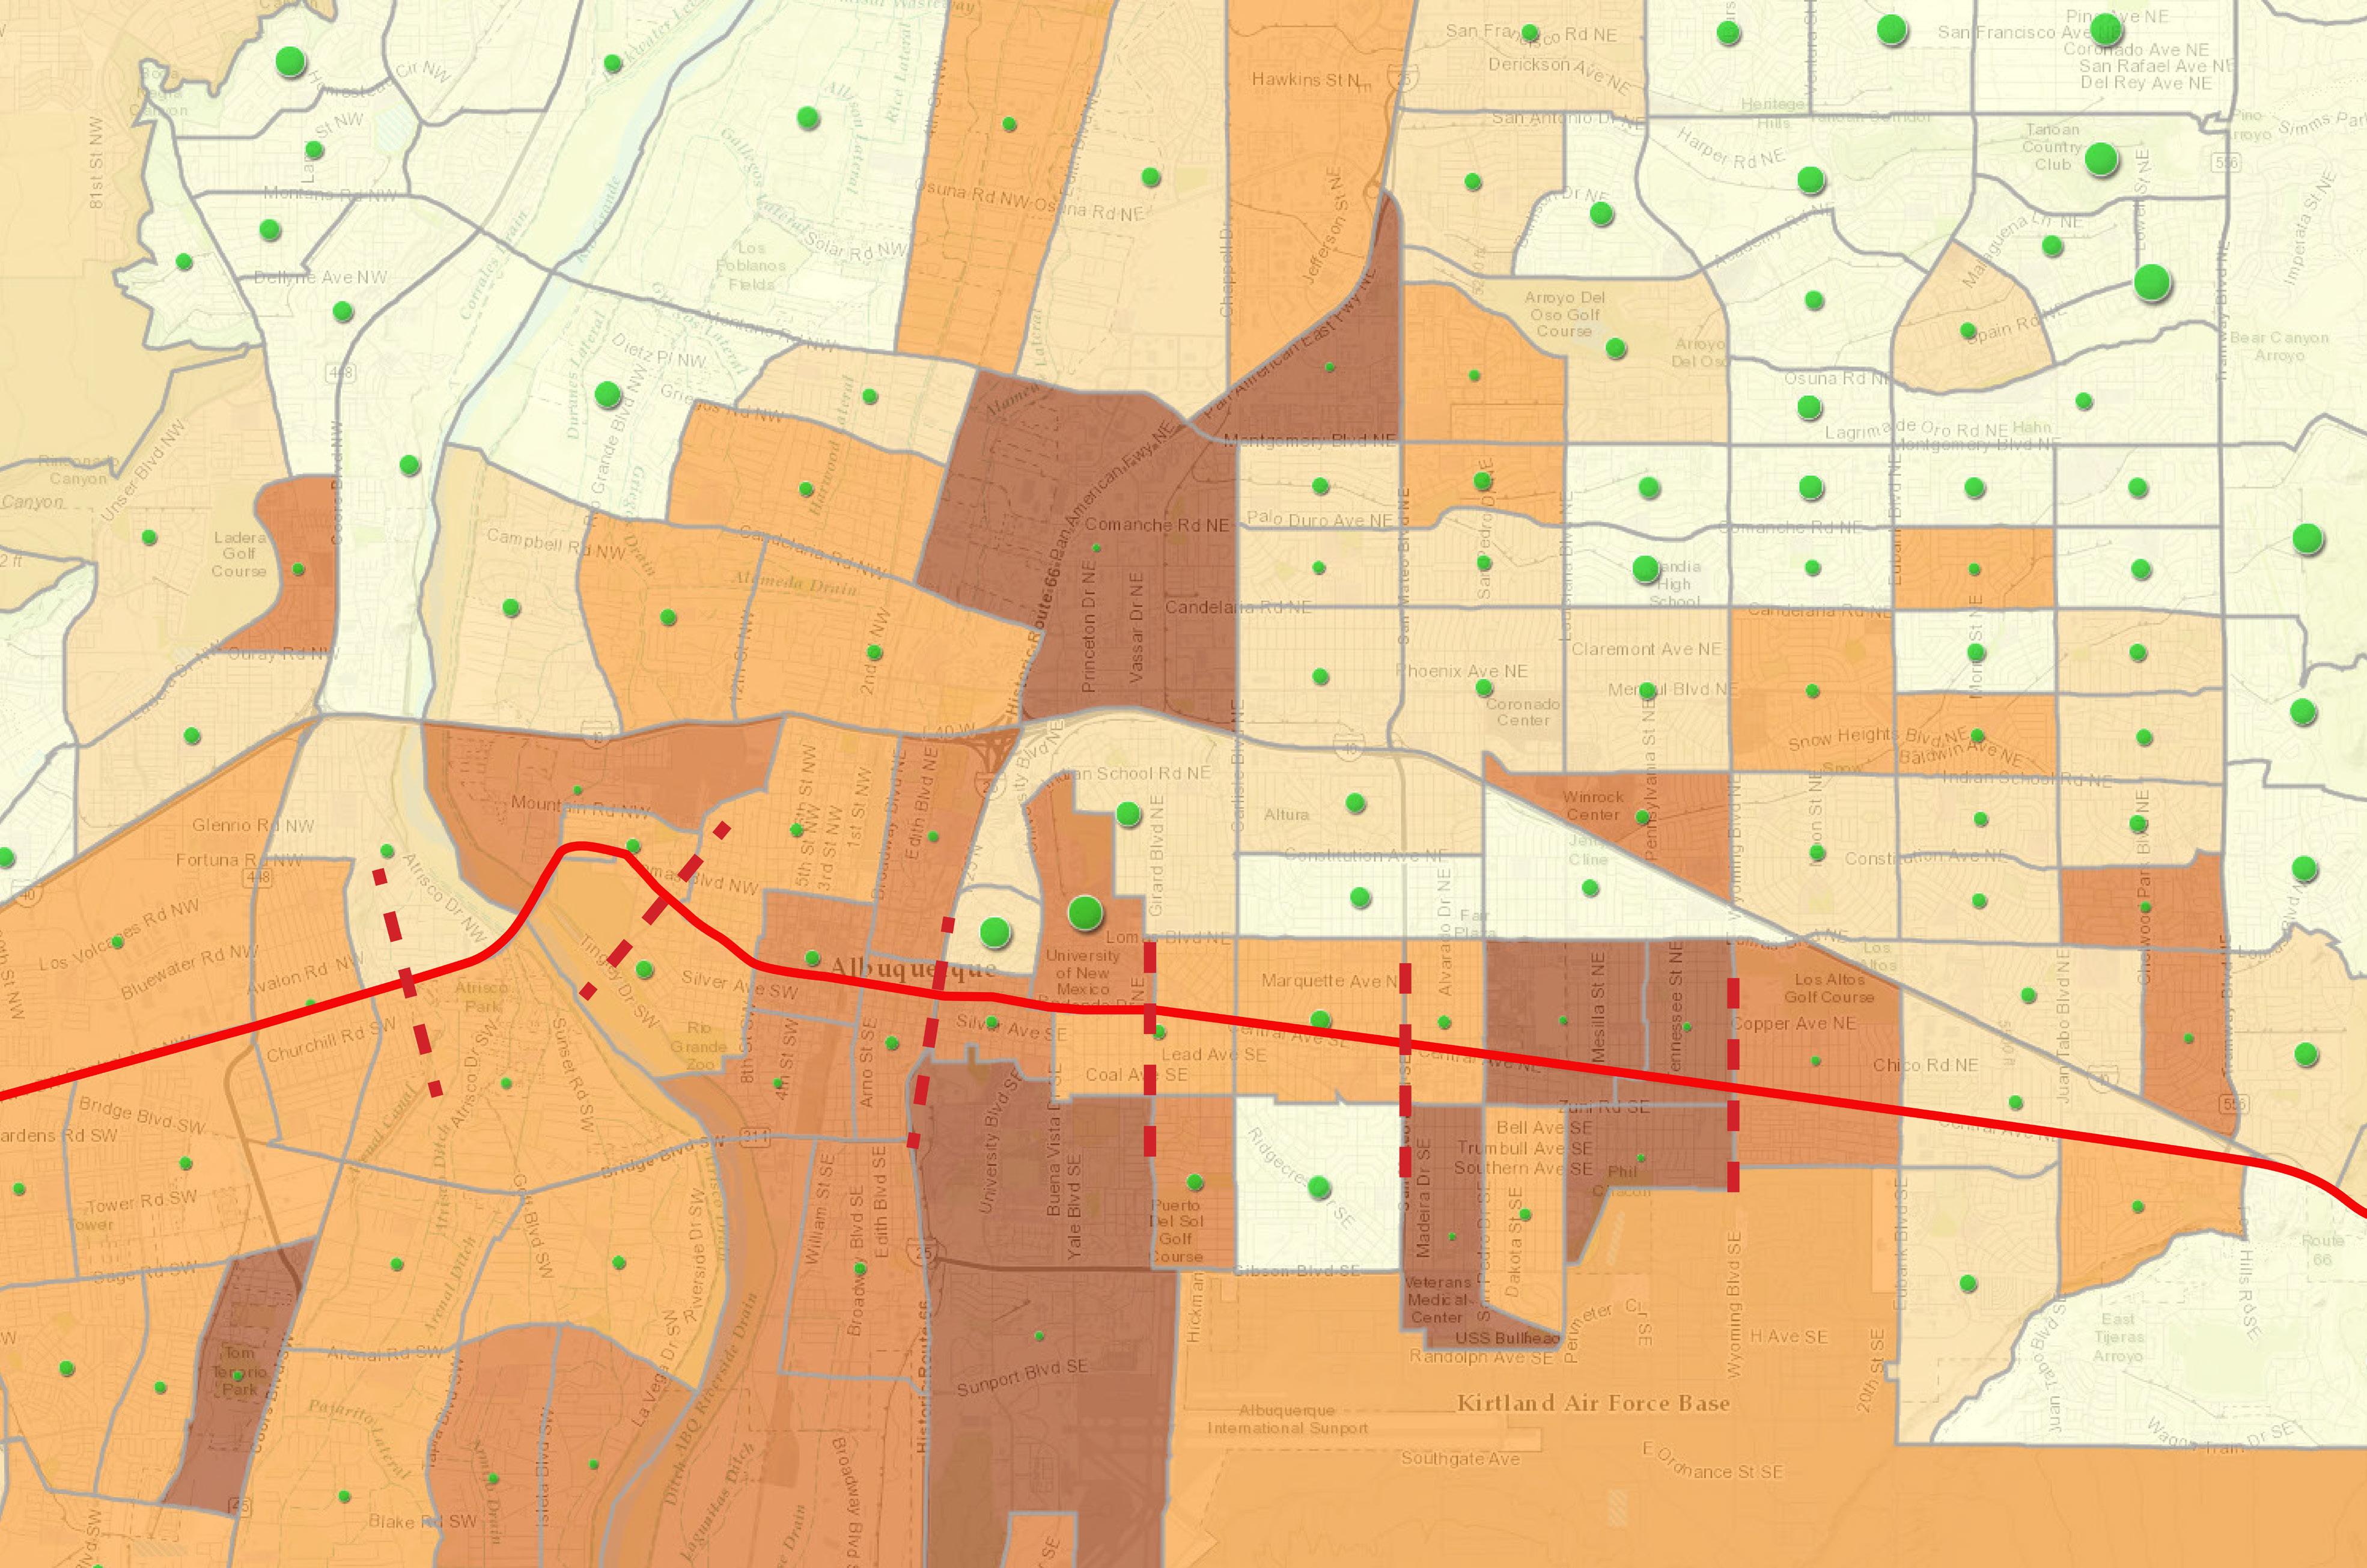
The Central Corridor Neighborhood Study by UNM
international district east gateway

Source: NMCDC.com Accessed: NOV:2016
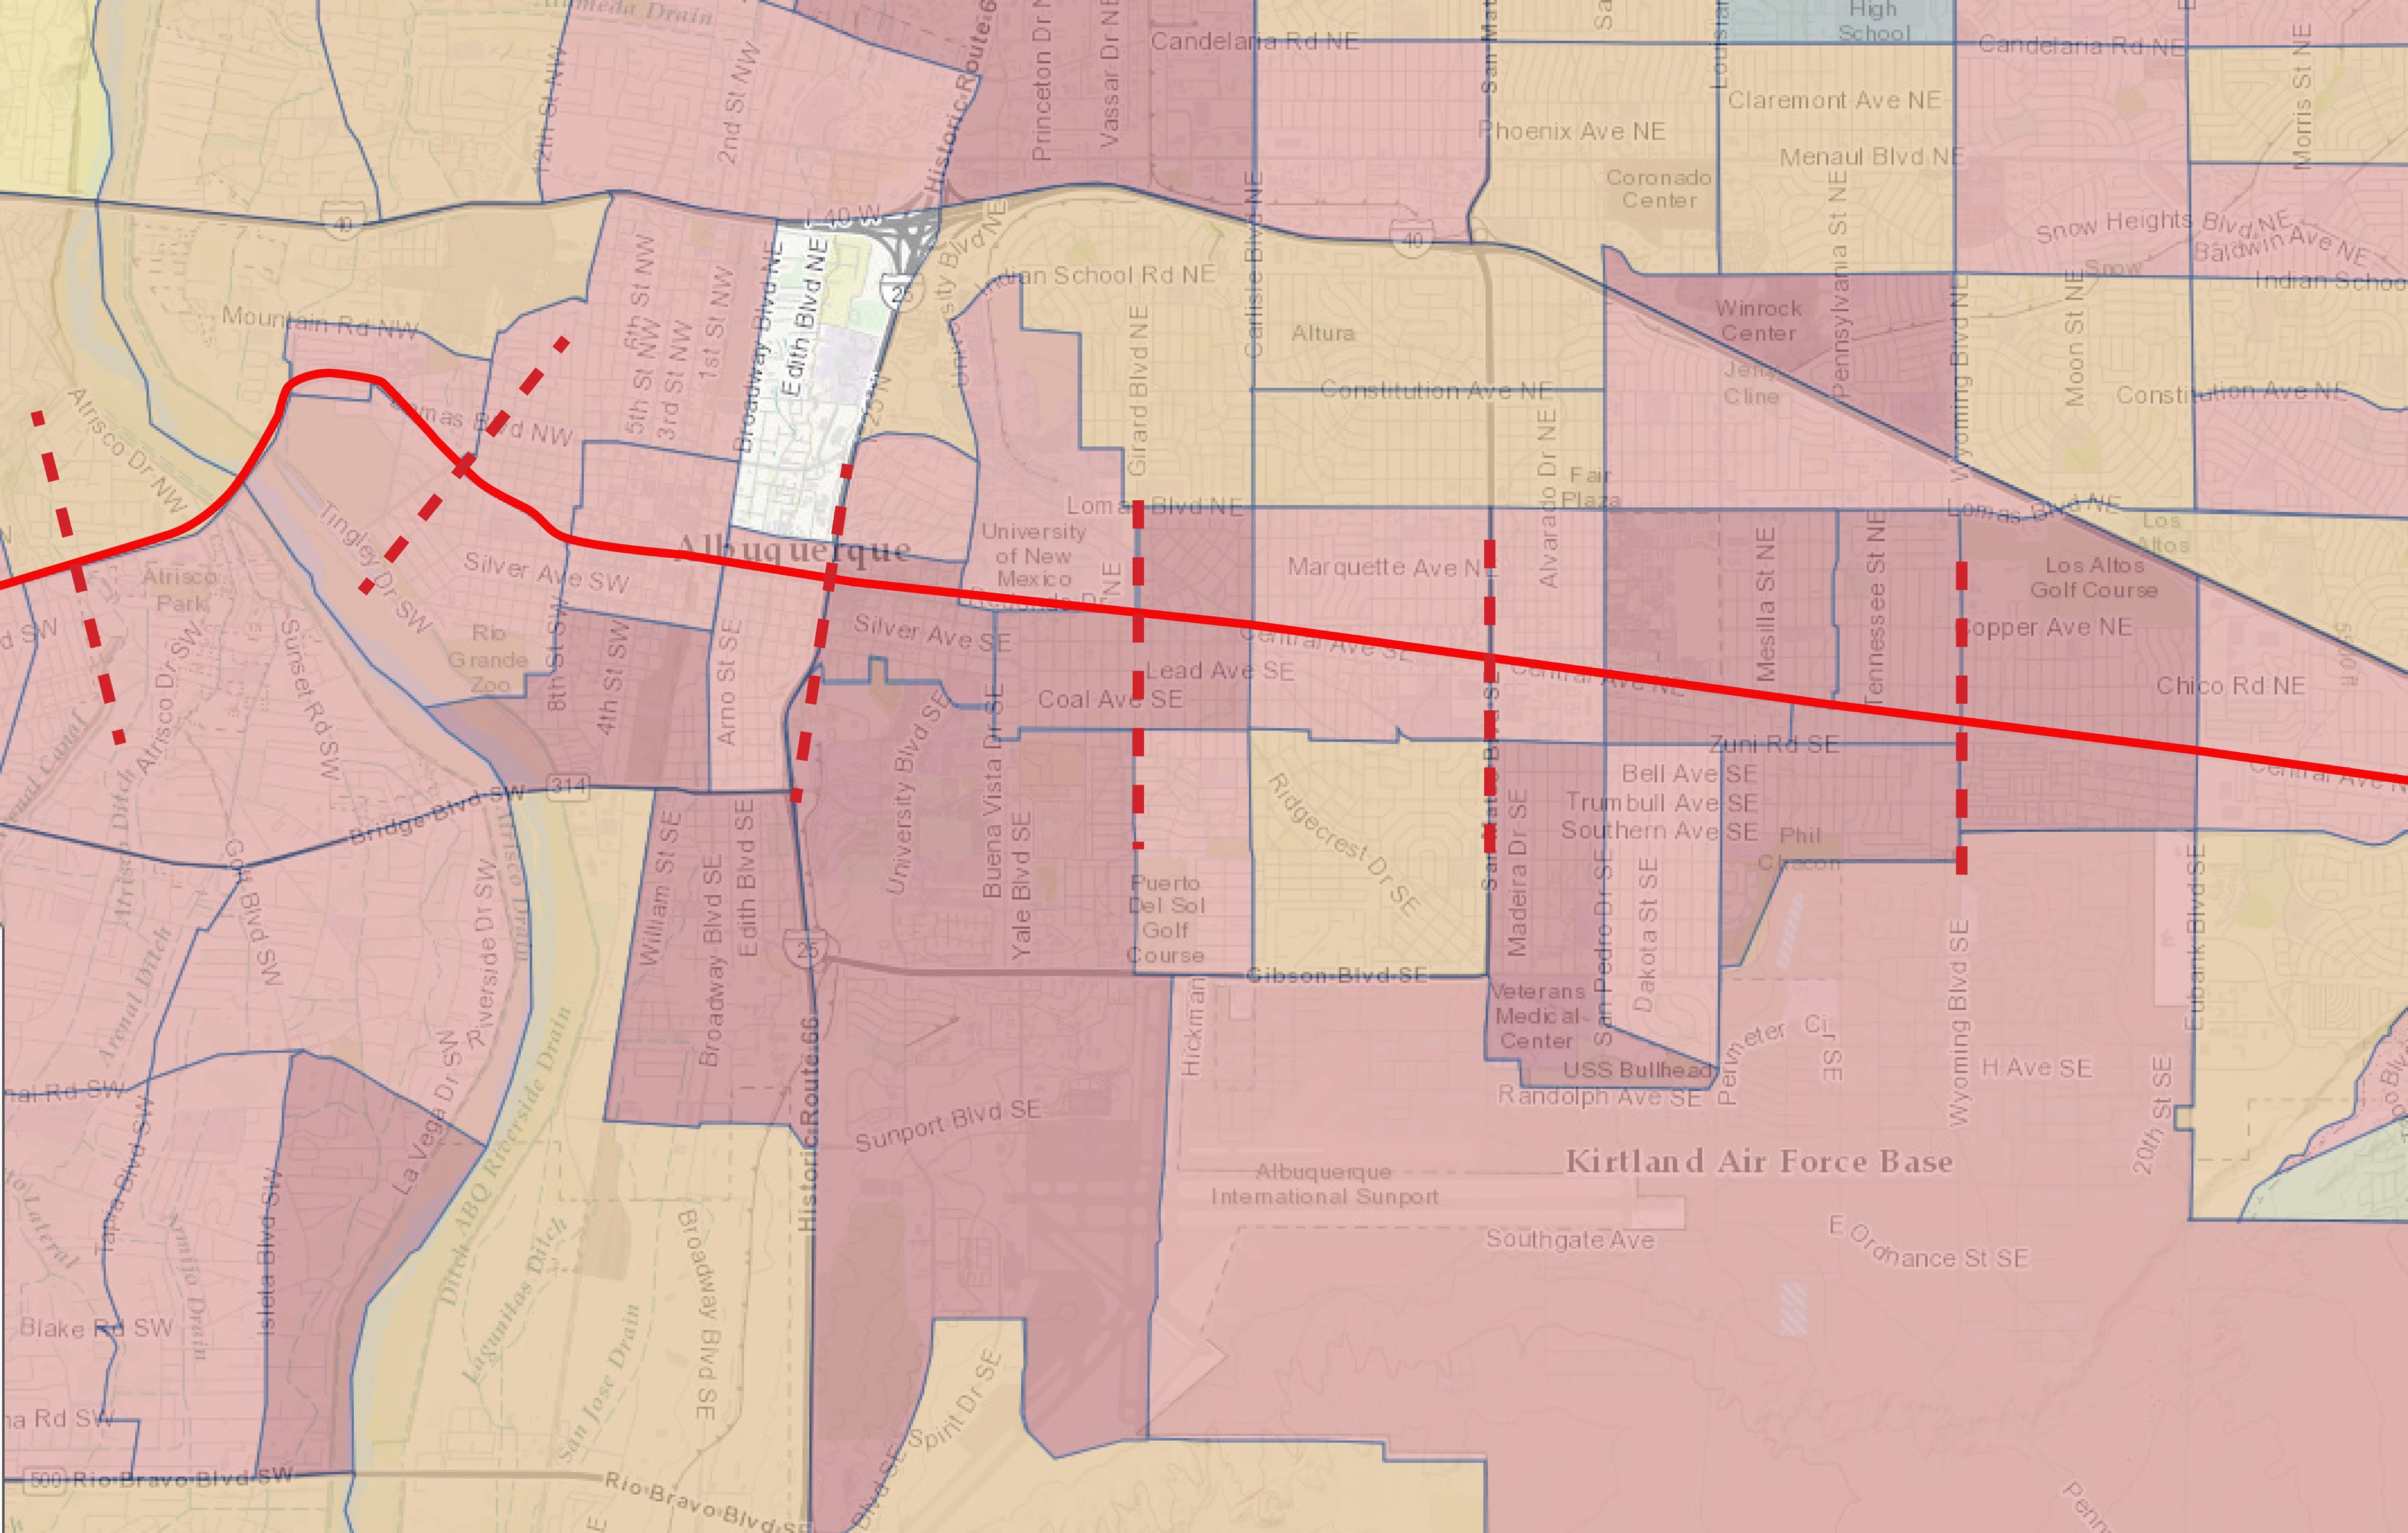
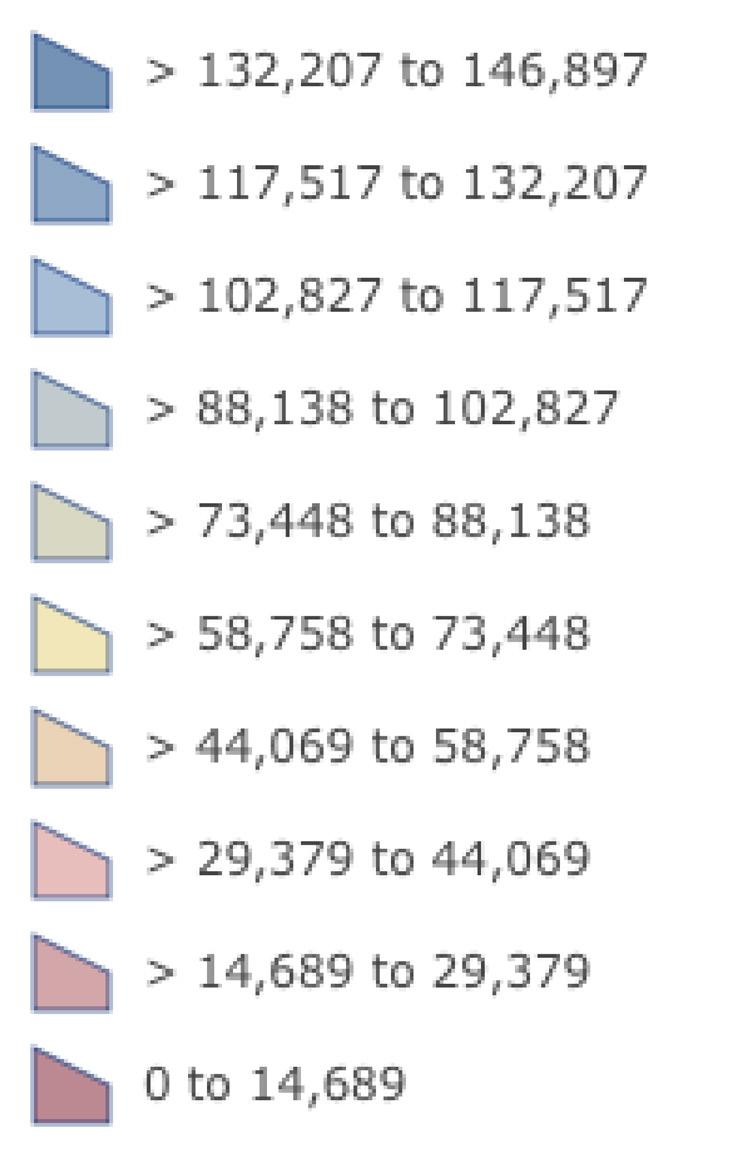
Median Family Income
% Persons Below Poverty Level


west central old town downtown university nob hill
The Central Corridor Neighborhood Study by UNM
international district east gateway

Source: NMCDC.com
Accessed: NOV:2016
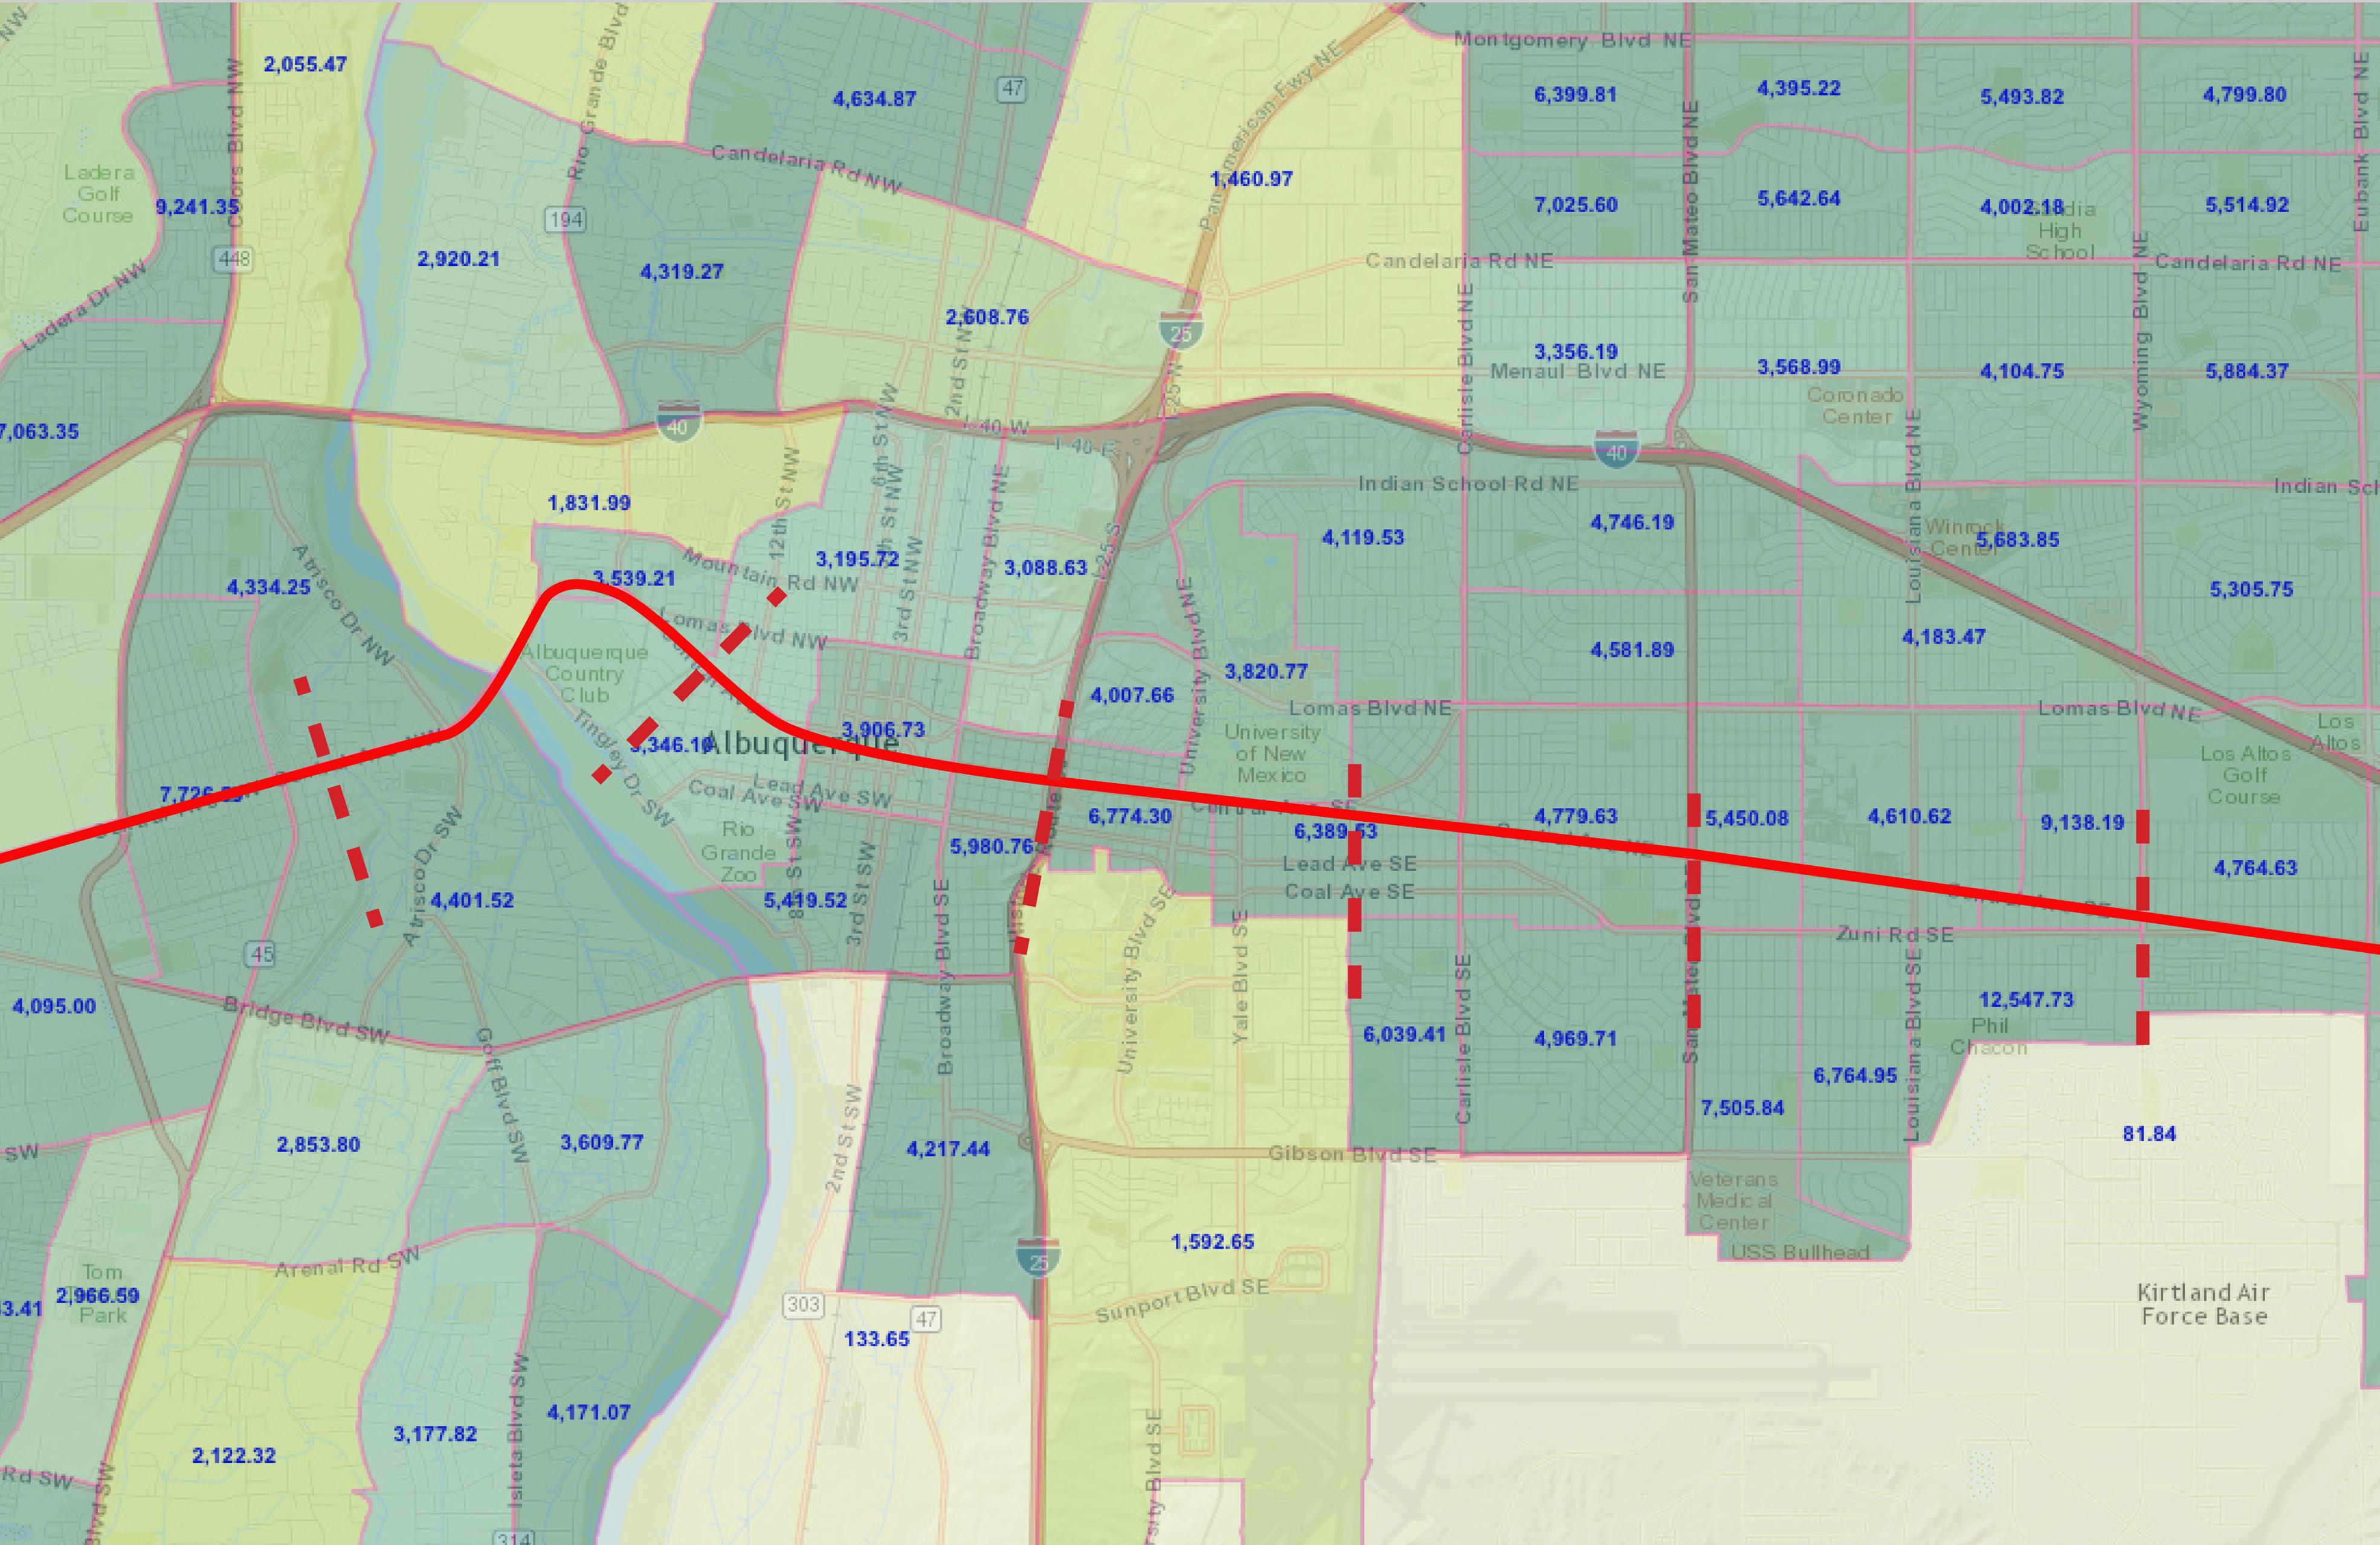
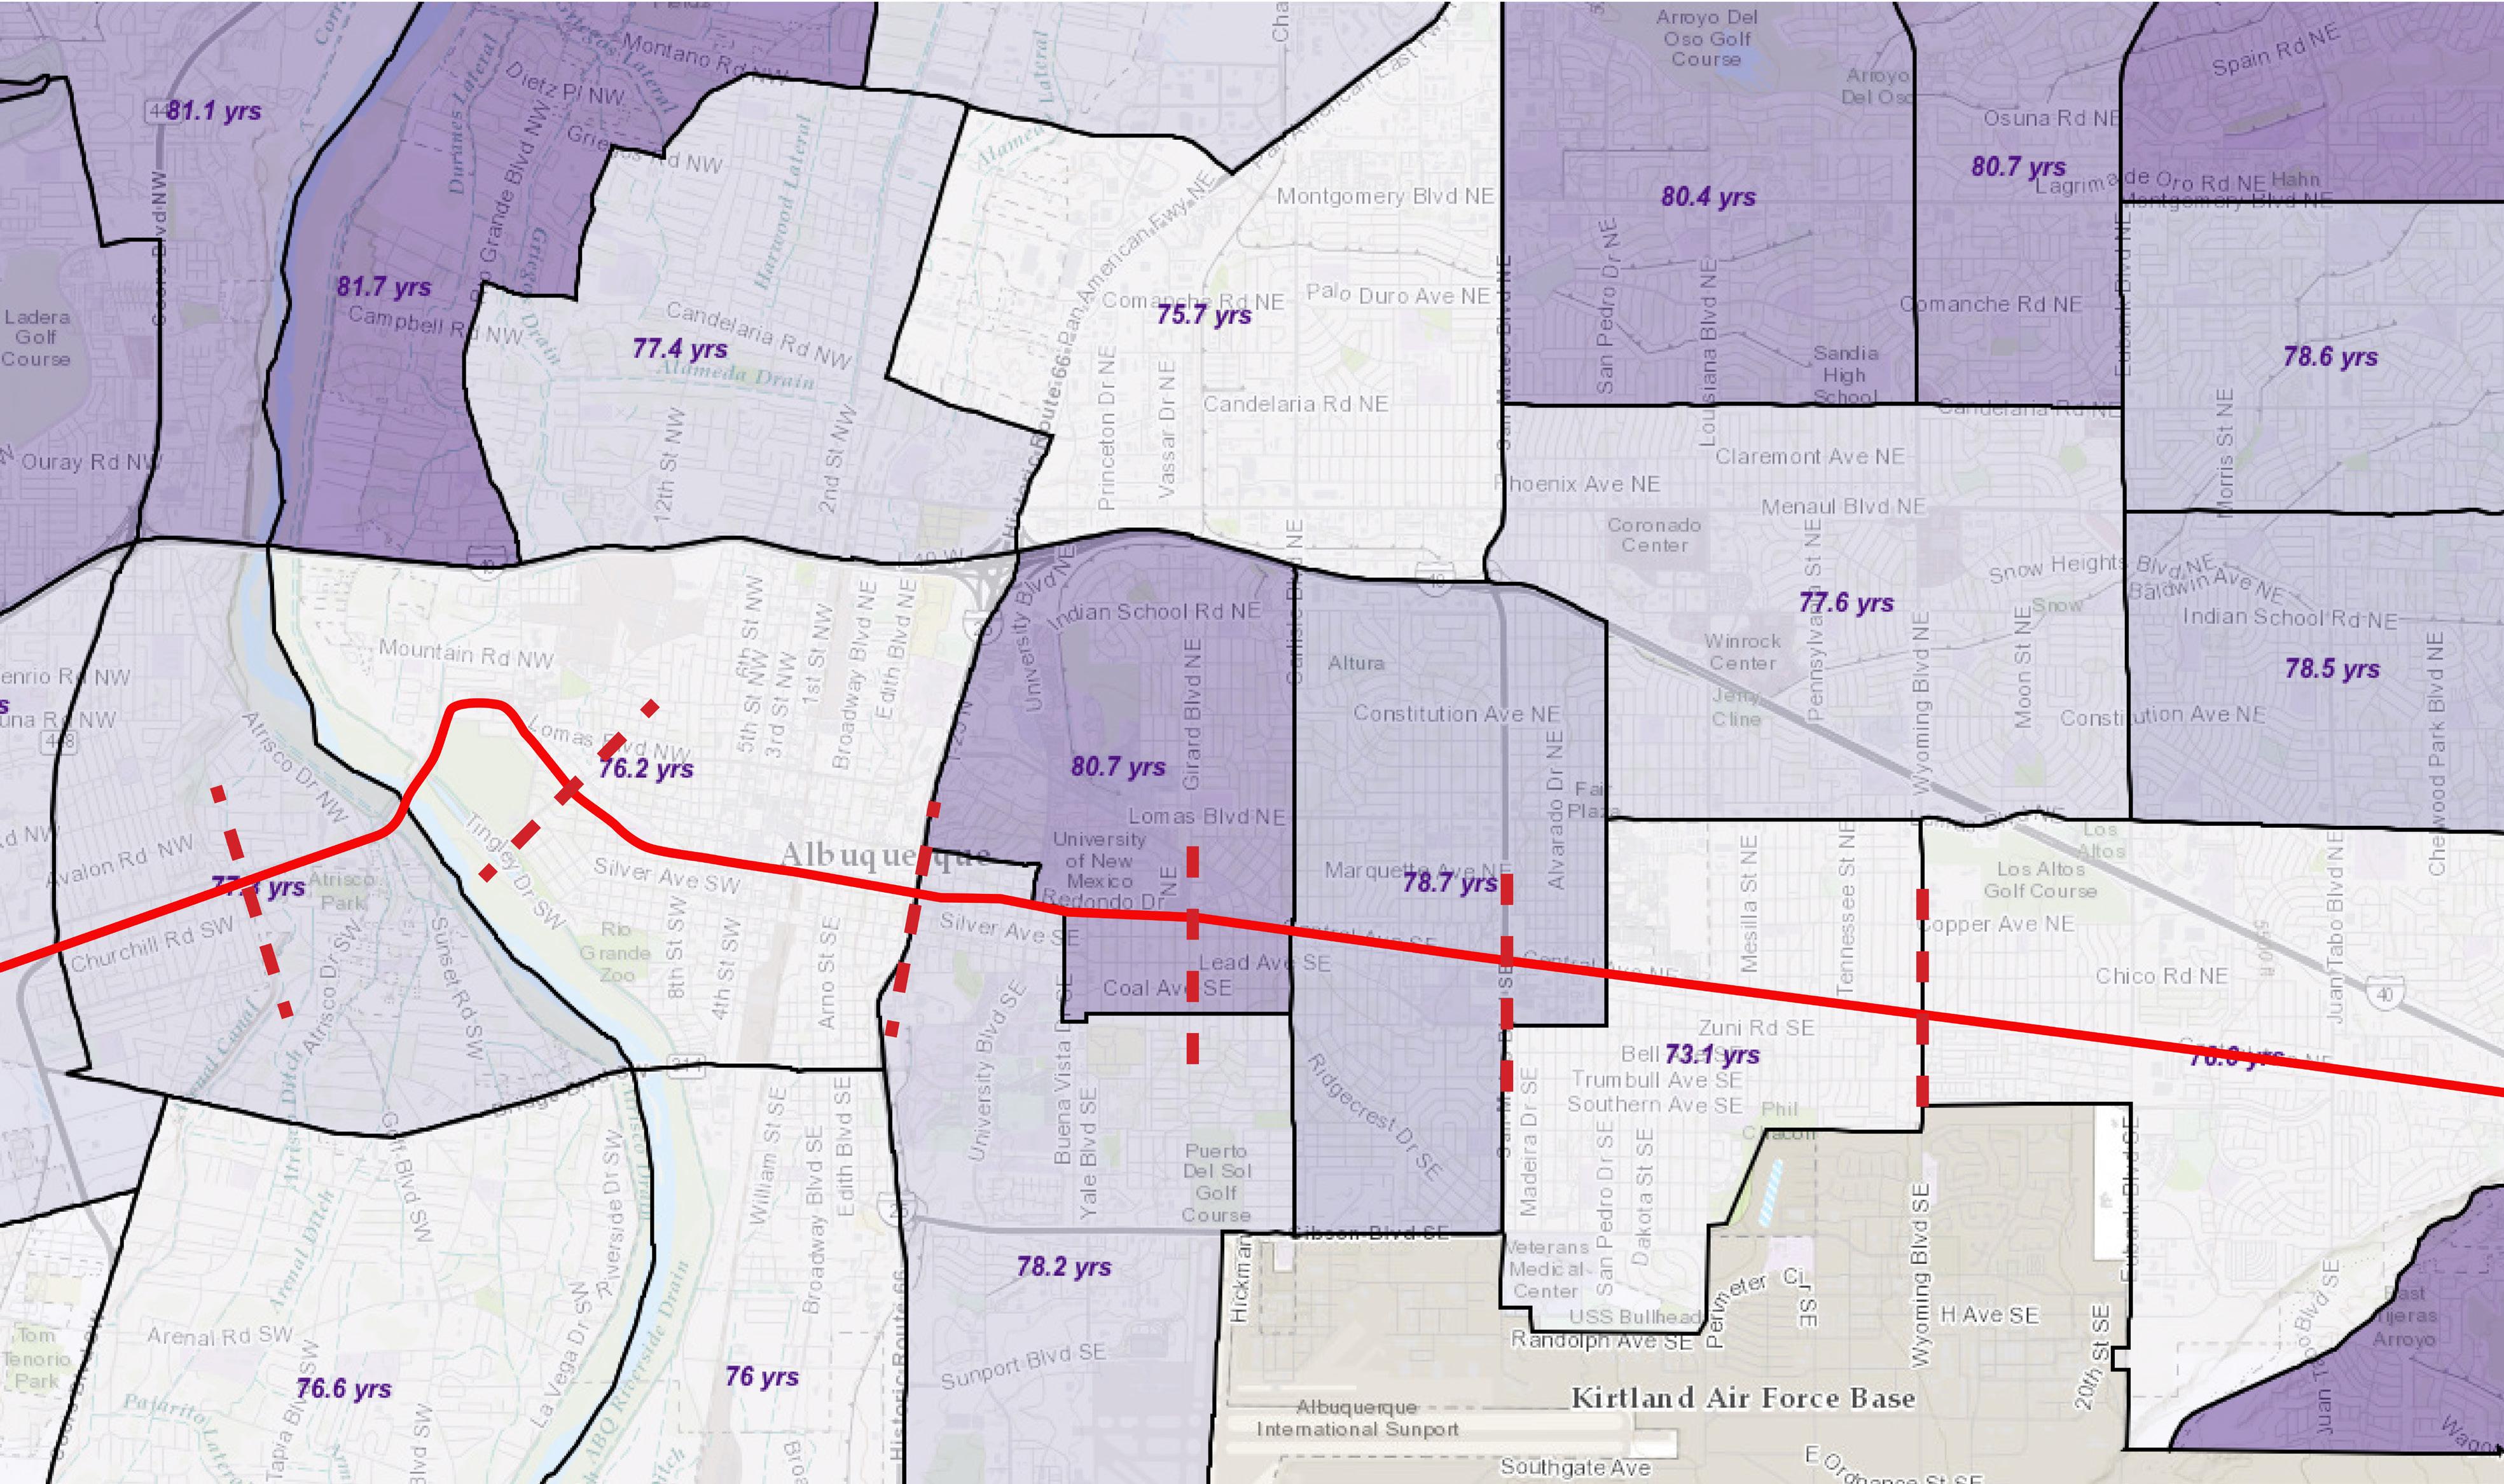
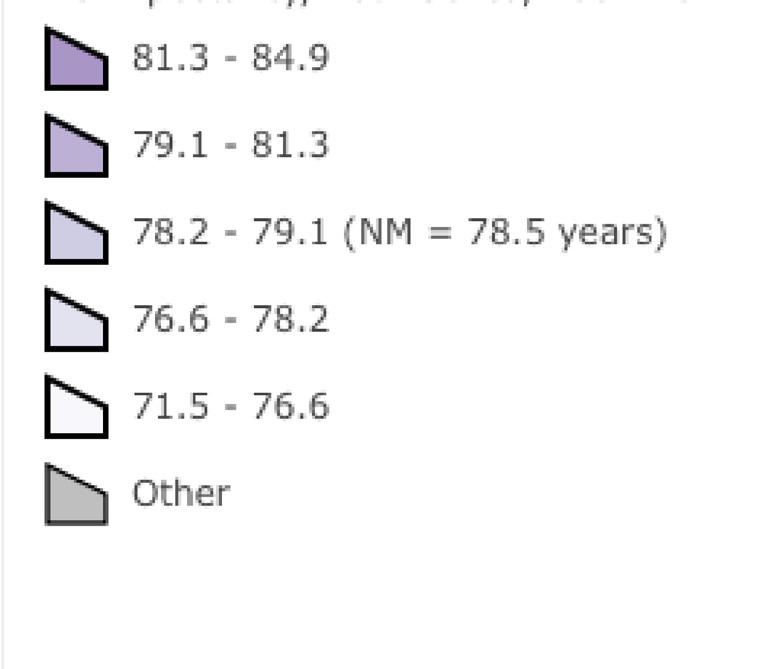
Life Expectancy at Birth. both sexes 2007 -2011


The Central Corridor Neighborhood Study by UNM
hill international district east gateway

Source: NMCDC.com
Accessed: NOV:2016
ART Route Community Boundaries
Life Expectancy, Both Sexes, 200720011

Median Household Income, 2010
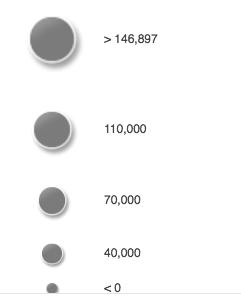


The Central Corridor Neighborhood Study by UNM
nob hill international district east gateway

Source: ABQMaps - City of Albuquerque; www.cabq.gov.gis
Accessed: NOV:2016
ART Route Community Boundaries


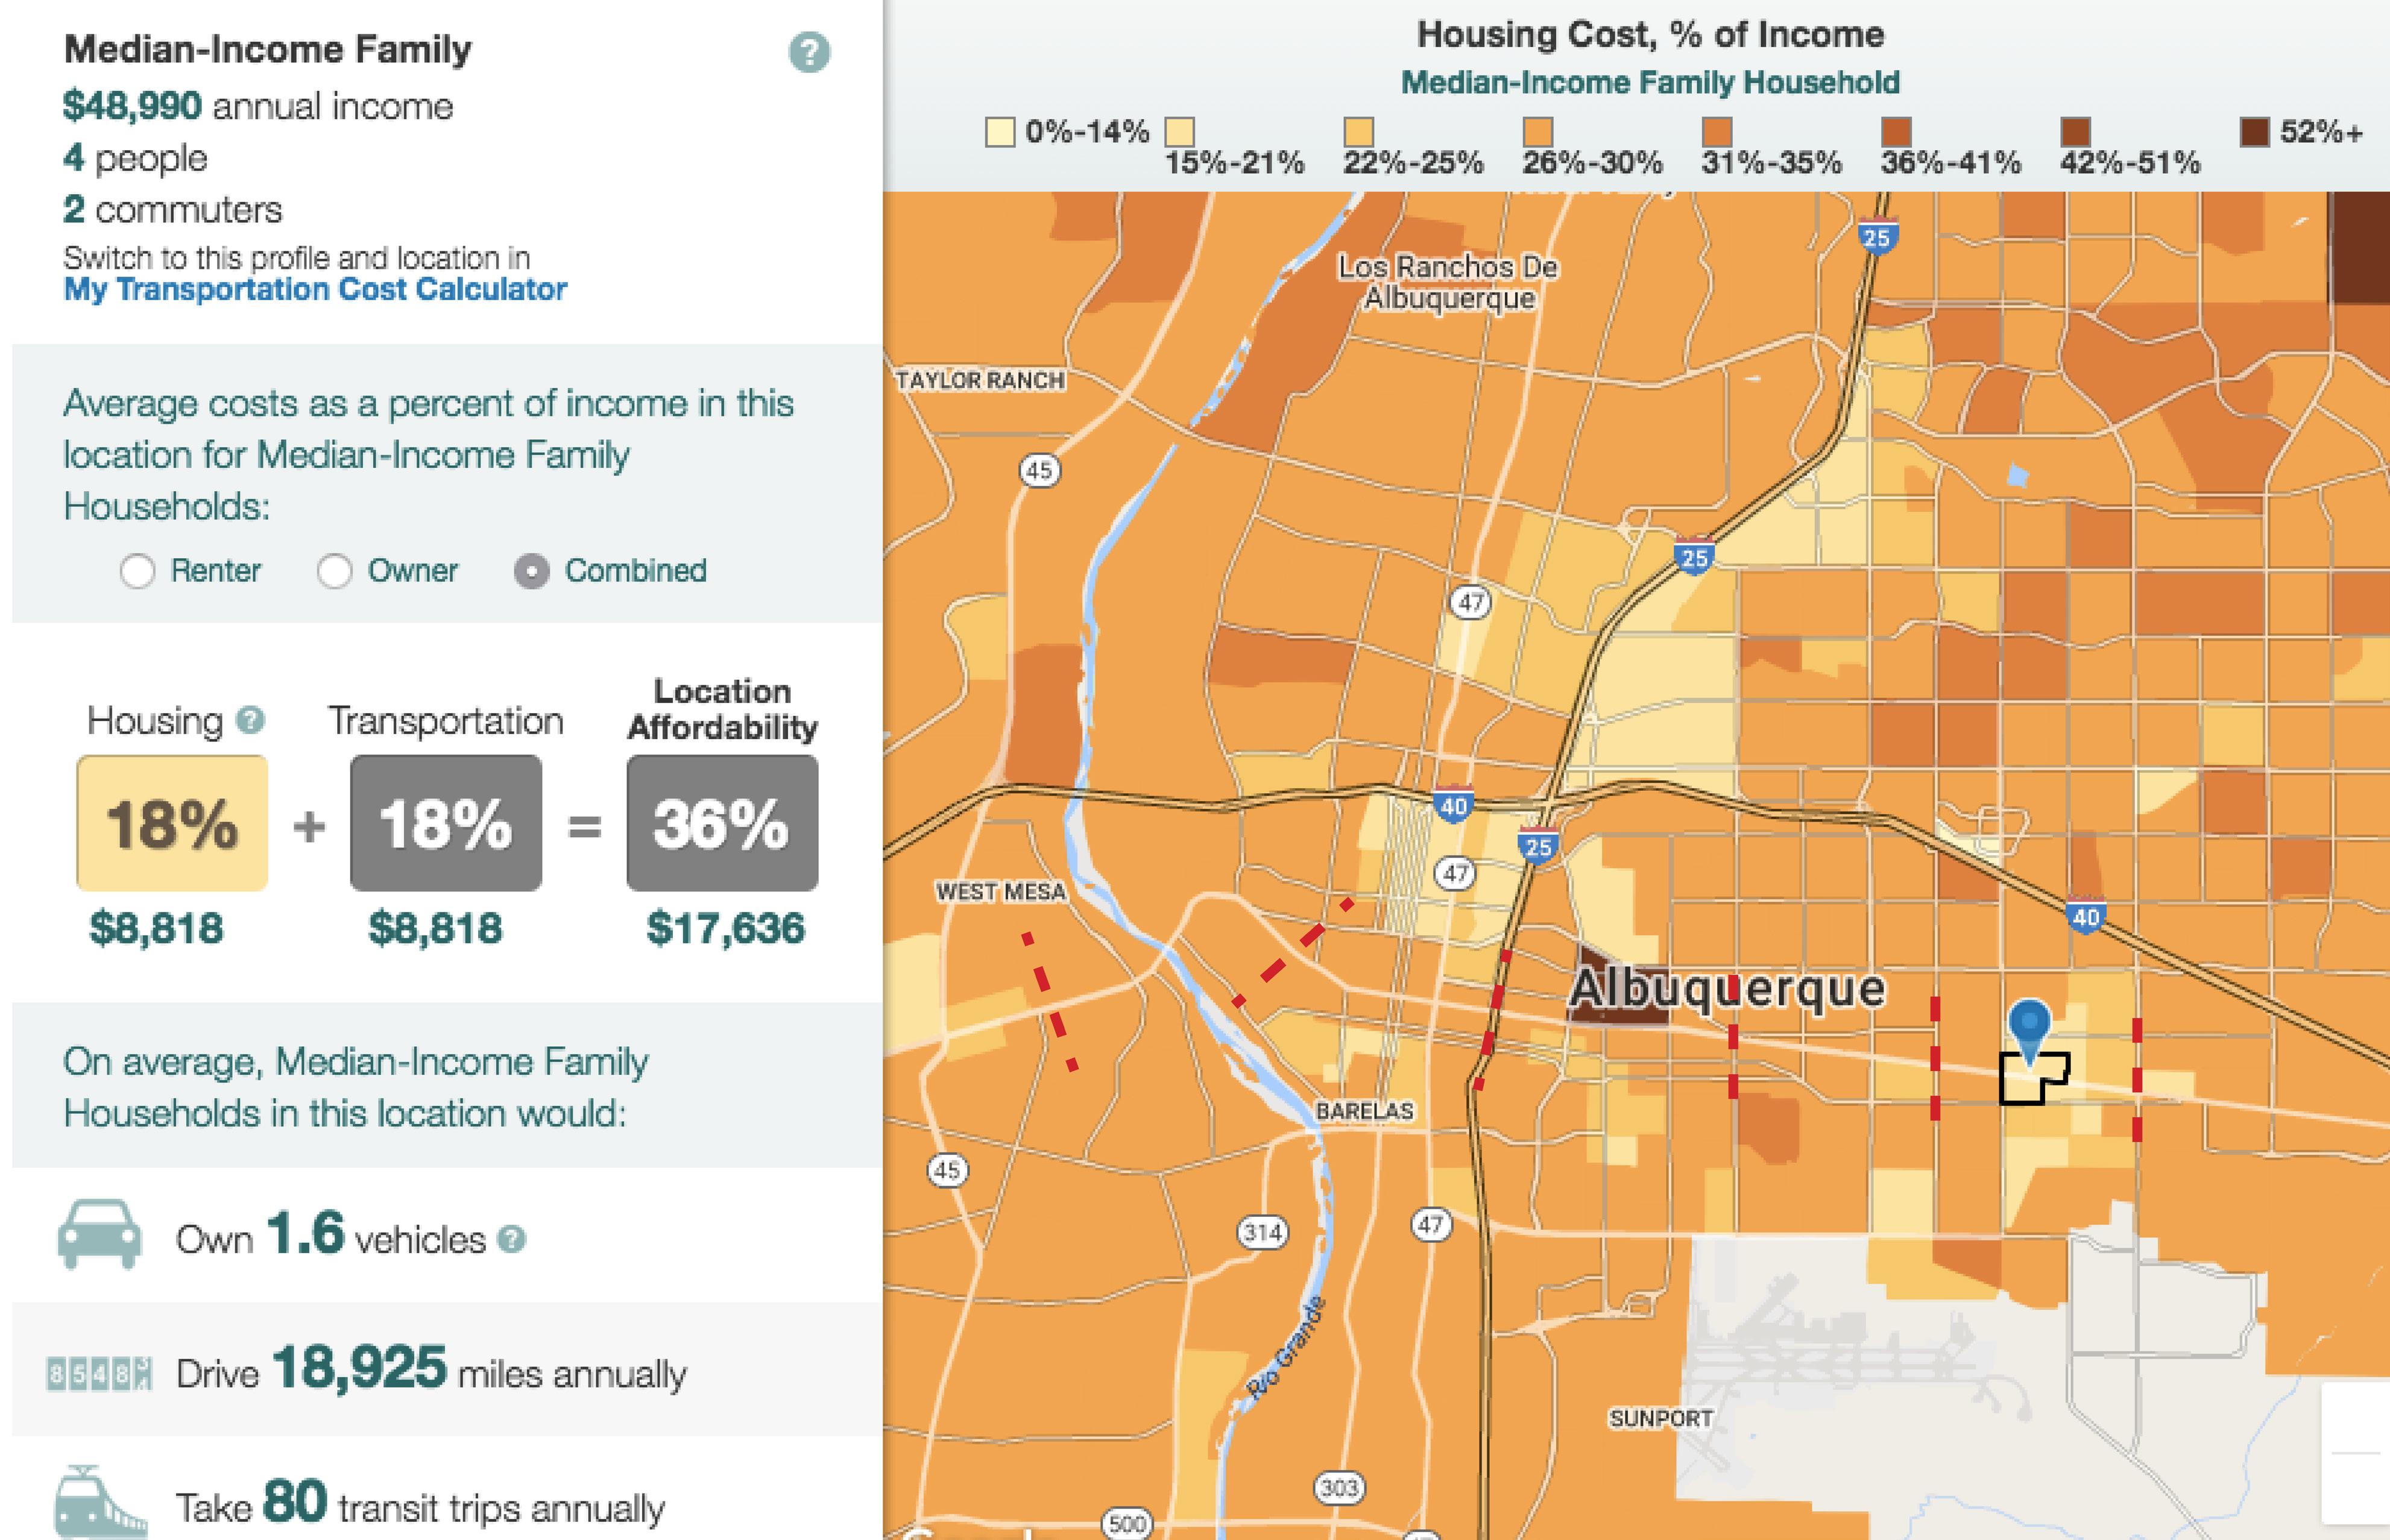
- Housing + Transporation + Median Income
The Central Corridor Neighborhood Study by UNM

university nob hill international district east gateway
ART Route
Community Boundaries
Sampled Area

TO:GALLUP140.5mi TO: UNSER BLVD NW
Transit Routes
The Central Corridor Neighborhood Study by UNM
TO: LOS LUNAS 25.5 mi
scale: 1/2 in = 1mi
TO: TRAMWAY BLVD
Albuquerque Regional Airport
DATA SOURCE: DATE: ABQ RIDE JAN:2017
TRANSPORT - Regional Train + Bus Services
The Central Corridor Neighborhood Study by UNM * Albuquerque
TO: TRAMWAY BLVD
Albuquerque Regional Airport
scale: 1/2 in = 1 mi
DATA SOURCE: DATE: ABQ RIDE JAN:2017
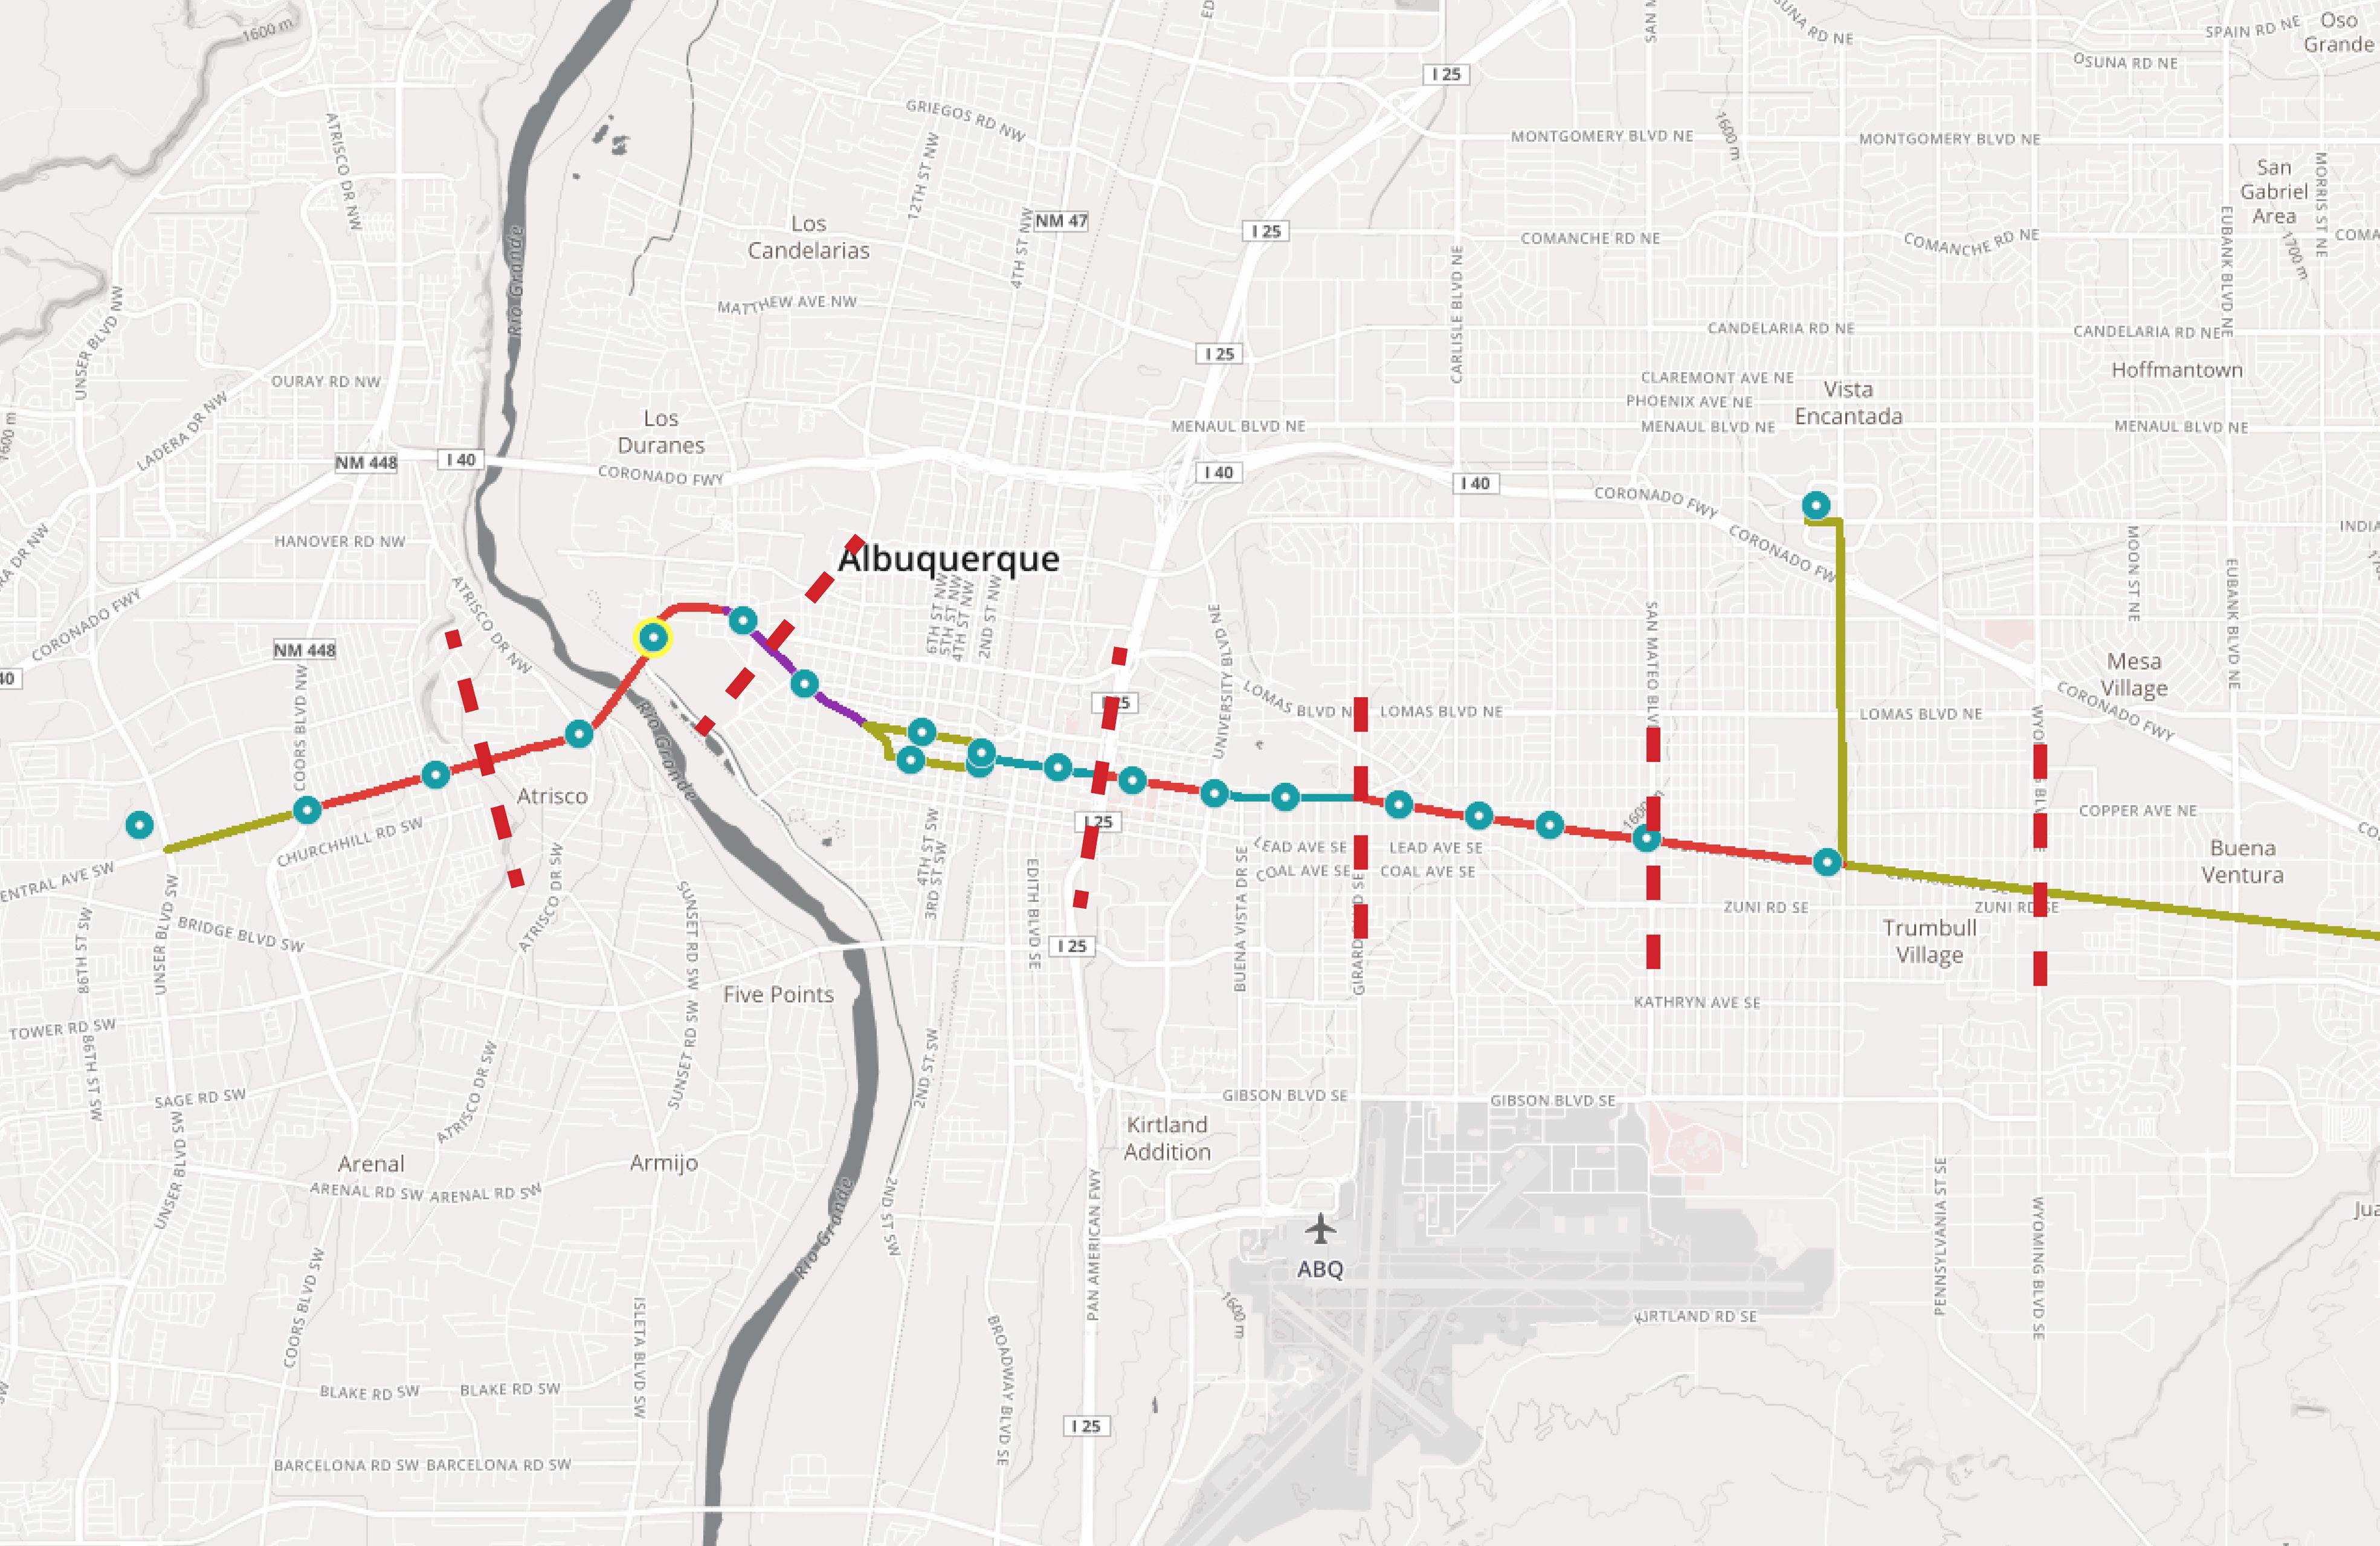
TRANSPORT - ART Route Stations
The Central Corridor Neighborhood Study by UNM

Source: http://www.brtabq.com/Map Assessed: Nov. 2016 nob hill international district east gateway

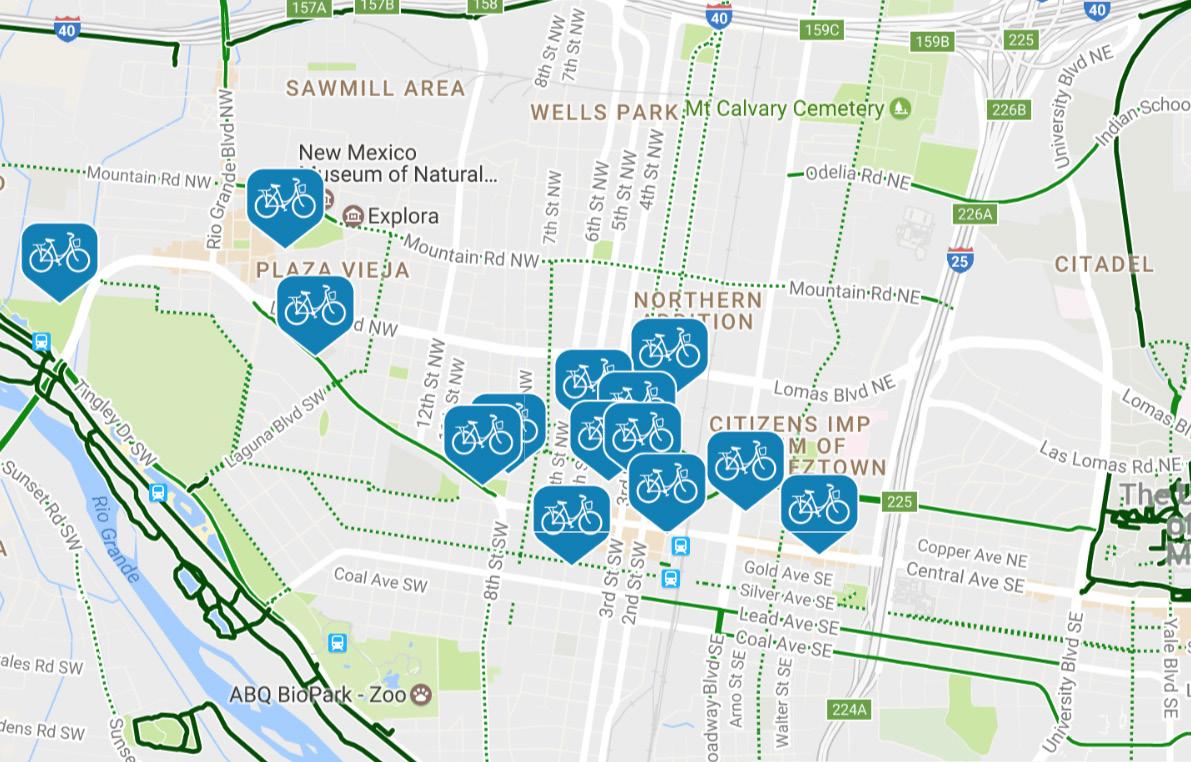
TRANSPORT - Bike Share Locations
The Central Corridor Neighborhood Study by UNM
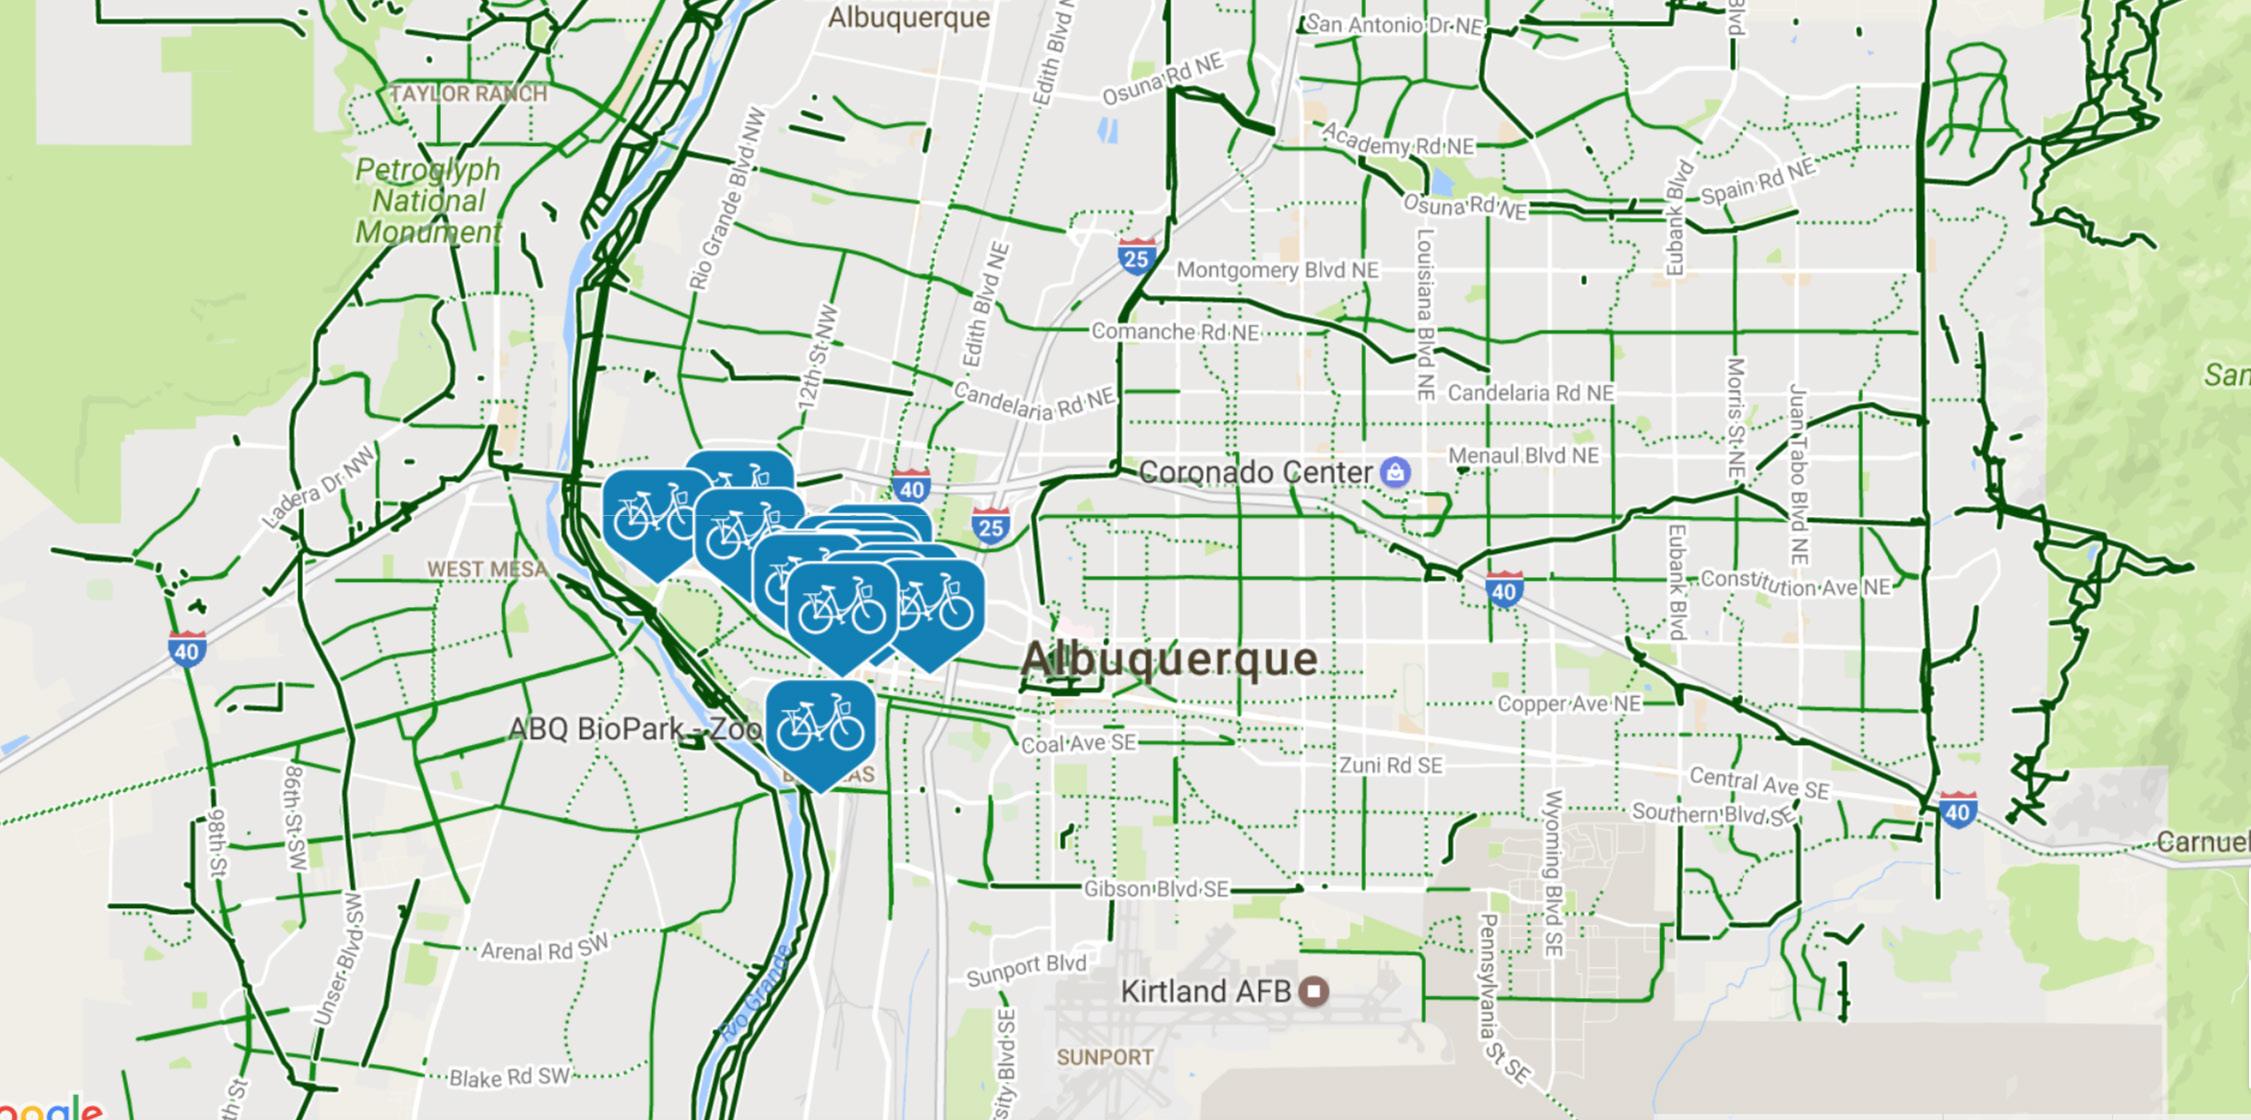


Source: BICI: Bhttp://bike.zagster.com/abq/ Accessed: JAN 26, 2017

BICI - Bike share locations, Downtown ABQ
Locations West to East
* Bio Park
* Albuquerque Museum
* County Club
* Silveman Lodge
* MRCOG
* PNM
* City Hall West
* Hyatt Regency
* Convetion Center West
* Galaria
* Downtown Movie Theater
* Fat Pipe / ABQ Lofts
* EDo / Grove

The Central Corridor Neighborhood Study by UNM
TO: SANTA FE 64.3 mi
ART ROUTE
scale: 1/2 in = 1 mi
TO: TRAMWAY BLVD legend
115TO:SANTAROSA mi
DATA SOURCE: DATE: ABQ RIDE JAN:2017
ART ROUTE
TRANSIT USE MORNING
TRANSIT USE MID-DAY
TRANSIT USE EVENING
TRANSIT USE MORNING & MID-DAY
TRANSIT USE MID-DAY & EVENING
TRANSIT USE MORNING & EVENING
TRANSIT USE ALL TIMES
LESS USEMORE USE

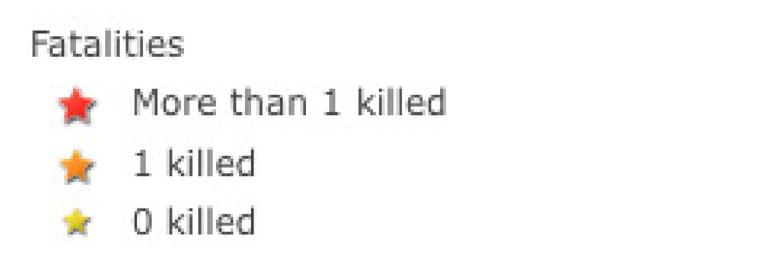
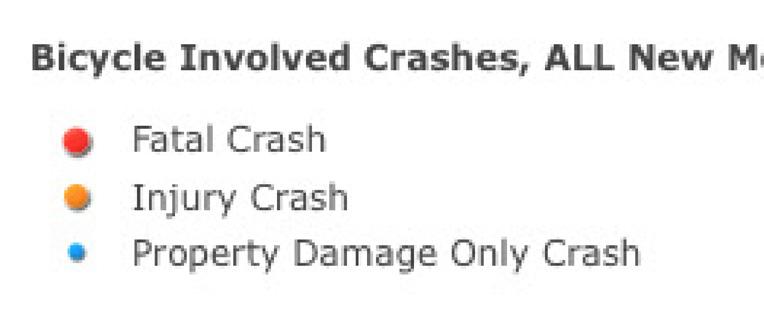
TRANSPORT - Accidents: Pedestrian, Bicycle and Motor Vehicles. 2010-2014
The Central Corridor Neighborhood Study by UNM
hill international district east gateway

Source: NMCDC.com Accessed: NOV:2016
ART Route Community Boundaries
Pedestrian Involved crashes, All New Mexico 2010 -2014
Bicycle Involved crashes, All New Mexico 2010 -2014
Motor Vehicle Involved crashes, All New Mexico 2010 -2014


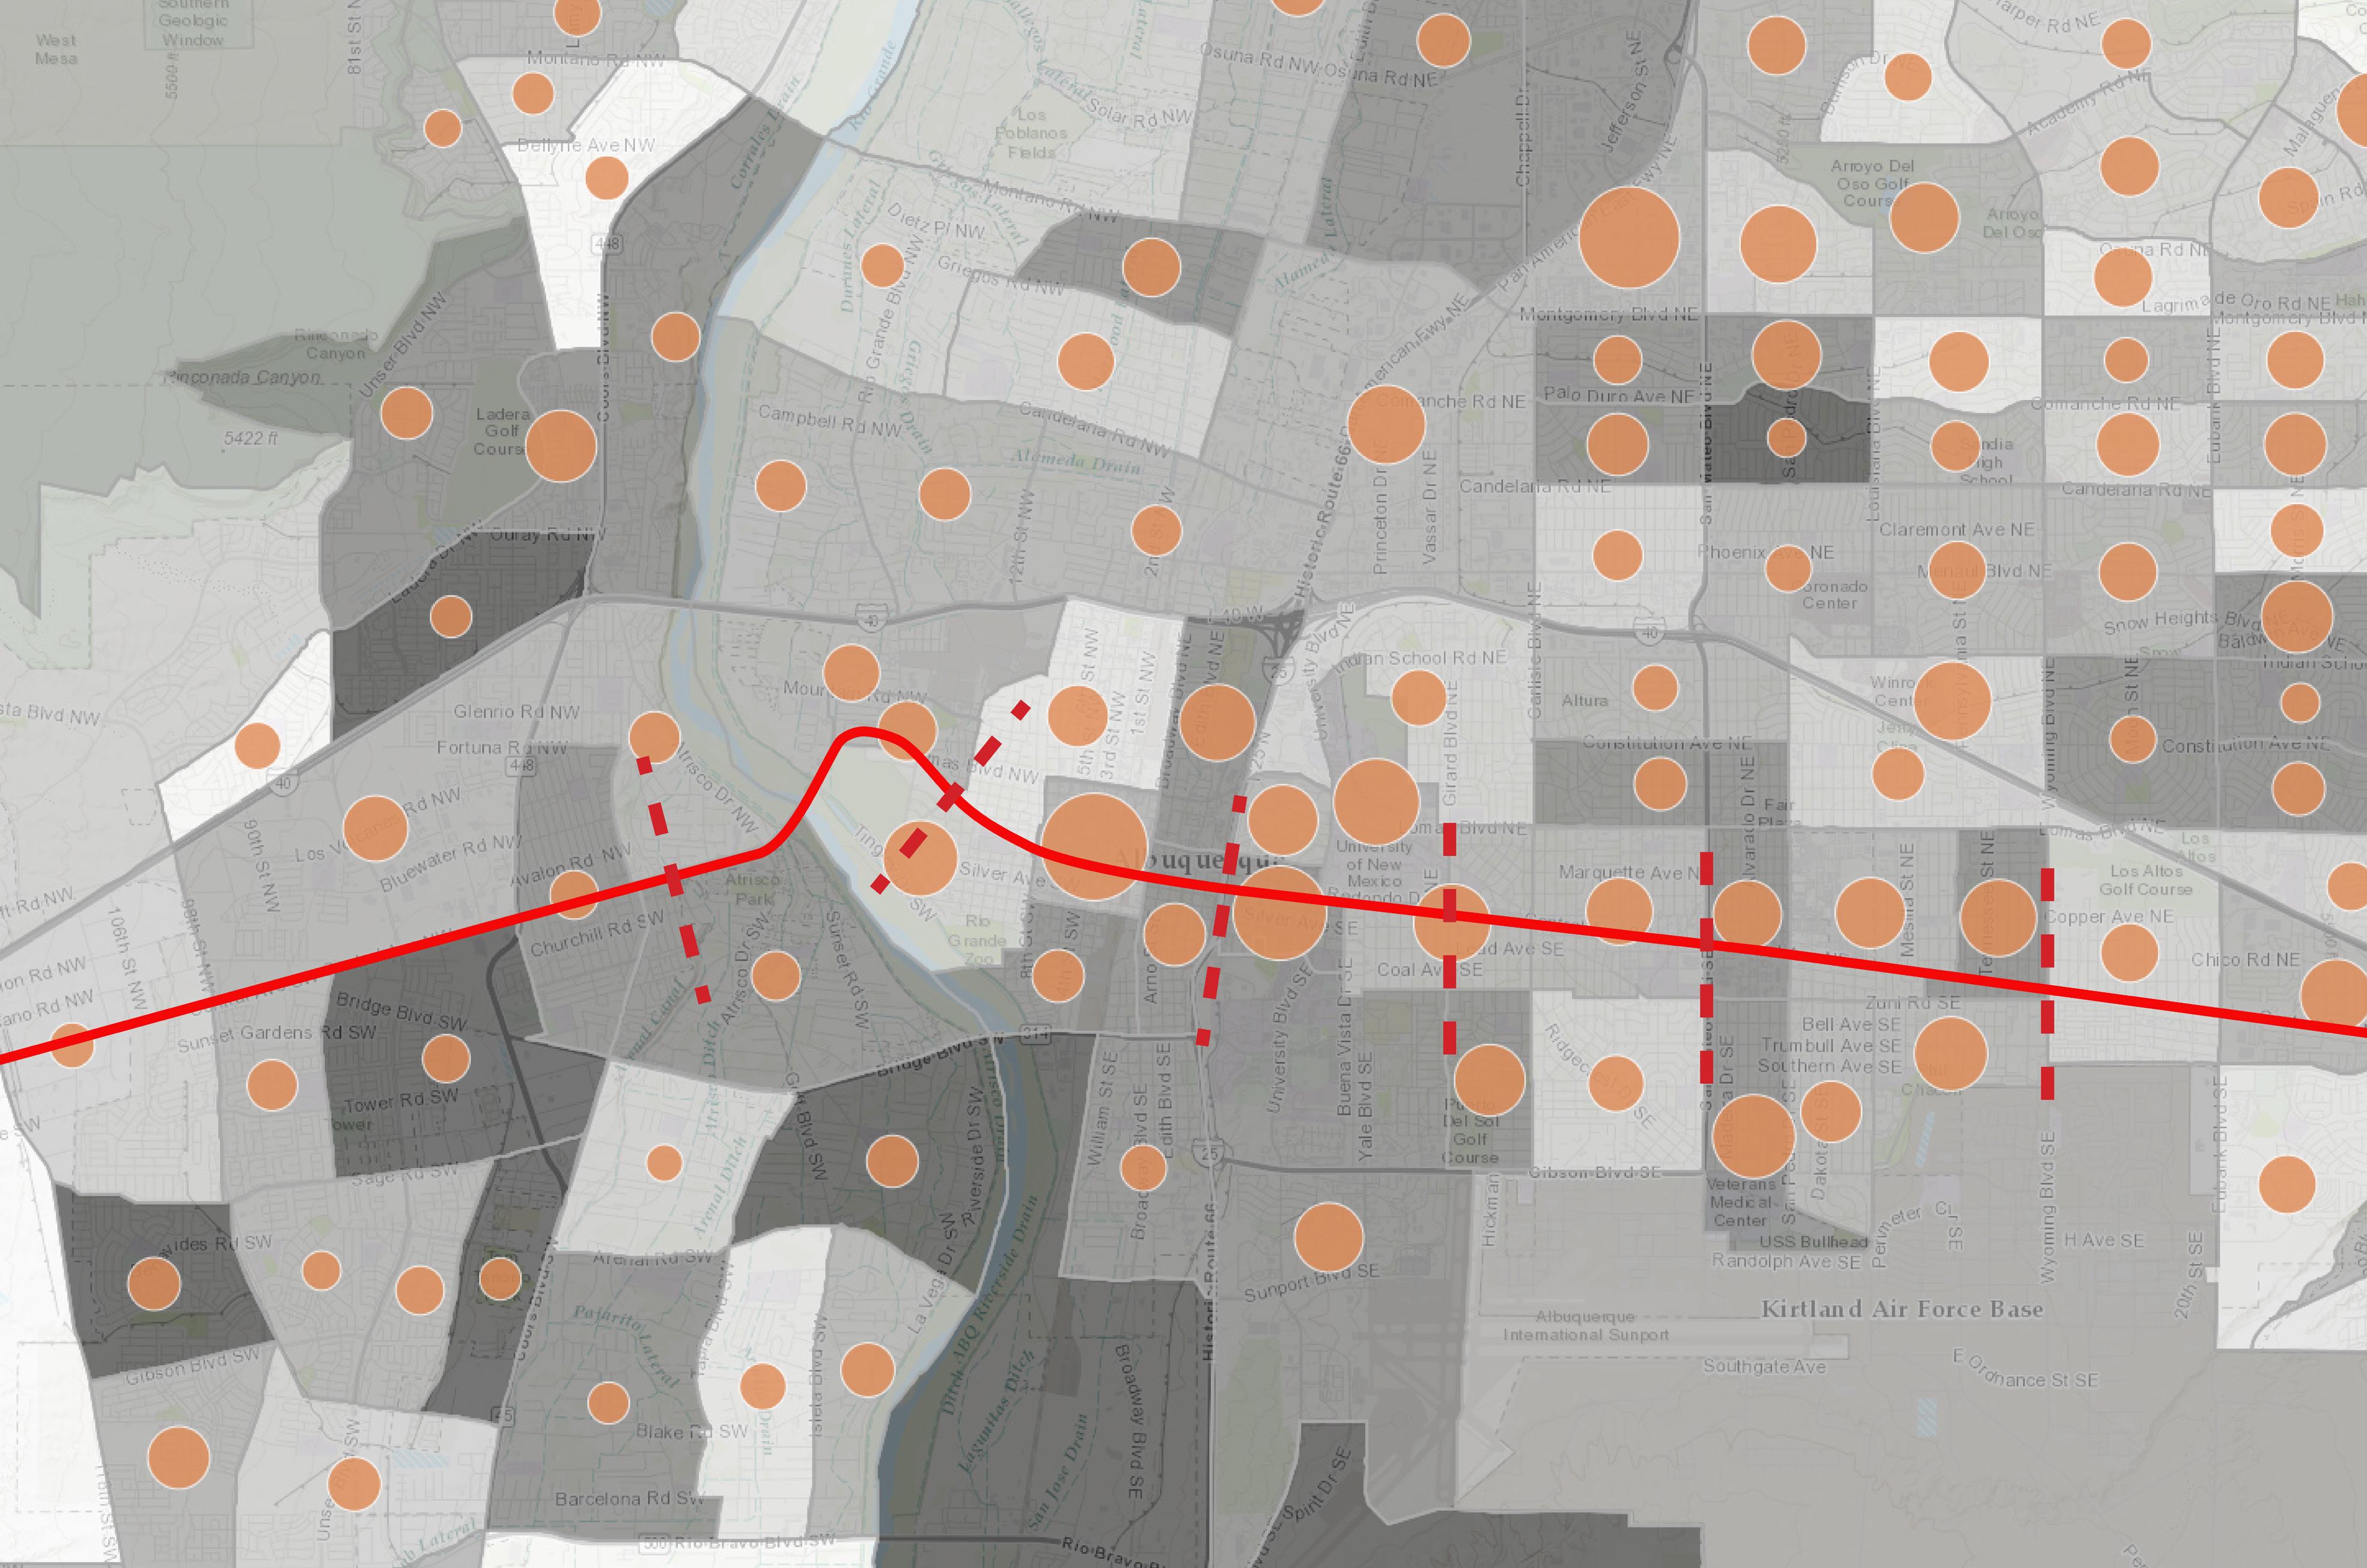
RESIDENTIAL - Rent 35% or More of Household Income
The Central Corridor Neighborhood Study by UNM
nob hill international district east gateway

Source: NMCDC.com Accessed: NOV:2016
ART Route Community Boundaries
Percent Moved In in 2010 or Later

Percent Renters Paying 35% or More of Household Income for Rent


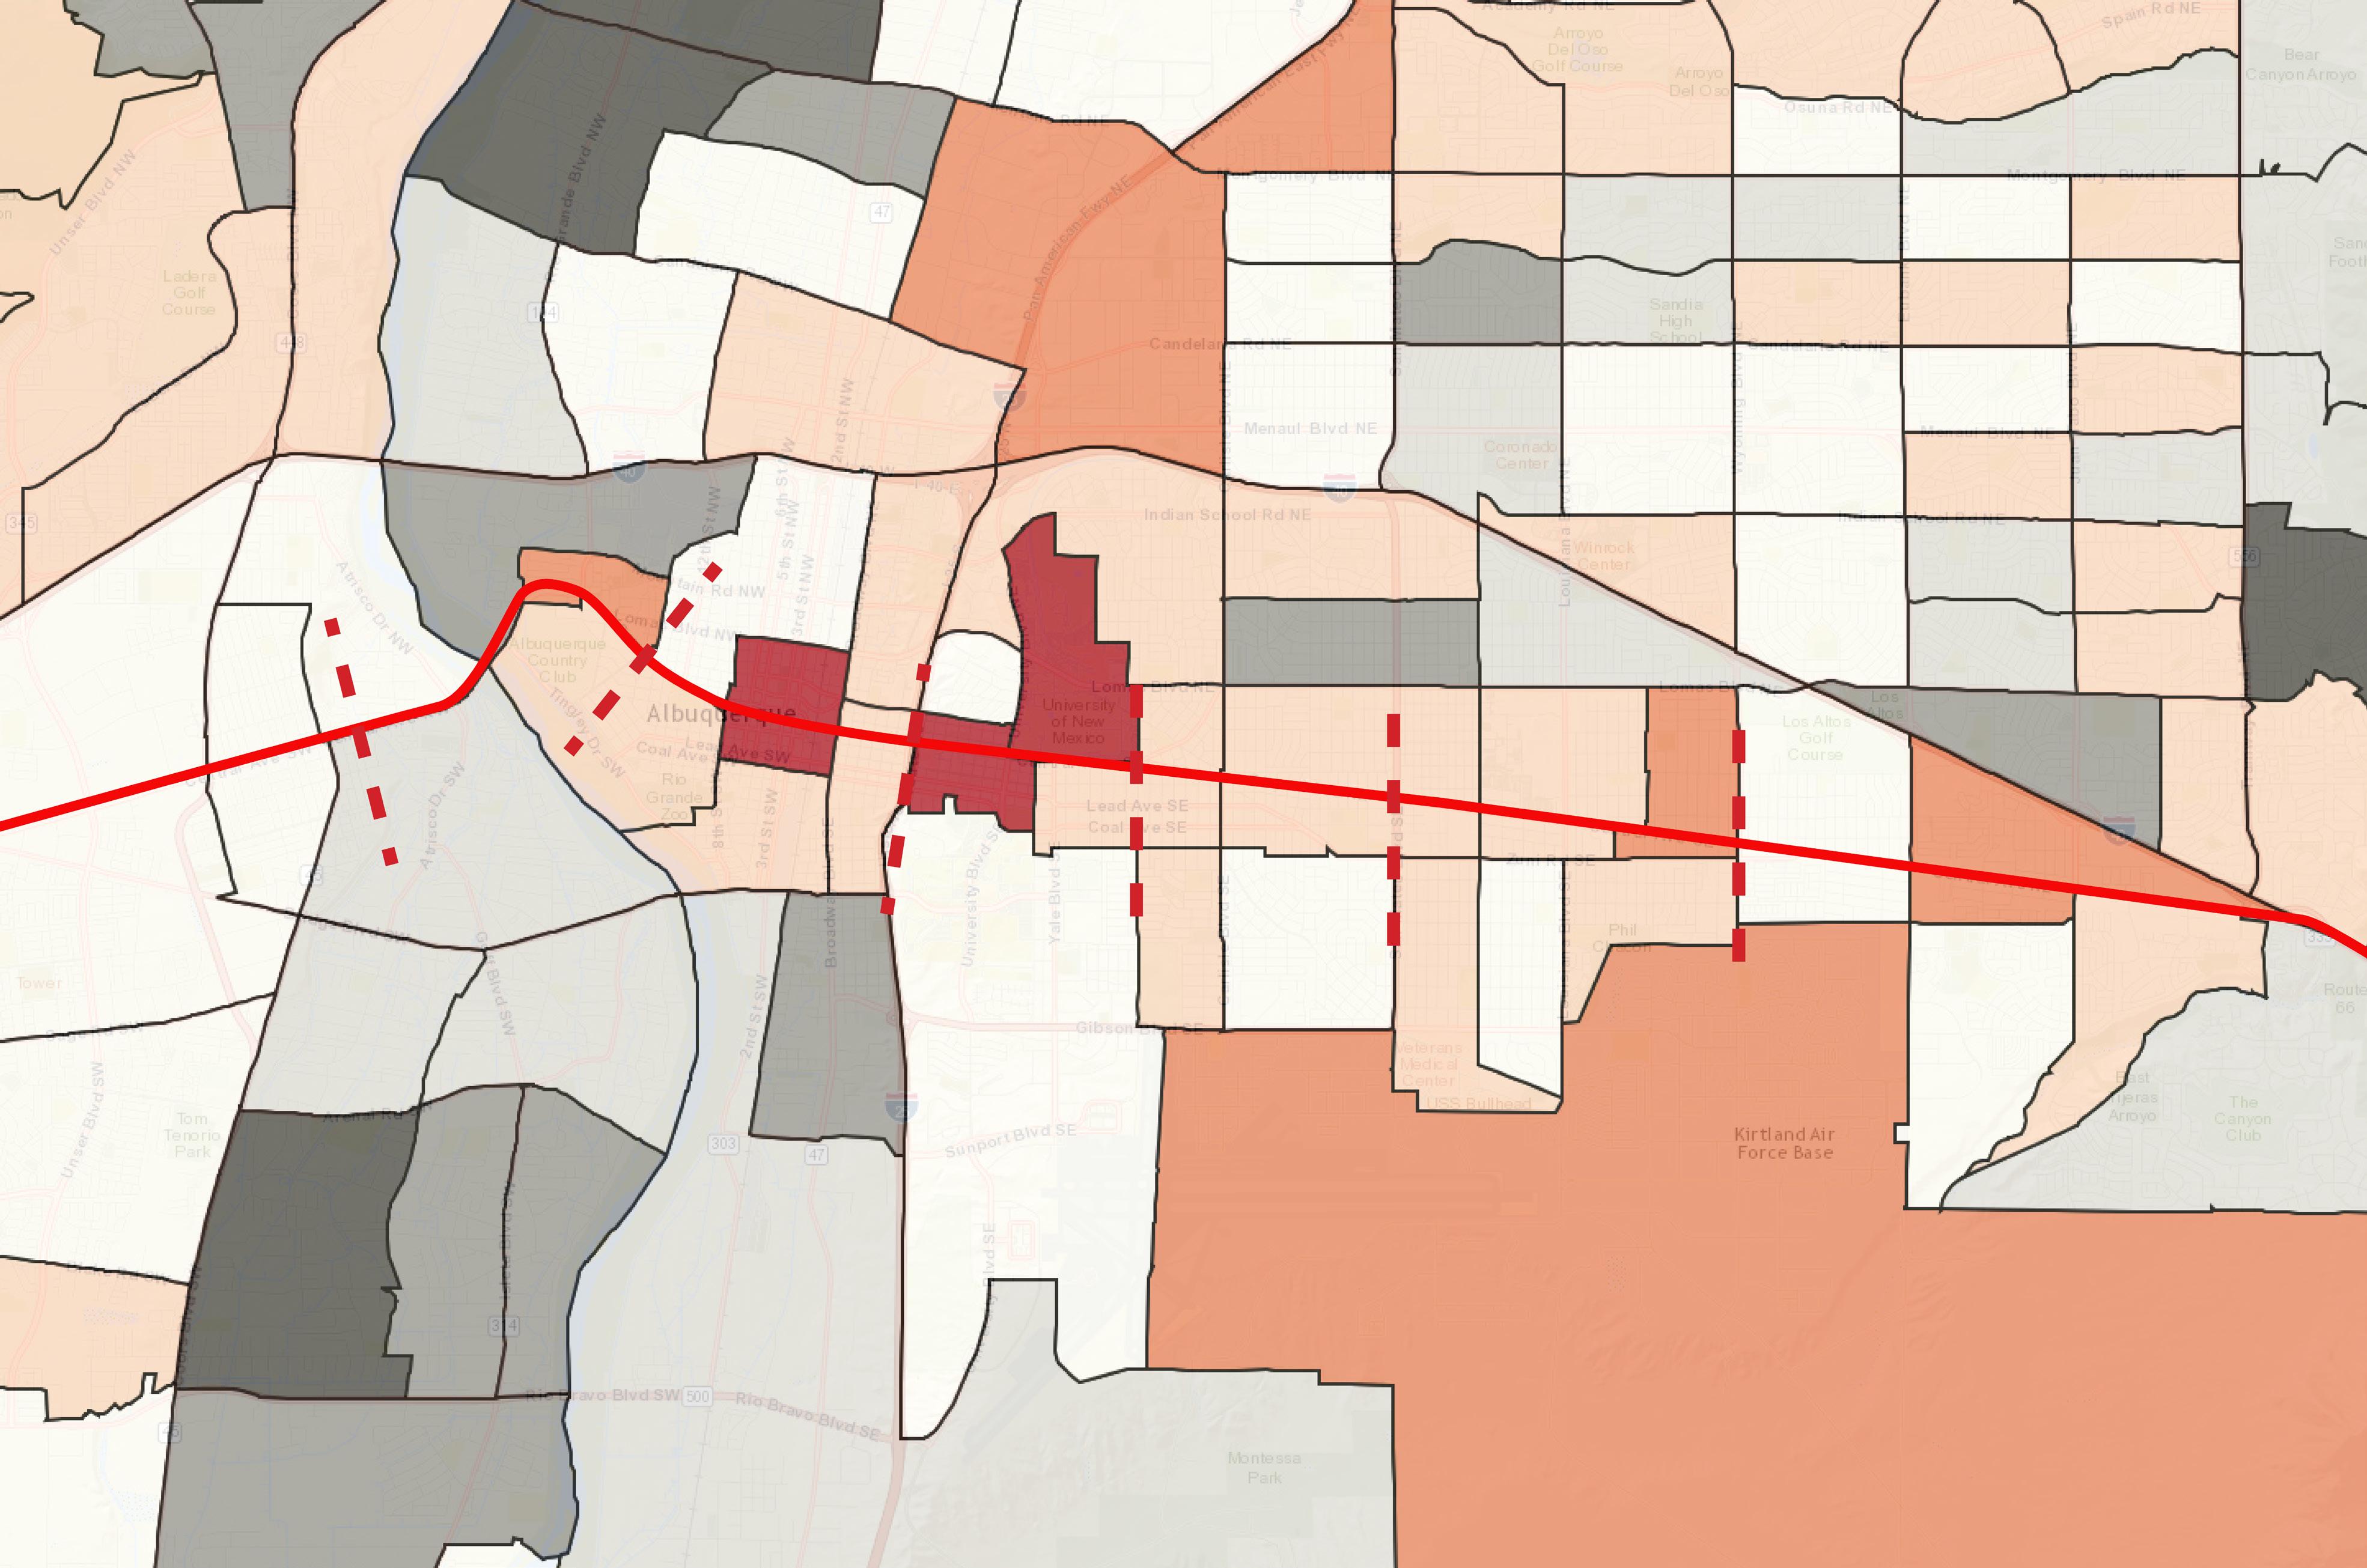
HOUSING - Tenure: % Population living less than 1 year at current residence.
The Central Corridor Neighborhood Study by UNM
international district east gateway

Source: NMCDC.com Accessed: NOV:2016 residence.
ART Route Community Boundaries
Population living >1 Year at Current Residence (%)


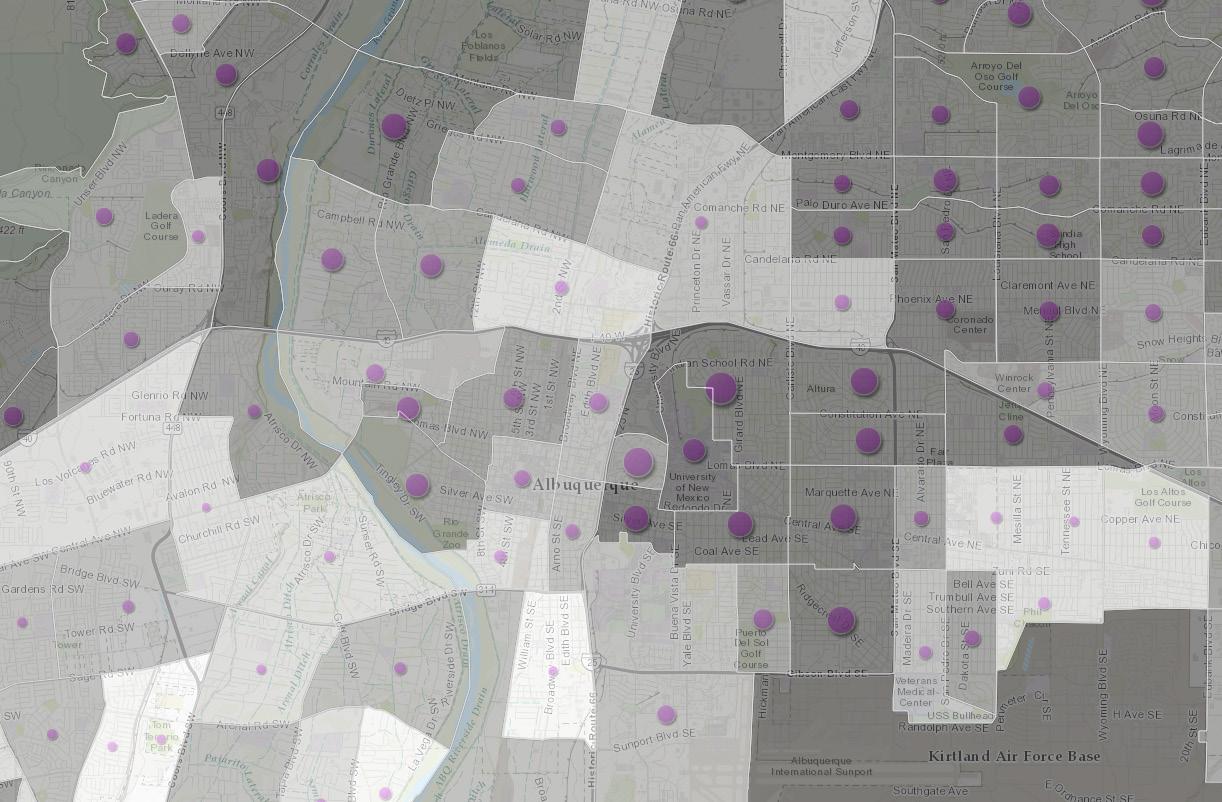
EDUCATION - Educational Attainment
The Central Corridor Neighborhood Study by UNM
hill international district east gateway

Source: NMCDC.com Accessed: NOV:2016
ART Route
Community Boundaries
% of Population >25 Yrs Old with High School Deiploma or Higher
% of Population >25 Yrs Old with Bachelor’s Degree or Higher


EDUCATION - Pre-K Sites and Early Childhood Risk Factors, 2016
The Central Corridor Neighborhood Study by UNM

Source: NMCDC.com
Dated: NOV:2016
ART Route Community Boundaries
Pre-Kindergarten sites, NM
Pre-K, Active 2016

Early Childhood Risk Categories 2016




City of Albuquerque, Bureau of Land Management, Texas Parks & Wildlife, Esri, HERE, DeLorme, Intermap, USGS, NGA, EPA, USDA, NPS



CityofAlbuquerque,BureauofLandManagement, TexasParks&Wildlife,Esri,HERE,DeLorme, Intermap,USGS,NGA,EPA,USDA,NPS

CityofAlbuquerque,BureauofLandManagement, TexasParks&Wildlife,Esri,HERE,DeLorme, Intermap,USGS,NGA,EPA,USDA,NPS

CityofAlbuquerque,BureauofLandManagement,…
Ontario BaseMap,ProvinceofOntario,Esri,HERE,…
BASEMAPTYPE
PARKACCESS
BASEMAPTYPE
PARKNEED

Source: Parkscore.com Dated: 11:2016
CityofAlbuquerque,BureauofLandManagement, TexasParks&Wildlife,Esri,HERE,DeLorme, Intermap,USGS,NGA,EPA,USDA,NPS


PARK ACCESS
DEMOGRAPHICS
HEALTH
LANDUSE
CITY DETAILS
PARKNEED
Population: 556,866
DEMOGRAPHICS
Population density: 4 8 per acre
City area: 116,051 acres
Park land %: 24
HEALTH
Median park size: 4 3 acres
Spending per resident: $58 80 Playgrounds per 10,000: 2 9
LANDUSE
Recreation / Senior Centers per 10,000 Residents: 1 1
Basketball Hoops per 10,000: 2.2
CITYDETAILS
Dog Parks per 100,000 Residents: 2 3
Population:397,511

NATIONAL COMPARISONS
Populationdensity:11 7 per acre
Albuquerque NM Parkscore: 65.0
Cityarea:33,958 acres
Parkland%:15
Medianparksize:6 5 acres
Fort Worth TX Parkscore: 41.0
Spendingperresident: $223 66
Minneapolis MN Parkscore: 86.5
Playgroundsper10,000:2 8
Recreation/SeniorCenters per10,000Residents:2.6
BasketballHoopsper10,000: 3 9
DogParksper 100,000Residents:1 8


PUBLIC REALM - Trails and Routes Closed to Vehicles
The Central Corridor Neighborhood Study by UNM


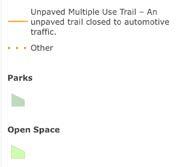
Source: BICI: AGIS.com
Accessed: JAN 2017

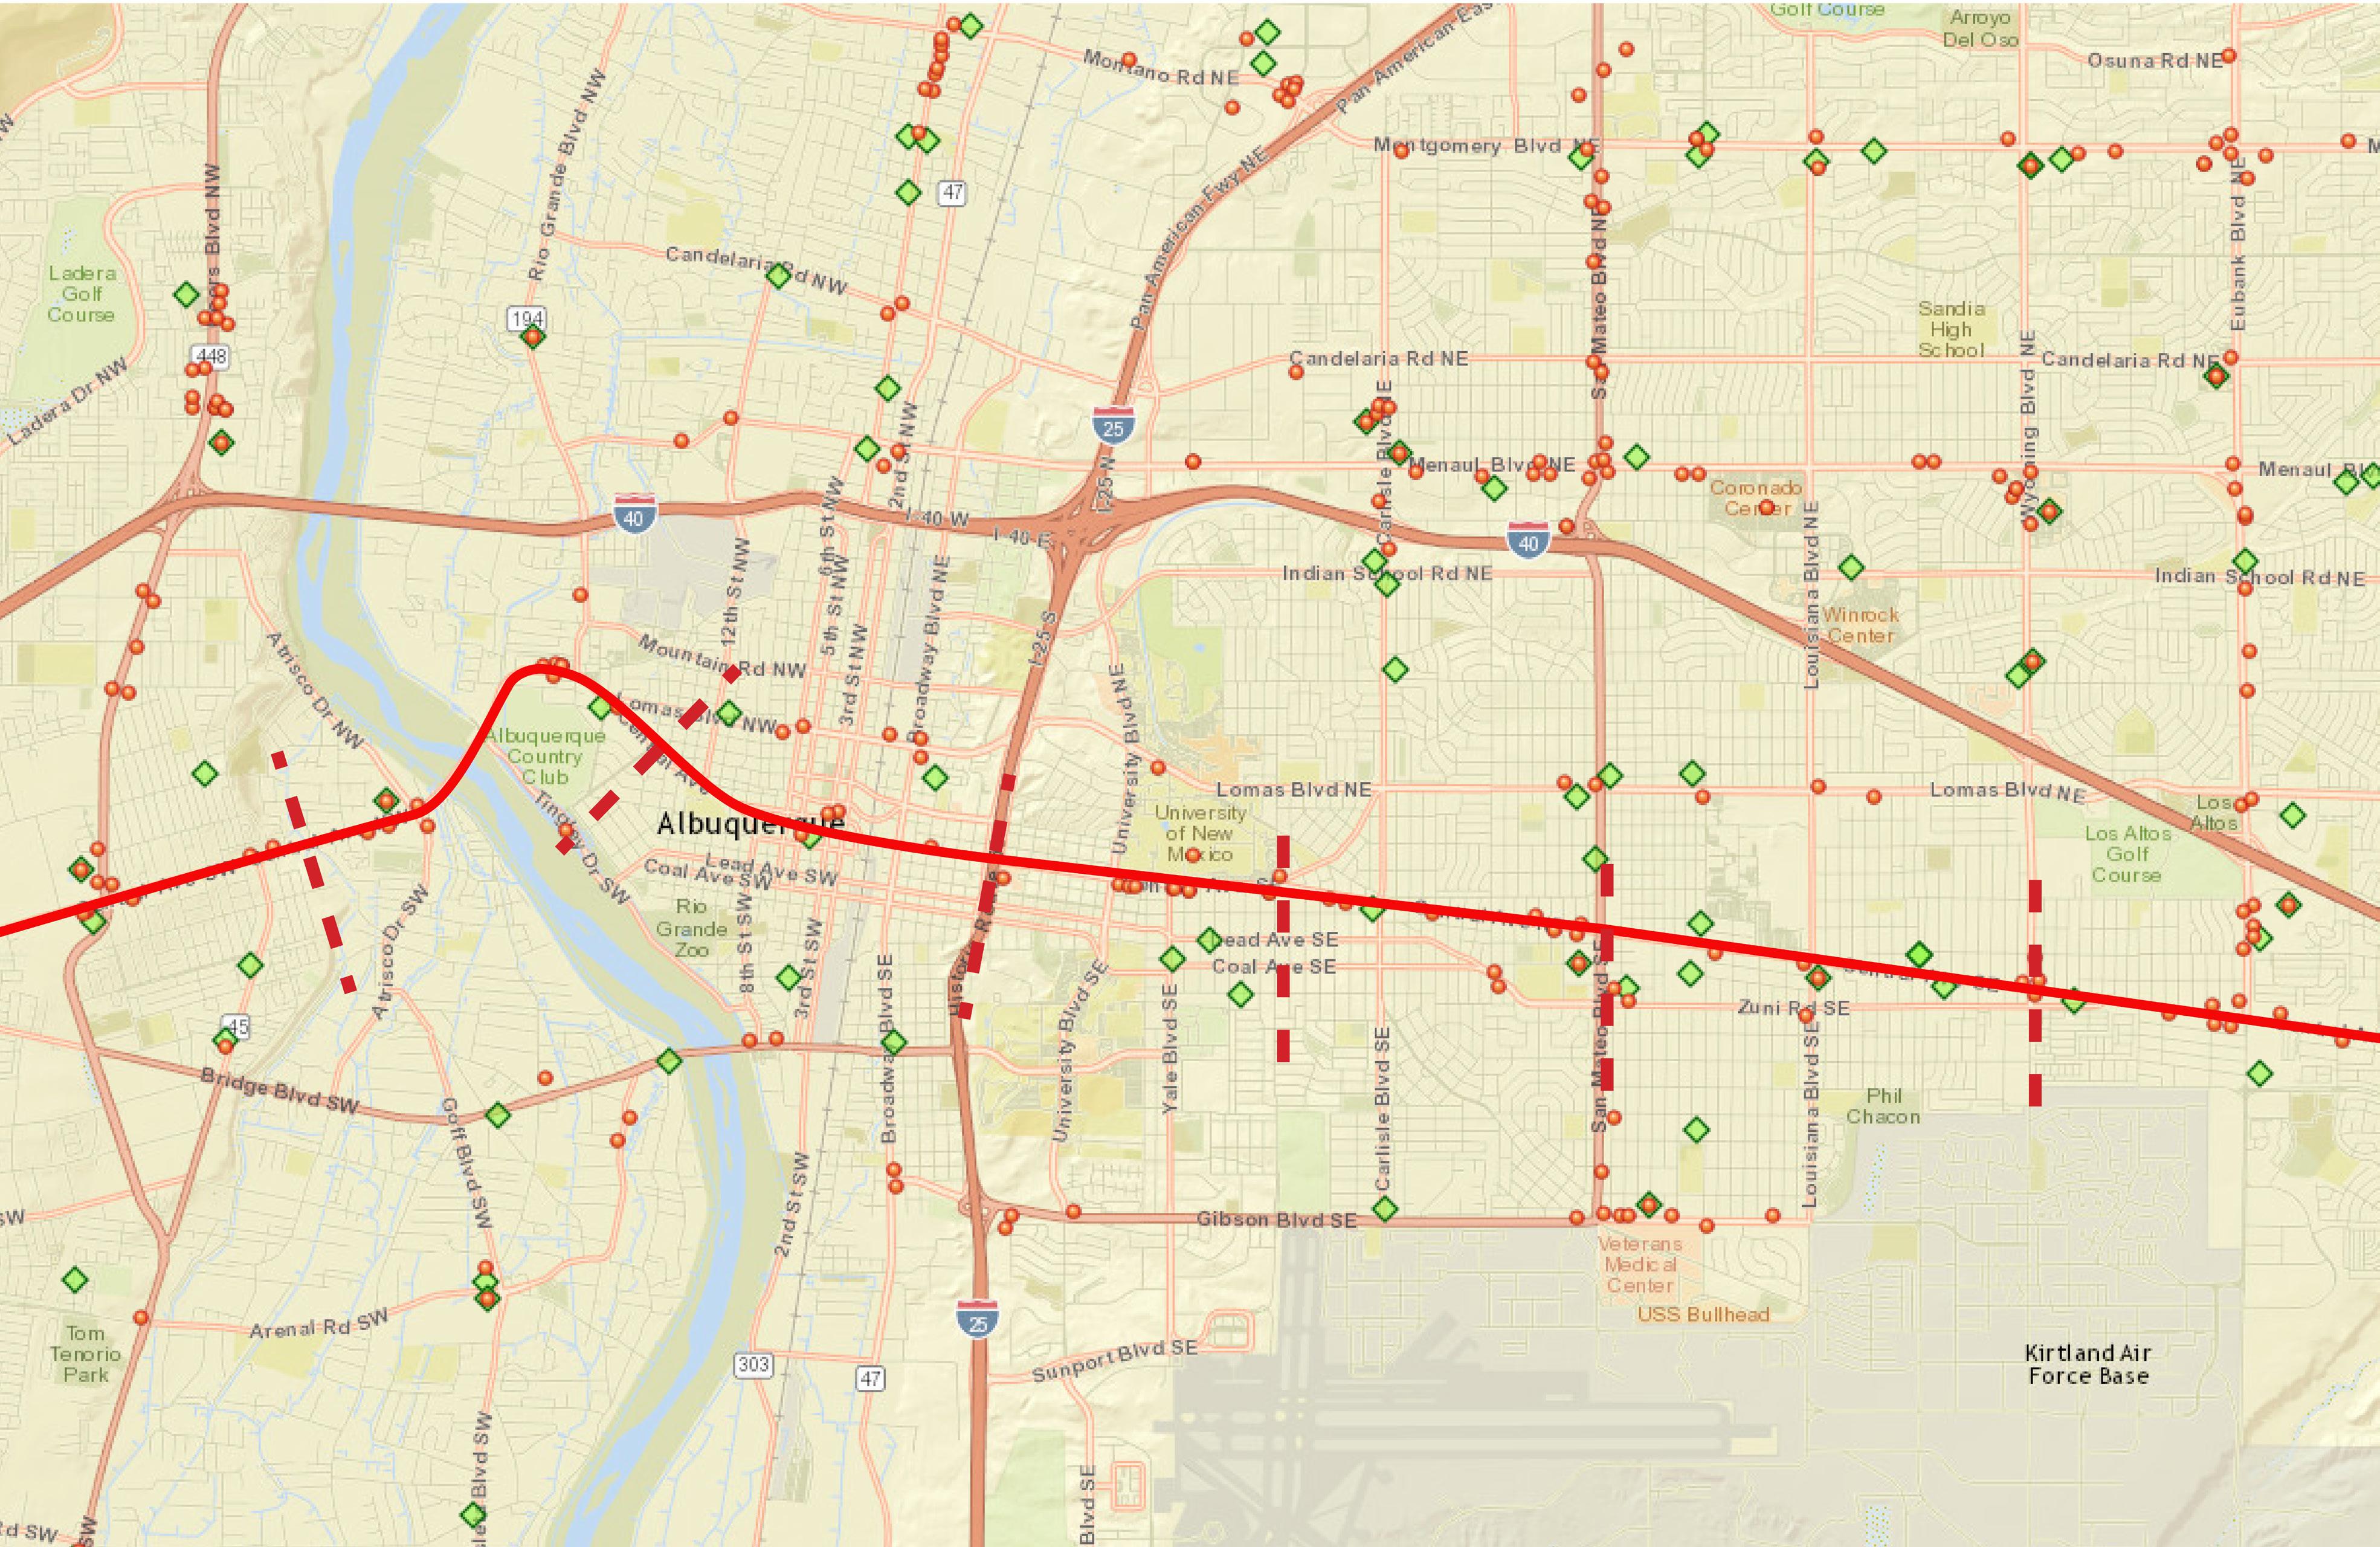
ACCESS - Grocery Stores and Fast Food
The Central Corridor Neighborhood Study by UNM
international district east gateway

Source: NMCDC.com
Accessed: NOV:2016


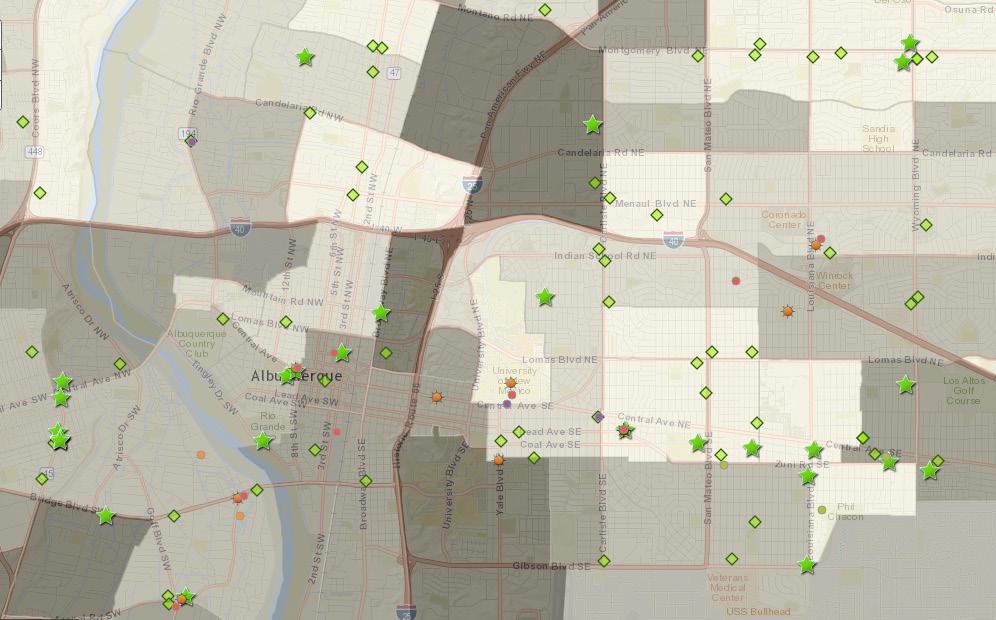
The Central Corridor Neighborhood Study by UNM
nob hill international district east gateway

Source: NMCDC.com
Accessed: NOV:2016
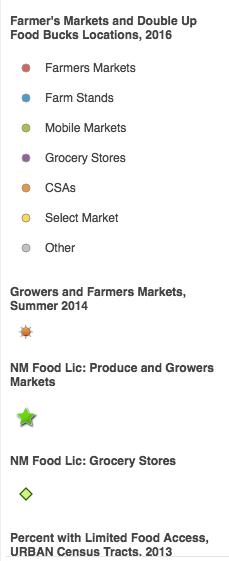


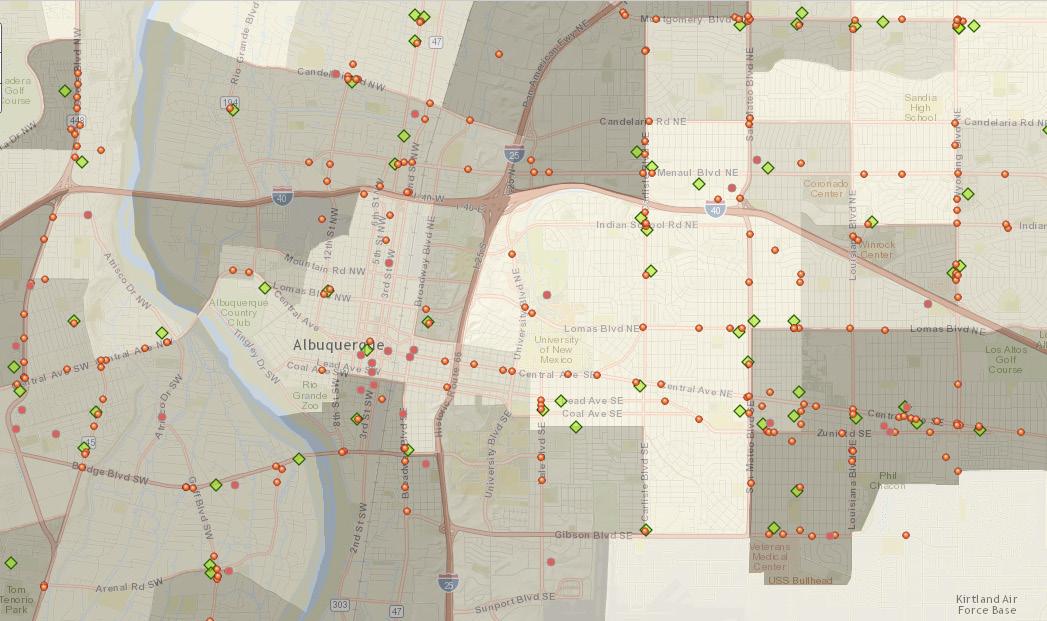
nob hill international district east gateway

Source: NMCDC.com Accessed: NOV:2016
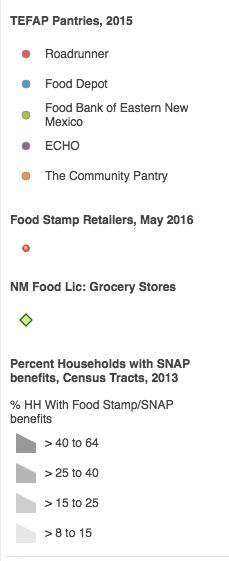


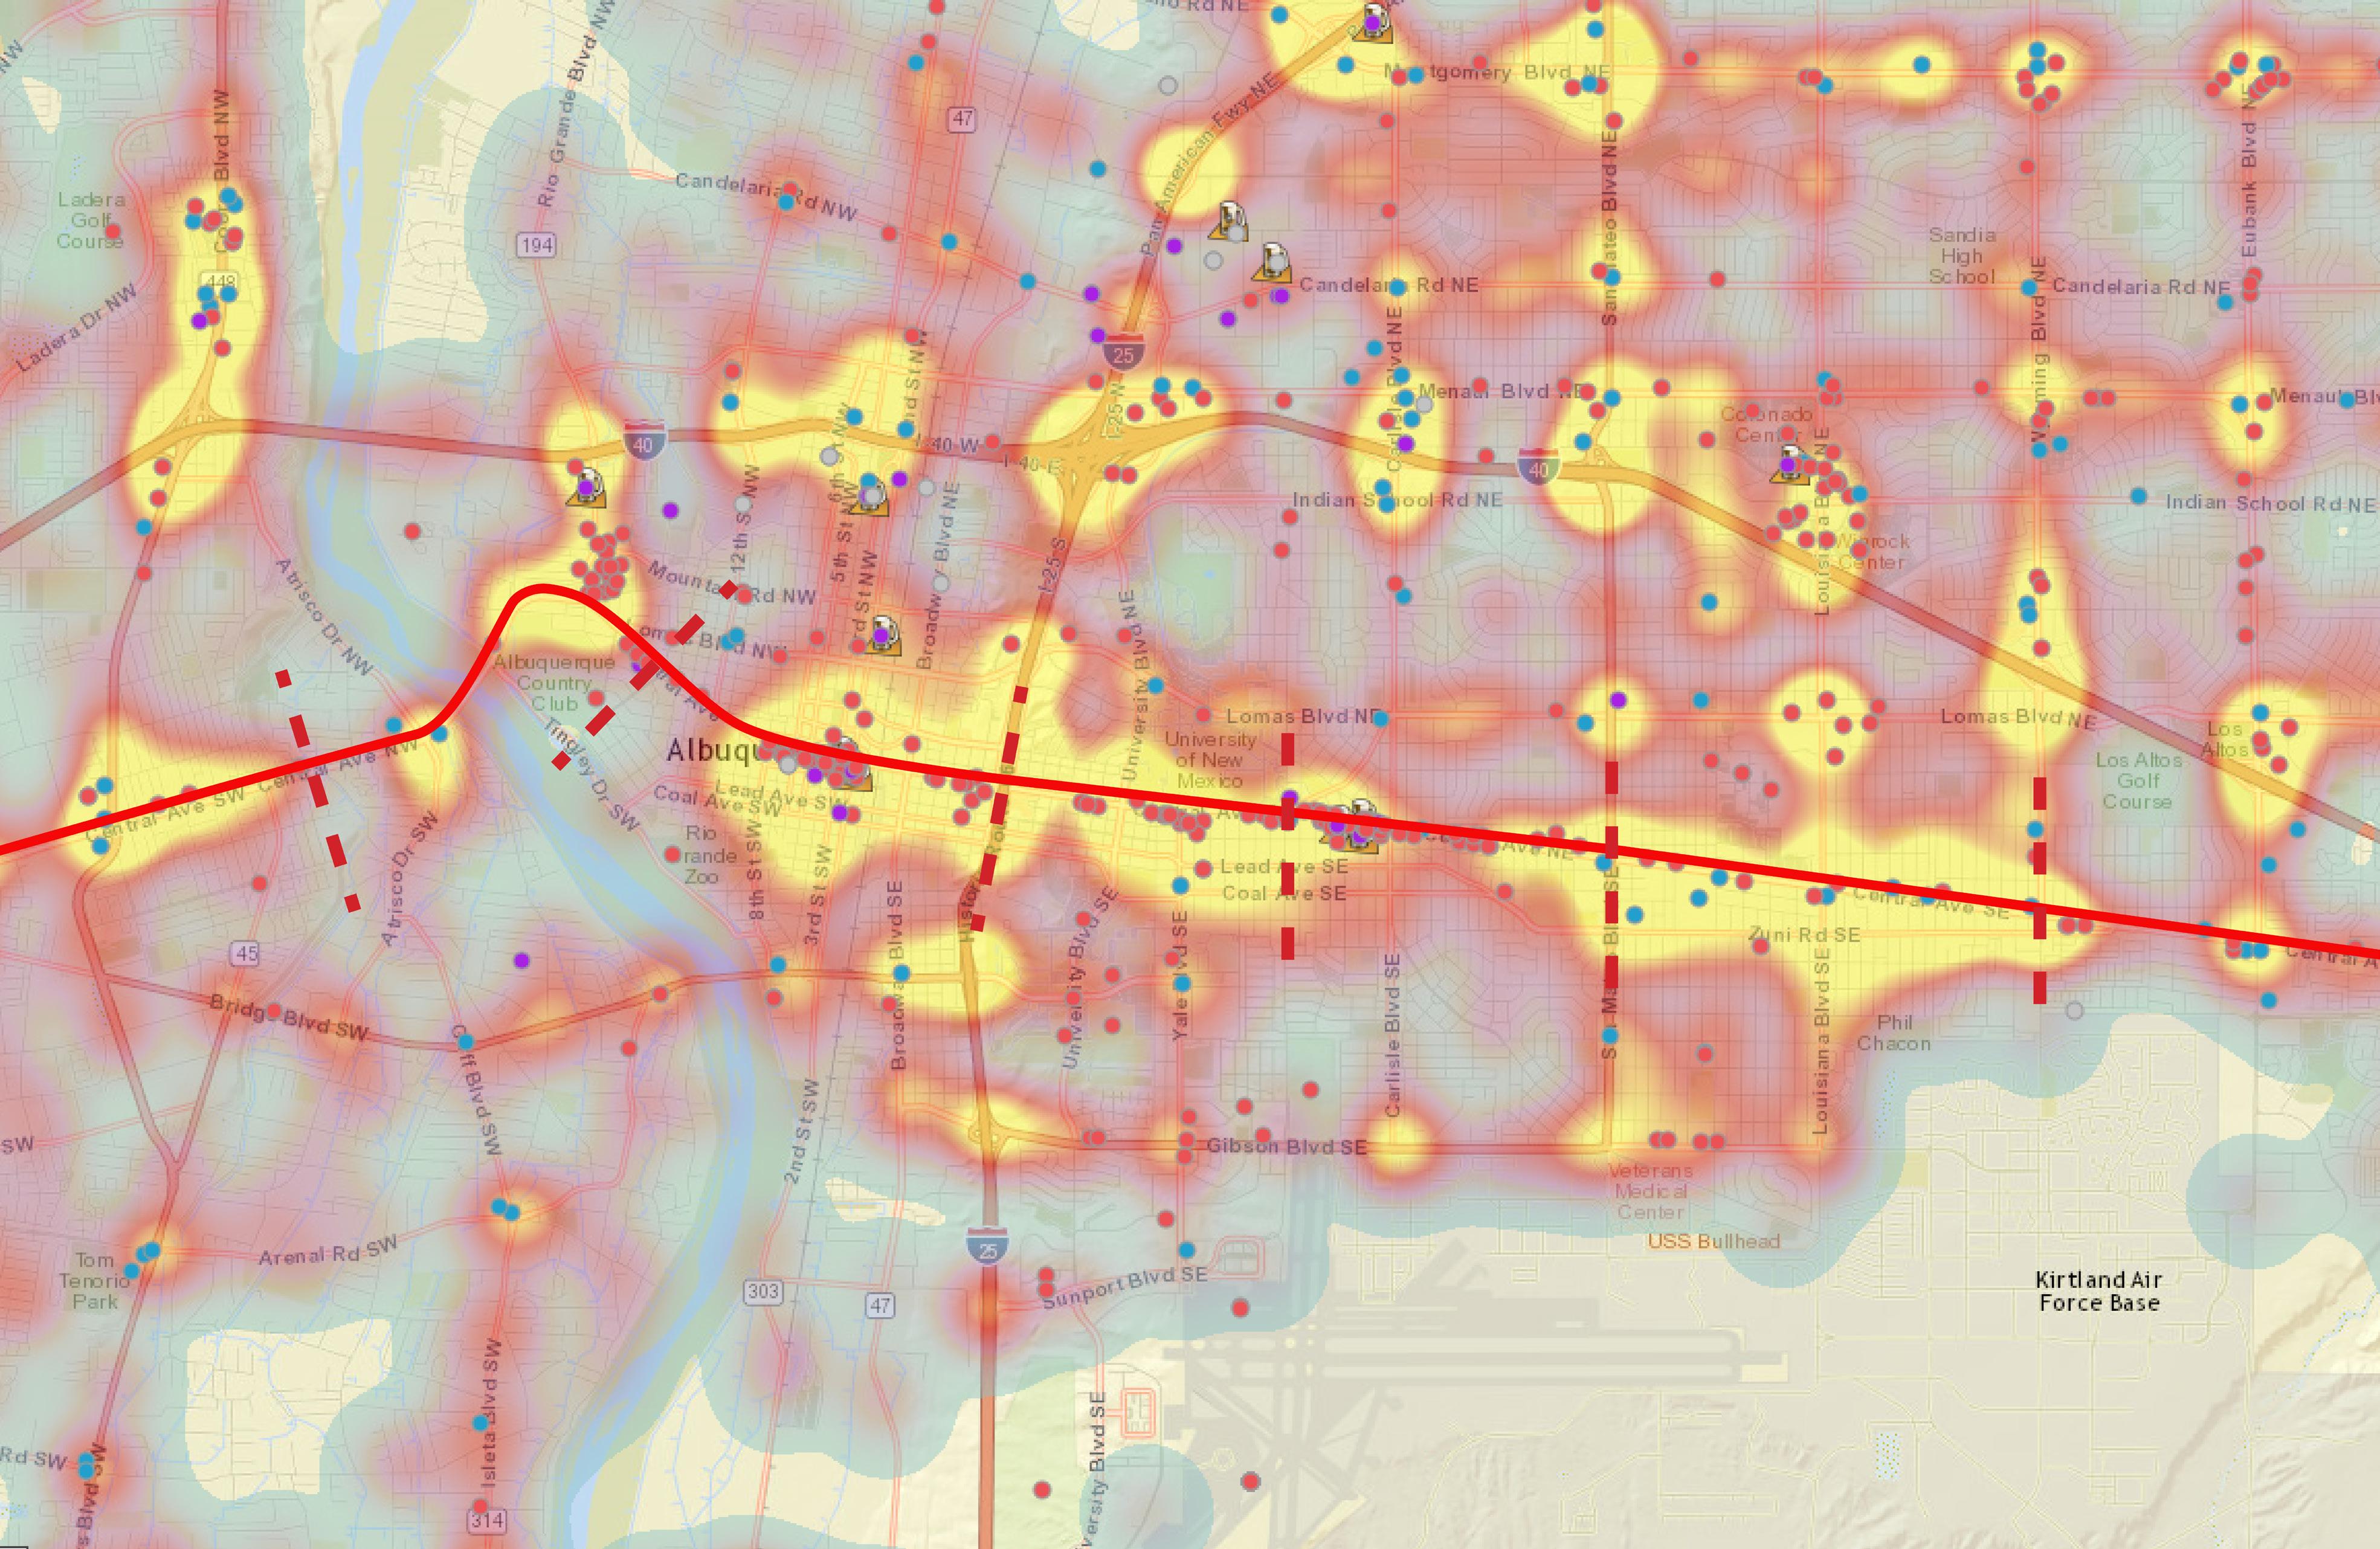
FOOD ACCESS - Liquor Licenses and Liquor Related Crashes
The Central Corridor Neighborhood Study by UNM
hill international district east gateway

Source: NMCDC.com
Accessed: NOV:2016 Legend
ART Route Community Boundaries
All Liquor Licences . 2016

Alcohol Involved Motor Vehicle Crashes. All New Mexico. 2010-2014


ENVIRONMEN TAL QU ALIT Y - Air Pollu tion Sites
Central Co rrido r Neighb orh ood Stu dy by UNM
The Atrisco area was originally settled by Puebloans of Tiwa descent (circa 1100-1500) and later became the Town of Atrisco, established as a Spanish Land Grand in the 1700s. The central plaza for the original Atrisco settlement was actually located further south in the valley at the Five Points intersection on Bridge Avenue. The central feature for settlers to this area was the Atrisco Ditch, known as the Acequia Madre, one of the oldest features within the community that is still kept as a natural channel. The many acequias that weave through the area today are hidden behind houses and underneath paved streets, but were once the lifelines of a landbased way of life.
In the 1920s the Middle Rio Grande Conservancy District took ownership of the acequias and they were repurposed to help control for flooding, with the channeling and straightening of the Rio Grande River. Nowadays, Atrisco still retains some of its original agricultural character seen by the presence of small farms, mature trees, and traditional New Mexico building types, often of adobe construction. Rural and traditional settlement patterns can be observed via lot layouts which are larger and of various shapes with small building footprints and non-linear streets, but indeed some bedroom-planned communities also persist.
The commercial district is concentrated within a block along Central Avenue and lacks the same strong sense of place evident in the residential areas, but is nevertheless anchored by some keystone places strongly valued by the community (i.e. El Super, Ace of Hearts, and the Monte Carlo). Two monstrous big box developments are located across the street from each other at
the corner of Atrisco and Central Ave and together total over 26 acres. Within most of the commercial area can be found shopping strips where; landscaping is limited and parking lots prevail, lacking shade, containing limited handicap accessibility, and providing inconsistent sidewalks.
The Atrisco area’s population is smaller than the other study areas, around 3,500 people, with a higher number of Latino or Hispanics (86%) making up this population. Poverty rates are high (43%) and this is especially true for the neighborhoods below Central Avenue whose median incomes average $25,000. Unemployment rates hover around 7% and 18% of residents suffer significant housing cost burdens, meaning they are spending more than 35% of their income on housing costs (i.e. rent, mortgage).
The social indicators are also concerning, with childhood obesity rates at 40% among children grades K-5 and nearly 30% of the population over age 18 reporting spending no leisure-time physical activity. Yet median ages are younger (29) and household sizes are normal (2.5), with life expectancies growing for this area (increased 2.2 years between 2007 and 2011). The built environment is made up of a large amount of both vacant and empty lots (38 acres) and mostly owner-occupied units (68%) at limited residential densities (3 du/ac), which are located along super blocks (722’) that are much larger than traditional city blocks (660’). For example, the distance from 47th Street to Atrisco Street is over a quarter of a mile long.
Samuel Fantaye Joshua Hernandez
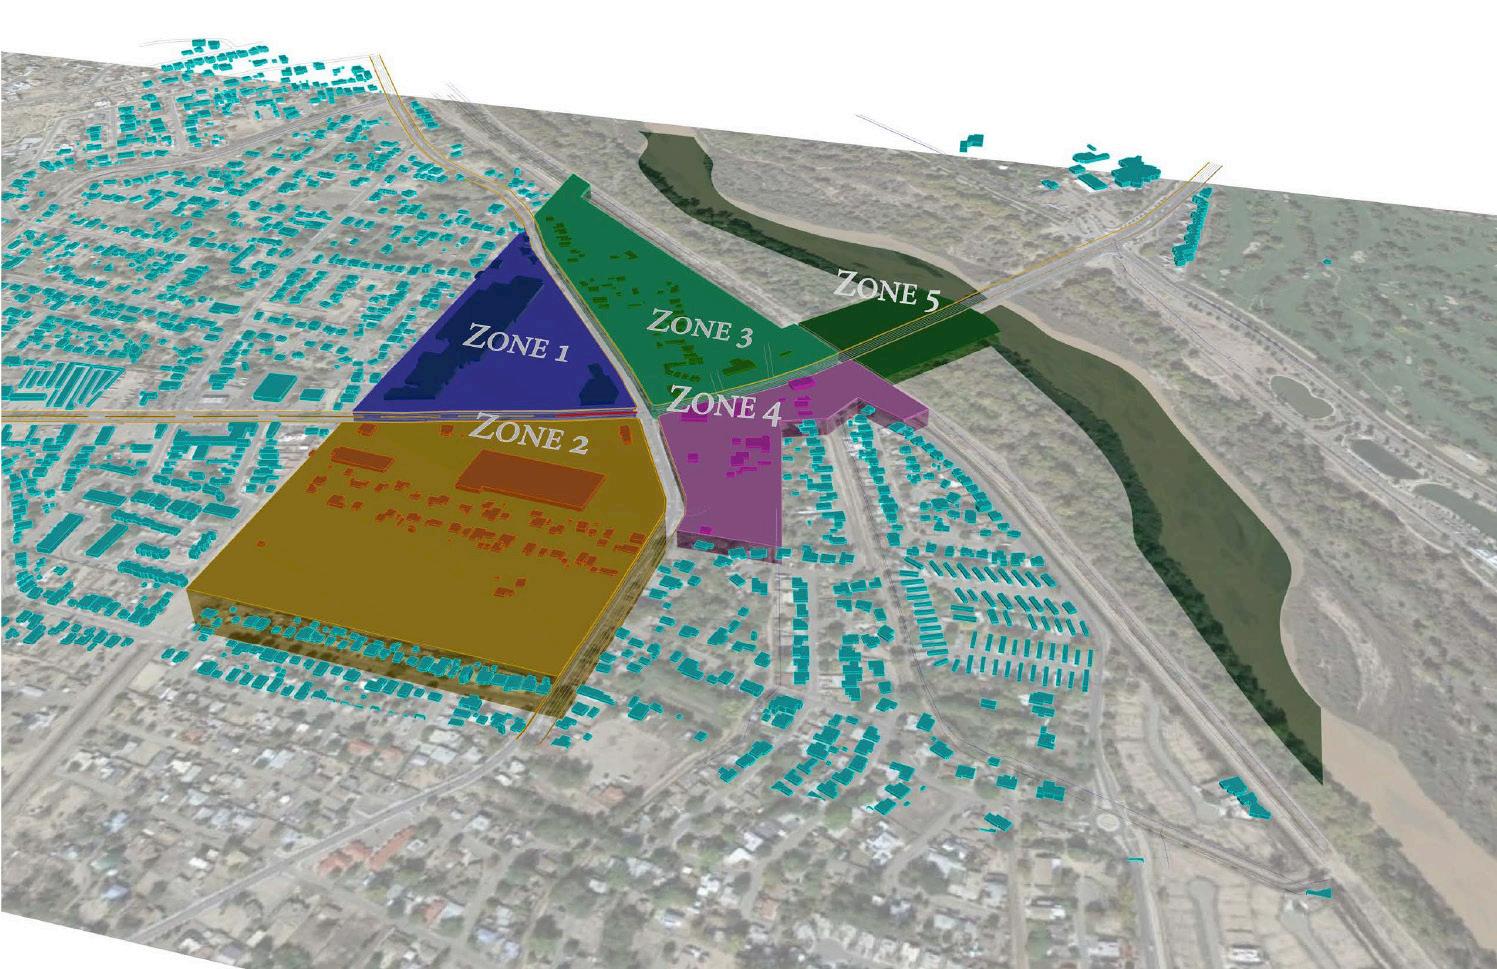
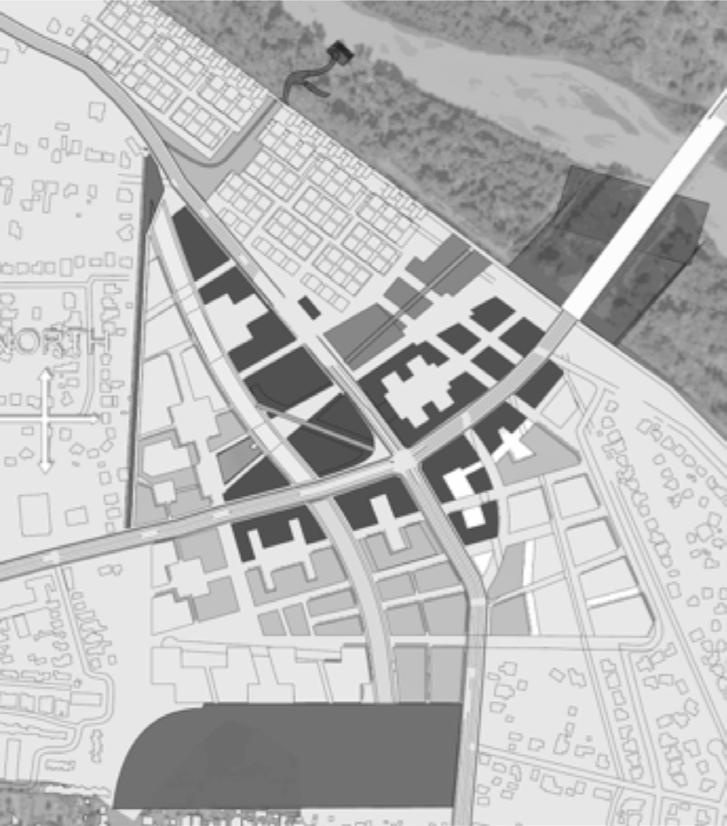
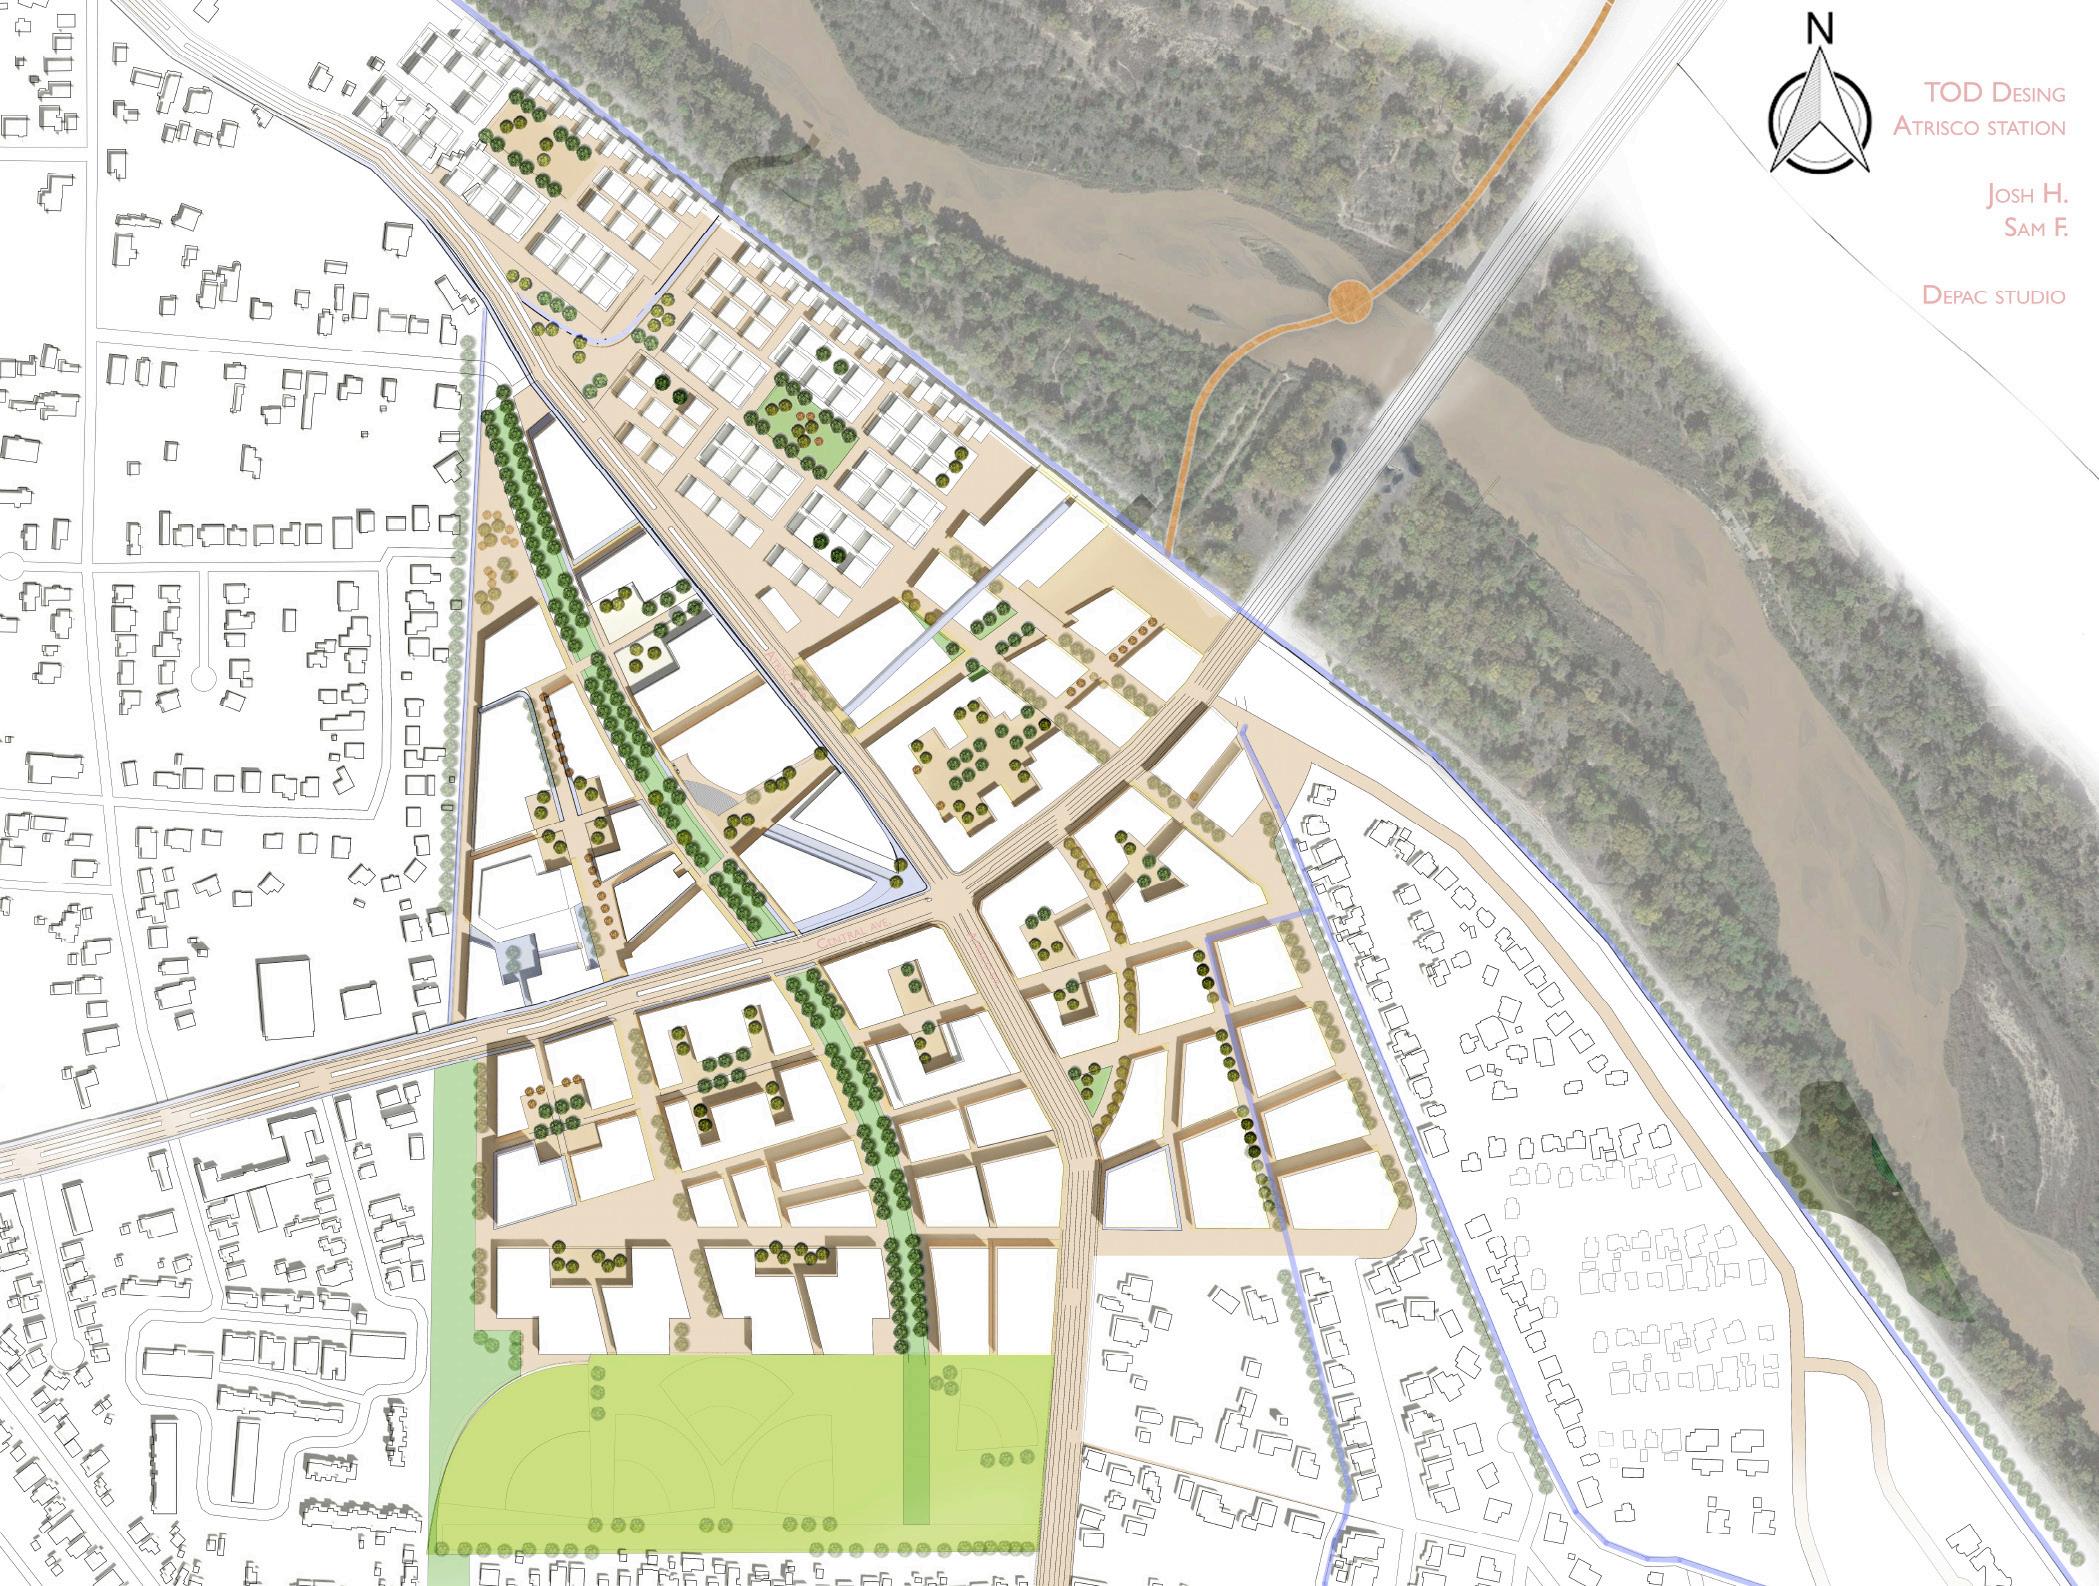
The goal of the Atrisco TOD proposal is to create a gateway destination that speaks to the agricultural history of the area while promoting an urban garden setting around the Atrisco stop by adding new pathways along existing acequias and connections to the Rio Grande.
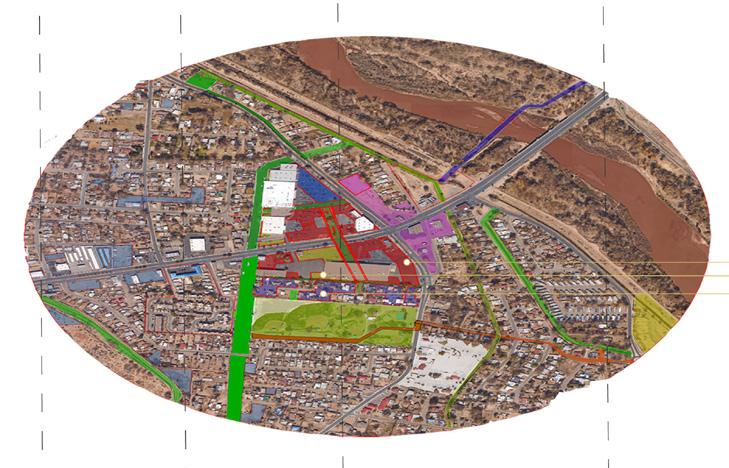

Density is increased with multi story mixed use buildings and medium density residential development
The acequias become pathways connecting natural and urban areas
The Grande Plaza corridor is a focal point - an intersection of multiple access routes and a place for formal and informal functions - a safe place for pedestrians, that is well-shaded, and pleasant, and includes:
Pedestrian walkways Streetside parking Driving lanes multi use areas
The spatial structure of the development is realized in five zones:
Zone 1 Commercial + Parking
Zone 2 Residential + Commercial
Zone 3 Primarily residential
Zone 4 Commercial
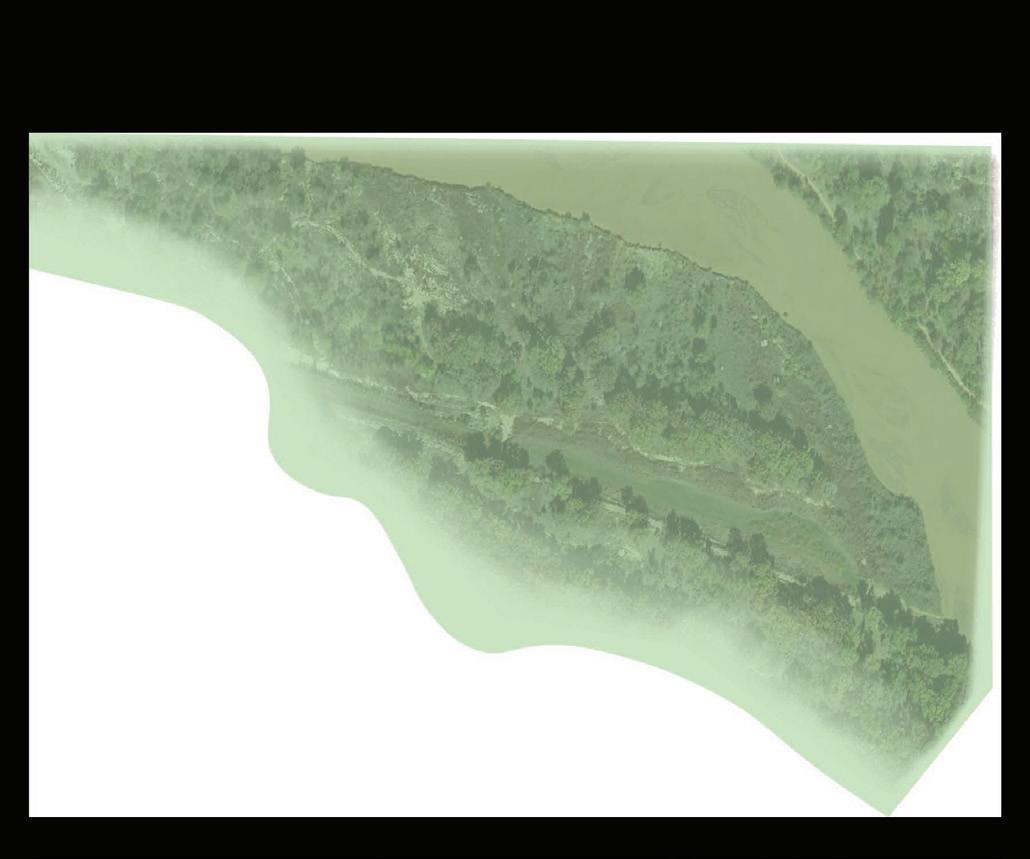
Zone 5 Bridge + bosque park

Atrisco
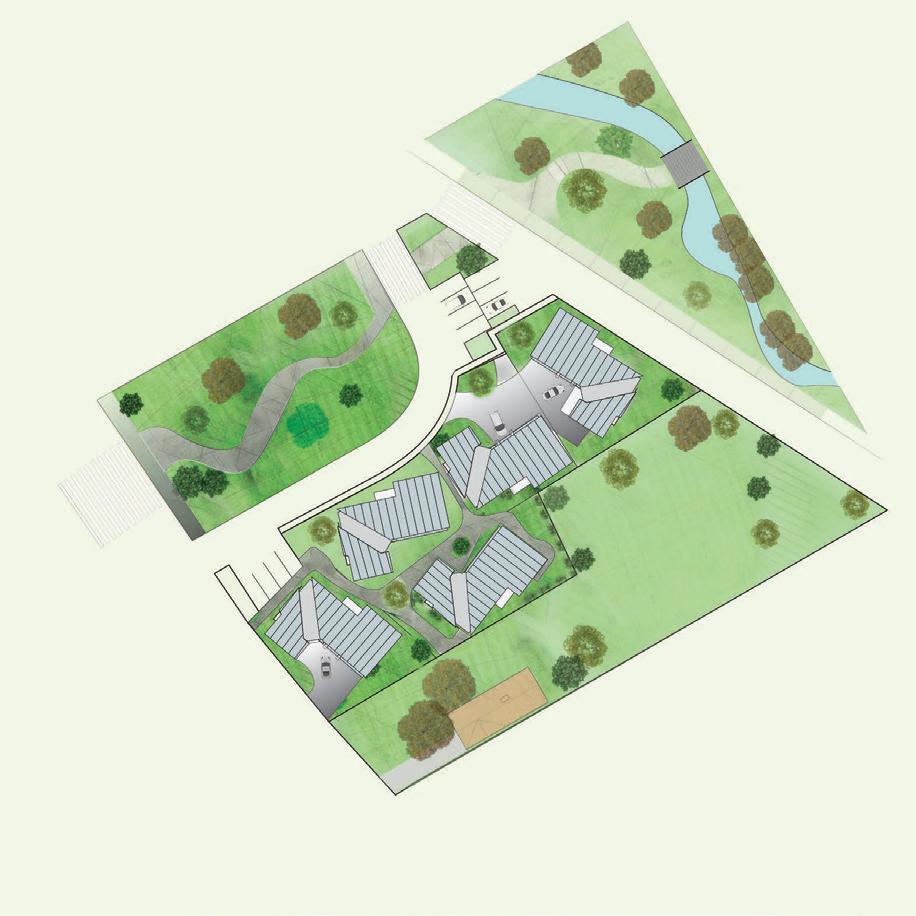
Housing Development : Chosen Site


Joshua Hernandez


Housing Development : Footprint

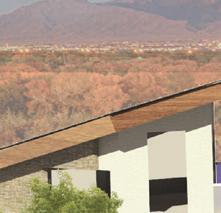
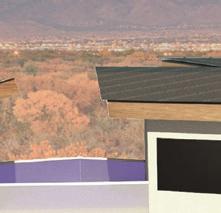
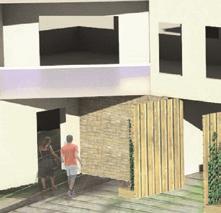
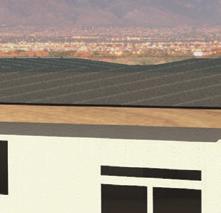
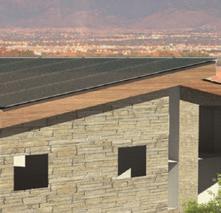
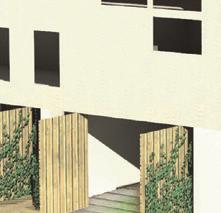
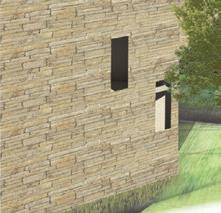
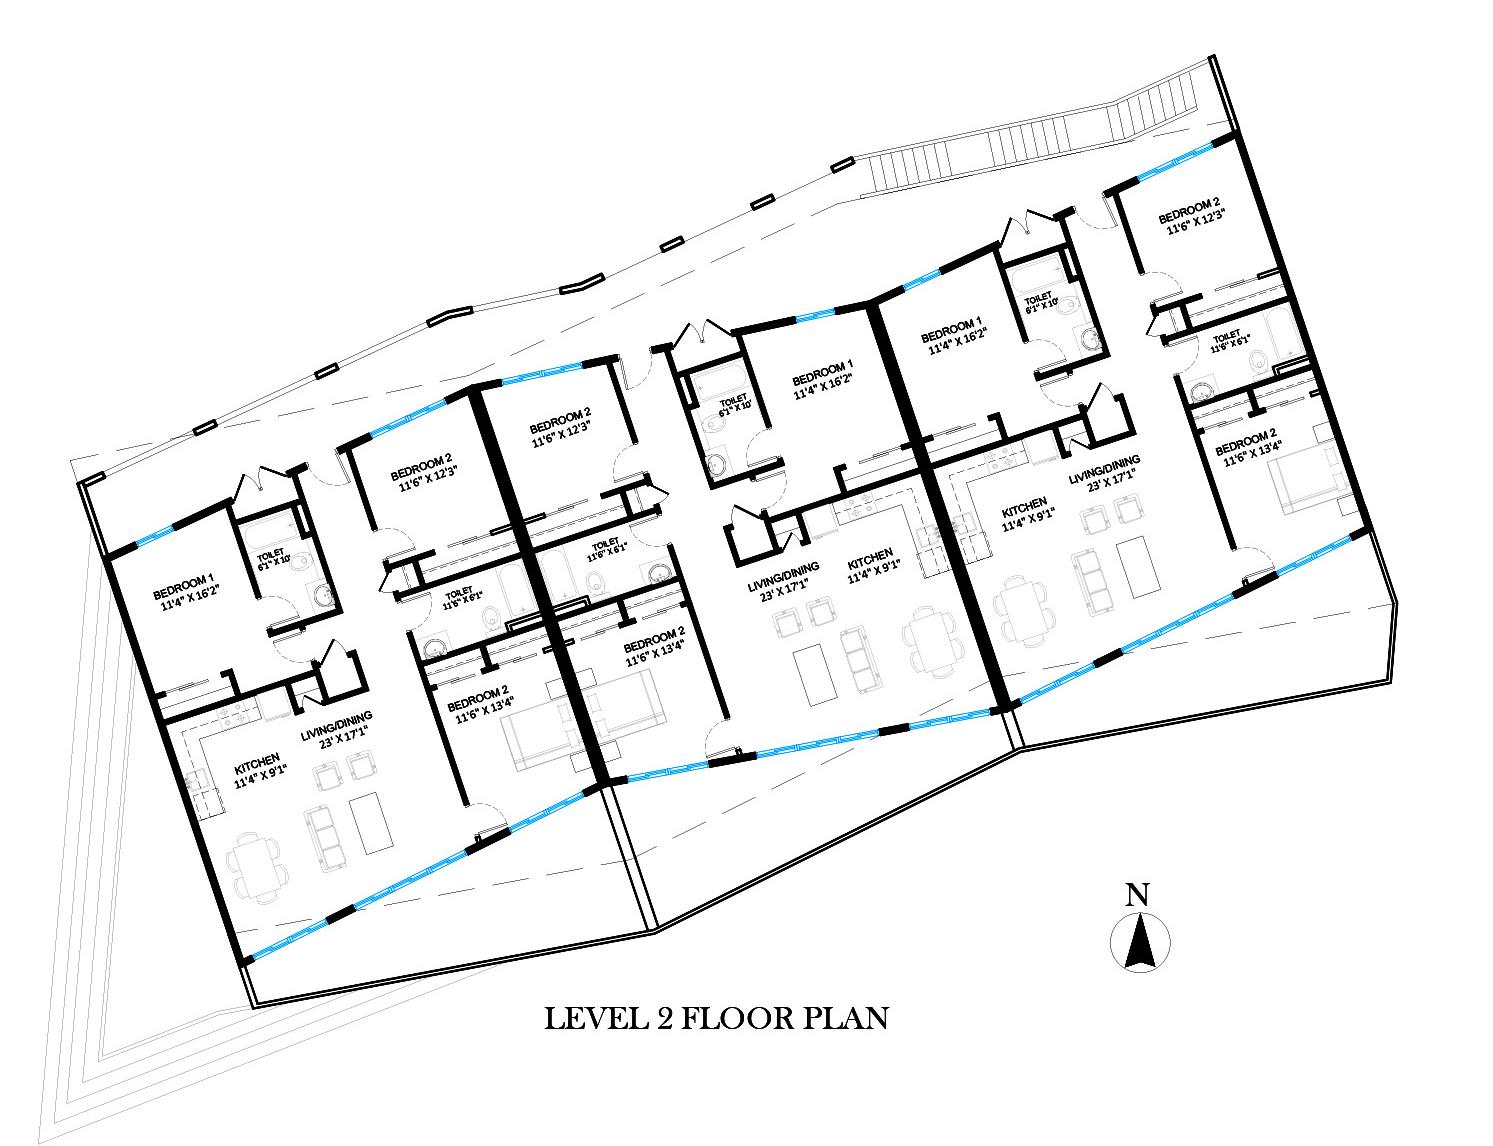
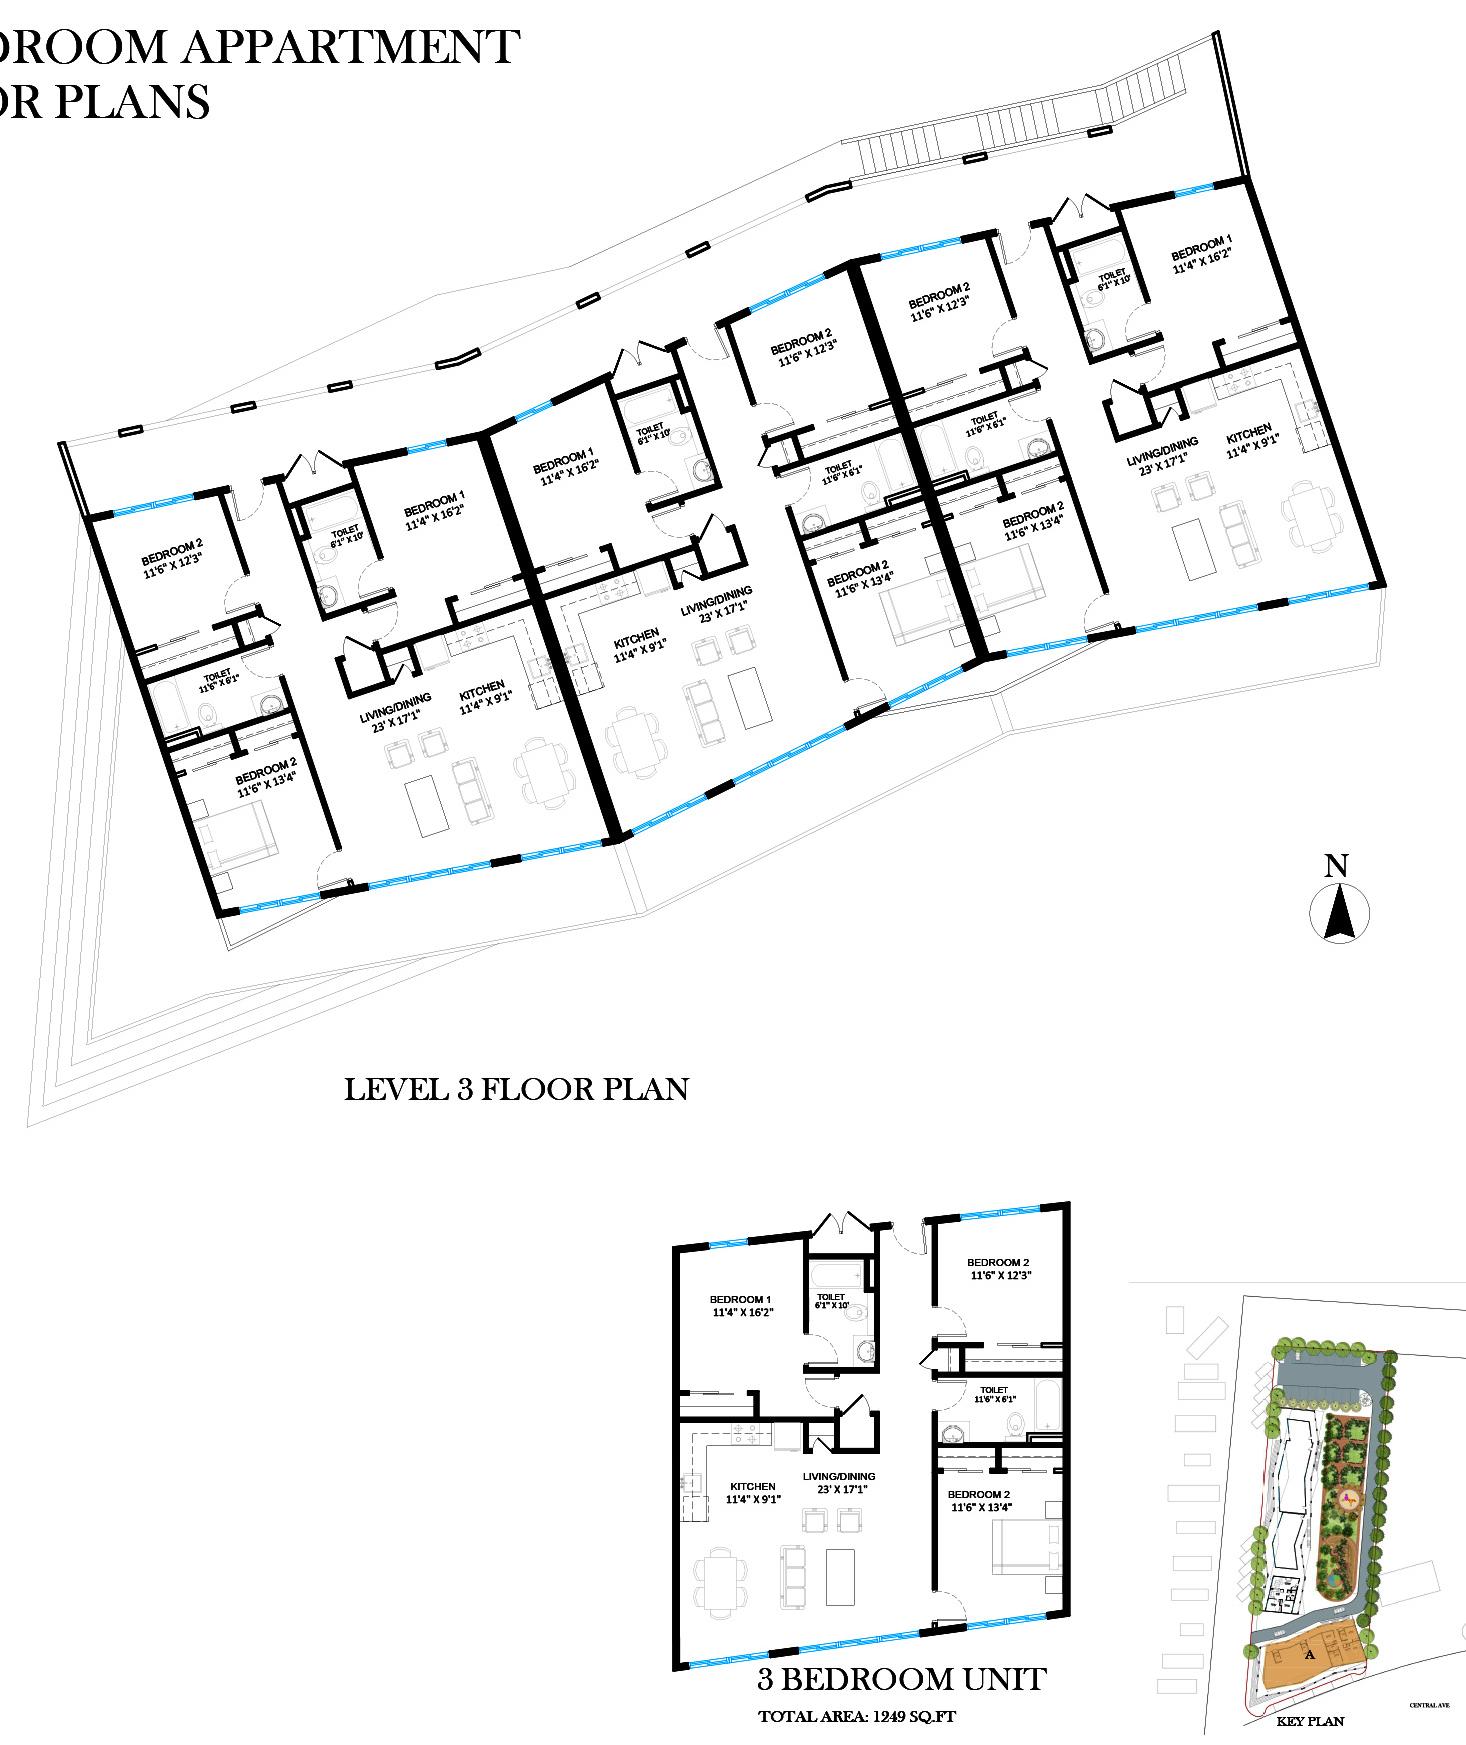
an s shaped structure allows for maximum views and sunlighting. it also fits well on to the lots available to design on. the housing structures will be constructed in between a
and a farm creating green space views in 3 directions from the site. This site is located at the farthest northern end of the atrisco plaza.


Housing Development : Site plan


Some of the homes are 3 floos and some are 2 floors. this provides multiple elevation to the project while creating views over the top of the 2 story structures.
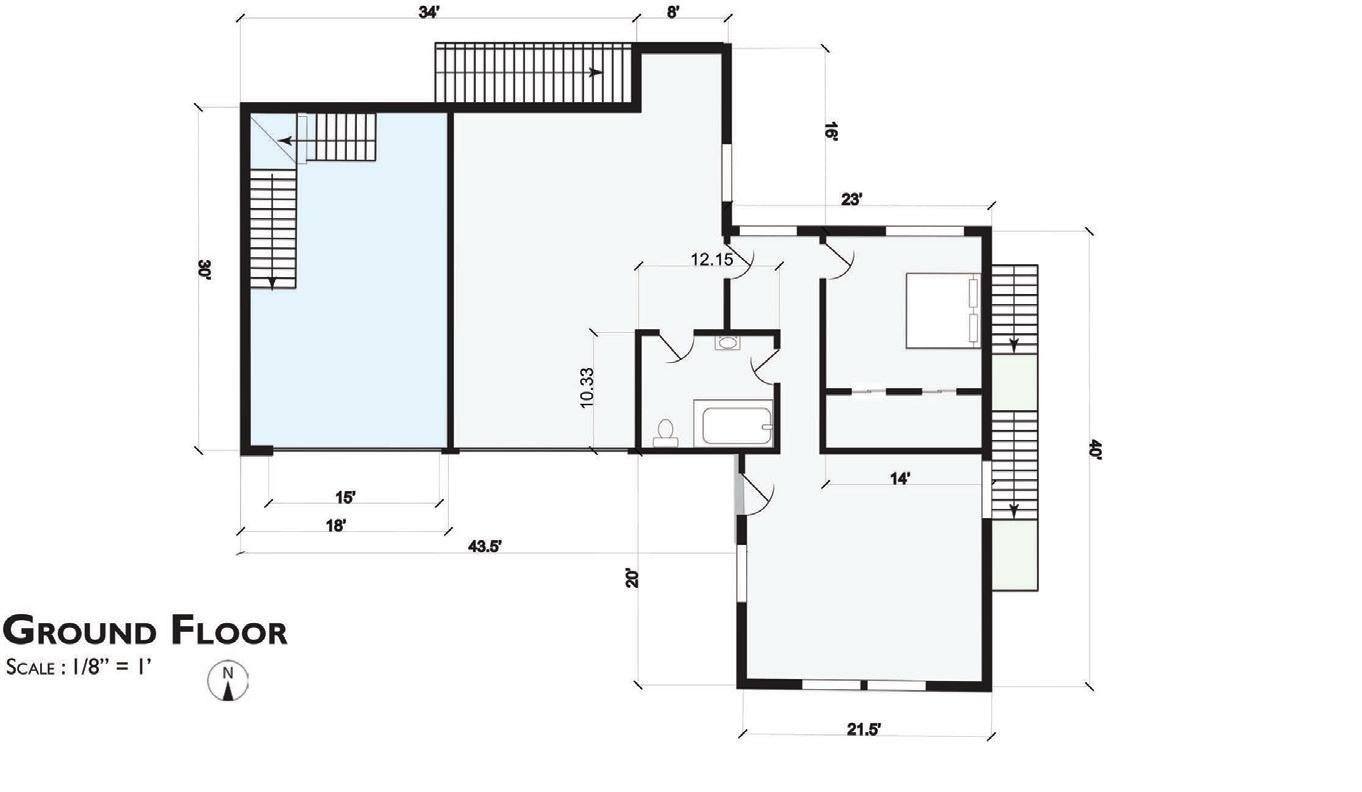
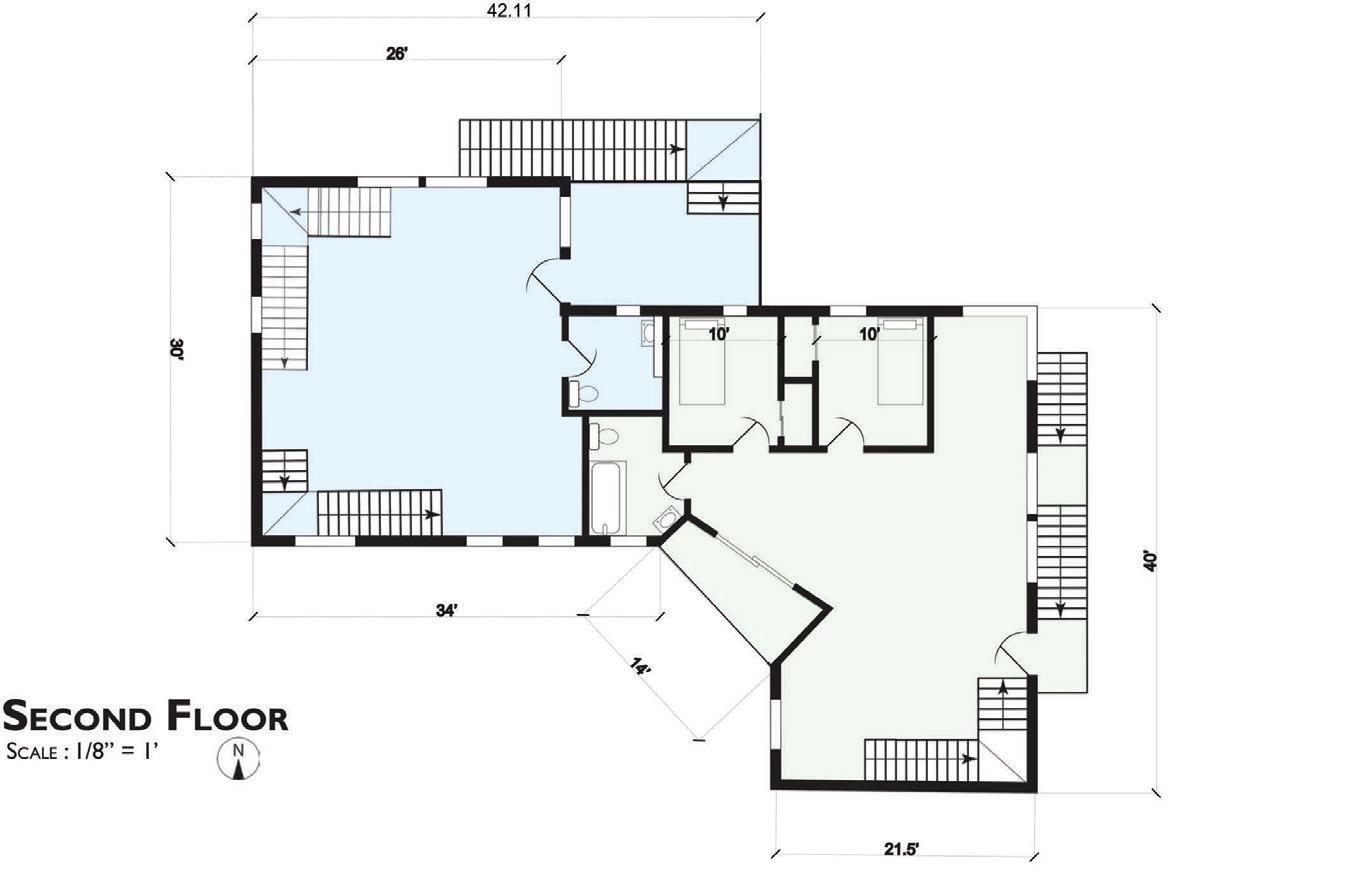
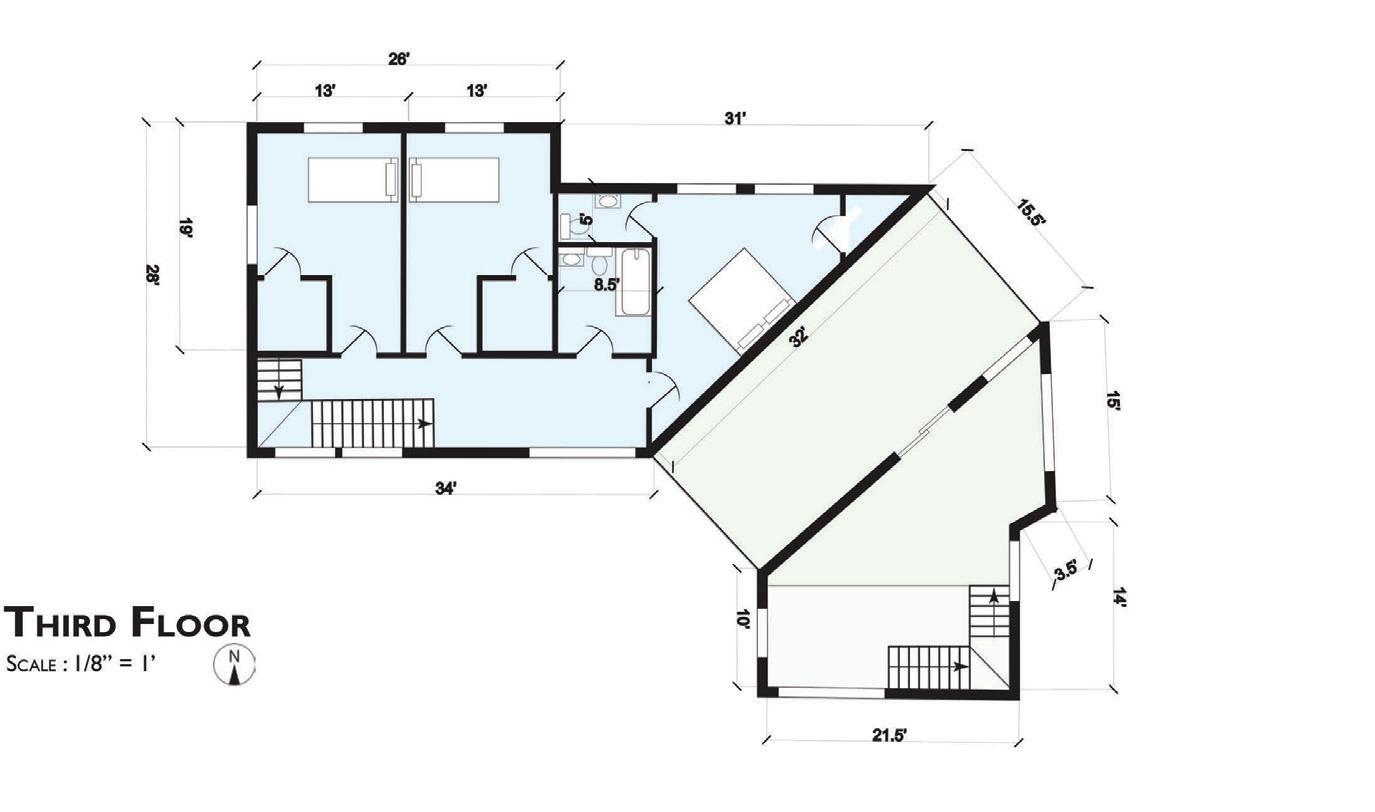











New Planning
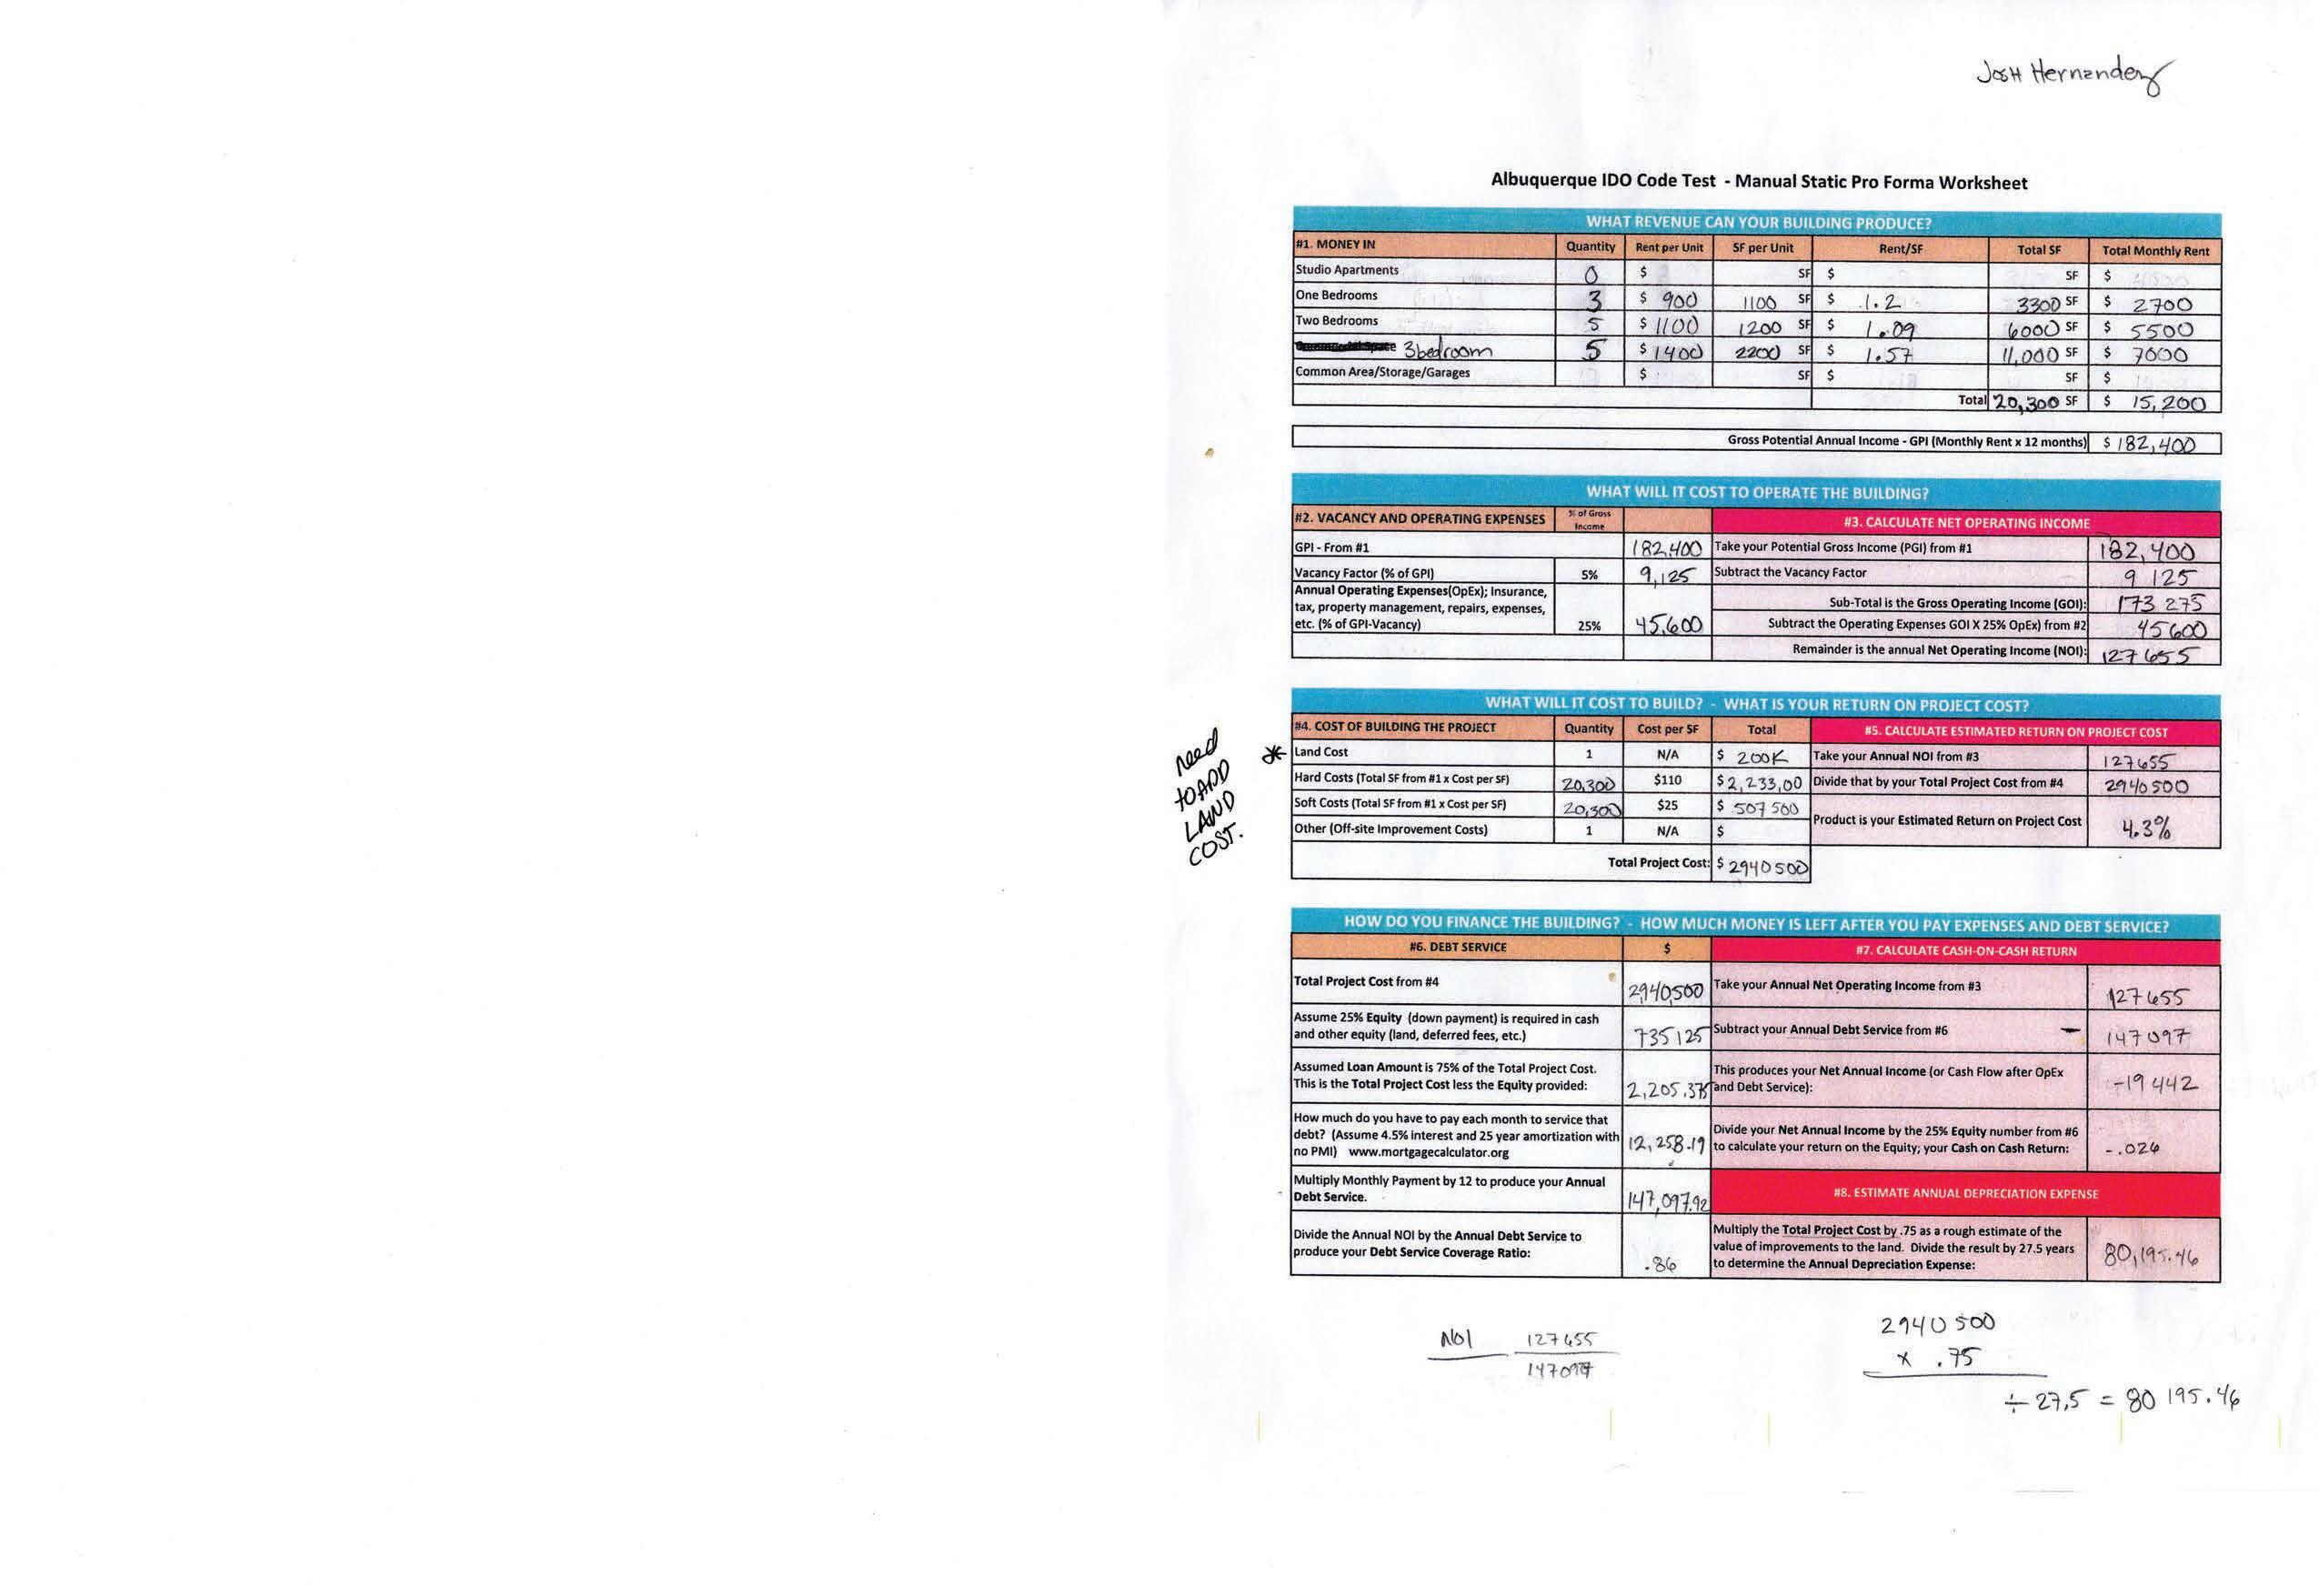
multifamily designs tested the could meet this property severely bring the townhomes ART system to the river park approx.
DU. This is already and school busses undesirable only one trash filled yard townhomes
Community Map: UNIVERSITY ATRISCO
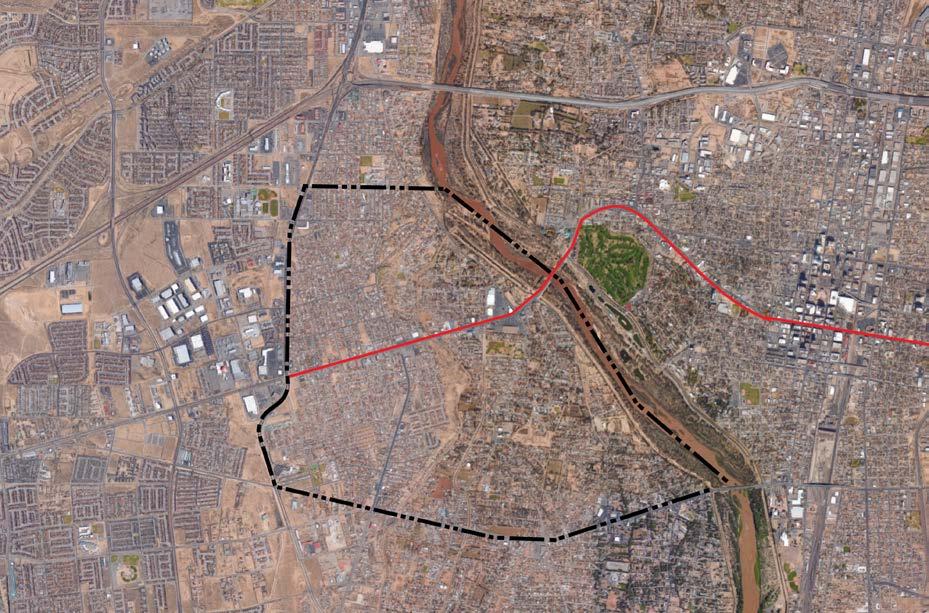
LAND USE - Aerial Photograph
The Central Corridor Neighborhood Study by UNM

Source: Accessed: FEB:2017
Proposed ART Stops ART Route Community Boundary 1/2 Mile Radius

Location Map

Community Map: UNIVERSITY ATRISCO
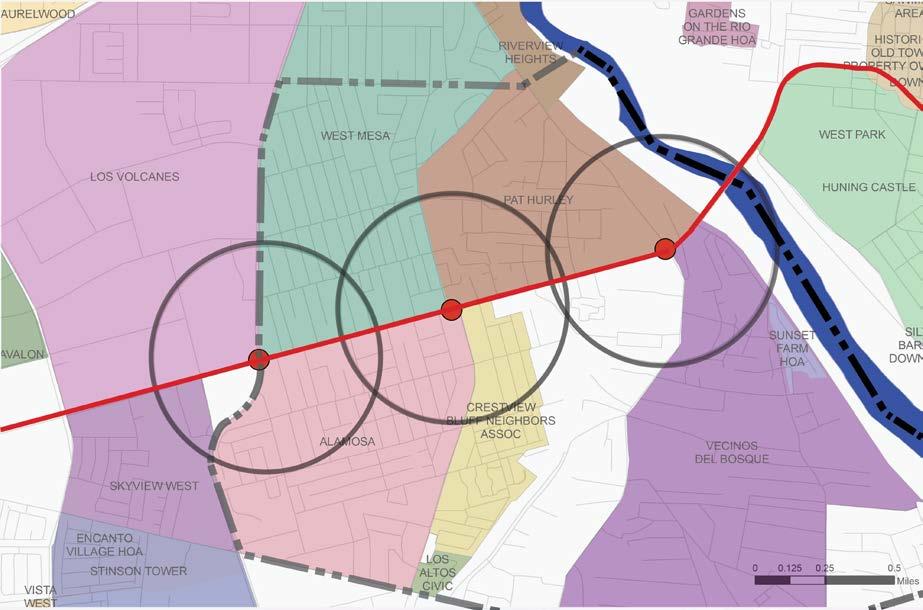
The Central Corridor Neighborhood Study by UNM

Source: Accessed: FEB:2017
Location Map Legend
ART Route Community Boundary 1/2 Mile Radius
Proposed ART Stops

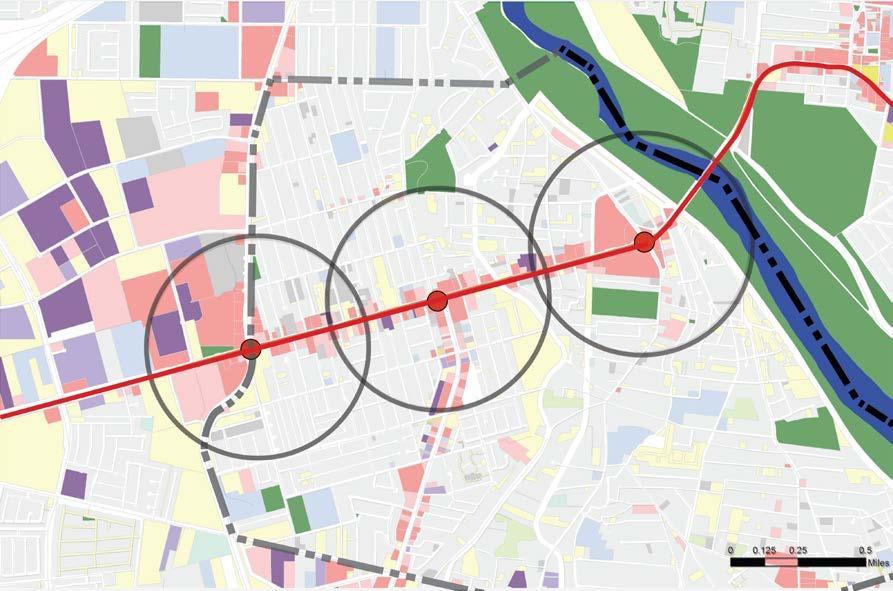
The Central Corridor Neighborhood Study by UNM Community Map:

Source: AGIS
Accessed: FEB:2017
Legend
ART Route Community Boundary 1/2 Mile Radius
Proposed ART Stops
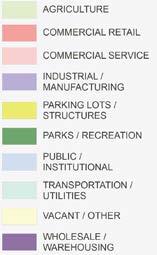
GENERAL LAND USE CATEGORIES

Location Map


The Central Corridor Neighborhood Study by UNM Community Map:

Source: AGIS.org
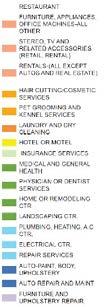
Accessed: FEB:2017 COMMERCIAL LAND USE
Location Map

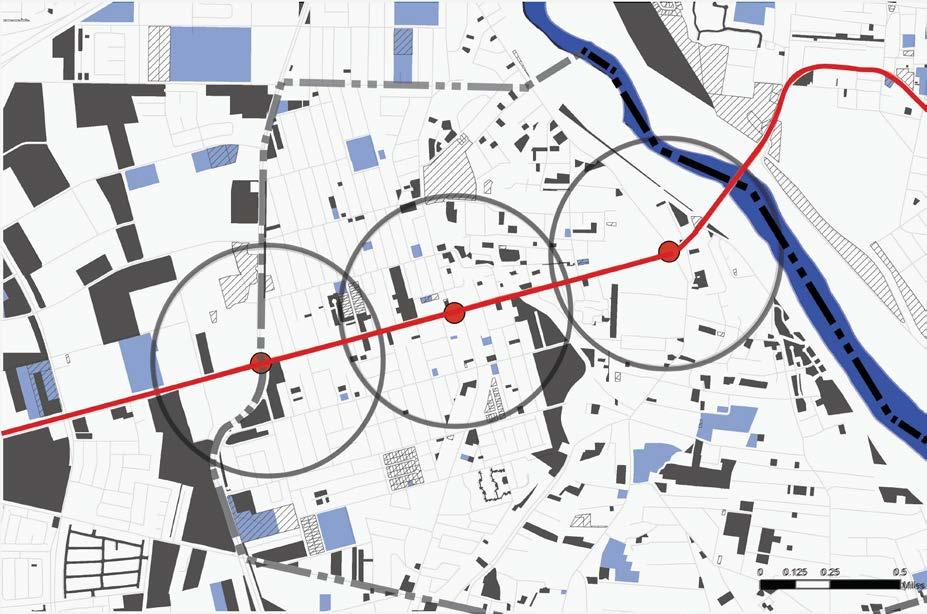
The Central Corridor Neighborhood Study by UNM

Mile Radius
Location Map
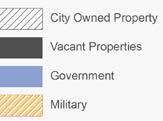
Source: AGIS.org Accessed: FEB:2017 CITY / STATE OWNED, VACANT AND UNDERUTIIZED LOTS

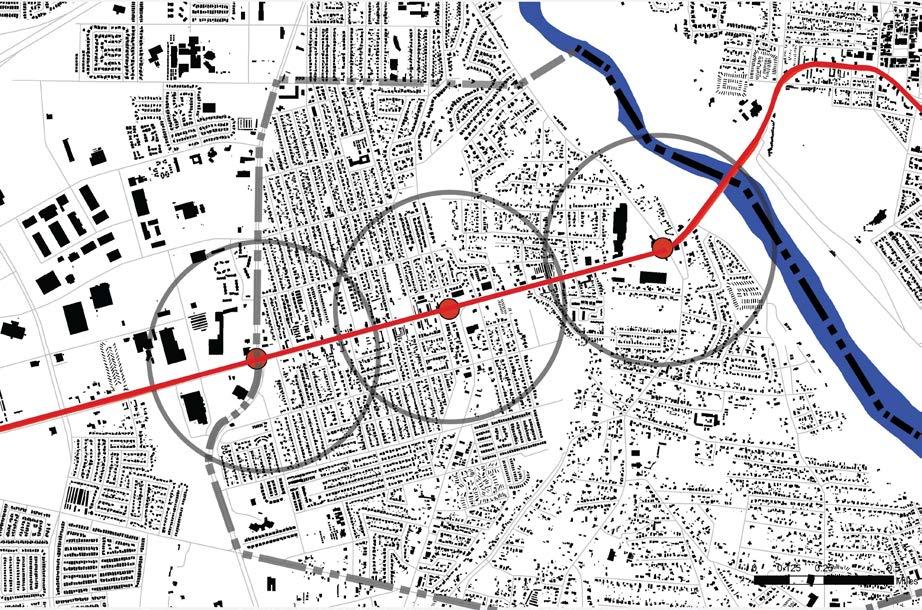
The Central Corridor Neighborhood Study by UNM

Source: Accessed: FEB:2017


Community Map: UNIVERSITY ATRISCO
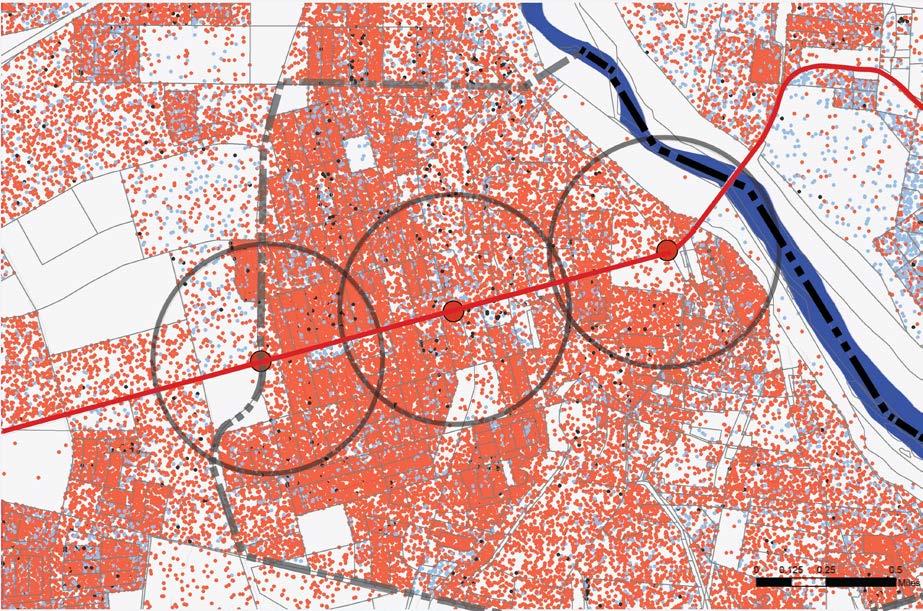
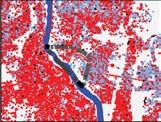
SOCIO-ECONOMIC - Racial and Ethnic Distribution
The Central Corridor Neighborhood Study by UNM

Source: Accessed: FEB:2017
Legend
ART Route Community Boundary
1/2 Mile Radius
Proposed ART Stops
ONE DOT = 5 PEOPLE

Non Hispanic - Other
Non Hispanic - Mixed Races
Non -Hispanic - White
Hispanic Location Map
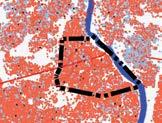

Community Map: UNIVERSITY ATRISCO

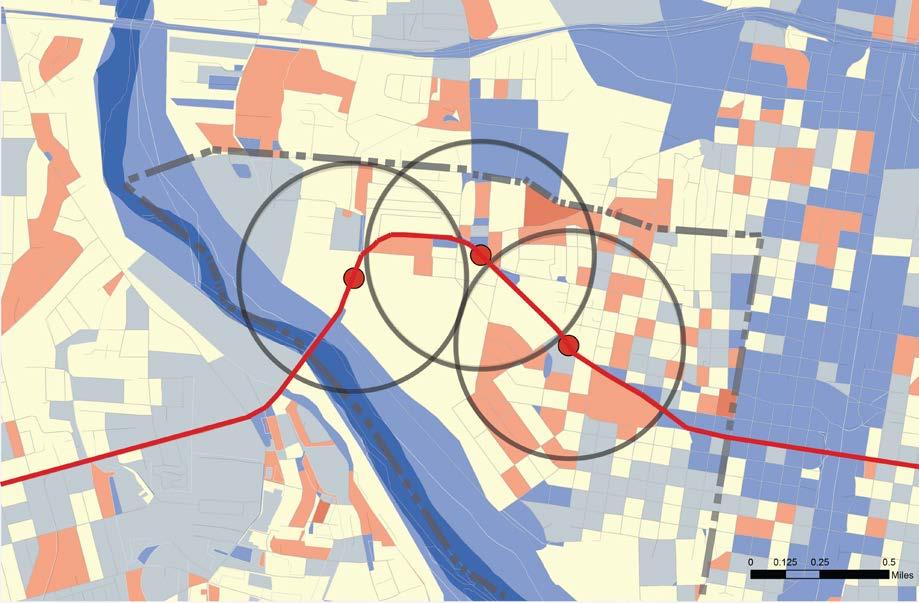
SOCIO-ECONOMIC - Median Age of Population
The Central Corridor Neighborhood Study by UNM

Source: NMCDC.com Accessed: FEB:2017

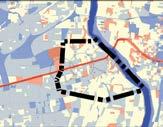
Location Map


SOCIO-ECONOMIC -Employment and Poverty Levels
The Central Corridor Neighborhood Study by UNM

Source: Accessed: FEB:2017
ART Route Community Boundary
1/2 Mile Radius
Proposed ART Stops
EMPLOYMENT DENSITY
Jobs per Acre
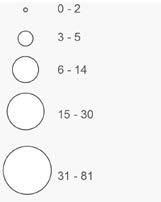
% FAMILIES UNDER 100% FEDERAL POVERTY LEVEL

Location Map

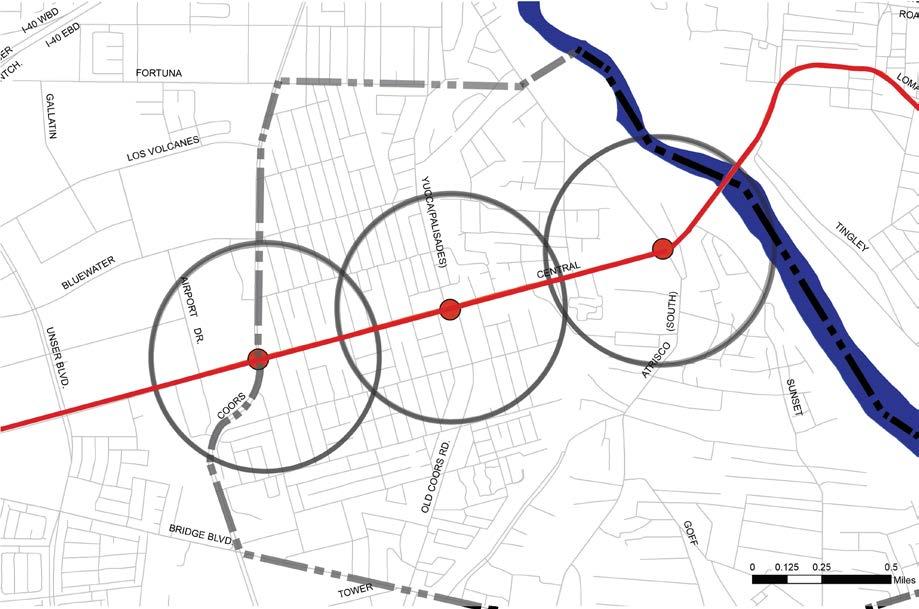
TRANSPORT - Local Roads
The Central Corridor Neighborhood Study by UNM

Source: AGIS
Accessed: FEB:2017
Location Map Legend
ART Route Community Boundary 1/2 Mile Radius
Proposed ART Stops


TRANSPORT - Local Bus Routes and Rail
The Central Corridor Neighborhood Study by UNM

Source: AGIS
Accessed: FEB:2017
ART Route Community Boundary 1/2 Mile Radius
Proposed ART Stops

Location Map

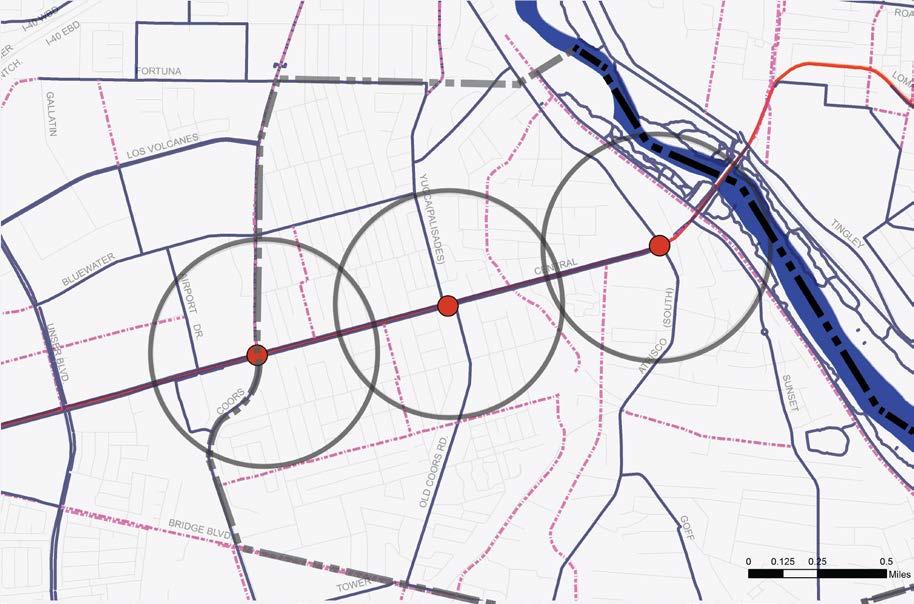
TRANSPORT - Bike Routes
The Central Corridor Neighborhood Study by UNM

Source: Accessed: FEB:2017
ART Route Community Boundary 1/2 Mile Radius
Proposed
ART Stops


Location Map

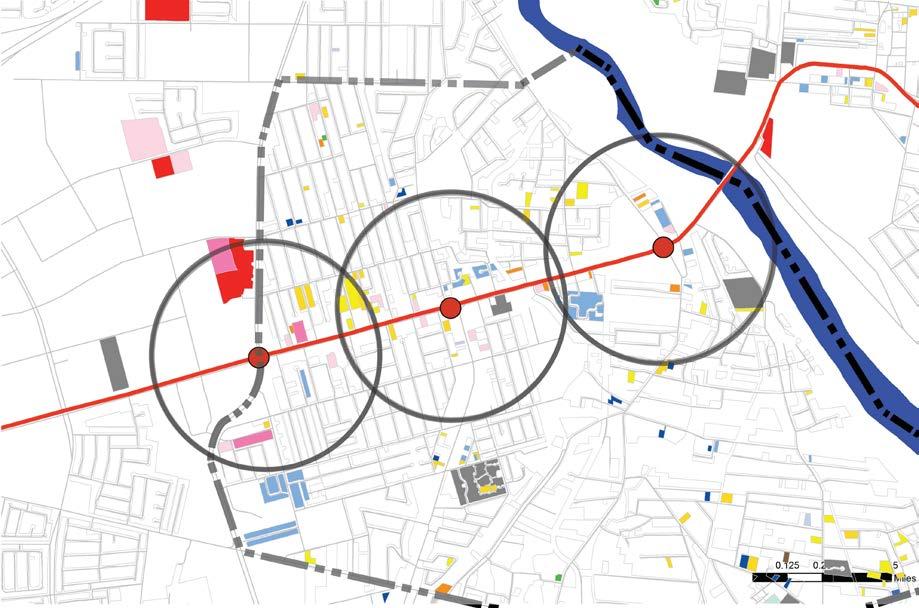
- Land Use
The Central Corridor Neighborhood Study by UNM

Source: AGIS Accessed: FEB:2017
ART Route
Community Boundary 1/2 Mile Radius
Proposed ART Stops


Location Map

Community Map: UNIVERSITY ATRISCO
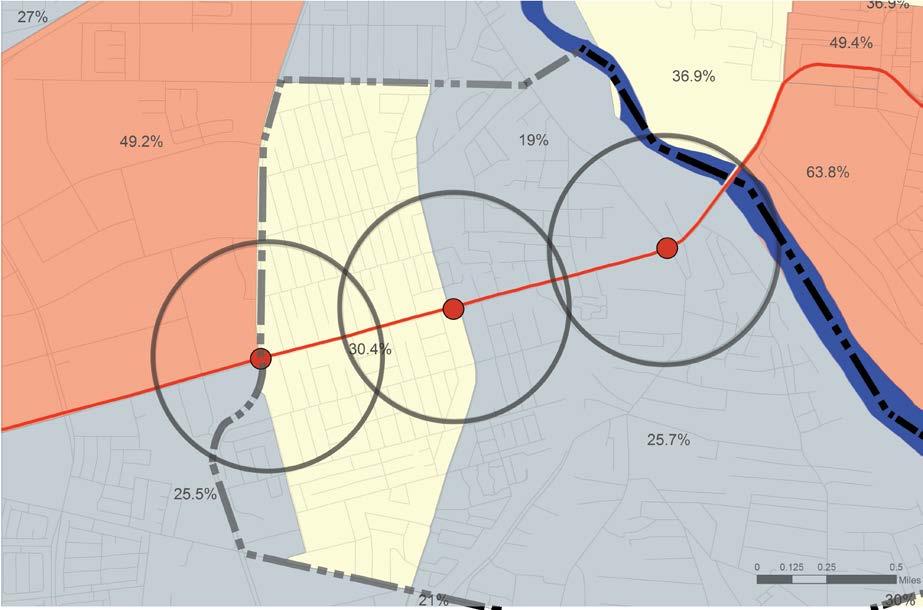
The Central Corridor Neighborhood Study by UNM

Source: AGIS Accessed: FEB:2017
ART Route
Community Boundary 1/2 Mile Radius
Proposed ART Stops
% RENTER OCCUPIED
Location Map Legend

Community Map: UNIVERSITY ATRISCO

The Central Corridor Neighborhood Study by UNM

Legend
ART Route
Community Boundary 1/2 Mile Radius
Proposed ART Stops
AGE OF HOUSING
Total Units built prior to 1970

PROPERTY VALUES
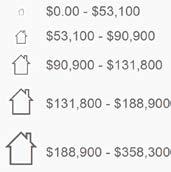

Location Map

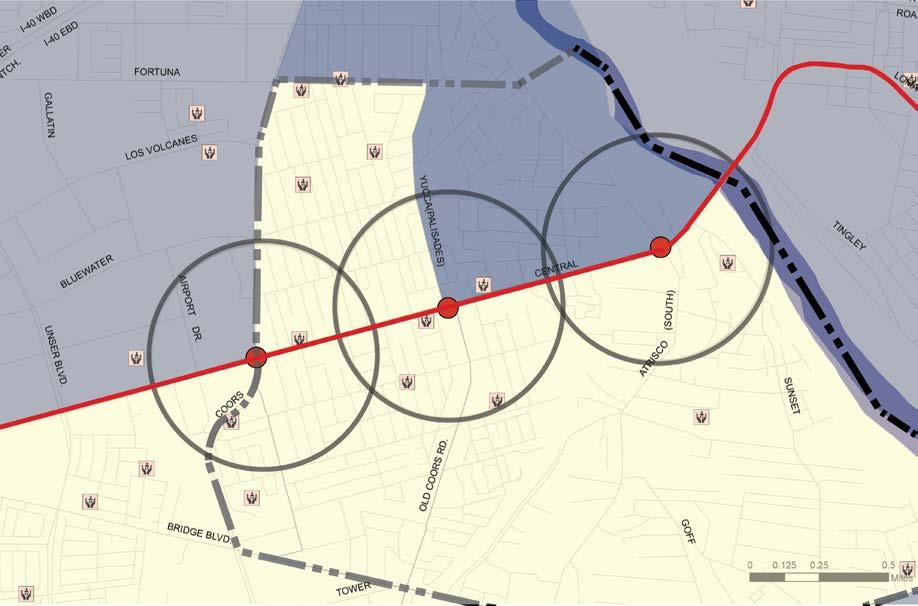
The Central Corridor Neighborhood Study by UNM Community Map: UNIVERSITY ATRISCO

Source: Accessed: FEB:2017
ART Route Community Boundary 1/2 Mile Radius
Proposed ART Stops
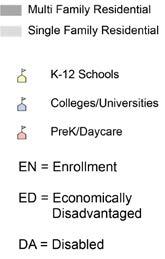

Location Map Legend

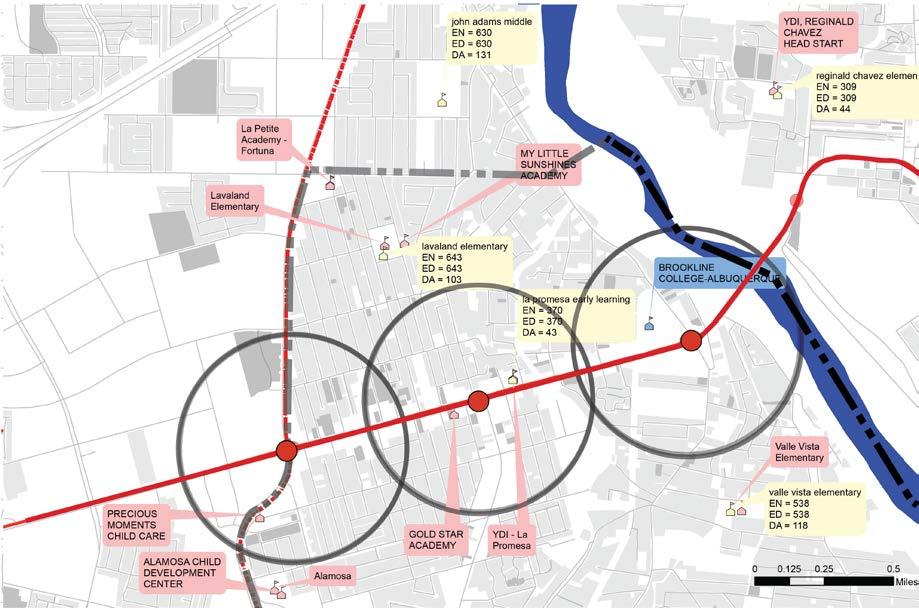
EDUCATION - Preschool Facilities and Vunerable Children
The Central Corridor Neighborhood Study by UNM Community Map: UNIVERSITY

Source: Accessed: FEB:2017
Legend
ART Route Community Boundary 1/2 Mile Radius
Proposed ART Stops

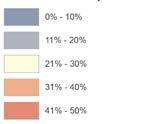
PERCENT FAMILIES UNDER 100% FEDERAL POVERTY LEVELS
Location Map

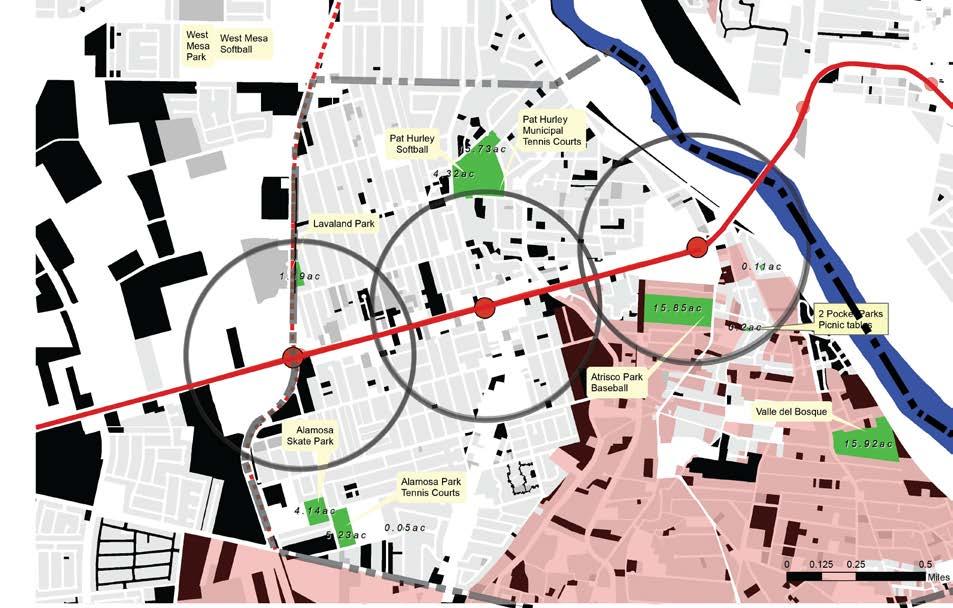
PUBLIC REALM- Public Open Space
The Central Corridor Neighborhood Study by UNM

Source: Accessed: FEB:2017
ART Route Community Boundary 1/2 Mile Radius
Proposed ART Stops

Location Map

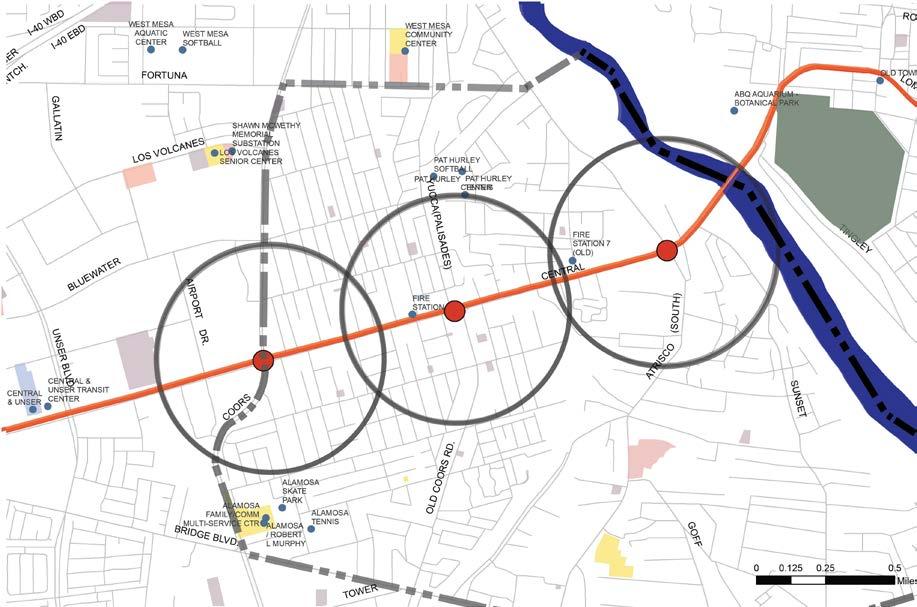
REALM - Community / Publicly Accessible Spaces
The Central Corridor Neighborhood Study by UNM

Source: Accessed: FEB:2017
ART Route Community Boundary 1/2 Mile Radius
Proposed ART Stops
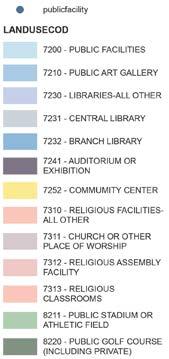
Public Facility
Location Map

The Central Corridor Neighborhood Study by UNM

Source: Accessed: FEB:2017
ART Route Community Boundary 1/2 Mile Radius
Proposed ART Stops
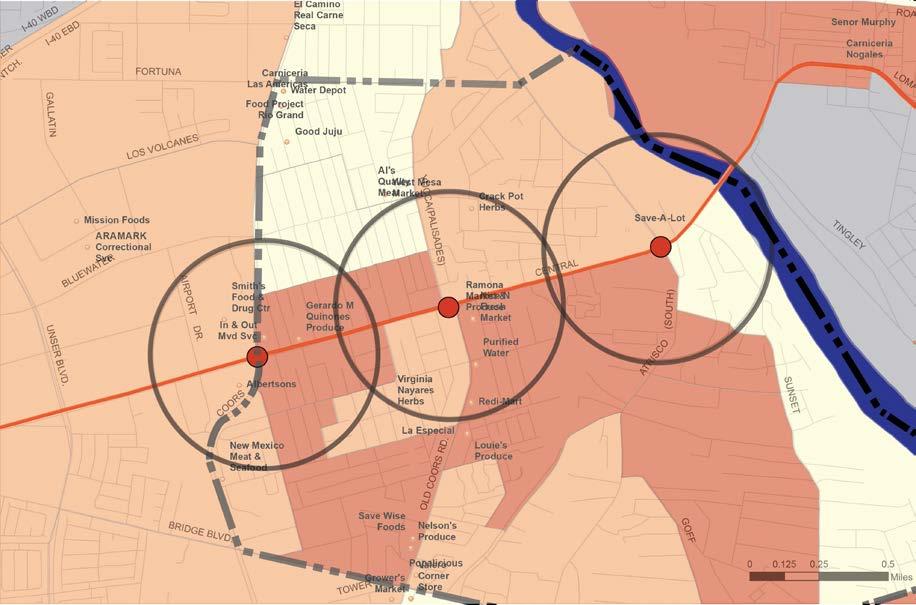
ESTIMATED OBESITYMEAN Food Suppliers / Stores 0

Location Map

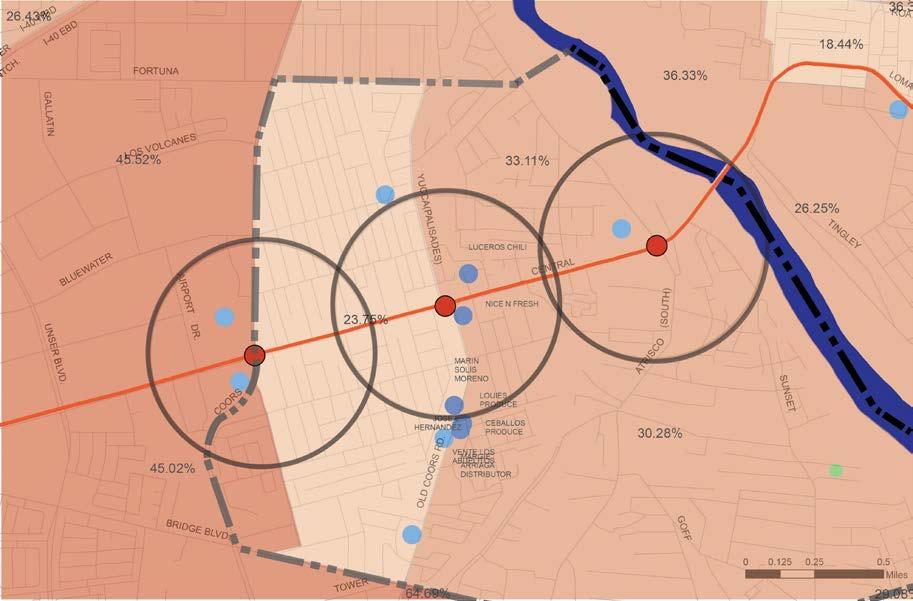
FOOD ACCESS - Access to Fresh food
The Central Corridor Neighborhood Study by UNM Community Map: UNIVERSITY ATRISCO

Source: Accessed: FEB:2017
ART Route Community Boundary 1/2 Mile Radius
Proposed ART Stops

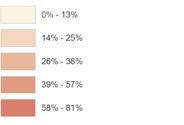
PERCENT OF LOW ACCESS, LOW INCOME PEOPLE AT 1/2 MIILE
Location Map

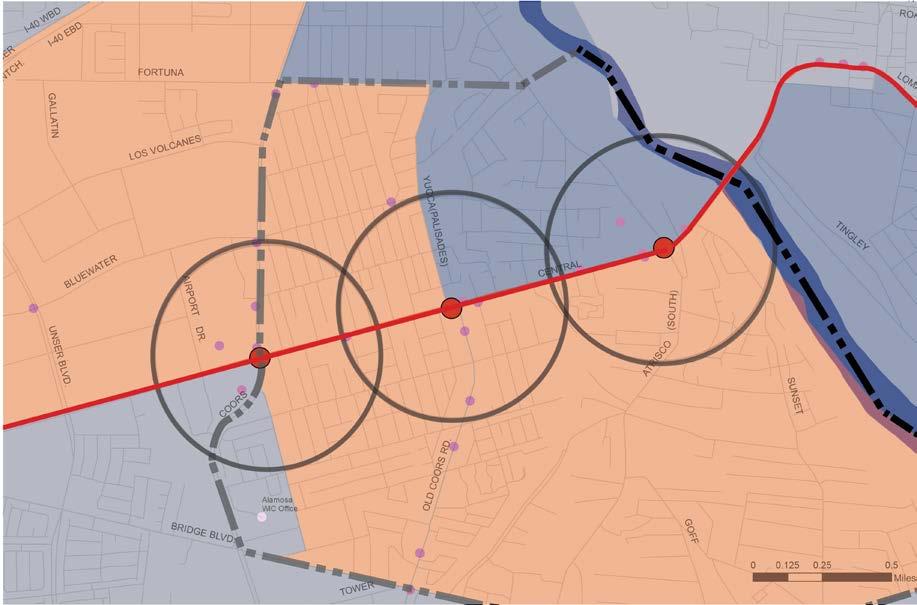
FOOD ACCESS - Assisted Access to Food
The Central Corridor Neighborhood Study by UNM Community Map: UNIVERSITY

Source: Accessed: FEB:2017
ART Route Community Boundary 1/2 Mile Radius
Proposed ART Stops
ASSISTED FOOD ACCESS SUPPLIERS

HOUSEHOLDS RECEIVING FOOD STAMPS: ESTIMATE; PERCENT HOUSHOLDS


Location Map

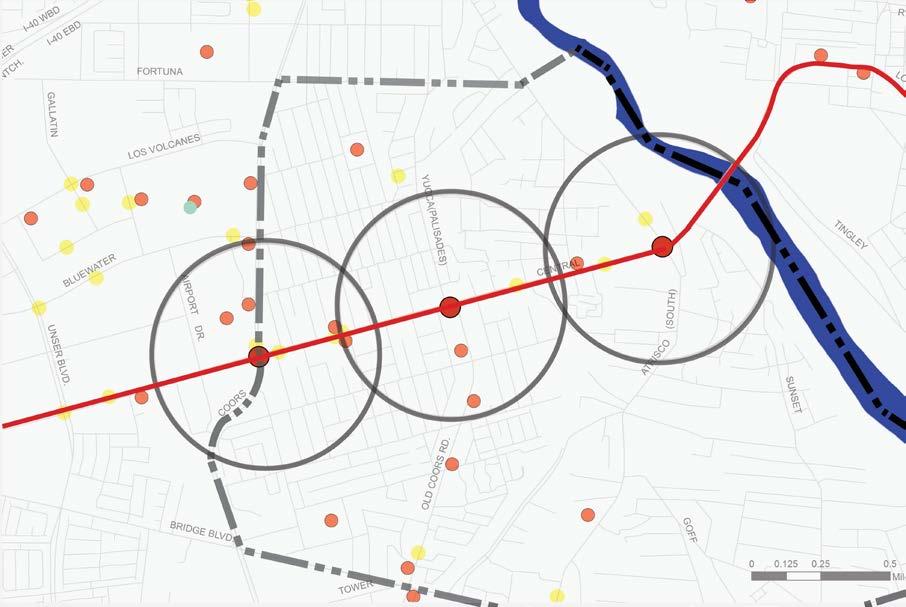
The Central Corridor Neighborhood Study by UNM Community Map:

Source: Accessed: FEB:2017
ART Route Community Boundary 1/2 Mile Radius
Proposed ART Stops

Location Map


The Central Corridor Neighborhood Study by UNM Community
- Health Facilities and Protective Services

Source: AGIS.org Accessed: FEB:2017
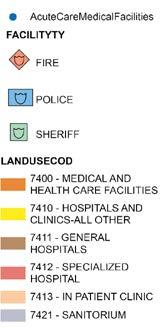

The Rio Grande valley area has been inhabited and cultivated by the Pueblo people as long ago as 2,000 B.C.—centuries prior to the arrival of European explorers and colonists in the 1500’s. Old Town was the original settlement site of the City of Albuquerque, chosen for its proximity to the Rio Grande and access to flood irrigation canals for farming. It was founded on authority from Spain in 1706 by Spanish colonists’ governor, Francisco Cuervo y Valdez and named La Villa de Alburquerque. This location was a strategic choice not only for the fertile land for agriculture, but also because it was situated on El Camino Real de Tierra Adentro, or the “Royal Road”. From 1598 to 1821, the Camino Real was the main route for transporting people, goods and culture into New Mexico.
According to the Spanish Laws of the Indies, the plaza was the created to be the town center and subsequent buildings were constructed around it. Adobe buildings spanned outward from the plaza and the church, named for Saint Francis Xavier, was built further west. Due to fires and heavy floods, the church, San Felipe de Neri, was rebuilt on the north side of the plaza in 1793 where it still stands, and is the oldest extant building in Albuquerque. Buildings built during this time were constructed from adobe bricks and stucco with portals in the Territorial and Pueblos-Spanish styles. After the railroad arrived, wealthier residents built their homes in the Queen Anne and Victorian architectural styles using the modern materials of the time that were being transported from the east. Today, several of these style buildings were remodeled in the 1950’s and 60’s to reflect the Pueblo Spanish Revival style that was developed to help New Mexico gain its statehood; a style that became what tourists expected to see in the Southwest.
The railroad came to La Villa de Alburquerque in the early 1880’s and a major railyard and depot was located two miles east of the town. As a result, La Villa de Alburquerque would no longer hold its position as the town’s core. The new location was called “New Town”— which is currently Downtown—and La Villa de Alburquerque became “Old Town” and has remained so ever since. Old Town’s transformation from its mainly agricultural roots to a place for business and commerce continues today. The plaza is currently framed by galleries, shops and restaurants that were once simply residential homes, civic government buildings and trading shops.
Prior to the Pueblo Revolt of 1680, La Villa de Alburquerque was occupied primarily by 19 Spanish landholding families, but the city has had shifts in its population’s make up and demographics over time. By 1760, la villa was occupied by approximately 70 Spanish families and people of mixed ancestry including Spanish and Native American and African and Anglo Saxon. Today, the area is largely Hispanic and White and is not as ethnically diverse as it once was. Economically, less than 10% of the families residing in Old Town fall under the poverty level, but the percentage of low income/low fresh food access persons averages about 22%. Roughly half of the residents are renters, with property values ranging from $53,000 to $90,000.
Albuquerque’s botanical gardens and musuems are located close to Old Town, which remains a historical anchor and the heart of Albuquerque’s history and culture and public celebrations. Residents, locals and visitors continue to gather in the plaza to shop, eat, worship or to enjoy live music and entertainment.
Cynthia D. Jacobs
Project Goals
Complete Streets
Viviane Beluse Alex Rodriguez Ronak Shah
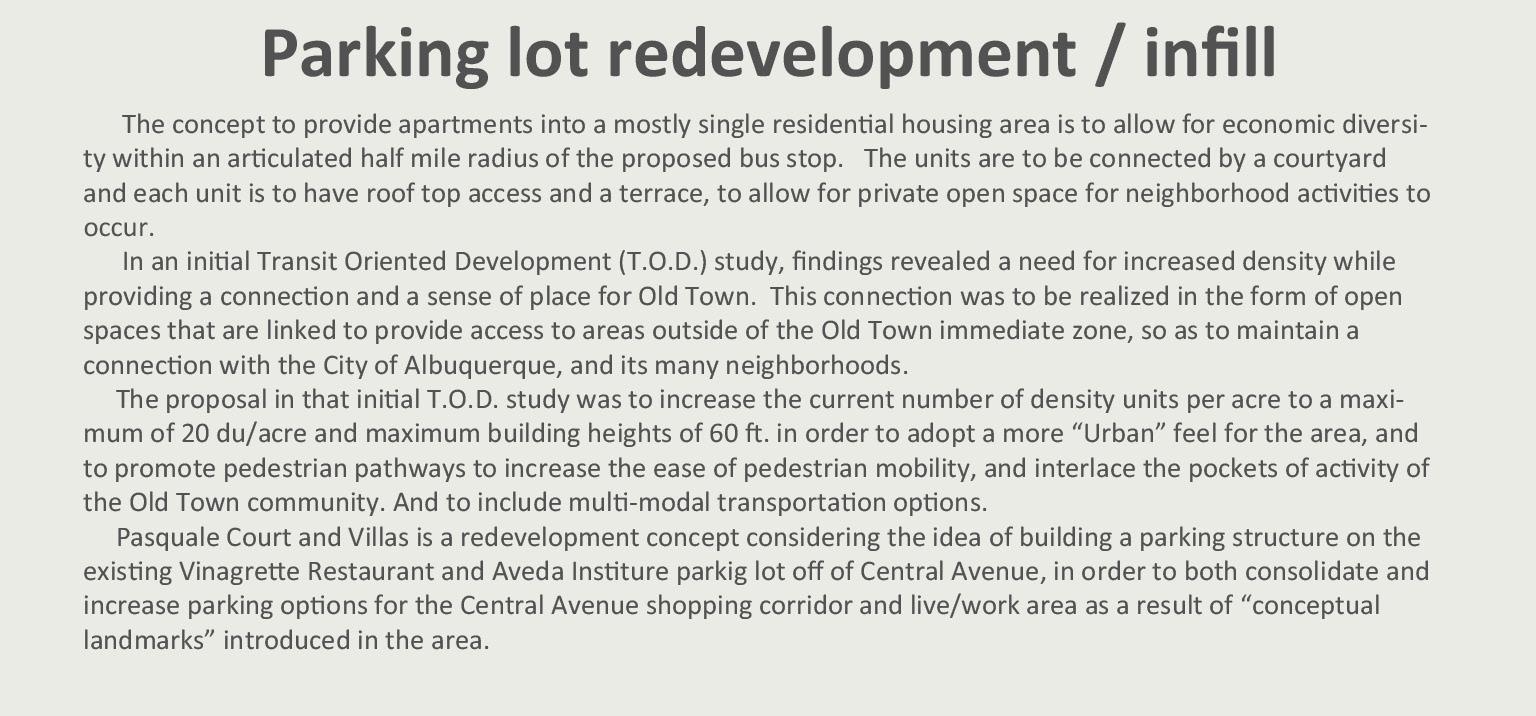
• Provide principles and visionary design guidelines that promote multi-modal transportation options, are safe, are visually attractive, thrive socially and economical!’£ and create a sense of place for the Old Town community.
Pedestrian Pathways
• Emphasize pedestrian pathways to increase the ease of pedestrian mobility and interlace the pockets of activity of the Old Town community.
Increase Density- mainly housing
• Increase the current number of density units per acre to a maximum of 20 du/acre
• Maximum building heights of 60ft.
Reorganize Parking
• Develop Central Ave. facing parking lots
• Replace parking with parking garages and rooftop parking
• Replace at a 1:1 ratio
Parks and Open Space
• Increase parks and open space footprint from 10 acres to 20 acres.
• Increase is based on providing outdoor recreational amenities for the increase is population Place
• Create place through a clock tower on the triangle lot created between the merging of Central Ave. and Lomas Blvd. This provides a gateway entrance to Old Town.
• Design other catalytic projects
Design for a variety of commercial uses
• Design commercial space for a maximum of 20,000 sq. ft. for larger retailers
• Design 700-1000 sq. ft. commercial space for local entrepreneurs

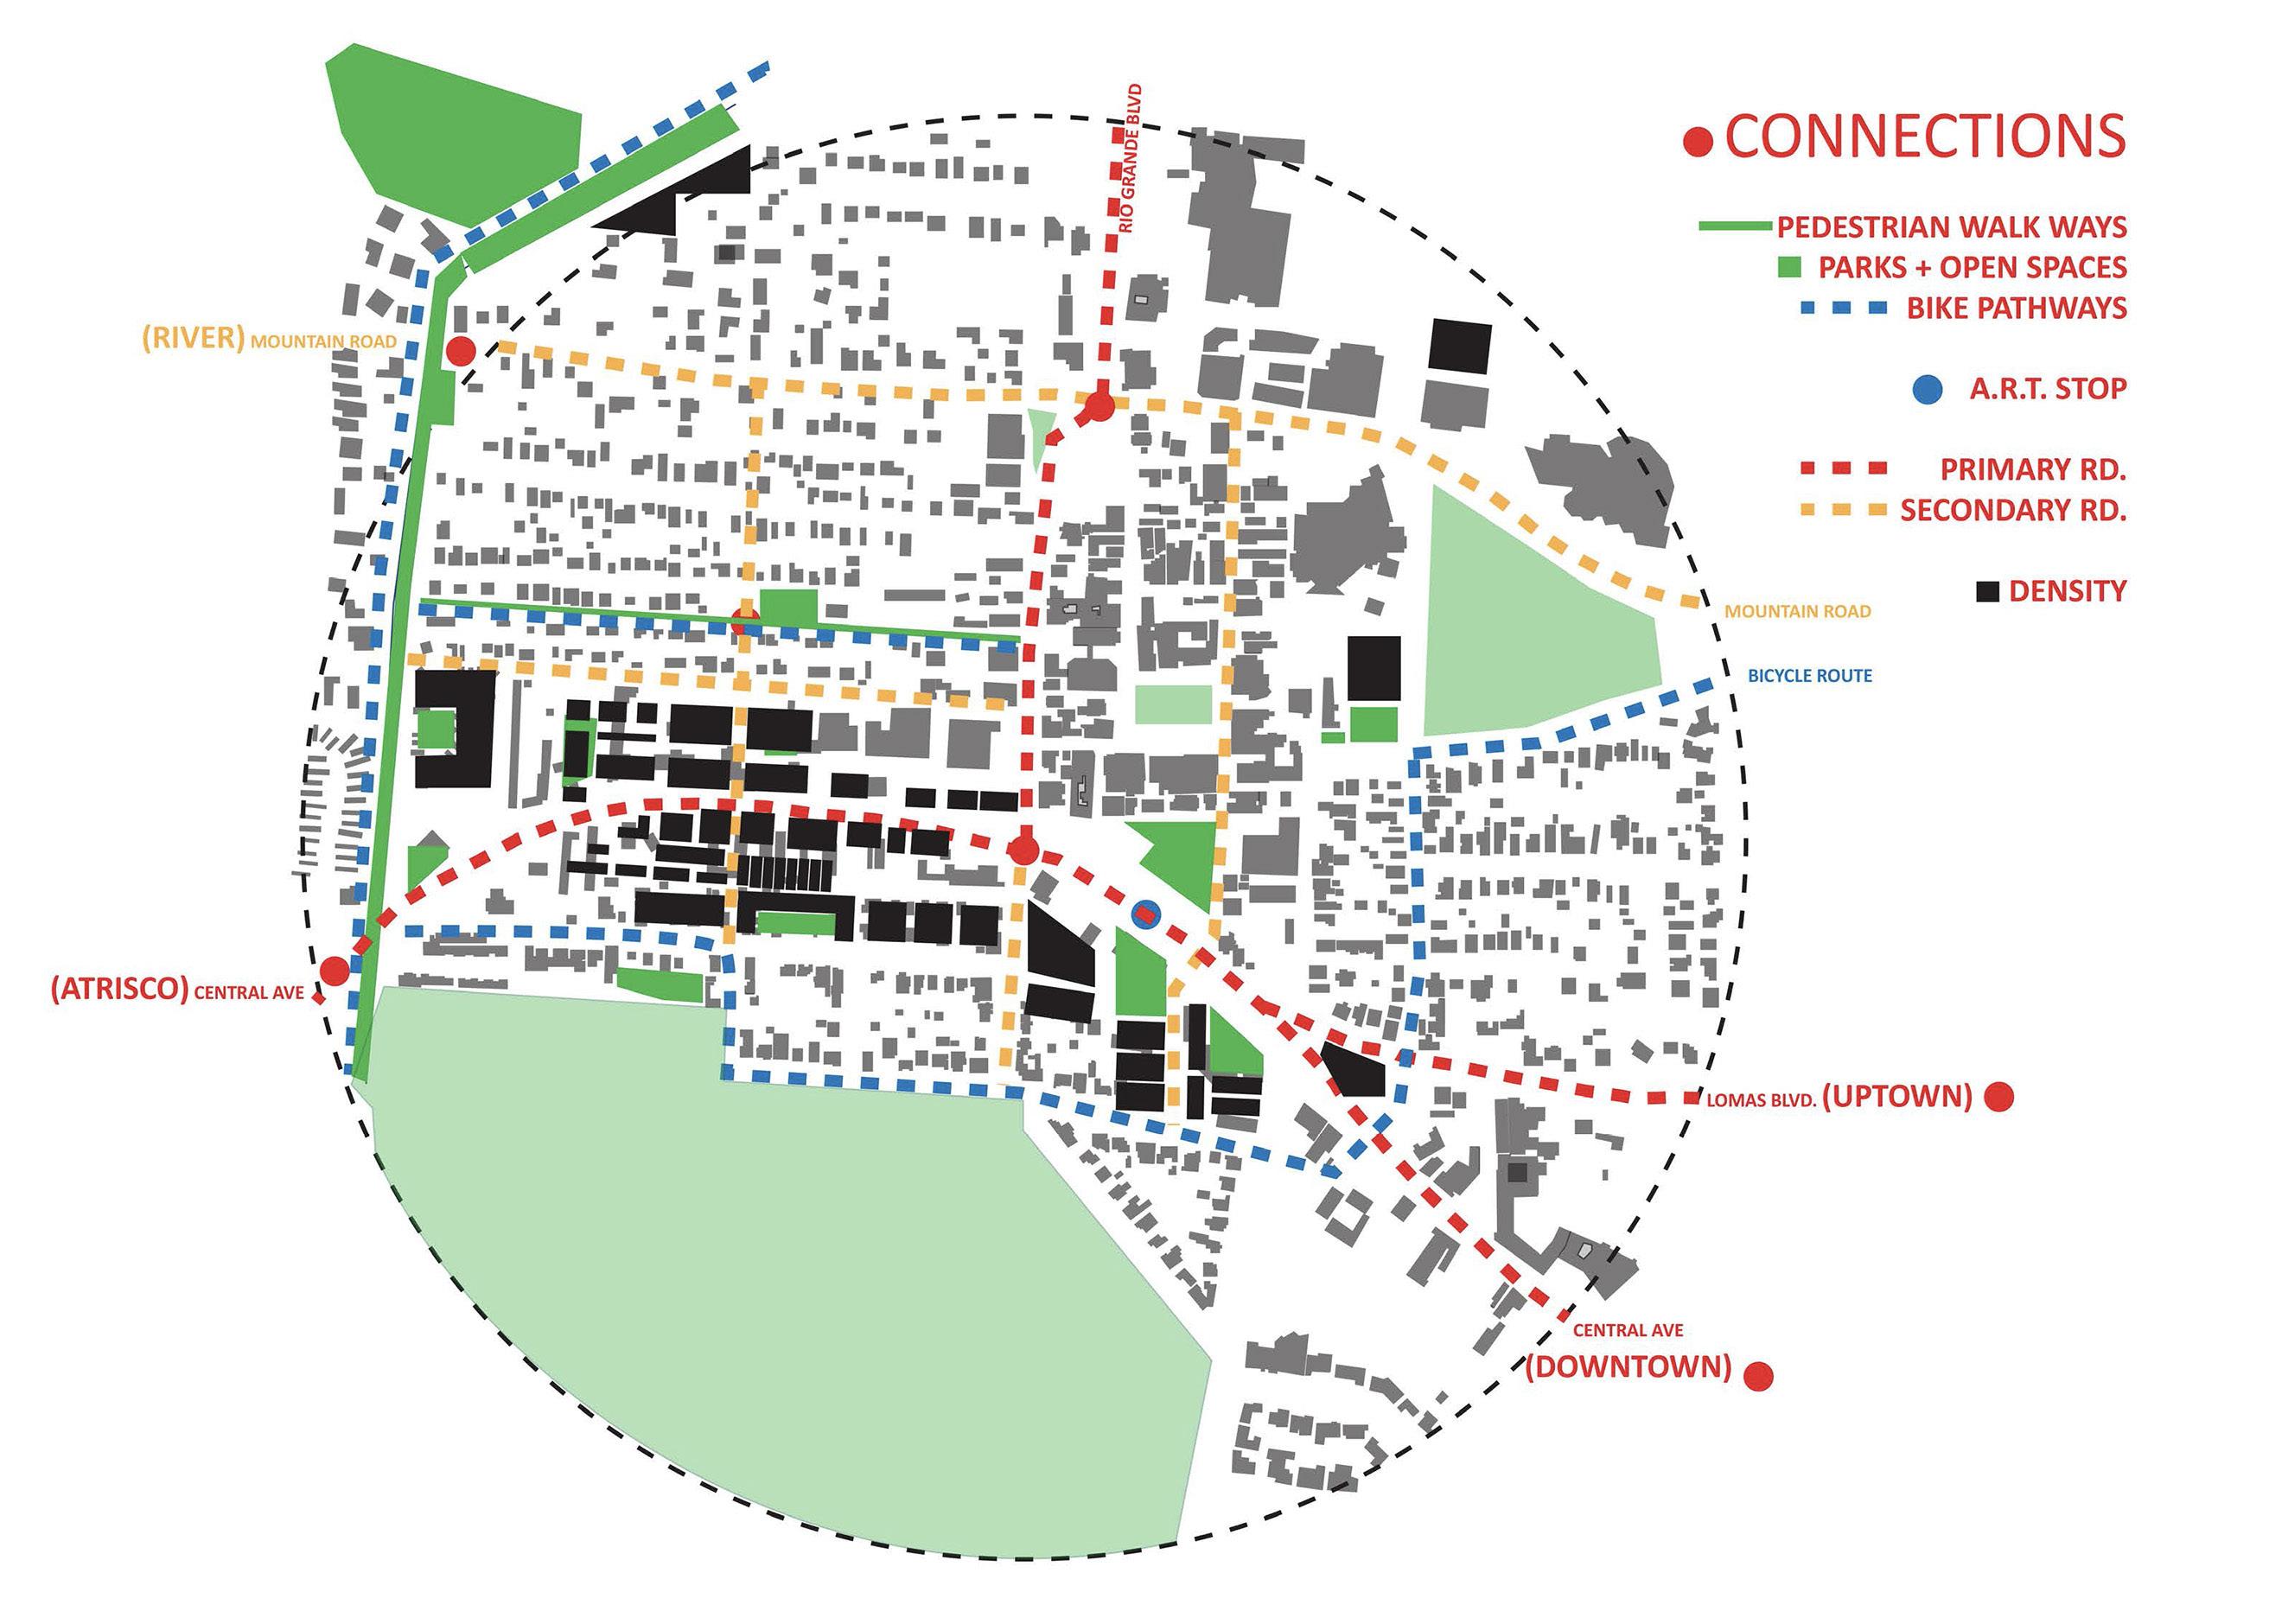
The TOD development focuses on Central Avenue corridor development, a network of circulation that integrates green spaces, and connections to the Sawmill area to the north east
-Make Old Town THE Focal Point
-Connect Museums and Current Green Spaces
-Add Mixed-Use along Central and Rio Grande Corridor near BUS stop
-Create Large Gateways to Designate Old Town (Make BUS stop a Destination)
-Create Infill Pocket Parks and Connect Open Spaces
-Possible Connection to Bosque.

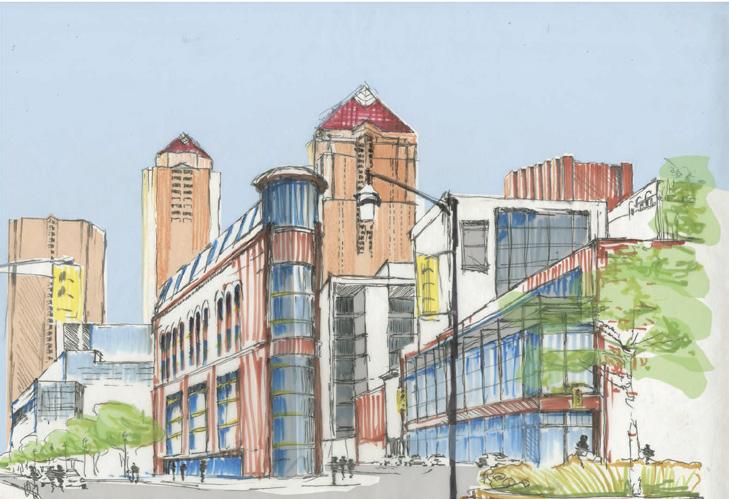

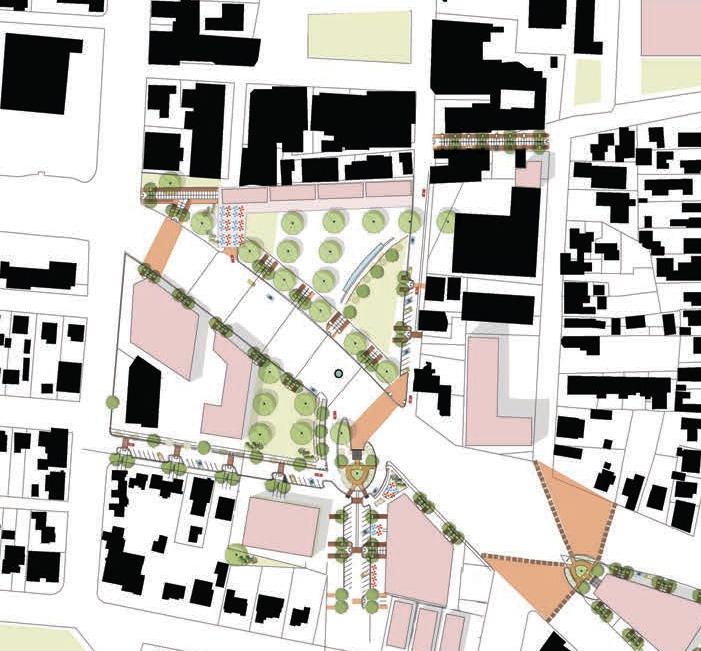
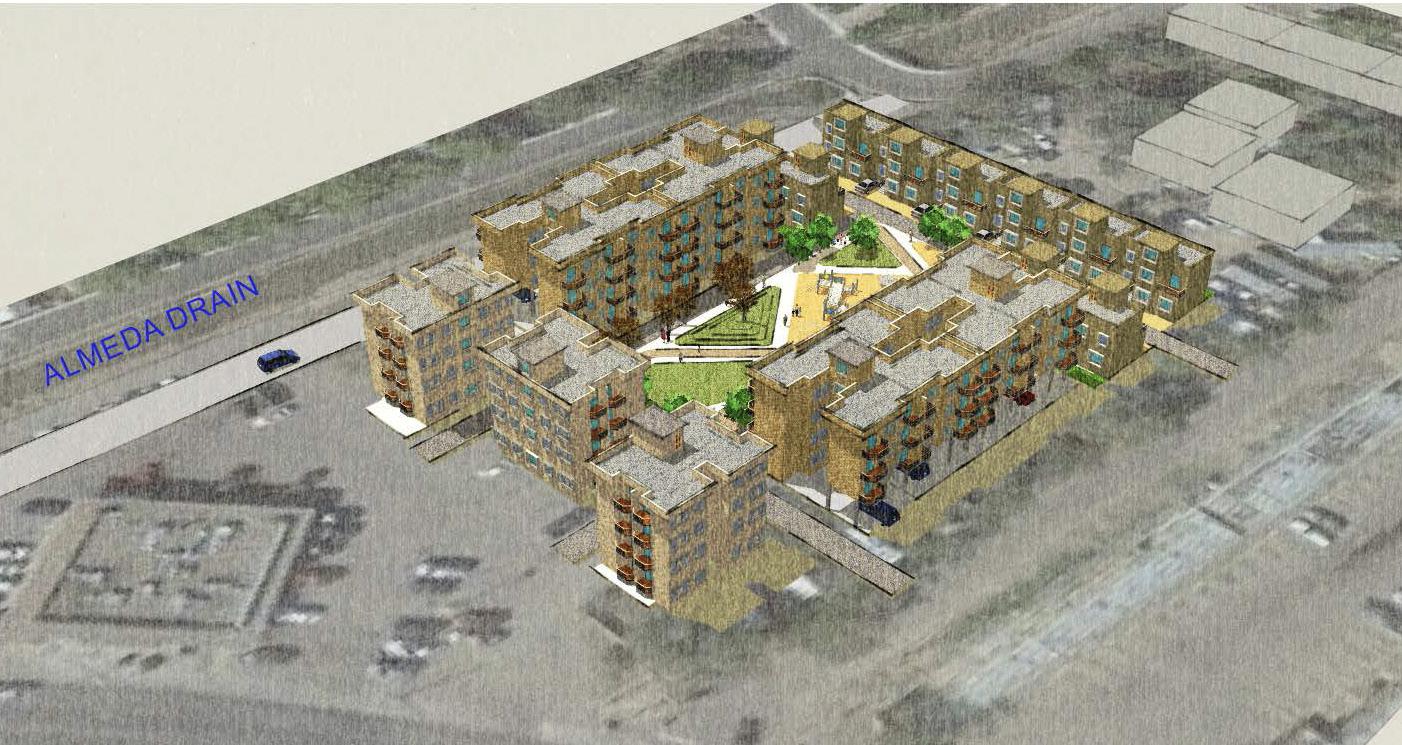
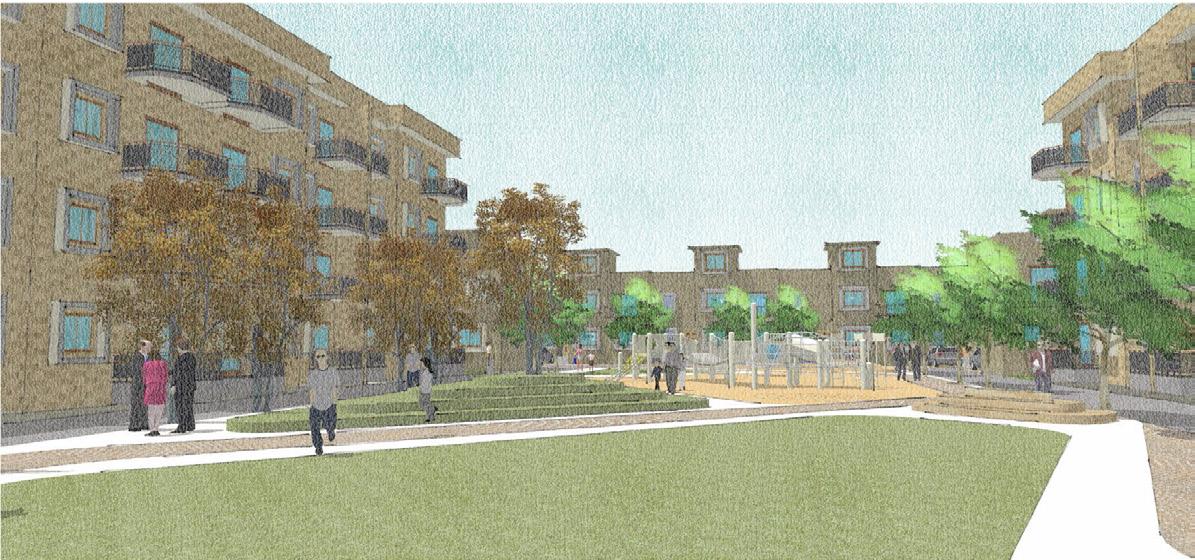
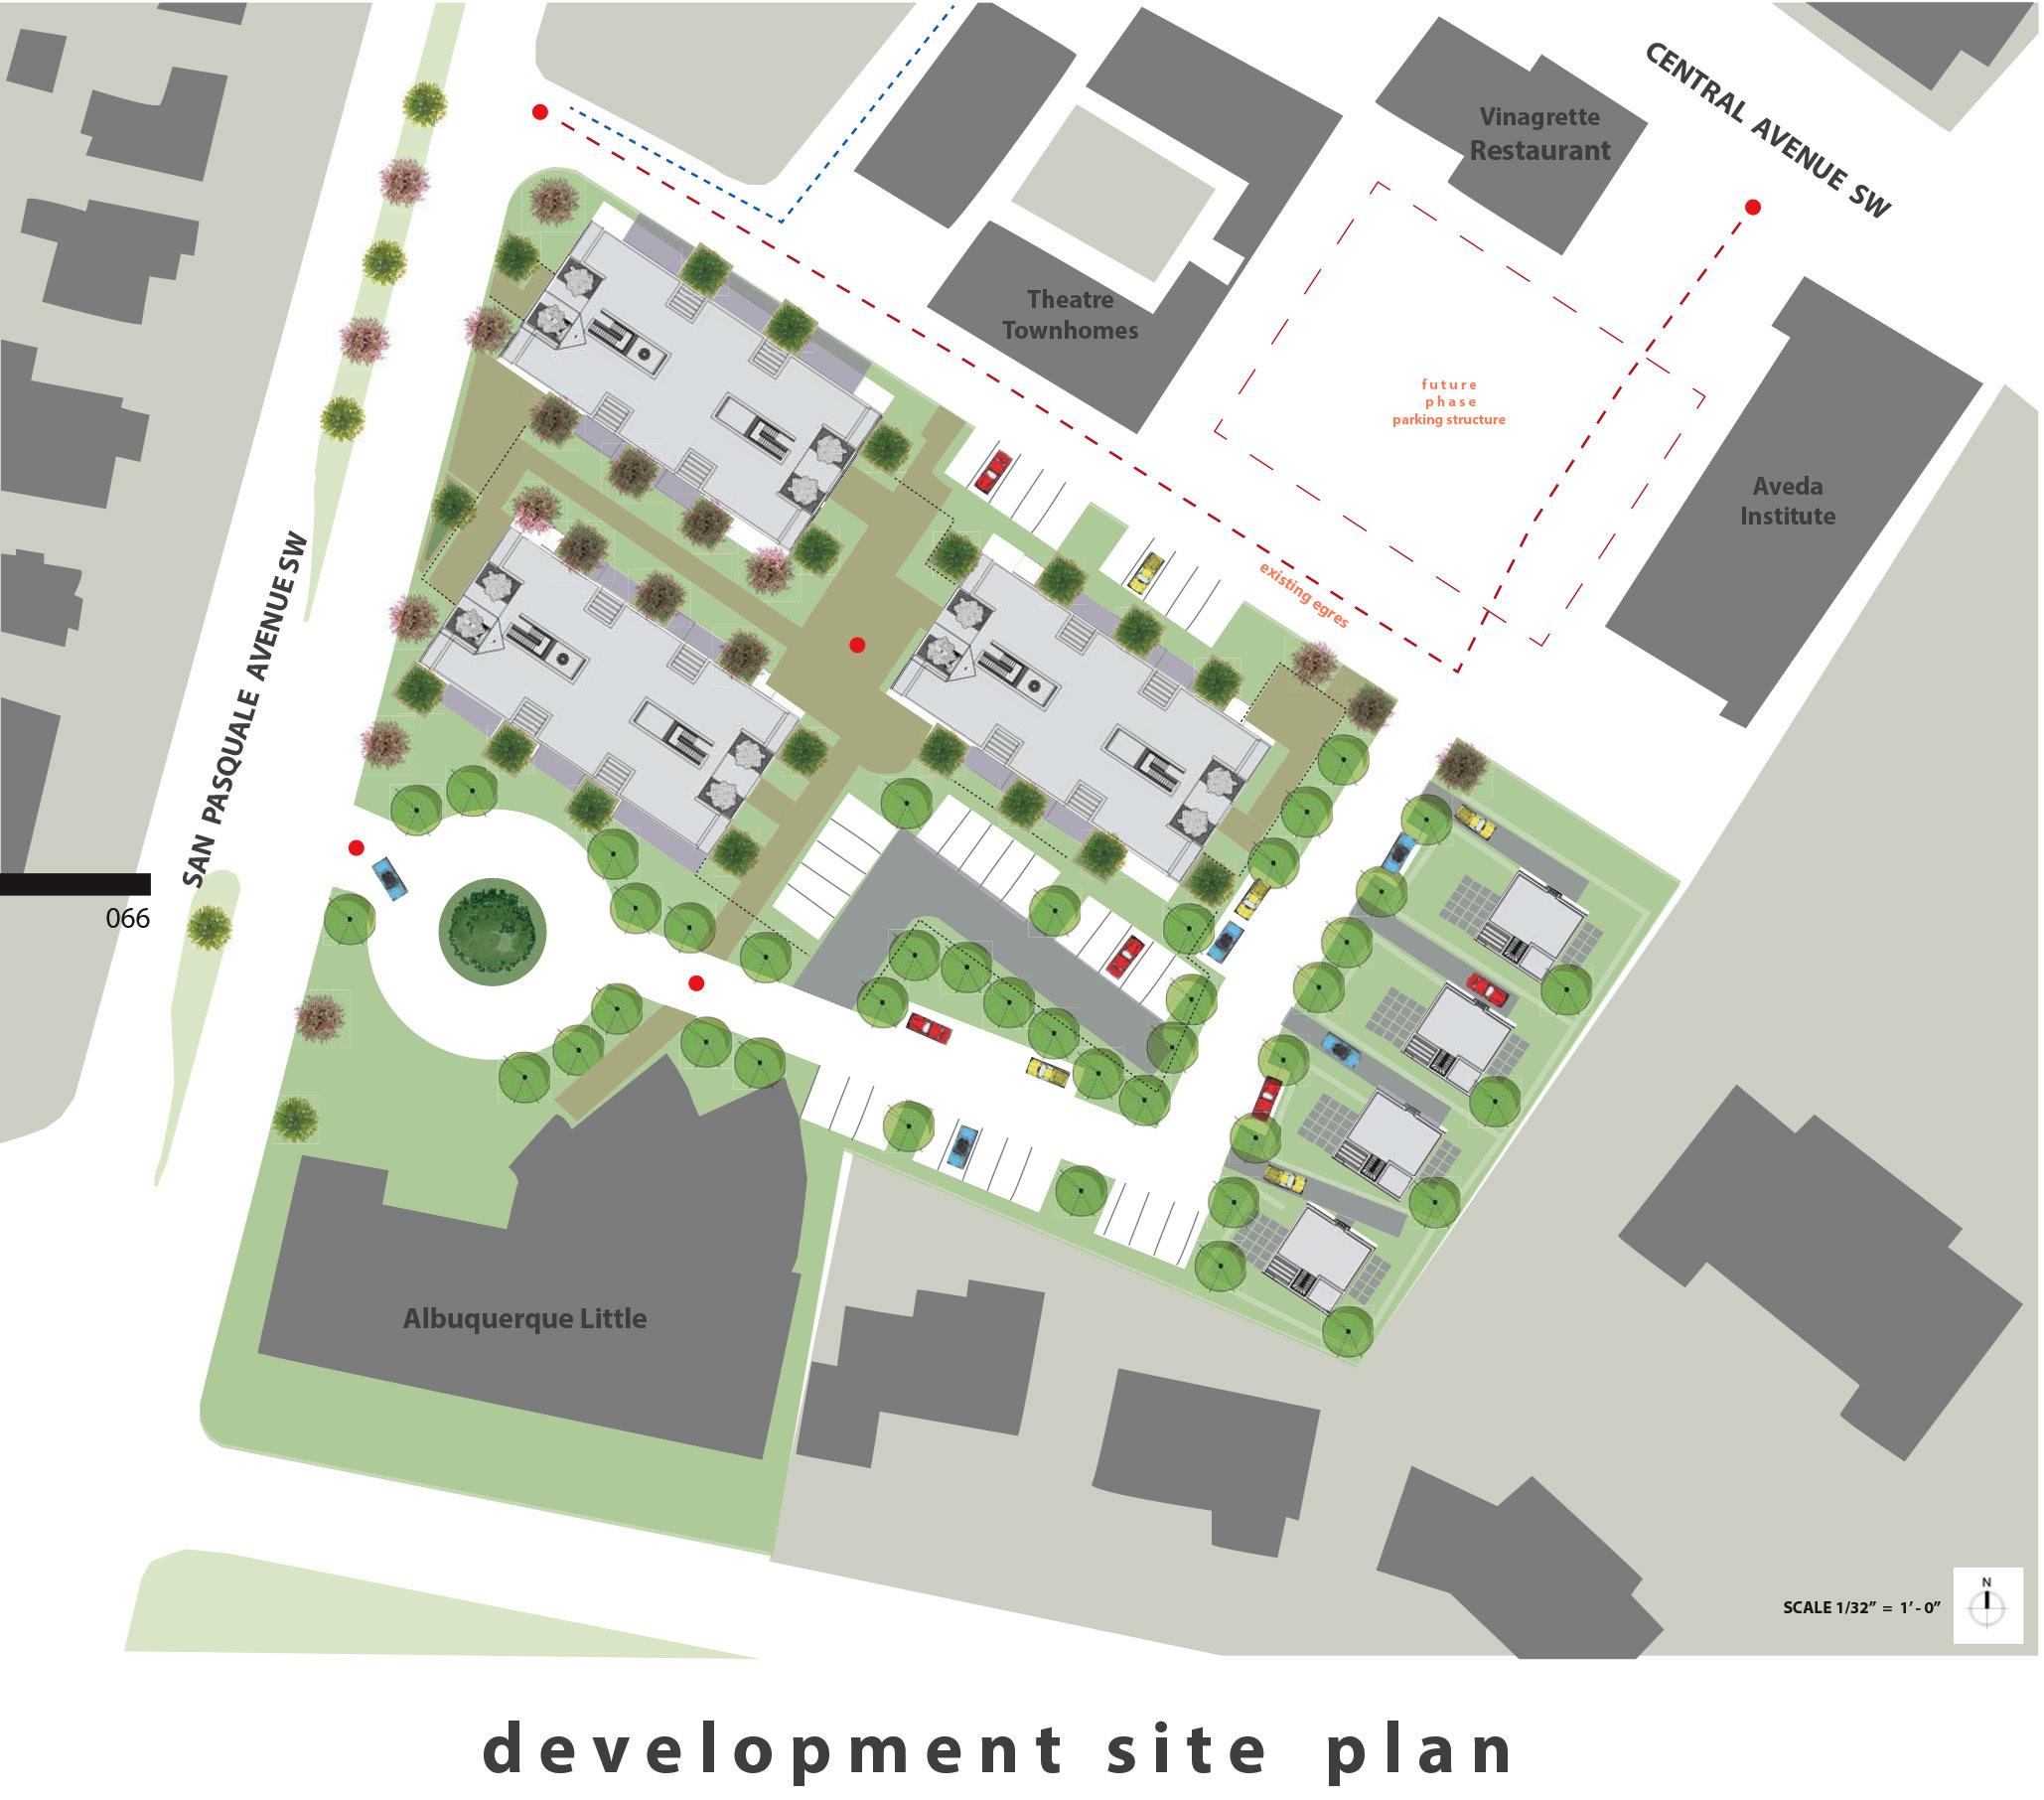
Surface parking lot along Central is re-designed as an green space gateway into Old Town
Medium density housing enclave located next to the Alameda Drain
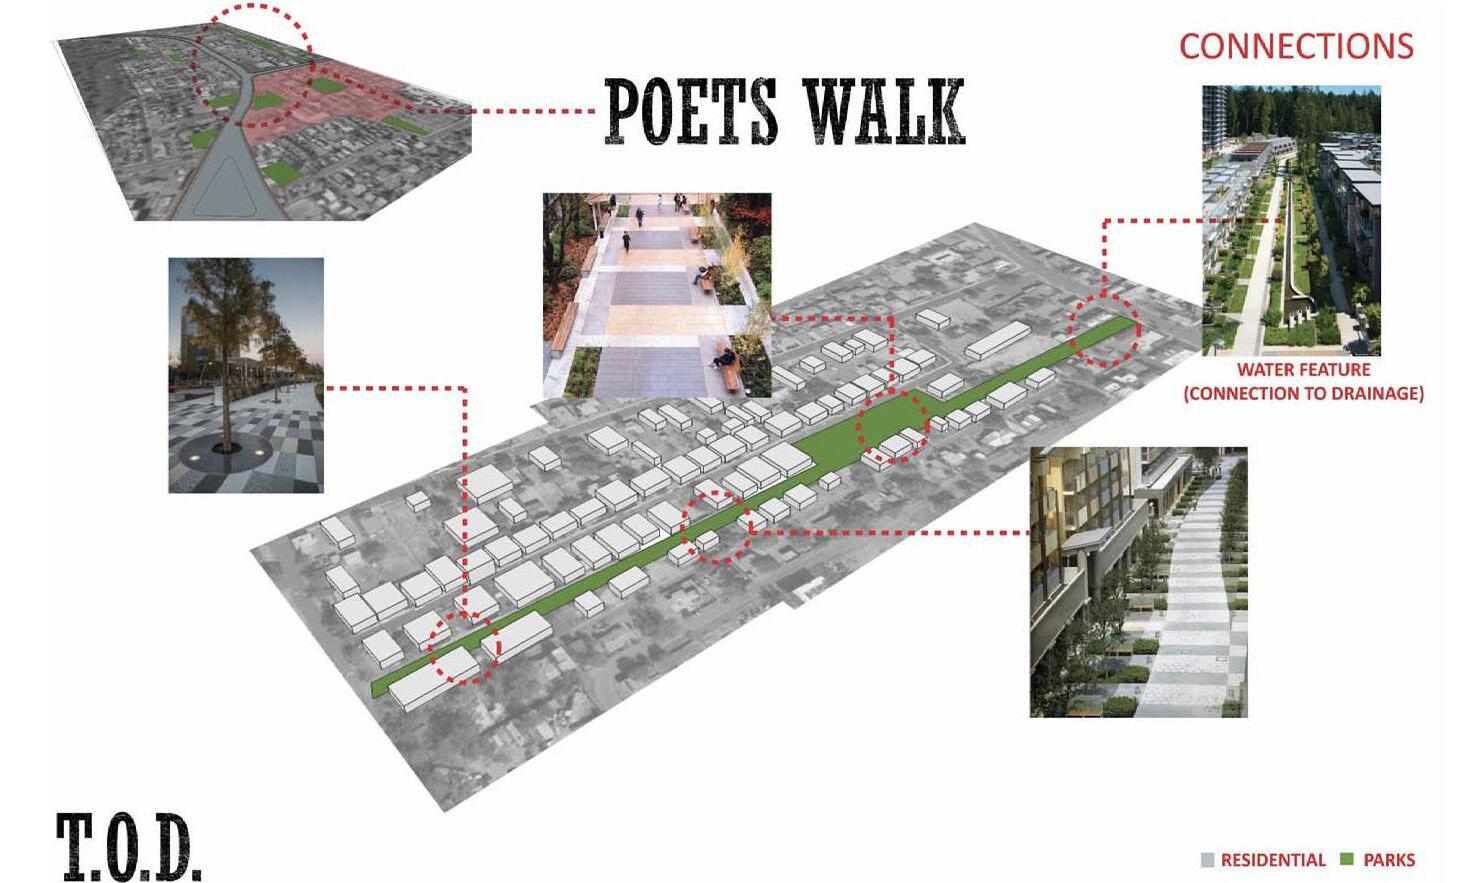

The Poet’s walk is a pedestrian corridor connecting Old Town and the museums with the Biopark and the Atrisco area. The corridor is a shaded pedestrian walkway that incorporates nodes for seating and other activities
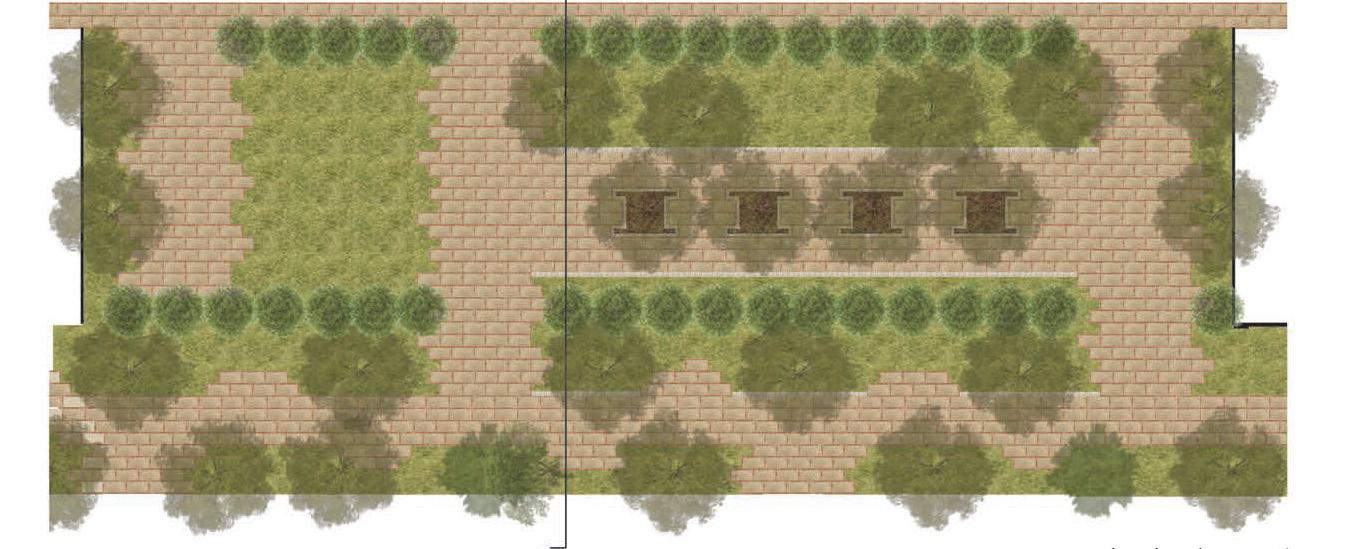
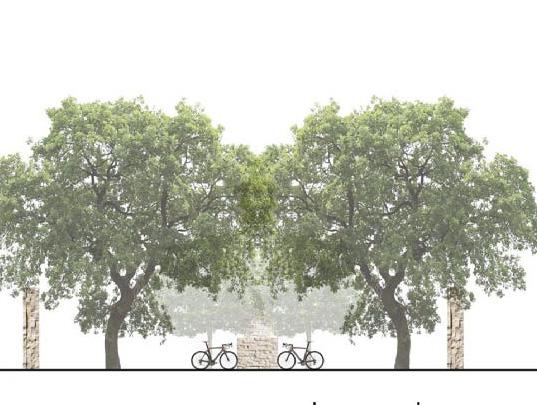
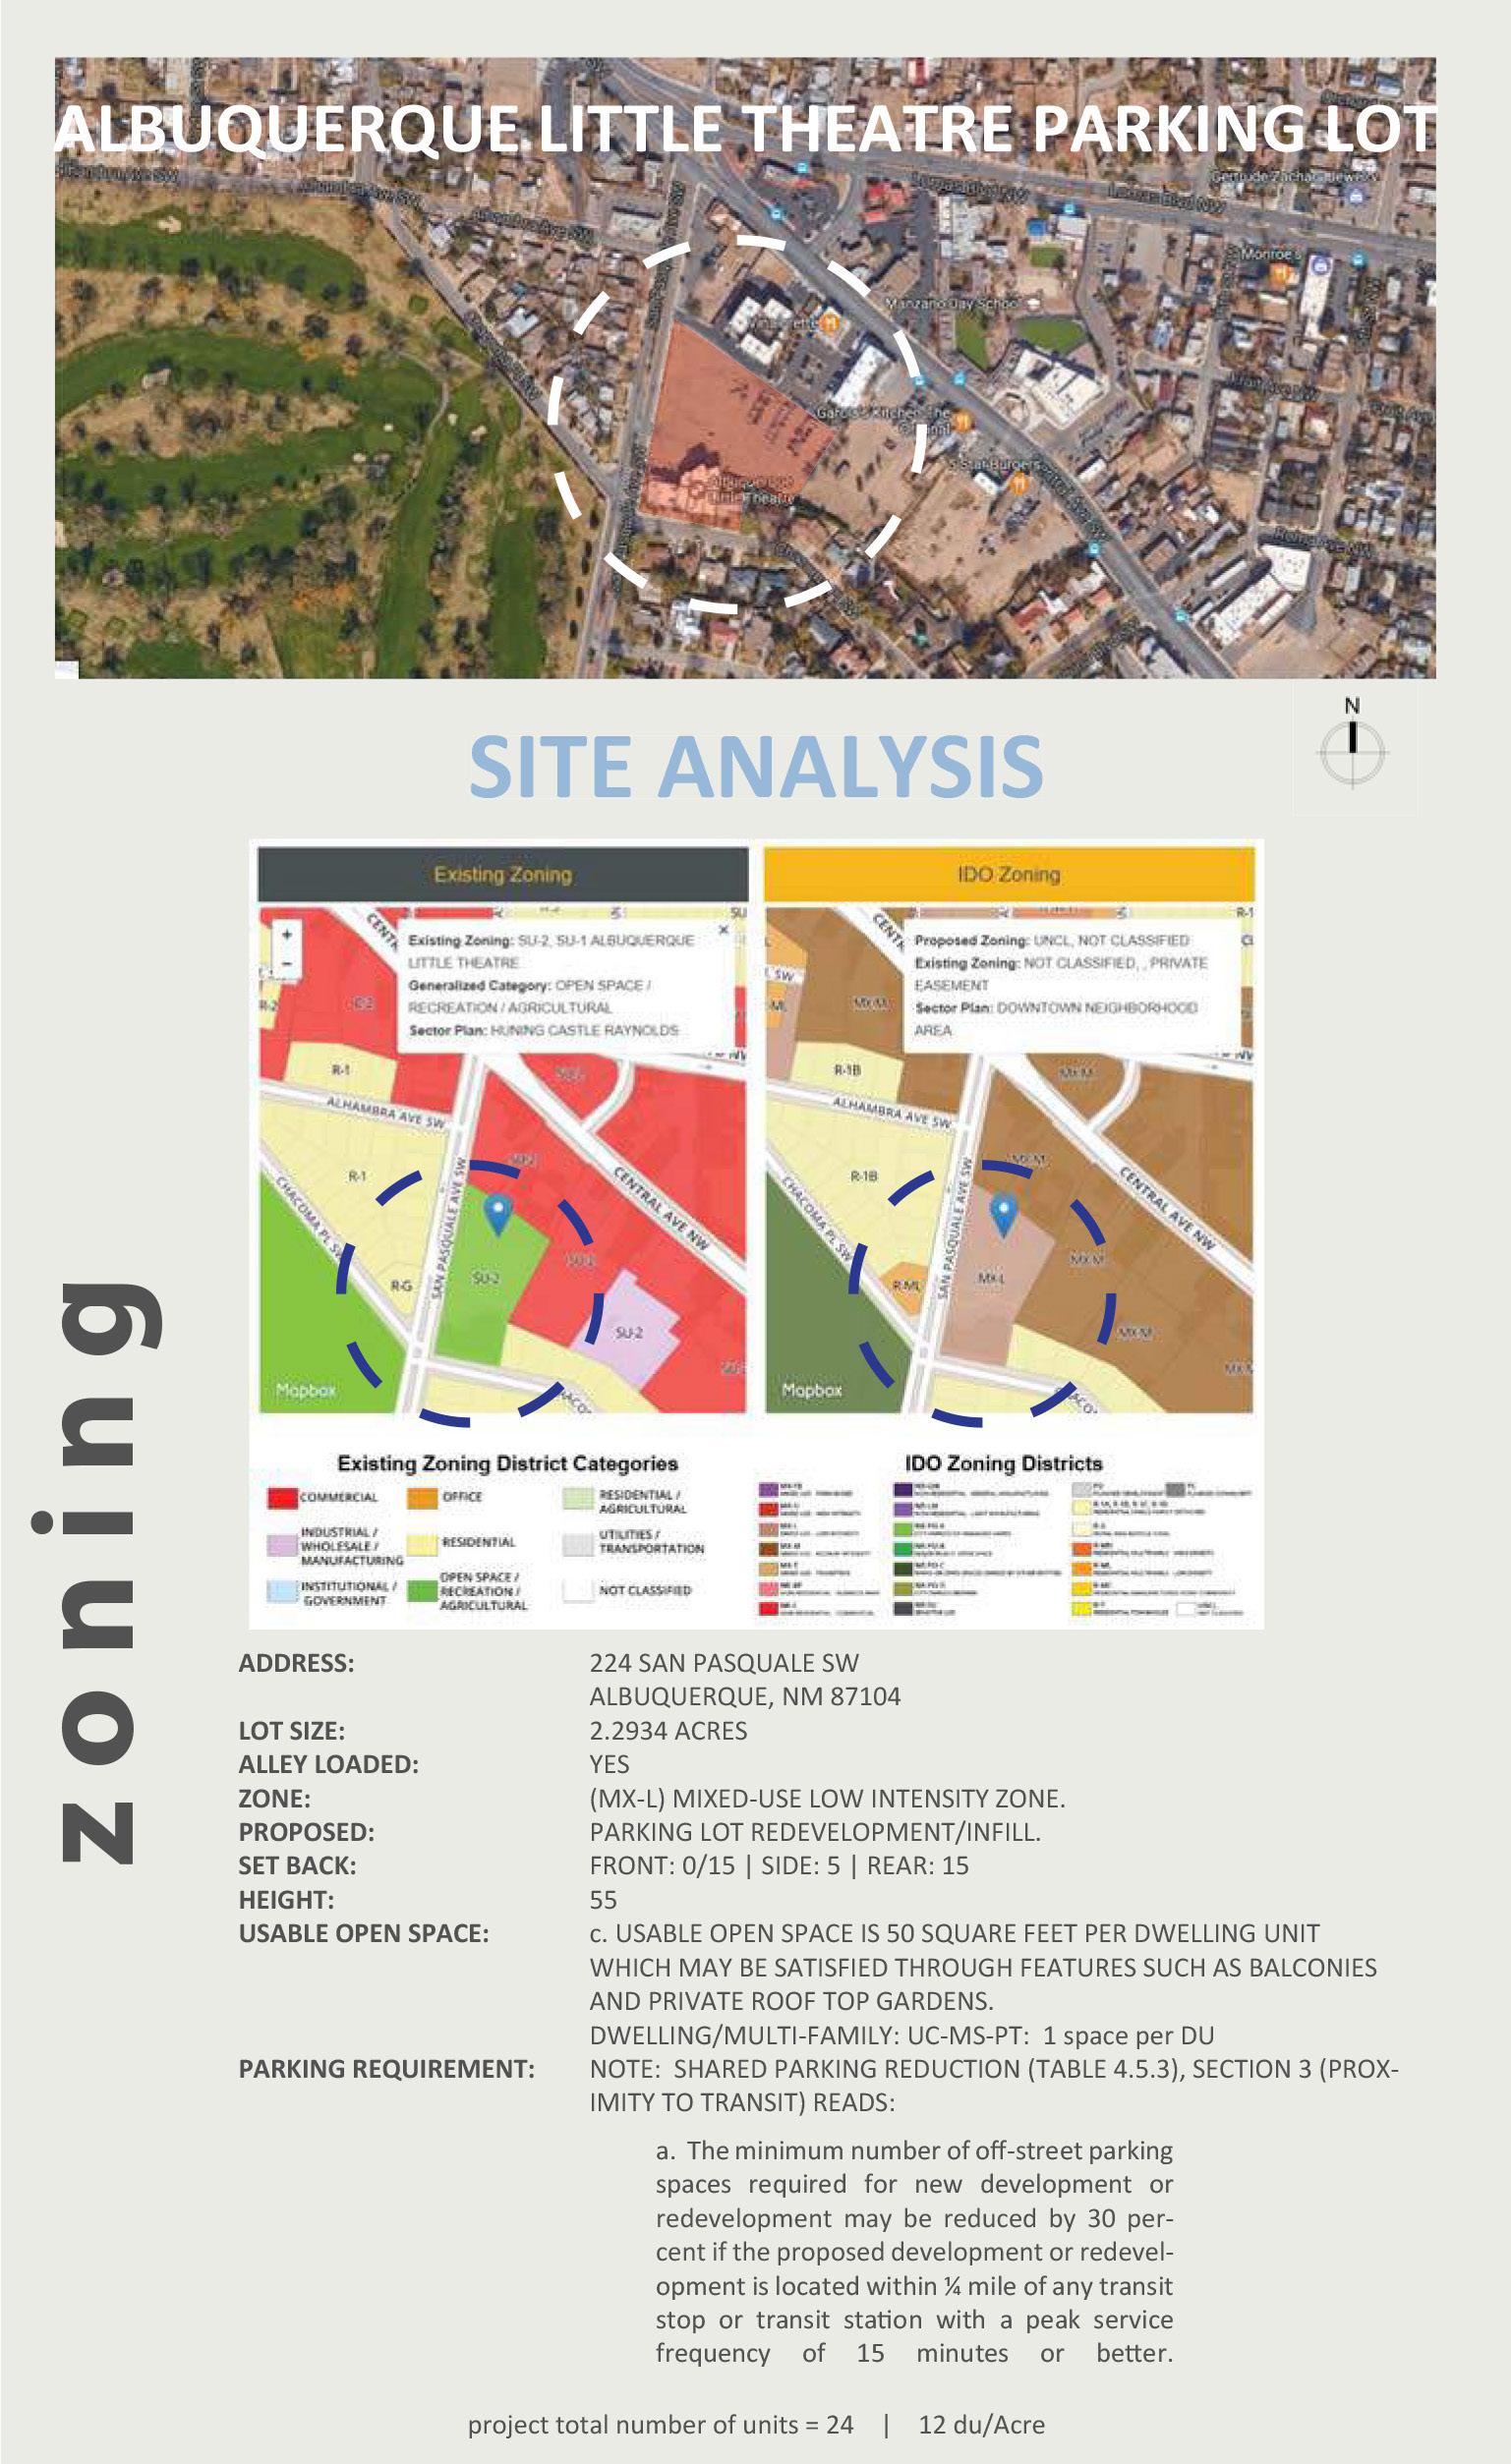
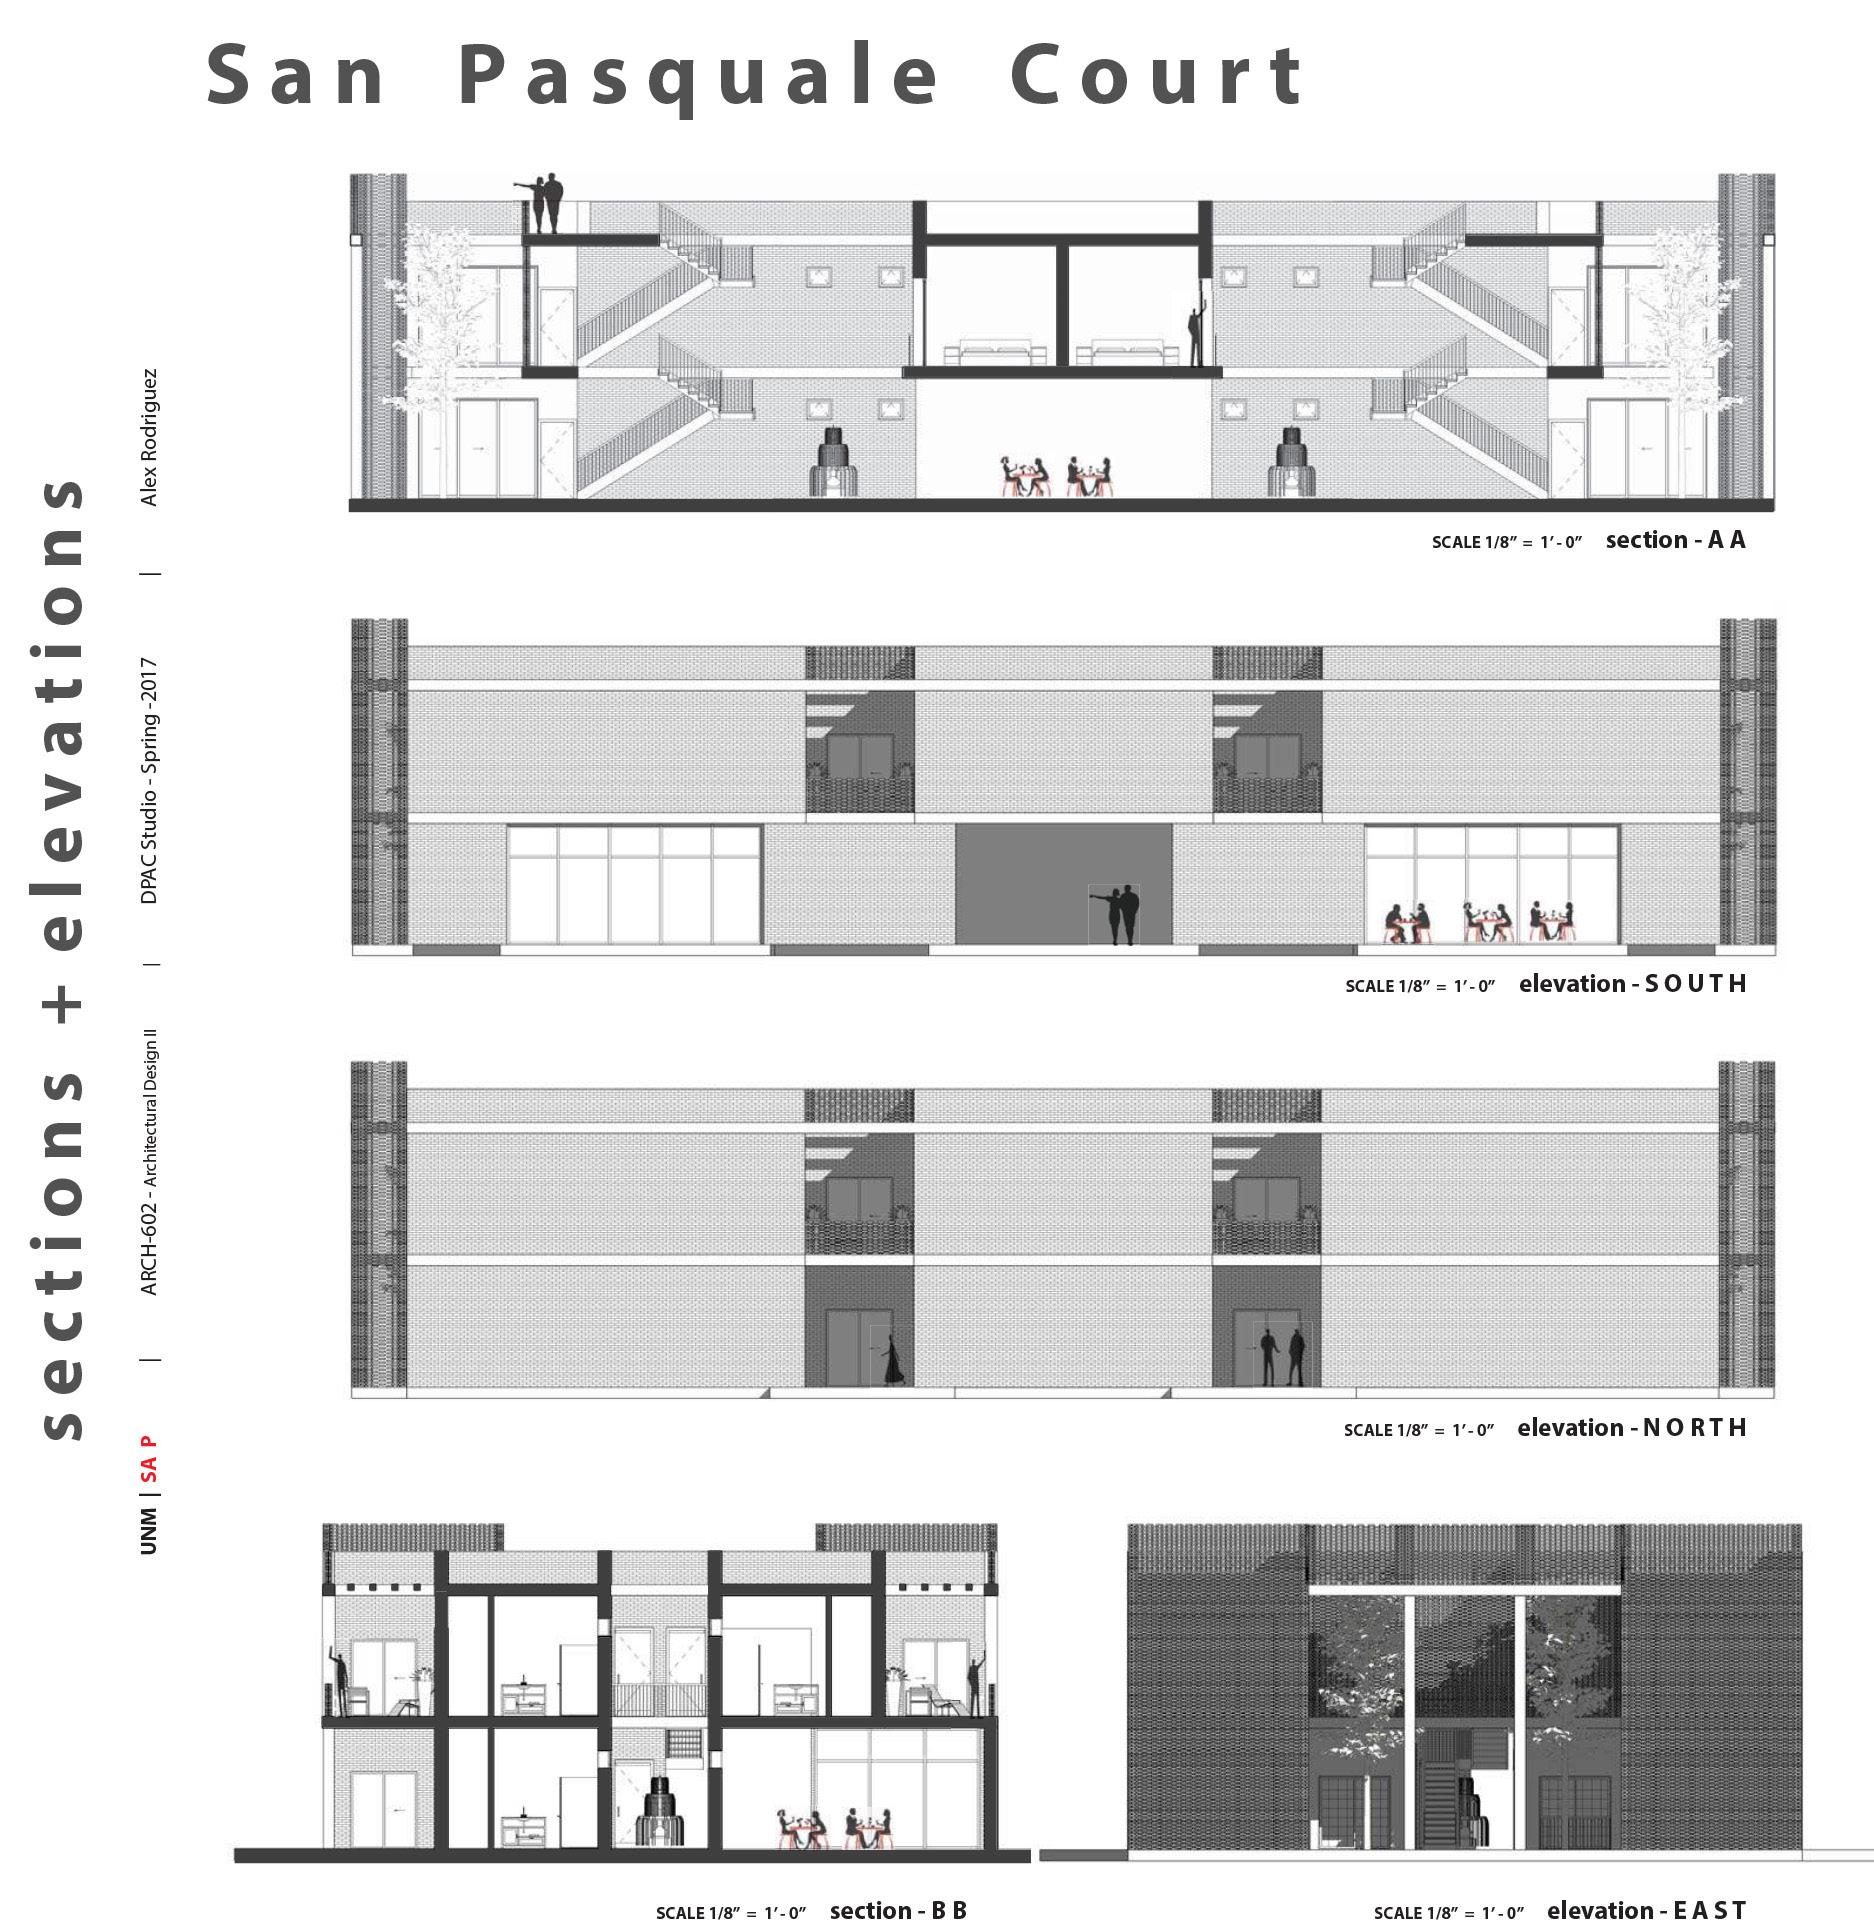
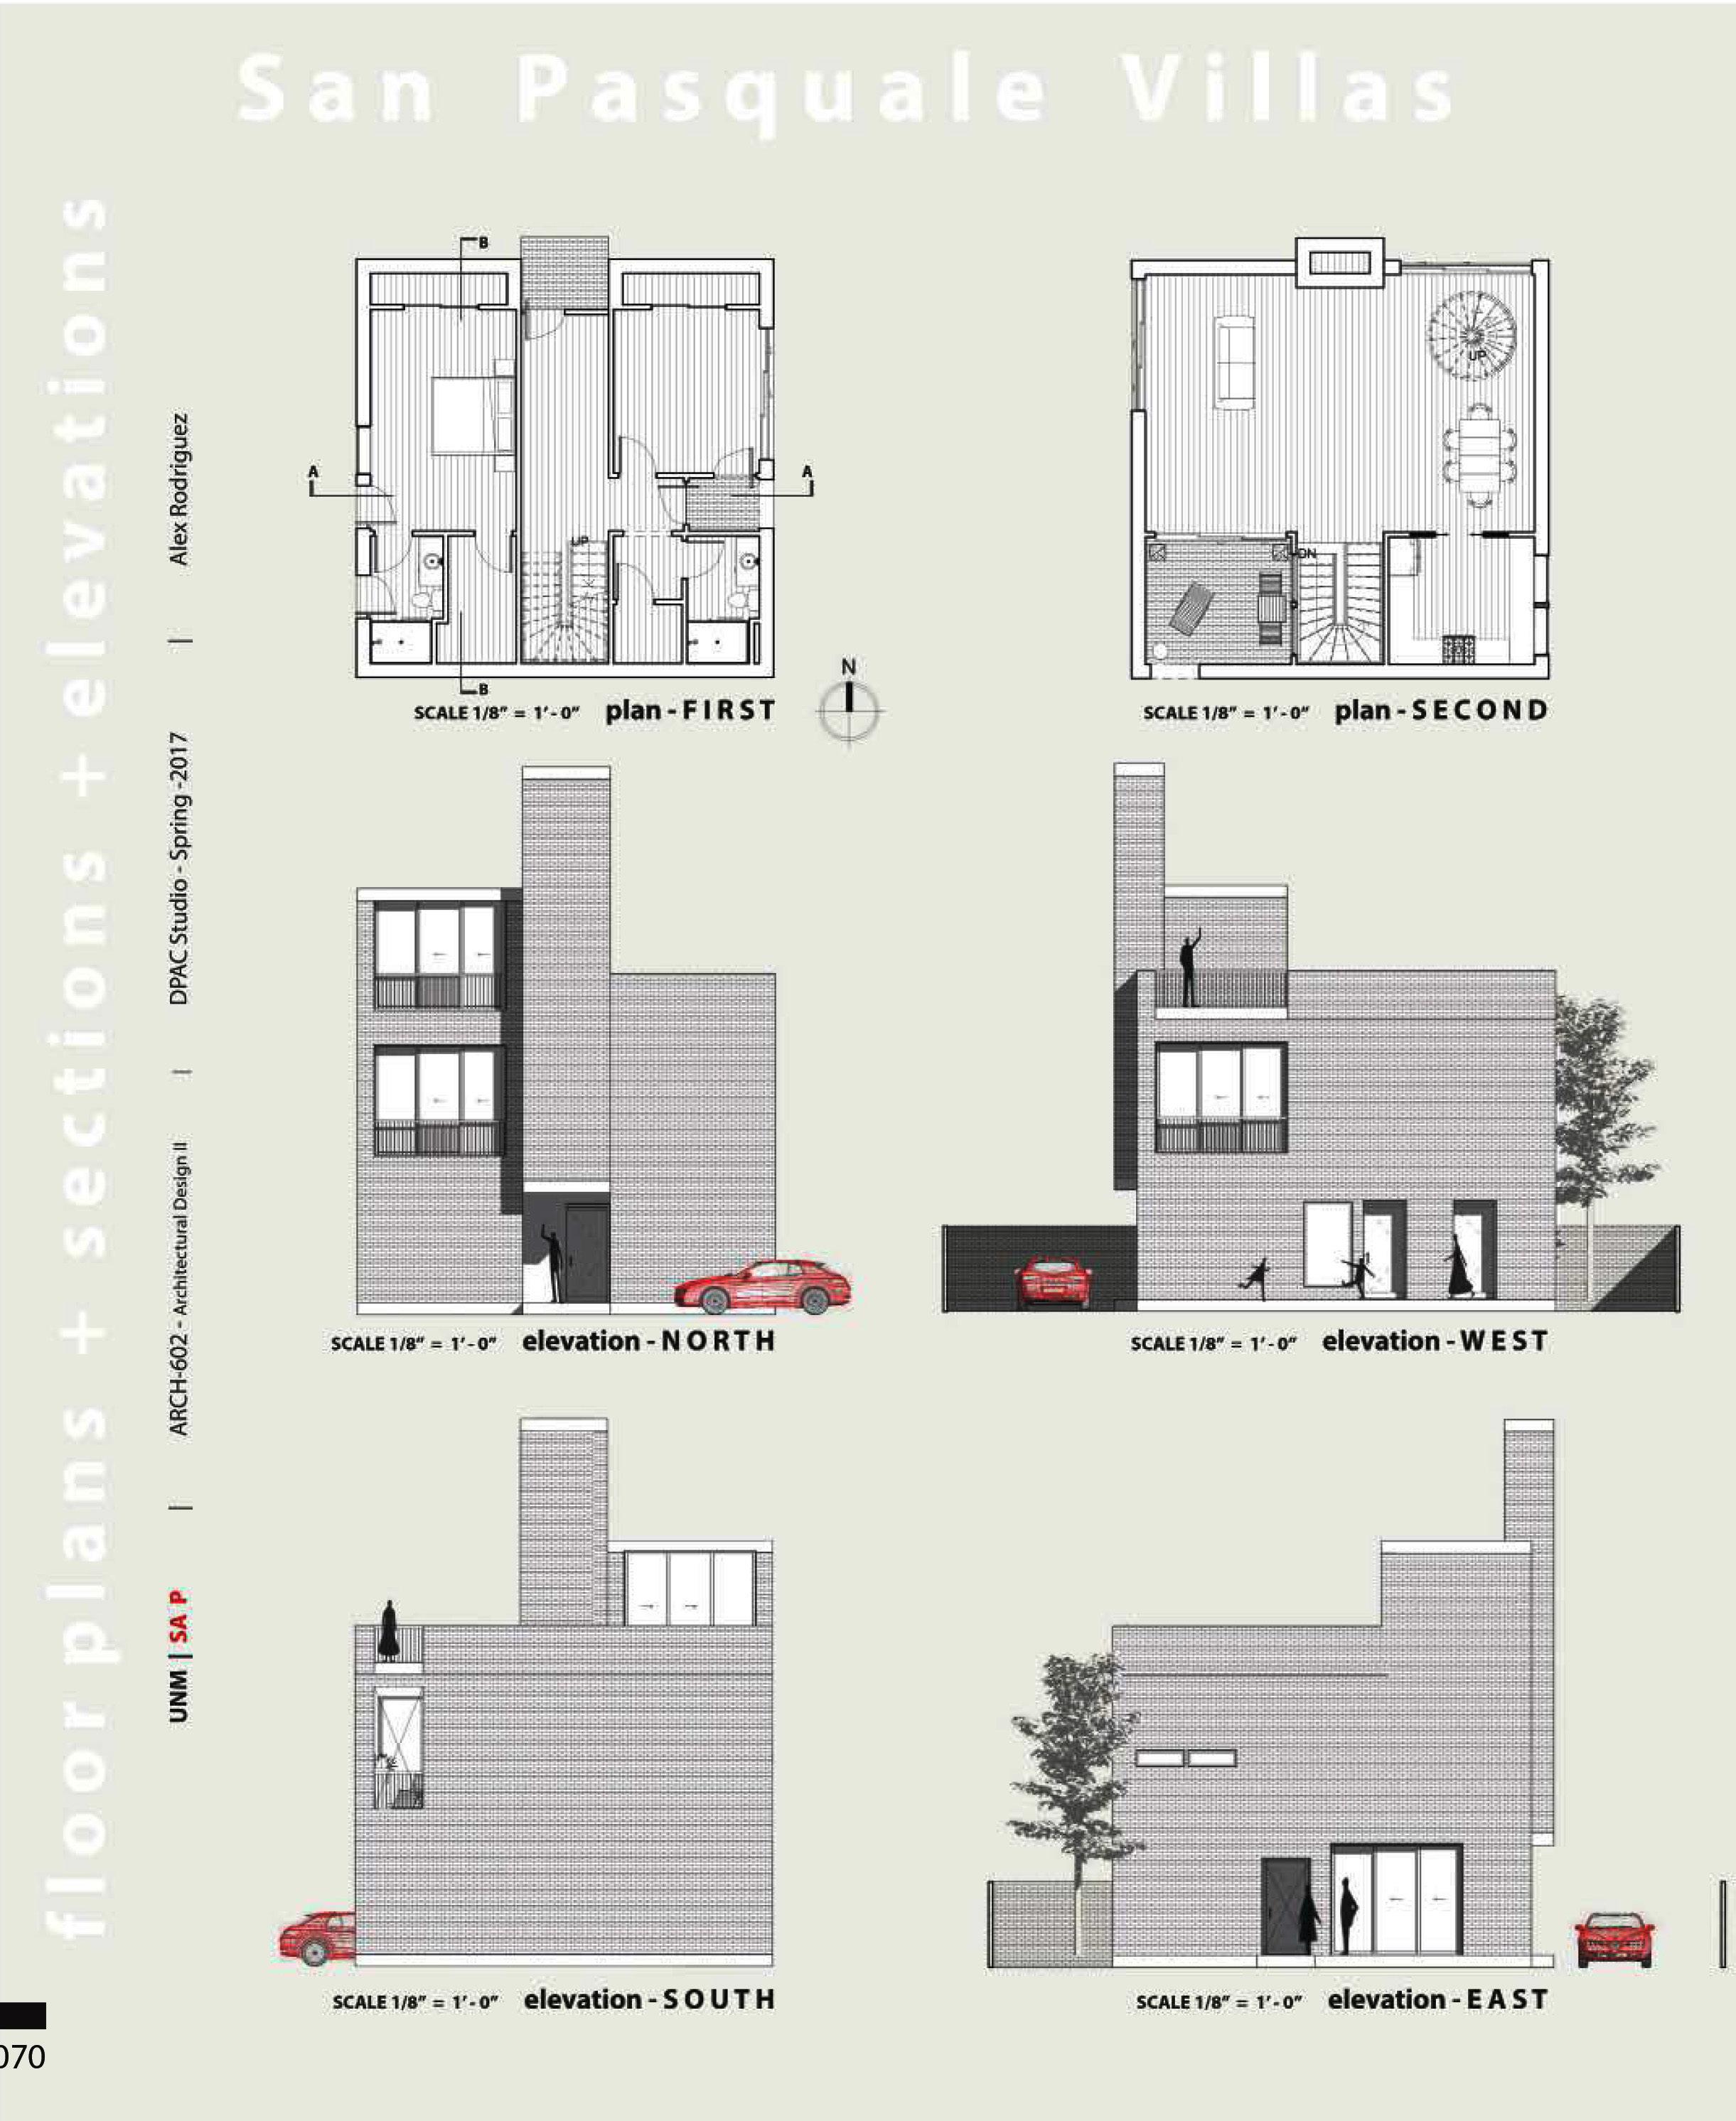
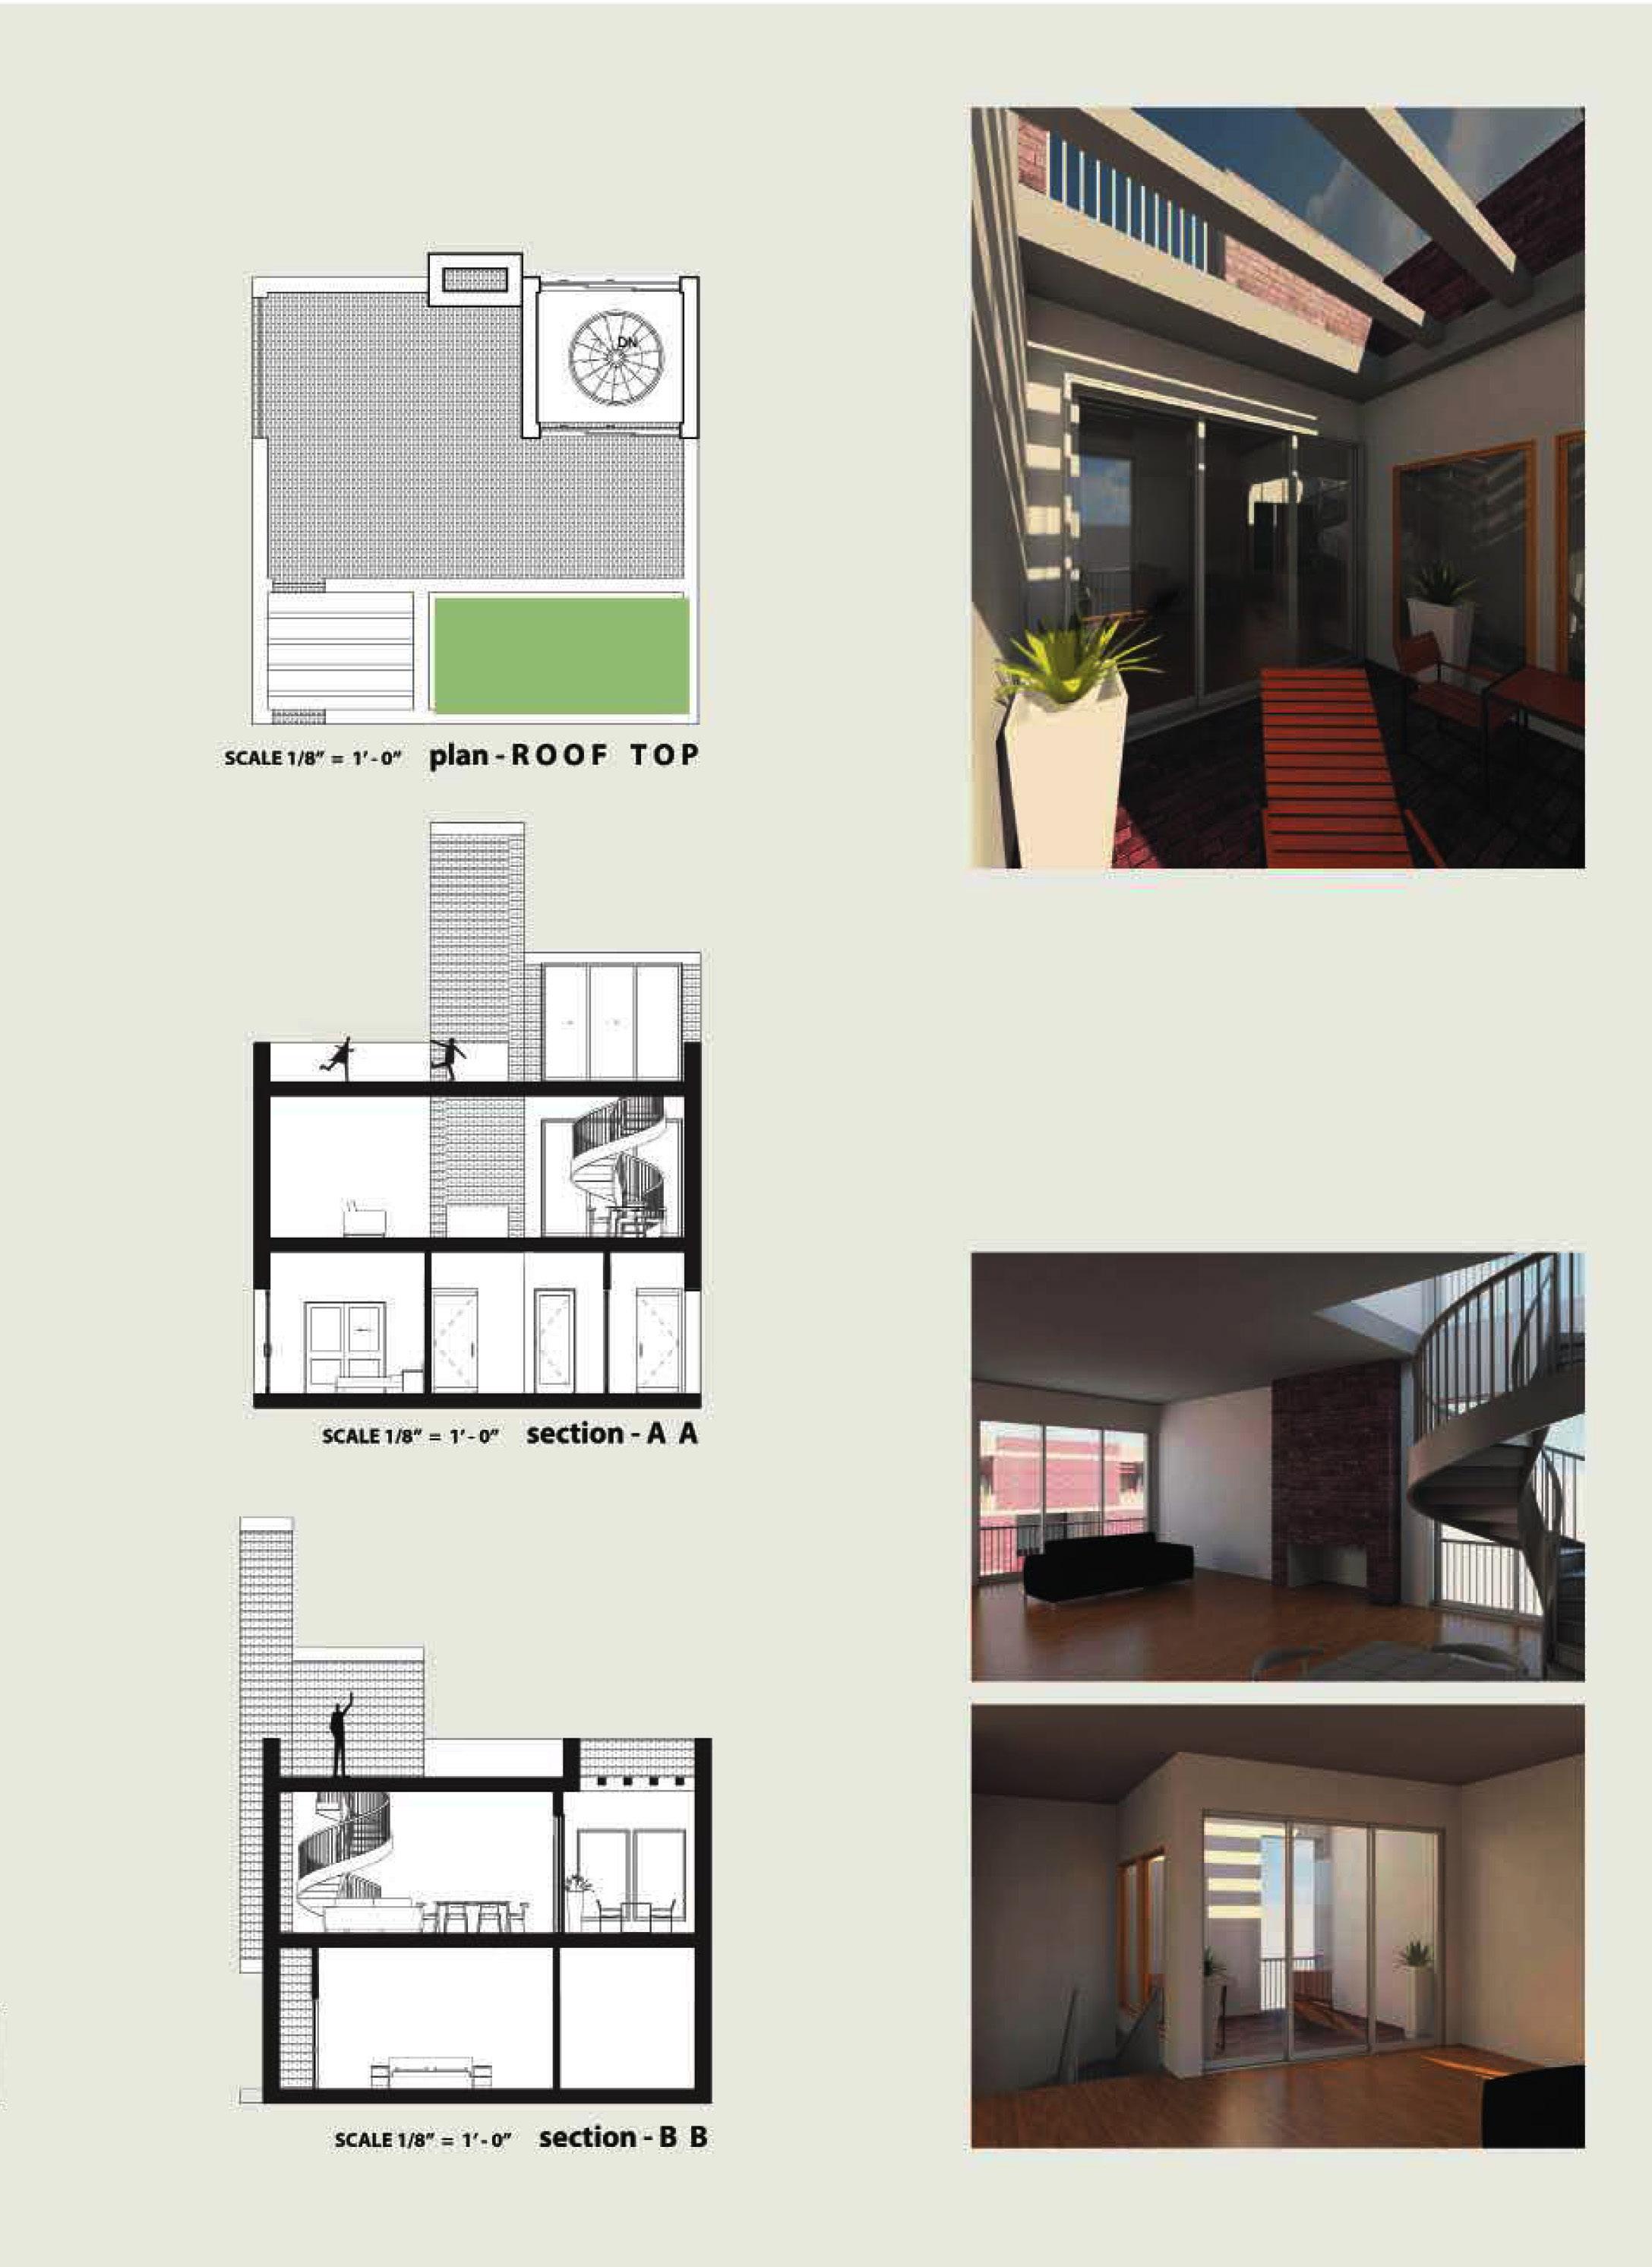
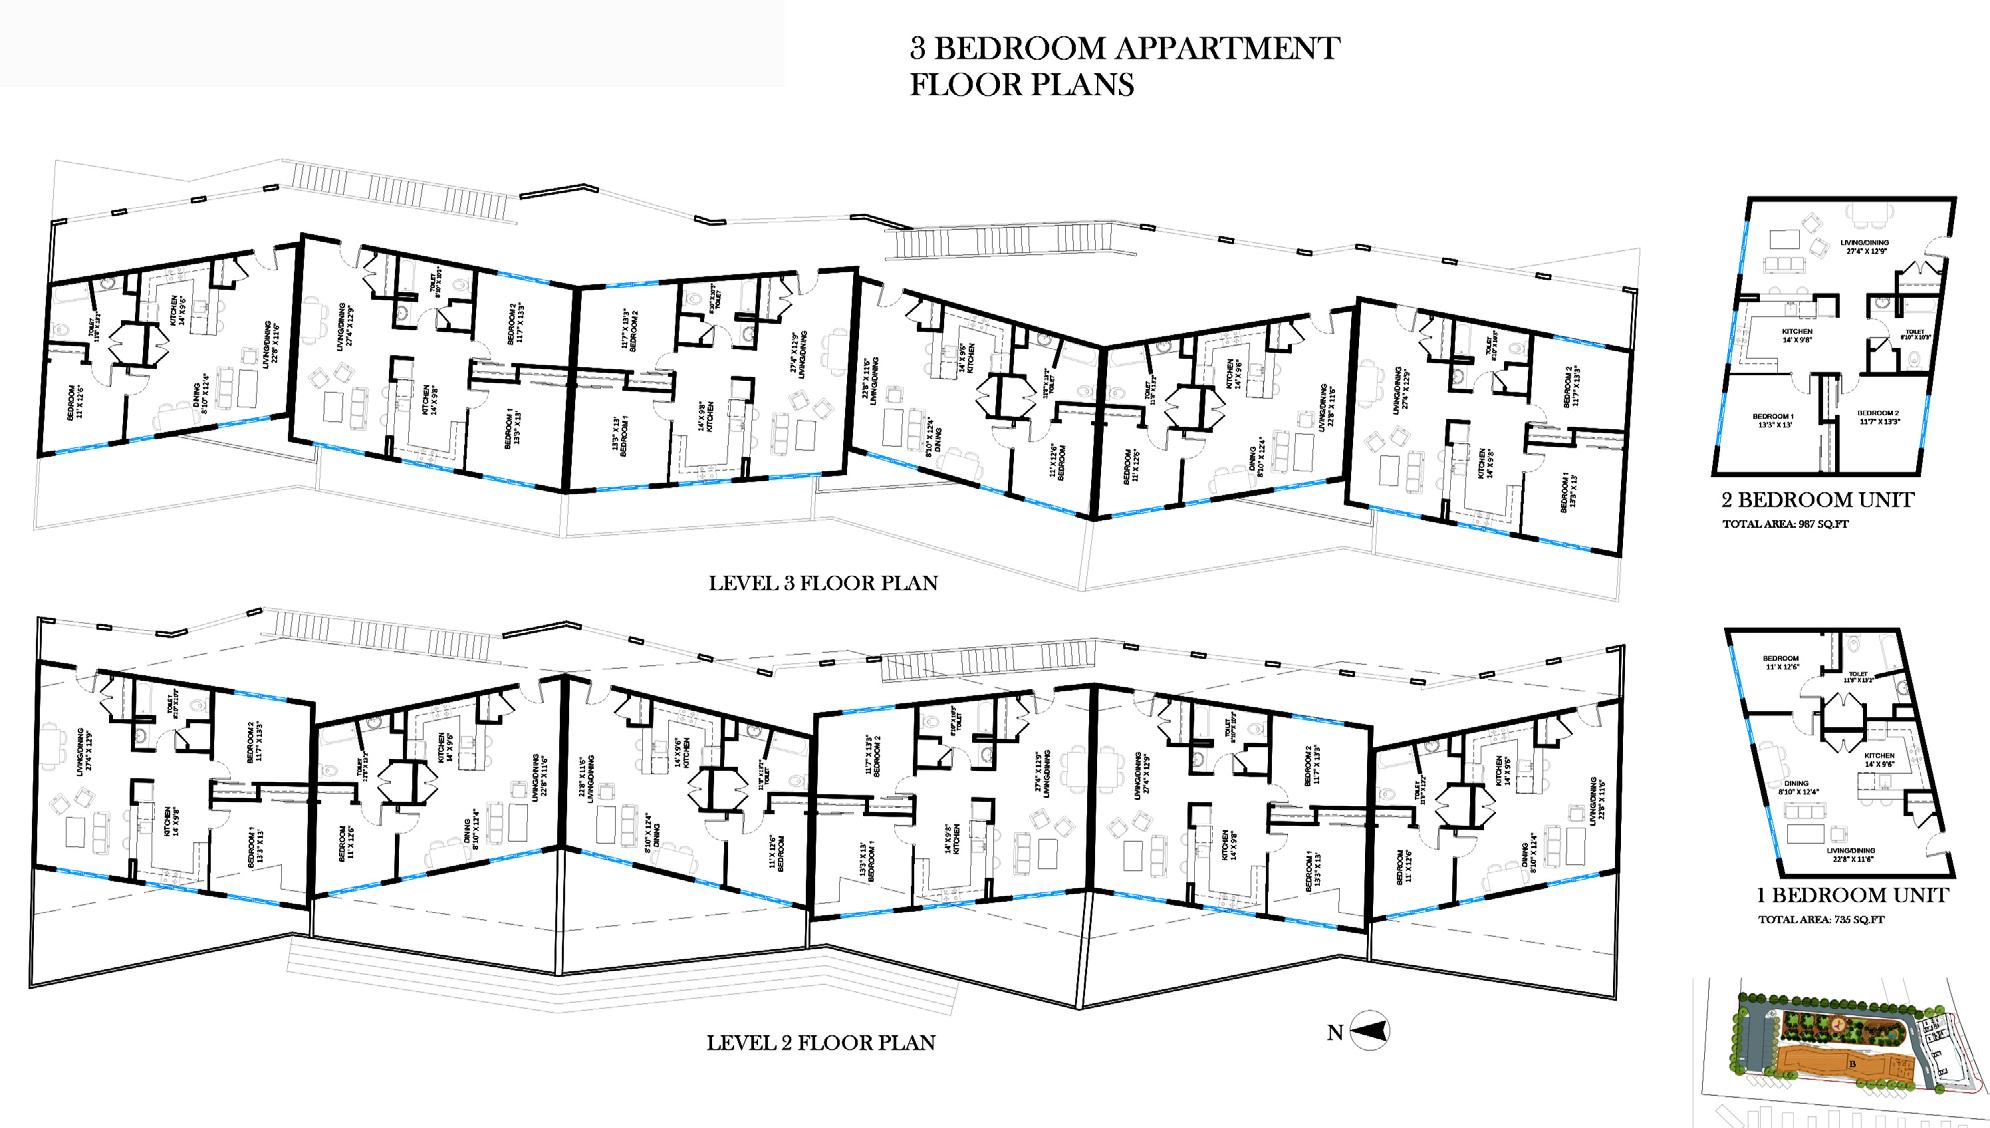
Proposal 1 Alex Rodriguez




Community Map: Old Town
LAND USE - Aerial Photograph
The Central Corridor Neighborhood Study by UNM


Location Map Proposed


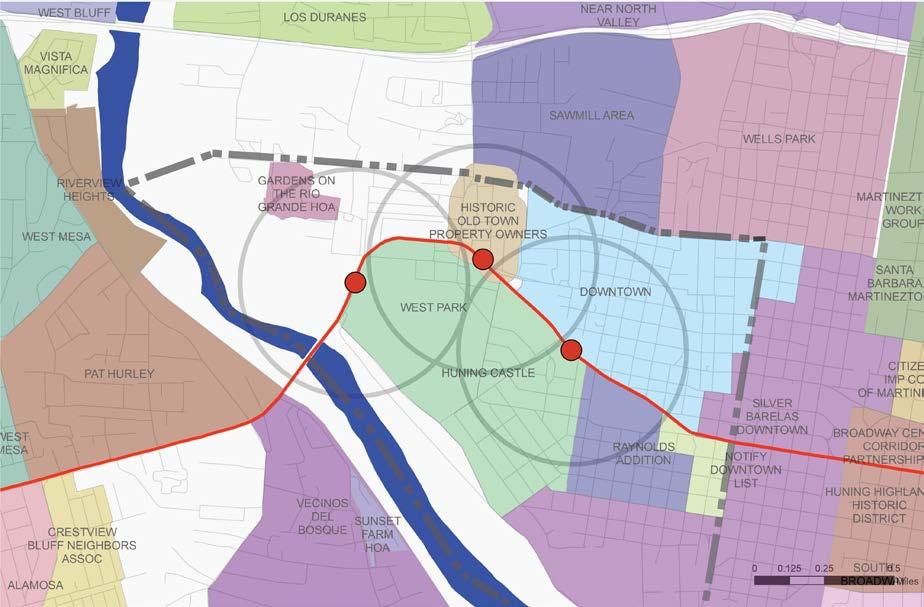
LAND USE - Neighborhood Association Boundaries
The Central Corridor Neighborhood Study by UNM


Location Map

The Central Corridor Neighborhood Study by UNM



Location Map

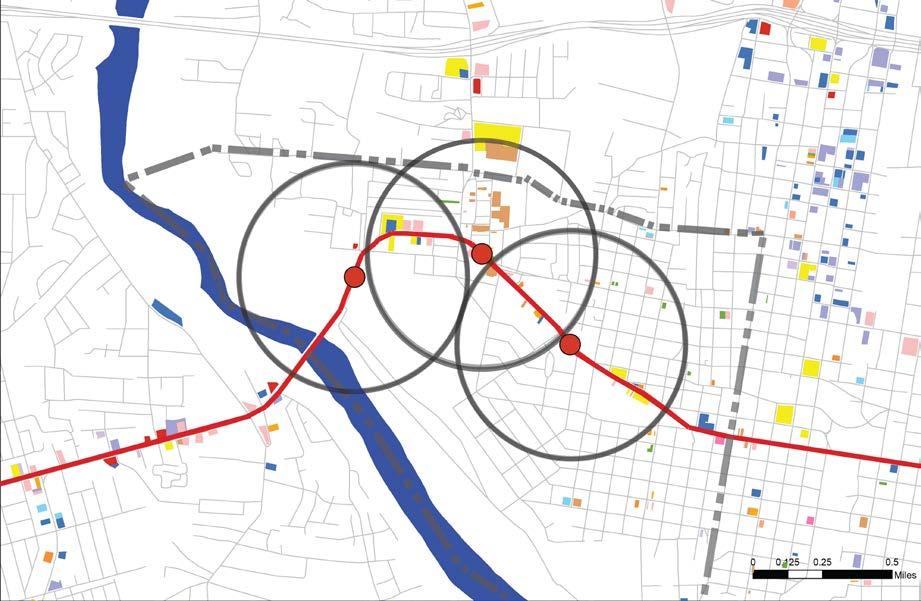
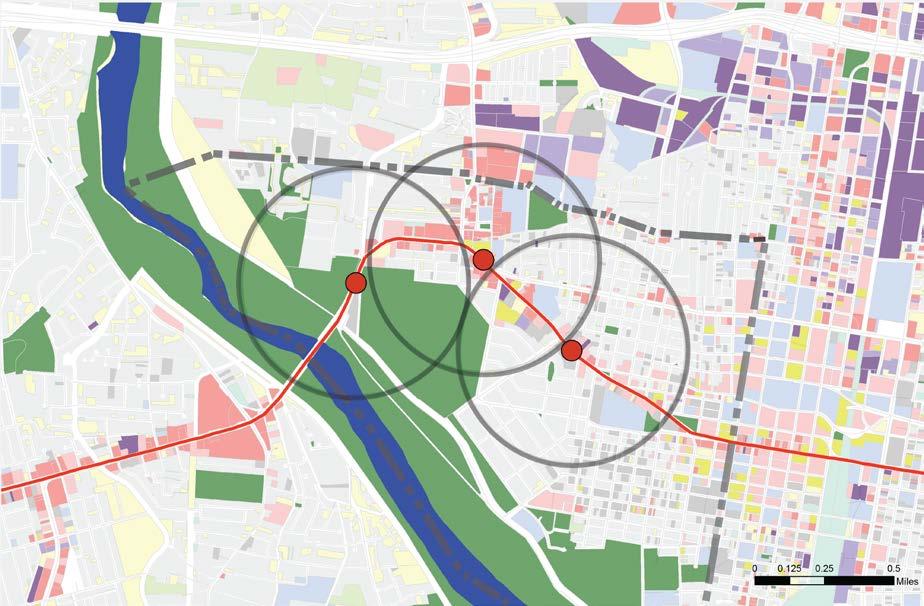
LAND USE - Commercial
The Central Corridor Neighborhood Study by UNM


Location Map

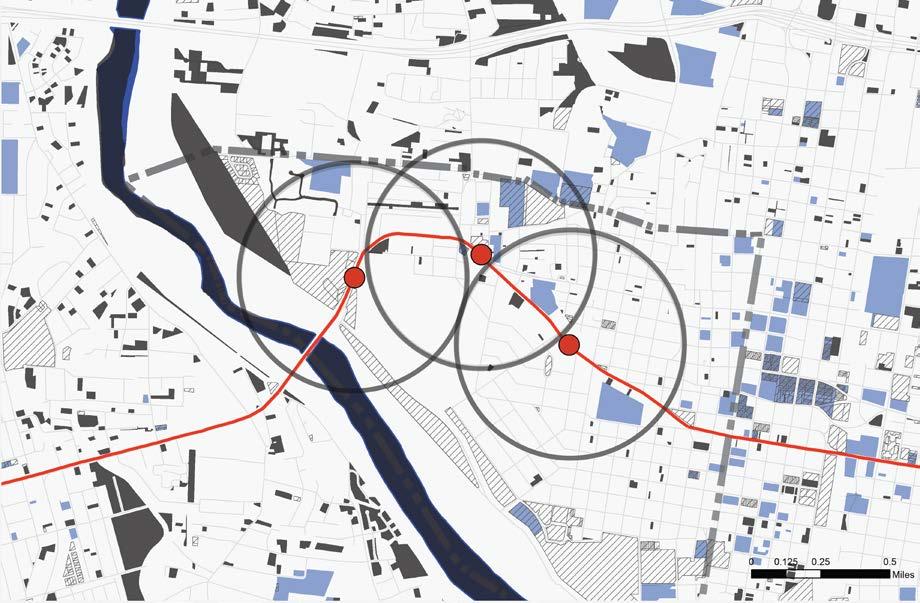
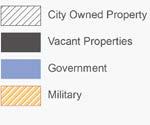
LAND USE - City owned and Vacant Lots
The Central Corridor Neighborhood Study by UNM


Location Map

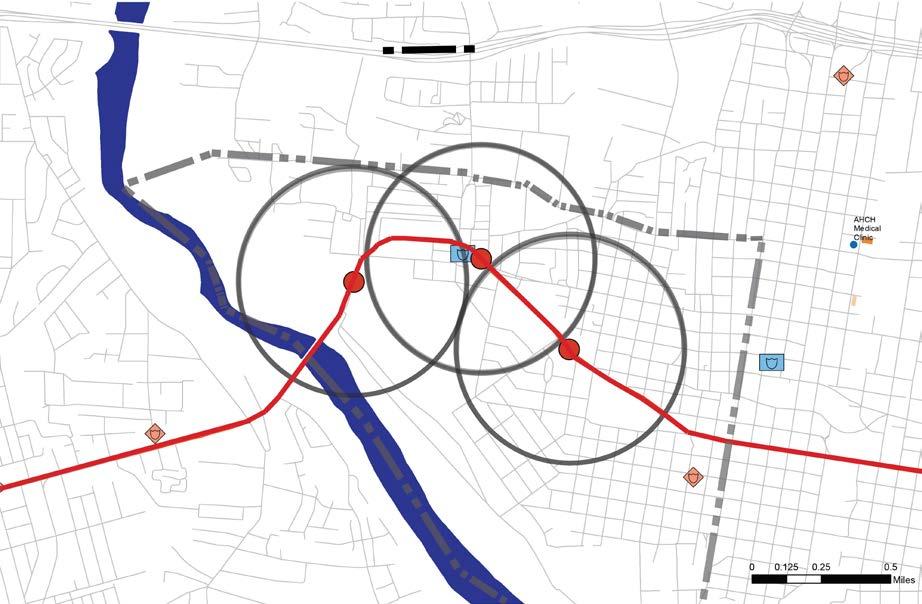
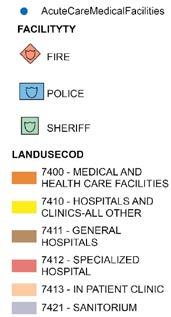
LAND USE - Health Facilities and Protective Services
The Central Corridor Neighborhood Study by UNM


Location Map

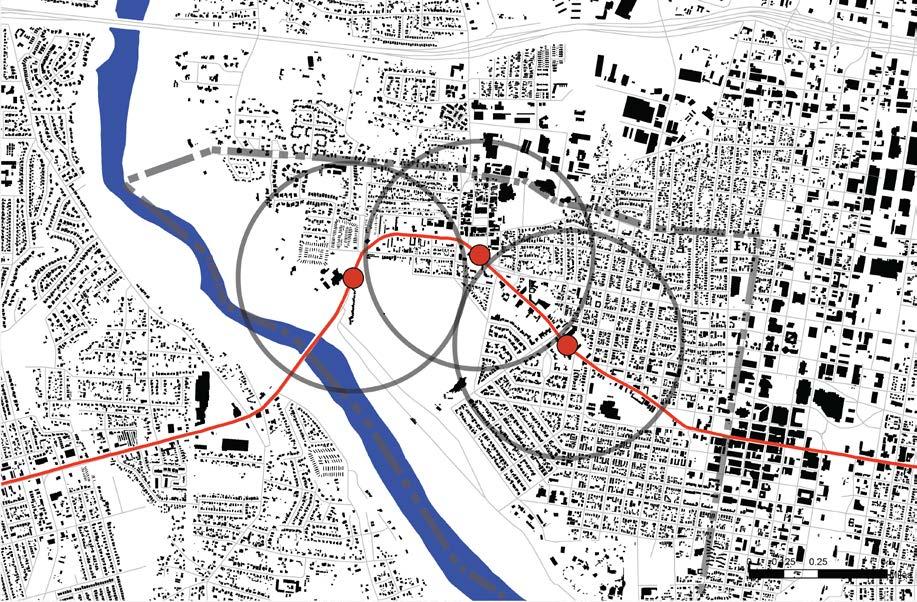
LAND USE - Built V. Unbuilt
The Central Corridor Neighborhood Study by UNM



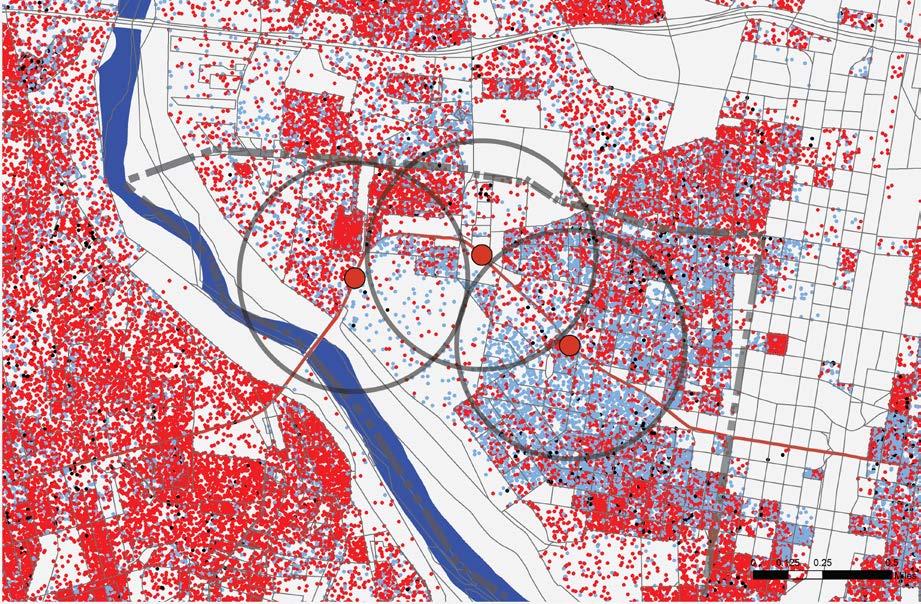
SOCIO-ECONOMIC - Racial and Ethnic Distribution
The Central Corridor Neighborhood Study by UNM


Not Hispanic - Other
Not Hispanic -Mixed Race
Not Hispanic - White Hispanic
Location Map

Median
The Central Corridor Neighborhood Study by UNM


MEDIAN AGE - BY CENSUS TRACT
Location Map

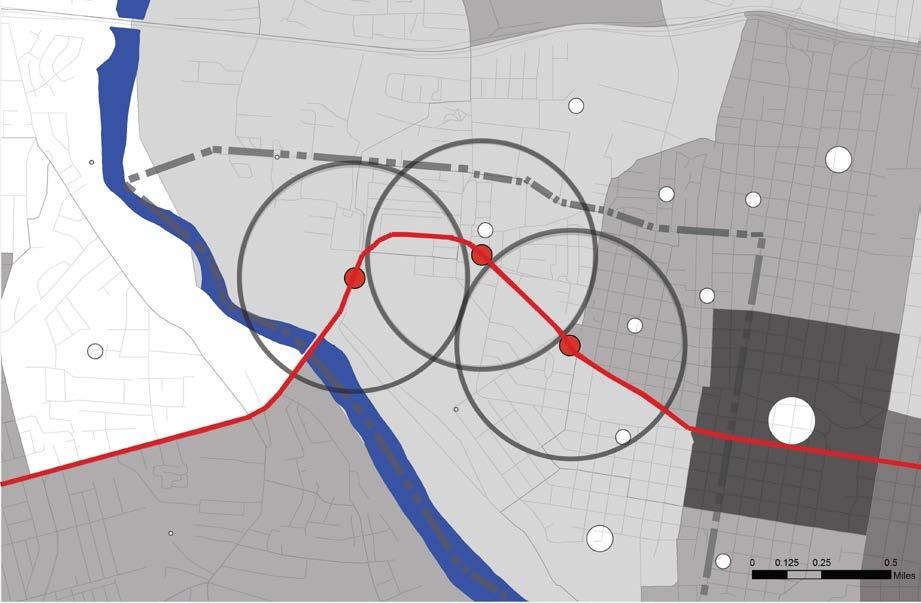
SOCIO-ECONOMIC - Employment and Poverty Levels
The Central Corridor Neighborhood Study by UNM


EMPLOYMENT DENSITY
JOBS PER ACRE
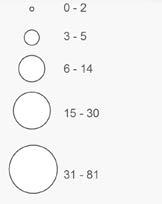
% FAMILIES UNDER 100% FEDERAL POVERTY LEVEL


Location Map


TRANSPORT - Roads
The Central Corridor Neighborhood Study by UNM


Location Map

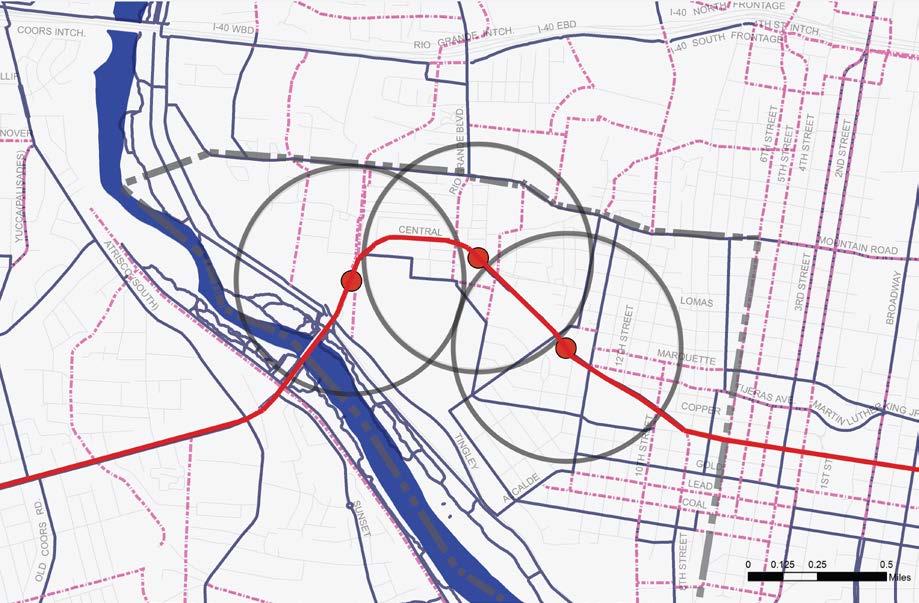
TRANSPORT - Bike Routes
The Central Corridor Neighborhood Study by UNM


Location Map

Community Map: OLD TOWN
TRANSPORT - Local Bus Routes & Rail
The Central Corridor Neighborhood Study by UNM


Location Map

Map:
- Land Use
The Central Corridor Neighborhood Study by UNM


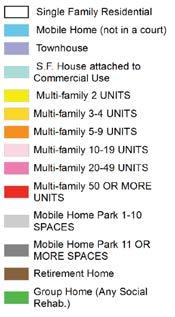
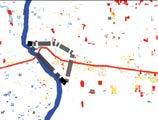
Location Map


RESIDENTIAL - Population Renting V. Owning
The Central Corridor Neighborhood Study by UNM


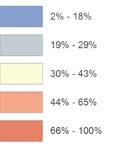
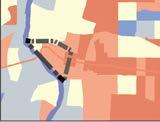
Location Map

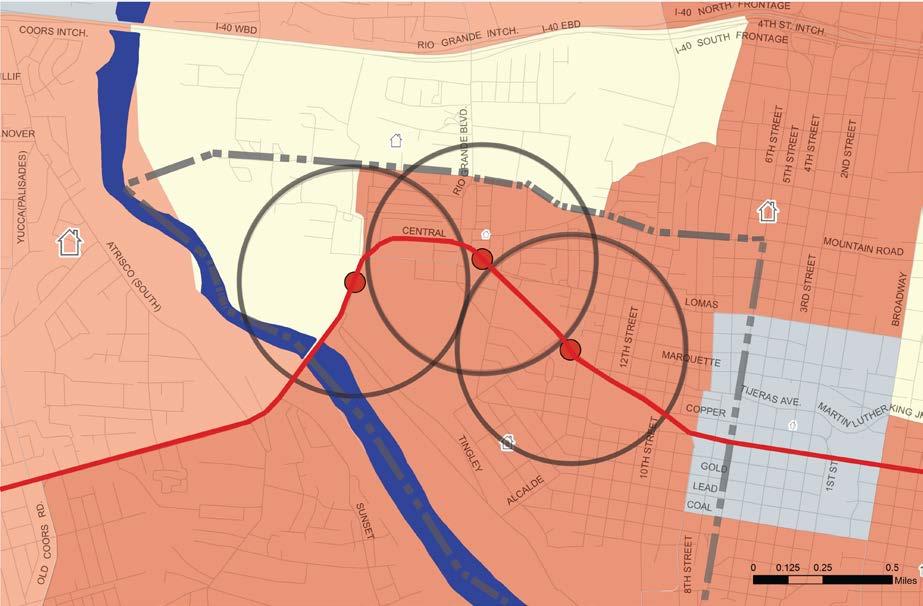
RESIDENTIAL - Age and Value of Housing
The Central Corridor Neighborhood Study by UNM


AGE OF HOUSING
Total Units Built Proir to 1970
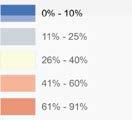
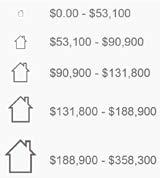
PROPERTY VALUES
Location Map

reg inald chavez e lementary
EN = 309
= 309
= 4 4
reg inald chavez e lementary
reg inald chavez e lementary
YDI, REGINALD CHAVEZ
HEAD START
BRO OKLINE COLLEGE-ALBU QUERQUE
BRO OKLINE COLLEGE-ALBU QUERQUE
BRO OKLINE COLLEGE-ALBU QUERQUE
YDI, REGINALD CHAVEZ
YDI, REGINALD CHAVEZ
HEAD START
HEAD START
EN = 309
EN = 309
= 309
= 309
= 4 4
= 4 4
EDUCATION: Lan d U se Typ e
The Central Co rrido r Neighb orh ood Stu dy by UNM
EDUCATION - Land Use
EDUCATION: Lan d U se Typ e
EDUCATION: Lan d U se Typ e
The Central Co rrido r Neighb orh ood Stu dy by UNM
The Central Corridor Neighborhood Study by UNM
The Central Co rrido r Neighb orh ood Stu dy by UNM
ace lea dership high scho ol
= 376
= 376
= 4 5
alice ki ng community school
EN = 333 ED = 96 DA = 3 5 dolores g onzales elementa ry EN = 396 ED = 396
wash ington midd le
= 468 ED = 468
= 1 02
NM S chool Demographics SY 15-16
= 6 6
Legend

! A.R.T. proposed bus stop > Exis ting bus st op . 1/2 Mile Radi us " Communi ty Boundary Mul ti Family R esidential
Singl e Famil y Resi dential
K-12 Schools
Mul ti Family R esidential Singl e Famil y Resi dential
Legend ! A R T proposed bus stop > Exis ting bus st op . 1/2 Mile Radi us " Communi ty Boundary Mul ti Family R esidential Singl e Famil y Resi dential
Colleges/Universities
K-12 Schools
PreK/Daycare
= Enrollment
= Economically Disadvantaged DA = Disabled
Location Map
Location Map
Location Map
- 4 .1 EN = Enrollment ED = Economically Disadvantaged DA = Disabled

- 4 .1
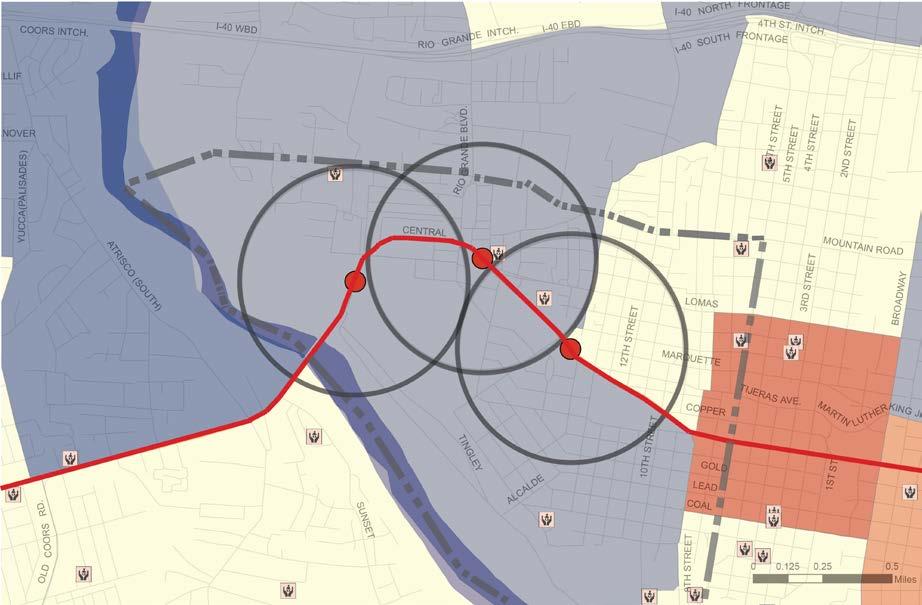
EDUCATION - Preschool Facilities and Vunerable Children
The Central Corridor Neighborhood Study by UNM


Location Map

Mary

Legend
Legend
! A R T proposed bus stop
Legend
Legend
> Exis ting bus st op
. 1/2 Mile Radi us
! ( A R T proposed bus stop > Exis ting bus st op . 1/2 Mile Radi us " Communi ty Boundary " Unincorporated Areas
! A R T proposed bus stop
> Exis ting bus . 1/2 Mile Radi us " Communi ty " Unincorporated Areas
" Communi ty Boundary
Mul ti Family R esidential
Mul ti Family R esidential
" Unincorporated Areas
Mul ti Family R esidential
Mul ti Family R esidential
Parks Vacant Properties
Singl e Famil y Resi dential
Singl e Famil y Resi dential Parks

Location Map
Location Map
Singl e Famil y Resi dential Parks Vacant Properties L - 5 .1
Singl e y Resi dential Parks Vacant L - 5 .1

.1
L - 5 .1
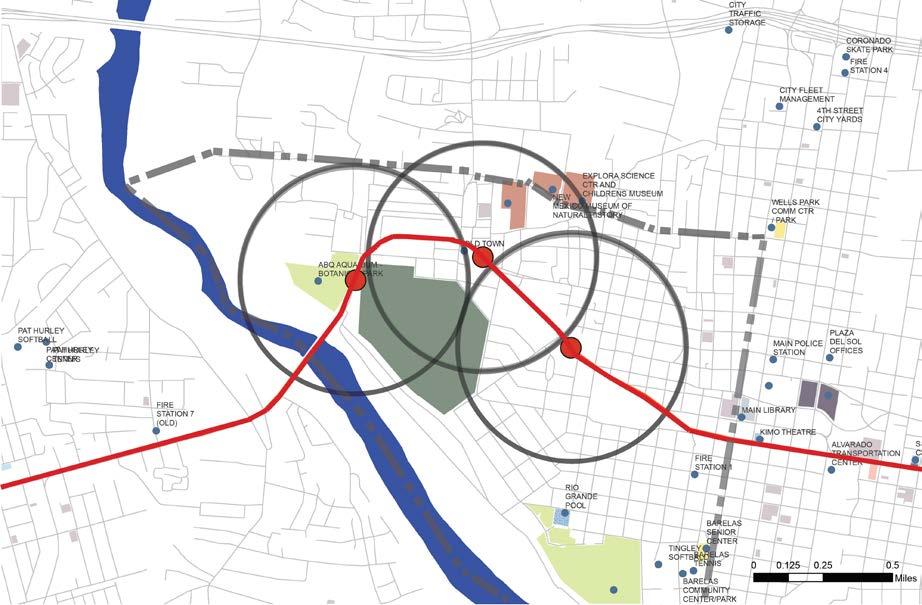
PUBLIC REALM - Community /Publicly Accessible spaces
The Central Corridor Neighborhood Study by UNM


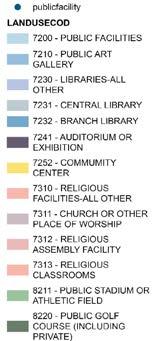
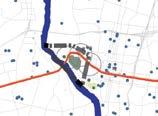
Location Map

Community Map: OLD TOWN

The Central Corridor Neighborhood Study by UNM


O Food Retailers
MEAN ESTIMATED OBESITY
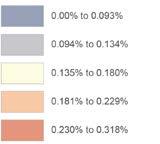
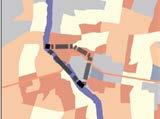
Location Map

The Central Corridor Neighborhood Study by UNM


% OF LOW ACCESS/LOW INCOME PEOPLE AT 1/2 MILE
Location Map

The Central Corridor Neighborhood Study by UNM Community Map: OLD TOWN
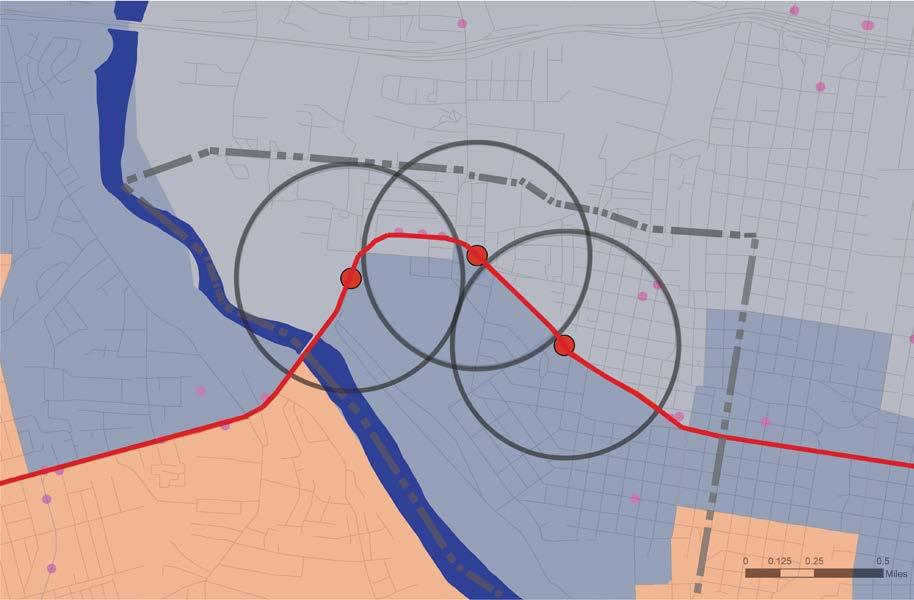


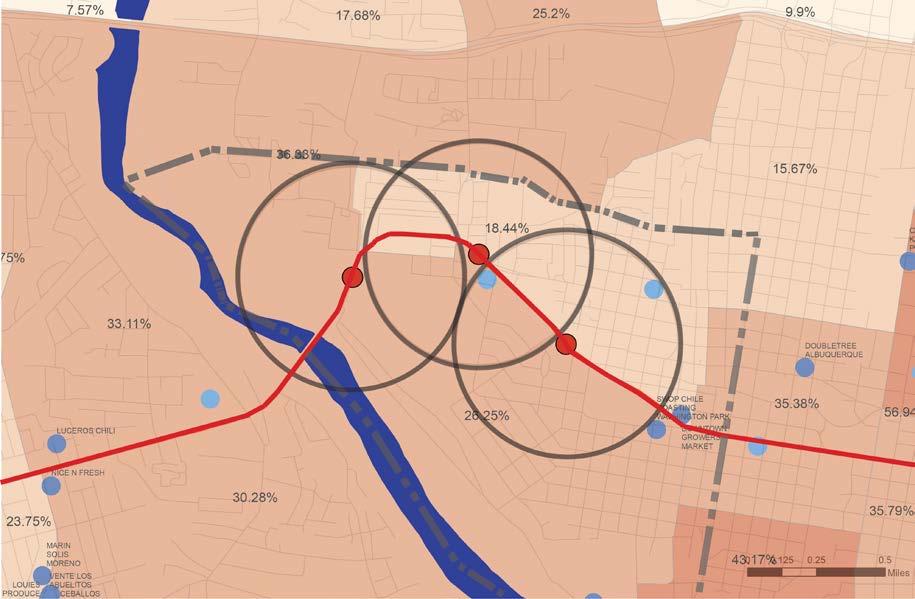
HOUSEHOLDS RECEIVING FOOD STAMPS - ESTIMATED % OF HOUSEHOLDS
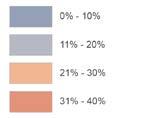
Location Map


ENVIRONMENTAL QUALITY - Polluted Sites
The Central Corridor Neighborhood Study by UNM


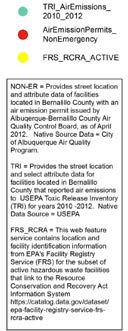

Location Map

Movement away from Downtown, up the sandhills and toward the ranch land of Albuquerque’s East Mesa began in the late 19th and early 20th centuries around the establishment of the University of New Mexico in 1889. The historic Silver Hill Neighborhood was platted as the Terrace Addition (also known as Terrace Heights and Buena Vista Heights) several years prior in 1881. This area is bounded by Presbyterian Hospital and Yale Boulevard to the west and east, and Central Avenue and Central New Mexico Community College to the north and south respectively. Silver Hill is defined by Silver Avenue, a tree lined street with buffered sidewalk setbacks and forested median strip.
To the north, the Sycamore neighborhood was platted as Brownewell and Lail’s Highland Addition in 1886. It is defined by I-25 and University Boulevard, and Martin Luther King Jr Avenue and Central. Neither Brownewell nor Terrace saw much housing or commercial development until 1910, when Huning Highland was completed. Sycamore is the site of an abundance of vintage multifamily housing, with some remaining historic homes built primarily in the ‘30s and ‘40s. Today Presbyterian Hospital, which has historically been the area’s dominant land owner and has developed much in its vicinity, is working with Titan Development and the Mestas Development Group to create a mixed use property with a hotel, street-level retail and 74 apartment units. The 10 acre property spans five city blocks within Sycamore and had been largely vacant for decades.
Col. D.K.B. Sellers—a self-deemed colonel—played a role in much of the development of the University Heights Addition. This neighborhood was platted in 1906 and spans from Yale to Girard and Central to Garfield, encompassing the streets named after ivy league schools. Incidentally, Sellers led the push to change Railroad Avenue to Central Avenue in 1907. He became mayor as New Mexico became a state in 1912, and went on to develop much of Nob Hill. Spruce Park— originally the Country Club Addition—was platted in 1922 as the city’s only exclusive neighborhood. It is bound by “Pill Hill” or Encino Place near I-25 and University, and Martin Luther King Jr Avenue and Sigma Chi Road. Unlike the other University neighborhoods, the enclave was platted in the City Beautiful tradition with gently curving, tree-lined streets.
Today the neighborhoods along the Central Corridor and adjacent to the University of New Mexico are diverse in character and population. For instance, Spruce Park remains an area of affluence. Silver Hill, Sycamore, and University Heights on the other hand have been challenged by blight, absentee landlords, and crime. Due to the high population of students, the area has high tenant mobility rates and a wide variety of income levels. In general, poverty rates are high compared to the rest of the city.
With the exception of UNM and its arboretum, there is little open space in the area. Roosevelt Park, a 13-acre depression-era WPA project located in Silver Hill, is an exception. There is also a small eponymously named neighborhood park at the center of Spruce Park. Unfortunately, when University area neighborhoods were platted in traditional grid patterns and built upon, developers failed to incorporate unique topographies and sublime western views into the designs. As a result many potential acropoleis deserving pride of place and public uses were squandered. However, the area possess an abundance of surface parking lots, vacant and city-owned properties which might potentially be leveraged as public space around new zoning and transit. Albuquerque is historically a developer driven city with a laissez-faire approach to urban design, so seeing the creation of such spaces will likely require significant effort on the part of the neighborhoods and community.
—Jessica Cassyle Carr
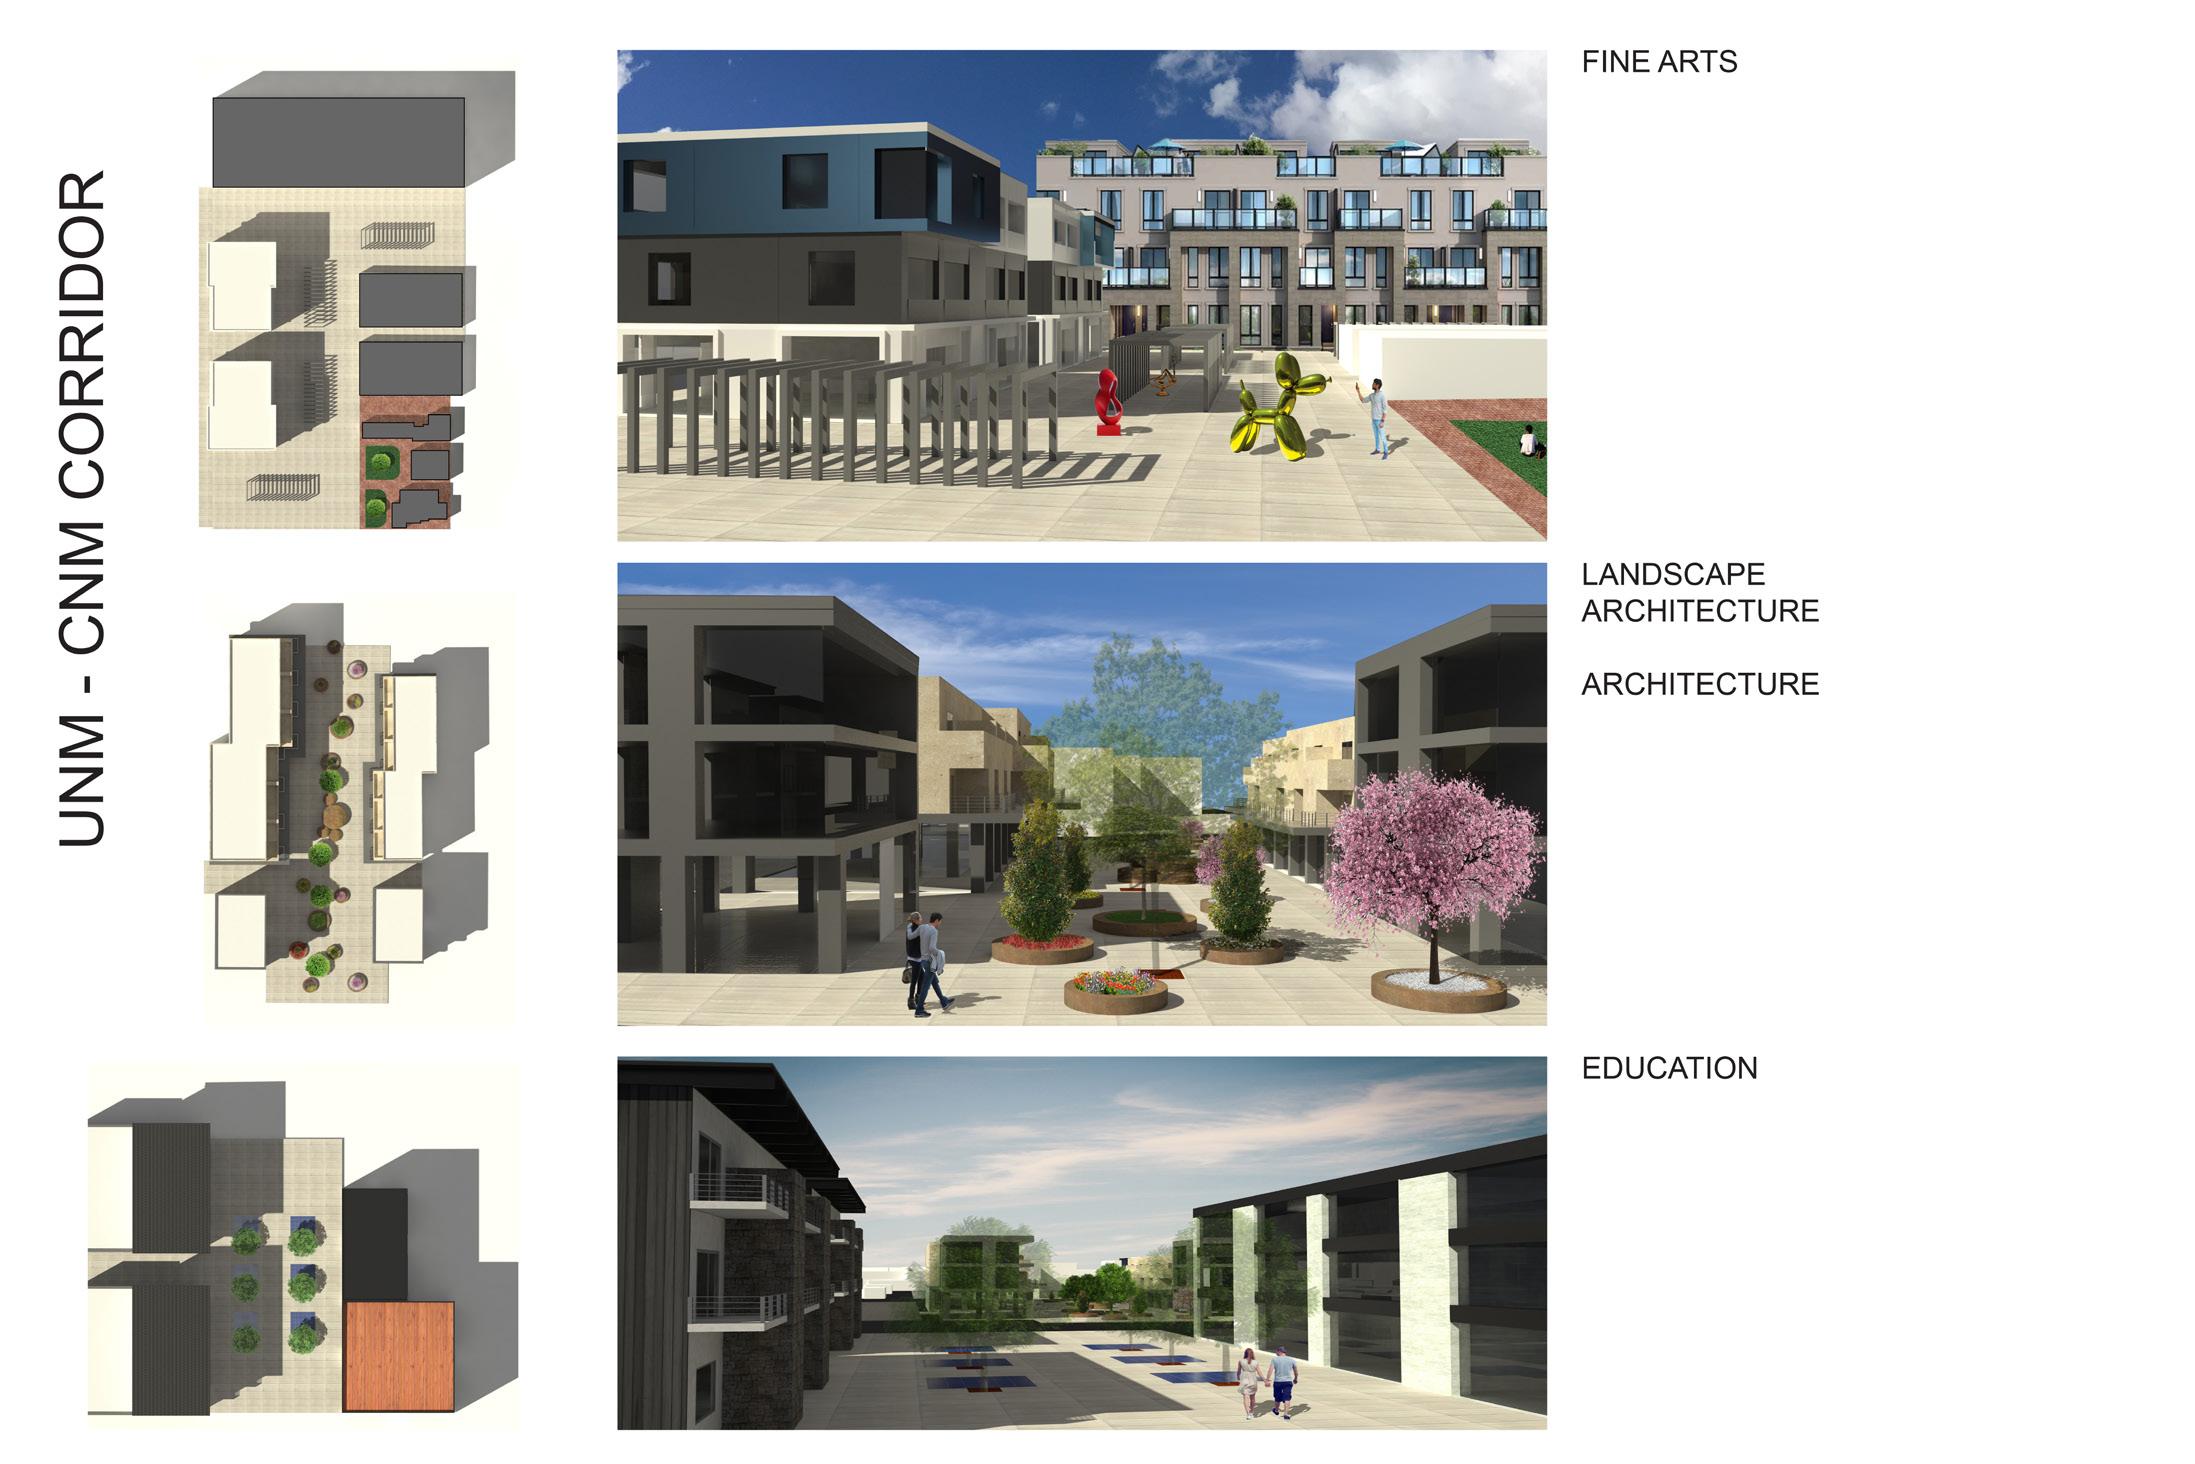
Travis Tabet Bishal Khanal Ali Al-Gahmi

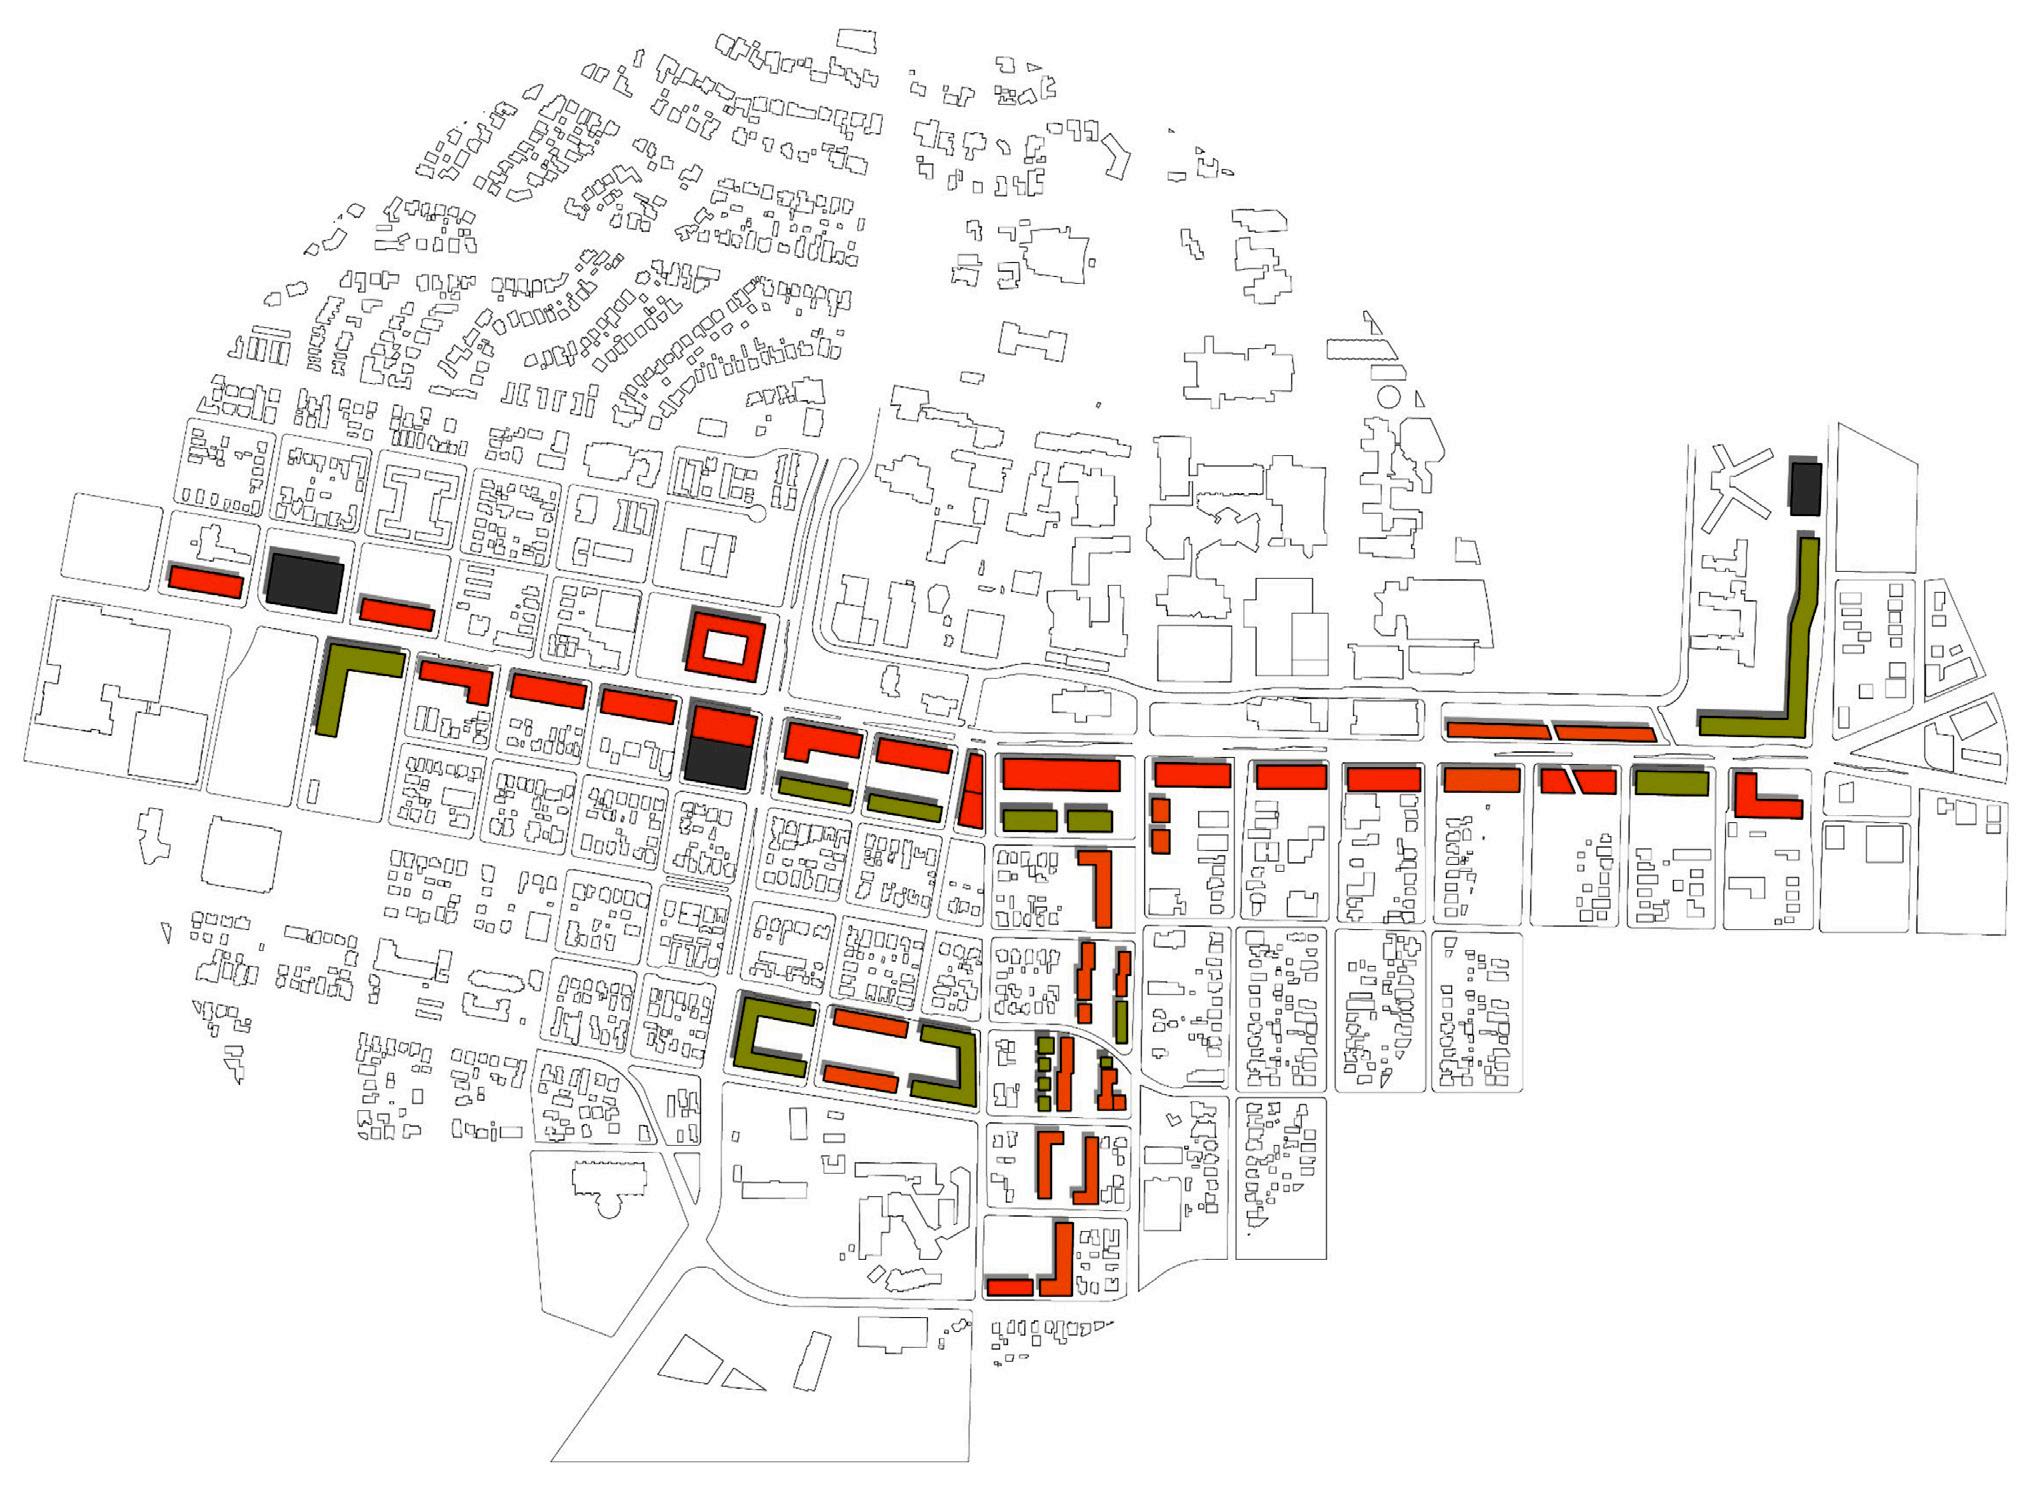
ART Stations
East-West movement on Central
North-South movement on University
Diagonal pedestrian movement between UNM and CNM
Existing Green Space
New Green Space
Ali Al-Gahmi
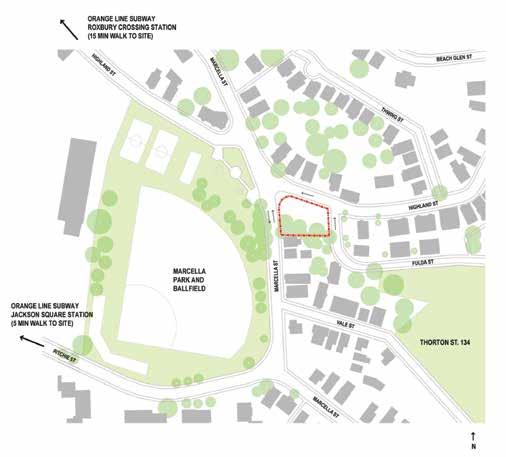
SITE: UNIVERSITY AVE./DR. MLK JR. PROPOSED SITE
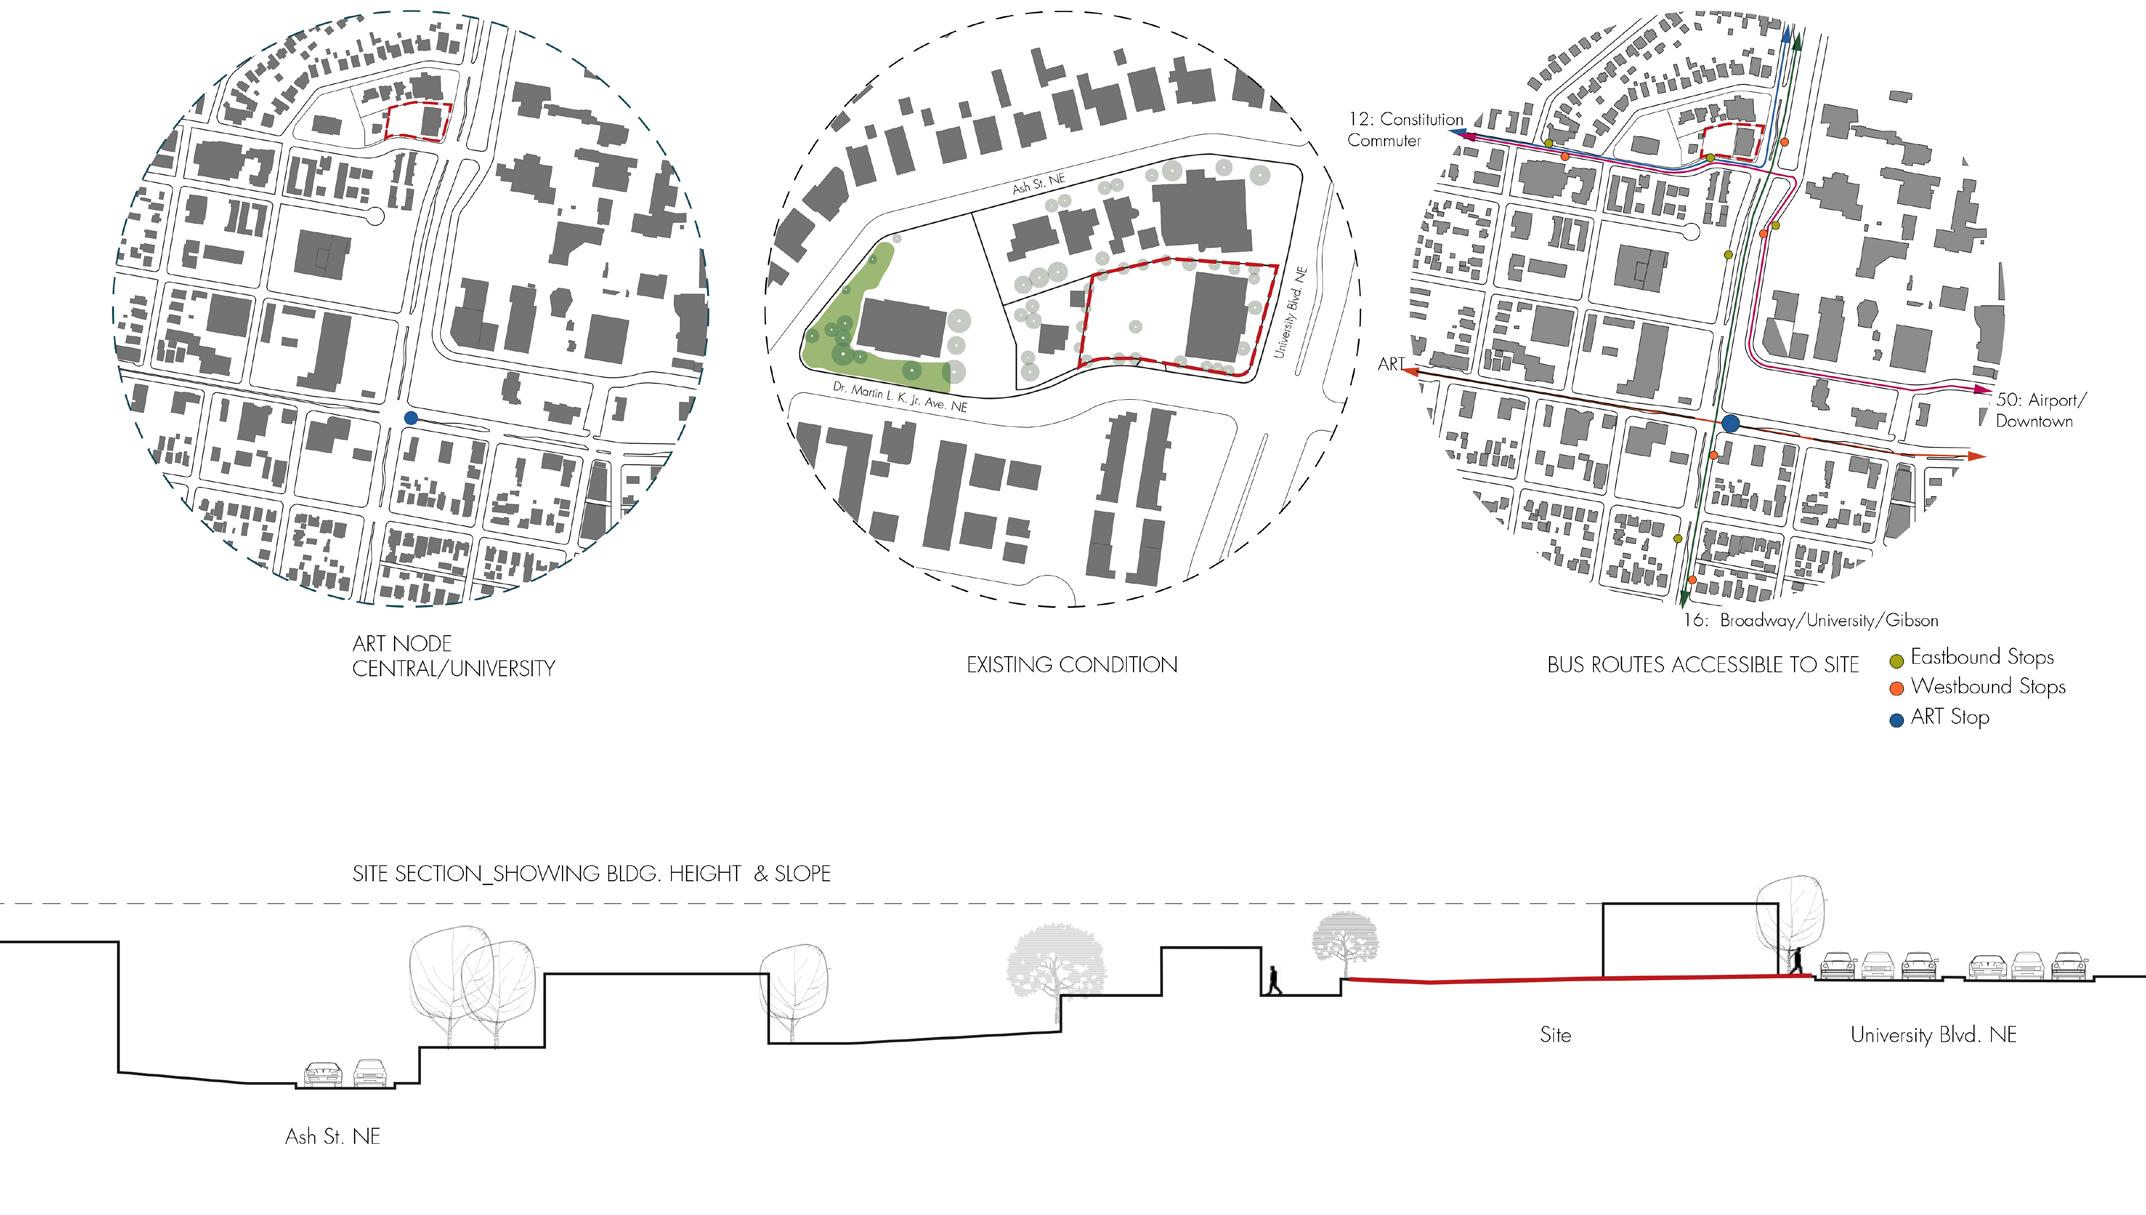


Site Plan
Site Plan


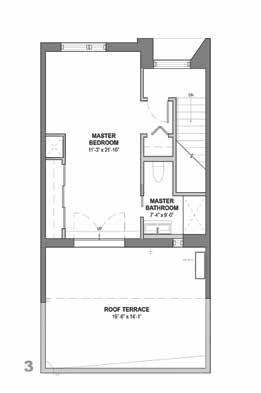



YEAR: September, 2013 AREA: 7,883 SF (4 units @ 1,850 SF) 3 bedroom, 2.5 bath
YEAR: September, 2013 AREA: 7,883 SF (4 units @ 1,850 SF) 3 bedroom, 2.5 bath
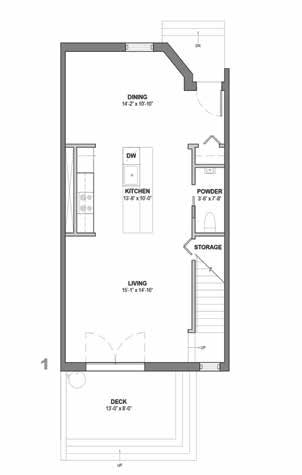

ARCHITECT: Interface Studio Architects (ISA)
Interface Studio Architects (ISA)

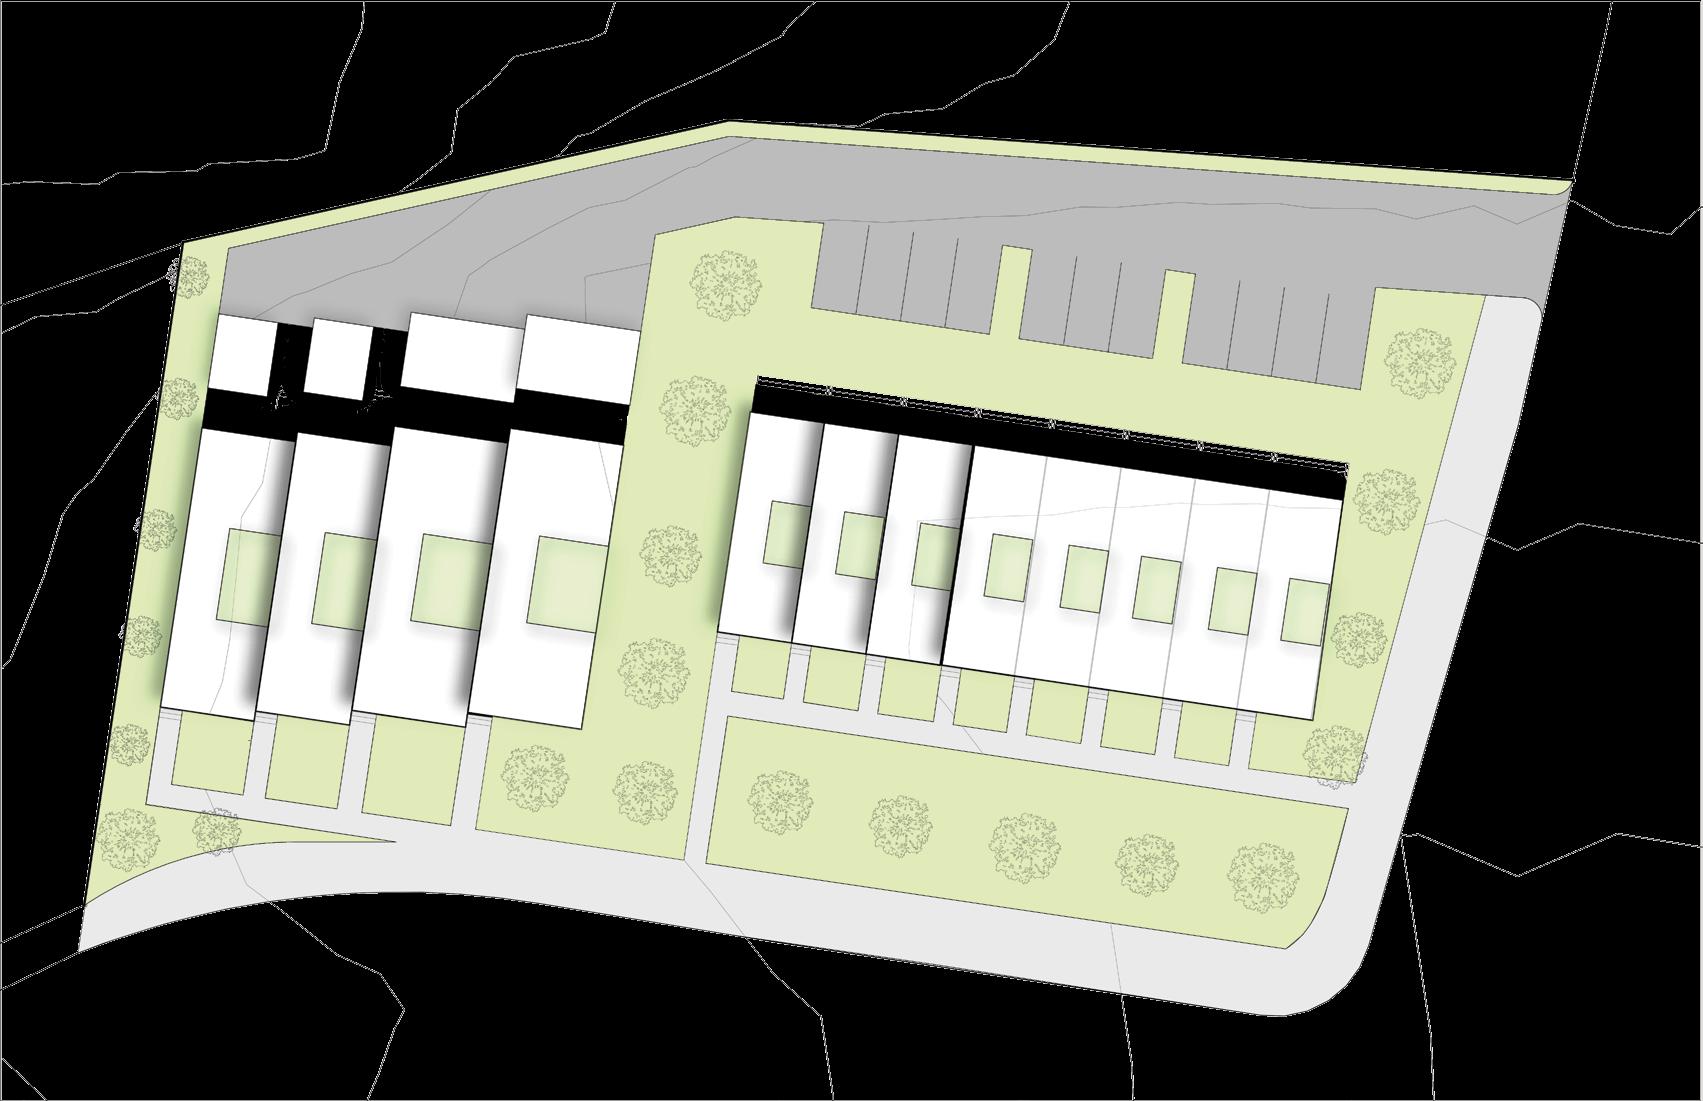
LOT SIZE: 34,350 SF IDO ZONING: R-T
NUMBER OF UNITS: 12 DU/ACRE: 15.23 PARKING: Required: 14/Proposed: 11
LEGEND:
A. Living Area
B. Kitchen/Dining
C. Atrium
D. Storage
E. Exterior Patio
F. Balcony
J. Bedroom
H. Bathroom
I. Closet




UNIT C @ 2,801 SF (2 UNITS)

UNIT C @ 2,801 SF (2 UNITS)
C @ 2,801 SF (2 UNITS) FRIST


SECTION DD
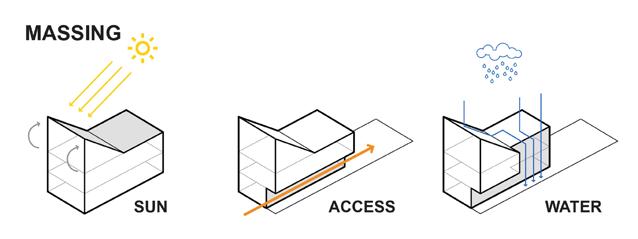
BUILDING CIRCULATION
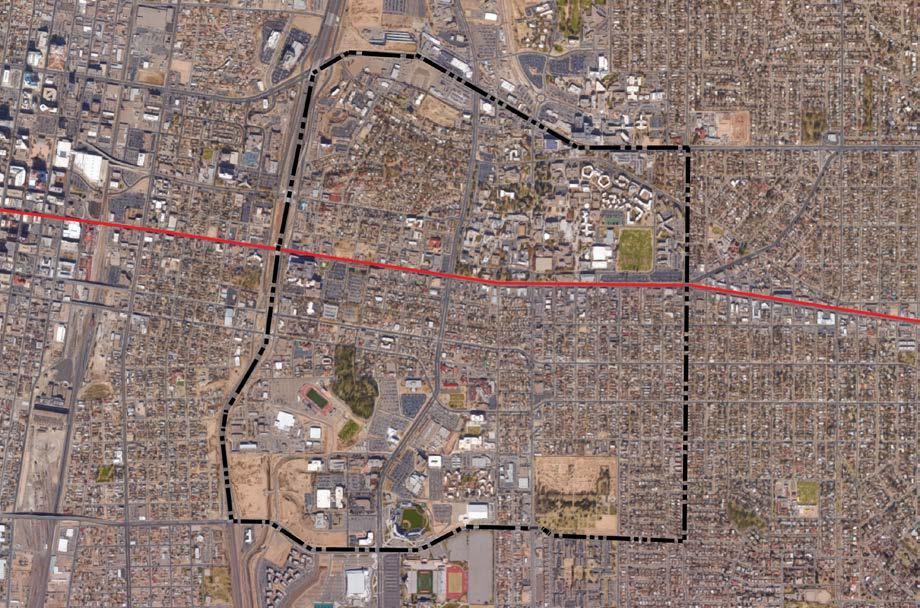
LAND USE - Aerial Photogragh
The Central Corridor Neighborhood Study by UNM

Source: Accessed: FEB:2017
Location Map Legend
ART Route Community Boundary 1/2 Mile Radius
Proposed ART Stops


Community Map: UNIVERSITY
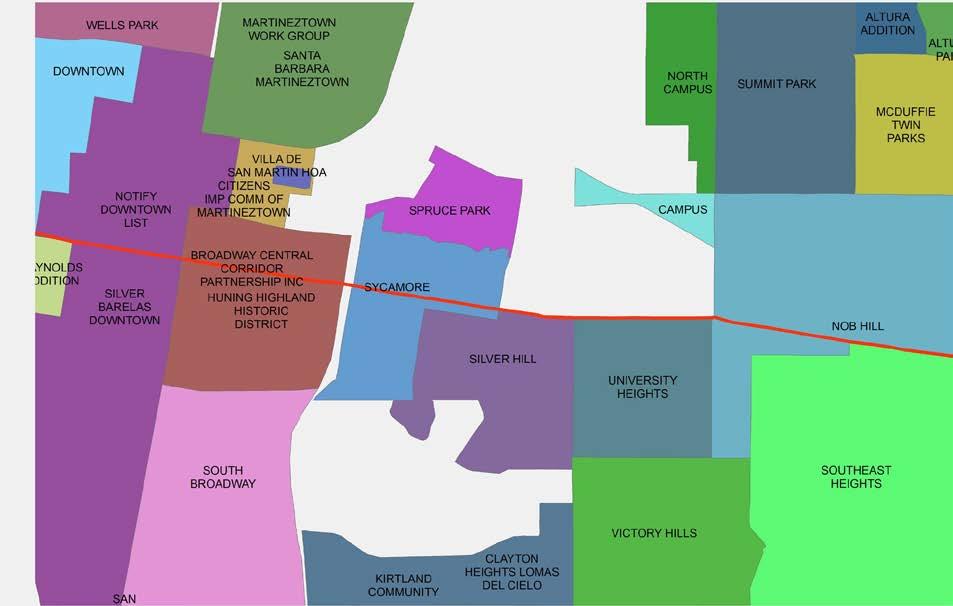

The Central Corridor Neighborhood Study by UNM


Source: Accessed: FEB:2017
Location Map Legend
ART Route
Community Boundary
1/2 Mile Radius
Proposed ART Stops



The Central Corridor Neighborhood Study by UNM


Source: AGIS
Accessed: FEB:2017
ART Route
Community Boundary
1/2 Mile Radius
Proposed ART Stops

Location Map Legend


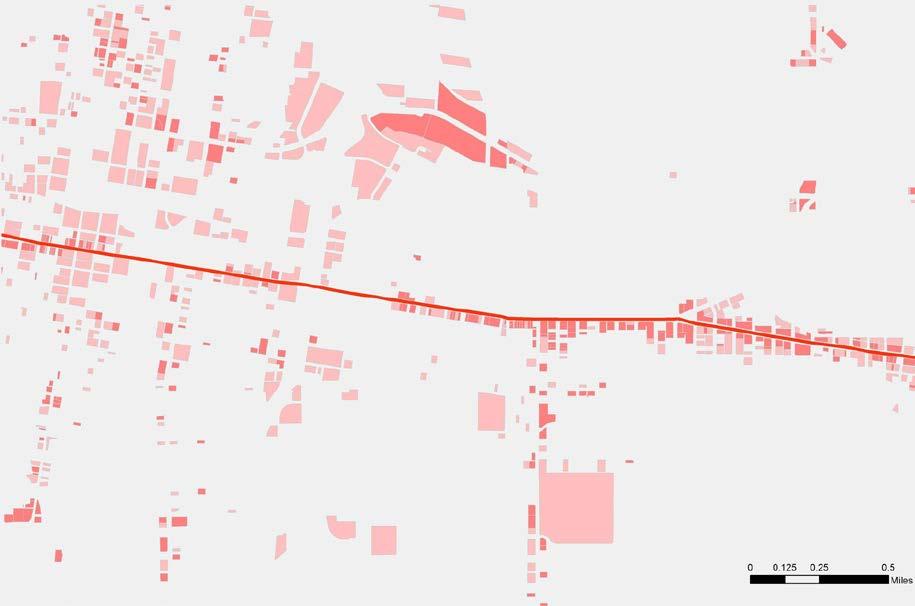
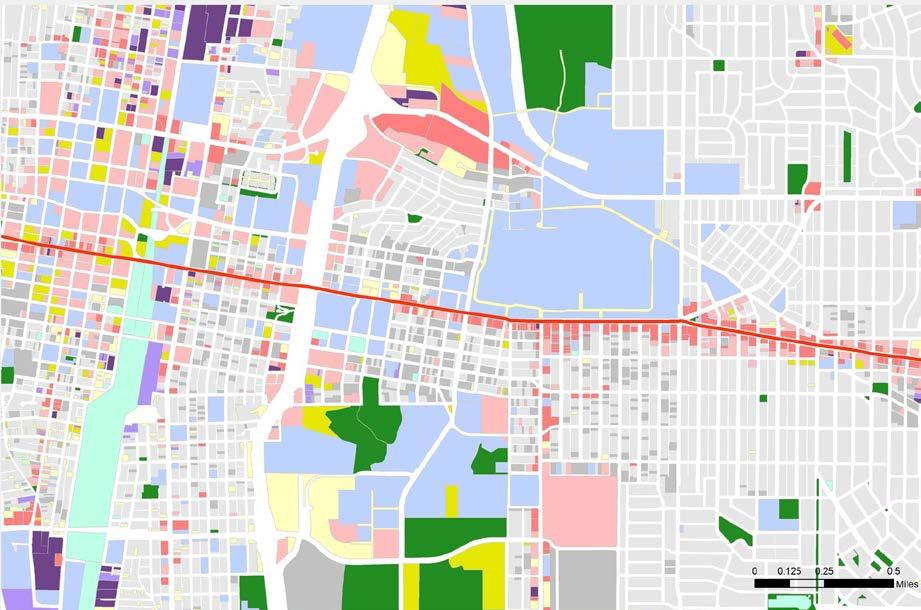
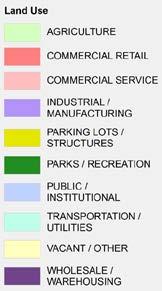
Commercial

The Central Corridor Neighborhood Study by UNM


Source: AGIS.org
Accessed: FEB:2017



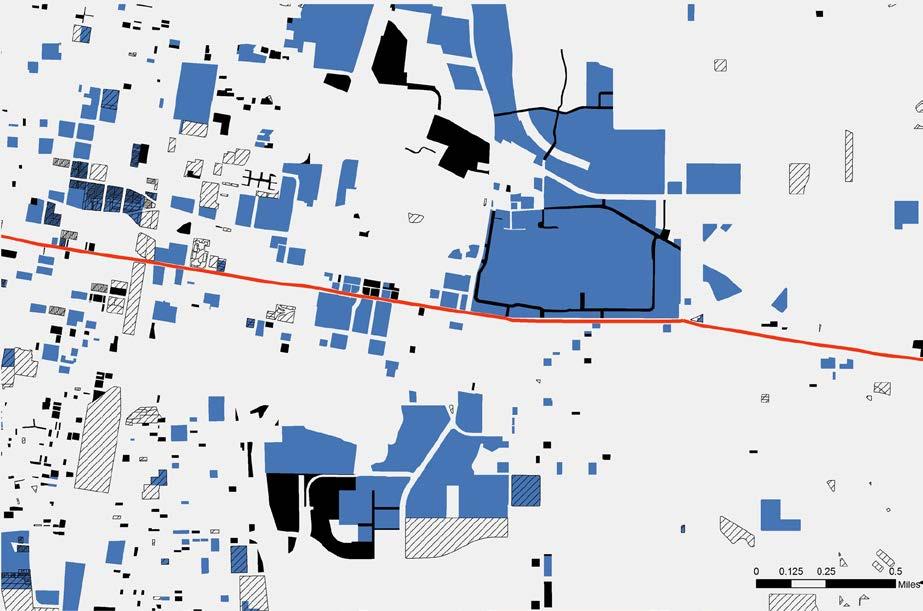

The Central Corridor Neighborhood Study by UNM


Source: AGIS.org Accessed: FEB:2017


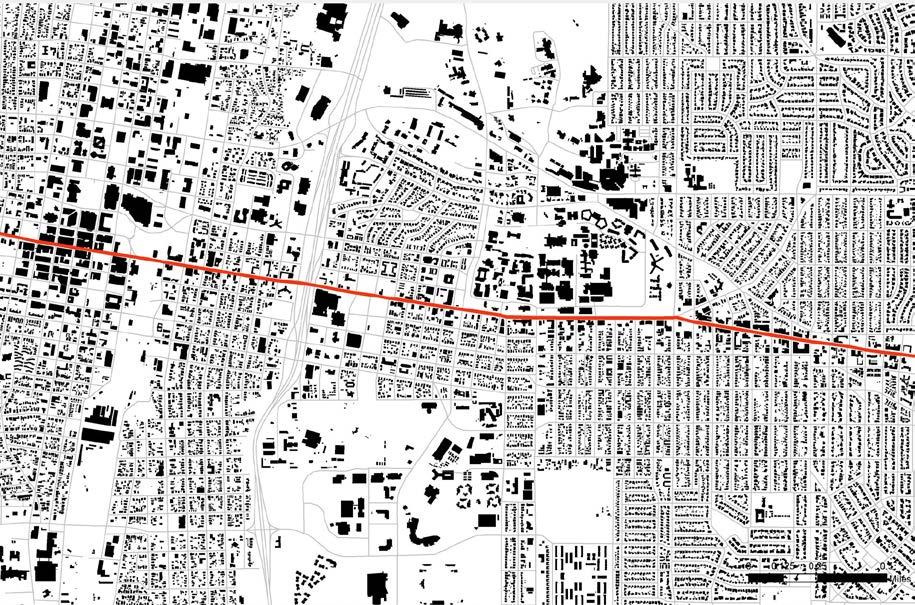

The Central Corridor Neighborhood Study by UNM


Source: Accessed: FEB:2017
ART Route Community Boundary 1/2 Mile Radius
Proposed ART Stops

Un Built
Surfaced streets Built


Location Map

Community Map: UNIVERSITY
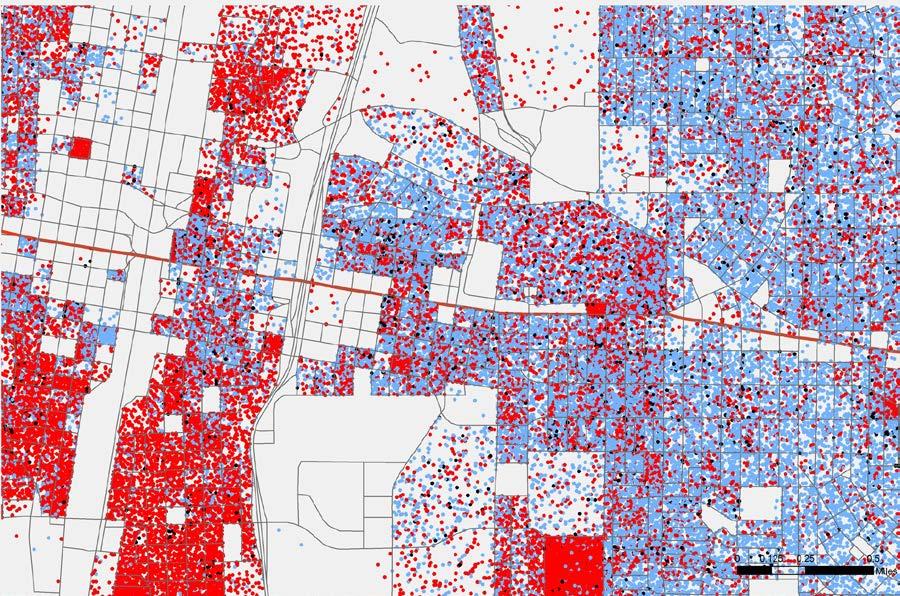

SOCIO-ECONOMIC - Racial and Ethnic Distribution
The Central Corridor Neighborhood Study by UNM


Source: Accessed: FEB:2017
Legend
ART Route Community Boundary 1/2 Mile Radius
Proposed ART Stops

Non Hispanic - Other
Non Hispanic - Mixed Races
Non -Hispanic - White
Hispanic


Location Map

Community Map: UNIVERSITY
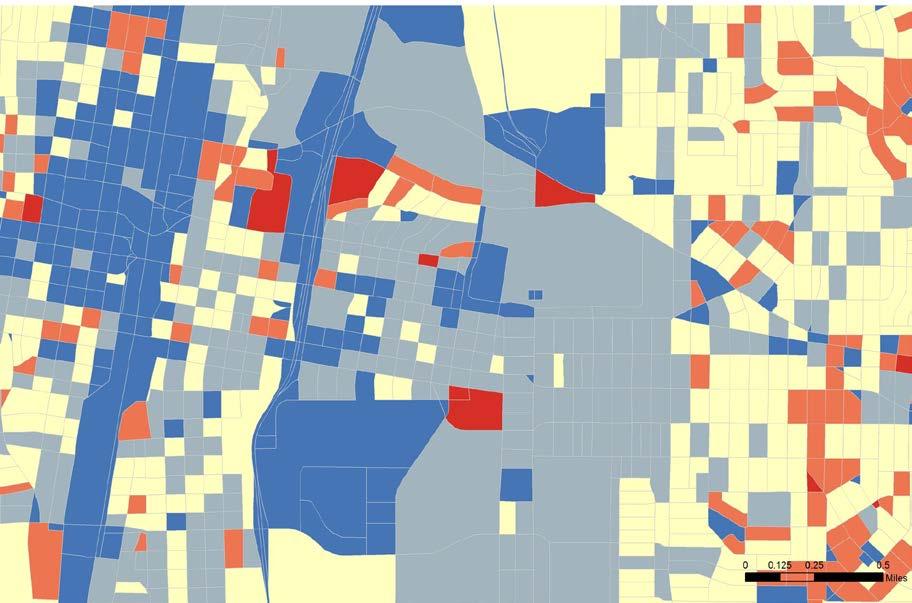

SOCIO-ECONOMIC - Median Age of Population
The Central Corridor Neighborhood Study by UNM


Source: NMCDC.com

Location


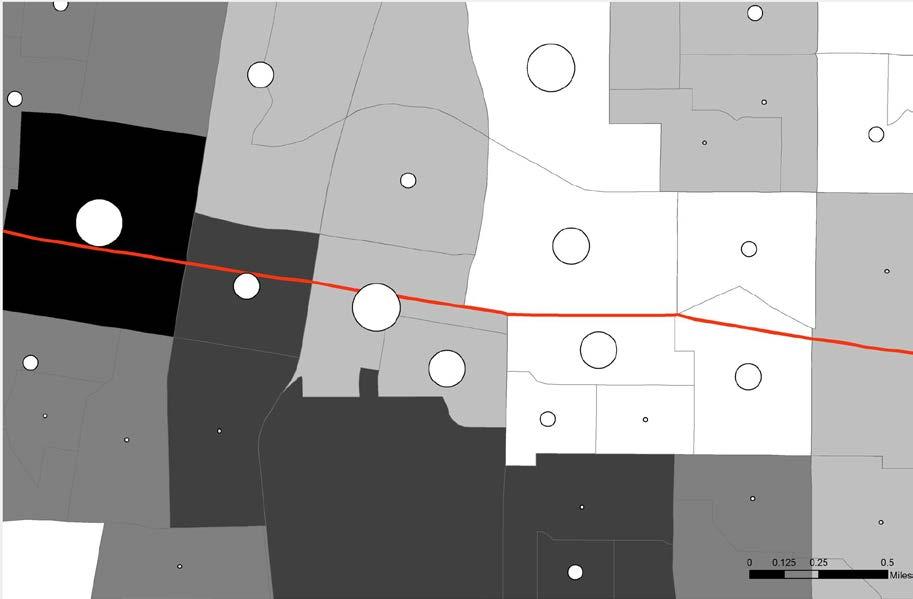


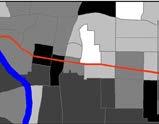
SOCIO-ECONOMIC - Employment and Poverty levels
The Central Corridor Neighborhood Study by UNM


Source: Accessed: FEB:2017
ART Route Community Boundary
1/2 Mile Radius
Proposed ART Stops
EMPLOYMENT DENSITY
Jobs per Acre
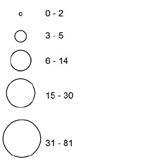
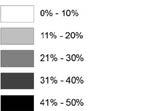
% FAMILIES UNDER 100% FEDERAL POVERTY LEVEL


Location Map

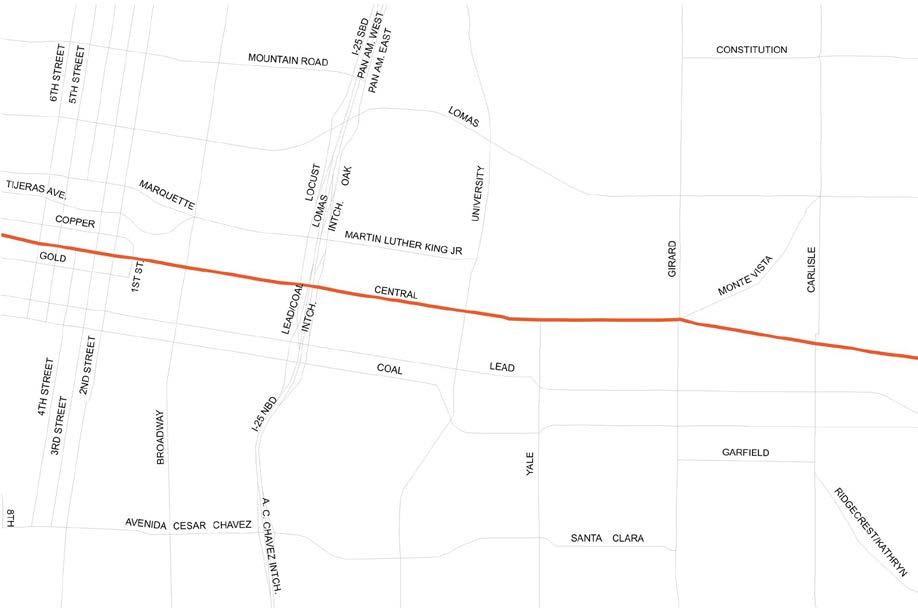
TRANSPORT - Roads


The Central Corridor Neighborhood Study by UNM


Source: AGIS Accessed: FEB:2017
ART Route
Community Boundary 1/2 Mile Radius
Proposed ART Stops


Location Map


TRANSPORT - Local Bus Routes and Rail
The Central Corridor Neighborhood Study by UNM


Source: AGIS
Accessed: FEB:2017
ART Route Community Boundary 1/2 Mile Radius
Proposed ART Stops
BUS
Location Map


TRANSPORT - Bike Routes
The Central Corridor Neighborhood Study by UNM


Source: Accessed: FEB:2017
ART Route Community Boundary 1/2 Mile Radius
Proposed ART Stops


Location Map


The Central Corridor Neighborhood Study by UNM


Source: AGIS Accessed: FEB:2017
ART Route Community Boundary 1/2 Mile Radius
Proposed ART Stops
% RENTER OCCUPIED
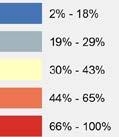

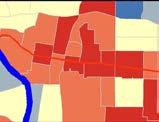
Location Map

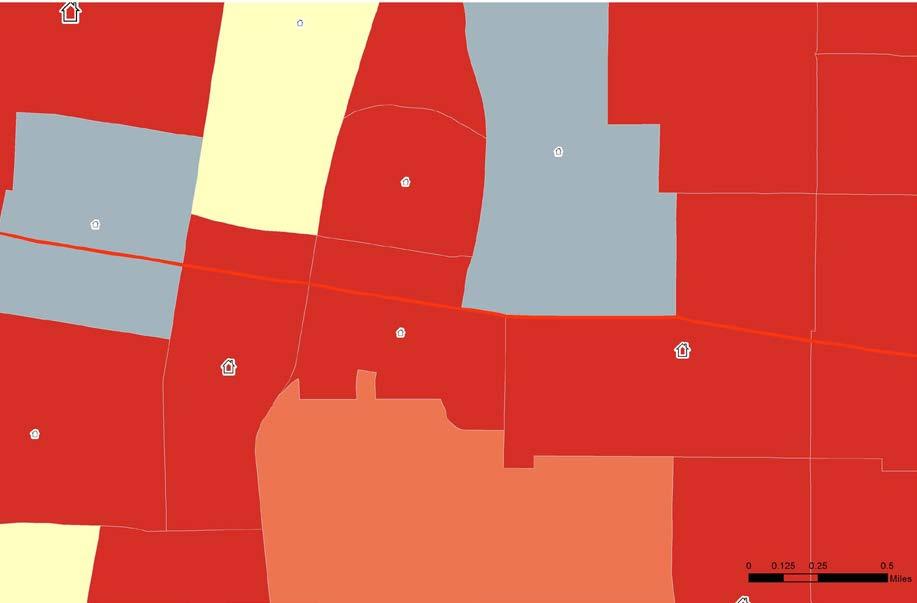

The Central Corridor Neighborhood Study by UNM


Source: Accessed: FEB:2017
ART Route Community Boundary 1/2 Mile Radius
Proposed ART Stops
AGE OF HOUSING
Total Units built prior to 1970

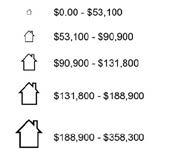

Location Map Legend


Commu nity Map: UNIVERS ITY
Commu nity Map: UNIVERS ITY
Community Map: UNIVERSITY
Commu nity Map: UNIVERS ITY
PRESBY
PRESBYT EAR INST ORAL SC
PRESBYT

EDUCATION: Lan d U se Typ e
LOWELL CHILD DEVELOPMENT CENT ER
LOWELL CHILD DEVELOPMENT CENT
LOWELL CHILD DEVELOPMENT
CENT ER
EDUCATION: Lan d U se Typ e
EDUCATION - Land Use
EDUCATION: Lan d U se Typ e
The Central Co rrido r Neighb orh ood Stu dy by UNM
The Central Co rrido r Neighb orh ood Stu dy by UNM
The Central Co rrido r Neighb orh ood Stu dy by UNM
The Central Corridor Neighborhood Study by UNM

Legend
ART Route Community Boundary
Legend
1/2 Mile Radius
Legend ! A R T proposed bus stop
> Exis ting bus st op
Proposed ART Stops
Legend ! A R T proposed bus stop > Exis ting bus st op . 1/2 Mile Radi us " Communi ty Boundary
. 1/2 Mile Radi us " Communi ty Boundary
Mul ti Family R esidential
Mul ti Family R esidential
Singl e Famil y Resi dential
Singl e Famil y Resi dential
K-12 Schools
K-12 Schools
Colleges/Universities
Colleges/Universities
PreK/Daycare
EN = Enrollment
EN = Enrollment
ED = Economically Disadvantaged
DA = Disabled
ED = Economically Disadvantaged DA = Disabled
Location Map
Location Map
Location Map
Location Map
PreK/Daycare L - 4 .1

L - 4 .1
Community Map: UNIVERSITY


EDUCATION - Preschool Facilities and Vunerable Children
The Central Corridor Neighborhood Study by UNM


Source: Accessed: FEB:2017
ART Route
Community Boundary 1/2 Mile Radius
Proposed ART Stops
PERCENT FAMILIES UNDER 100% FEDERAL POVERTY LEVELS
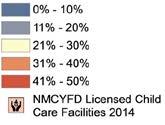

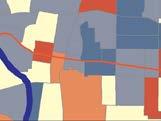
Location Map


Source:
Legend
Legend
Legend
! A R T proposed bus stop
ART Route Community Boundary
! A R T proposed bus stop
Legend ! ( A R T proposed bus stop
> Exis ting bus st op
1/2 Mile Radius
> Exis ting bus st op
. 1/2 Mile Radi us
. 1/2 Mile Radi us
> Exis ting bus st op . 1/2 Mile Radi us
Proposed ART Stops
" Communi ty Boundary
" Communi ty Boundary
" Communi ty Boundary
" Unincorporated Areas
" Unincorporated Areas
" Unincorporated Areas
Mul ti Family R esidential
Mul ti Family R esidential
Mul ti Family R esidential
Singl e Famil y Resi dential
Singl e Famil y Resi dential
Singl e Famil y Resi dential
Parks
Parks
Parks
Vacant Properties
Vacant Properties
Vacant Properties
Location Map
Location Map
Location Map
Location Map

- 5 .1
.1
Community Map: UNIVERSITY


PUBLIC REALM - Community / Publicly Accessible Spaces
The Central Corridor Neighborhood Study by UNM


Source: Accessed: FEB:2017
ART Route Community Boundary 1/2 Mile Radius
Proposed ART Stops
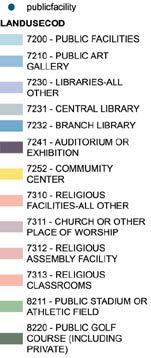
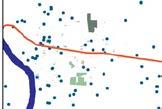

Location Map

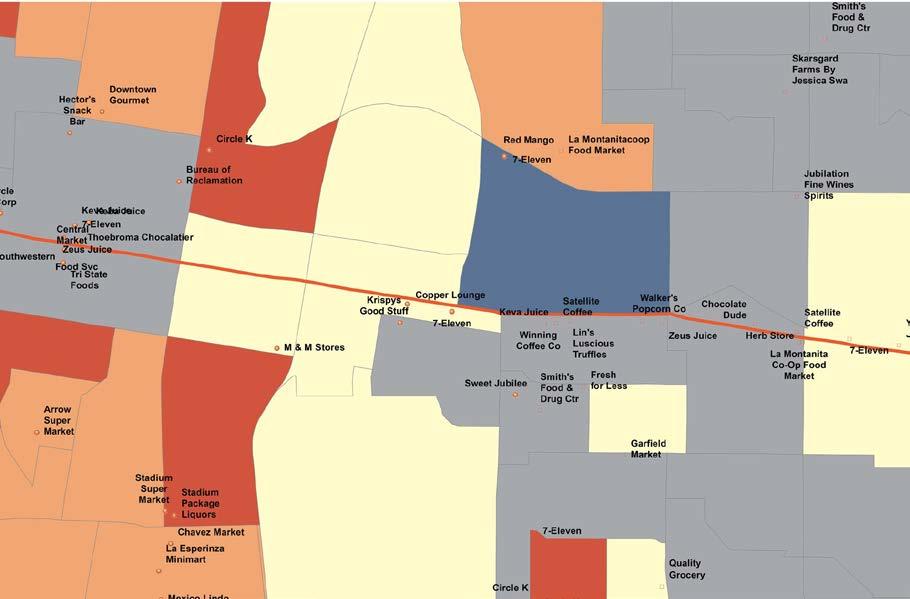
The Central Corridor Neighborhood Study by UNM Community Map: UNIVERSITY


Source: Accessed: FEB:2017

ART Route Community Boundary 1/2 Mile Radius
Proposed ART Stops
ESTIMATED OBESITYMEAN Food Stores


Location Map

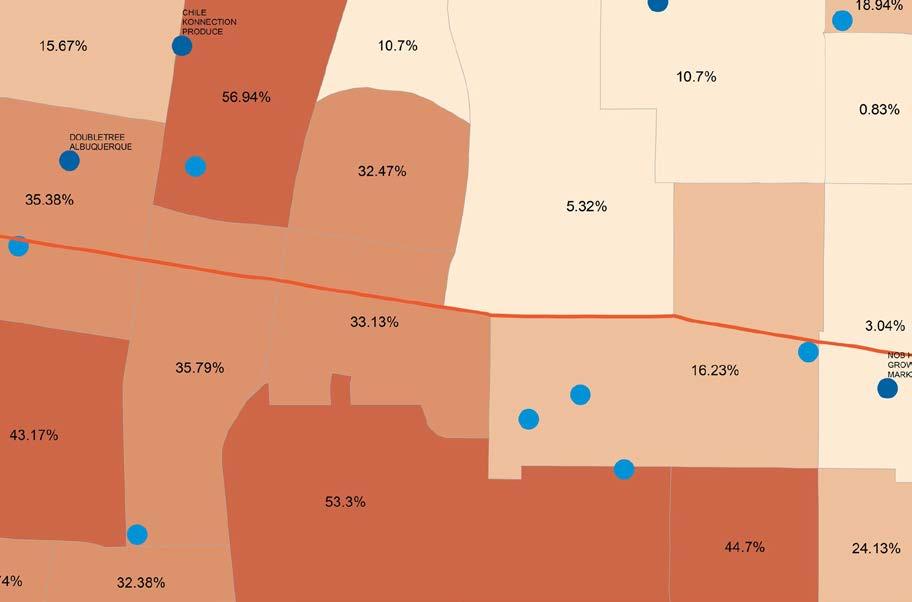

The Central Corridor Neighborhood Study by UNM


ART Route
Community Boundary 1/2 Mile Radius
Proposed ART Stops
Source: Accessed: FEB:2017 FRESH FOOD SUPPLIERS
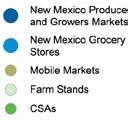

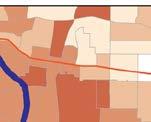

Location Map


FOOD ACCESS - Assisted Access to Food
The Central Corridor Neighborhood Study by UNM


Source: Accessed: FEB:2017
ART Route Community Boundary 1/2 Mile Radius
Proposed ART Stops
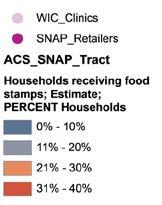
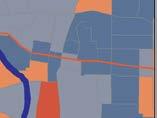
Location Map Legend


The Central Corridor Neighborhood Study by UNM


Source: Accessed: FEB:2017
ART Route Community Boundary 1/2 Mile Radius
Proposed ART Stops


Location Map

The Central Corridor Neighborhood Study by UNM Community

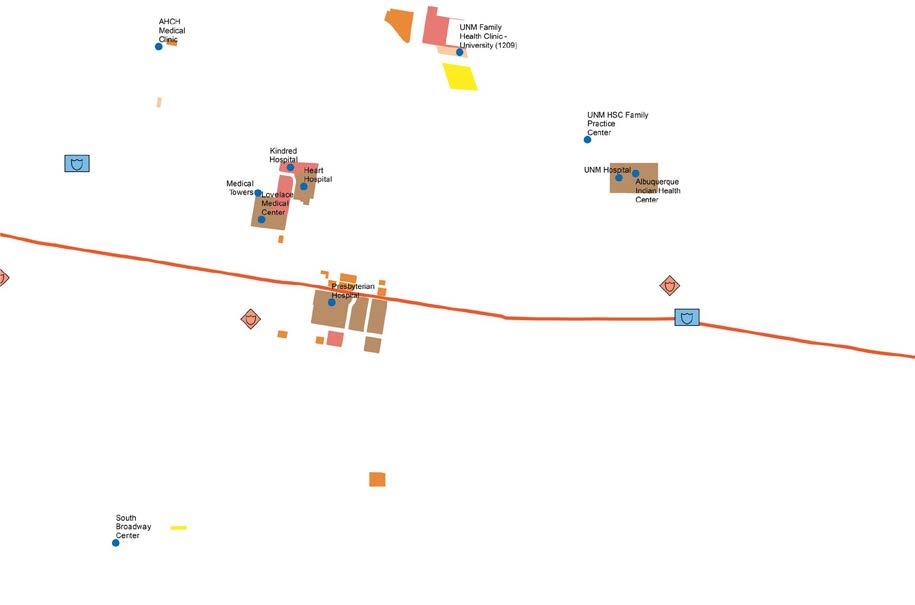
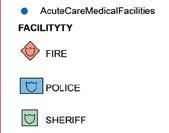
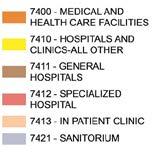
GENERAL - Health Facilities and Protective Services


Source: AGIS.org
Accessed: FEB:2017
1/2 Mile Radius Community Boundary ART Route
Proposed ART Stops


Location Map
