U . S . F orecast
GDP OUTLOOK 3.0% Annual Real GDP Growth is Coming, but Probably Not in 2017 2016 went out not with a bang but a whimper. Real GDP growth in the final quarter of the year came in at a tepid 1.9% as of the advance estimate of GDP (the first of three estimates of GDP). That puts the full-year real GDP growth at an anemic 1.6% for 2016, matching the weakest annual GDP growth of this historically weak recovery. The contentious and historical presidential campaign occupied most of the last year, and the uncertainty surrounding this election was higher than is usually the case. This certainly weighed on economic growth, with investment spending hit particularly hard. We have substituted the current wild ride for election uncertainty, but like the election, this too will come to an end.
The average rate of annual real GDP growth from 2010 through 2016 has been just 2.1%. Our forecast for average real GDP growth from 2017-2020 is significantly higher
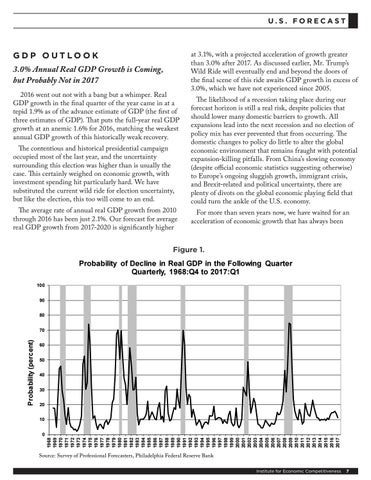
at 3.1%, with a projected acceleration of growth greater than 3.0% after 2017. As discussed earlier, Mr. Trump’s Wild Ride will eventually end and beyond the doors of the final scene of this ride awaits GDP growth in excess of 3.0%, which we have not experienced since 2005. The likelihood of a recession taking place during our forecast horizon is still a real risk, despite policies that should lower many domestic barriers to growth. All expansions lead into the next recession and no election of policy mix has ever prevented that from occurring. The domestic changes to policy do little to alter the global economic environment that remains fraught with potential expansion-killing pitfalls. From China’s slowing economy (despite official economic statistics suggesting otherwise) to Europe’s ongoing sluggish growth, immigrant crisis, and Brexit-related and political uncertainty, there are plenty of divots on the global economic playing field that could turn the ankle of the U.S. economy. For more than seven years now, we have waited for an acceleration of economic growth that has always been
Figure 1. The Anxious Index Probability of Decline in Real GDP in the Following Quarter Quarterly, 1968:Q4 to 2017:Q1 100 90 80
60 50 40 30 20 10 0
1968 1969 1970 1971 1972 1973 1974 1975 1976 1977 1978 1979 1980 1981 1982 1983 1984 1985 1986 1987 1988 1989 1990 1991 1992 1993 1994 1995 1996 1997 1998 1999 2000 2001 2002 2003 2004 2005 2006 2007 2008 2009 2010 2011 2012 2013 2014 2015 2016 2017
Probability (percent)
70
Survey Source: Survey of Professional Forecasters, Philadelphia Federal ReserveDate Bank Institute for Economic Competitiveness
7