22 minute read
17 Backfill grout and freezing tests

from Tunnelling in the Follo Line Project - NFF Norwegian Tunnelling Society publication no 29
by TunnelTalk
Johannes Gollegger, Bane NOR
Introduction
Advertisement
The TBM sections of the Follo Line tunnels have a single water barrier consisting of segmental lining with gaskets. For the ring gap filling has the contract defined the following principle requirements:
Contractor shall develop a grout mix for backfilling the ring annulus. The mix characteristics shall be suited to the selected construction method, proposed plant, and advance rates. Consideration shall also be given to geological conditions and in particular ground water ingress. Pea gravel is not acceptable. The grout shall remain effective for the design life of the tunnel and shall not degrade, shrink, or lose strength to an extent that the tunnel structure and performance would be compromised. The grout shall be sufficiently fluid to ensure that it flows into all parts of the void.
Backfill grout
Acciona Ghella Joint Venture (AGJV) choose to use a bi-component grout pumped from the surface. The injection process is described in detail in section 11a, while in this section the focus is on the technical specifications and the specific behaviour.
The bi-component grout is characterized by being composed of a stabilised pumped cement-based grout A-component and by a B-component which acts as an accelerator. Separated one from each another, the two components are practically inert, and the hardening only starts when the two components are mixed. During the injection process the two components do not mix until they reach the end of the injection line (injection nozzle), hence right before reaching the annular gap. Additionally, opposite to the traditional grout which needs 4 to 8 hours for hardening and obtaining a certain degree of strength, the bi-component grout develops a typical gel structure in a few seconds which guarantee a degree of bearing capacity at an early age which allows the quality ring behaviour and filling between the segments and the rock mass.
The A-component is a grout suspension composed of water, bentonite, cement, and a stabilizer. The purposes of each element are:
• Bentonite: Increases the shear strength and the ability to absorb water from the suspension which grants a thixotropic behaviour. In this way the suspension is less viscous and flows better. • Cement: Acts as the binding agent and controls the hardening time. The water/cement ratio is decisive for the final properties of the grout regarding the strength. • Water: Allows the hydration of the cement. Its amount controls also the fluidity of the mix. • Stabilizer/retarder: Decelerates the hydration of the cement and avoids the A-component reacting during the injection process. Its function gets disrupted when mixed with the B-component (accelerator).
These components are natural and due to the variability of their nature, the characteristics of the suspension can vary too. Consequently, the dosages should be dimensioned and tested for the different products in the particular conditions of each project.
The B-component is a sodium silicate. The percentage of the component B determines the gelling time and the early strength of the gel. The component B is an accelerator which counteracts the effect of the stabilizer in the A-component and allows the hydration of the cement.
The material parameters were defined as:
UCS E
g j
c
y n
Age
[MN/m²] [MN/m²] [kN/m³] [°] [kN/m²] [°] [-]
2 h 0.2 20 12.6 30° 58 10° 0.35 24 h 0.7 100 12.6 30° 58 10° 0.35
Table 17-1: Material parameters for backfill grout.
After an intense testing with the specific product used for the Follo Line, including injection trails, the following mixes were proposed:
Table 17-2: Proposed backfill grout mixes.
The advantages of bi-component grout over conventional grout mixes are summarised next:
• Bicomponent grout provides fast bedding to the ring which is coming out of the tailskin shield. In this way the risk of deformation and undesired steps in the segmental lining is reduced. • The appropriate adjustment of the grout mix components allows a good control of the gel time and strength development in early and later stages. • The previous point is especially relevant when working in unpressurized shield drives such as with double shield technology. When no front counter pressure is available, there is a high risk of the backfilling grout to flow forward towards the shield, increasing the risk of the shield to get trapped in the ground. • Due to the fast hardening of the grout around the latest installed rings, the deformations and rotations of the ring, caused by the thrust jacks and the rotation of the cutting wheel, are reduced. • The two components are inert when separated from one another, the risk of clogging in the lines is drastically reduced. The breakdown times for cleaning the grout lines are minimised which improves the overall TBM performance. • The fast strength development of the bicomponent grout reduces the risk of the grout being washed out because of groundwater flows which can occur in the annular gap. • The low viscosity of the two components allows to pump them from the tunnel portal to the
TBM without the need for grout transportation by vehicles, which results in reduced logistics requirements in the tunnel. • The equipment on-site is considerably smaller than with conventional grout where a mixing plant is required. The disadvantages of the bi-component grout are:
• Compared to pea gravel higher risk for wash out. • Cumbersome cleaning process of the water contaminated with bi-component grout. • The specific materials used for the Follo Line resulted in a relatively high pH-value of the contaminated water, causing risk for health of humans and material durability. • Build-up of calcite formations of water entering the tunnel system.
Frost behavior of the bi-component grout
Over various years, client and contractor discussed potential consequences of frost in combination with water leakages in the tunnel.
Since the backfill grout consists during installation of approx. 80% water, the risk of potential expansion during freezing, and as such build-up of intolerable pressure to the segmental lining was identified. The second concern was related to the structural integrity of the backfill grout. Therefore, extensive testing in small scale, but also in bigger scale were performed.
Small scale freezing test
Mapei, the supplier of the backfill grout, did small scale testing, which were verified with the exact same products and mix design at SINTEF in Norway.
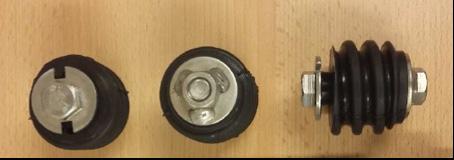
Five steel molds with backfill grout samples were received 2019-09-19. One mold was equipped with cast-in thermocouple. The molds were filled with grout and sealed by Mapei at their abortorium at Sagstua (Norway) 2019- 07-30. The cylindric grout sample was 40 mm in diameter with height 40 mm. A photo of a sealed mold is shown in Figure 17-1.
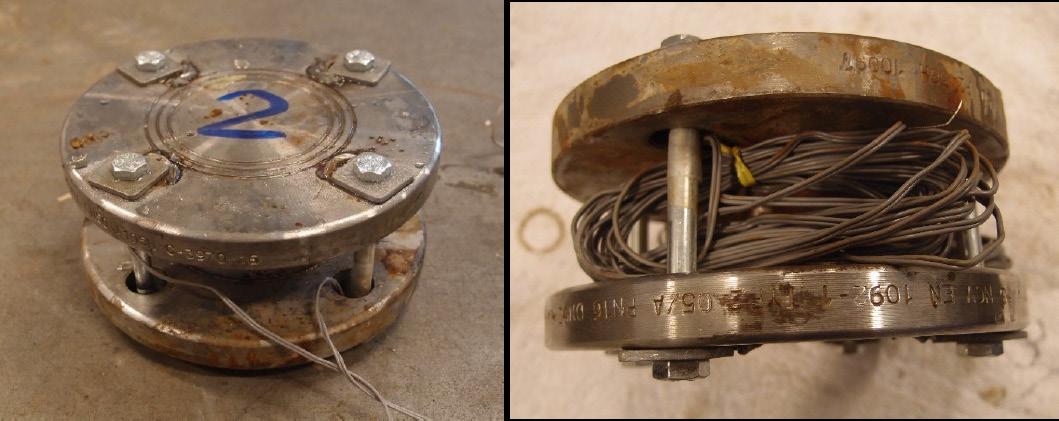
Figure 17-1: Steel mold with 15 mm top and bottom lid attached by 4 bolts.
The original Ø15 mm steel bolts were replaced by Ø8 mm (quality 8.8) steel bolts. Two bolts were equipped with surface strain gauges. One of the molds had cast-in thermocouple for monitoring of the grout temperature. The temperature was recorded for 3 cycles. The air and grout temperature are shown in Figure 17-2.

Figure 17-2: Recorded temperature in air (blue) and grout (green).


Figure 17-3: Left: Sample no 1 after 4 cycles, right sample with cast-in thermocouple after 24 cycles.
Figure 17-4: Left: Grout cylinder from sample no 4 after 24 cycles (left), right sample no 1 after freeze/thaw exposure (4 cycles) followed by 2 days of water storage.
The temperature cycle was set to 3 hours of freezing and 3 hours of thawing (6 hours cycle). As shown in Figure 17-2, the grout temperature was recorded to be -10⁰C and +10⁰C for 1.5-2 hours for each cycle. The grout temperature shows a strange peak during freezing at ÷6 - ÷7⁰C and an even stranger peak during thawing at ÷4 - ÷2⁰C. The first peak can be caused by freezing of water below zero temperature under pressure (i.e ice formation), but the last peak must be caused by a measuring error (recorded temperature ⁓300⁰C, typically for short circuit for thermocouples).
When opening the molds after freezing and thawing, the grout appeared to be intact. Marks could easily be made with fingernails as shown in Figure 17-3, left. The grout cylinders were squeezed out of the mold and observed visually. The grout was very weak and could easily be crumbled by the fingers as shown in Figure 17-4. The grout was significantly weaker than reference grout (cubes and drilled cylinders stored in water at SINTEF). The grout strength was not measured after freeze/thaw testing.
Two grout cylinders were placed in water after demolding. After two days in water, the cylinders more or less fell apart, and the grout structure seemed to be damaged by the freezing.


Surface strain gauges were glued on two bolts for each of the molds labelled 1, 2 and 3. Recorded strain for molds No 1 and No 3 are given in Figure 17-5 (freeze/thaw cycle 2-4). As can be seen from the figure, the recorded strain shows that the bolt was: • contracting during the first half hour of the freezing period (until the grout reaches ⁓ ÷3⁰C) • elongating from 0.5 until 1 hour • stable from 1 until 3 hours
The bolt length returned rapidly to the original position when the grout was thawed.

Figure 17-5: Recorded strain by surface gauges on two bolts for Mold No 1.
For calculation of the load (F) and stress (σ), from the grout on the steel lid, we have used
• average recorded strain difference for two bolts, ΔƐ, in ‰ • effective bolt area 36.6 mm2 x 4 for 4 bolts, Ab = 146.4 mm2 • Steel E-modulus, E = 210 000 N/mm2 • grout sample cross section, AG = 1256 mm2 • Load, F = (ΔƐ ∙ E/1000) ∙ Ab • Stress, σ = F/AG
The bolt elongation during freezing is slightly decreasing from cycle 2 till cycle 4. Calculated values for mold No 1 and No 3 are shown in Table 17-3.
Cycle No 2
ΔƐ, Load, Stress,
3
ΔƐ, Load, Stress,
4
ΔƐ, Load, Stress,
‰ kN MPa ‰ kN MPa ‰ kN MPa Mold No 1 414 12.7 10 404 12.4 10 382 11.7 9 Mold No 3 581 17.9 14 534 16.4 13 476 14.6 12
Table 17-3: Induced force and stress when the grout is freezing.
SINTEF received 2019-03-06 four Ø64 mm drilled cores labelled “CP 54 IB” and seven Ø64 mm drilled cores labelled “CP 54 CB”. These cores have been stored in water at SINTEF from arrival. From four of these cores, one 25/25/150 mm prism was prepared by sawing. Photo of the prisms is shown in Figure 17-6.
The prism initial length was measured by a ruler. The prisms were thereafter wrapped in thin plastic sheets to avoid moisture loss before exposure for 24 hours at -10⁰C. The prism length was then measured again in frozen state. The results are given in Table 17-4 below.
No cracking or other damages could be observed after the freezing exposure.
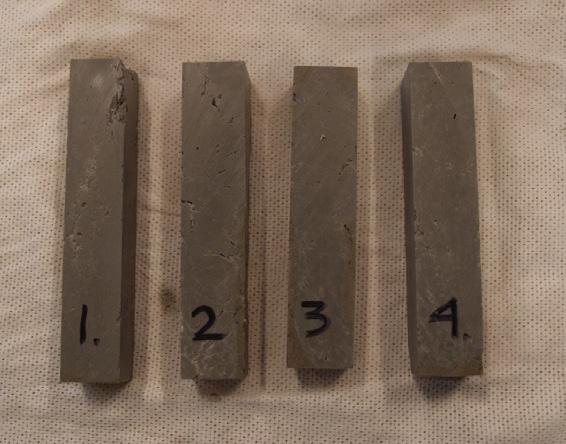
Figure 17-6: Prism for expansion measurements.
Prism No
1
Expansion, mm/m 3.1
Table 17-4: Prism length expansion during freezing. 2
3.3
Conclusions from small scale testing
Grout prisms prepared from drilled cores from the tunnel have been tested for expansion during freezing. The expansion was measured to 0.3 %, which is very low. A material consisting of 80 vol% water should expand more. It might be that the low expansion measured is somehow related to the bentonite content as water contained in very small pores may freeze at lower temperatures, but this phenomenon cannot be explained without further investigation.
The freeze/thaw experiments in steel molds show that, even if the expansion is low, the grout generated a considerable pressure on the steel lids during freezing. Surface gauges attached to the steel bolts connecting the upper and lower lids, showed a load corresponding to 10-14 MPa pressure from the grout on the lids.
The grout was inspected after 1, 4, 12 and 24 freeze/ thaw cycles, respectively. When opening the molds, the grout seemed to be intact, but when the grout was pressed out from the steel cylinders it could be observed that the grout very easily could be crushed by the fingers. It was not attempted to measure the strength.
This means that when the grout is frozen in a complete confined state, the freezing generates a considerable internal pressure and a structural degradation of the grout. 3
3.4 4 Average
2.6 3.1
Big scale freezing test
Despite the fact that two different parties did similar tests and achieved the same results, remained still the question why the grout does not expand more, when it should theoretically expand 6-7% due to the water content. Therefore, did Bane NOR decide to run a big scale test at the frost laboratory at SINTEF. Two different setups were done, model A represented a completely filled ring gap, while model B was partly filled with backfill grout and water.
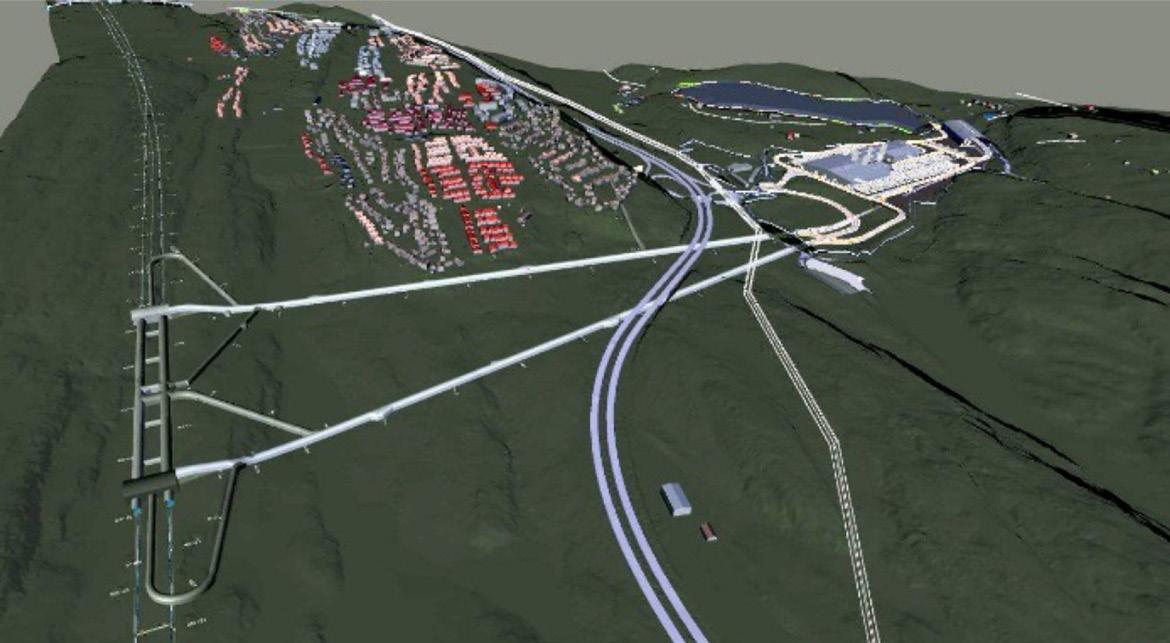
The SINTEF frost laboratory was constructed in 2009 and comprises of two rooms divided by a granite wall, placed in a confined and insulated space to avoid disturbance from the surroundings, as illustrated in Figure 17-7. The total floor area is 3.2 x 2.4 x 7.9 meters with insulated floor, walls, and roof, where the granite wall is 1.5 meters thick. The granite wall comprises of 12 granite blocks and each block measures 0.8 x 0.8 x 1.5 meters. One room represents the rock side, while the other room represents the tunnel side. Each room has an independent cooling unit and a control system for individual adjustment of the temperature in each of the two rooms. The purpose of the rock side room is maintaining a temperature representing the temperature in the rock mass, which often is 4-8°C in Norway. The temperature can be regulated as needed. The room also has the important function of supplying water to the rock mass through predrilled holes in the rock wall as well as being the technical room, hosting computers that collect the measurement data.

Figure 17-7: 3D model of the freezing laboratory. Figure 17-8: 3D model showing placement of temperature gauges in the granite wall in red.
Inside the granite wall, temperature gauges are installed, as illustrated in Figure 17-8. The temperature gauges are installed in slots at the interface between rock blocks and are distributed at seven depths in the rock, with closer spacing towards the tunnel side. Each slot is equally configured with temperature gauges, except for the upper four rock blocks, resulting in 56 points of measurement. In the four topmost blocks there are only 4 points of measurement. The total number of points for temperature measurements in the rock wall is 60. For the present laboratory setup, the data from two sets with measurements in 7 depths was utilized (14 points of measurements). The points of temperature measurement are located in the rock right behind the laboratory model that is custom-built for this experiment.
The granite wall has a number of horizontal penetrating holes with 20 mm diameter that can transport water from the rock side to the tunnel side, simulating water bearing fractures. One of the important elements in this full-scale laboratory experiment was the possibility of presence of water. The model was made watertight by sealing all joints in the model with Tec7. The granite wall beyond the laboratory model has 11 horizontal penetrating holes that can transport water into the model.
The room is equipped with a cooling unit, that can generate up to -20°C and +10°C. As the thermal conductivity in the rock mass is relatively low, it is important to introduce the wanted baseline rock mass temperature in both the rock side and the tunnel side at an early stage, letting the temperature in the granite wall stabilize at the wanted rock temperature. At experimental start-up, the temperature at the tunnel side was lowered to the designated experiment temperature.
In this experiment, the temperature was set to 8°C in both the rock side and the tunnel side on January 16th, 2020.
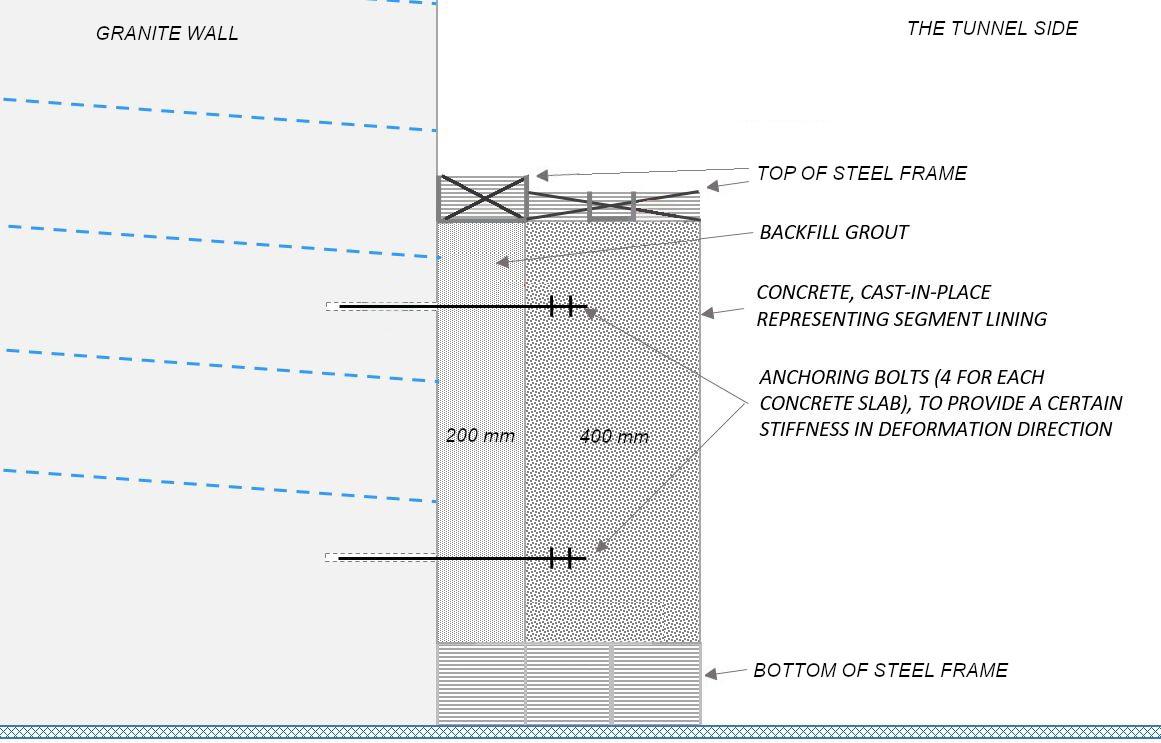
Figure 17-9: Principle drawing of the experimental setup for freezing of backfill grout.
The target temperatures for the freezing exposure during the test were defined as follows:
• Temperature at the concrete surface: -15 oC • Temperature at interface between concrete and backfill grout: -10 oC
The intention of this freezing testing was to reproduce the freezing exposure in the lining structure as close as possible to the stated design freezing parameters.
Figure 17-10 presents the temperatures in the rock room, tunnel room, and at the concrete surface during the freezing cycle. The room temperatures were measured in cans with approximately 1 liter of water on the rock side and 0.7 liter of antifreeze solution.

Figure 17-10: Temperatures in the rock room, tunnel room and concrete surface during the freezing cycle.
With the given dimensions of the rock mass in the model (1,5 m thickness) and total thickness of the lining structure, one would need to apply a temperature of 2 degrees for more than 3 months as well as assuring that no sources of heat loss were present.
A thermal load of -15 oC at the lining surface and +2 oC on the rock mass side at 1,5 m depth in the rock mass was applied. Under ideal conditions with no sources of “false” heat flow, such as leaking water through the model or insufficient or damaged insulation, the desired thermal profile could be achieved in approximately 25 days. This is based on the precondition that the entire model had a homogenous temperature of +2 oC at the start freezing cycle with -15 oC on the lining surface.
Thermal profiles measured at intervals are shown in the cross section of the freezing model in Figure 17-11. There was a period of four days (July 31st to August 3rd), during which the freezing generator broke down and needed to be maintained. This delayed the freezing process, but it did not cause any detrimental effects to the physical experiment, as the room temperature never became higher than 0 oC.
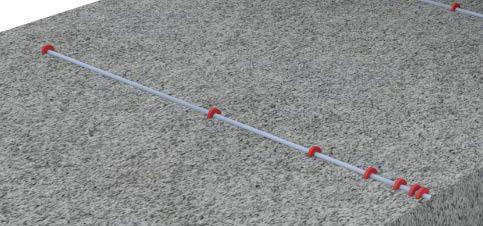
The displacement of the lining, caused by freezing, was measured as the movement of the concrete lining in the direction perpendicular to the rock mass surface during the freezing of the model. Cord extensometers at 8 different positions on the concrete lining surface were used for this purpose.
The results are shown in Figure 17-12. The period of freezing from 19.07.2020 to 03.09.2020 is clearly shown. When freezing was terminated, the measured displacements ranged from 3 to 5 mm. For completeness, the diagram includes a few days before the commencement of freezing as well as a few days of the thawing.

Figure 17-11: Measured temperatures in the rock mass and section A of the lining model, including the thawing period.
Figure 17-12: Measured displacements of the concrete lining during the period of the freezing of the model.

After the termination of the freezing cycle and the model had defrosted and sampling of backfill grout was performed, applying different drilling techniques. Some examples are shown in Figure 17-13. Throughout this sampling period, it was ensured that the model was kept wet by maintaining the initial water supply.
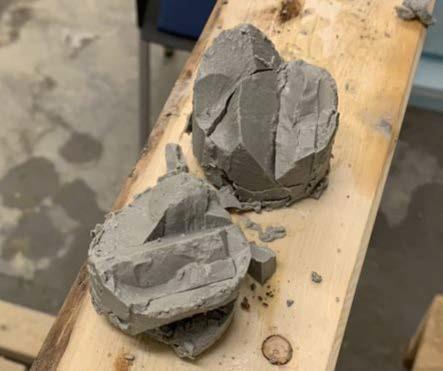

Figure 17-13: Left: Core sample of backfill grout, taken from the top of model B. Right: Core sample of backfill grout, drilled perpendicular through the concrete of model B.
After the samples had been collected from the two models, they were evaluated and specimens for compression strength were made for the samples. Due to cracking and degradation, it was not possible to extract specimens for compression strength and density for all the samples. In general, it was observed that the quality of the cores from model B was much poorer than for model A. Table 17-5 present a subjective description of the core qualities and Table 17-6 shows compressive strength and density measurements.
Coring method Comments
1 Not possible to extract large pieces from model A or B. The grout itself was intact but the cores broke easily in planes in all directions.
2 & 3
4 All cores where fractured. It was possible to extract specimen for compressive strength for 6 out of 10 cores in model A, but only for 1 out of 10 cores from model B.
The cores were partly disintegrated with internal fractures. In some parts the grout had decomposed (claylike). In general cores from model A were better than cores from model B.
All cores where fractured. In general cores from model A were less fractured than cores from model B.
It was possible to extract specimen for compressive strength for 3 out of 3 cores in model A, but only for 1 out of 3 cores from model B.
Table 17-5: Qualitative description of cores.
Model
Sample Diameter, mm Height, mm Density kg/
m3
Compressive strength, MPa
A
B
A1 A2 A5 A8 A9 A5B A1K A2K A3K B4 B1K 72 61 72 61 61 74 44 54 63 53 60 85 60 53 46
Single res. 1270 1250 1250 1270 1270 1300 1240 1280 1230 1220 1290 Average 1260 1270 Measured 2,8 2,7 2,6 2,3 2,9 2,3 2,8 3,2 1,7 2,1 2,2 Converted* 2,6 2,7 2,0 2,0 2,8 2,0 2,8 3,5 1,7 1,8 1,9 Average. 2,5 1,9
Table 17-6: Results from compressive strength and density testing.
Examination of grout cores, drilled after the freezing cycle, showed considerable grout degradation for parts of all cores. Other parts of some cores were intact, and for these cores test specimen for determination of compressive strength could be prepared. The compressive strength achieved was about 2.5 MPa for section A and 2 MPa for section B (cube strength after approximately 190 days). These are good results compared to testing of test prisms cast during the cast of the model (cube strength 3 MPa after 100 days of water curing). The remaining parts of the cores were dissolved into small parts, and some parts were even dissolved to a claylike consistency. The cores taken from section B were considerably more dissolved than the cores from section A.
Summary from big scale testing
The laboratory setup aimed at reproducing the water and freezing exposure to the backfill grout of the segmental lining in the Follo Line Tunnel. The goals were to identify possible detrimental effects regarding degradation of the backfilling material and measure potential displacements deformations caused by the freezing induced expansion of the grout.
One freezing cycle was carried out which could achieve an exposure close to the design requirements for the Follobanen project. At the interface between concrete and backfilling, a temperature of approximately -8 oC during the test was achieved. The design specification calls for a minimum temperature of -10 oC at this location. The exposure of the model was carried out with the specified design load of -15 oC applied to the segmental lining surface.
Displacement of the concrete lining in the model was monitored during the freezing. Freezing induced expansion in the range of 3 to 5 mm of the 200mm thick backfilling in axial direction of the model was measured. A theoretical maximum displacement under complete freezing of all water in perfect confinement can theoretically be calculated to be 15 mm.
The test shows less freezing induced deformations than the theoretical maximum. Clear signs of degradation of the backfill grout were found, even after only one freeze-thaw cycle. One must also bear in mind that the test does not account for the effects of significant inhomogeneities such as voids and channels. Based on the test results, freezing exposure with several repeated cycles over many years, is likely to gradually lead to a degradation of the backfilling.
Summary of performed backfill grout testing
The big scale freezing test has, like the small-scale freezing tests, verified that the expansion of the backfill grout during freezing is considerably lower compared to the theoretical expected once due to the water content.
For the calculation of the theoretically maximum displacement the following conditions were assumed:
• Maximum volumetric expansion of water during freezing: 9% • Porosity of the backfill grout: 83% • Degree of water saturation: 100% • Expansion possibility in vertical direction: None (or very little due to the confinement) • Direction of freezing expansion: entirely in axial direction of the model
With a thickness of the backfilling of 200 mm, one can therefore assess the theoretical maximum deformation in axial direction of the concrete lining D as follows:
D = 200mm * 0,83*0,09 = 14,9 mm
Hence, the measured displacements (between 3 and 5 mm) correspond to a range of 20 to 33 % of the theoretically maximum possible displacement in this model.
According to the project team’sevaluation, would the theoretical expected expansion of approx. 15mm imply a high risk of damages to the segmental lining, while the measured expansion can be taken by the segment ring without causing damages.
The registered degradation confirmed Bane NOR’s concern regarding the structural integrity because it increases the risk for potential washouts resulting in voids behind the lining. These voids increase the amount of water behind the lining, which not only represents a risk for leakages, but also would this water expand during freezing and could as such apply intolerable load to the segmental lining.
Therefore, has contact grouting been applied in areas for risk of freezing, in order to reduce potential leakage points, filling potential void and last but not least limit running water, which could washout degraded back fill grout.
References
Skjølsvold, Ola. Freeze-thaw testing of bicomponent backfill grout. Test report 2019. SINTEF Community
Strømvik, H. & Holter, K.G. & Skjølsvold, O. Freezing of backfill grout, laboratory setup and execution. Test report 2021. SINTEF Community