20 minute read
14 Geological mapping and follow-up during the TBM excavation

from Tunnelling in the Follo Line Project - NFF Norwegian Tunnelling Society publication no 29
by TunnelTalk

Anne Kathrine Kalager, Bane NOR Guro Isachsen, Bane NOR Bjørnar Gammelsæter, Bane NOR Agnethe Hoff Finnøy, Bane NOR
Geological mapping
Advertisement
As an important supplement to the geological mapping, that had been performed before the start-up of the TBM excavation, systematic geological mapping was daily executed in parallel with the maintenancestop during the entire excavation period, in order to document the real geological conditions along the tunnel section.
The challenge related to geological mapping in a double shield TBM-project is the restricted access to the tunnel face and the rock mass. Behind the shield, the segmental lining is installed, making the bedrock inaccessible for mapping behind the machine. The only area the rock face is available, is in front of the TBM, through the cutter head via the Ø60cm manholes. This makes geological mapping only possible when the machine comes to a standstill and depending on how far the cutterhead is retracted, the view can be very limited. Performing strike and dip measurements at the tunnel face is challenging as a normal geological compass is useless on a TBM due to the magnetism. In the Follo Line project, there was a need for alternative sources of information that could give additional information and create a more complete and detailed impression.
Figure 14-1: Example of access to rock face for geological mapping.
The NTNU-model used as a compensation model
The geological parameters mapped were determining the contractors right to compensation according to the NTNU model.
The NTNU hard rock tunnel boring model was part of the contract and the intention was to use it as a compensation model for the EPC TBM. The model covers the complete tunnel boring process; from the early planning stage, through pre-investigations, time and cost estimates, tunnel excavation and finally acquisition and interpretation of experience data. The estimation model is based on job site studies and statistics from tunnelling in Norway and abroad (Bruland, 1998).
Rock mass fracturing is the most important for the penetration rate parameter. In the NTNU model the rock mass fracturing is expressed by the fracturing factor (ks). ks is dependent on the degree of fracturing (type and spacing) and the angle between the tunnel axis and the planes of weakness, α, (1). The orientation of the fracture-planes is determined from measurements of strike and dip.
(1)
where αs= strike angle, αf = dip angle and αt= tunnel direction
For more than one set of fracture-planes, the total fracturing factor ks-tot is as follows:

where ks-tot = total fracturing factor, (2)
ksi = fracturing factor for set no. i and
n = number of fracturing sets.
The fracturing factor is shown in figure 14-2 below, as a function of fissure or joint class and angle between the tunnel axis and the planes of fractures.

Figure 14-2: Fracture classes representing fracture spacing and angle, given a ks for each fracture set. Also, the correction factor for DRI is shown (Bruland, 1998).
The rock mass properties for TBM boring are expressed by the equivalent fracturing factor, kekv.
(3)
Where ks-tot= total fracturing factor
kDRI= correction factor for DRI
kpor= correction factor for porosity of the rock. The compensation for geological conditions was related to variation in the kekv.
In the rock mass present in the project area the porosity is <2%. This give a kpor =1. The DRI was found in laboratory tests, and samples were taken regularly. The geological mapping was therefore focused on documenting the rock mass total fracturing factor, ks-tot. According to the NTNU model one need to document number of fracture sets, strike and dip of the fracture sets and the fracture spacing of each set.
Optical tele-viewing
Probe drilling for detecting water ahead of the TBM and to prepare for systematic and continuous mapping by optical tele-viewing along the tunnel alignment, was performed every day during the maintenance shift. (Lawton, Gammelsæter, Finnøy, Syversen, 2018). The detection of water is described below.
The results from the continuous fracture mapping by optical tele-viewing (OTV) was used as input for the NTNU model for compensation. This model is based on continuous fracture mapping from an open TBM, where the rock-surface is available behind the cutterhead. (Bruland, 1998). For a shield-TBM, the rock-face is only visible through the cutterhead when the TBM is not excavating. To collect necessary and continuous information about the different fractures- and fissure systems along the entire tunnel section, 40 meters long probe-holes were drilled from behind the shield, forward ahead of the machines. An overlap of approximately 10 meters between the lengths were normally achieved.
The probe-holes were logged with Measure While Drilling (MWD), but this gave mainly information about fracture-zones and presence of water, and no precise information of the orientation or condition of the fractures. The MWD-data was therefore not suited for detailed fracture-mapping as required for the NTNU-model.
Figure 14-3: Overlapping probe-drilling for double shield TBM.

Instead, mapping of the probe-holes by an optical tele-viewer gave pictures with quite high-resolution scale, where fractures and their orientation could be mapped in detail. An example is shown in figure 14-4 below.
Open fractures were usually easy to detect, while closed fractures or fractures with small aperture could be difficult to observe in the picture. Sometimes a line of brownish colour from weathering could reveal the presence of a fracture that was otherwise undetectable in the picture. Also fractures in dark rock like amphibolite could be difficult to spot. Fractures and fracture-planes that were believed to contribute to the rock breaking process under TBM boring were marked on the picture with special software. With the same software, it was then possible to decide strike and dip of these structures. These data were then used to estimate fracture sets and fracture spacing. Further on, ks could be estimated. The project estimated one ks value for each probe hole.
The probe-holes prepared for OTV were bored upwards to achieve a drained hole. They were also flushed to avoid debris covering parts of the holes. (Kalager, Gammelsæter, 2019)
The OTV-logging provided a continuous geological data record along the entire tunnel section. The instrument for televiewing had a compass to keep track of borehole orientation. The result was a highresolution picture where fractures and lithology could be mapped in detail and of good enough quality to be used as input for the NTNU-model.
Due to influence of all the metal parts from the TBM, including back-up to the compass, corrections of dip and strike direction had to be done afterwards.
The continuous OTV-logging provided a huge amount of information to be analysed. To utilize all the data collected from the OTV, it was important that the analysis were performed by geologists with experiences from face-mapping and chip analysis as well.

Figure 14-4: OTV image with fractures mapped.
Face mapping
The purpose of performing face mapping was to gather general geological information and to get input to assess the fracture factor Ks, which was part of the compensation model. Mapping was performed every morning during the maintenance shift by geologists from both the client and the contractor. Both parties signed the agreed mapping form before leaving the TBM.
Depending on the daily excavation rate, there were 15-20 tunnel meters in average between each face mapping.
Access to observe the face was through the manhole and to a certain degree through muck openings as well. The cutter-head was retracted from the face to make it possible to get an overview of a larger part of the face.
The geological mapping of the face gave information about presence of rock types and eventually of hard and abrasive minerals like quarts or garnet. Signs of weathering were often visible. Other important information was the number of fracture-sets visible and the space between the fractures. In some cases, the mapping made it possible to observe the roughness of the fracture planes and eventually infilling or aperture. It was also possible to verify if fractures or fracture-planes contributed to fall-out or over-break. Water seepage from the face could also be identified. Figure 14-5 shows an example of how photographing of the face contributed to supplement the geological mapping.

Figure 14-5: Fractures with different orientation identified at the face.
3D-Photographing at face
3D-photographing of the face was done regularly every day during the maintenance shift. Equipment and software from 3GSM were used. A camera was mounted in the manhole of the cutterhead, and a circular video was captured during one rotation of the cutterhead.
Advanced software generated scaled and oriented 3D images from measurements taken. This is illustrated in figure 14-6 below.

Figure 14-6: A 3GSM-photo gave a ”doughnut”-shaped picture where fracture-sets were visible.
The width of the doughnut shaped picture was in the range of 0,5-1,5 meter depending on how far back the cutterhead was retracted. The result was a documentation of the rock mass conditions on that particular tunnel-face. From the 3D images, it was possible to identify and measure over-breaks, perform geological mapping and to analyse fracture set orientation and to some degree fracture spacing as well.
Chip analyses
Chip analysis can be a valuable tool to obtain information on the rock breaking process and was therefore performed regularly. Normally 10-20 of the largest chips were collected from the TBM excavation and measured in three directions, x, y and z. The shape and size of the chip gave information or tendencies on fracturing factor, rock brittleness and hardness. The combination of chip shape and chip size could give tendencies on the efficiency of the boring process.
Core drilling
Every 250 meter of the tunnel excavation, core drilling was performed at the front of the TBM’s. Cores of four meters length were drilled perpendicular to the tunnel to get rock material for laboratory testing to determine Drilling Rate Index (DRI), Cutter Life Index (CLI) and mineral analysis. The DRI value was needed to be able to calculate the Kekv as an input for the NTNU-model. For cutter life calculations, CLI and the mineral content, mainly quartz, was needed.
In addition, two meters long cores were bored for geological logging as a supplement to the geological information obtained from the daily tele-viewing, face mapping and chip analyses.
Experience by using the NTNU-model as a compensation model
All the mapping needed for using the model were performed by both the contractor and the client. The fact that some of the data for the model was based on subjective interpretations by the parties, resulted in different views of a potential compensation for deviation of the ground conditions. Even though the parties had a disagreement about the size of the compensation, the results provided a basis for a final compensation related to changes in the ground conditions.
Summary of the different methods for geological mapping
The different methods for geological mapping are listed in table 14-1 below
Monitoring of the pore-pressure, groundwater level, and settlements
A network of registration wells for measuring the pore-pressure along the tunnel section and in sensitive areas connected to the tunnel by fracture-zones were installed before the start-up of the tunnelexcavation. The first piezometers were installed in 2009, almost seven years before the start-up of the TBMs. Early installation of monitoring is important to obtain a history of natural seasonal variations in the pore pressure. (Syversen, Lawton, Finnøy, Gammelsæter, 2018). The wells and piezometers for the groundwater monitoring system were installed in the rock, with connection to fractures, and in the soil, that mostly consists of marine clay, as well.
The monitoring of the pore-pressure was a continuous and ongoing process throughout the project, and after finalization of the excavation until the water-balance was stabilized as well. All sensors
were logged automatically every 10th minute, and the results were uploaded to a web-based GIS portal with a frequency of down to1 hour if deemed necessary. In addition to the pore-pressure monitoring program, an extensive settlement monitoring program was carried out. Nails were mounted on the foundation of more than 2300 buildings. The nails were
Methods for mapping Description
Face mapping Inspection of the rock through holes in the cutterhead.
Photogrammetry from face 3D Photographing of the face by the use of several georeferenced photos.
Probe drilling Two drill rigs on each machine. 38 possible drill positions in the shield. Holes were drilled with an angle of 11 degrees.
Optical televiewer 2D photography of the probe holes. Gives an oriented projected photography of the inside of the borehole.
Core drilling Two cores of 2-meter length were taken. One perpendicular to the tunnel axis, and one parallel.
One core of 4-meter length was taken perpendicular to the tunnel axis.
Lab testing 1 meter out of the 4 m long core was taken to perform the following tests:
• Drilling Rate Index
• Cutter Life Index
• Quartz content
Frequency What is mapped
Daily on all machines. Were performed during maintenance stops.
Daily an all machines. Performed during maintenance stops.
Continuous and overlapping probe holes. The frequency was dependent on the production, but it was usually performed every day. Fracturing, rock type, water leakages etc.
Fracturing, rock-types leakages etc. Can generate stereo-nets and rose diagrams from each face.
Water leakage. All holes were also logged by MWD.
Was performed on overlapping probe-holes so that every meter of the tunnel was mapped. Fracture-data, like orientation and distance between fractures. Lithology in the hole.
Every 50 meters Fracture mapping and lithology.
Every 250 meters. Fracture mapping and lab testing
Every 250 meters. DRI, CLI, quartz content and XRD. The results were used as input in the compensation model which regulated compensation for changes in geological conditions.
• XRD
Chips-analysis Samples were taken from the conveyor belt and studied. Occasionally Was used to get a better understanding of the breaking process
Table 14-1: Different methods used for geological mapping from the four double-shield TBMs.
manually surveyed in due time prior to passing with the TBMs and after the TBMs had passed, and the readings were uploaded to a web portal. In addition to the manually measurement of settlements, a monitoring program utilizing satellite data (inSAR) from 2014 and up to date was established to identify if settlements occurred on buildings along the tunnel section. How the pore-pressure, ground-water levels and development of settlements were followed up, is described in more details in Chapter 15 “Ground-water control and monitoring”.
Probe-drilling and pre-grouting in areas with leakages
To fulfil the requirements regarding limited drop of pore-pressure and no damages to buildings or other infrastructure in the areas above or close to the tunnel, the tunnels were built as an undrained tunnel solution. Concrete segments with watertight gaskets were installed right behind the shield of the machine. The concept was based on a solution that as soon as the lining was installed, the backfill behind the lining should be completed, and the grout-ports should be closed. Then the tunnel should become water-tight and acts as an undrained tunnel. This is described in more details in Chapter 16 “Production and installation of the segmental lining”
The leakages occurred in areas with fractures. (Kalager, Gammelsæter, 2019). The rock-mass itself was solid and impermeable. Before the lining was installed, there was an open rock-face of approximately 15 – 20 meters between the tunnel face and the last installed segmental ring. In a few areas where highly permeable fracture zones intersected the tunnel, there were some extensive leakages into the tunnel before the lining was installed. Such leakages followed the network of fracture zones, and in the worst case, a huge area up to 1.5 km from the tunnel was seen to be affected. Specific experience of this is also described in more details in Chapter 15, “Groundwater control and monitoring”.

Figure 14-7: The tunnel crossed different networks of fractures. The rings show the crossing-points between the tunnel and identified main fractures and the stars illustrates the affected areas along the different fractures within the network. Blue and red rings indicate crossing of fractures within different networks. The experience achieved in areas with such leakages through fracture zones, was that the water ingress also resulted in outwash of the cement-based backfill that was injected behind the lining. This outwash made it possible for more water to flow behind the lining, which resulted in even more out-wash of material and in some cases a destabilizing of the lining as well. From an early stage of the excavation period, it was obvious that the contractor needed to improve their strategy and methods for handling the water as an integrated part of their construction.
Daily, during the maintenance-shift, probe-drilling was performed in the rock ahead of the TBM to register the geological conditions, detect fractures with high permeability and identify if leakages could be expected. The number of probe holes depended on the sensitivity of the area above the tunnel and the expected geological conditions ahead of the TBM.
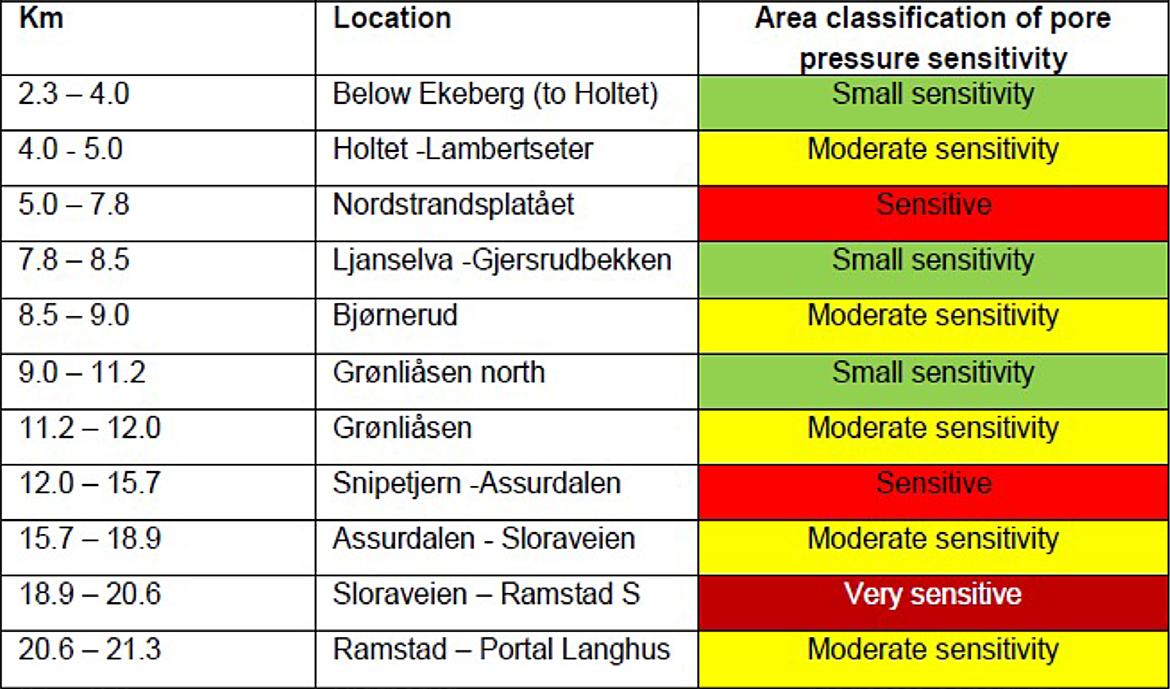
The entire tunnel section was classified in different sensitivity-zones defined as small sensitive, moderate sensitive, sensitive and very sensitive. In general, one probe hole located on the top of the cutterhead or two probe holes in different locations related to the cutterhead were bored in areas defined as small sensitive. In moderate to sensitive areas, experience showed that increasing the number of probe holes to four distributed in different positions around the cutterhead, gave quite reliable information about the geological conditions ahead of the TBM. In very sensitive areas the number of probe holes were set to six.
To reduce the amount of leakage before the lining was installed, pre-grouting was performed from the TBMs when identified as necessary, based on water ingress measurements from the systematic probe drillings. The trigger values of water leakage from the probe holes were based on the sensitivity class of the areas affected by the tunnel excavation. Based

Figure 14-8: A 3D-visualization of the tunnels crossing the different main fracture-zones. The blue and purple colours illustrate high penetration-rate, which correlates with the fracture-zones identified before the start-up of the TBMs.
on experience achieved during the excavation, the trigger values for starting pre-grouting in the different sensitivity areas were set to 80 l/min from one probe hole in areas with small sensitivity, 40 l/ min from minimum two probe holes in moderate to sensitive areas. During the excavation, the number of probe-holes were in some cases increased to six, and the trigger-value for starting pre-grouting redused to 25 l/min in total from all the probe-holes. In very or highly sensitive areas, 8 l/min in total from all the six probe holes were used as trigger-value for starting pre-grouting.
In some of the areas classified as high-sensitive, mandatory pre-grouting was required.
Each TBM was equiped with two rock-drills for probing and for drilling the holes that should form the umbrella for pre-grouting. The double-shell machines were designed with 38 holes around the shell where it was possible to perform holes for probing and grouting.
Every 500 meters, the two parallel tunnels are connected by cross-passages. The experience showed that opening of this cross-passages resulted in additional leakages. Even though pre-grouting was done as an umbrella from the tunnel around the portal of the cross-passage, leakages after opening-up the lining occurred. The water seemed to come through channels in the backfill material between the lining and the rock. After considering different methods to stop the water in this portal-area for the crosspassages, contact-grouting, with low pressure, of the backfill area around the opening was identified to give the best result.
In areas defined as very sensitive, it was decided to do systematic pre-grouting from the TBM in the areas around the future portals for the crosspassages as well as contact grouting.
This methodology for identifying water and limit the leakage was developed and improved during the excavation phase, and the results appear to be positive. The drop of the pore-pressures stopped and were re-established when the performance of grouting was tailor-made to the geological conditions. The principles for controlling the water balance during the excavation is illustrated in figure 14-9 below. It is also described in more details in Chapter 15 “Groundwater control and monitoring”.
Infiltration wells
To compensate for the water leaking into the tunnel, and by that avoid a drop of the pore-pressure and development of settlements on buildings within the influence area of the tunnel, temporary infiltration wells were installed at different locations. The wells were operated from the surface.
Many of the wells were operated with good results, but not all of them. The key to success seemed to depend on the quality of the installation and the match with the geological conditions. The infiltration wells were usually drilled 20-50 m into the rock. The intention was that they should cross identified permeable fracture zones. These fracture zones were preferably inclined under soil deposits.

Figure 14-9: Mitigations to control the water balance during the excavation.
Water with some overpressure was infiltrated from the rock well trough the fracture zone up into the soil. Pressure and flow were carefully controlled to avoid piping effects and out-wash in the soil. The infiltration of water was mostly activated in combination with pre-grouting to control the water balance in the area affected by the tunnel excavation.
It was a requirement that these infiltration wells should only be used as a temporary mitigation to maintain the pore-pressure while the TBM passed by. After the lining was installed, there should be no need for them anymore.
Experience by the TBM-operation in the Norwegian hard-rock and specific ground conditions
Most of the tunnel excavation in the Norwegian hard rock has traditionally been performed by drill and blast methodology. Therefore, a decision to use TBMs to excavate the main part of the 20 km long twin-tube tunnel at the Follo Line project caused a certain degree of scepticism.
Lessons learned from the excavation of this tunnel section by four double-shell TBMs is that there are some key-factors that must be present for achieving a successful result, namely establishing a good knowledge of the geological conditions along the tunnel section, systematic mapping of the conditions ahead of the TBMs during the excavation, systematic measurement of the pore-pressures and settlements, improved and tailor-made mitigations to limit the amount of leakages and timely and appropriate decision-making for activating the mitigations.
The machines and the equipment must be tailormade for the specific ground conditions. Last, but not least, the experience and skills of the personnel, on both the contractor’s and the client’s side, and the communication and co-operation between them, is also in many ways crucial for achieving a good result.
The experience from the excavation of the two Follo Line tunnels is that the contractor improved their skills for handling water leakages during the excavation. Nearly 8.000 meters of pre-grouting were performed. Their procedures and performance for probe-drilling, detection of water and pre-grouting became more efficient after a while, and in total, the excavation must be defined as being a success.
References
Bruland, A. 1998. Hard rock tunnel boring. Doctoral thesis 1998:81. NTNU
Fritzøe Lawton, M. & Gammelsæter, B. & Hoff Finnøy, A. & Syversen, F. 2018. Continuous mapping with OTV from hard rock double shield TBM as input for compensation. WTC2018, Dubai
Kalager, AK. & Gammelsæter, B. Did the selection of TBMs for the Follo Line project tunnels satisfy the expectations? WTC2019, Napoli
Syversen, F. & Lawton, M. & Hoff Finnøy, A. & Gammelsæter, B. 2018. Water ingress and groundwater control in double shield TBMs at the Follo Line project – Norway. WTC2018, Dubai