29 minute read
9 Use of the tunnel spoil

from Tunnelling in the Follo Line Project - NFF Norwegian Tunnelling Society publication no 29
by TunnelTalk

Gunvor Baardvik, NGI Anne Kathrine Kalager, Bane NOR Johannes Gollegger, Bane NOR
Introduction
Advertisement
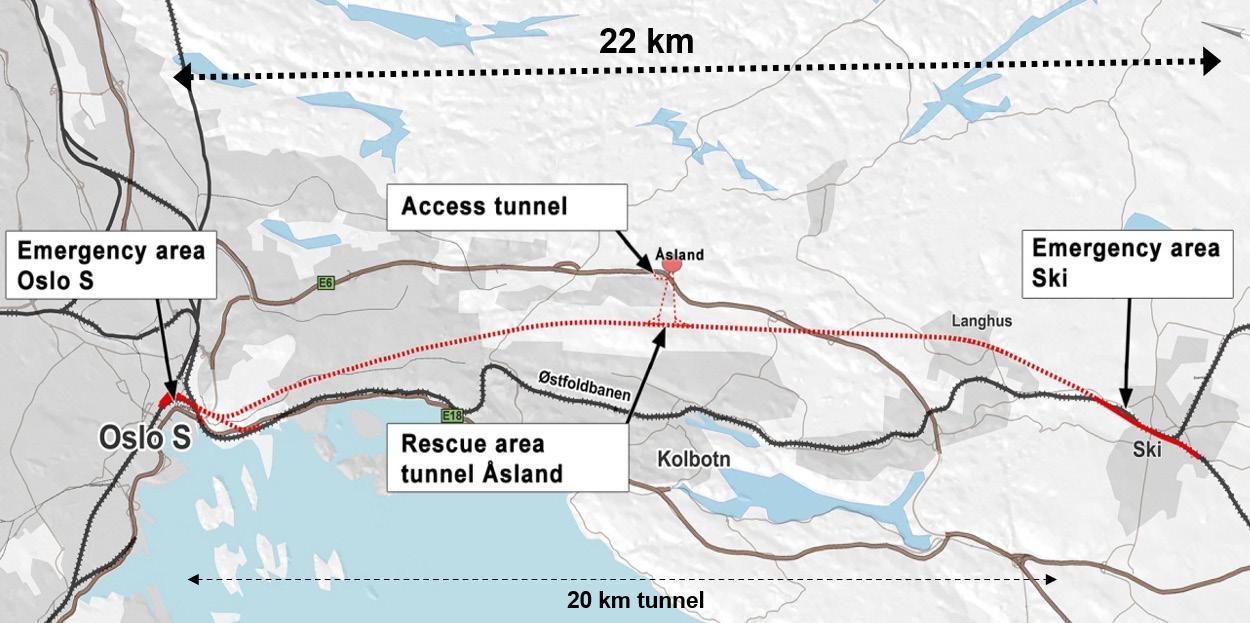
In total, 9 million tons of excavated material were brought out of the tunnel during the construction of the 20 km long twin tube tunnels, with 54 cross connections between the two tunnels. In addition, several access tunnels, logistic tunnels and caverns were built for an efficient performance of the work. This is illustrated in figure 9-1 below.
Figure 9-1: The tunnel system with connection to the rig area at Åsland; Access and logistic tunnels, assembly caverns and the main tunnels excavated by four TBMs.
From an early stage of the planning of the construction work, the project organization considered several alternatives for re-use of the excavation material. The spoil was defined as an important resource, and it was a goal for the project to find a sustainable solution for re-use of these 9 million tons of rock mass.
Three stages of Area-development plans
The project had access to a large rig area, called Åsland, centrally located approximately halfway between the two ends of the 20 km long tunnel section. Within the area which was originally approved by the municipality as a rig area for the performance of the tunnel, approximately 20% of the material could be re-used for building up the rig area and for re-establishing the terrain after the construction period. Most of this spoil would come from the excavation of access tunnels, logistic tunnels and caverns.
When it was decided to excavate the main part of the tunnel by four tunnel boring machines (TBMs), operating from this large rig area, it was also identified that production of segments for the tunnel lining could take place within Åsland rig area. This was described as an option in the tender documents. If the segments and the concrete should be produced within the rig area, it was also a requirement that 10 – 15% of the excavated material should be crushed into different fractions, which should be used as aggregates for the production of concrete.
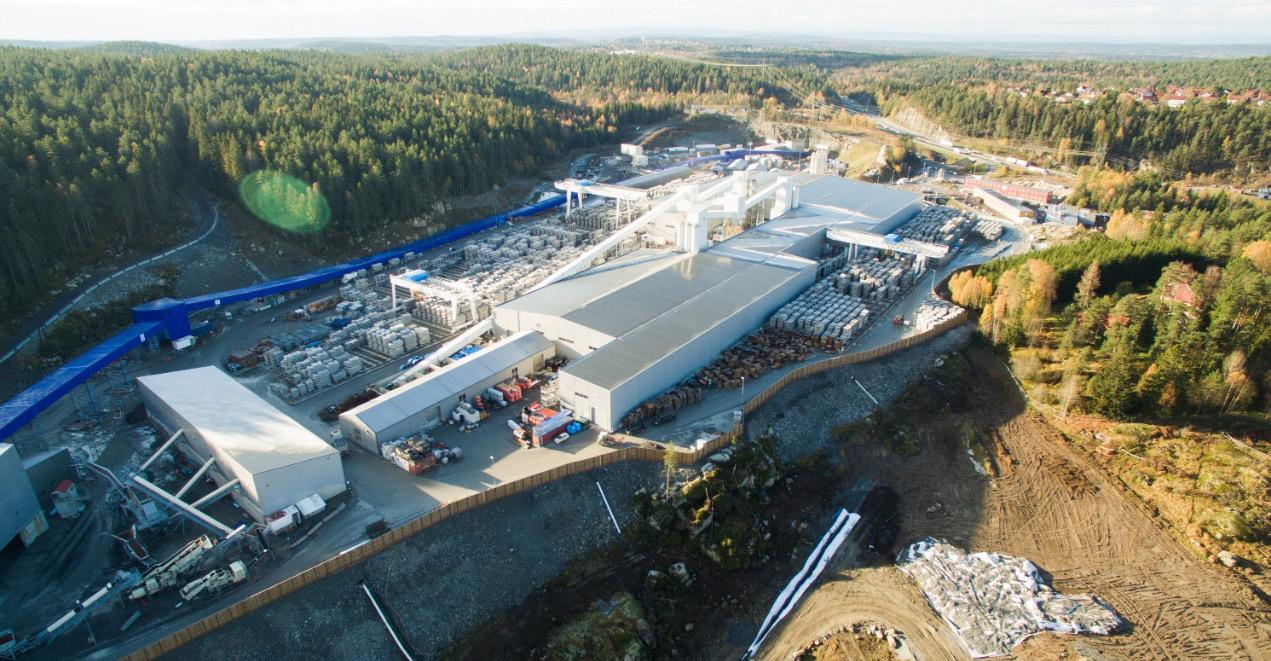
To be able to prepare for an establishment of an efficient rig area, where all the main activities related to the tunnel excavation could be located, it was necessary to extend the rig area. Approval of access to an extended area linked to the area that was already approved, was done by an application described as new area development plan. An acceptance of this plan made it possible for the contractor to have all his activities related to the tunnel excavation within the rig-area, including three factory units for the production of the segments for the lining, storage area for the segments, facilities for handling the spoil, crushing the spoil, all kinds of workshops, offices for the contractor and the client, cantina and accommodation for approximately 470 workers. This is shown in figure 9-2.
In addition, it was also possible to prepare for a future residential and recreation area by re-using approximately 50% of the excavated material to fill up a valley linked to the rig area. This area development plan was not yet in place when the tender doc-

Figure 9-2: An overview of the rig area with conveyor belt (blue covered), which brought all excavation material from the tunnels up to the upper rig area, close to the deposit area.
uments were sent out, but it was approved by the municipality before the contractors delivered their final bids, so during their preparation for their bids it was clear that approximately 50% of the spoil could be deposited within the rig area, as a basement for a future residential and recreation area.

Figure 9-3: Rig and deposit area illustration of an early project stage. Later the deposit area was extended for the area development plan tailormade for the operation of four TBMs which opened up for re-use of 50% of the spoil as a basement for a future residential and recreation area.
In addition, the contractors had to search for other areas, outside the rig area, where filling was allowed. Bane NOR introduced one accepted alternative as a part of the tender documents and investigate various other locations, but the contractors were free to come up with other alternatives. The requirement from the client was that the alternatives were accepted by the municipality.
During the process of producing and achieving acceptance for the second area development plan, which allowed for re-use of approximately 50% of
the spoil within the area, both Bane NOR and the Municipality of Oslo saw benefits for both parties and the value of sustainability for re-use of the material would be even higher, if all the spoil could be filled at Åsland. This plan is shown in figure 9-4 below.
After acceptance of this plan, the project was finally allowed to fill all the spoil from the tunnel excavation within the area, as a basement for a future residential and recreation area. Re-use of short travelled excavated material contributed to a massive reduction of traffic on the road system. All the material from the tunnel excavation was transported all the way from the four TBMs up to the edge of the deposit area by conveyor belts. Compared with an alternative of excavating the tunnel by drill and blast from seven different access-tunnels and transport all the spoil by trucks to the deposit area, a reduction of 27.000 tons of CO2 has been calculated for the TBM-alternative where all the spoil was transported out to the deposit area by conveyor belts.

Figure 9-4: The final area development plan, which allowed for re-use of all the excavated material.
Preparations for filling at an existing deposit of quick clay
The ground conditions in the valley, where most of the material was supposed to be deposited, consisted mainly of a thick layer of clay above the rock surface. Laboratory tests showed that the clay was very sensitive, recognised as quick clay, figure 9-5. This meant that disturbance of the clay structure, from digging, compaction or filling could within seconds transform the clay to a liquid soup. The clay basin was surrounded by solid rock on three sides. In the end of the valley, a retaining wall, like a dam, had to be established as a back-up. In case of a collapse of the clay during the filling, this wall would prevent the “soup” to float out of the valley. To reduce the water content of the clay, a vertical drainage system was established as pre-work before the filling of excavated material could start. A grid of drainage pillars was carefully bored down into the clay, see figure 9-6 below. This vertical drainage pillars were connected to a horizontal layer of gravel to lead the water out to the edges of the valley. Before the actual filling of the deposit area with proper compaction could start, a preloading layer to reduce to impact of heavy construction machinery together with vibrating compaction was installed.

Figure 9-5: Geological profile along deposit area.
Figure 9-6: Establishment of a vertical drainage system (blue line illustrates the vertical drains installed in a pattern of 2mx2m).


Monitoring program of deposit area
An exhaustive monitoring program consisting of settlement points, inclinometers and piezometers has been established at the deposit area, see figure 9-7. A maximum of more than 4m of settlements has been registered during the filling process. As illustrated in figure 9-8 were the settlements of the quick clay almost subsided after 2 years when the maximum filling height was reached. But the deepest quick clay deposit continues to settle for some centimetres per year. This also correspondences with the pore pressure development, figure 9-9. During the first period the clay was despite the vertical drains not able to drain in accordance with the additional loading resulting in increased pore pressure. With a delay of several months the pressure finally started to reduce again and after approx. 2 years the pressure was back to the original level.
Bane NOR studied during autumn and winter 2019/2020 the surface settlements by InSAR. InSAR (Interferometric Synthetic Aperture Radar) is a technique that maps millimetre scale deformations of the earth’s surface with radar satellite measurements. The surface settlements were in the same magnitude as the quick clay settlements.

Figure 9-7: Monitoring of deposit area.

Figure 9-8: Settlements of quick clay.

Figure 9-9: Example of pore pressure development.
The spoil at the Follo Line consist mainly of hard rock as Precambrian gneisses, with variations between tonalitic to granitic gneiss and quartz-feldspathic gneiss. In the preparation of the tender documents Bane NOR made a study of spoil properties from older TBM-tunnelling projects in Norway. The report, which summarized the data from tunnels for hydropower plants performed in the 1970- and 1980-ies, highlighted the issues to expect from the spoil from the Follo Line (NGI, 2016).
• The large volume of fines in the spoil • The shape of the particles, which is characterized as flaggy, due to the disc cutters on the
TBM • Brittle particles with low crushing resistance • Sensitivity to variations in water content
Despite this, laboratory test on the material in the study showed that the geotechnical properties of the spoil were good (Statkraft,1986). It was known from the study and recommended in the tender documents that the spoil should be handled and placed with care, to avoid high porosity and settlements in the fill.
The contractors joint venture consisting of Spanish Acciona and Italian Ghella (AGJV) have performed extensive field and laboratory testing to assure and document the quality of the TBM-spoil fill (AGJV, 2019).
Trial fill
The work with the fill of TBM spoil started with trial fills. In the trial fills, four different thicknesses of the layers were tested, combined with varying amount of compaction work. The aim was to find the optimum thickness of the layers and suitable compaction effort, that would be valid for the whole fill.
The test was conducted on four different thicknesses of layers: 0,5m, 0,7m, 1,0m and 1,5m as seen in figure 9-10.
Figure 9-10: Longitudinal section along the trial fill showing the different sections and layer thickness.
The trial fill took place late in the autumn 2016 after and under heavy rainfall. Initially the test results were confusing. The plate load tests (PLT) indicated that the deformations in the fill was to large, but testing with nuclear density gauge (Troxler) compared with results from Standard Proctor laboratory tests, and later, the test pits in the trial fill, demonstrated that the density of the fill and the compaction effort was sufficient for layer thicknesses of 0,7 m. The number of passes was six with a vibratory roller of 25 tons. The trial fills showed a homogenous grain size distribution in the material. The average water content was between 5 – 8 %, and the material was characterised to be sensitive to increase the water content.
One of the challenges with TBM spoil from large projects, is the amount of materials to be handled continuously. The Follo Line had four tunnel boring machines operating simultaneously. The transport of masses could not stop or be delayed, else the spoil would pile up very quickly in the spoil shed and probably force a stop in the whole TBM production line. An important decision based on the trial fill was, that the fill work should only be performed when there was little or no precipitation. When the weather forecast predicted rain, the spoil was transported to other deposit sites outside the building platform area. This also secured the working conditions on the fill and the quality of the fill.
Another important mitigation in order to protect the TBM spoil from more water, was transporting the spoil out on conveyor belts under a cover. On the other hand, it was a need to add water on the TBM to avoid too much dust in the tunnel. The material was stored in the spoil shed for a short draining.
Requirements set for compaction control state that measured dry density must be within 95% of the proctor compaction test results. The plate load test results were according to contract required to achieve E1 > 20MPa, and E2/E1 ≤ 3.
Quality control procedure
The contractor worked out a test procedure for every layer in the fill, which consisted of: • 2 tests of natural water content (lab) • 2 grain distribution curves (lab) • 2 tests where the optimal water content for compaction and maximum dry density were determined using the Standard Proctor test (lab) • Several tests for each layer of the deposit with
Troxler - nuclear density gauge (field) • 2 plate load tests (field) • Number of passages or weight of compaction equipment
The natural water content in the TBM-spoil
TBM spoil is sensitive to water, and variation in water content causes variations in geotechnical performance under and after compaction of the material. Natural moisture of the spoil was measured in the laboratory on the same samples as grain distribution tests. The average value for the water content in the fill was 5.7 – 5,8 %. The maximum water content was approximately 8.7 to 9 % and minimum between 0.27 and 2.85% (AGJV, 2019).
Grain size distribution
Grain size distribution testing was performed to control the variation in the materials during the earthworks. In the master thesis from Marianne Dahl (Dahl, 2018), the grain size distribution curves from more than 25 layers are plotted and presented as shown in figure 9-11. The TBM-spoil from the Follo Line project is relatively homogenous and is characterized as a well-graded, sandy, silty gravel. The spoil from contents of 40-95% gravel (> 2 mm), and 10-18% fines (<0,063 mm silt and clay). The well-graded materials achieve a good compaction and high density. In well-graded materials, a larger proportion of the pores are filled with smaller grains and the density increases. Masses with a low porosity are usually stiffer and have a higher modulus than masses with more voids. The high content of gravel contributes to high shear strength and low compressibility (Statkraft,1986).
The high content of fines (<0,063 mm) of 10-18% do not satisfy the requirement to self-draining materials.

Figure 9-11: Grain size distribution curves from layer 4 to layer 29 (Dahl, 2018).
The Standard Proctor compaction tests
The Standard Proctor compaction tests are performed on material taken from the spoil shed together with materials for water content. Two samples are taken for each layer of the deposit. The result of the Standard Proctor test is that the average dry optimum density is about 2.15 t/m3 and the corresponding optimum water content is approximately 8 %. The water optimum is slightly higher than the average natural water content on 5,7 %. In figure 9-12 two proctor curves from the tests on Layer nr. 11 is presented in colored lines.
When applying a correction of the maximum dry density with respect to grain size it should be possible to achieve an average dry density of 2.2 t/m3 with this material.
Field test with nuclear density gauge – Troxler
It has been conducted several measurements with nuclear density gauge on each layer of the fill. The results will always vary with the density of the rock mass, water content and how tight the test rod is in contact with the soil.
The main results from AGJV on the Troxler tests are summarized below (AGJV, 2019), also showed in figure 9-12: • Density from the Troxler test is usually higher that the maximum determined by the Proctor tests (>100 % Standard Proctor). • Moisture by the Troxler measurements is below the optimum determined by the Proctor tests and usually in the range of natural values of water content.
In figure 9-12 the Troxler data from layer 11 is presented together with the according Proctor curves (NGI, 2018).
Plate load test
The plate load test (PLT) is frequently used as a tool in compaction control in road constructions. Plate load tests were performed after compaction of each layer to determine the achieved stiffness of the first loading cycle E1. Furthermore, by applying the load twice with complete release of pressure between the two cycles, it is possible to evaluate the degree of compaction, E2/E1.
The results from the plate load test showed a less stiff material than expected, and many of the plate load test did not satisfy the requirements. On average there is obtained a deformation moduli EV1 = 26.5 MPa and a ratio EV2 / EV1 at 3.43 (Dahl, 2018).
Layer 11 presented in figure 9-12 is the results from a layer where the plate load test was not accepted,

Figure 9-12: Combined plot of data from Troxler measurements and two laboratory test Standard Proctor on Layer 11. The Troxler data shows better values of dry density than the Proctor curves, and the ratio of air-filled voids is 5 – 7%. The field data are better than the requirements.
while the Troxler data are better than the reference Standard proctor test. Random tests on several layers with poor results from PLT shows the same (NGI, 2018).
Under the compaction work it was reported several times that the surface was soft and wet, and that the number of passes with the rollers was not achieved until some days after the first attempt. When conducting plate loading tests, the requirement for uniformity of the surface is important. Attempts have also been made for plate load tests with and without alignment with plaster or sand (Barnard and Heymann, 2015). In short, the authors conclude the experiments that the use of plaster or sand gives an increased value at the first time deflection E1, up to 50%. These two factors in combination might be the cause of the poor result of the plate load tests on the fill.
Test pits
To investigate whether the compaction of the fill was acceptable despite the results from the plate load test, additional test pits and permeability tests were undertaken to evaluate the actual achieved dry density against the standard Proctor maximum. During the tests the permeability was also measured, and the drainage properties of the fill were evaluated.
The four test pits presented of Dahl (Dahl, 2018) show high values for dry density, see figure 9-13. The comparing of test pit and control measurements with Troxler tests conducted on the surface where test pits were performed, show good correlation for test pit 1, 2, 3 and 4 (NGI, 2018).
The interpretation of the results from the test pits indicate that compaction of each layer is better than the plate loading tests indicate alone. All measurements with Troxler on the surface of the pit before excavation are above 95% Standard Proctor and with an air-filled pore volume of 7 % or less.
Evaluation of the fill
The results from the Troxler tests and test pits are plotted in a compaction plot, together with results from Standard Proctor tests, se figure 9-13. The figure shows that the quality of the compacted fill
is better than the requirements of 95 % Standard Proctor. The average maximum dry densities from the Proctor tests are plotted as 100 % standard Proctor, with a purple curve. The curves from the Standard Proctor test are sensitive to the solid density of the particles, ρs, and is probably the reason for some of the Proctor curves plotting on the high side, above the line for 100 % saturation Sr=100 %.
The standard Proctor tests indicate an average maximum dry density of ρd=2.15 t/m3. This indicates a dense and stiff fill. The optimum water content lays between 8 and 9 %. This must be considered satisfactory, given the variations in volume of fines and water content.
The installed monitoring system indicate that the consolidation of the quick clay deposit is flattening out, but some settlements in the range of a few centimetres can still be expected. The comparison with the surface settlements evaluated by InSar show the same magnitude of settlements, which means the filling as such does almost not have any settlements, which is another indication of a high quality filling.

Figure 9-13: All measurements with Troxler on the four test pits, plotted together with the archived Proctor curves for the nearby layers. Most of the measurements are above 95 % (pink line) Standard Proctor and with an air filled pore volume of 7 % or less, which must be considered satisfactory for the quality of the fill.
Before the tender documents were produced, the properties of the rock mass were analysed and found acceptable for re-use as aggregates for concrete production. Based on this, crushing and reuse of approximately 10 – 15 % of the material was implemented as a requirement in the contract.
The production of the segments started up during the summer of 2016, approximately 3 months before the first TBM started the excavation. This part of the production was based on delivery of commercial aggregates from an external quarry.
When the TBM production started in the autumn of 2016, testing of the quality and achievement of the different fractions as well as the chemical components of the crushed material were performed.
The material was crushed into the following fractions: • 0 – 8 mm (sand) • 8 – 11 mm (fine gravel) • 11 – 22 mm (course gravel)
Humidity of the material
The crushed material was washed before it was transported more or less directly into the concrete production line. The aggregates were dropped from the top in the spoil shed. The water in the material were drained downwards towards the hatch in the floor, where the material was dropped on a conveyor belt and transported to the batching plant, only 1 – 2 days after the crushing. For the sandy material (0 – 8 mm), the time for the water to be drained out was too short. Much of the water remained in the material and caused a high humidity of this fraction. It was measured up to 17 % humidity, while the recommended value is 3 – 7 %. It was known that a high and unstable water-content in the aggregates would affect the production and quality for the concrete. This challenge related to the high water-content was not a problem for the two gravel-fractions. After washing, the water drained more efficient through the material for these fractions.
Standard for declaration of the material
In accordance with the contract, the concrete production should comply with the standard NS-EN-206. According to this standard, the quality of aggregates in the concrete should comply with the standard NS-EN-12620+NA. The standard requires two steps of testing; first initial testing to declare the properties of the aggregate material. Then frequent production testing must be performed to check if the properties of the material changes compared to the initial results. The standard requires a certain number of tests to be performed before the aggregates can be used for concrete production.
Pyrrhotite and accepted content of Sulphur
In November 2016, shortly after the testing had started, chemical analyses of the aggregates identified presence of the unstable mineral pyrrhotite, Fe1-xS. This is, as Pyrite, FeS2, an oxidizable iron sulphide. These minerals react with water and oxygen and form iron oxyhydroxides and sulphuric acid. In concrete, sulphuric acid will then react with the phases of the cement paste and form gypsum and ettringite, which will cause expansion and cracking of the concrete. Pyrrhotite is more unstable than pyrite, and in the presence of water and oxygen, this mineral reacts relatively quickly.
NS-EN-12620+NA requires testing of sulphur content and presence of unstable minerals as pyrrhotite as a part of the initial testing. During production, total sulphur content shall be tested at least once a year. The standard states the following regarding the total amount of sulphur:
The total content of sulphur in aggregates and filers shall not exceed 1 mass percent S. Special precautions are necessary if it is pyrrhotite in aggregate. If it is known that this mineral is present in the aggregate, the total sulphur content shall not exceed 0.1 % S.
In Norway, this limit for total amount of sulphur is defined as 0.1 % when pyrrhotite is present. This means that a total amount of sulphur accepted may be 0.144 %. Some other countries, Canada for example, has defined the limit to be 0.10 %. Many, within the concrete industry in Norway, argue to use the conservative limit 0.10 % instead of 0.1 %, as stated in the standard. In Ireland, for instance, an amount of sulphur up to 0.3 % is acceptable without any further testing of the petrographic condition. However, worldwide it seems to be limited experience regarding the amount of sulphur that can be accepted if pyrrhotite is present to avoid damage of concrete. More scientific investigation should be done within this field.
For identification of the total amount of sulphur, a method described in the standard NS-EN-1744-1 was used. Further, the identification of sulphide minerals was performed by using the test method known as DTA (Differential Thermal Analyses). Through the method, presence of both pyrite and/or pyrrhotite is identified, but it is not possible to determine the amount of these minerals by using DTA. Thus, NS-EN-12620+NA does not state any maximum limit for the content of pyrrhotite if this is present.
Along the tunnel the rock consists mainly of three groups of pre-Cambrian gneisses: Tonalitic to granitic gneiss, quartz – felspathic gneiss and biotitic-augen gneiss. The mechanical properties of these gneisses are similar, but the variations are related to the amount of quartz, feldspat and biotite. Gneiss is a foliated metamorphic rock. As a result of several occasions of foliations, the coarse mineral grains have been arranged as a banded structure. Several generations of intrusions occur, some of them still with the character of a diabase, mainly of pegmatite, and some have been transformed to amphibolite and folded into the gneisses. The amphibolite and pegmatite appear as elements within the gneisses with varying shape and thickness in alternating sequences. The different rock types cannot be related to specific sections of the tunnel, and the entire gneiss formation is defined as one geological unit for the entire tunnel section. In the northern part of the tunnel, the frequencies of fracture zones, which intersect the tunnel is less than in the southern part of the tunnel. In theory, both pyrite and pyrrhotite may occur within fracture zones. Pyrite was, as a part of the pre-construction investigation, identified in cores including such fracture zones. Pyrrhotite may also occur as a common trace constituent of mafic igneous rocks. In addition, it can also occur in pegmatites and in contact metamorphic zones. Pyrrhotite is also a known mineral in amphibolite, gabbro, and marble.
Initially, pyrrhotite had not been identified during the pre-construction testing of cores along the tunnel. It was identified for the first time when the contractor performed his initial testing for declaration of the material before he could use it as aggregates for the concrete production for the segments.
Test results
In total, 30 samples from produced aggregates, from TBM spoil material and from cores from initial geological investigations were analysed for content of sulphur and presence of pyrrhotite. The results can be seen in table 9-1 below.
As a summary, we see that: • It was identified pyrrhotite in 18 of 30 samples (60 %) • 6 of 30 samples, 20 %, had a total content of
S > 0.1 % in combination with presence of pyrrhotite, and did not fulfil the requirements in
NS-EN-12620+NA • 4 of the 30 samples had a total content of 0,10 % < S < 0.15 % in combination with presence of pyrrhotite By comparing the presence of pyrrhotite with the geological conditions, it was difficult to find a clear correlation. This is shown in figure 9-14 below. It was only the pure samples of amphibolite where no pyrrhotite were identified, but the number of samples is too low to conclude that pyrrhotite never occur in the amphibolite present in this area. As known by experience, pyrrhotite is generally a common mineral present in amphibolite. However, amphibolite is only present in small amounts within the rock mass, and mainly as lenses and banding within the gneisses.
Even though the occurrence of pyrrhotite may correlate to the degree of fractures in the rock mass, it was also difficult to see a clear correlation of this when the result of samples taken from the different parts of the tunnel were compared. See the results in figure 9-15 below.
Maybe it is a weak tendency of a higher frequency of pyrrhotite in samples from the southern part of the tunnel section, where the frequency of fractures and water on fractures were higher than in the north. However, pyrrhotite was present in the northern section as well, and the picture of where this mineral could be expected to occur, or not, was too unclear to define areas where it would be safe to excavate for aggregate production.
Frequencies of pyrrhotite from other quarries in Norway
Pyrrhotite in aggregates is not known as a huge problem in Norway. The main source for production of aggregates is post-glacial fluvial deposits of natural sand and gravel. This material has been exposed to oxidation through thousands of years. Pyrrhotite, known as an unstable mineral, when it is exposed to oxygen and water, is therefore more or less eliminated.
Excavated material from tunnels has not been exposed to oxidation. The likelihood of having pyrrhotite present in aggregates produced from this spoil is therefore higher than if the aggregates is produced form material which has been exposed to oxidation over a long period. In our case, where the material was supposed to be crushed immediately after excavation, and then go directly into the concrete production, it was not time for testing, and pyrrhotite-free aggregates could not be guaranteed.
Final decision for handling of pyrrhotite
As a result of the testing of whether pyrrhotite were present in different areas along the tunnel section or not, and the measurements of the total content of sulphur in the samples, Bane NOR found the risk

Table 9-1: Test results where presence of pyrrhotite and total amount of sulphur is measured.

Figure 9-14: Pyrrhotite found in different geological compositions marked as red dots. A=Amphibolite, G=Gneiss and P=Pegmatite.

Figure 9-15: Pyrrhotite found in different samples marked as red dots. N represent samples taken from the northern part of the tunnel section, between Åsland and Oslo. S represent samples taken from the southern part of the tunnel section, between Åsland and Ski.
of using aggregates which would have made damages to the concrete in the segments unacceptable. Due to limited areas for storage of aggregates and short time from production of the aggregates until they went into the production, it was not possible to identify pyrrhotite-free aggregates or clarify spoil for aggregate production in due time.
Since approximately 20 % of the tested samples were outside the recommended limits for aggregate production, neither contractor nor client wanted to take the risk by using spoil from the tunnel excavation for production of aggregates. The parties agreed to buy commercial aggregates for the concrete production instead.
The production line for the concrete production was originally, in accordance with the contract, set-up for re-use of spoil from the tunnel excavation, as aggregates.
Conclusion
It has often been stated that spoil from TBM excavation has no value compared to excavated material from drill and blast production. However, the way the material, nearly 9 million tons, is handled and filled in accordance with a specific procedure, has demonstrated the opposite. At the Follo Line project re-use of short-travelled TBM excavated material has been performed to build up a quality basement for a future residential area.
The transportation of the material by conveyor belts, all the way from the four TBMs up to the surface, and the re-use of the spoil within the extended rig area, has reduced the discharge of CO2 by 27.000 tons, compared with the alternative of excavating the tunnel by drill and blast from seven different access points and transportation of all the spoil by trucks to the deposit area.
Re-use of the spoil for aggregate production would have contributed to an even higher degree of utilizing the material and reduction of transport on the road system. The production was planned for crushing of 10 – 15 % of the material to aggregates. Instead, the local produced aggregates had to be replaced by commercial aggregates from an external producer.
Higher focus on testing of petrographic properties and content of different minerals, which may affect the quality of concrete, should have been prioritized at an earlier stage. An early identification of the presence of pyrrhotite would have limited the uncertainty related to aggregates and contributed to a tailor-made production line based on delivery of commercial aggregates from day one.
To be able to deal with unfavourable spoil for the concrete production a sufficient big area for intermediate storage, sorting and handling of spoil would be required, which the Follo Line project did not have available.
The presence of quick clay at the deposit area did, thanks to the applied mitigation measures of the vertical drains with drainage layers and preloading before the quality filling started, not result in any collapse of the quick clay. The consolidation of the quick clay could be accelerated and was by the end of the TBM excavation almost finished.
References
Acciona & Ghella (AGJV) (2019) UFB-31-A-67013 00E “Project: The Follo Line project, EPC TBM. Follobanen, Åsland. Spoil Area”. Final Report.
Barnard and Heymann (2015) “The effect of bedding errors on the accuracy of plate load tests”. J. S. Afr. Inst. Civ. Eng. vol.57 n.1 Midrand Jan./ Mar. 2015
Dahl, Marianne. (2018) “Investigation of geotechnical properties of TBMspoil from the Follo Line project”. Master- degree thesis for Marianne Dahl. NTNU 2018.
NGI (2016) Report UFB-30-A-70072. “Application of TBM spoil as a quality fill for Gjersrud/ Stensrud township. Follobanen». Bane NOR.
NGI (2018) Report 20180498-01-R. «Kontrolldata fra fylling av borkaks fra Follobanetunnelen. Evaluering av geoteknisk kontroll av fylling av borkaks».
Bane NOR (2020) Report UFB-31-A-70105 00B. «Deponiområdet Gjersrud – Stensrud. Vurdering av kvalitet av utført fylling ved Gjersrud – Stensrud».
Norwegian Standard NS-EN 12620+NA: «Aggregates for concrete»
Silje Gystad Ytterdal, Elisabeth Grasbakken, Berit G. Petersen. 29.05.2017. “Memo- Evaluation of risk regarding pyrrhotite in aggregates.” Bane NOR, Oslo, Norway.
Statkraft (1986). «Prosjekt fullprofilmasser. Materialegenskaper». NGI report 85607-1. 30. may 1986.