16 minute read
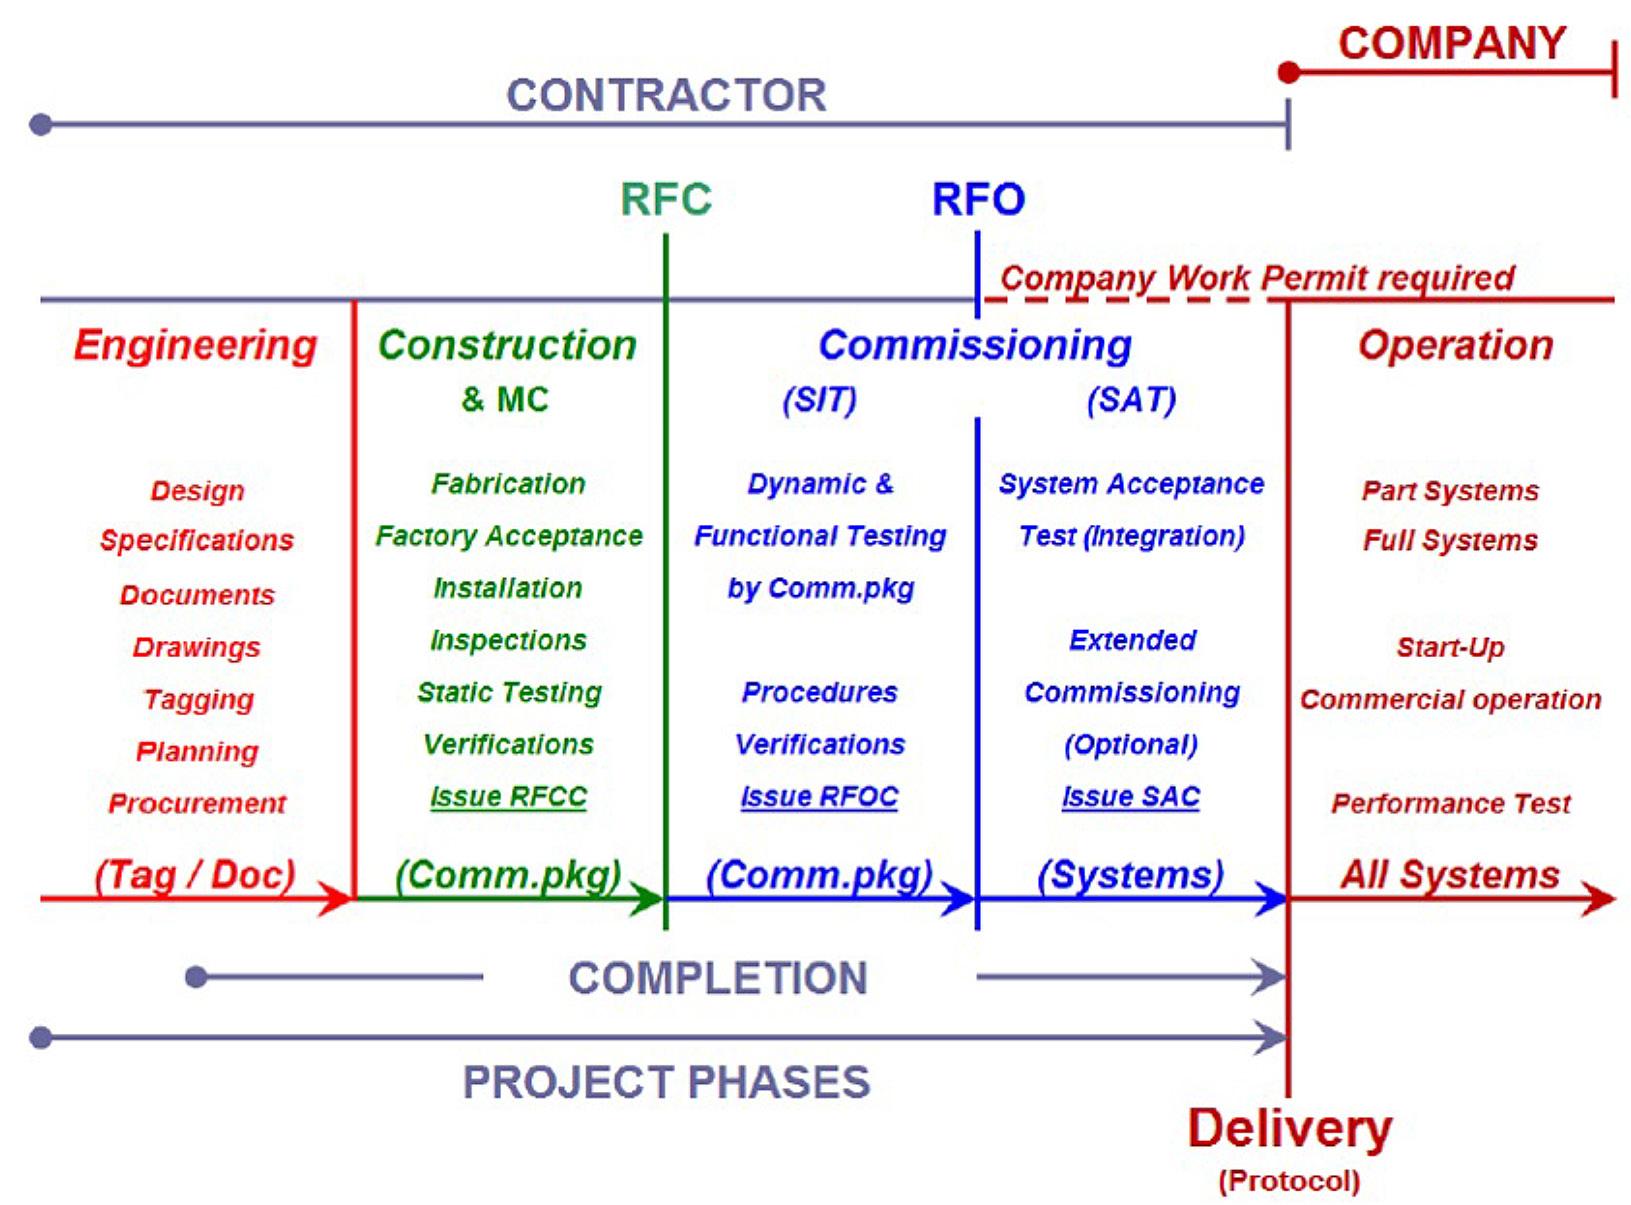
3 Pre-construction planning and geological investigation

from Tunnelling in the Follo Line Project - NFF Norwegian Tunnelling Society publication no 29
by TunnelTalk

Bjørnar Gammelsæter, Bane NOR Elisabeth Grasbakken, Multiconsult
Introduction
Advertisement
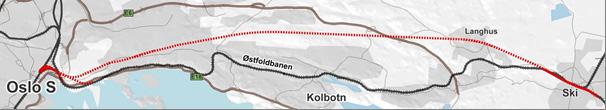
The first geological investigations for the Follo Line railway project were performed during the early 1990’s as part of a master plan for Oslo-Ski. In 2007 the Follo Line project started to plan and conduct more geological investigations, evaluating possible tunnel alignments and tunnel concepts. In 2009 it was decided a direct alignment for the Follo Line, with no stations between Oslo and Ski. A two tube single track solution were chosen in 2010, resulting in a total of 40 kms of tunnel.
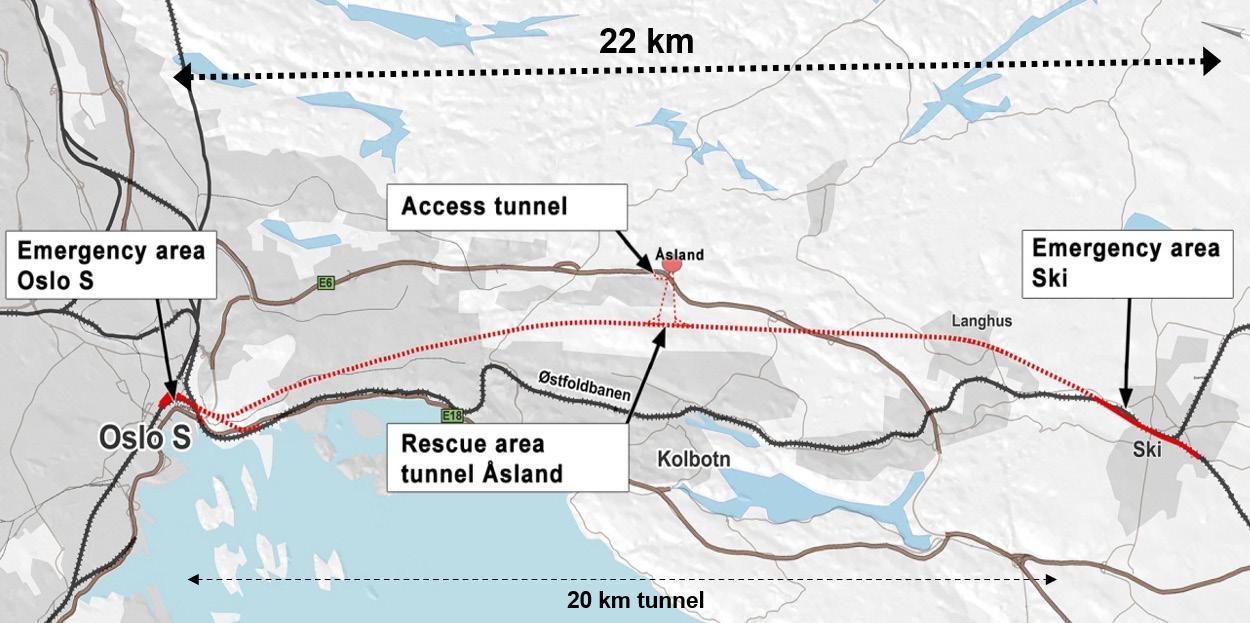
Figure 3-1: Overview of the project area.
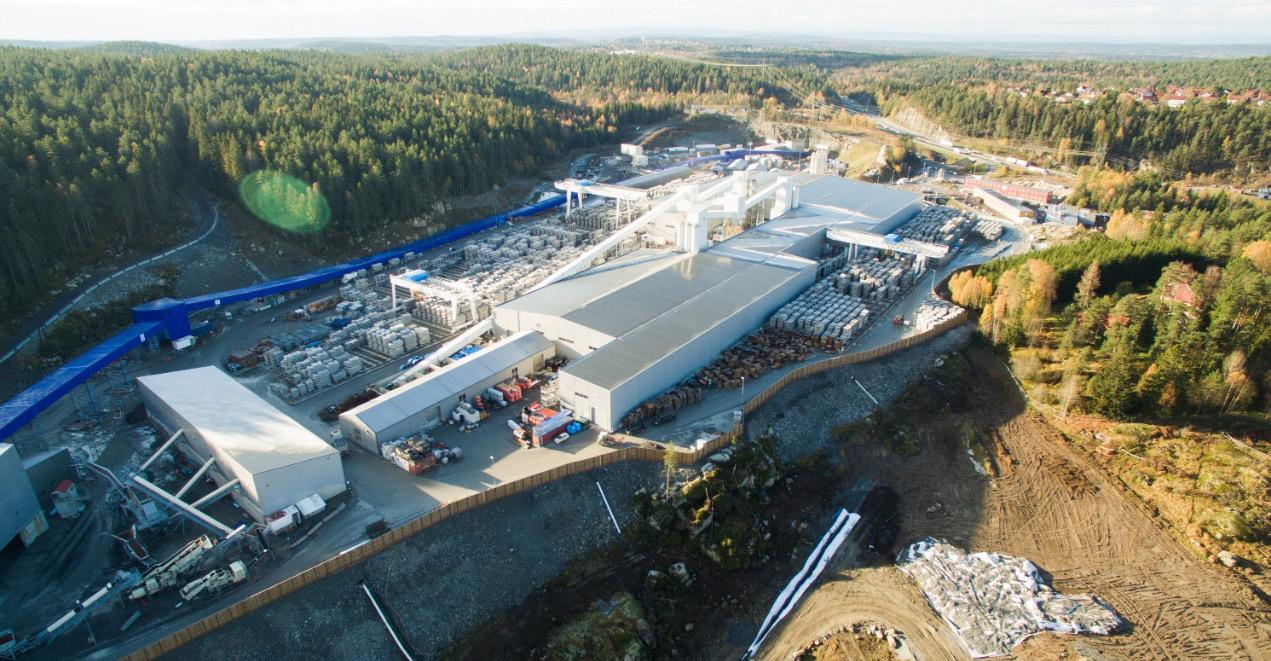
More comprehensive investigations were done over a number of years, until the construction of adit tunnels started at Åsland in 2014.
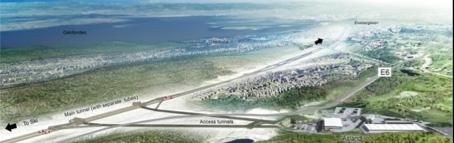
Figure 3-2: Adit tunnel system at Åsland.
The geological investigations can be divided in three main topics.
1. Rock mass mapping and characterization, focus on fracture zones and jointing 2. Soil layer parameters and thickness of sediments above the rock-surface 3. Hydrogeology.
The aim of the investigations was to avoid or minimize tunneling in difficult ground-conditions, to reduce the risk for damage to buildings or infrastructure and valuable nature, and finally, reduce the risk for cost escalation of the construction work. However, since the Follo Line railway tunnel is built as a high speed line, adjustments of the alignment due to the geology was limited.
Investigations of the ground conditions covered desk studies of maps and existing reports, inspections of tunnels in the vicinity of the project, geological and engineering geological field mapping, seismic refraction profiling, core and well drilling, resistivity profiling and rock stress measurements. All data reports from geological investigations are compiled in one large report, ref (1).
Pre-investigation methods
Field mapping
NGU (the Geological Survey of Norway) conducted an upgrade of the geological background material in 2007. In addition, they also performed detailed structural field mapping in 2007 and 2011, ref. (2) and (3). The Engineering companies Aas-Jakobsen and Multiconsult (FPS) performed engineering geological field mapping, assembling of rock and soil information from existing reports and inspections of tunnels/caverns in the project area, ref. (4). In 2009 NB&A ref. (5) performed rock mass characterization of rock exposures for input to the QTBM prognosis model.
Seismic refraction profiling
Seismic surveys had been conducted by Sverre Myklebust A/S in 1993 and by GeoPhysix AS in the period 2008 to 2012. A total of around 7,5 km of seismic profiling was done in the period 2008-2012. The seismic profiling gave information of layering, seismic-velocity, and fracture zones.
Resistivity profiling
NGU conducted resistivity profiling along 19 profiles with a total length of 12 400 m. In this study, both soil cover and fracture zones in bedrock were of interest. Due to this, the data were processed focusing both on horizontal and vertical structures. To get control of technical installations and possible sulphides in bedrock, induced polarization (IP) was measured. An advantage of resistivity profiling is the possibility to provide information about dip and width of fracture zones.
Geotechnical investigation
Information of deposits/soil layers over the tunnel were investigated by soundings for confirmation of bedrock level and for detection of type of soil. Test series of soft deposits/ sediments from areas of special interest were sent for laboratory analysis. Main objective was confirmation of bedrock, and to investigate settlement potential in the soil. About 420 soundings were conducted for the Follo Line project and about 700 soundings from other projects were collected.
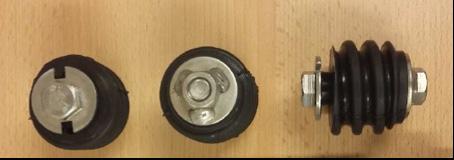
About 130 piezometers in soil for pore pressure measurements was installed for monitoring of pore pressure along the tunnel section. It was considered important to start monitoring some years before the construction work started, in order to document natural seasonal variations in pore pressure. This is described in more details in chapter 15.
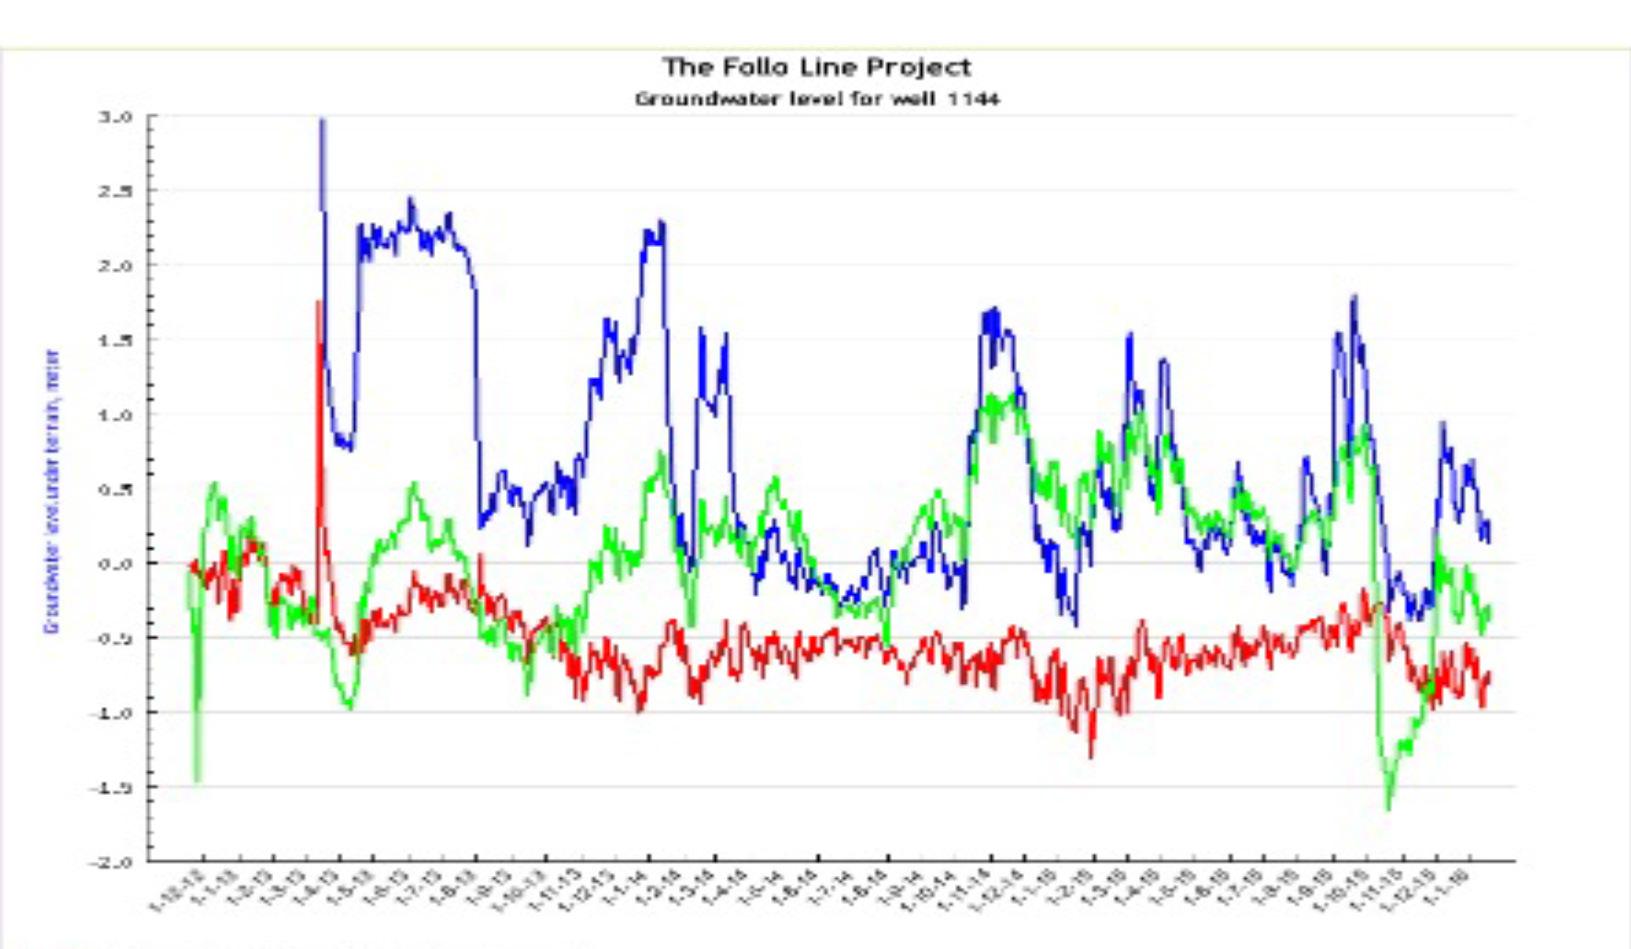
Figure 3-3: Example of ground water monitoring showing natural variations.
Building inspection and existing wells
To get information regarding foundation and condition of buildings prior to construction, an extensive program for inspection of buildings and location of wells along the tunnel alignment were performed. This is described in more details in Chapter 15.

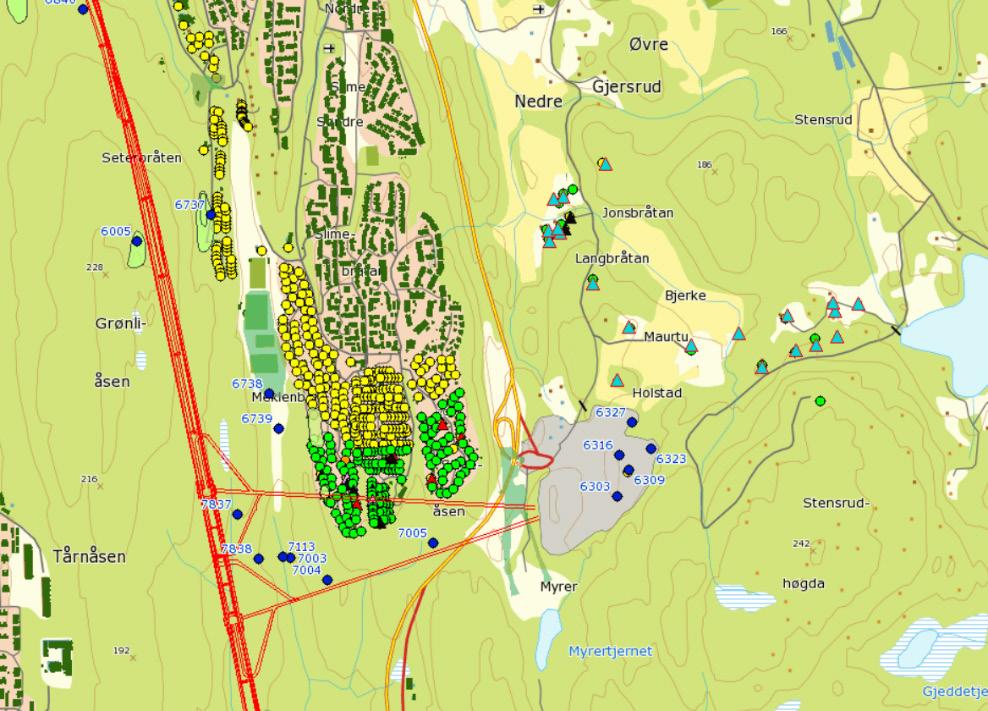
Figure 3-4: Building inspections and located wells at Åsland area.
Core drilling
During the pre-investigation phase, 18 inclined holes was drilled in the project area with a total length of about 2000 m. About 500 Lugeon tests were performed, and 32 core samples were tested by SINTEF Byggforsk for rock mechanical properties. The main purpose of the core drilling was to determine width and character of selected fracture zones, as well as leakage conditions. After the selection of TBM as the excavation method for the main part of the tunnel section, some additional core drillings were performed in solid rock, far from known fracture zones, in order to have undisturbed tests samples.

Figure 3-5: Examples of rock cores from BH 839, 105, 28-110m. Amphibolitic gneiss with garnets.
All core drilled boreholes were logged for rock type, and properties as RQD, joint infill, joint roughness, and degree of weathering, ref (6). All cores were photographed, see figure 3-5.
Well drilling
In connection with this project, a total of 9 rock wells were drilled in an early phase. Four of the wells are located on the plateau from Ekeberg to Nordstrand (chainage km 3.4 to 7.0) and the last borehole was located on Grønliåsen (at chainage km 11.0). The main aim with these boreholes were to get an indication of the groundwater level / pore pressure in the hard rock aquifer, and to verify if a hanging groundwater exists at the upper part of the rock formation. Hence, all the wells have been divided in two sections, one measuring the groundwater level in the upper part of the bedrock formation and another in the lower part of the well. This is described in more detail in chapter 15.
Lugeon / water loss measurements were performed in all holes.

Color Type
Geotechnical investigations
Geotechnical investigations
Number Comment
420 For the Follo Line project
712 From other projects
Laboratory rock samples
Rock wells 32 From cores mainly
9
Core drillings
Seismic profiles
Resistivity profiles 18
59
19
Figure 3-6: Overview of geological pre-investigations performed from 2007-2014.
Rock stress measurement
Rock stress measurements was conducted by SINTEF at three locations, one at Ekeberghallen in the north and two from the adit tunnels at Åsland close to midpoint of the tunnel stretch. The stress measurements show stress vectors significantly higher than theoretical estimations based on the overburden in the area.
Laboratory testing
Laboratory investigation of rock samples have been carried out both on core samples and on blocks of rock. The following testing methods have been used:
• DRI = Drilling Rate Index • CLI = Cutter Life Index • UCS = Unconfined Compressive Strength • PLT = Point Load Test • CAI = Cerchar Abrasion Index • Quartz content • Brazilian Tensile Strength • Modulus of Elasticity and Poisson’s ratio,
In addition, two tests of gouge material were conducted.
Additional pre-investigation performed by contractor
Being an EPC contract, the contractor, AGJV, performed additional pre-investigations in 2015-2016 as part of the detail design process. Additional investigations that were performed:
• 8 core drillings • 9 probe drillings • 17 piezometers • 8 resistivity profiles • 11 seismic profiles
Main results from the pre-investigations
Lithology
The bedrock within the project area consists mainly of Precambrian gneisses and amphibolite. Younger dykes, originating from the Perm period, also occurs. On a short stretch in the northern part of the tunnel, also sedimentary rock, as black shale and limestone, occurs.
The Precambrian gneisses, which occur in the project area, are divided into 3 main groups. The geological map of the NGU-report (2) refers to the following lithologies: • Tonalitic - to granitic gneiss • Quartz-feldspathic gneiss • Biotitic augen gneiss
Detailed registrations in tunnels, caverns and at the surface showed that the different lithological units at a smaller scale have a rather heterogeneous character. In addition to the main groups of rocks, several generations of intrusions occur. Part of the older intrusions still have the character of diabase, while others are transformed into amphibolite and folded into the gneisses. These amphibolite dykes and sills make up a larger portion than the Permian intrusives. The youngest Permian intrusives are both dykes and sills following weak layers in the foliation and along fracture zones. One special intrusion is a 20-30 m thick rhomb porphyry dyke that can be followed from Ekeberg southward over a distance of approximately 15 kms.
In addition, observations from field mapping and core drilled holes showed that amphibolite lenses and intrusives parallel to the foliation occur. About 15 % of the rock lithology in the cores is amphibolite.

Figure 3-7: Precambrian gneiss from the access tunnel area at Åsland.
Fracture zones
The project area is intersected by several fracture zones, also defined as “weakness zones”, as shown on the engineering geological maps, se example in Figure 3-8.
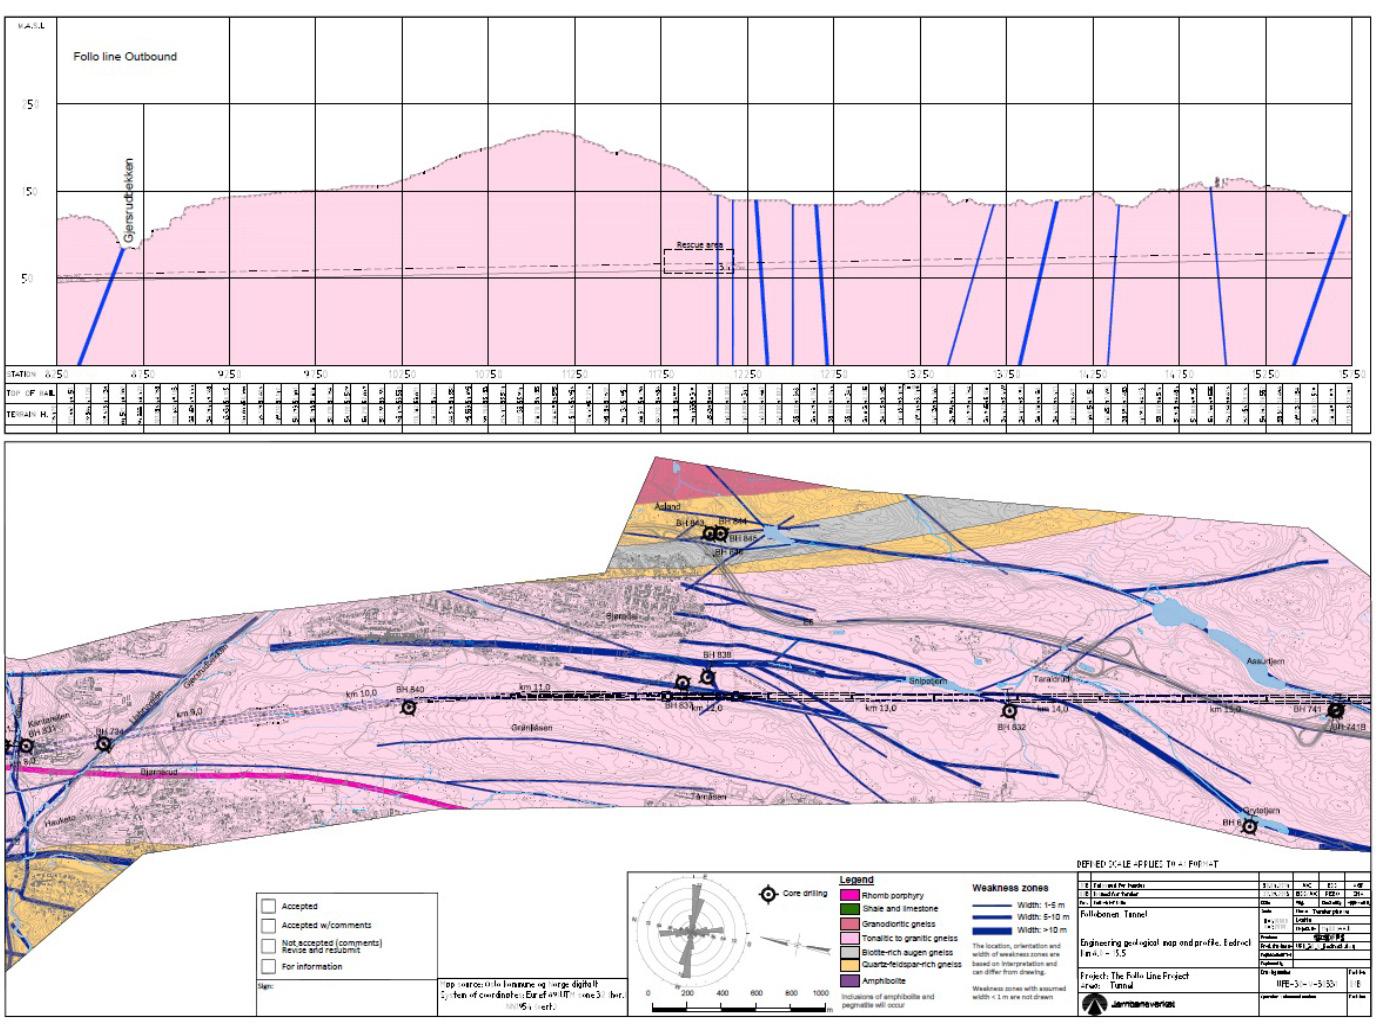
Figure 3-8: Engineering geological map showing fracture zones with a thickness of > 1 meter.
Fracture zones occurred as jointed zones with densely jointed areas, or as crushed zones where the rock material was crushed and showed clay transformation of material, partly also with clay gouges that can range from a few centimetres to several decimetres thick, ref (4).
The zones marked on the geological maps are divided into three categories: Width 1-5 m, 5-10 m and more than 10 m. Fracture zones illustrated on the drawings by one line is normally not one single zone, but often crushed or jointed sections divided by more competent rock sections.
Core drillings were carried out to map the course and characteristics of prominent fracture zones. The most pronounced fracture zones, that were intersected by core drillings, showed crushed sections up to approx. 20 m length in the borehole. The fracture zones were connected to each other. The impact of this was that leakage from one zone, when intersected by the tunnel, could result in reduction of the pore pressure within a large influence area. This is also described in Chapter 15.
Also, the seismic refraction surveys provided information about fracture zones in the rock mass. These registrations described the zone’s course along the surface, but nothing about dip and character towards depth. Most often the seismic measurements showed some overexposure of zones in the surface. Resistivity profiling gave an indication about dip angle for the zones, and interpretations form these profiles were included when preparing the geological profiles.
Zones occurred in two main directions, N-S and E-W. There are deviations from these directions
with some zones oriented in direction NW-SE and NE-SW.
Fracture zones along the N-S direction was of special concern since this is almost parallel with the alignment for long parts of the tunnel.
Jointing
During field mapping, registration of joint character, strike/dip and joint spacing were registered. These observations were grouped for sections of the project area and presented as rosette plots. A rosette plot has been prepared for each of the geological maps, see an example of this in figure 3-8.
Studies of joint registrations showed two main joint sets. One joint set was steeply dipping and had roughly an E-W oriented strike. The other joint set followed the foliation, which mainly was oriented N-S and dipping westwards (35°-90°).
Joint characteristics, roughness and undulation of joints were recorded where these parameters were possible to detect.
The average joint spacing for the various joint sets observed at the surface did not seem to be influenced by the proximity to the fault zones. One reason for this may be that some rock exposures were small, making it difficult to determine the general joint spacing. Another reason might be that random joints were included in the average joint spacing, as these joints did not belong to any joint set. A third reason could be that areas most strongly influenced by the fault zones, usually form soil covered depressions in the terrain and therefore do not show rock exposures at the surface. During excavation, it could be expected to encounter zones more fractured and with closer jointing than what had been mapped at surface exposures.
Joint spacing recorded on rock cores from the core drillings (RQD and joints pr. m) indicated more fractured rock than registered at the surface. However, the results could be misinterpreted, as there is often difficult to decide whether a joint is caused by in situ fracturing or a mechanical break from the drilling operation.
From NB&A Q-tbm report, ref (5), typical range of RQD values are in the range of 75-100 %.
Set
E-W (average spacing)
N-S (average spacing)
Km 2,3-8,0 8-15,5
0,8 0,9
0,5 0,8-1,1
Table 3-1: Average joint spacing from pre-investigations.
15,5-21,3
0,9 (0,2-2)
Rock mass classification
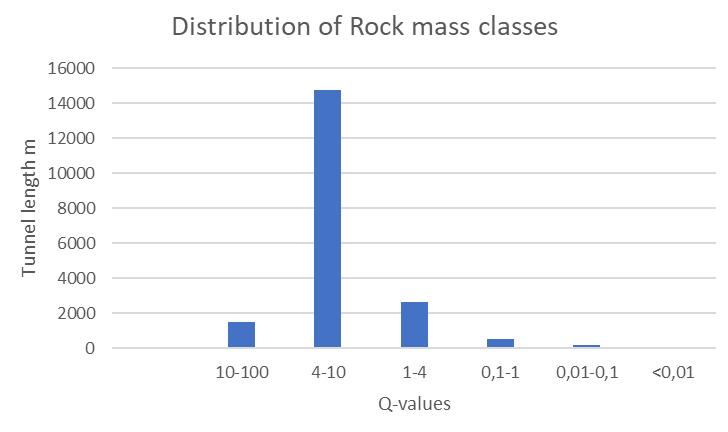
Q-parameter data was collected by Multiconsult for estimating rock support classes, ref (4) and by NB&A for input to the Q TBM prognosis model, ref (5) Distribution of rock mass classes (Q) is shown in figure 3-9 below.
Figure 3-9: Distribution of rock mass classes.
NB&A conducted Q-parameter mapping along the project area, but along a slightly different alignment than the final alignment. The results were divided in two main sections north and south. The collected parameters excluded cores and fracture zones.
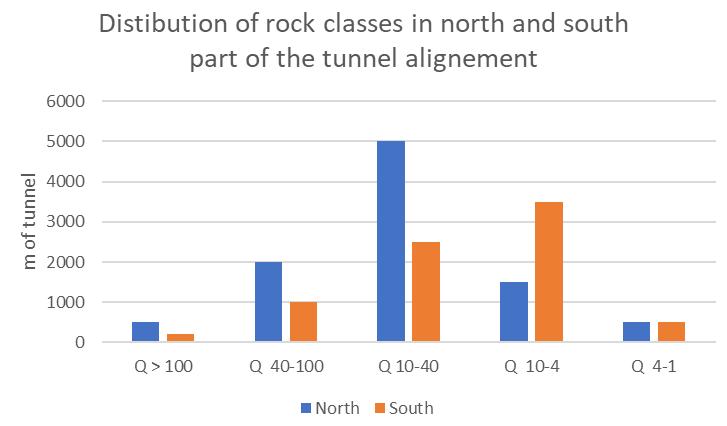
Figure 3-10: Distribution of rock mass classes from the Q TBM field mapping.
Laboratory testing of rock samples, strength properties
About 32 core samples and 8 hand size rock samples were collected and tested for strength and borability properties. A total of around 70 tests were conducted. Table 3-2 below shows typical test results, ref (1).
Lithology
DRI CLI UCS PLT Brazilian tensile strength CAI Quartz Density
MPa Is50 MPa % Kg/m3
Amphibolite 33,5 12,3 188,2 8,8 8,6 3,5 10,1 3136
Pegmatite 52,5 4,5 119,7 7,5 3,8 57,5 2644
Gneiss 38,4 6,6 145,5 8,6 12,1 4 31,4 2681
Table 3-2: Strength properties for different rock types.
Soil and settlement potential
The project area is located below the marine limit (maximum sea level after the last glaciations) which is 220 meter above present sea level in this part of Norway. During several glacial periods, areas with fracture-zones have been more exposed to erosion than areas without fractures and formed wallies and peaks of the rock-surface. Thick layers of marine silt and clay deposits can therefore be found in these wallies within the project area. Normally there is also a moraine layer towards the rock surface. In addition, some limited areas were covered by organic deposits (peat/bog). Both marine- and organic deposits are settlement-sensitive to pore pressure reductions, ref (4). The project area has a limited groundwater extraction potential. Water leakages into the tunnel may occur when the tunnel crosses one of the fracture zones. If the leakage is not stopped, or reduced by pre-grouting during the excavation, the fracture zone, and eventually also the adjected zones, may act as drainage channels, which will reduce the pore pressure in the silt or clay sediments above or within the influence area of the tunnel. This is described in more detail in Chapter 14, “Geological mapping and following up during the TBM excavation” and in Chapter 15, “Groundwater control and monitoring” It is also illustrated in figure 3-11 below where all the lines, added on the ordinary map, represent a network of fracture zones with a thickness of at least one metre. This fracture zones are also illustrated in figure 3-8 above.

Tunnel crossing a fracture zone Tunnel crossing the next zones within the same fracture network Area influenced by crossing of the different fracture zones Thick layers of clay/ silt. Dark green > 10 m Figure 3-11: When the tunnel crosses a fracture zone, the connected network of zones may act as drainage channels and result in reduction of pore-pressure within a large area.
A drop of the pore pressure will result in settlements and damages of buildings and infrastructure founded on these sediments. A number of piezometers (19) were installed during the pre-investigation phase to map the pore pressure at the rock surface below the clay deposits. This is described in more detail in chapter 15, “Groundwater control and monitoring”
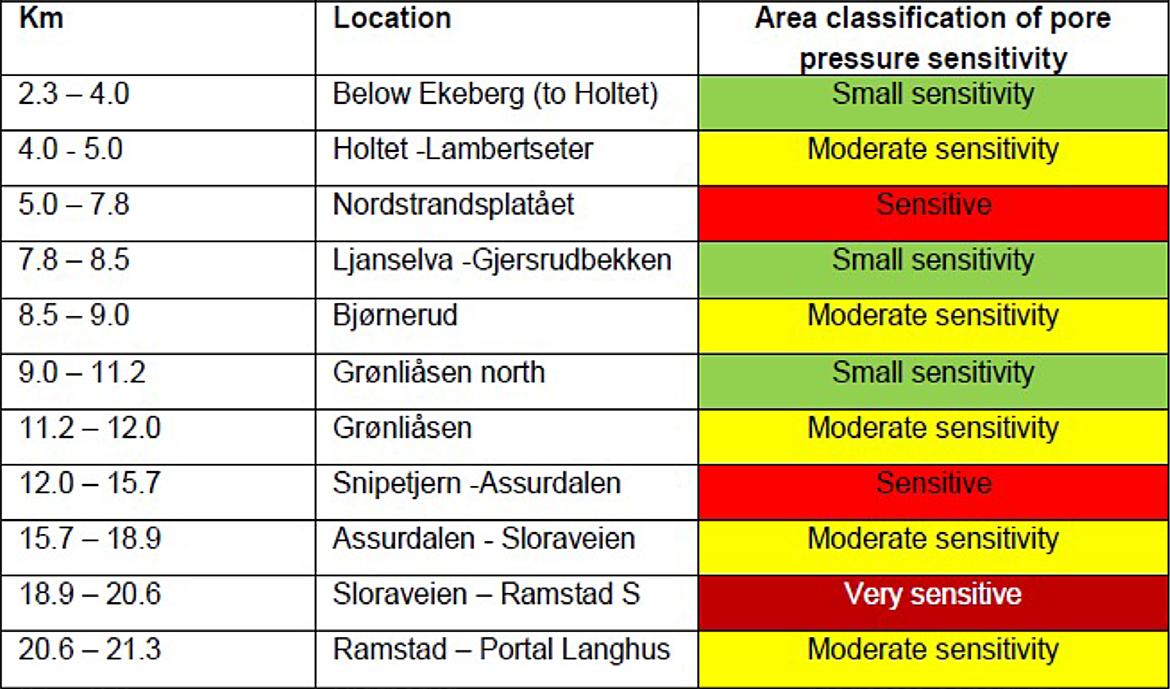
The depth to the rock surface varies from approx. 2.5 m to more than 20 m within the project area. The most vulnerable residential areas above the tunnel were located at the Nordstrand area at km 5 – 8 in the northern part of the tunnel section, and in the south at Ramstad terrace km 19.6 – 20.4.
Hydrogeology
The Follo Line is located east of the Oslo Fiord under catchment areas draining into Bunnefjorden (an arm of the Oslo Fiord). Average annual precipitation is in the range of 705 to 830 millimeter.
Monthly average precipitation
Figure 3-12: Monthly average precipitation for selected, relevant gauges.

Hydraulic conductivity from Lugeon testing
Hydraulic conductivity in the rock mass was calculated based on Lugeon tests. One Lugeon is defined as the water loss in liter/minute/m borehole with an excess pressure of 1 MPa. Ideally one (1) Lugeon corresponds to a hydraulic conductivity of 2,3 ∙10-7 m/s
During the pre-investigation phase, several investigation holes in rock were made, mainly core-drilling, but also some rock wells. Several in situ Lugeon tests were performed in these holes to get a better basis for evaluating rock permeability or potential for water leakages to the tunnel, ref (4). All data from the tests were put together in different categories. • 0-1 L (almost tight) • 1-5 L (small water loss) • 5-20 (medium-high water loss) • >20 (high water loss)
Figure 3a-13 shows data from the pre-investigations divided in these 4 categories in a sector diagram.
Quite a large share, 87 % is in the range 0-5 Lugeon (tight rock or small water loss).
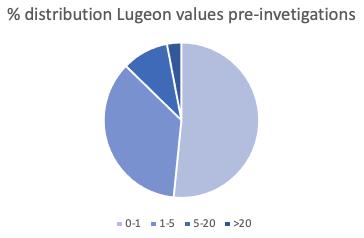
Figure 3-13: Distribution of Lugeon values pre-investigations core holes and rock wells.
References
1. FPS. UFB-30-A-30063 Geotechnical and
Geological Investigations Data Report. 2014. 2. NGU. Geologiske forhold langs planlagt jernbanetrasé Oslo - Ski. Rapport nr. 2007.048. 2007. 3. —. Resistivity measurements and structural geology along the railroad tunnel transect Oslo-
Ski. Report no. 2011.004. 2010. 4. FPS. UFB-30-A-30064_02B: Summary geological data report. 2014. 5. Assosiates, Nick Barton &. Driving prognosis for
TBM by Nick Barton & Assosiates, based on surface mapping and the Q-method. 2009. 6. FPS. UFB-30-A-30062_03B Core drilling report. 2013.
Acciona & Ghella (AGJV) (2019) UFB-31-A-67013 00E. Project: The Follo Line project, EPC TBM. Follobanen, Åsland. Spoil Area. Final Report.
Barnard and Heymann (2015) The effect of bedding errors on the accuracy of plate load tests. J. S. Afr. Inst. Civ. Eng. vol.57 n.1 Midrand Jan./ Mar. 2015
Dahl, Marianne. (2018) Investigation of geotechnical properties of TBMspoil from the Follo Line project. Master- degree thesis for Marianne Dahl. NTNU 2018.
NGI (2016) Report UFB-30-A-70072. Application of TBM spoil as a quality fill for Gjersrud/ Stensrud township. Follobanen. Bane NOR. NGI (2018) Report 20180498-01-R. Kontrolldata fra fylling av borkaks fra Follobanetunnelen. Evaluering av geoteknisk kontroll av fylling av borkaks.
Norwegian Standard NS-EN 12620+NA: «Aggregates for concrete»
Silje Gystad Ytterdal, Elisabeth Grasbakken, Berit G. Petersen. 29.05.2017. “Memo- Evaluation of risk regarding pyrrhotite in aggregates.” Bane NOR, Oslo, Norway.
Statkraft (1986). Prosjekt fullprofilmasser. Materialegenskaper. NGI report 85607-1. 30. may 1986.