World sanitaryware exports and imports Export e import mondiale di sanitari Luca Baraldi - Acimac Research Dept. (studi@acimac.it)
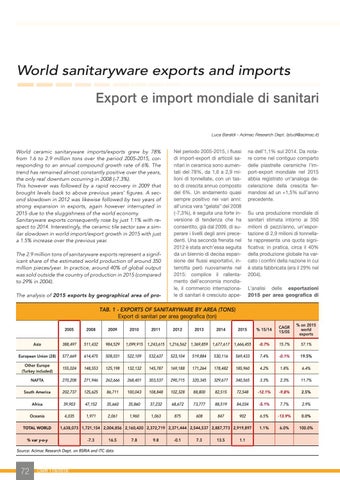
World ceramic sanitaryware imports/exports grew by 78% from 1.6 to 2.9 million tons over the period 2005-2015, corresponding to an annual compound growth rate of 6%. The trend has remained almost constantly positive over the years, the only real downturn occurring in 2008 (-7.3%). This however was followed by a rapid recovery in 2009 that brought levels back to above previous years’ figures. A second slowdown in 2012 was likewise followed by two years of strong expansion in exports, again however interrupted in 2015 due to the sluggishness of the world economy. Sanitaryware exports consequently rose by just 1.1% with respect to 2014. Interestingly, the ceramic tile sector saw a similar slowdown in world import/export growth in 2015 with just a 1.5% increase over the previous year. The 2.9 million tons of sanitaryware exports represent a significant share of the estimated world production of around 350 million pieces/year. In practice, around 40% of global output was sold outside the country of production in 2015 (compared to 29% in 2004). The analysis of 2015 exports by geographical area of pro-
Nel periodo 2005-2015, i flussi di import-export di articoli sanitari in ceramica sono aumentati del 78%, da 1,6 a 2,9 milioni di tonnellate, con un tasso di crescita annuo composto del 6%. Un andamento quasi sempre positivo nei vari anni: all’unica vera “gelata” del 2008 (-7,3%), è seguita una forte inversione di tendenza che ha consentito, già dal 2009, di superare i livelli degli anni precedenti. Una seconda frenata nel 2012 è stata anch’essa seguita da un biennio di decisa espansione dei flussi esportativi, interrotta però nuovamente nel 2015: complice il rallentamento dell’economia mondiale, il commercio internazionale di sanitari è cresciuto appe-
na dell’1,1% sul 2014. Da notare come nel contiguo comparto delle piastrelle ceramiche l’import-export mondiale nel 2015 abbia registrato un’analoga decelerazione della crescita fermandosi ad un +1,5% sull’anno precedente. Su una produzione mondiale di sanitari stimata intorno ai 350 milioni di pezzi/anno, un’esportazione di 2,9 milioni di tonnellate rappresenta una quota significativa: in pratica, circa il 40% della produzione globale ha varcato i confini della nazione in cui è stata fabbricata (era il 29% nel 2004). L’analisi delle esportazioni 2015 per area geografica di
TAB. 1 - EXPORTS OF SANITARYWARE BY AREA (TONS) Export di sanitari per area geografica (ton) 2005
2008
2009
2010
2011
2012
2013
2014
2015
% 15/14
CAGR 15/05
% on 2015 world exports
Asia
388,497
511,432
984,529
1,099,915
1,243,615
1,216,562
1,369,859
1,677,617
1,666,455
-0.7%
15.7%
57.1%
European Union (28)
577,669
614,475
508,031
522,109
532,637
523,104
519,884
530,116
569,433
7.4%
-0.1%
19.5%
Other Europe (Turkey included)
155,024
148,553
125,198
132,132
145,787
169,188
171,264
178,482
185,960
4.2%
1.8%
6.4%
NAFTA
270,208
271,946
262,666
268,401
303,537
290,715
320,345
329,677
340,565
3.3%
2.3%
11.7%
South America
202,737
125,625
86,711
100,043
108,848
102,328
88,800
82,515
72,548
-12.1%
-9.8%
2.5%
Africa
39,903
47,152
35,660
35,860
37,232
68,672
73,777
88,519
84,034
-5.1%
7.7%
2.9%
Oceania
4,035
1,971
2,061
1,960
1,063
875
608
847
902
6.5%
-13.9%
0.0%
1.1%
6.0%
100.0%
TOTAL WORLD
1,638,073 1,721,154 2,004,856 2,160,420 2,372,719 2,371,444 2,544,537 2,887,773 2,919,897
% var y-o-y
-7.3
16.5
Source: Acimac Research Dept. on BSRIA and ITC data
72
CWR 119/2016
7.8
9.8
-0.1
7.3
13.5
1.1