


Economic Persepectivesisthe PerseEconomics magazine dedicatedtostudents,runbystudents.Publishedtermly, EconomicPersepectivesseekstoexplorethecomplexworld ofEconomicsonatheme-by-themebasis.
For the Michaelmas edition, we chose the theme of inequality. Whilst it isn’t on every government’s top priority, almost every policy decision made by the government and its close associates will affect the gradient of privilege within and between economies. Its fragile nature is the spark of never-ending discussion, and this term we felt obliged to extend it to the Perse, given Trump and Labour’s comeback, Rachel Reeves’ notorious budget, and the controversial VAT tax on private schools. Faced with turbulent political times, it is essential to explore the consequences of such decisions on inequality. This edition includes 12 articles, each providing in-depth analysis and exploration of various inequities experienced in today’s world, alongside an additional 2 articles on the world of finance.
As our last edition as editors, we would like to thank everyone involved in the creation, writing and publication of the magazine. It has been a very enjoyable year, and we are grateful to have had the privilege of reading all the amazing articles. Through the process we have learned so much about
Do Income Distribution Policies Affect Inequality Differently at the Global vs. National Level?
More Countries Consider a Universal Basic
On the morning of November 6th, 2024, Mr Donald Trump was set to make history: to become the first US President to be convicted of a crime. With his campaign fundraising able to pay $100 million in legal fees for his cases, here’s how “Make America Great Again”’s biggest fan plans to lead one quarter of the global economy. Those outside of his power – sit tight - we could be in for a rough ride.
bill. If this holds, then the removal of taxes may have little effect on inequality - but is Trump just setting himself up for retirement?
A converse example of disproportionate effect are Trump's plans to ramp up domestic energy production in an effort to lower energy costs, a big part of the cost of living. Even with household income level and energy consumption sharing a positive relationship, lower-income households will indulge in the policy due to the cost occupying a larger proportion of what they take home.

Trump plans to continue with the personal income tax cuts he made in 2017, when he introduced the Tax Cuts and Jobs Act (TCJA). The act provided the greatest relief on marginal tax rates and corporate taxes (cutting this from 21 to 15%), hence continuing the act would disproportionately benefit wealthier Americans, who pay the highest amounts. Analysis from the Congressional Budget Office (CBO) backs this up, calling the cuts regressive.
His claim to cut or even completely remove marginal rates on Social Security will also have the same effect. While this brings the inevitable question of lost government revenue bringing less spending, research has shown that elderly households tend to be income inelastic and that a fuller pocket may be saved for a future healthcare


However, there is reason to rejoice. The TCJA also includes expanding child tax credit, so those with large families, who are typically low-income due to the sizeable cost of raising children, could ease their financial pressure. It seems like Trump is also setting his family up post-retirement.
The most notorious policy changes that have been Trump's favourite since 2015 are tariffs, particularly on China. During this campaign, he announced 10-20% on all imports into America, 60% on all Chinese goods, and potentially 500% on Mexican cars! Rising costs for businesses also reduce wages, especially in import-reliant industries such as manufacturing and agriculture,

their wages, potentially narrowing the gap.
Perhaps the most intriguing policy Trump has mentioned is proposal for localizing minimum wage changes, suggesting that states should control them to match the local economy. Creating minimum wage disparities between states means gaps are created within the low-income band. Reducing the spatial impact of the policy will also mean that minimum wages can be adjusted more frequently and hence by smaller amounts too.

whose workforce is made up of low skill and hence low-income workers.
Increased consumer prices (if passed on) disproportionately affect lowincome individuals, eroding their purchasing power. China and the EU are already planning retaliation tariffs, which could lower US demand and shrink export-based industries. What happened to wanting to 'end inflation'?
Although, tariffs could be the way to 'Make America Great Again' depending on Trump's preferences, of course. Tariff revenues could be used to subsidise American counterpart industries, boosting worker wages if they are passed on. The gains may be offset by the increased costs and there are no specific plans to allocate tariff revenue to local industries.
But not all hope is lost. Trump's crackdown on immigration cannot be ignored. Promises of 'mass deportations' would realistically be stricter border control but could still shrink the US labour force considerably. Giving remaining workers in immigrant-heavy sectors (whose large supply creates lower wages) bargaining power increases
This localization can create competition between neighbouring states. This is also dependent on job availability and real wage unemployment in states offering higher base wages - could the idea is to reduce unemployment within states? Inter-state migration is unlikely given the target audience having low geographical mobility - so this then gives state governments substantial wage-setting power. This may allow minimum wage to keep up with local costs of living, but it is not as simple for inflation. Nevertheless, a state minimum wage is advantageous to a national minimum wage in that a national minimum wage is not guaranteed to be in line with every local cost of living. The minimum wage for financial comfort in Boston will be like that in LA, but both will be much higher than their midwestern counterparts.
But is giving everyone the ability to keep up with their respective costs of living a definite step in the right direction? The policy in itself creates disparity among the lowest earners in the country - only polarizing the rich and poor more. This raises the question of what we consider to be income inequality - is it people meeting their financial needs with varying degrees of comfort or the difference between highest and lowest earner? I will leave that with you to decide.
Varun V - Year 13


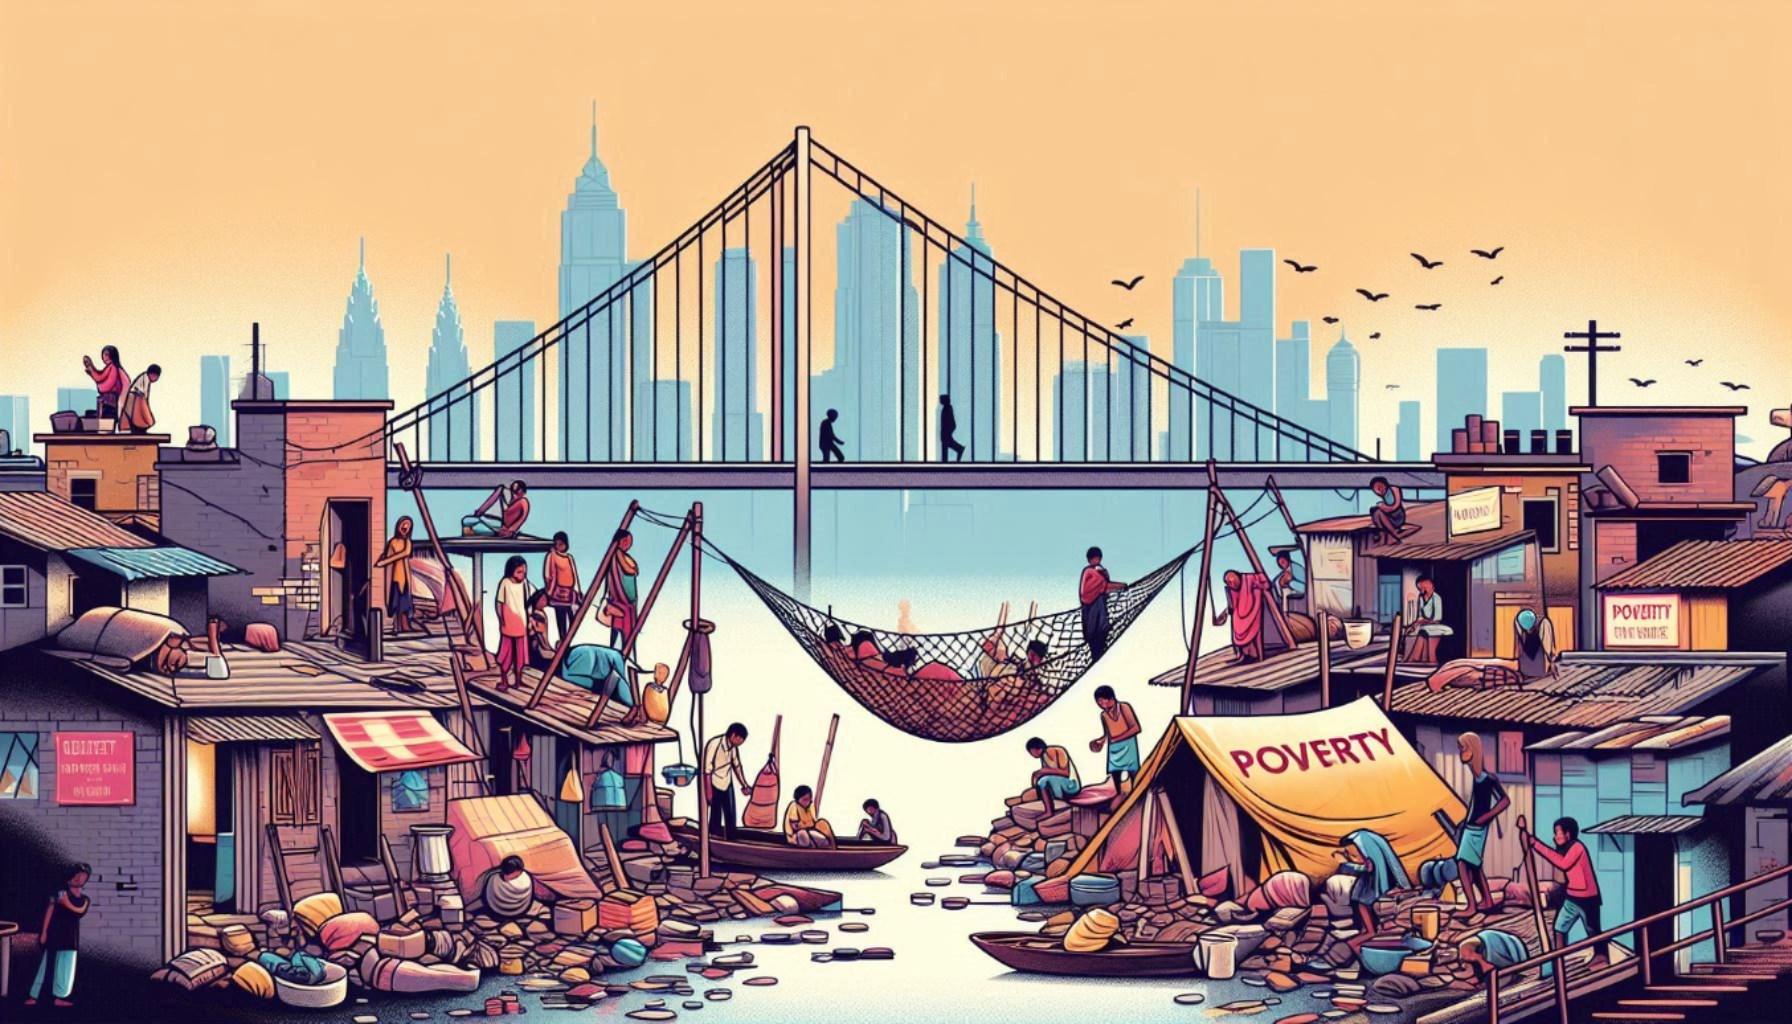
The divide between North Korea and South Korea is remarkable. Following a turbulent history of war and annexation from Japan, the two nations separated in 1948, leaving half of their respective populations in absolute poverty. Whilst the North was confined to Soviet occupation, the more liberal South aligned itself with capitalist values, attracting the interest of the United States. Now, North Korea has a GDP of $29.6 billion, while South Korea has a GDP of $1.7 trillion. Whilst North Korea struggles with 60% of its population living below the poverty line ($2.15 per day), South Korea is prospering with a GDP per capita of $33,121. How can two countries both start from absolute poverty, yet transform into completely opposing nations? Nevertheless, the difference between North Korea and South Korea is only one of many examples of countries escaping the poverty trap. Ultimately, there are many factors at play in determining a country’s success, however the three most important are governance, human and social capital and economic policies.
Strong governance is an essential framework for a
prosperous economy. Through enforcing property rights, transparent institutions and a rigorous judicial system, a stable and competitive business environment is created. Effective property rights are crucial in order to prevent opportunism, giving businesses security to invest, innovate and build wealth without fear of confiscation as their assets are protected. Transparent institutions show honesty and accountability, allowing for productive use of funds which creates a medium of trust and reduces corruption. On the other hand, a strong judicial system binds all aspects together, reinforcing governmental authority and acting as a deterrent for illegal business and political conduct. Not only do transparent institutions and robust governance foster a pro-business environment, yet they also attract foreign direct investment (FDI), a key component of many poor countries’ GDP. Studies have clearly indicated the link between corruption, lack of transparent institutions and mismanagement of funds as a severe deterrent for FDI, thus strong governance is fundamental in
attracting investment. Two countries which have stark differences in governance are Zimbabwe and Botswana. Zimbabwe has a corruption index of 24 (149th in the world), whilst Botswana’s corruption index is 59 (39th in the world). As a result, Zimbabwe receives $0.4bn a year of FDI and Botswana receives $0.67bn a year. At first, the difference may not seem considerable, though given the fact that Zimbabwe has a population of 17 million whilst Botswana has a population of 2 million, the contrast is evident. However, the effects are not only seen in FDI, and the divide is clearest when looking at GDP per capita. Botswana ranks 4th in Africa, with a GDP per capita of $7,250, yet Zimbabwe ranks 17th with a GDP per capita of $1,590.
Human and social capital also plays an indispensable role in escaping poverty. Without fundamental social services such as healthcare and education, growth would be significantly hindered. Education is essential for poor countries as it can help break the generational poverty trap through allowing workers to gain a more advanced skill set. Subsequently, a more educated workforce leads to increased innovation and entrepreneurship, alongside an increase in remittance payments as more skilled workers find jobs abroad. Likewise, secure healthcare provisions allow for a healthy, productive workforce, especially given that many developing countries suffer from epidemics. The Human Capital Index (HCI) measures the amount of human capital that a child born today can expect to attain by the age of 18, given the risks of poor health and education that prevail in the country where they live. South Sudan, the poorest country in the world, has a HCI 0.31, meanwhile the USA has a HCI of 0.7, showing the importance of human capital in the wealth of a country. Social capital undoubtedly plays a fundamental part in economic growth. Through strong narratives, identity and social norms, countries can achieve a faster decrease in poverty, clear examples being Tanzania and Kenya, where Tanzania prioritised social cohesion as a policy as opposed to Kenya who introduced stronger economic policies. However, Tanzania created a more robust foundation where all workers were unified under the same narratives, helping mitigate division. On the contrary, Kenya’s focus on economic policy
disregarded the importance of social capital, ultimately contributing to the Kenyan crash in 2008.
Economic policies and industrialisation are essential in the alleviation of poverty, China being a powerful example of effective economic policy. Heavy industrialisation and its growth to the world's largest manufacturer have been key to escaping poverty. In the 1970s, China was one of the poorest nations, however today it is the second richest country in the world. China accomplished a remarkable feat, achieving the largest global reduction of poverty of 800 million people. Under the Mao regime, China faced a planned economy, focused heavily on agriculture. As a result, this limited China’s growth and contributed to the Great Famine between 1959 and 1961. Following the Mao regime, CCP liberalised trade and allowed foreign direct investment into the country, providing a framework for future reforms. The second wave of major changes occurred in the 1980s and 1990s, when China ultimately joined the World Trade Organization in 2001, resulting in a rapid expansion and becoming the world's largest manufacturing country. The stark opposite of China is North Korea, who under Kim Jong Un’s totalitarian state are stuck in a planned economy, unable to trade and relying on self-sufficiency, deepening its poverty crisis.
Ultimately, a combination of reforms is essential to bring a country out of hardship as no one policy will function by itself whilst a lack of fundamental bases is likely to keep a country in poverty. When looking at the differences between economically developing countries and low-income developing countries, the contrast is stark. Poorer countries are riddled by corruption, lack sufficient public infrastructure and do not adopt suitable economic policy to help reform the nation. On the contrary, economically developing nations and those who have escaped the poverty trap have been able to invest in key resources such as education and healthcare, all whilst creating a stable business environment for economic activity to flourish. Such economic policies contributed to their expansion to the wider world, allowing for more globalisation and further alleviation of poverty.
Octavian M - Year 13
What is the gender pay gap?
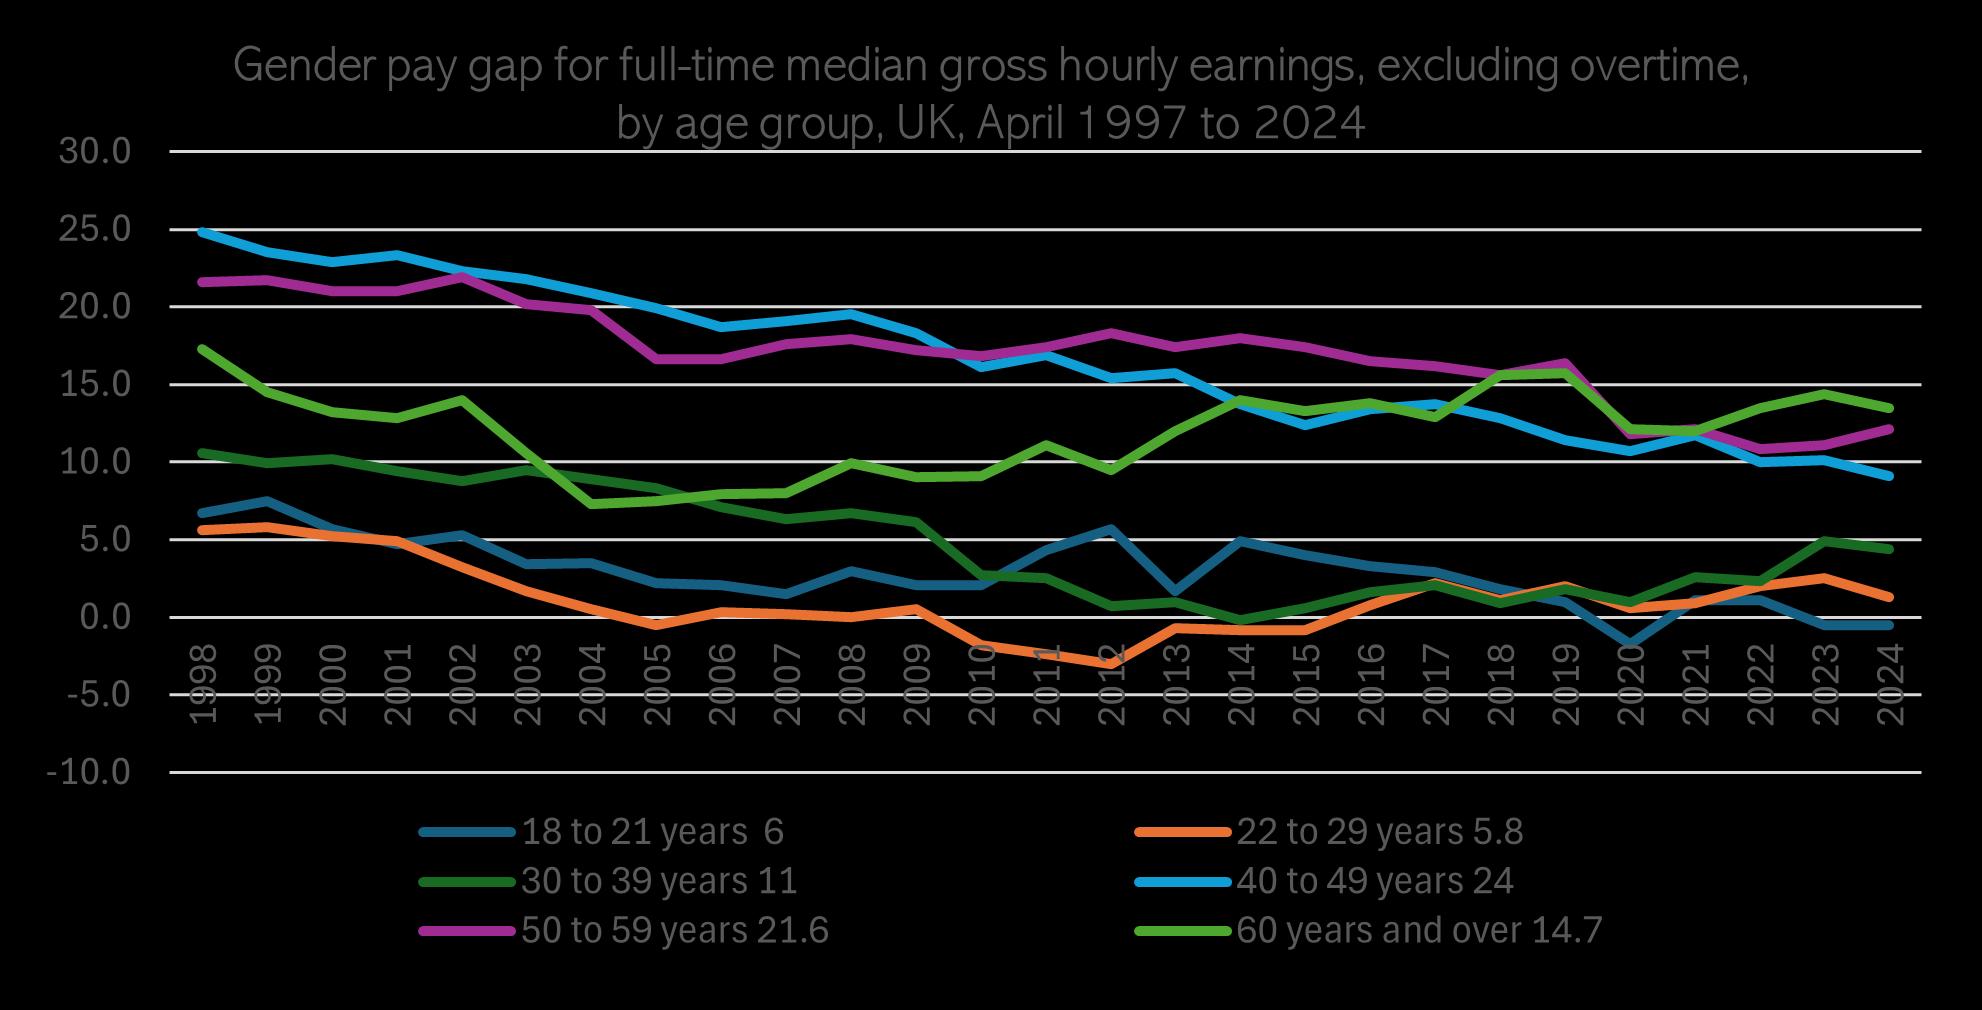
The gender pay gap is the difference in the average earnings between men and women. In the UK, it remains a significant issue, with recent data showing notable disparities. As of April 2024, the gender pay gap difference for full-time employees is reported at 7%, down slightly from 7.5% in 2023. This means that, on average, women earn 93% of what men earn when working full-time. The UK’s average gender pay gap, including all employment (part-time and full-time), is relatively equal compared to other European countries such as Germany (17.6%) and France (17.0%), with the average gender pay gap being at ~ 16.0%. However, the gap for all employees, including part -time workers, is at 13.1%, which is nonetheless an improvement from 14.2% the previous year.
An interpretation is that the high gender pay gap rates mirror the fact that a larger proportion of women in the UK (38%, or ~ 6.01 million women) work part-time, compared to 14% of men (~ 2.3 million men) who are working a part time employment. The hourly wages tend to be lower for a part time job, and so the gender pay gap results are inflated with the low part time wages for more women.
What contributes towards the gender pay gap?
Age, seniority, and the development of job sectors contribute to the gender wage gap, with the
difference being particularly evident among workers that are older than 40.
For instance, employees aged 40-49 experience a 10.1% pay gap in the UK, while those aged 18-21, the pay inequality has decreased from +1.1% to0.2%. However, the highest increase of the pay gap is in the age group of 30-39, where it has increased from 2.3% to 4.7%; the most unequal this age group has been since 2009.
Additionally, the gap widens amongst the high earners. In the top 10% of income earners, women make about 15.5% less than men, while the gap is only 2.7% among the lowest paid 10% . For example, in JPMorgan, for the “high quartile” jobs, the representation of female employees only stands at 26.9% compared to the “low quartile” jobs, where women make up most workers, with 51.3% being female. This is partially due to the segregation of traditional “gender roles,” leading to women being often undervalued and underpaid, compared to their male counterparts. The gender division of labour roles has been rooted in historical biases for multiple centuries, and these are the stereotypes about what a woman should work as, correlating to the salaries and further opportunities that they receive.
In the UK, women hold approximately 77% of the jobs in the health and social care sectors, and about 70% of jobs in the education sector. The average disposable income earned in the health, social and education sectors is usually lower than the average salary of the male-dominated industries such as STEM (Science, Technology, Engineering and Mathematics) careers, where roughly 61% of the work force is male.

The average salary of a person who is eligible to become a teacher, is £34,000 (excl. London), compared to the average salary of a steel engineer (a STEM job), which is ~ £38,690, which highlights how the average salaries of sectors which have a female majority, is significantly lower than the male dominated sectors.
Strategies on reducing the gender pay gap to achieve equality.
Addressing the issues in the labour market requires a variety of approaches that tackle the systematic prejudice that women have to face, where women are disproportionately represented in lower-paying sectors, such as healthcare, education, and social care.
1. Introduce more benefits directed at a full 52 week paid maternity leave, because as of now, companies are not liable for the last 13 weeks of leave, which means that women are only getting 90% of their weekly salaries for 39 weeks, with 13 further weeks of unpaid leave.
2. Allowing more women to hold higher roles and leadership opportunities, by lessening the disparity between women and men in leadership roles. In the promotion process, if the applicant pool were split 50/50 between men and women, the UK
Government projects that only about 35% of the applicants being accepted for further stages would be female. Furthermore, from the 2,000 full time professionals who participated in this survey only 16% of women were promoted, compared to 23% of men. Additionally, only 7% of women reported to have received pay increases compared to 20% of men. Reducing the economic disparity between men and women is an essential step towards a fairer and more inclusive society. It will ensure that men and women will both have equal opportunities, which can also be reached through policies such as a gender quota per each sector, as demonstrated in Iceland, where progressive gender policies have been introduced since the 1960s.
In summary, while there are legal protections against direct discrimination, there is still a subtle and underlying systematic and structural bias against women. More needs to be done against corporations and firms that resist diversity-related efforts, due to a desire to maximise profits and revenue. According to MIT professor Danielle Li “diversity is fundamentally seen as the enemy of performance” for these large companies. This highlights a blatant bias where the inclusion of “diversity” is seen as disruptive, rather than beneficial, and therefore a larger effort is needed to tackle this perception. Diversity is a catalyst of innovation, and so the current toxic work culture needs to recognise diversity as beneficial, instead of harmful.
Many now view the stock market as an indication of economic opportunity and a powerful symbol of wealth and financial success. Even though it can generate money, only some benefit equally. The divide between those who can afford to invest and those who can’t frequently widens. Examining business practices, tax laws, and investor accessibility makes it easy to understand how the stock market can increase inequality.
Unequal
Due to unequal access, the stock market contributes to inequality because lower-income households often lack the disposable income or financial resources to invest. According to a 2020 study, less than 1% of the stock market's worth was held by the poorest 1% of Americans, while the wealthiest 1% owned more than half, despite the fact that 58% of Americans owned equities mostly through retirement accounts. This implies that lower income households don’t benefit nearly as much as wealthier households. The recent increase in tech stocks demonstrates this. Large shareholders and executives, who frequently receive stock-based remuneration, have benefited greatly from the extraordinary value of companies like Apple, Microsoft, and Amazon. Even if their
businesses expand, lower-paid workers receive different rewards than high-level employees who profit directly from stock options. Because of this discrepancy, the wealthy continue to move forward while people without access to stocks continue to lag.
Another element contributing to inequality is how capital gains are treated in terms of taxes. The profits from selling stocks or other investments for a profit, known as capital gains, are subject to a lower tax rate in the U.S. than average salaries.
Long-term investments' maximum capital gains tax rate is 20%, whereas the maximum wage income tax rate is 37%. Wealthy investors, whose income frequently consists of capital gains, can amass wealth under this system at a lower tax cost than wage earners. One of the richest people in the world, Warren Buffett, has frequently emphasised this tax benefit, pointing out that since his income is mainly from investments, his effective tax rate is lower than his secretary's. As a result, the favourable tax rates on capital gains help those with investment income to build wealth more quickly than those relying on wages, intensifying the divide.

Another way the stock market can exacerbate inequality is through company buybacks. When businesses buy back their own stock, the stock price rises because fewer shares are available on the market. Stock options help executives and shareholders, but they frequently come at the expense of larger business investments or employee compensation.
Companies like Apple and ExxonMobil spent billions on stock buybacks following the U.S. Tax Cuts and Employment Act of 2017 rather than increasing salaries or creating employment. Although this strategy rewards large shareholders and raises share prices, it rarely helps the company's longterm viability or workforce. By concentrating money among shareholders rather than dispersing it more widely, buybacks prioritise short-term advantages. Ultimately, this effect transfers negatively to the employees who are compensated less. Once again, this widens the gap between the wealthy shareholders and the employees.
Although the stock market is still a major driver of economic expansion, as this article demonstrates, it also exacerbates economic inequality by providing disproportionate advantages to wealthier investors. Even though the system provides substantial financial benefits, lower-income people are frequently left behind as these advantages are concentrated among those with better access to capital and advantageous tax treatment. A more equitable distribution of wealth might be achieved by reforming aspects such as capital gains taxes, expanding employee stock ownership, and limiting business buybacks that put shareholder value ahead of employee investment. In the end, resolving these differences is crucial to creating an economic climate that supports both prosperity and equity, guaranteeing that the advantages of the stock market extend to a wider range of people and strengthen society overall.
Ashvik G - Year 12
The UK is a very inequal country, as of 2024 the bottom 50% of the population owns less the 5% of the wealth in the country, contrasted to the top 10% holding 57%. This inequality has increased in recent years too (In 1995, the top 10% only held 52.5% of the wealth). To address this successive governments have tried to address this issue, for
example with the previous government’s ‘Levelling up scheme’ which tried to address regional inequalities across the UK. However, in this article we will be primarily looking at how taxation is used to address inequality and how effective it is.
The primary way that taxation is used to tackle
inequality is through having progressive rates of tax, higher for higher earners and lower for lower earners. And then using this tax revenue, primarily in the form of social transfers and the provision of public services like healthcare, to benefit poorer areas and households.
The efficacy of this system however can be highly variable. It works well in countries such as Sweden, Norway and Denmark, all of which have relatively high rates of income tax for top earners and also have stellar public services and are some of the most equal countries in the world with Gini coefficients between 0.2 and 0.3, compared to the UK’s 0.32. Whilst in the UK it is seen as a fairly inefficient system due to the state of public services, for example the UK spends 11.3% of GDP on healthcare, compared with Norway’s 8.1%, despite this Norway has far better health outcomes than the UK as well as less health inequality between its people when it comes to wealth.
Another example to compare to these countries is the US, which also has a progressive tax system, but despite this it is the most inequal developed country in the world with a Gini coefficient of 0.413. This can partly be attributed to a large number of tax loopholes on the system which enable the wealthy to avoid paying large amounts of income tax, as well as a significantly lower rate of tax on capital gains than there is on earned income, which is a measure which benefits the wealthy far more than the poor.
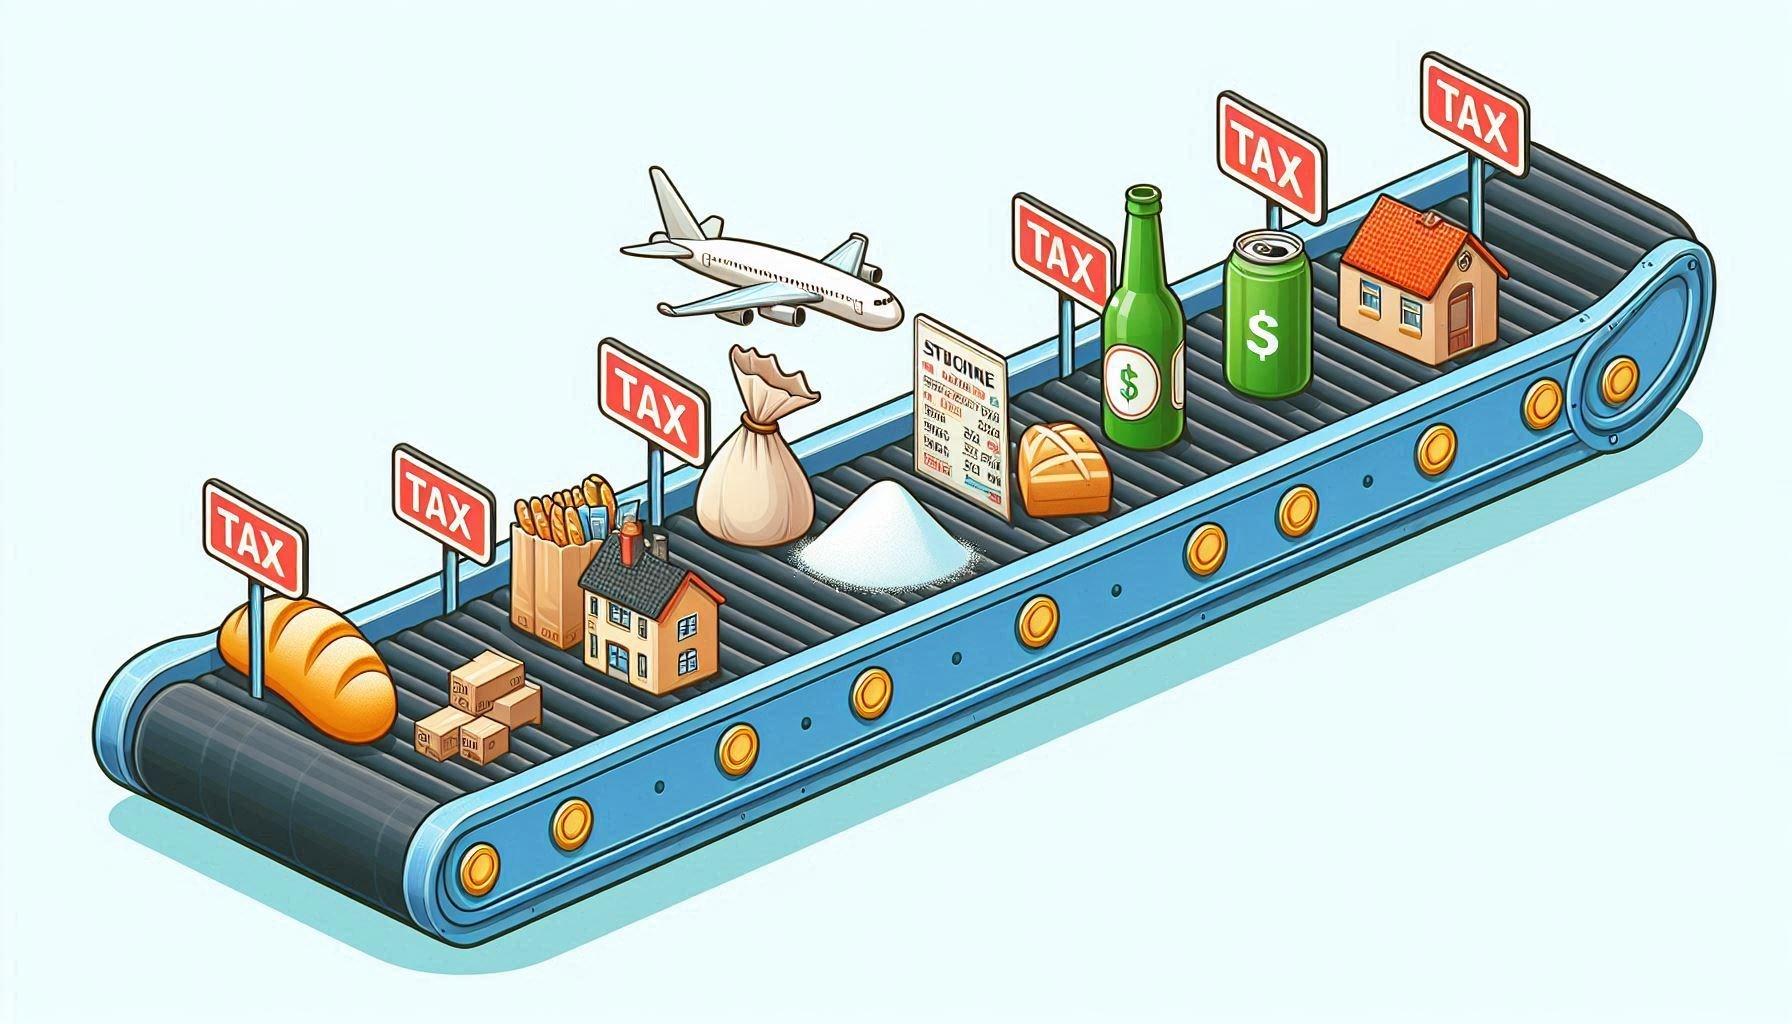
Furthermore, taxation can exacerbate issues of inequality in some cases. Regressive taxes, such as VAT, can increase inequality as
they will take up a higher proportion of a poorer person’s income than a richer person, further exacerbating inequality.
Another issue that affects the efficacy of using high taxes on high earners is that in this very globalised world it is fairly easy for wealthy people to move assets and themselves abroad in order to avoid these high taxes, thereby causing a double amount of damage, as they don’t pay the taxes and the economy is hurt as the amount of consumer spending will go down as they have left the country, thereby reducing the tax take from consumption taxes. This mean that the government would have to raise taxes to maintain the current level of public spending, creating a loop which makes the UK poorer.
In conclusion, taxation can be an efficient way to address inequality in a society, as seen in the Scandinavian countries, however if done inefficiently it can lead to increased levels of inequality as the rich avoid the taxes, or it can end up harming the country and making the country poorer if the government goes too far and the rich leave.


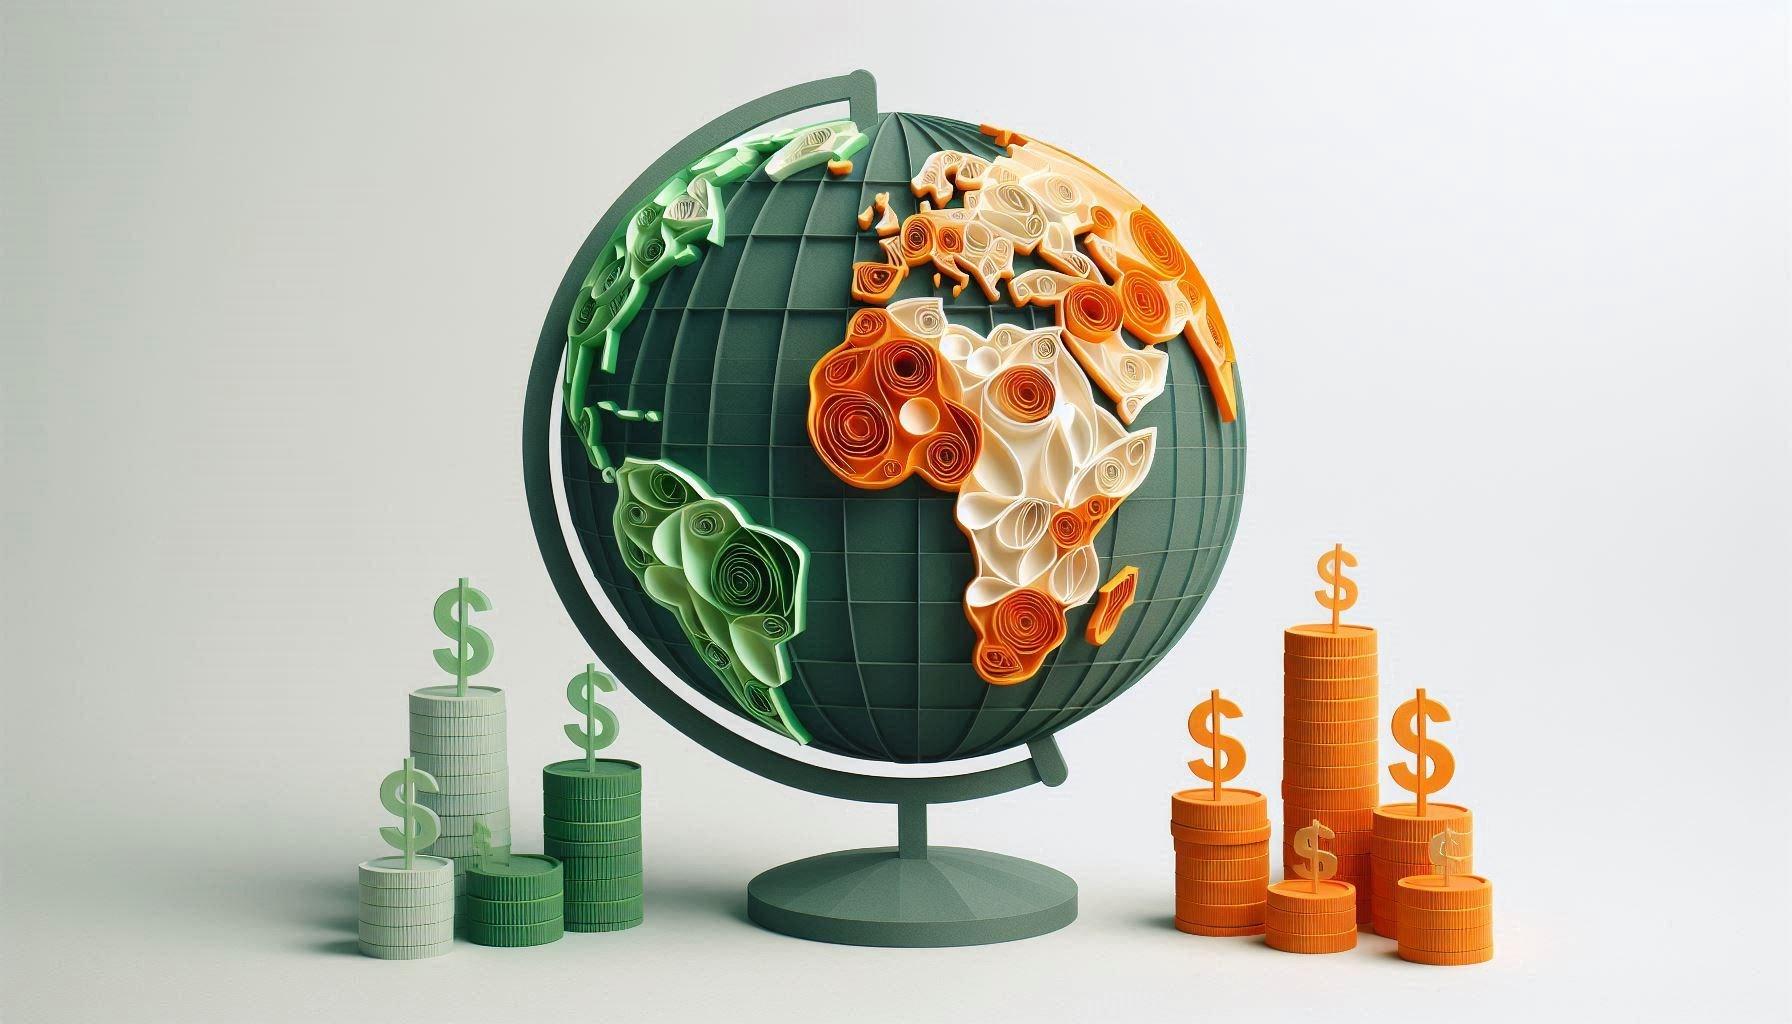
From the streets of London to the markets of Nairobi, income distribution policies shape the economic landscape differently across the world and within nations, raising the question: how do taxation and other redistributive measures affect inequality on both global and national levels?
On a national level, a common method to reduce inequality is a progressive tax system. This allows higher earners to pay a larger percentage of their income in taxes. The goal is to redistribute wealth from the rich to the public through government spending on public services such as healthcare, education and infrastructures which benefit the whole nation. Income inequality can be measured by the Gini coefficient on a scale of from 0-1, where 0 indicates perfect equality and 1 perfect inequality. According to the OECD Taxation and
Income Distribution reports, countries like Denmark have seen success with a progressive tax system, achieving a Gini index of around 0.25. Another policy is the Wealth and Inheritance Tax. Wealth taxes are taxes on total assets a person owns such as property, stocks or other valuable possessions. Meanwhile, inheritance taxes are taxes imposed on the wealth passed down from generations. This redistributes wealth in societies where it is highly concentrated, where the funds are then used to support public services and create a more levelled playing field by preventing the wealthy from accumulating excessive wealth without contributing to society.
Tax policies also have their drawbacks which can exacerbate inequality. Some countries allow regions to have their own tax policies, which leads
to significant variations within the same nation. For example, in America, California has a progressive income tax system with rates ranging from 1% to 13%, generating substantial revenue to fund public services. In contrast, Texas does not impose a state income tax, creating a different approach to funding and resource allocation. Because of these high taxes, California can afford to offer more generous services to low-income residents, reducing economic inequality within the state compared to Texas.
However, on a global scale, the effects of income distribution policies become more nuanced. As there is no unified global system of taxation to address income or wealth distribution across countries, this leaves loopholes where wealthy individuals and multinational corporations can avoid taxation by operating across multiple jurisdictions. For example, practices like profit shifting and base erosion (BEPS) according to the OECD allow for movement of profits from high-tax jurisdictions to low tax-jurisdictions. Essentially, both cases involve companies moving profit towards countries with low to no taxes. An estimate of $100-240 billion is lost annually due to BEPS practices. Furthermore, there are often exploitations of tax havens (a country that offers foreign businesses and individuals little to no tax liability to attract external investment) to avoid paying taxes in higher -tax countries. This would result in the concentration of wealth in certain nations, while developing countries suffer from a loss of tax revenues, thus exacerbating global inequality.
According to the Tax Justice Network, an estimation of more than $11 trillion of global wealth is held offshore in tax havens, which hinders the potential for wealth redistribution through taxation, leaving poorer countries with fewer resources to tackle inequality.
Despite these practices of tax avoidance, there are distributive policies aimed to tackle inequality at a global scale, such as international aid where wealthier nations provide foreign aid to developing countries as a substitute for global tax distribution. According to the World Bank Research on Aid effectiveness, while international aid flows provide necessary and crucial relief to lower-income
countries, they fail to fundamentally alter the inequalities embedded in the root of the global economy. A notable example is the Haiti Earthquake Relief in 2010, where international donors provided Haiti with roughly $13.5 billion of humanitarian aid for essential immediate support, with its GDP consequently growing by 5.5% in 2011. Despite this there is limited long term impact of aid, as seen in 2020 where about 60% of Haitians were still living below the poverty line and 24% lived in extreme poverty (less than $1.23 per day). Subsequently, this highlights disparities on a global scale. Additionally, in recent years there was a strong push for a global minimum tax rate, where the OECD set a minimum tax rate of 15% on profits, designed to curb tax haven practices and close loopholes. As a result, benefits already trickled to countries like Nigeria and Bangladesh with an increase of 5-10% in tax revenues to address healthcare and infrastructure needs, helping reduce poverty and inequality.
In conclusion, tackling inequality requires a comprehensive approach that addresses both national and global challenges. Income distribution policies, such as progressive tax systems and wealth redistribution, can reduce inequality within nations. However, issues like regional tax differences, where states have varying tax rates and loopholes such as tax havens, undermine these efforts. On a global scale, the absence of a unified tax system leaves countries vulnerable to profit shifting and base erosion, with multinational corporations exploiting gaps in tax laws. To further refine these policies and systems, national solutions must involve closing regional tax gaps and strengthening enforcement of progressive taxations. Globally, in addition to pushing for initiatives like the OECD’s minimum tax, reforming international aid to focus on long term development and better cooperations between countries can address the root cause of global inequality. By combining strong national policies with unified global reforms, a more equitable world is within reach, where resources and opportunities are decisively and fairly distributed across borders.
Neil B - Year 12

The Finnish education system stands out globally not just for its high quality but also for its commitments to equality. In many countries, lowincome households are stuck in a poverty trap, where poor conditions lead to low educational outcomes, which in turn reinforce their socioeconomic problems. However, the situation in Finland is different. By providing equal access from early childhood education through to higher education and beyond, the country has built its education system around breaking down barriers to social mobility, giving everyone the opportunity to succeed.
The cornerstone of Finland’s education system is universally free access. All stages of Finnish education are publicly funded, removing a significant financial barrier to education. This means that students coming from lower-income households can break out of the cycle of poverty without the huge burden of student debt. This contrasts with the UK, where tuition fees mean that students must pay £28,605 for a three-year degree, almost a whole year’s earnings at median income.
Finnish schools are mainly funded by the central government, ensuring equal funding. This allows all regions of the country to support their schools, in contrast to other countries where funding is provided based on performance, which would lead to a vicious cycle as the schools with worse performance get less funding which would likely cause grades to drop even further, as was seen in Tony Blair’s education policies. The government’s commitment to funding high quality education can be seen in its high education expenditure at 6.5%, compared to the OECD average of 5%.
All primary and secondary school teachers in Finland must have a master’s degree and have gone through training before becoming a teacher.
In return, the Finnish government provides them with autonomy in the classroom (within the national curriculum). This autonomy feeds into the focus on holistic learning, where education is built around the personal development of the pupils rather than academic achievement. This allows for a collaborative, rather than competitive, environment in schools, improving the emotional wellbeing (and in turn, performance) of students. This holistic education can also be seen in the minimal use of standardised testing, which similarly reduces stress for pupils due to the pressure experienced in exam season. The few exams would particularly support students from lower-income households as they may not have access to private tutoring, which may be needed by some in the leadup to exams.
Finland’s higher education system continues with the same focus on equality seen in primary and secondary education. As mentioned earlier, the lack of tuition fees means everyone can receive tertiary education, no matter their household incomes. Equal opportunities for both university and vocational training mean students will receive high quality education no matter which pathway they take and will be able to secure employment in the future, unlike some other countries where vocational training is neglected as it can be seen as being less prestigious or desirable than university. In Finland, on the other hand, vocational education is available to pave the way to careers in key industries such as healthcare and sustainable energy. Finland also provides financial support for its higher-education students to prevent income inequality. Students receive both a grant and a loan from Kela, the Social Insurance Institution of Finland. The provision of grants and the low interest rates on the loan further reduce the financial burden on students that may prevent
them from going through education elsewhere.
The high quality of the Finnish higher-education system can be seen in the 94% employment rate of Masters graduates a year after employment and 81% for those with further vocational education. While the statistics do not differentiate between employment in Finland and abroad, Finnish students are likely to be able to enter job markets across the world due to high quality education in English as well as languages such as Swedish, French and German.
However, in Finland, education does not stop at university. The importance of adult education is recognised in the Finnish educational system, which provides personal and professional development throughout an individual’s career through continuation of university-level education, local community education centres or governmentrun programs. This is particularly important for people working in industries that may be eroded in the future, such as the petroleum industry (which makes up 8% of Finnish exports) as climate change concerns cause global demand to fall. Without high quality re-education opportunities, these workers can fall into structural unemployment and poverty, as is seen in former coal-mining towns of Northern England, where child poverty is 30%, 8 percentage points higher than the national average. In Finland, however, their retraining programmes will hopefully prevent such disparities. This high-quality adult education is highlighted by Finland’s 100% adult literacy rate.
All of these measures, in combination with other government policies focused on social welfare, mean that Finland has a Gini coefficient (a measure of a country’s income inequality, where 0 is pure equality and 1 is pure inequality) of 0.277 according to the World Bank, making it the 17th
most equal country in the world. While other countries cannot implement a direct copy of Finland’s education system, there are still aspects of it that could help solve problems elsewhere. For example, a 2022 YouGov pol in the UK, in support of the Times Education Commission Report, found that 56% of parents felt the British emphasis on tests and qualifications negatively affects children’s mental wellbeing, which could be improved with a more holistic approach. The US, with $1.7 trillion of student debt, could also look to Finland’s student finance system for solutions.
Nonetheless, policies would obviously need to be adapted to the local context. Finland has a very large tax burden to fund the entire education system (as well as other public services), and the tax rises needed may be politically unpopular elsewhere. Different cultural values may also impact attitudes towards an education system like Finland’s.
Overall, while the Finnish education model is not perfect, it remains a trailblazer in universally accessible holistic education. Throughout all stages of life, Finland ensures that there are no economic barriers preventing access to education. Nonetheless, despite these strengths, the system has issues too. Some critics feel that the Sámi people in northern Finland are deprived of the educational opportunities available elsewhere, while others feel that in the pursuit of equality, the system may have sacrificed educational quality. Still, while education systems are not “one size fits all” and different approaches will suit different countries and different cultures, the Finnish model of education offers valuable insights into how a country can use education to promote socioeconomic mobility and create opportunities for every child to build a brighter future.
Matt K - Year
13

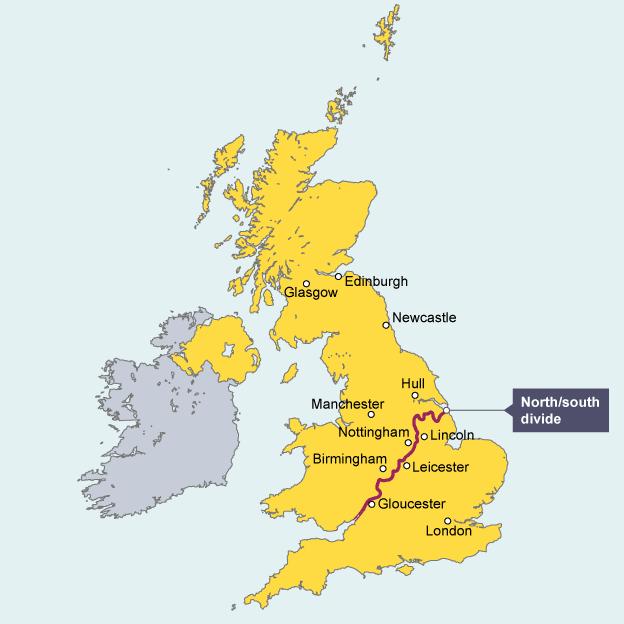
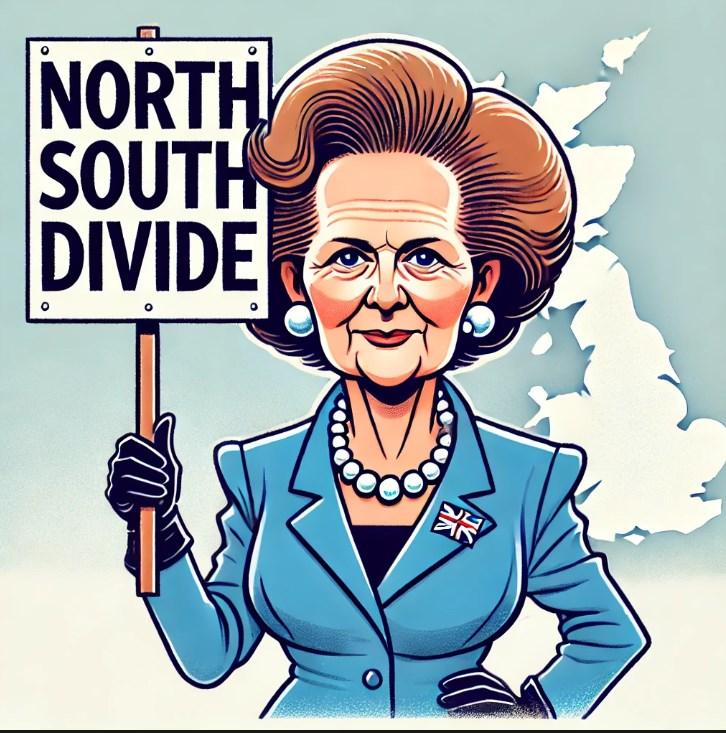
For decades in the UK there have been discussions over the North South divide and many issues surrounding it. Perhaps some would argue that this is the fault of government intervention, for example the Thatcher government which saw the closure of thousands of businesses predominantly in the North of England, Scotland and Wales which lead to this growing divide, however there is another side to the story and that is what role do individual firms play in the inequality. Firstly, it is important to define what is meant by the North South divide which is economic inequalities in two areas of the UK, but the more debated issue is where does the divide lie.
The picture on the following page is taken from the BBC which clearly shows where they believe the North South divide lies. However, there are still limitations to this such as ‘Birmingham’ which is in the ‘West Midlands’ but on this map, it appears in the North. Other maps label it higher and split it using GDP per capita as an indicator.
Firstly, one must agree that to some extent the fault of the North South divide lies with the
governments. Since the 1980s the North South divide has only worsened, with increased money being reinvested into the South in particular London and its home counties as opposed to being evenly distributed across the UK. According to the UK government in 2022-23 the Northwest of region of England received 11% of the UK government spending as opposed to London receiving 15% and the Southeast receiving 12%. Furthermore, government spending per person In the North of England is £7,500 as opposed to £9,500 in the South. This clearly shows that annually even to this day, the North South divide is worsening due to the government intervention as this economic inequality becomes more apparent year on year. There are also social aspects related to this for example government spending includes hospitals which explains the fact life expectancy is 4 years higher in the South (79) than the North. Perhaps it is no surprise that London, the capital, is receiving the highest amount due to the fact it has to stay competitive with other cities and act attractive and competitive in foreign markets for example around 40% of the world’s foreign
equities are traded in London as well as being home to many international companies headquarters such as HSBC so it needs to have sufficient funding to keep its reputation. This provides a sufficient explanation for why London is receiving substantial amounts of funding however it does leave people on the Northern side of the North South divide feeling isolated. This small % change in what they receive can have large scale impacts especially because year on year, since the 1980s the north has been left isolated and without support, they struggled to grow.
However, the government are not solely to blame for the issue of North South divide due to new government schemes that have been introduced. For example, in 2019 the conservative manifesto promised to introduce the ‘levelling up scheme’. it is a scheme that focuses on reducing the imbalance of economic issues between the North and South through investment. Examples of the scheme in action are 208 million pounds was injected into Northern cities, 90million in Blackpool to renovate homes, 67million in Sheffield to help build homes on brownfield sites, and 31 million in Liverpool for investment projects. It is important to mention though that the scheme wanted to do this sustainably and this means not to the detriment of the prosperous areas in the UK. For example, increase the funding in the North however to do this they will not find the money by decreasing funding in the South. This led to many issues as many in the North questioned whether the scheme was possible to complete and that it was unfair because their growth was stunted by funding in the South so why are not the government prepared to
reverse the investment. But the answer is simple, London is the capital, London is the home of the Buckingham Palace and thus our monarchy, and it is home to the houses of parliament. It is highly unlikely therefore that the government would want to reduce spending thus worsening the North South divide. The government also attempted to introduce other schemes such as the Northern powerhouse in 2015 which planned to add 100billion pounds to Northern regional economies and create an additional 850,000 jobs in the North. This was a strategy aimed to reduce the North South divide due to the fact it invited businesses to set up in North, predominantly industrial ones to create an industrial economy in the North. It also aims to evenly spread economic growth by devolving power and budget to local mayors so decisions in the North are made by the North. This would help strengthen the UK economy due primarily to the fact it would help diversify the economy from a service based economy (80% of the UK GDP comes from service-based jobs) to one that also does more manufacturing (manufacturing currently occupies 10% of the UK GDP.) Another notable mention is HS2. Although that project has now been terminated it was expected to create 40,000 jobs and £40 bn for the UK economy, which would have similar effects to the other project.
However, whilst we have considered the ins and outs of the government trying to tackle this economic issue there is also the less spoken about side of responsibility firms play in this. The average wage in the Northeast of England in 2023 was £31,200 (according to indeed.com) . In 2023 in the South, it was £36,560 which is higher than the UK average of £34,963 (from Statist). Thiss would thus suggest that in the South of England there are higher paid jobs and a more skilled workforce. A more skilled workforce would incentivise firms to set up in the South. An example of this is Cambridge and Oxford, where firms such as AstraZeneca have set up its headquarters in Cambridge and are likely to recruit educated people from the universities. There is set to be a new powerplant built in Oxford in 2025 which is likely due to a similar reason. The fact firms are setting up in the South due to this skilled workforce, and it
is also notable to mention many of these jobs created are high paid jobs, it is not really down to the government as they can’t control where the good universities are. It of course makes sense that firms would therefore prefer to set up in areas where there is a skilled workforce and unfortunately as schools in the South are sometimes seen as better than the North it is likely that without sufficient investment into education it is likely that this trend of hiring in the South will continue. With firms setting up in the South this worsens the North South divide due to the fact there are less jobs in the north. For example, in the Northeast, Northwest Yorkshire and the Humber there is 1.1 million businesses and 7.7million jobs compared to 6.3 million jobs in London alone (December 2022). 300,000 of these workers in London are employed by technology companies such as Google which can generally be seen as higher paid jobs. With an increase in the number of jobs we would see an increase in economic activity due to the fact there can be more spending, these means that fewer jobs in the North will lead to less economic prosperity which is shown by the fact the North of England generates 343billion pounds for the economy which contribute to 19% of the UK total economy. However, the Southeast contributes 12% of the GDP and with London included 38% of
the UK total GDP comes from the London and the Southeast. Furthermore, an example of a firm moving up North and it helping is in 2011 the BBC moved their headquarters to Manchester; this employs around 3200 people across 26 departments. The reason the BBC decided to move MediaCityUK to Salford Quays was in order to boost the Manchester media industry, and to better represent the North of England more proportionally. It must also be highlighted that they also decided to make this move due to cheaper operating costs in the North. For example, the average house price in Northumberland in August 2024 was £211,000 as opposed to £491,000 in Cambridge at the same time. Cheaper land and offices make it easier for firms to set up there which should incentivise other firms to move up North which in turn would decrease the North South divide. This therefore shows that firms perhaps have a part to play in the North South divide due to the fact they prefer to set up in the South leading to more jobs and more economic activity in the south thus worsening the divide.
Another reason there is an argument to suggest why firms are responsible for the North South divide is due to the fact during the industrial revolution the North used to be very affluent. This

is due to the fact in cities such as Sheffield, Birmingham, and Manchester used to produce lots of goods and had large factories which provided jobs and money to the Northern economy. Furthermore during the industrial revolution, the North was highly profitable due to the fact they had more coal resources than the South, this made it a desirable area for mines to open which created jobs but also the North had more railway lines than the South which helped promote economic growth during this time. This clearly shows that when the North had sufficient firms and jobs it was still competitive and, in some aspects, richer than the South. Furthermore, whilst this disparity became apparent after the industrial revolution a modern example is in the 2009 recession. In 2009 unemployment in the Northeast was at 5.5% however it was only 4% in London. In addition to this after the recession unemployment rates quickly dropped in the south however, they did not begin to fall until 2011 in the North. This shows that as previously mentioned there are less firms in the North due to many closing and new ones not setting up there that economic activity is continuing to be lower than the South. Perhaps if so many of these firms did not close post the industrial revolution, then maybe there would still be more jobs and rates of unemployment would not be so high and the disparity between North and South would decrease. Perhaps this offers evidence that if the government incentivised schemes like ‘The northern powerhouse’ and if firms agreed to set up North firms could help reduce the economic inequaility in the UK.
Finally, another reason it is not the fault of the government for the North South divide is the effect of tourism. In 2019 the UK had one of the highest tourism spend in the world at 91bn. The largest attraction to this is London where there are amenities and home to Buckingham Palace. It is estimated that the royal family alone contribute 58 million pounds a year to the tourism sector. Also, often the money that is generated via tourism is reinvested back into that area as to stay a tourist attraction or make it a more attractive attraction (add a new railway to
improve accessibility). Perhaps if firms and tourism companies focused on attracting more tourists to the North of England this would help reduce the North South divide as not only would it contribute to the northern economy due to the money people spend at the sites but also create more jobs and more revenue for local amenities such as hotels. This would have a multiplier effect in increasing economic activity and thus if firms could attract more visitors to the North the North South divide could decrease.
In conclusion, I believe that to a significant extent the fault of the North South divide lays within the government. The main reason for this was before privatisation and the closure of many Northern business the north economy was highly active its estimated that Thatcher closed 40 state owned UK companies costing 600,000 workers their jobs. Sectors which were hit the largest seemed to be gas, electricity, many coal mines and water companies. Unfortunately, these sectors also seemed to be the ones predominantly based in the North. The Daily Mirror thus labelled Margret Thatcher ‘the woman who divided a nation’ not only politically but with reference to the North South divide offering evidence to the fact the government seem mainly responsible.
Luke F - Year 12

The basic theory of a Universal Basic Income (UBI) dictates that every single resident within a country should receive the same lump sum of money on a regular basis (e.g. Everyone gets £1000 per month) with no strings attached. Many figureheads have got behind the idea including Martin Luther King Jr, Richard Branson, and Elon Musk. However, what is essentially a simplified benefits scheme for the masses may seem promising on the surface, many questions quickly arise concerning various flaws in the concept of it. In this article I will explore whether or not the benefits outweigh the potential downsides and if the implementation of UBI could be at all feasible.

The case for a UBI
Many argue that modern benefit schemes around the world are overcomplicated. The countless labour hours of administration needed to run them place a heavy monetary burden on governments (£265.5bn for the UK government in 2023) as well as the often-disputed issue of who does and does not qualify for these benefits. Furthermore, where benefit schemes should ideally provide a baseline to help people while they get back on their feet or find necessary support, often schemes leave the receivers of benefits in a situation where it is in fact better for them not to work at all as by doing so, they may lose entitlement. This can come around in instances where the benefits payment is set at a certain income level where if you even go slightly
above it, you lose entitlement to all benefits. A UBI would solve these issues for the most part as the only decision is the size of the payment and all you need to be to qualify is a legal citizen of the country.
In addition to the comparable advantages to many current benefit systems, the sheer level of taxation and redistribution can also be seen as a positive. With income inequality getting worse all around the world, especially the top 0.1%, a UBI could potentially provide a needed boost to those lagging behind. In addition, many studies have shown that because of the higher marginal propensity to consume that many of those receiving benefits will have, as well as the multiplier effect, these benefits
euros) so people could still not depend on it for a living, it was perhaps more of a slightly higher starting platform which in turn boosted motivation to get a job. The most positive outcome of this experiment however, was probably the significant boost in wellbeing reported across the board with participants reporting lower levels of most major negative emotions. This was most likely due to less concern about money but also perhaps due to other opportunities becoming available to them.
It isn't all perfect though.
If asked about flaws of such a scheme, a fairly standard response would centre around the fact that it would require large amounts of funds that would not be readily available to many governments globally and yes, that is indeed the case. In order to provide a substantial payment to each citizen, governments would inevitably have to raise taxes. Now, the level of rise could be counterbalanced with the money gained from abolishing current welfare systems (just under £4000 /person) but this would almost certainly not be enough.
will boost the economy significantly more than if it mainly resides in the hands of the richest.
During the years of 2017/18, this theory was put to the test by the Finnish Government and the results may appear surprising. Initially, it would seem that a basic income would lead to a decrease in employment rates as people no longer feel the need to work. At the start of this experiment, both groups had similar levels of unemployment but by the end of the two year period, there was in fact a statistical difference whereby the test group (i.e. The one that received a UBI) had much higher employment levels. This was perhaps triggered by the fact that it was a relatively small income (560
There are many ways that this tax could be raised - some which would be more popular than others. For example, although a VAT rise could be relatively easy to implement in some countries, the regressive nature of the way it works would hinder the reduction of inequality as those in the lowest income classes end up paying a higher percentage of their income towards the tax. The most likely source of this large amount of tax money would probably have to be a tax that mostly affects the ultra-wealthy such as a wealth tax. Other options include a financial transactions tax, corporate taxes or potentially a Carbon tax which would be difficult to implement as measuring the release of Carbon would be hard to control and put numbers to as well as raising questions of who is ultimately responsible for the release of the Carbon.
Other major problems include the initial debates on how much the income would actually total to, some may argue for a below living wage so people have to work, some for one that is just liveable and some even higher. This could pave the way to very populism based political campaigns whereby parties offering higher UBI's may attract more voters and then never fulfil these promises. Finally, there is also the uncertainty surrounding the concept, although trials have been run, they have all been relatively small scale (i.e. Constricted to a smallish geographical area or a small number of people nationwide - the Finnish trial was restricted to 2000 people and some have been even smaller with German trials only involving 500) and thus cannot definitively conclude that a full implementation of this concept would actually work.
The idea has gained momentum over the years and rightly so as it promises a lot, however, without extremely careful consideration, it simply cannot be
integrated as it would be incredibly difficult to implement with various demographic groups having differing opinions on it. In addition, some economies are potentially in a better position for one than others. For example, less developed economies may find that a solid base for everyone taken from their ultra-rich is beneficial as it allows options such as the creation of new businesses without worry about income for a certain period of time. Contrastingly though, advanced economies may struggle with the implementation and instead should perhaps just focus on the refinement of their current benefit system. With this being said however, I do believe the idea has merit and yes, more countries should be seriously considering a UBI as a replacement for their current welfare system.


An inheritance tax is a one-time payment imposed on the heirs who inherit the wealth of an individual after that person dies. Such a tax is paid out of a person’s estate, whether that be in the form of property, possessions, or money. It seems important to reiterate this, as there is a significant difference between a wealth tax and an inheritance tax – where a wealth tax is imposed only on the owner of the wealth and is levied annually based on the current market value of their assets. Now of course, there could be such thing as a one-off wealth tax – in response to a particular crisis –which would be based on the value of assets at that date; crucially, this is still different from an inheritance tax.
Whilst there were speculations around Rachel Reeves introducing a wealth tax into the UK’s budget, it did not come into fruition – in fact, the last time a wealth tax was a genuine possibility in the UK was 50 years ago under another Labour Government (which had also decided against it). There were however changes in capital gains tax, with the lower rate increasing from 10% to 18% and the higher rate from 20% to 24% - may think this is effectively the same as a wealth tax, and whilst similar in many ways, it is most certainly not. This is because CGT focuses on realised wealth rather than the potential market value focussed on by a wealth tax.
Moving onto inheritance taxes, Rachel Reeves had certainly adjusted their state in the Autumn 2024 Budget. But what do these changes in inheritance tax mean for the people of Britain? And what do they suggest about the future of economic equity when concerning the groups affected?
It is perhaps most strikingly clear that farmers and in particular, family businesses would be affected the heaviest by an APR tax relief cap at only £1,000,000 from April 2026. Previously, APR tax relief enabled small family farms to be handed down over generations – keeping the local industry. However, by creating such a low cap, the Chancellor has made it so that only the very smallest estates are protected – in most scenarios, family farms would not be able to escape the inheritance payment. This has a twofold effect, where we will see not only a rise in commercial ‘mega-farms’ because of heirs not being able to withstand the imposed payment, but also as a result of this the future of historically great estates is put into question – with their local roots being sacrificed when bought by large farming businesses, who would likely only hope to increase produce yield rather than protect the estate’s natural beauty. These APR tax relief changes are ‘nothing short of a betrayal’ according to Victoria Vyvyan, the president of the Country Land and Business Association, due to a promise made last year by the Secretary of State – claiming that they

‘have no intention of changing APR’. For this very reason, it seems like there is very little economic consideration from the Chancellor towards Great British Farmers, who are forsaken by a budget that ensures future generations will not be able to continue their families’ work. However, it isn’t all overwhelmingly bad news for the industry – the potential forced sale of land from larger farms may help more newcomers get into farming which, assuming they can survive, would only help the diversity of farming practices in Britain.
Whilst AIM ISAs had previously qualified mostly for business property relief (therefore are exempt from inheritance tax), Reeves made it so that a 20% effective rate would be the norm from April 2026. This adjustment from 0 is not as clear-cut in its effects when compared to the £1,000,000 asset cap – it could have one of two outcomes, either creating a loophole for investors to exploit or boosting UK small-cap investing. The latter outcome could be since, even though there is an increased rate, it is still lower than the 40% inheritance tax on non-business assets – therefore in a broader context, an AIM-listed share could be an attractive option for long-term investments. Furthermore, in making these smaller companies more attractive to invest in (venture-style) we could see better support for early-stage businesses that are at the forefront of innovation. However, the lower rate for AIM ISAs could be a pathway for wealth preservation of high-net-worth individuals –
they could sell other assets and invest into AIM stocks, benefiting from the lower rate of 20% and avoiding the higher IHT on real estate. Furthermore, along the same line of reasoning investors could establish family investment trusts through holding AIM shares – enabling heirs to inherit the shares without triggering the full IHT liability, rather preserving wealth through the lower 20% IHT rate.
It seems to go without saying that an IHT introduction on pension wealth from April 2027 would have an equally adverse effect on the heirs of such wealth. However, what may be less obvious is the effect this has on those whose pension will be passed down – because there is clearly less incentive to hold any leftover funds or death benefits, we may see an increase spending on their behalf. Therefore, it is entirely possible that the inheritance tax on pensions will have very little effect on raising any meaningful sum of money.
In summary, these raises in inheritance tax will not only hit the wealthy, but also the working population and smaller businesses who will be clearly hindered by such low relief caps. Resulting in a potential weakening of British industry, despite this clearly not being the intention.
Teddie C - Year 12

When controlling a virus, one questions as to how many have contracted an infectious virus. In epidemiology, this has a number, R0, or the basic reproduction number. R0 is the expected number of people one infectious person is likely to infect with the virus. The critical threshold for this number is 1. If lower, the disease will perish within the population. If higher, the disease will spread faster. During the early months of 2020, R0 for COVID-19 was measured to be between 2.8 and 3.3. For context, the Ebola outbreak was between 1.5 and 2.5.
What is most interesting about R0 is that it is not just a biological number, considering how a virus can bind to others, but also a social number. If someone who spends their time indoors contracts COVID-19, R0 for that individual will be closer to 0. On the contrary, if a social butterfly contracts COVID-19, their R0 will be evidently far higher.
Rather than individual figures, the best we can hope for are group R0s. When considering which
groups would be of greatest risk of containing infected with high R0s, children were singled out, considering how the ways children go about their lives and hygiene are generalised to be very different from how others may do. This is why in many countries (primarily seen in China, Japan and Uganda), the first step in social distancing was to shut down schools, not necessarily even because children were especially at risk, which they weren’t, but rather because they were considered to be “vectors”, with the idea that if a child was to contract the virus, the child would naturally integrate themselves into the environments of other children and teachers, which would then have the potential to catalyse the spread of the virus due to the others of who were infected then integrating themselves into their own environments, thus resulting in a chain reaction of infections. Similar precautions were enacted upon university students, due to the high gatherings of people moving across large campuses.
As is the nature when making generalisations, to hope for an entirely positive outcome is simply unrealistic. Undoubtedly, the greatest drawback from the school closures which created the highest inequality was the mass disruption of learning, lowering attainment on national levels in the UK. This was especially evident for children in poorer families who may have not had access to the internet or owned a device to take part in online school. This substantial lowered attainment for children of crucial developing age meant that some of the vital life skills that are taught best in person at a physical school were missed out on.
Similarly, university students experienced noticeable downgrades in their higher education experiences from the knock-on effects of COVID-19. A study done by the SCIS (the Scottish Council of Independent Schools, a council that works in association with the Scottish Government in support of education across the UK) showed that in the midst of the pandemic showed almost 30% of 20,000 anonymous students were highly dissatisfied with their academic experience, and that the money they had to sacrifice was not being put to good use, and that 53% of students reported dissatisfaction in regards to their social experiences.
An adaptation from the pandemic that changed the working world in many ways is the transition to online work. The specific nature associated with the economic shock from COVID-19 seemed to only further imply societal inequalities in relation to work. Excluding key workers, the vast majority of people in the bottom eighth of the earning distribution worked in sectors that, due to a lack of an audience in the pandemic, were forced to close doors, and 80% of these workers either find themselves in a shutdown sector or work jobs that requires labour difficult to translate into working from home – compared with only a quarter of the highest-earning eighth of workers. Typically, workers in higher developed countries and cities (such as Londoners) found the transition to online work more achievable than workers in LIDCs such as Bangladesh or Nigeria, who were more affected than others in these
respects.
COVID-19 , to summarise, was able to hit the world with quick, successive jabs to our everyday structure that wounded our economy and society, forcing us all to adapt to changes unlike what many had seen before. In the UK, the interest rates fell to the lowest ever recorded, at only 0.1%, which was a tremendous distance from our target of 5%. Over a quarter of total UK businesses had to shut down completely. For thousands of families, the idea of connecting with loved ones during celebrations became impossible, worsening the feeling of social isolation for millions. Lockdown challenged the world to think on its feet, and the impending pressure of an ever-spreading globally dominated virus turned decision making into picking a least devastating course of action as opposed to the “best”. However, whilst the impacts of COVID-19 are by no means over for many people across the world, several of the issues that arose from the pandemic are gradually on the mend. Masks are being worn far less frequently. Children and students alike have been reintroduced back into schools and colleges. Limitations on where you can travel to or how long you can be outside for have been lifted. And, of course, you can walk into a Tesco without having to race to grab a bottle of hand sanitiser.
Will J - Year 12


Monetary policy is an action that a country's central bank or government can take to influence how much money is in the economy and how much it costs to borrow. In the UK, the Bank of England (BoE) uses a primary tool, called the Bank Rate. The Bank Rate is the standard rate of interest for all banks that deposit capital and cannot be accessed by an ordinary consumer. The Bank Rate is then passed on to commercial interest rates for consumers and firms to access. A secondary tool which the BoE uses is quantitative easing (QE). Quantitative easing is the act of buying back bonds (debt issued by the government or firms) to bring down longer-term interest rates and is set by the Monetary Policy Committee (MPC). These two main techniques are used to help get the rate of inflation to the UK's 2% target.
Why do we need inflation at 2%?
Inflation is the measure of how much the price level in an economy for regular goods has increased over the past year. The Office for National Statistics (ONS) regularly monitors this using the Consumer Prices Index (CPI) which is a measure of over 800 things that regular people buy, such as bread, cars or bus tickets. If inflation is at, let's say, 2%, then if
something costs £10 the next year it would cost £10.20 which is an increase of 20p. If the inflation was even higher, at 10%, then the cost of the good would be £11 which is an increase of £1. This must be controlled at a low level to ensure that prices do not increase too much per year.
How does the Bank Rate and Quantitative Easing reduce inflation?
The MPC can set the Bank Rate to control the level of inflation in an economy. Raising interest rates is the BoE's primary tool to reduce inflation, as it decreases the spending in the economy. Interest rates are the amount of money a borrower has to pay on borrowed money or how much money savings are rewarded, usually over a year. Say interest rates are at 5%, then if an individual borrows £100, they will have to pay back the lender £105, so the lender makes a profit. Similarly, if the interest rate for a savings account is 5%, the saver will get £5 extra from the £100 saved. The Bank Rate is the rate set by the Bank of England and is only accessible to firms and institutions such as banks, who have to legally hold some reserves in the Bank of England but can also add more. This Bank Rate is then transferred along to consumers
through the commercial rate, which is usually the one everyday people see and access. So increasing the Bank Rate leads to higher commercial rates, then a higher "cost for borrowing" and "reward for saving" less spending overall in an economy as people are more incentivised to save rather than borrow. Inflation may decrease as demand for goods in the UK decreases so firms need to keep their prices competitive.
Quantitative easing is the process of buying back bonds. Bonds are similar to "I owe you" cards where the government allows individuals to loan money to the government, and the government will pay back a small amount of interest that is fixed, such as £5. The MPC also decides on QE. This measure is particularly useful if the Bank Rate is very low. The process of QE is the purchase of bonds back from investors to push up their prices and decrease longterm bond yields. This is because there is a finite amount of bonds and thus if you decrease how many bonds there are, the price goes up and interest rates decrease.
Suppose a bond is worth £100 and the coupon (extra money) is £5 per year. The interest rate of the bond as a percentage of the bond value is 5%. Now, as the BoE has bought back these bonds, the price increases from £100 to £120, but the coupon payment is still at £5 because the coupon doesn't change, so the total interest is now 5/120 as a percentage or 4.2%.
Income vs Wealth
Income: money received, especially regularly / over a year, for work or through investments
Wealth: the total value of all assets owned by a person, community, company or country
What's the difference?
Imagine you earn £100 every month from your employer, and you save £20 of it. You already have a savings of £200 as well. Every month, your income is £100, as that's the money received regularly. However, your wealth is your total savings (£200) plus any extra money you didn't spend (the £20 from your income), so your total wealth is £220. Your income and wealth differ as income is the money coming in every time, and resets at every pay check, while wealth builds over
time as you save or own more assets.
Effects of monetary policy on inequality
Before the 2008 financial crisis, there were already heavily skewed income and wealth inequality. For instance, in 2007, the richest 10% of households accounted for around 25% of total income while wealth was skewed even further, where the top 10% accounted for over half of total wealth. After the crisis, the UK’s output fell by 6% and unemployment skyrocketed from 5% to 8%, the largest increase in the Second World War.
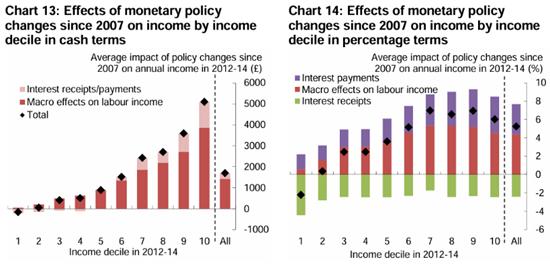
Monetary policy affects income and wealth distributions through six main factors in the short run.
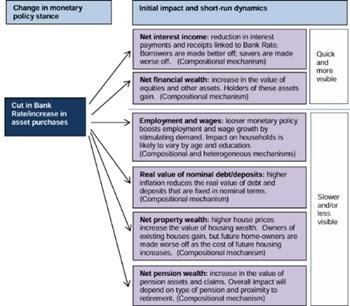
As it can be seen in the below diagrams, as the wealth decile increases, the distribution of certain types of wealth changes, most notably benefits for income & mortgage debt for wealth.
This may indicate, that from a cut in bank rate or
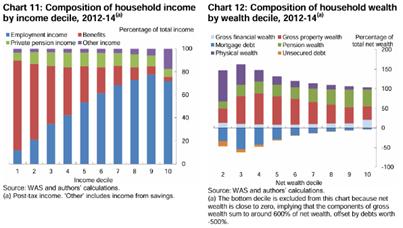
increase in QE, it leads to disproportionate effects on different income and wealth deciles. For example, loose monetary policy may lead to increase in real value of pension wealth, property wealth and debt, where higher income and wealth deciles have a higher proportion of wealth in pensions and property (chart 12) compared to lower deciles. The effects of loose monetary policy can be most notably seen by the following graphs:
When considering average effects, the type of household which is most likely to have been made worse off by monetary policy since 2007 would be
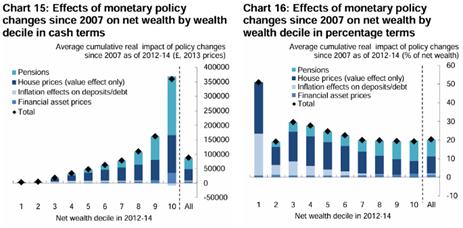
one with nobody in work, living in rented accommodation and with sizeable savings in bank deposits but little in the way of other financial assets.
Which monetary policy has the largest distributional effects?
The Bank Rate is typically seen to have less effect compared to QE, as the Bank Rate typically factors the boosted level of GDP. The effects of individual monetary policy can be most notably seen through the following two graphs:
Monetary policy easing affects the youngest people in society the most, as the effects of
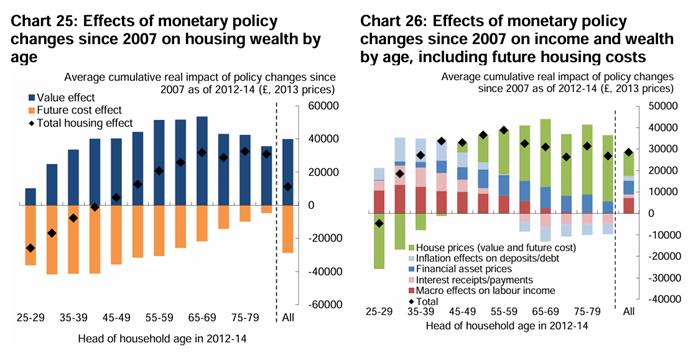
future housing costs are exacerbated by the increase in house value, which typically older people will own.
Overall, monetary policy is utilised to alter economic activity to inevitably control inflation, and by altering the Bank Rate and quantitative easing, this can be achieved. As a result, monetary policy does affect income and wealth inequality, most notably the effect on younger age groups who are impacted by increased house prices and who do not benefit from large pensions or financial assets. Loose monetary policy has a disproportionate effect on higher deciles of wealth, as they typically have a higher proportion of pension and property wealth and less debt. On the contrary, loose monetary policy has a positive effect on those who have a large proportion of their income from salaries as they benefit from loose monetary policy more.
Richard Z - Year 12


Rivalry between the US and China sprouted about a century ago and has consistently been a part of the history since. Especially with the development of technology and rise of the current era, the relationship between the countries is only gaining tension. In a society where power and dominance are held with such glory, it is only natural for the most advanced countries to be in competition. This technological feud between the US and China impacts several sectors such as global trade, national security and technological advancement. This contest has allowed the rapid development of pioneering technology such as AI, and semiconductors; both contributing to quantum computing.
Since the discovery of AI, the US has dominated the market with their technology. It is a global hub for research and development, consisting of the largest, most advanced global telecommunication firms, such as Google, Microsoft, and Apple. Google is one of the firms focused intently on AI development as they see it as a ‘foundational and transformational technology that will provide helpful benefits to people and society’. The firm also owns DeepMind which is one of the leading AI research labs in the world. Microsoft has also made significant advancements in AI such as Multimodal AI which allows the company to process multiple data types to provide more accurate results. Despite Apple specialising in the production of
smart devices, it has also stepped foot into the AI industry with the announcement of Apple AI.
The Chinese Government have devised a ‘Next Generation Artificial Intelligence Development Plan’ aiming to become the world leader in the industry by 2030, in response to the focus on AI research and development by major Chinese firms such as Baidu, Tencent and Alibaba. Due to the censorship of American applications, Baidu is regarded as the Chinese ‘Google’ and it is one of the few countries in the world that offers a full AI stack. They have also taken the lead in 2023 by launching their large product model, the Wenxin Yiyan, which they made widely available. Following this achievement, they proceeded to launch the world's first enterprise-level ‘Large Model Platform’, the “Baidu Intelligent Cloud Qianfan Large Model Platform”.
Tencent is also a major developer in games and social media and is developing AI to be used in all key areas of their businesses and in key applications across industries such as medical, industrial and agricultural. They mainly focus on researching machine learning, natural language processing, computer vision and speech recognition. These services are used to improve the public sector in China such as video surveillance, healthcare and education. Similarly, Alibaba also focuses on developing AI for logistics, retail and cloud computing. DAMO Academy, a leader in AI research, is Alibaba’s research division where many AI


assistants have been developed.
This also marks a leap forward toward surpassing the US. However, it is still far away from catching us with IBM’s 2nm chip developed in 2021 in the US.
Both countries have progressed in the development of semiconductors, not just in size but in their functions too. China’s newest advancement is a quantum chip called ‘Wukong’ (2024), developed by the Anhui Quantum Computing Engineering Research Centre. The chips have 198 qubits allowing powerful processing and programmability. It is designed for versatility and is critical in the advancement of quantum computing. US companies have made advancements in partnership with TSMC (a Taiwanese company) to develop semiconductors such as Apple chips. This technological rivalry has shaped global alliances such as the ‘Chip 4 Alliance’ between the US, Japan, South Korea and Taiwan to counter China’s semiconductor ambitions. Similarly, China is expanding its influence through initiatives such as the ‘Digital Silk Road’ with the aim to bolster China’s global economic and technological influence.

In the future, China is expected to surpass the US in the research and development of AI as it has overtaken the US in innovation and has outpaced the US in machine learning every year since 2021. All these factors considered; it is likely that China’s plan to be the global leader in AI by 2030 will become a reality.

Likewise, the semiconductor and chip wars stand at a similar position with the US being dominant and China being 2-5 years behind. The world relies heavily on the US for its technology as they are the leader in the design and intellectual properties of chips. Due to this, China relies heavily on imported, foreign semiconductors. In attempts to break this stalemate, China is investing heavily in its semiconductor industry. However, with the US having such a large lead in the industry, it has proven to be hard to catch up. To slow China’s progress in the development of semiconductors, the US has set strict export controls on advanced equipment and technology.
Despite the US's hinderance, China has had some major breakthroughs in its development such as the 7nm chip in 2022 by SMIC (China’s leading semiconductor foundry). This was a notable achievement as it was thought to be out of their reach due to the restrictions on the equipment.

In conclusion, the US is currently dominating in the technological strife, but China is catching up at a rapid rate, especially in AI. Despite the US being the leader in the industry, Chinese technology is seeping into global economies and potentially challenging the dominance of Western tech firms. In the long term, this competition will form more global alliances and accelerate global innovation. However, this competition could also cause a digital divide and cause cybersecurity concerns. Similarly, in the future, this rivalry may escalate creating conflict and limiting cooperation in combatting global challenges. On the other hand, it may evolve into a constructive form of competition which creates new solutions to global challenges and causes the expansion of global tech economies. Ultimately, the rivalry between the two biggest economies has the ability to reshape global directions regarding trade, tech and geopolitical alliances.
Lorna Z - Year 12

Over the past year, gold has risen over 30% from a different combination of factors. To understand these factors, we need to look at why people buy gold.
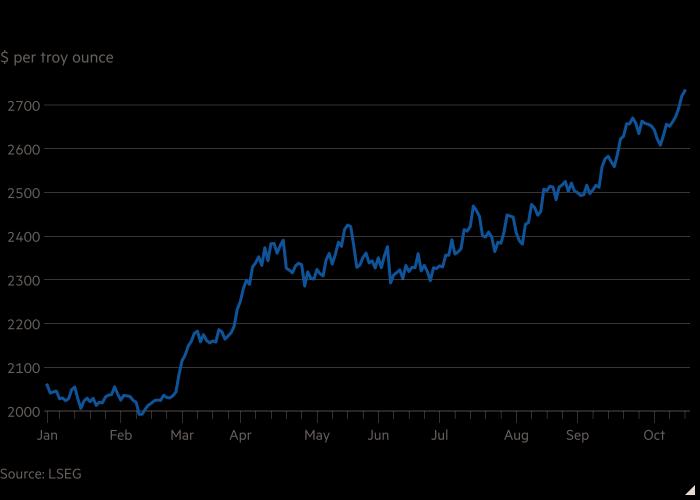
Investors typically go to gold for its stability, using it to hedge against inflation and reduce exposure to market volatility. Due to gold’s scarcity, alongside other factors, gold has an intrinsic value, meaning it has value just by existing. For instance, the shiny and other properties of gold make it very suitable for jewellery. In turn, it is a more stable investment compared to, e.g. USD, which depreciates over time and has no intrinsic value, only the value which individuals perceive it to have. Many institutions in the world use gold as a reserve, such as many central banks.
Gold is widely considered to be an alternative universal currency one that however earns no interest payments or any other cash flows. This means historically it has had a negative correlation to interest rates. Interest rates have a negative
correlation with gold prices because as interest rates increase, the opportunity cost of the interest from regular savings increases, thus decreasing demand because there is more incentive to save through interest. A weakening dollar may also affect gold prices as a weaker dollar means foreign investors can buy gold in USD compared to previously, thus pushing up its price as demand increases.
This has been the case recently as many central banks across the world look to decrease interest rates to stimulate economic activity. The Federal Reserve
interest rate is currently at 4.75%, with indications that interest rates are to fall in 2025, thus pushing up gold prices.
Gold prices can also be driven by supply and demand dynamics. On the supply side, mine production is the largest source of new gold followed by the recycling of existing gold. Some drivers of demand are jewellery, industrial and electric devices and central bank reserves. When demand growth outpaces supply, the imbalance puts upward pressure on the gold price. As seen in the graph over the page, as demand increases from D1 to D2, the quantity demanded increases and thus the price level shifts from P1 to P2.
Moreover, gold prices can be driven by global political
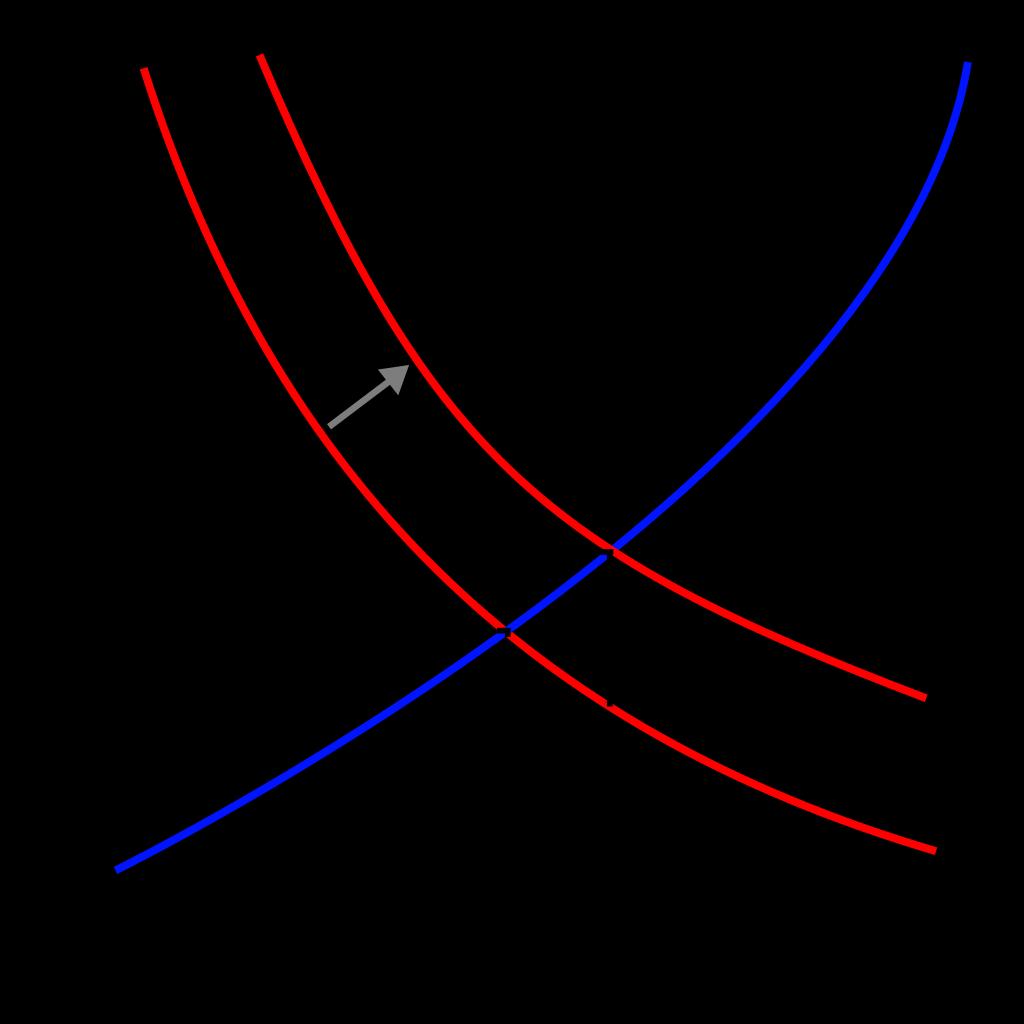
tensions. Multiple ongoing conflicts between Russian and Ukraine, Israel and Palestine and others in the past few years has contributed to the rise of the price of gold. Gold is a scarce resource, compared to something like the USD, with which the supply can be drastically increased by printing money. Therefore, in periods of time when there is low confidence in a country's stability, such as in an ongoing conflict, investors are more confident in gold as a store of value and move money into gold, thus increasing demand and driving the price up.
On the other hand, gold does come with risks typical of any investment, such as price volatility and other associated risks. Some risks may include additional costs for insurance and storage, where if investors buy physical gold, that gold must be stored somewhere secure and insured. This also poses the risk of theft and counterfeit if not checked and stored properly.
Another risk, or downside, to owning gold is its inability to earn passive income. Investments such as bonds or stock dividends provide some sort of passive income, however gold solely relies on its price appreciation for returns. This poses a risk, particularly at times where interest rates rise and thus the opportunity cost of holding gold increases, which leads to investors losing out on potential profits.
Compared to other stores of value, such as silver, gold has a much higher price per ounce than silver. Even though over 1 billion ounces of silver and 120 million ounces of gold are produced, the market value of each significantly differs due to each respective price. Thus, a small change in purchases of silver can lead to a much larger affect on the overall market for silver, so silver has a far larger volatility compared to gold. Investors look towards gold for its long term stability and relatively lower volatility, which makes it the preferred store of wealth.
Despite the downsides, gold has had a long track record of stability and the power to diversify


portfolios to decrease disk, which makes it an appealing asset for investors in times of heightened global instability. As such, gold seems to continue with its price rise among global tensions, a weakening dollar & lower interest rates. Gold will inevitably keep rising as it maintains its intrinsic value and scarcity while demand continues to rise.
Richard Z - Year 12
Globalisation and its Discontents by Joseph Stiglitz (Columbia University) is a fascinating book exploring the inner workings of the institutions managing globalisation. As Chair of the US Council of Economic Advisers from 1995-97 and Chief Economist of the World Bank from 1997 to 2000, Stiglitz had an insider view into the workings of these institutions, particularly the Bank and the International Monetary Fund. This exposé reveals the failings of these institutions in their goals due to the dominance of neoliberal capitalism in the minds of the Fund’s economists, the disregard for economic reasoning and the interests of those running the banks. Providing examples such as the East Asia Crisis and the transition to market economies in the former members of the USSR, Globalisation and its Discontents is full of application for topics such as trade and protectionism. The book is also easy to read, with the more complex economic terms being defined periodically throughout the book. I would recommend reading this book, particularly to anyone interested in globalisation, international development and trade.
Matt K - Year 13


"Phishing for Phools" by Nobel laureates George A. Akerlof and Robert J. Shiller is an excellent dive into how markets exploit weaknesses in human thought processes to maximise their gain, often at the expense of society and consumers themselves. The use of clear and well explained examples is used throughout the book, from how monkeys choose what they want to the financial crises, the authors reveal the use of manipulation in free markets. The book's interesting style of writing and clear application to the real world makes it easy for readers of any level to gain an understanding of complex economic concepts.
I would recommend this book to anyone interested in behavioural economics or economics in general and wants to read around the subject, and gain an understanding of different methods and tactics that shape our decisions in everyday markets.
K - Year 13


Borrow a book and submit a review for the competition and next edition


The Shackle Economics Society is a student-led hub for exploring areas of economics not typically covered in class. As a speaker, you will learn to create engaging presentations, develop your confidence in public speaking, and enrich your university application. As an audience member, you learn about new and exciting ideas! On occasion, we have had external speakers to share their experiences and expertise in their particular field.
Recent talks this term have included Dillon's investigation into the impacts of international stock markets, Jack's analysis of Japanese Management techniques, and Tavi's simulation of the Principal-Agent problem. These talks have all discussed detailed analysis of their area of research, and crucially linking it to the relevance within the real world. Your in-depth research improves your articulation and explanation of economic theories, but also show a wide understanding of the real world to interviewers and examiners.
If you are interest in presenting at the Shackle Economics Society, please contact Mr Featherstone or the Shackle Society Reps: Myles O, Jack S and Enis A.
The Perse Investment Club launched the year with a popular four-week ‘New to Financial Markets’ course, giving newcomers an introduction to the fundamentals of investing. Students delved deeper into the financial world with a session on derivatives, led by Dr. Kennedy, formerly of Barclays Capital and ANZ.
Meanwhile, the Wharton Global High School Investment Competition 2024-25 is in full swing, with three Perse teams hard at work crafting portfolio strategies tuning their reports. Adding to the s highlights, Iain MacLeod visited the club to share fascinating insights from his career advising hedge fund clients at Morgan Stanley.

The term wrapped up on a high note with an exciting stock market trading game, hosted by Neil Graham of Fitch Learning, offering students a taste of the thrill of working on a City trading

This term, the Middle School Economics Society has enjoyed a series of lively and interactive sessions led by Isabelle, Jacqueline, and Celia. The group explored price discrimination through scenarios where students acted as businesses setting prices for different customer groups. Discussions on inflation included bidding up the price of chocolate treats to show money supply inflation as well as a competitive quiz to test knowledge For government policy and the budget, students engaged in a simulation of budget allocation, debating priorities for public spending. The term concluded with an introduction to behavioural economics, featuring fun quizzes to differentiate between concepts like irrational decisionmaking, loss aversion, and herding. True to tradition, the leaders kept the sessions active and rewarding complete with games, debates, and the ever-popular chocolate prizes to boost participation and enthusiasm.

The Middle School Investment Club aims to paced world of finance. It acts to teach the basics and bridge
This year, Middle School Investment Club has focused on the fundamentals of portfolio construction and stock analysis. Building on the basics, we have explored the importance of building balanced portfolios, covering concepts such as diversification and the role of ETFs and index funds. Our members have learned to interpret key metrics such as EPS, dividend yields and P/E ratios, whilst applying this knowledge in the Investopedia trading simulator to test their


Wednesday 15th January
For Perse economists, you will be off timetable for this event. The IEA is a free market think tank, researching and publishing reports to influence government policy. The Perse will be hosting a conference with 3 excellent speakers. Dr Steve Davies, Head of Education at the IEA, will be exploring the economics of virtual worlds and video games. Dr Juan Castaneda, Director of the Vinson Centre for the Public Understanding of Economics and Entrepreneurship, will be unpacking the macroeconomics behind monetary policy and fiscal responsibility. Finally, we welcome back an Old Persean, Julian Jessop, who help to wade through causes, consequences and potential solutions for the productivity puzzle in the UK.
We look forward to welcoming 6th form economists from local schools to the event.
Look out for Mr Larner’s emails for more information, or search on the IEA website.
On the 6th November, we went to Economics in Action at Warwick Arts Centre where we enjoyed speakers from the IEA, BBC Radio 4's Economics podcast and professors from KCL and UCL. The talks introduced discussions on GDP, UK productivity and examination tips. The examination tips session, led by Peter Cramp, offered us all valuable insights into excelling in our economics exam and exam technique. Although at some points, concepts introducing exchange rates and monetary policy may have been challenging to grasp, the overall experience was inspiring, informative and fun! It was clear that each speaker gravitated towards a different ends of the political and economic spectrum in their stance on various issues, but presented compelling arguments for their case, leaving us to weigh up our thoughts and come to our own conclusions.
Richard Z - Year 12