Submarine Telecoms Forum, Inc. https://subtelforum.com/about-us
BOARD OF DIRECTORS: Wayne Nielsen, Margaret Nielsen, Kristian Nielsen, and Kacy Nielsen
Contributions are welcomed and should be forwarded to: pressroom@subtelforum.com.
Submarine Telecoms Cable Industry Report is published annually by Submarine Telecoms Forum, Inc., and is an independent commercial publication, serving as a freely accessible forum for professionals in industries connected with submarine optical fiber technologies and techniques. Submarine Telecoms Forum may not be reproduced or transmitted in any form, in whole or in part, without the permission of the publishers.
Liability: While every care is taken in preparation of this publication, the publishers cannot be held responsible for the accuracy of the information herein, or any errors which may occur in advertising or editorial content, or any consequence arising from any errors or omissions, and the editor reserves the right to edit any advertising or editorial material submitted for publication.
New Subscriptions, Enquiries and Changes of Address
19471 Youngs Cliff Road, Suite 100, Sterling, Virginia 20165 United States, or visit https://subtelforum.com.
Your Premier Portal to Locate Companies for Submarine Telecoms Collaboration
Content Highlights:
• All-Encompassing Listings: Dive into a world-class directory of submarine telecom product and service providers.
• Intuitive Search: Effortlessly navigate to the services and solutions tailored to your mission.
• Spotlight on Innovation: Engage with the leaders driving the industry forward through technological advancements.
SET SAIL FOR SUCCESS
BOOKMARK THE SUBTEL FORUM INDUSTRY DIRECTORY TODAY!
Figure
Figure
EXORDIUM
Dear Readers,
Welcome to Issue 14 of SubTel Forum’s Submarine Telecoms Industry Report.
The year 2025 marks the beginning of a new era for the submarine cable industry. The sector has transitioned from an age of unrestrained buildout to one defined by strategic coordination, sustainability, and global accountability. Amid geopolitical friction, evolving regulatory frameworks, and persistent supply chain pressures, the industry continues to demonstrate remarkable adaptability—balancing capacity growth with resilience and stewardship.
As detailed in this year’s report, the submarine telecoms landscape now stands at a point of structural maturity. Over $22 billion in active project capital is currently self-financed, underscoring a confident and independent market. Meanwhile, governments and multilateral institutions are deepening engagement through public-private partnerships and emerging security and sustainability frameworks, including the International Advisory Body on Submarine Cable Resilience. The message is clear: subsea cables are no longer peripheral infrastructure—they are critical assets central to global security, finance, and digital inclusion.
Technological evolution continues apace, though the emphasis has shifted from expansion to optimization. The industry’s focus now rests on operational precision, with innovations such as multi-core and hollow-core fiber, 800G wavelengths, and smart repeaters improving both efficiency and environmental performance. Lit-capacity utilization has reached record levels—averaging 60 percent globally—reflecting a disciplined alignment between deployment and demand.
Equally transformative is the cultural shift toward sustainability and long-term stewardship. Measurable standards such as CUE, PUE, and REF are now embedded in project design, while circular-economy practices are taking hold in system recovery and decommissioning. These advances—alongside a new generation of engineers, analysts, and policymakers—signal a maturing ecosystem that recognizes the enduring balance between growth, resilience, and responsibility.
Each year, our Industry Sentiment Survey provides an invaluable barometer of optimism, investment appetite, and workload trends across every region of the subsea market—data that directly informs the analysis and forecasts presented throughout this report.
The Submarine Telecoms Industry Report remains a cornerstone analytical resource for understanding these dynamics. It complements SubTel Forum’s other products—the Submarine Cable Map (published in January, May, and September), the quarterly Submarine Cable Almanac, the continuously updated Submarine Cables of the World Interactive Map, as well as our upcoming Cableship Codex, launching in December 2025. Together, they form a comprehensive suite of industry intelligence—tracking projects, investment, regulation, and innovation across every region.
This year’s report identifies more than $18.4 billion in new projects under active development, with $9.2 billion already contracted and $4.1 billion expected to reach RFS by the end of 2025. We have drawn on proprietary data from the SubTel Forum Submarine Cable Database and insights from recent SubTel Forum Magazine issues, as well as contributions from leading specialists including:
• Andrés Fígoli
• Kristian Nielsen
We extend special thanks to our 2025 sponsors for their invaluable support in producing this 14th annual edition:
• ACS
• Figoli Consulting
• WFN Strategies
As always, we are honored to feature a Foreword by Doreen Bogdan-Martin, Secretary-General of the International Telecommunication Union, whose leadership continues to advance the global dialogue on connectivity and resilience.
As SubTel Forum enters its 24th year in publication, our mission remains unchanged: to inform, connect, and challenge an industry that is vital to the world’s digital future. The next chapter will be defined not merely by capacity but by coordination—between nations, enterprises, and generations. With more than 175 years of subsea history behind us, the submarine cable community remains a model of innovation, pragmatism, and perseverance.
We thank our readers for your continued engagement with SubTel Forum’s work. As ever, we believe that an informed industry is a productive industry.
Good reading and Slava Ukraini,
Wayne Nielsen Publisher & President, Submarine Telecoms Forum, Inc.
FOREWORD
Thoughts from Doreen Bogdan-Martin, ITU Secretary-General
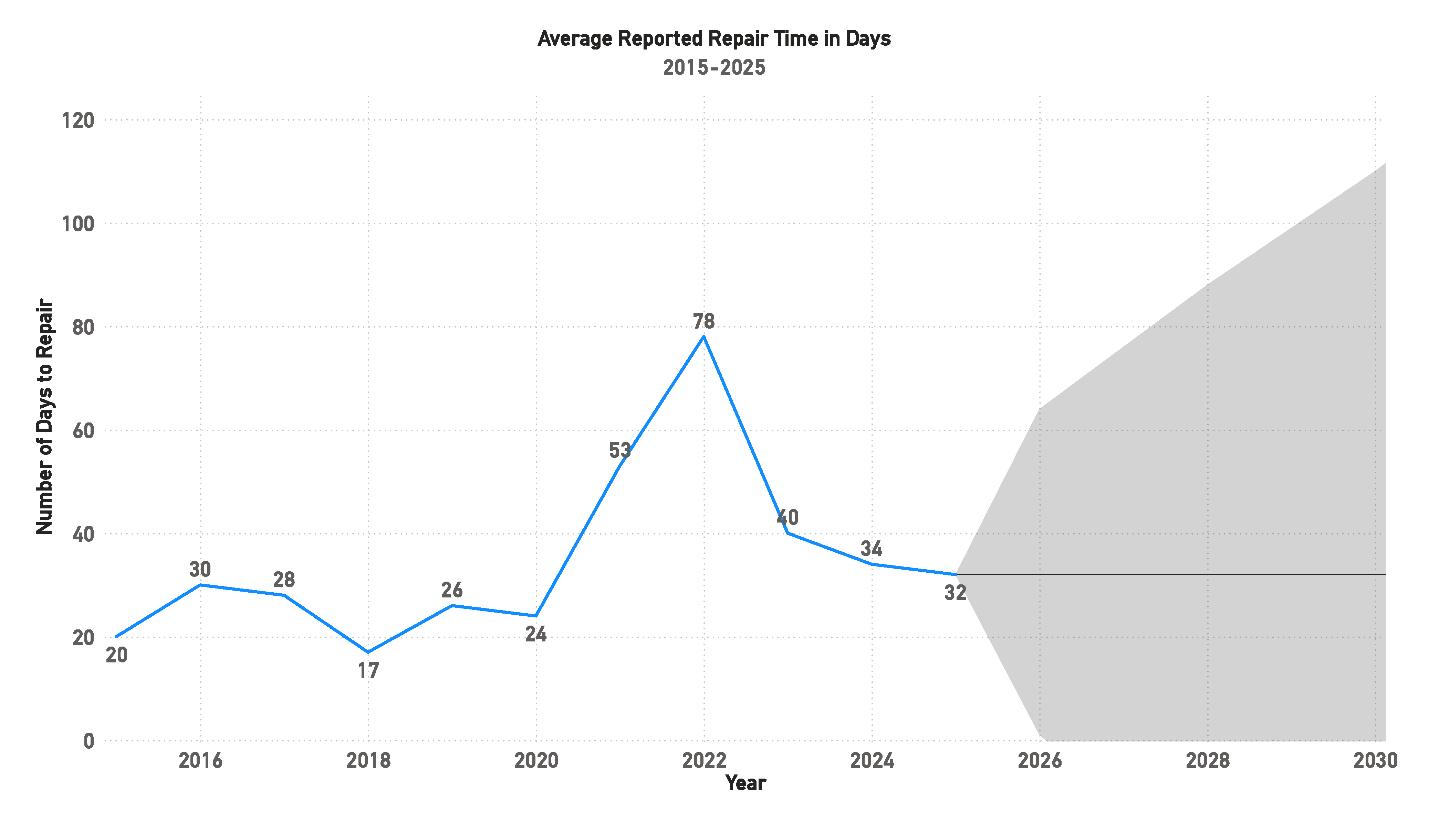
Laid end to end, the submarine cables connecting our world could circle the Earth between 30 and 40 times over.
The immensity of this undersea network reminds me of the vast challenges before us as the United Nations agency for digital technologies.
ITU’s goal is to bring one-third of humanity online, while ensuring that all 5.5 billion people already using the Internet can benefit from meaningful, reliable connectivity.
But when connectivity supplied by cable services is disrupted, entire economies and communities feel the impact.
Even though these information superhighways are built to operate for around 25 years, we are seeing over 200 disruptions annually.
Repairs can sometimes face significant delays.
ITU’s goal is to bring one-third of humanity online, while ensuring that all 5.5 billion people already using the internet can benefit from meaningful, reliable connectivity.
Meeting our goal of universal, meaningful connectivity demands more than infrastructure; it calls for shared commitment, fresh ideas, and collaboration on long-term resilience strategies on a global scale.
Developing these strategies is the aim of our International Advisory Body for Submarine Cable Resilience, led by ITU together with the International Cable Protection Committee.
While cable resilience has become a top priority for governments around the world, supporting strategies are at quite different levels of maturity.
The Advisory Body — comprising more than 40 experts and co-chaired by representatives from Nigeria and Portugal — aims to help everyone move forward together.
Its composition reflects ITU’s diverse membership of 194 Member States and over 1,000 companies, academic institutions and standards communities all over the world, and its work is grounded in strong shared incentives to boost cable resilience.
Over the next decade, some estimate that more than two-thirds of new value creation could come from digitally enabled platforms.
Submarine networks are given life by an interplay of technology, business and policy that must be considered holistically — we stand to gain great value from harmonizing our approaches to this fundamentally international matter.
In February, we held our first summit on submarine cable resilience in Abuja, Nigeria.
The summit’s declaration promotes global cooperation on areas including the strengthening of cable resilience through risk mitigation, promoting diverse routes and landings, and facilitating timely deployment and repair.
Alongside rising demand for data, route diversity for resilience has become a key driver for new cable rollouts.
Route diversity also includes an important development dimension, with underserved regions and Small Island Developing States especially vulnerable to cable service disruptions.
Enabling policies and regulations could support faster repairs, as could data-driven approaches to cable monitoring and risk assessment.
The Abuja Declaration also highlights the importance of sustainable approaches, technological innovation, and capacity building, with emphasis on preparing for both present and future connectivity needs.
This momentum continued at the World Summit on the Information Society High-Level event in July, where Advisory Body members gathered with the development community to discuss how to make the invisible backbone of global digital connectivity more resilient.
This year, ITU marks its 160th anniversary.
We are proud to have supported the submarine telecoms industry since its very beginnings, which also date back to the mid-1800s.
ITU standards underpin every technical aspect of this vital infrastructure, from cable design and construction, to deployment, operation, maintenance and repair.
This year, ITU marks its 160th anniversary. We are proud to have supported the submarine telecoms industry since its very beginnings, which also date back to the mid-1800s
Just as standards provide the technical foundations for global business ecosystems, our collective efforts and continued collaboration can help build the consensus essential to cable resilience.
Greater cable resilience will demand synergy in the actions of stakeholders across the public, private, and academic sectors alike.
I am confident readers of this report will rise to the occasion, and wish you every success in your work to ensure that undersea networks connect our world meaningfully and sustainably for generations to come.
Doreen Bogdan-Martin ITU Secretary-General
METHODOLOGY
This edition of the Submarine Telecoms Cable Industry Report was developed by the analytical team at Submarine Telecoms Forum, Inc., who also produce ongoing research for SubTel Forum Magazine, the Submarine Cable Almanac, the Submarine Cable Map Series, and the SubTel Industry Newsfeed. The report draws from the Submarine Cable Database, a proprietary data resource continuously maintained since 2013. This database serves as the foundation for all quantitative and visual analyses presented in the report, encompassing more than 500 active and planned domestic and international systems. It enables precise querying by year, region, length, capacity, ownership, installation contractor, project status, data center connectivity, and numerous other parameters
The process of data collection for this report is ongoing throughout the year and involves a diverse network of sources that include public regulatory filings, corporate disclosures, government infrastructure reports, supplier announcements, and industry press releases. In addition to these sources, the SubTel team conducts regular interviews and direct correspondence with cable owners, operators, manufacturers, and installers to verify and enrich available data. Each new data point is ingested through a structured process that includes tagging, classification, and source verification. Where possible, data are cross-referenced against at least two independent sources to ensure reliability. In cases where discrepancies arise, follow-up verification is conducted through direct outreach to industry participants or by consulting archival project documentation.
The Submarine Cable Database operates on a MySQL backend, designed for scalability and efficient data retrieval. Each system record is assigned a unique identifier, allowing for longitudinal tracking of project changes over time. Prior to integration, all data undergo consistency checks to eliminate duplication and ensure proper alignment with historical entries. The team maintains a detailed changelog schema that records each edit, which in turn allows analysts to trace the evolution of individual cable records across multiple reporting cycles/.
Data verification is a key component of this methodology. Automated validation scripts routinely scan the database for internal inconsistencies, such as incorrect length-to-capacity ratios or missing geospatial identifiers. These automated checks are complemented by manual reviews, during which analysts examine geographic accuracy using ArcGIS Pro overlays and other mapping tools. All landing points, regional groupings, and route alignments are visually verified against satellite and published marine route data. Financial fields are audited to ensure that cost estimates are correctly expressed in U.S. dollars and adjusted for inflation where applicable, maintaining uniformity across reporting years.
All visual outputs in this report are generated in ArcGIS Pro and Microsoft Power BI. The former is used to produce maps with consistent geospatial fidelity, following the visual and cartographic standards of the Submarine Cables of the World print map. Power BI is connected directly to the live database, ensuring
that every chart, graph, and data table in the report reflects the most current information available. This real-time integration enables seamless updates to visualizations whenever new data are incorporated into the database.
The analytical framework applied to this report includes descriptive, comparative, and predictive techniques. Descriptive analysis provides an overview of the current cable system landscape, summarizing distributions by geography, technology type, and ownership structure. Comparative analysis explores change over time, examining metrics such as regional growth, deployment trends, and technological advancement. Predictive modeling, executed through Power BI’s Exponential Smoothing (ETS) forecasting function, extends these observations into future projections. This model accounts for seasonality, trend persistence, and random variance within the data to produce forward-looking estimates that balance statistical rigor with practical interpretability.
Forecasting relies on a combination of historical trend modeling and exponential smoothing. The Compound Annual Growth Rate (CAGR) is calculated through two separate approaches: a fixed-period method that measures overall growth over a defined span, and a rolling two-year method that reduces volatility and provides a clearer picture of short-term fluctuations. Where gaps exist in public reporting—particularly following the 2019 adjustments to FCC data disclosure requirements—capacity projections are estimated using averaged historical growth rates from 2015 through 2018 as a baseline. These projections are further refined through model calibration, in which historical deviations are analyzed to fine-tune the forecast parameters.
For unrepeatered cable systems, a maximum modeled length of 500 kilometers is applied except in cases where longer systems are publicly confirmed. Future deployment trends for these systems are extrapolated linearly, based on the ratio of historical installation rates to regional project announcements. System cost estimates are derived from publicly available figures when disclosed; otherwise, a standardized industry average of seventy-five thousand U.S. dollars per kilometer is applied. This figure represents a blended average adjusted for inflation and the typical cost differential between shallow-water and deep-sea deployments.
A rigorous quality assurance process underpins every stage of this methodology. Once the analytical phase concludes, a secondary review is conducted by senior members of the SubTel research team, who re-verify key system data and recalculate sample metrics to confirm the accuracy of both the source database and the analytical outputs. All data visualizations are regenerated directly from live Power BI dashboards, ensuring consistency between graphical elements and the underlying data. This multi-step validation process minimizes the risk of error propagation and reinforces the integrity of both the current dataset and its forward-looking projections.
ACRONYMS & DESCRIPTIONS
Acronym
16QAM
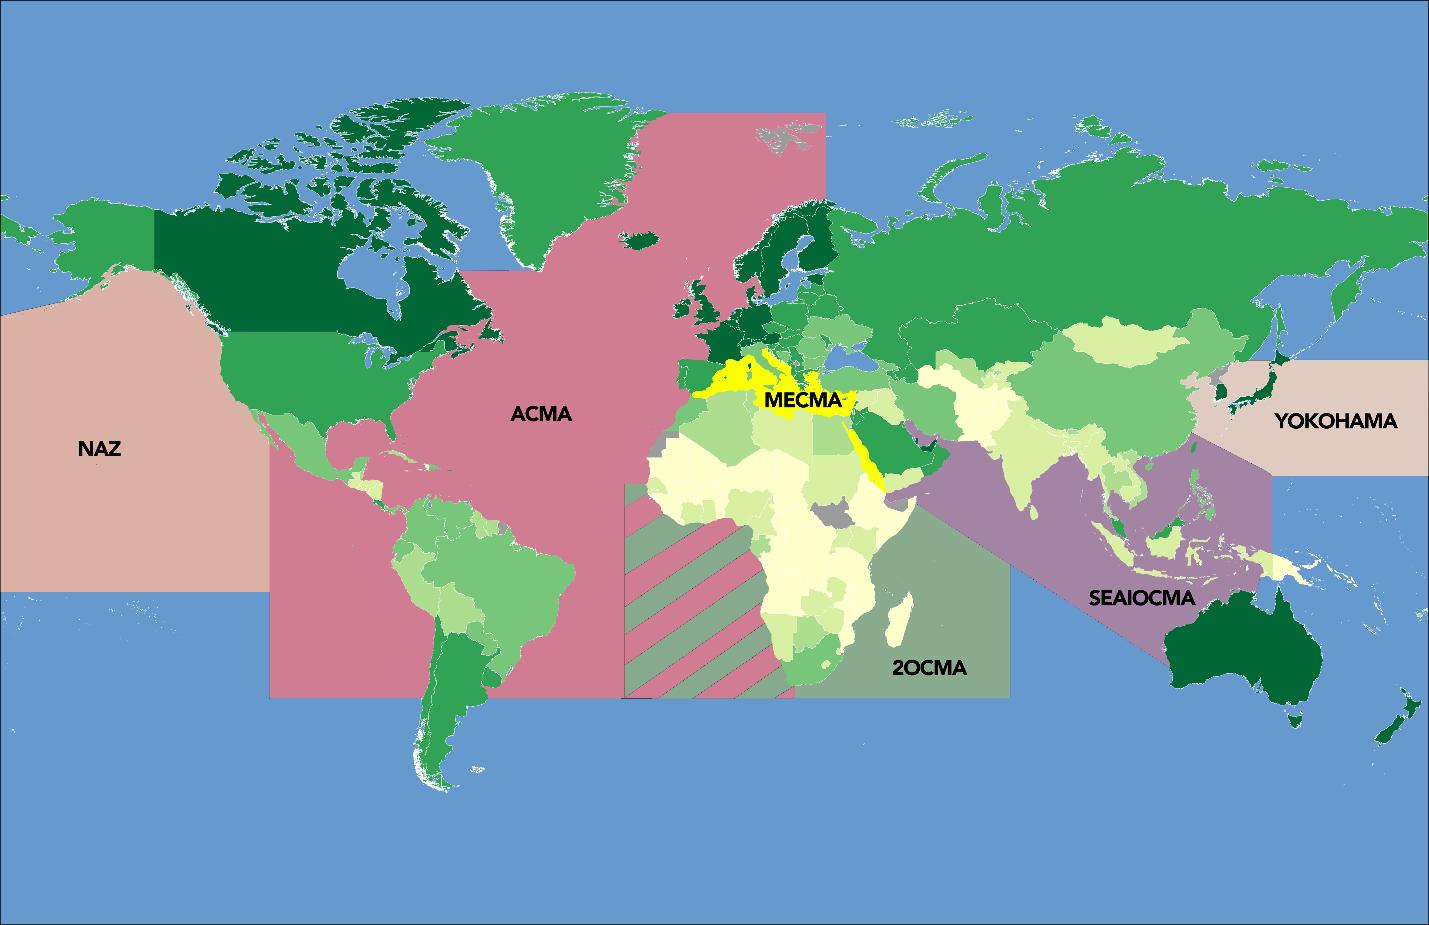
2OCMA
4G / 5G
AAE-1
ACMA
ACPL
Definition
16-Level Quadrature Amplitude Modulation – high-order modulation format transmitting 4 bits per symbol for greater spectral efficiency.
2 Oceans Cable Maintenance Agreement – covers southern Atlantic and Indian Oceans; operated from Cape Town.
Fourth / Fifth Generation Mobile Network – wireless technologies that drive higher data demand and subsea backhaul.
Asia–Africa–Europe-1 – subsea cable connecting Asia, the Middle East, and Europe.
Atlantic Cable Maintenance Agreement – covers North Atlantic, SE Pacific, and Northern Europe.
Airtel Cable Partners Ltd. – participant in the SEAIOCMA maintenance framework.
AI Artificial Intelligence – technology enabling machines to perform human-like tasks and driving hyperscale data and bandwidth growth.
AIS
APAC
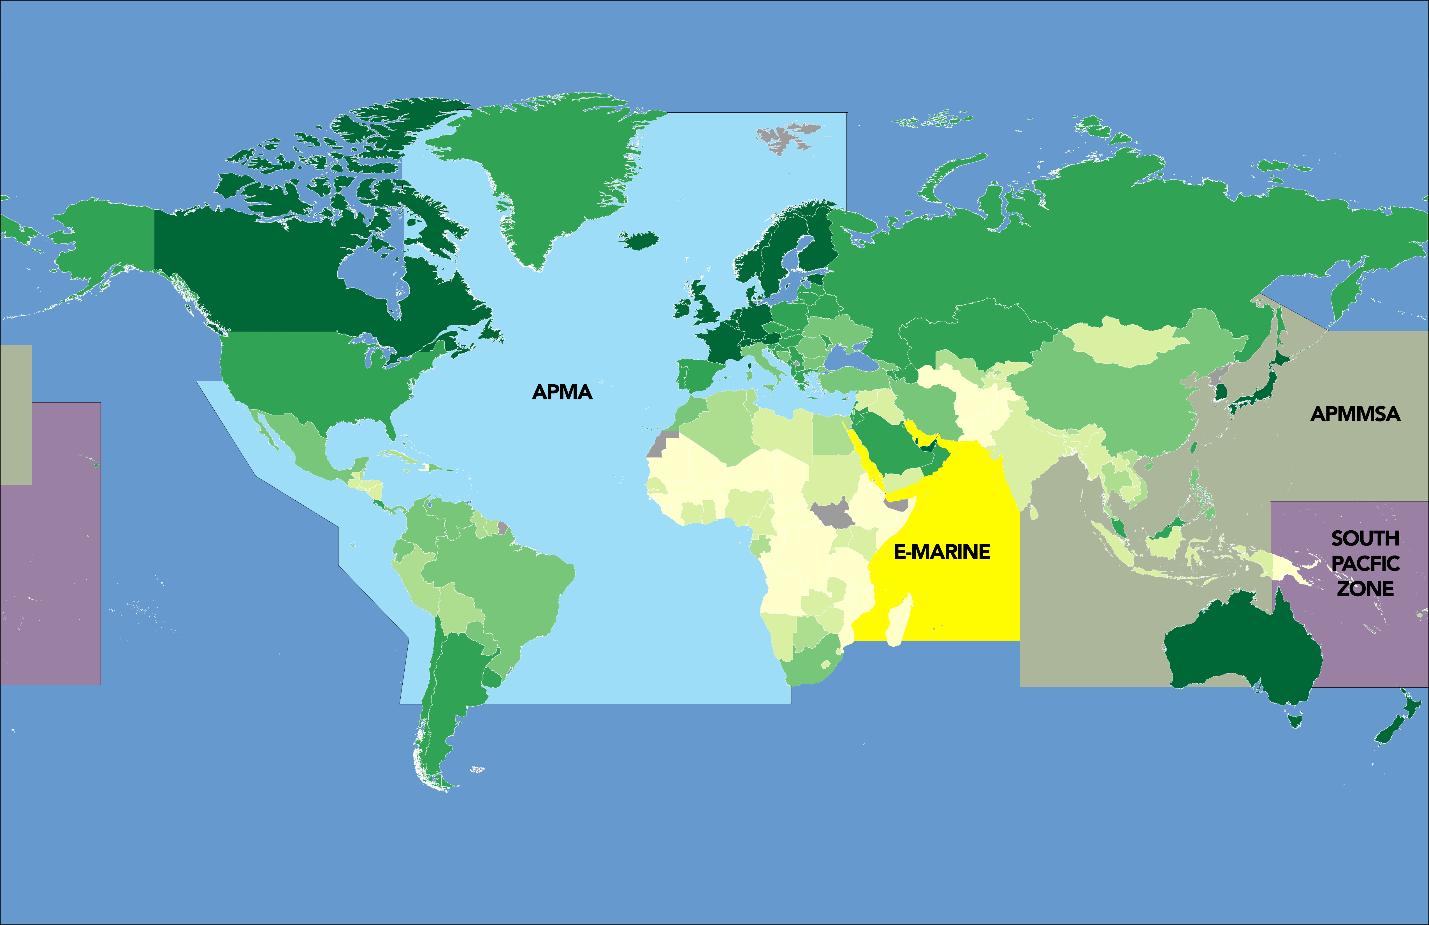
APMA
APMMSA
Automatic Identification System – vessel-tracking technology for monitoring ships near subsea cables.
Asia-Pacific – regional grouping central to hyperscale and subsea growth.
Water Usage Effectiveness – efficiency metric for water consumption in cooling systems.
YoY Year over Year – annualized growth comparison metric. µm Micrometer (Micron) – unit of fiber diameter measurement.
EXECUTIVE SUMMARY
The global submarine cable industry ends 2025 in a phase of structural maturity, characterized by sustained investment, stable financing, and increasing interdependence between infrastructure, regulation, and sustainability. After a decade of exponential buildout, the sector has transitioned from rapid expansion to strategic coordination—balancing growth with resilience, efficiency, and accountability. This year’s report offers a comprehensive analysis of these dynamics, highlighting emerging trends in ownership, financing, technology, and governance across all major regions.
While annual system deployment remains strong, the industry’s defining challenges have shifted. Geopolitical tension, supply chain constraints, and climate considerations now shape investment and project timelines as much as technology does. As subsea infrastructure becomes more deeply embedded in global security and economic systems, 2025 marks the consolidation of a new operational paradigm—one focused on coordination, regulation, and sustainability rather than pure expansion.
Subsea cables have become a focal point of global policy. Building on the momentum of prior security frameworks, 2025 has seen the integration of competition law, national resilience, and sustainability policy into unified governance efforts. The formation of the International Advisory Body on Submarine Cable Resilience underscores growing recognition of cables as critical international infrastructure. Parallel regulatory inquiries, including the UK CMA’s ongoing review of hyperscaler concentration, reflect heightened scrutiny of capacity control and antitrust dynamics in the subsea sector.
Governments are increasingly balancing intervention with collaboration. Public-private partnerships (PPPs) remain a key model for bridging security and innovation, while state-backed repair vessels and infrastructure initiatives hint at an era of deeper government involvement. The geopolitical importance of subsea connectivity is no longer questioned—it is a strategic reality shaping both policy and investment.
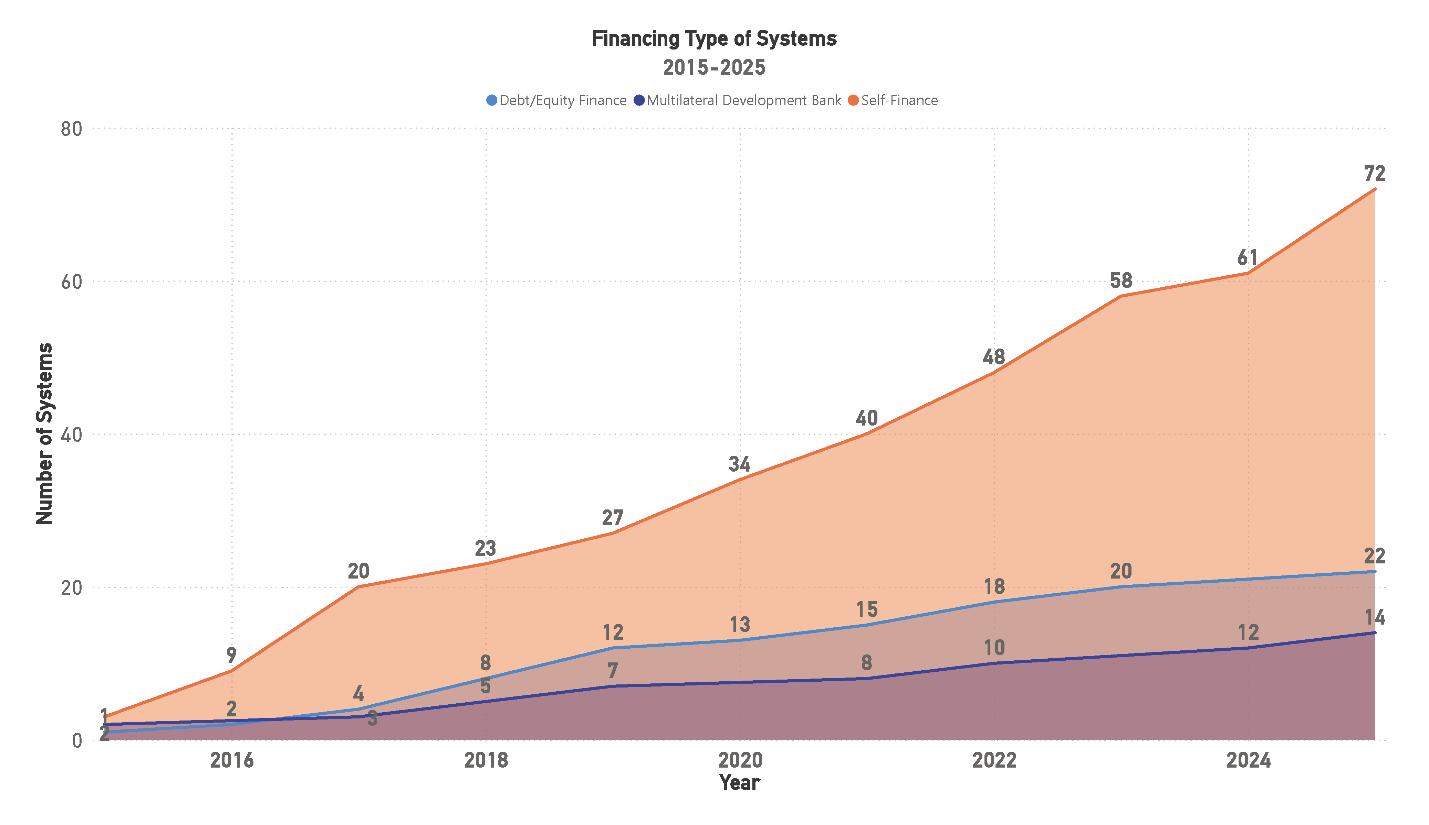
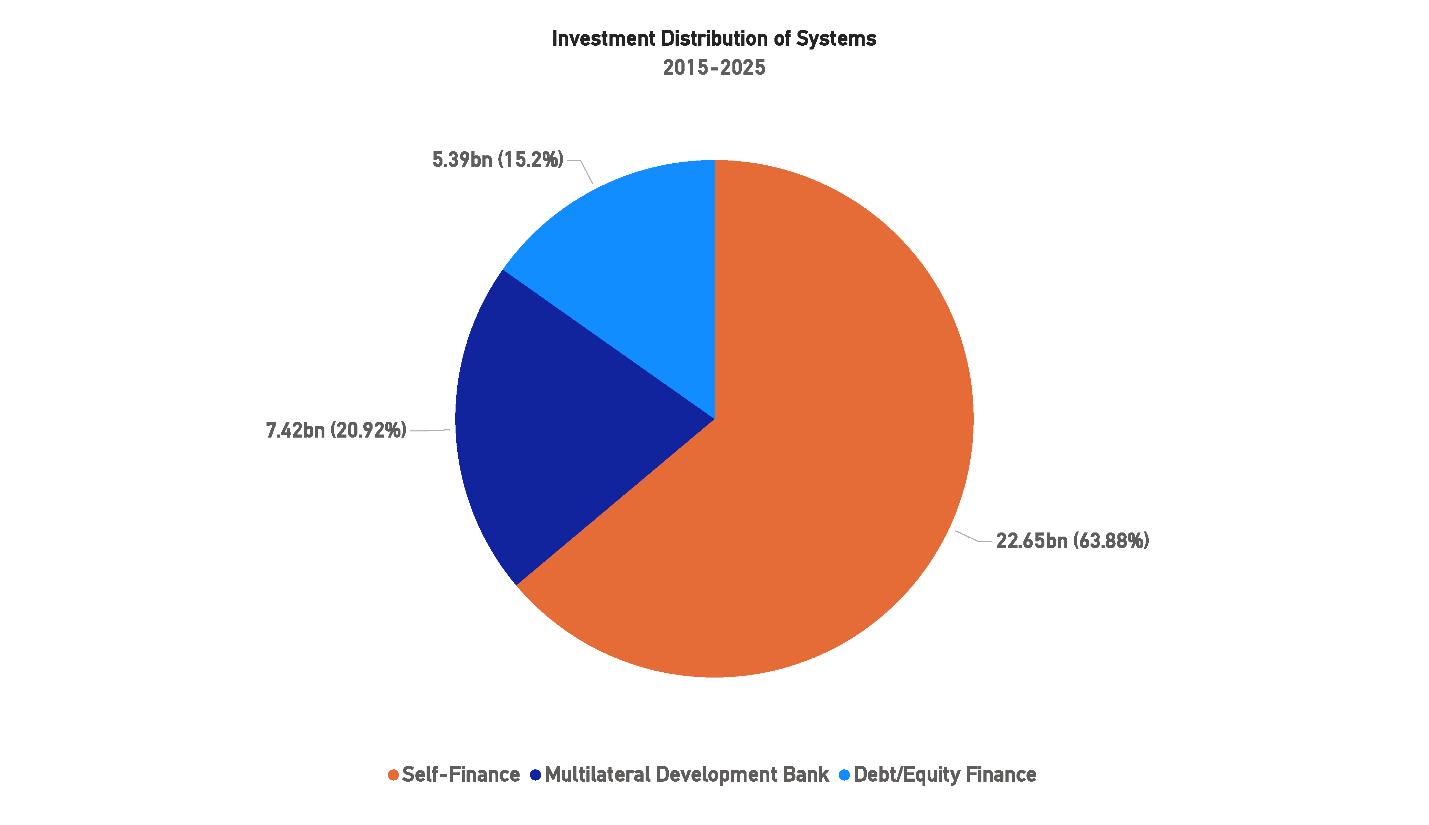
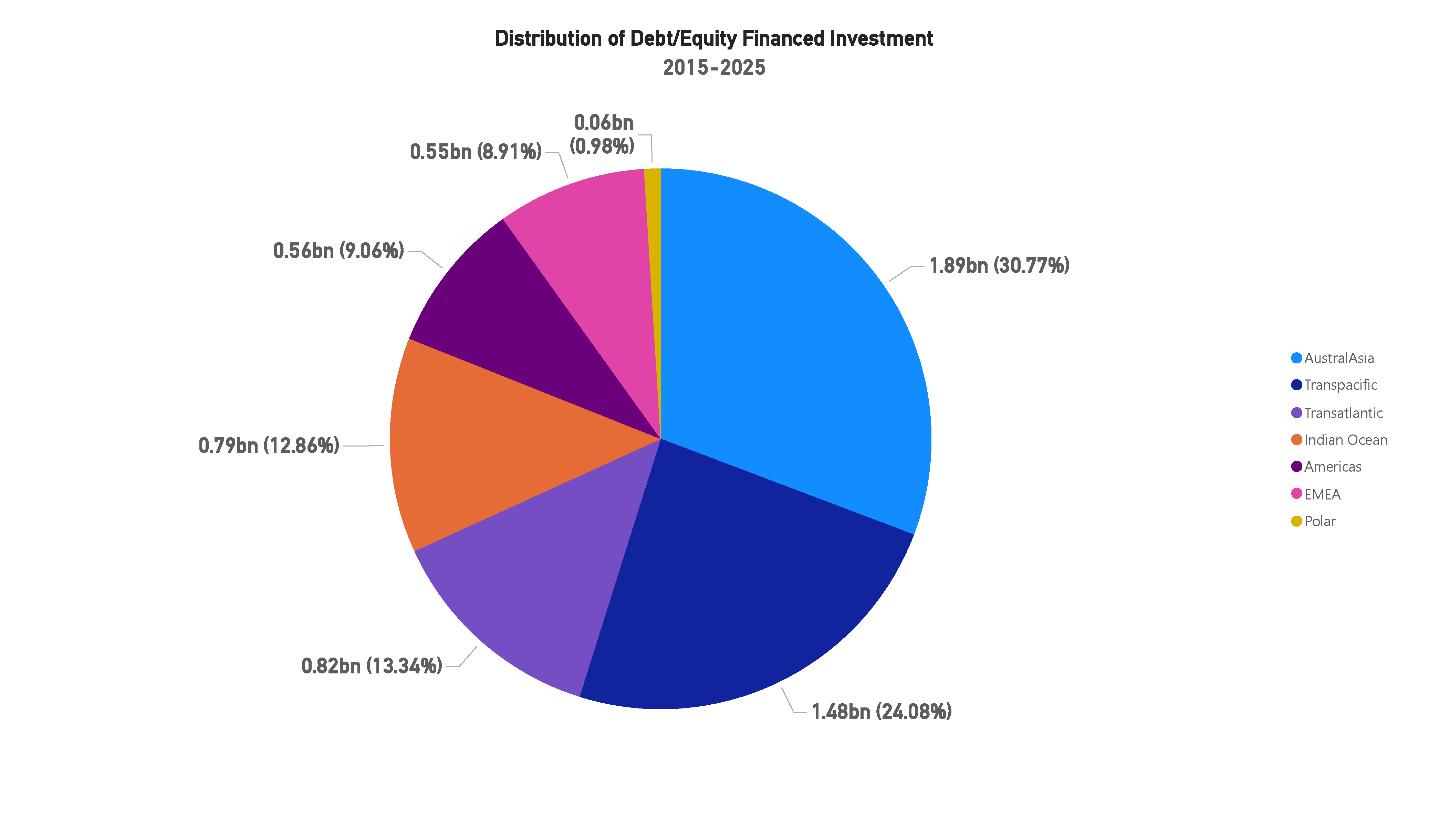
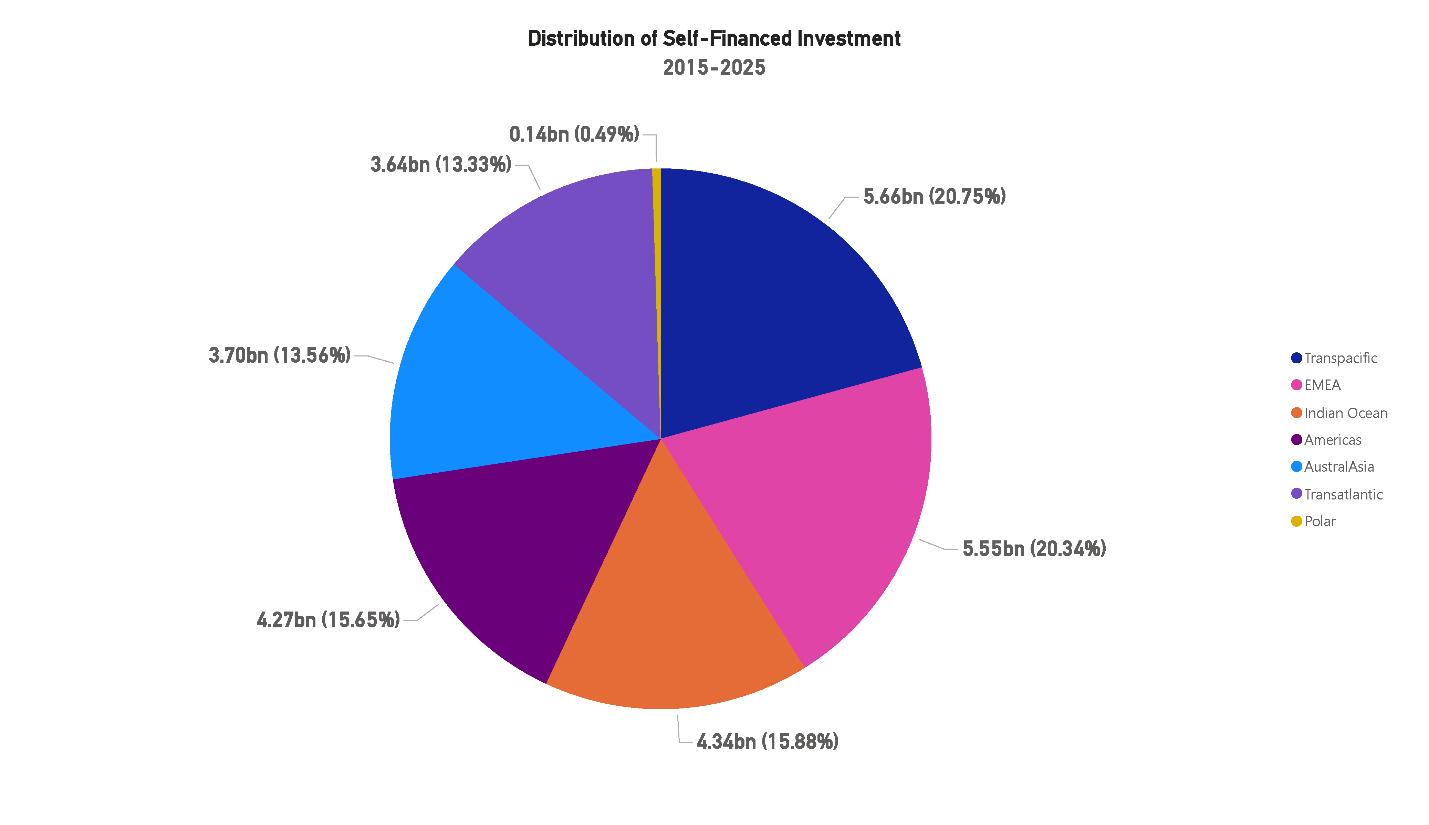
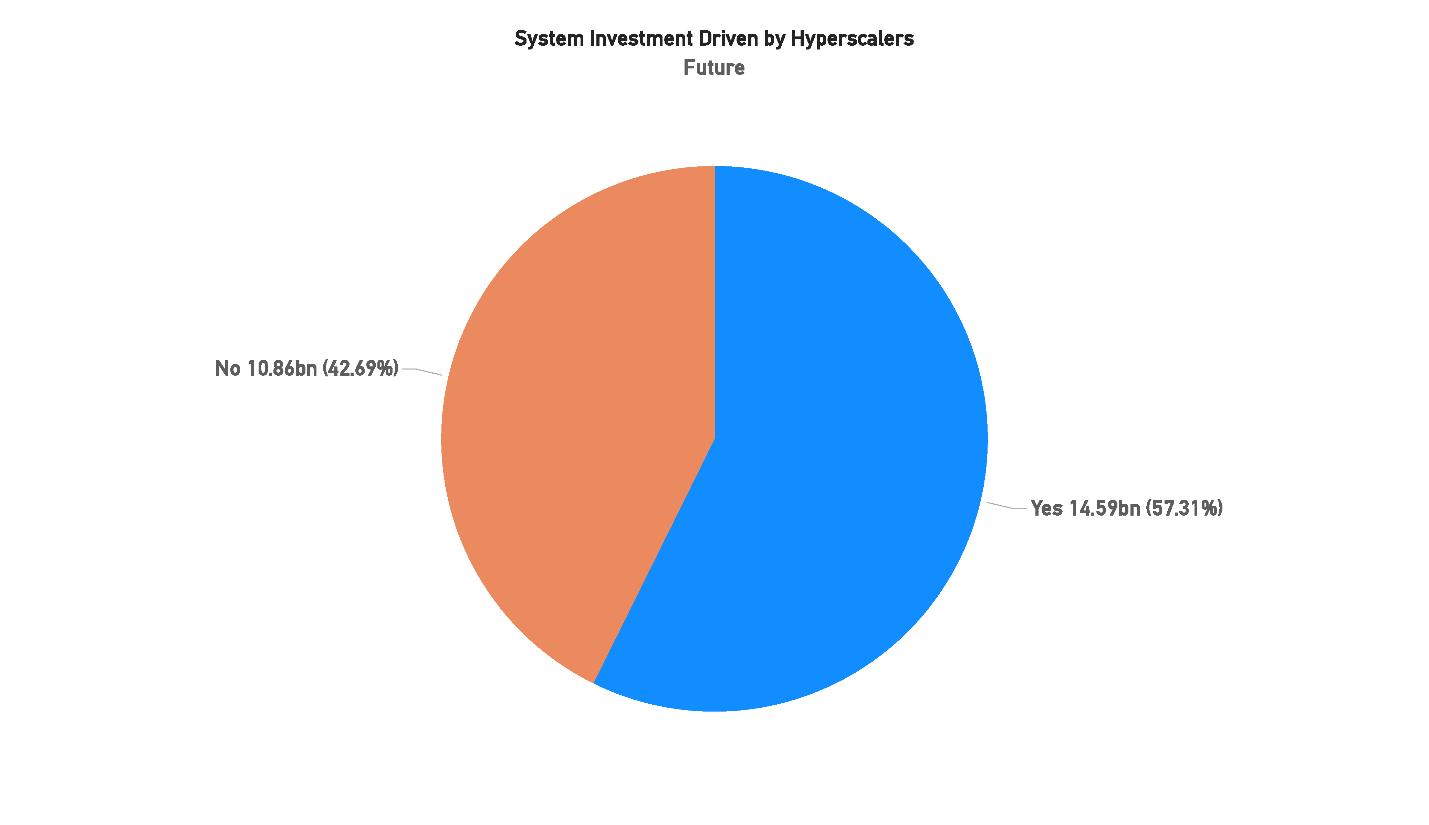
“Self-financing accounts for roughly two-thirds of global project capitalover USD $22 billion.”
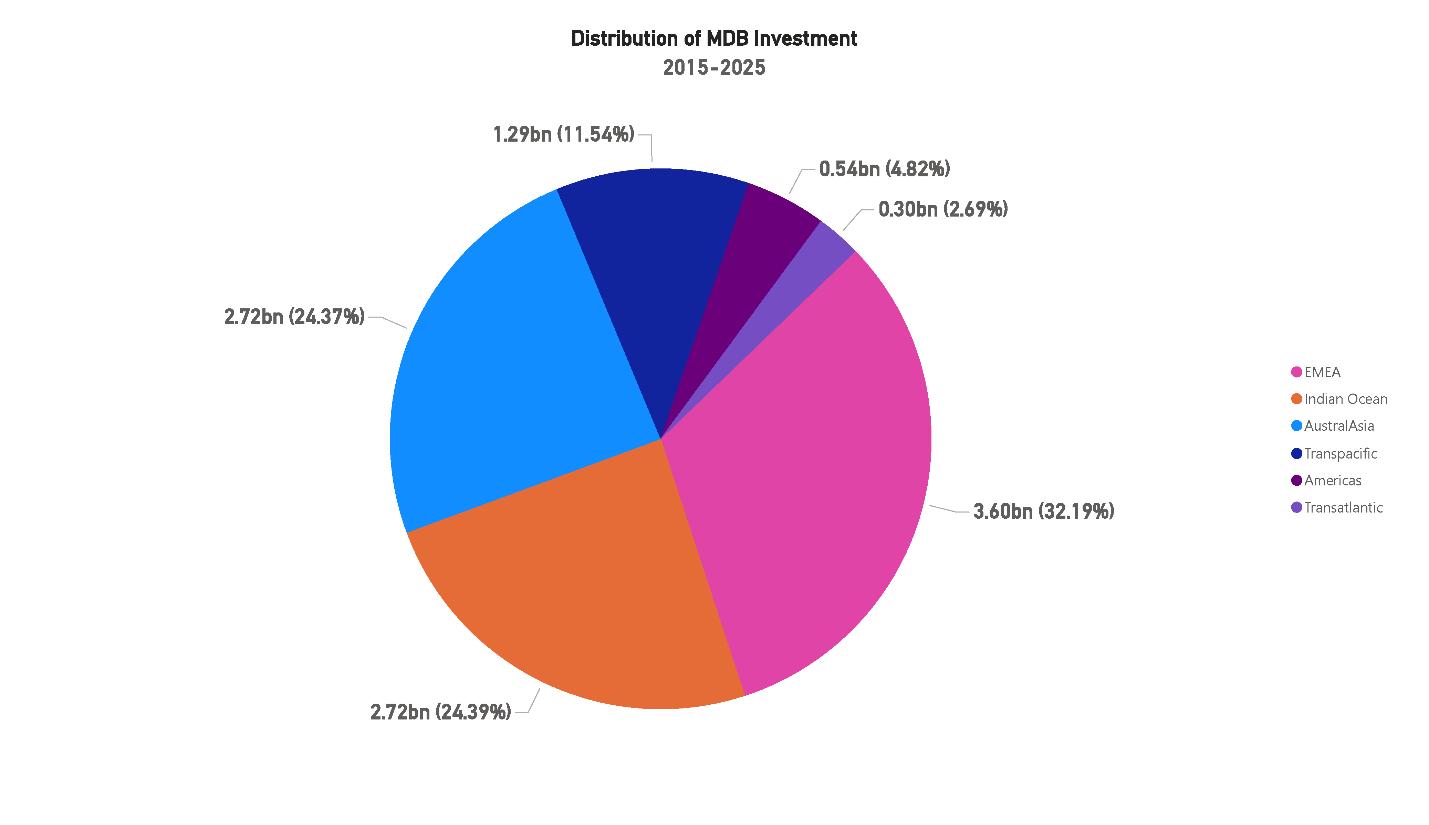
Financing trends reveal a sector that is both independent and adaptive. Self-financing accounts for roughly two-thirds of global project capital—over USD $22 billion—demonstrating the industry’s maturity and confidence. Multilateral Development Bank (MDB) participation remains vital in emerging markets, particularly across Asia-Pacific and the Indian Ocean, where development and security priorities intersect. Debt and equity partnerships are expanding, signaling diversification and risk-sharing as operators pursue long-term stability.
This rebalancing of capital flows illustrates a subtle but important evolution: financial decisions are increasingly driven by geopolitical logic, with investors seeking redundancy, resilience, and regional diversification rather than simply capacity growth.
Technological progress continues to refine, rather than redefine, the industry. The widespread adoption of multi-core and hollow-core fiber, coupled with intelligent network management, is driving efficiency gains across existing infrastructure. Global lit capacity now averages 60% utilization, a historic high that reflects a more disciplined alignment between demand and deployment. Innovations like smart repeaters, 800G wavelengths, and SDM refinements emphasize optimization over expansion—signaling a mature phase of data-driven engineering and operational precision.
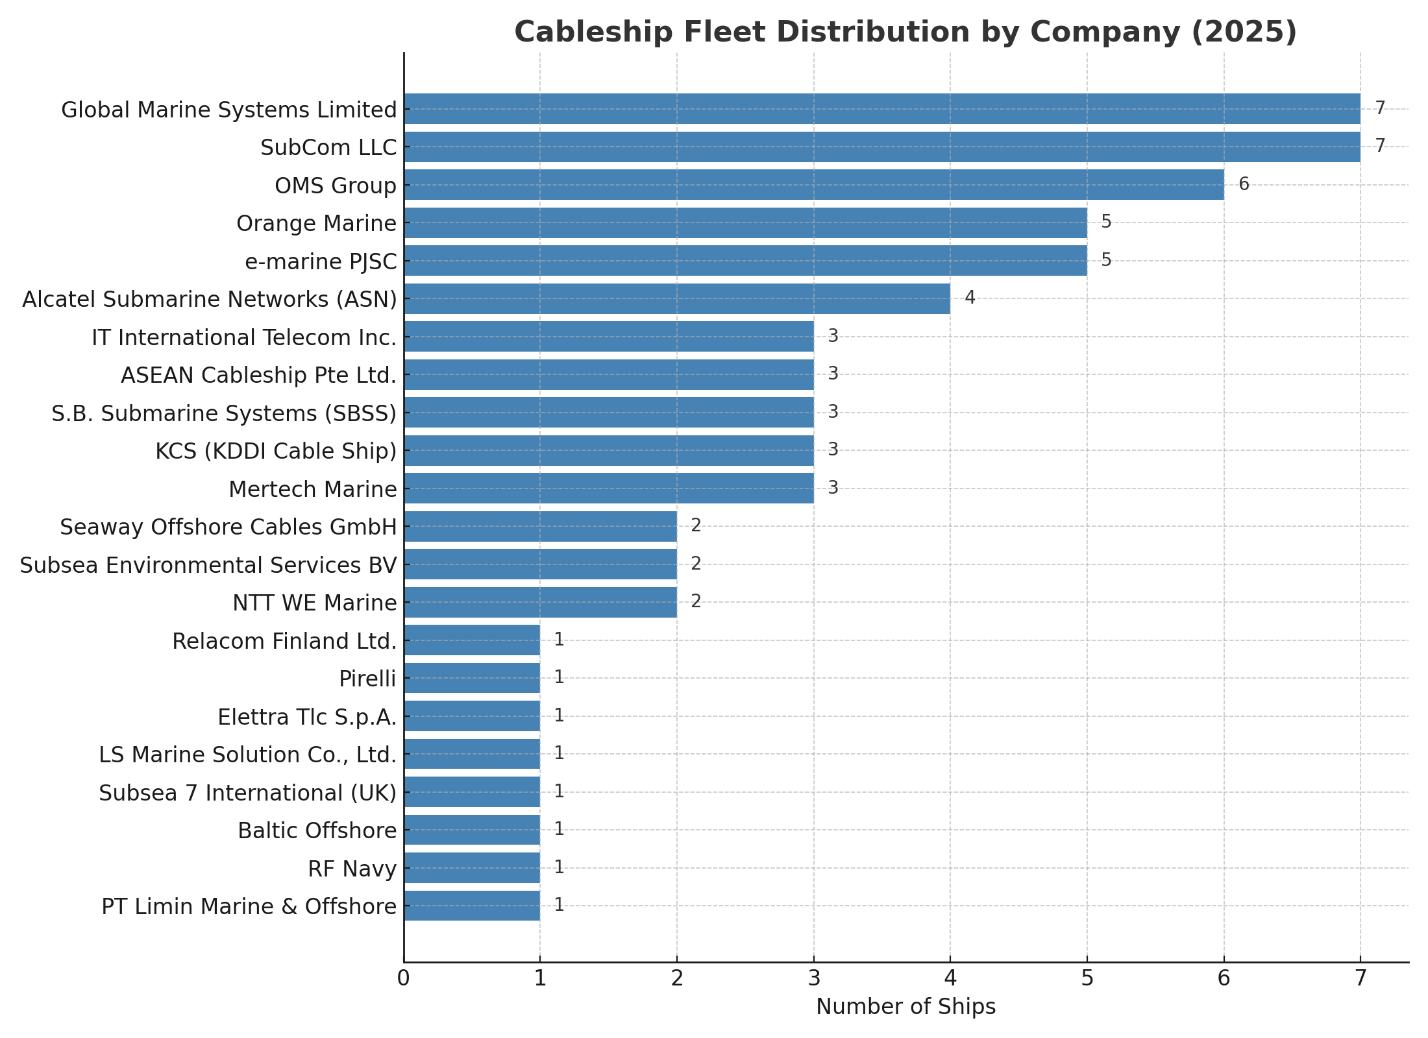
The global cable ship fleet remains a structural bottleneck, holding steady at 63 active vessels. Despite incremental new-
“The global cable ship fleet remains a structural bottleneck, holding steady at 63 active vessels.”
build plans, capacity constraints persist, especially in maintenance coverage across underserved regions such as Africa and the South Pacific. AIS data continues to show vessel concentration near logistical hubs including Singapore, Marseille, and Halifax, underscoring the operational dependence on a limited number of depot clusters. This reality has begun to shape project scheduling, system repair turnaround, and regional resilience planning.
“Perhaps the most transformative development in 2025 is the normalization of sustainability metrics across the industry.”
Perhaps the most transformative development in 2025 is the normalization of sustainability metrics across the industry. Initiatives such as the SubOptic Foundation’s Sustainability Standards and the introduction of PUE, CUE, and REF benchmarks have established measurable baselines for environmental performance. Cable recovery and recycling programs are expanding, while landing stations are increasingly designed to meet verified energy and water efficiency targets. Sustainability is no longer an external expectation—it is now an internal standard embedded in project design, financing, and corporate governance.
A new generation of talent is reshaping the cultural and intellectual fabric of the subsea industry. University programs—such as the University of California, Berkeley’s Sustainable Subsea Networks initiative—are creating formal education pathways that blend engineering, sustainability, and policy. The influx of students and early-career professionals is infusing the sector with fresh perspectives on governance, ethics, and long-term stewardship. This trend signals an enduring shift toward intergenerational continuity and institutional accountability.
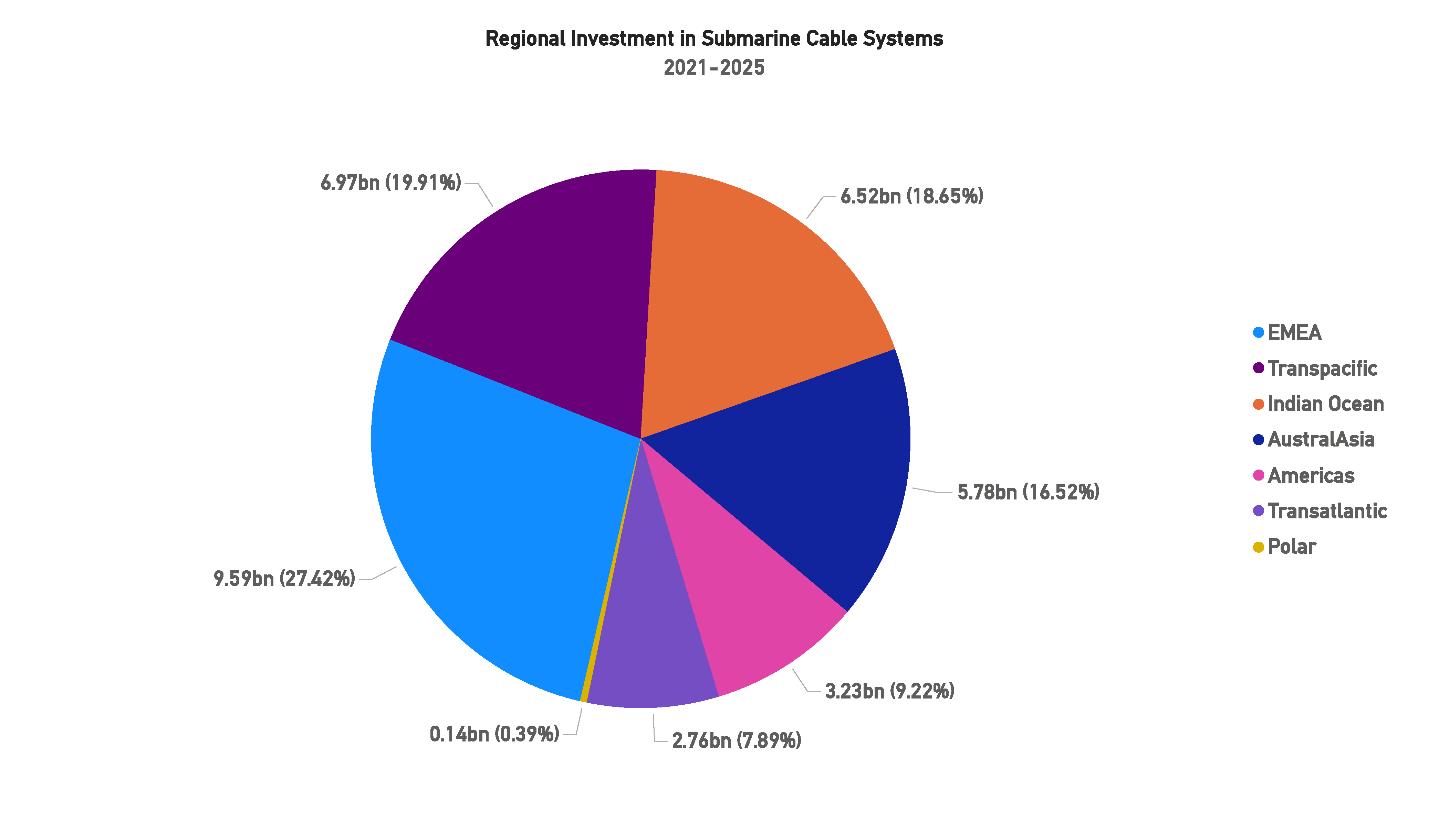
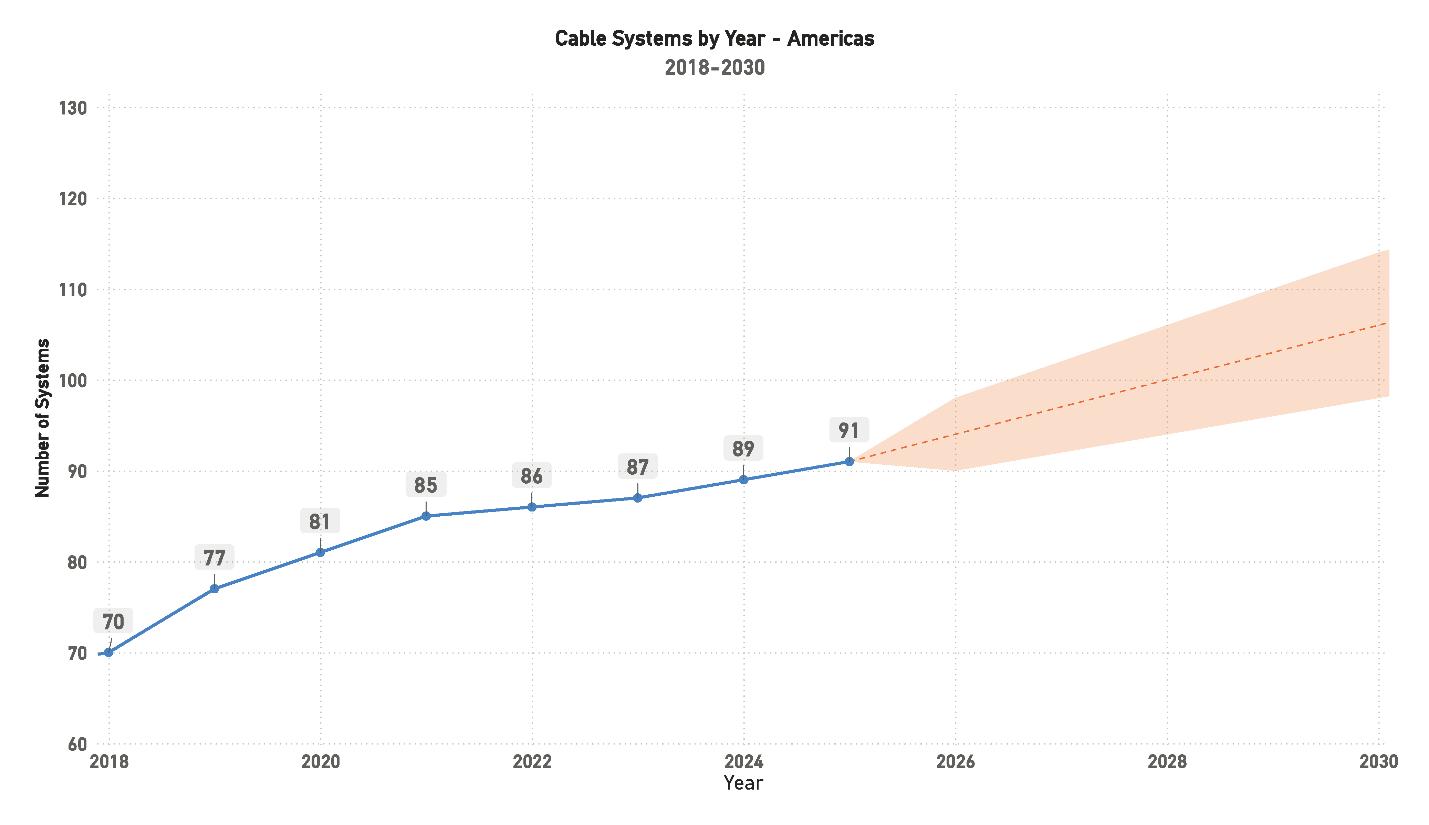
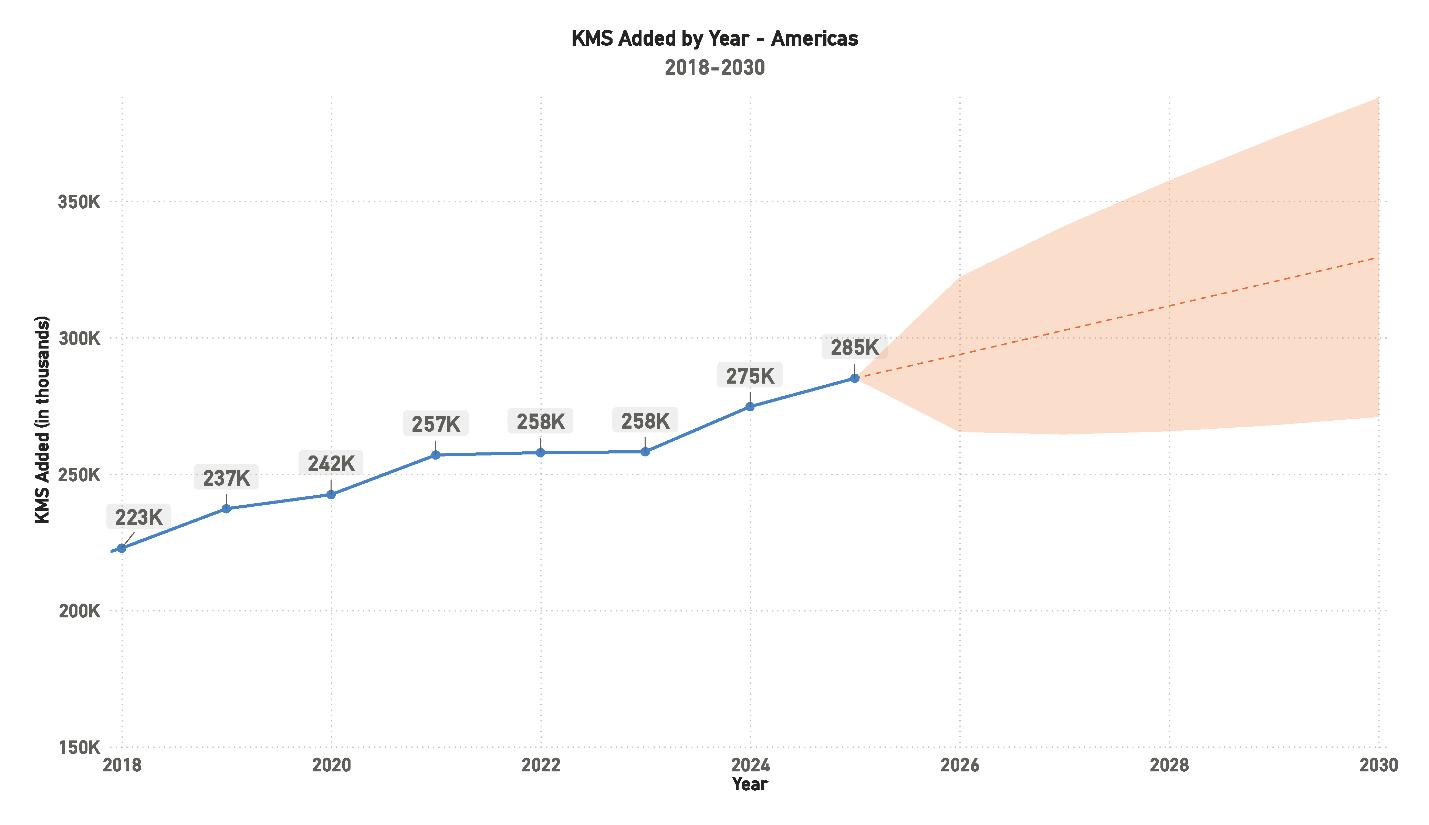
The Americas region continues to show steady growth, driven by hyperscaler investment and system upgrades across North and South America. With 91 active systems, the market remains stable and largely self-financed, reflecting a mature investment environment. Development now centers on modernization and redundancy rather than new routes, though regulatory inconsistency and natural risks still affect project timelines.
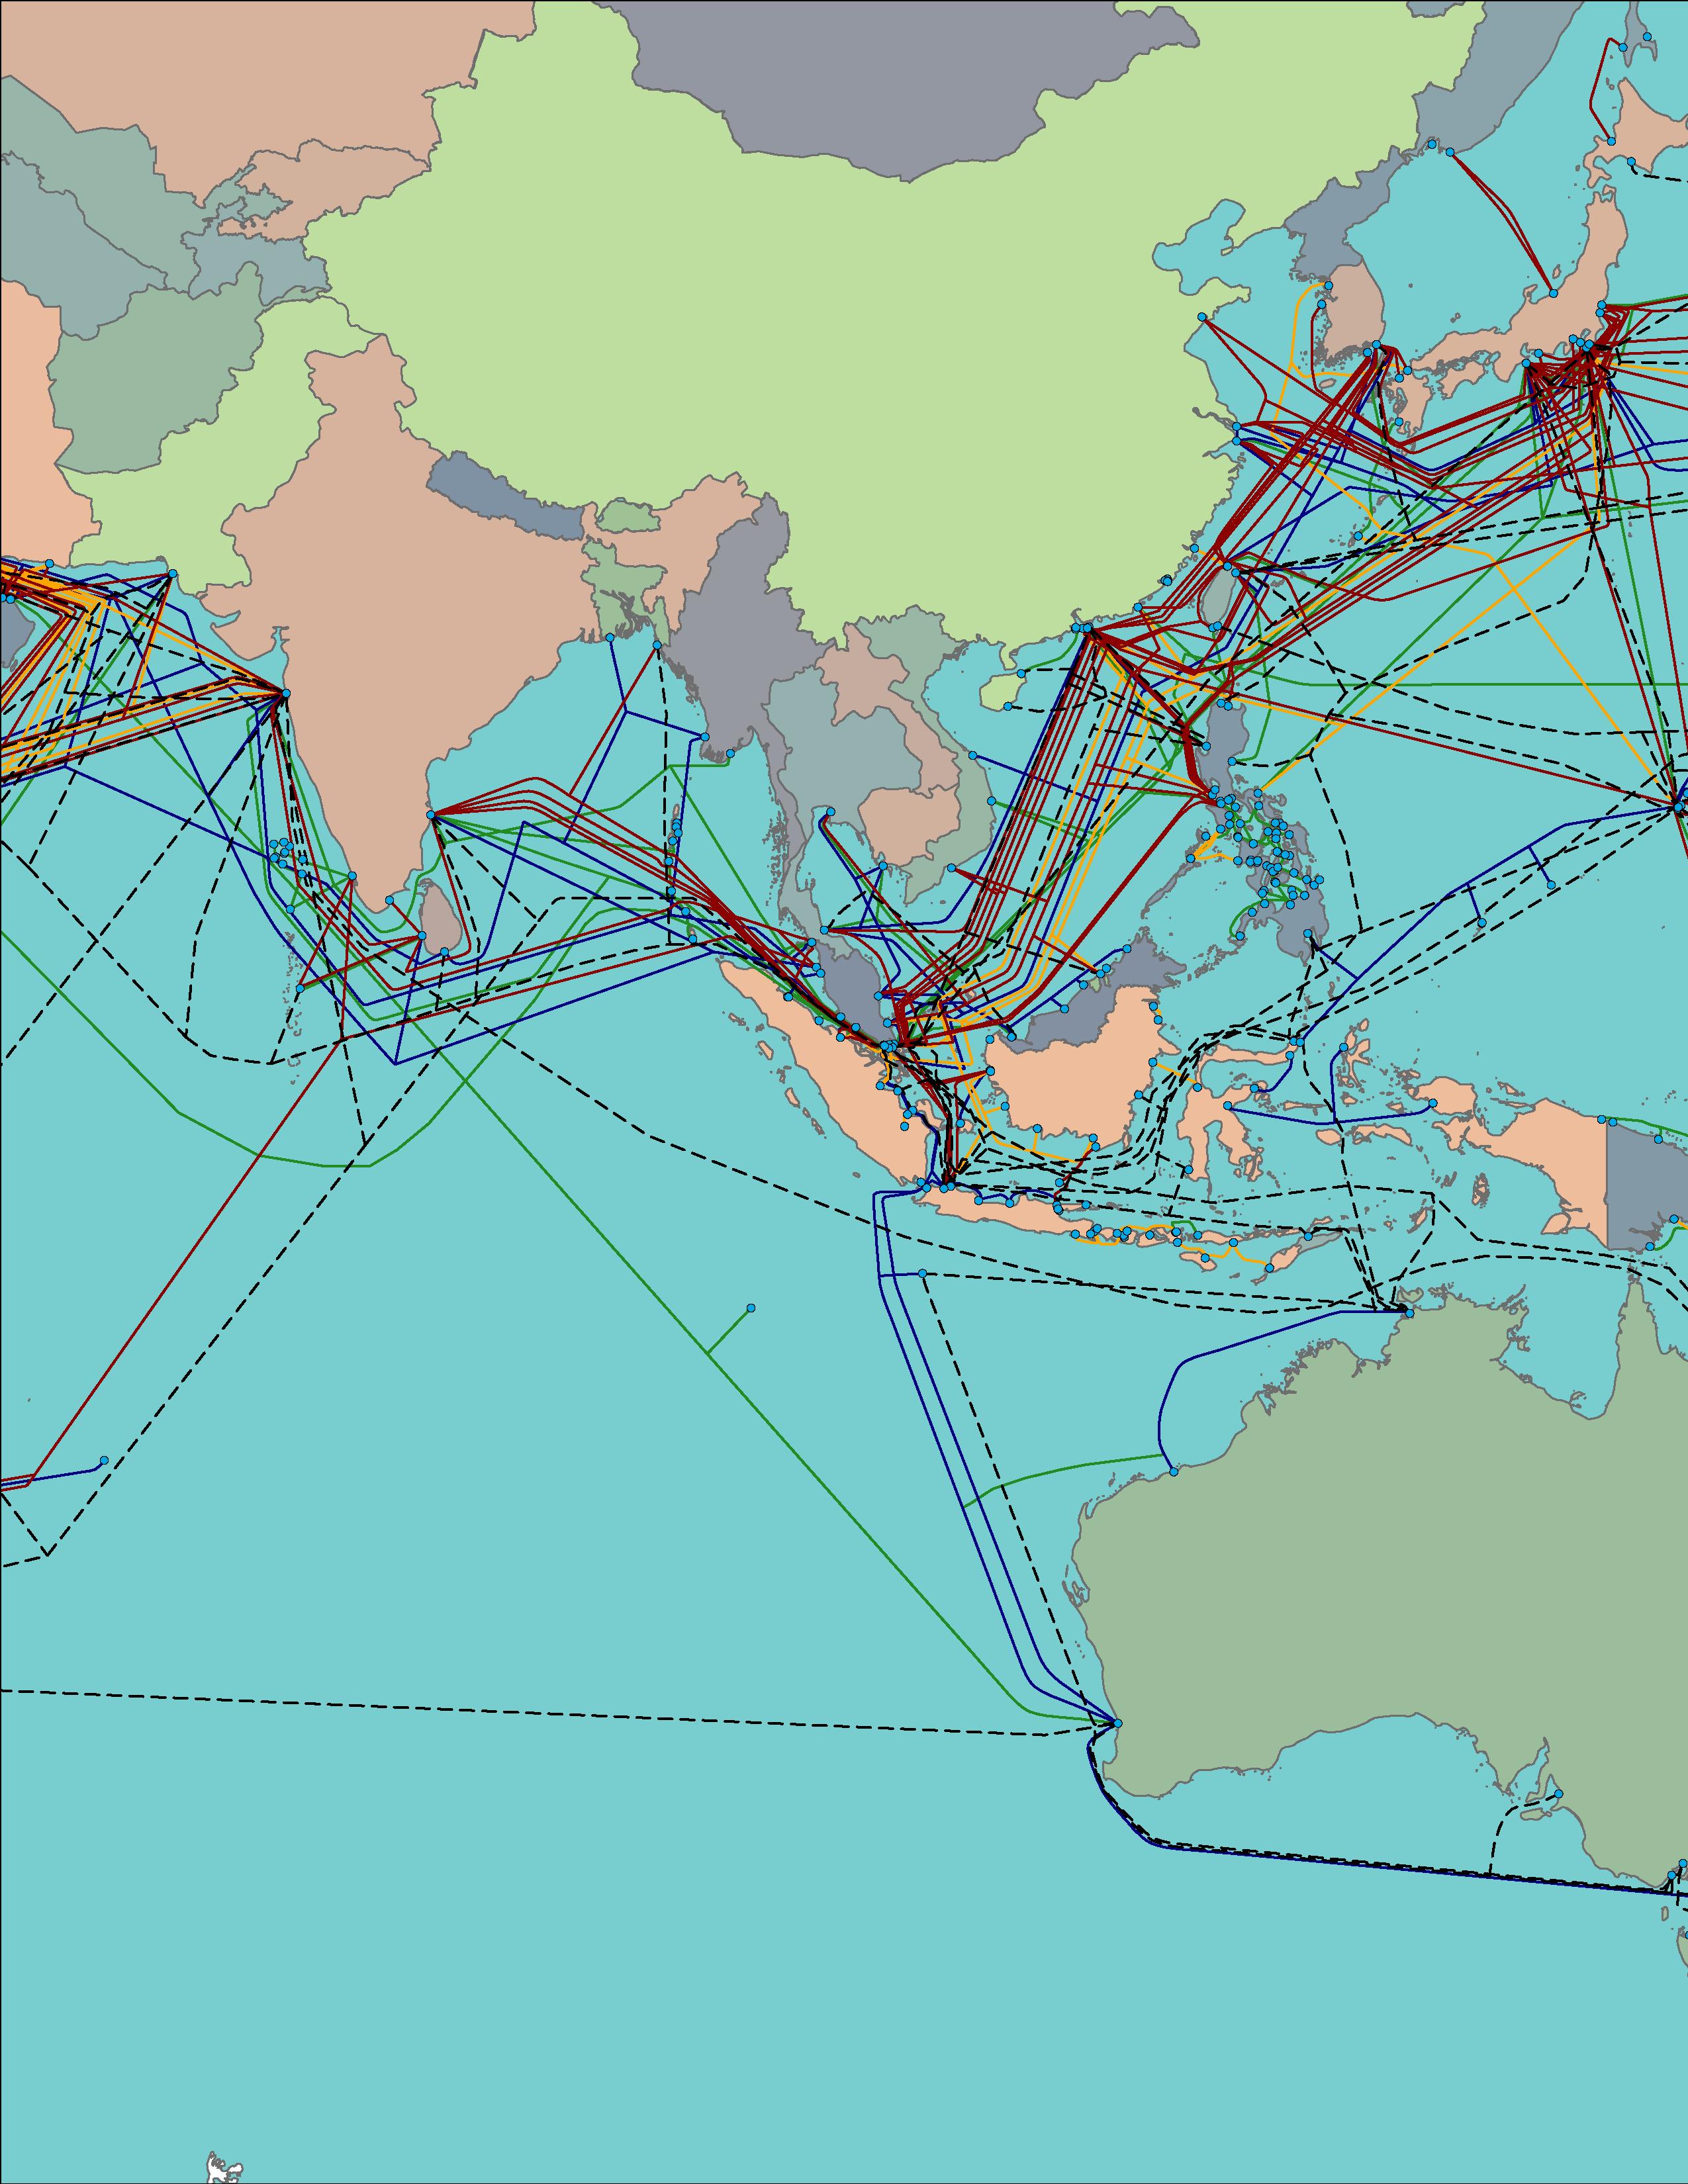
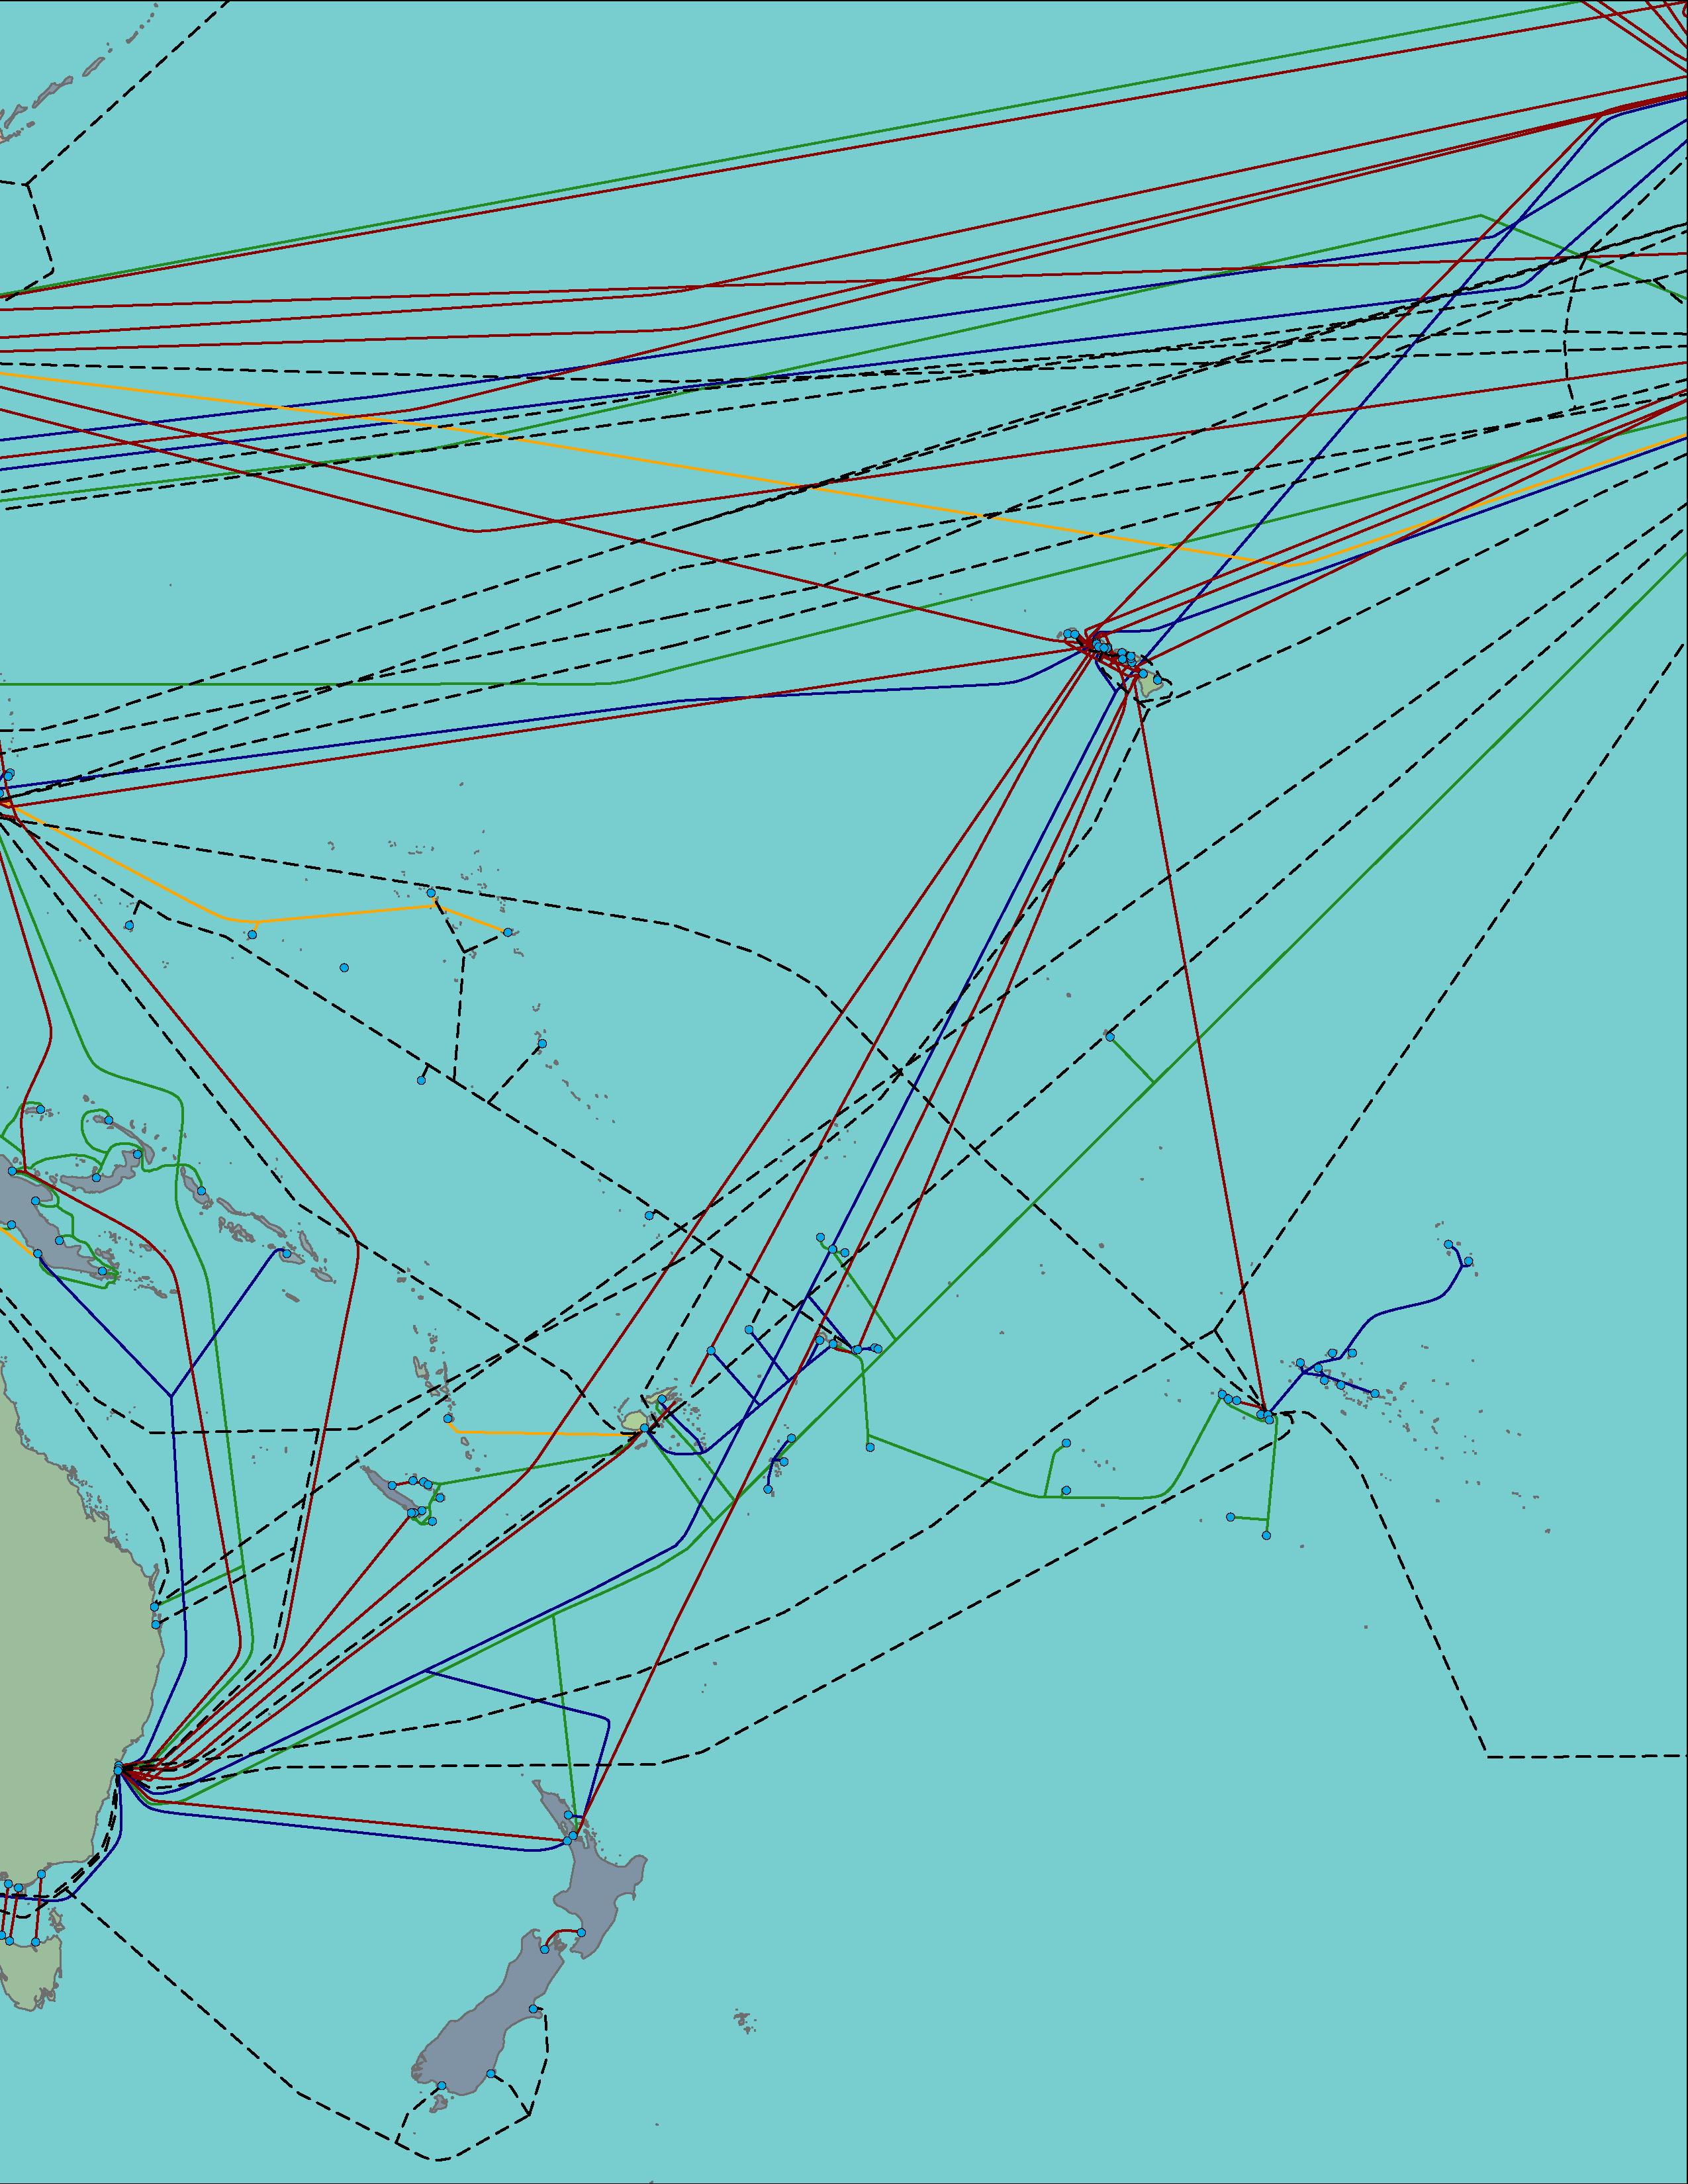
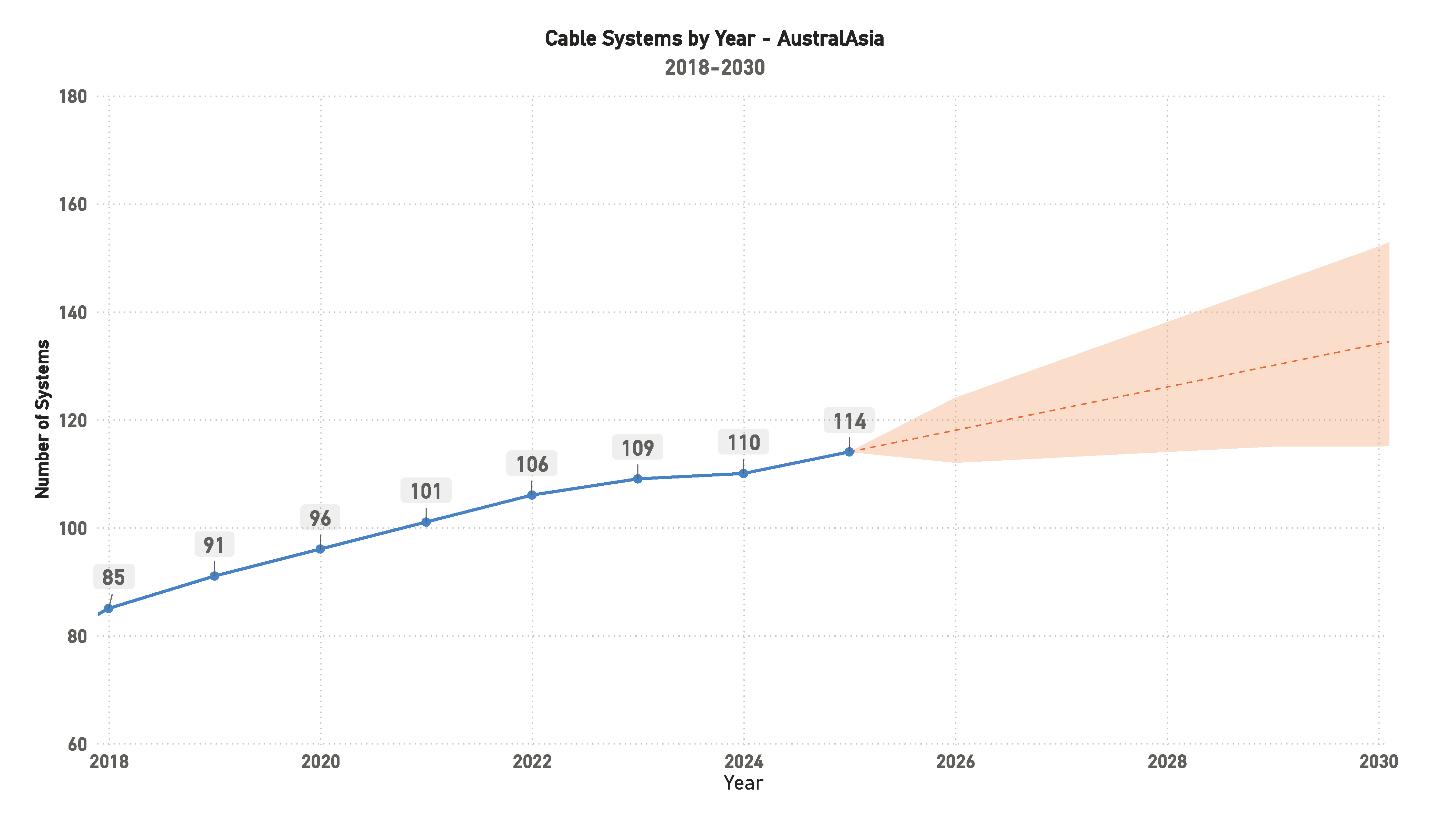
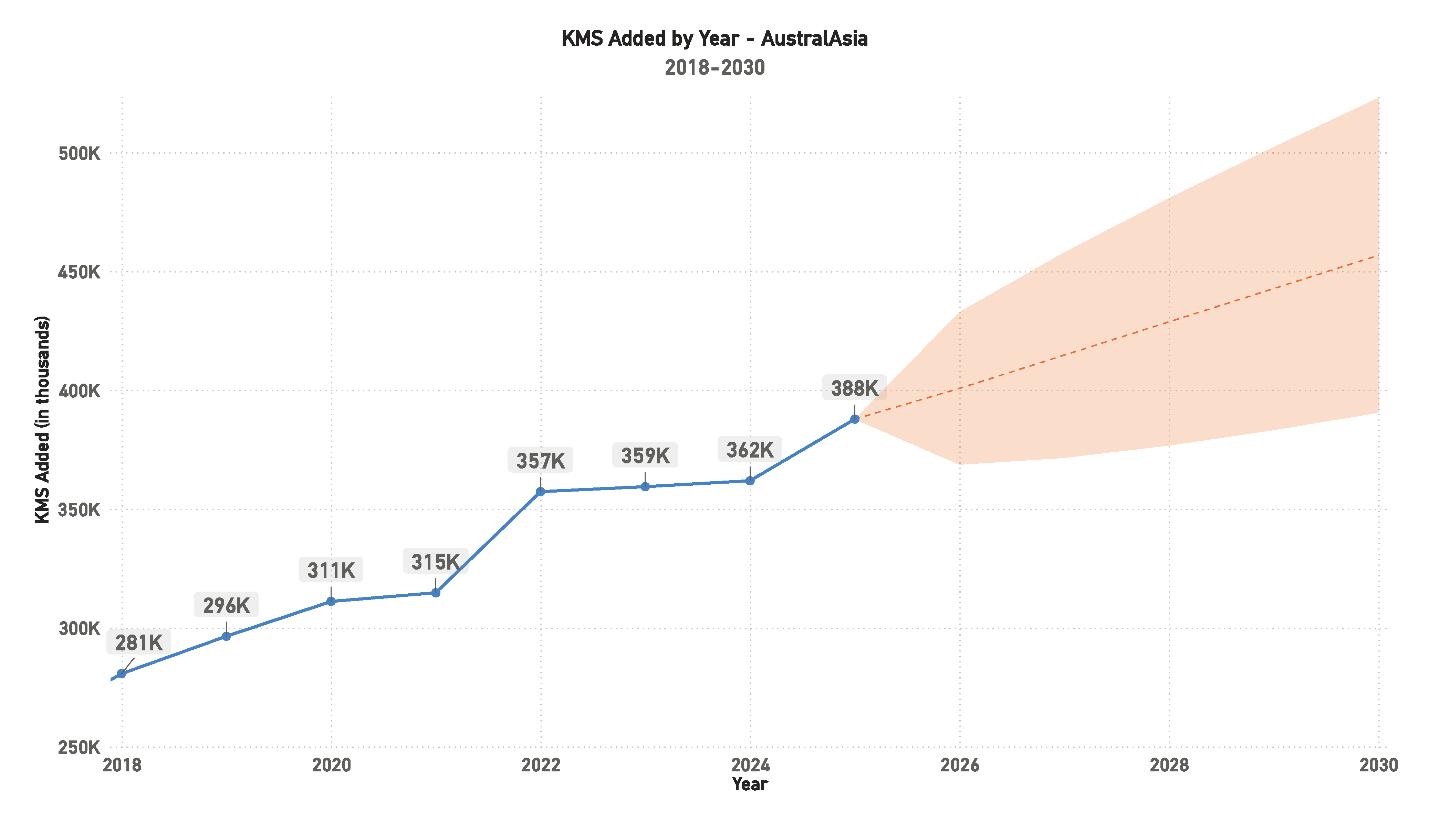
Across the Asia-Pacific and AustralAsia regions, expansion remains strong with 114 systems and 388,000 kilometers of cable in operation. Growth is fueled by large-scale hyperscaler projects and ongoing regional upgrades, supported by rising data center demand. Despite regulatory and environmental challenges in several Southeast Asian markets, the region is projected to surpass 450,000 kilometers by 2030, maintaining its role as a key engine of global capacity growth.
“Across the Asia-Pacific and AustralAsia regions, expansion remains strong with 114 systems and 388,000 kilometers of cable in operation.”
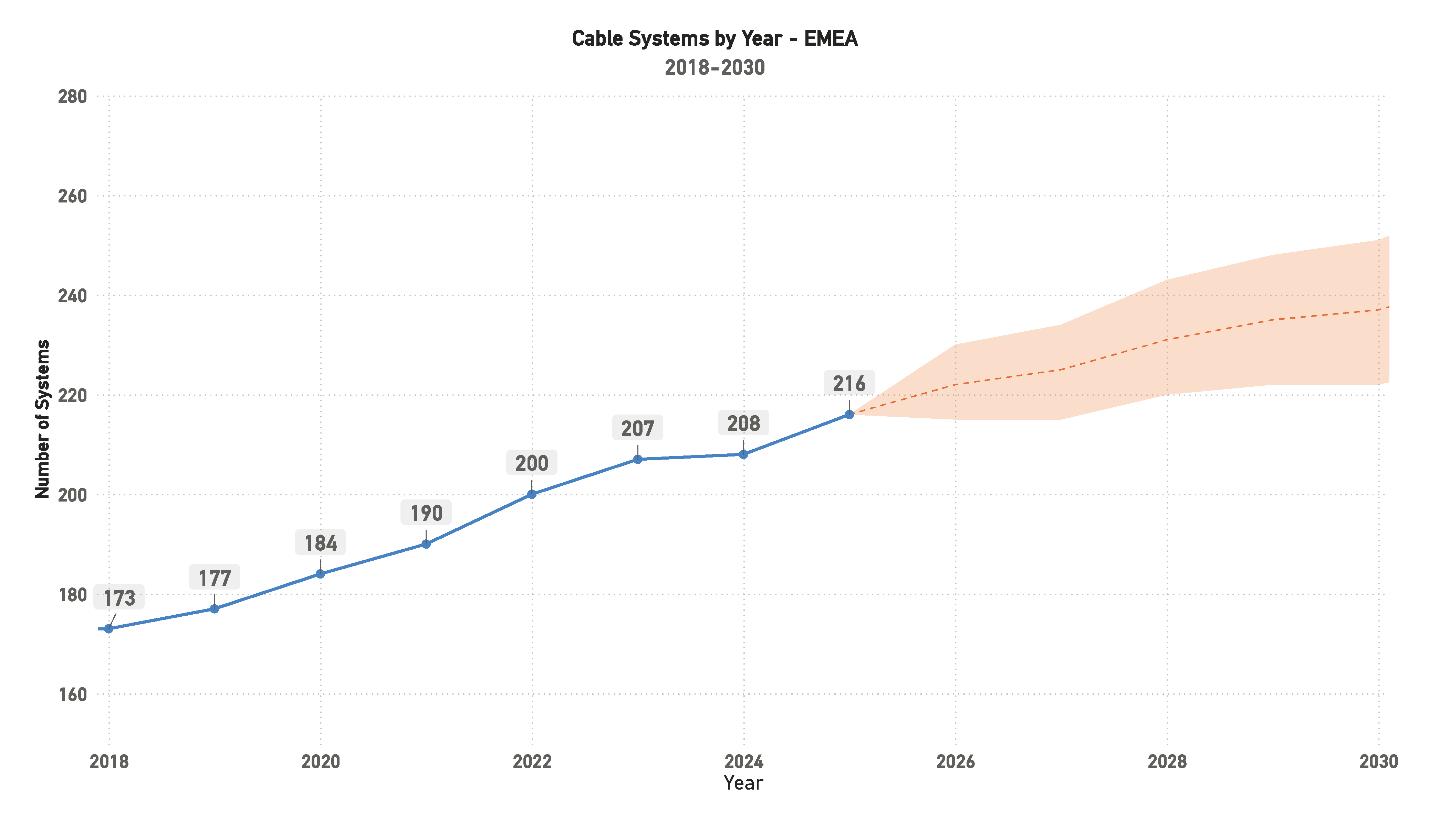
The EMEA region (Europe, Middle East, and Africa) remains the largest and most complex segment of the global subsea market, with 216 systems and 433,000 kilometers of infrastructure. While large-scale expansion continues, particularly in Africa, the region faces regulatory and political challenges, especially around the Red Sea and Suez corridors. Future priorities focus on resilience, route diversity, and network security across the Mediterranean and North Atlantic.
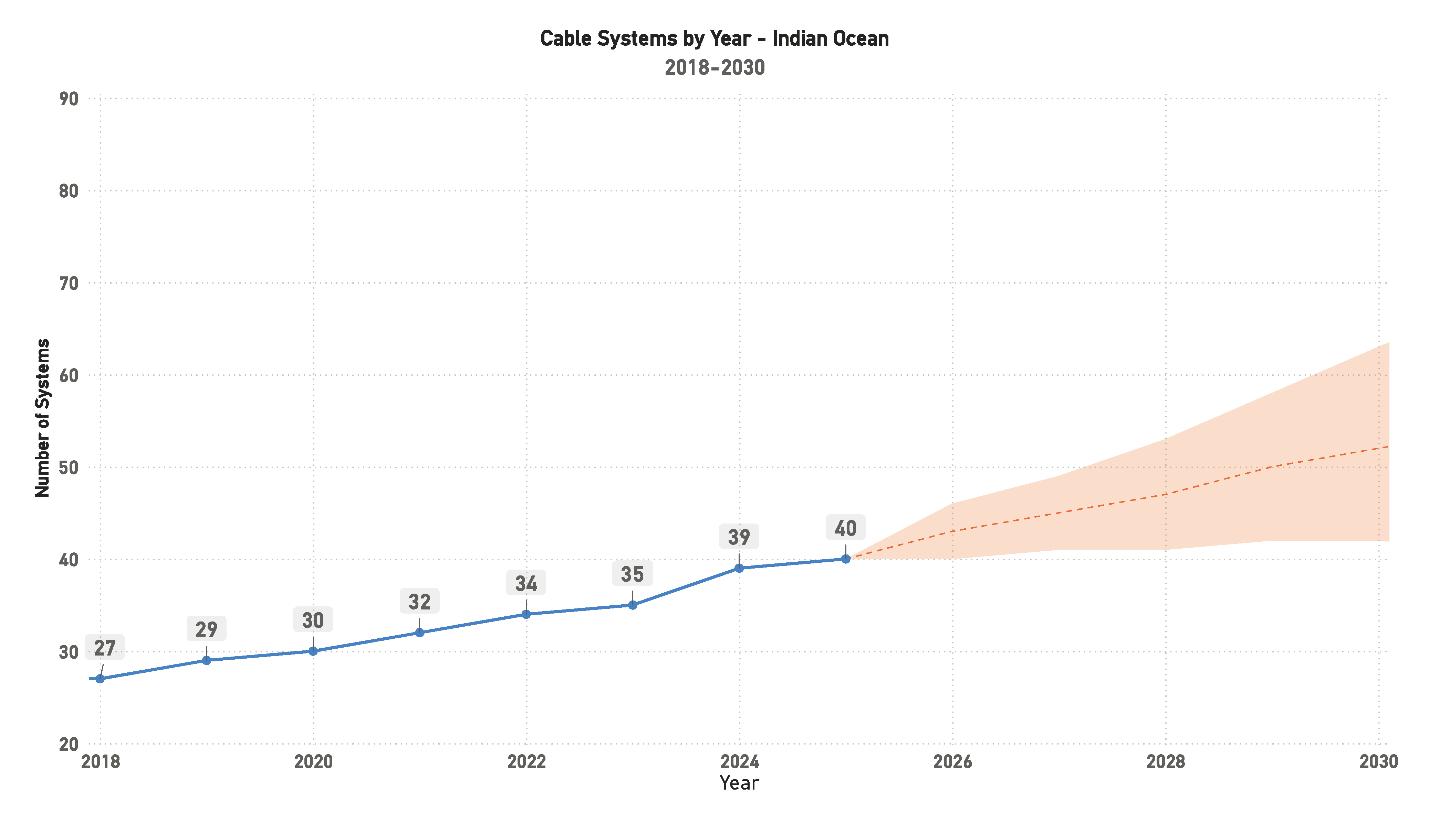
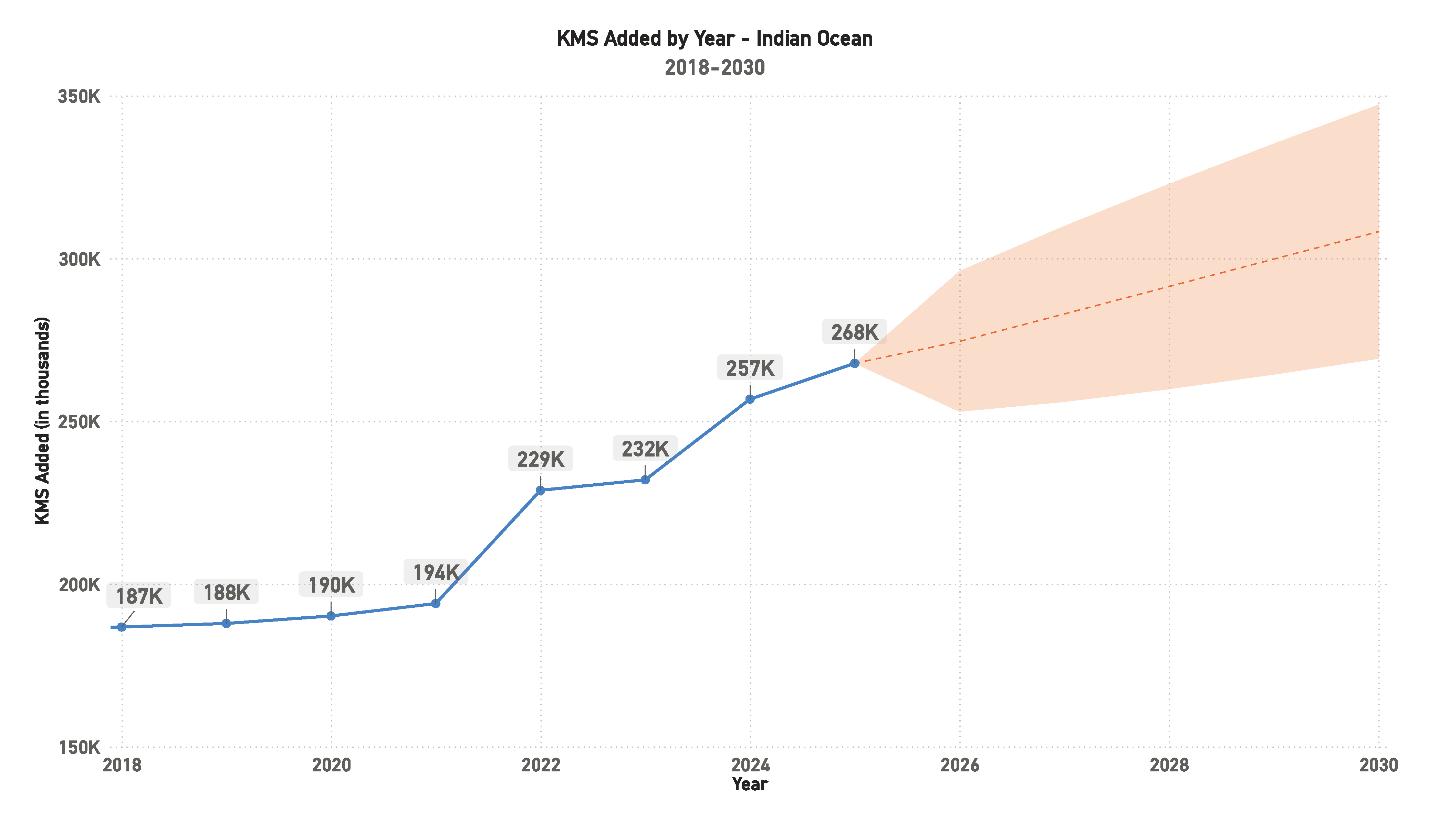
The Indian Ocean region has become an important connectivity bridge between Asia, Africa, and Europe. It now supports 40 systems totaling 268,000 kilometers, projected to exceed 300,000 kilometers by 2030. Growth is steady but uneven, reflecting varied regulatory and economic conditions, while the re-
gion’s strategic role in global redundancy continues to expand.
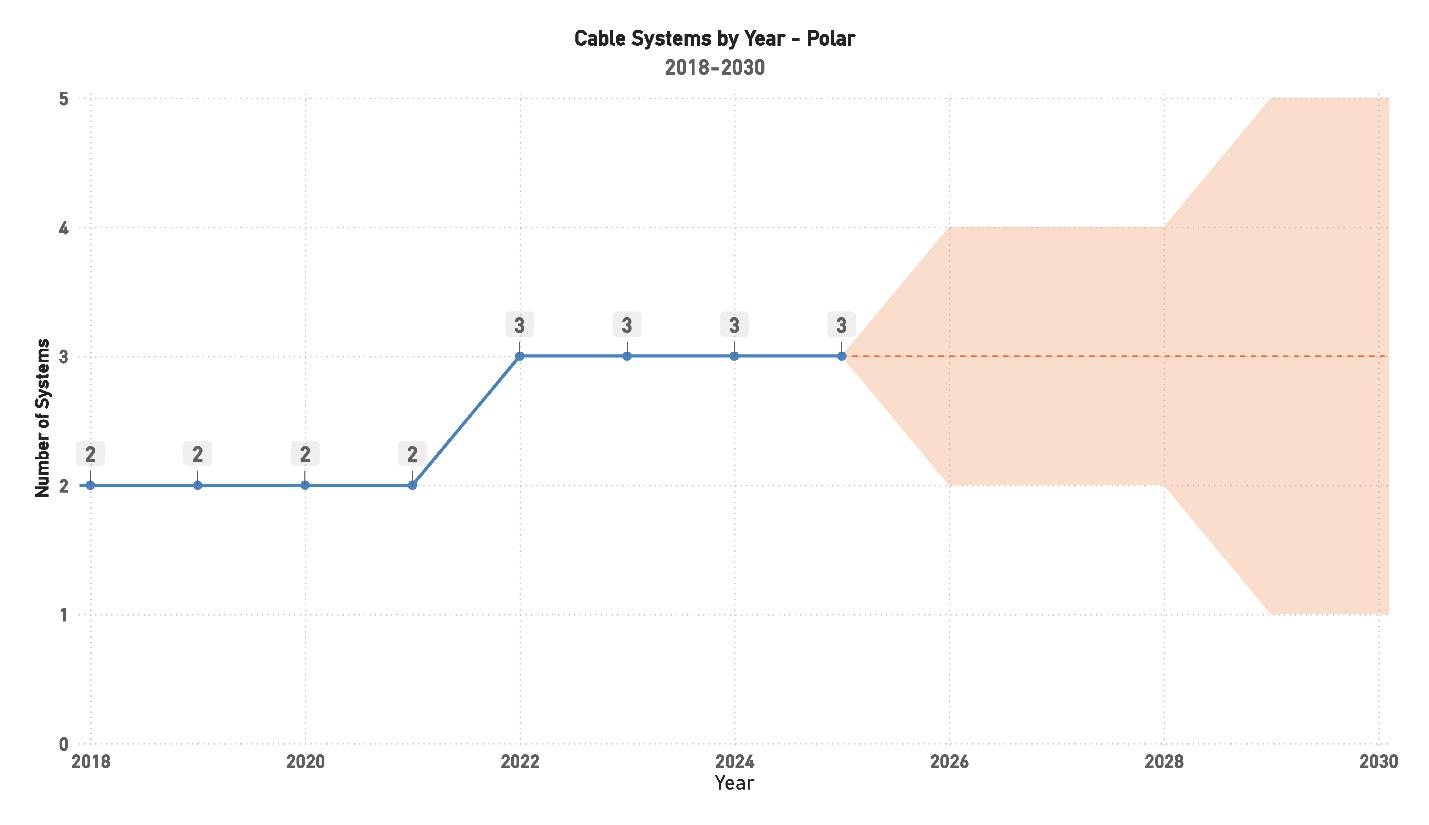
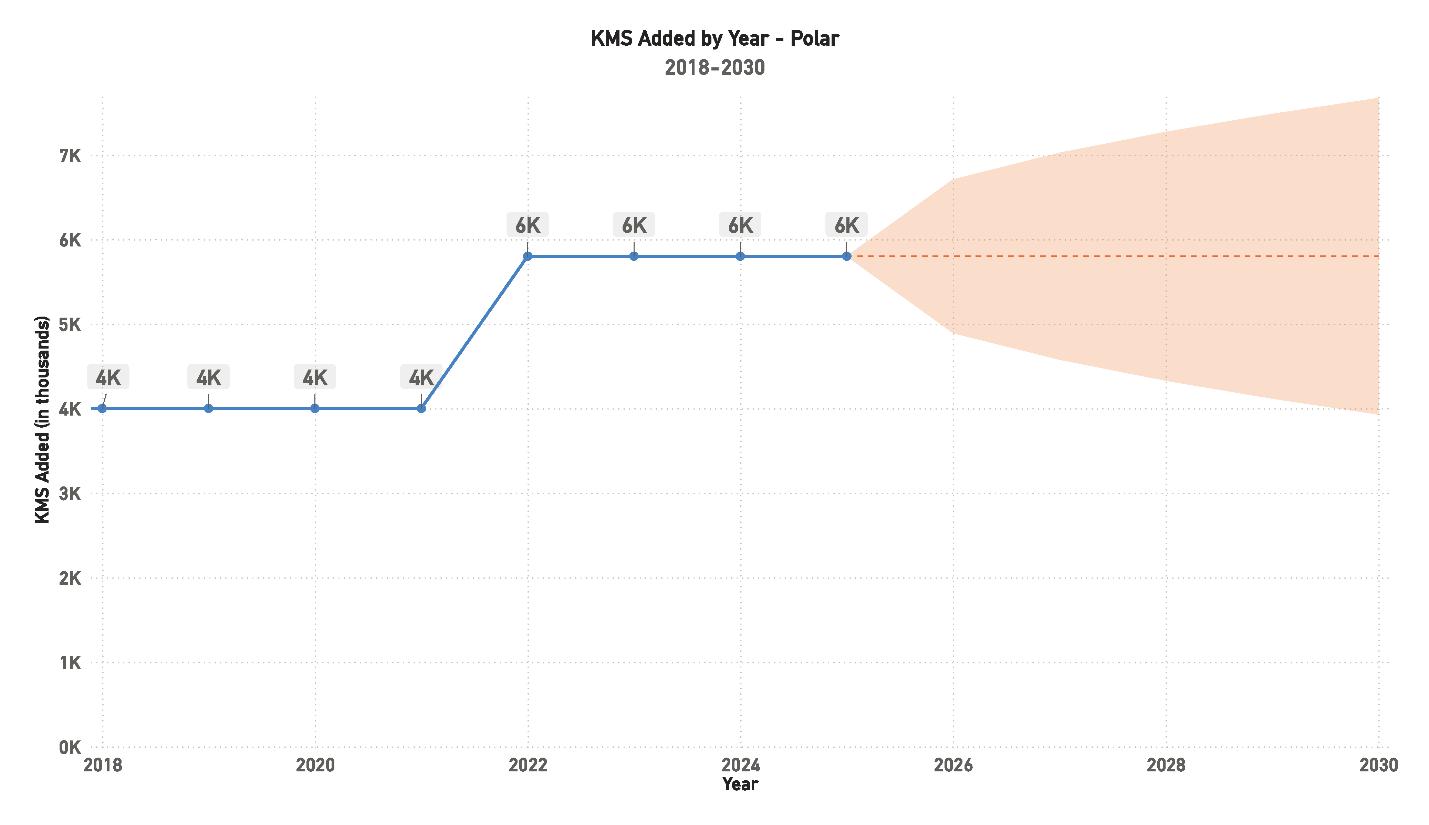
The Polar region remains small but strategically significant, with three operational systems and four in planning. Development is limited by cost, climate, and geopolitical barriers, but long-term prospects include shorter, lower-latency routes between Europe and Asia.
“The Polar region remains small but strategically significant, with three operational systems and four in planning.”
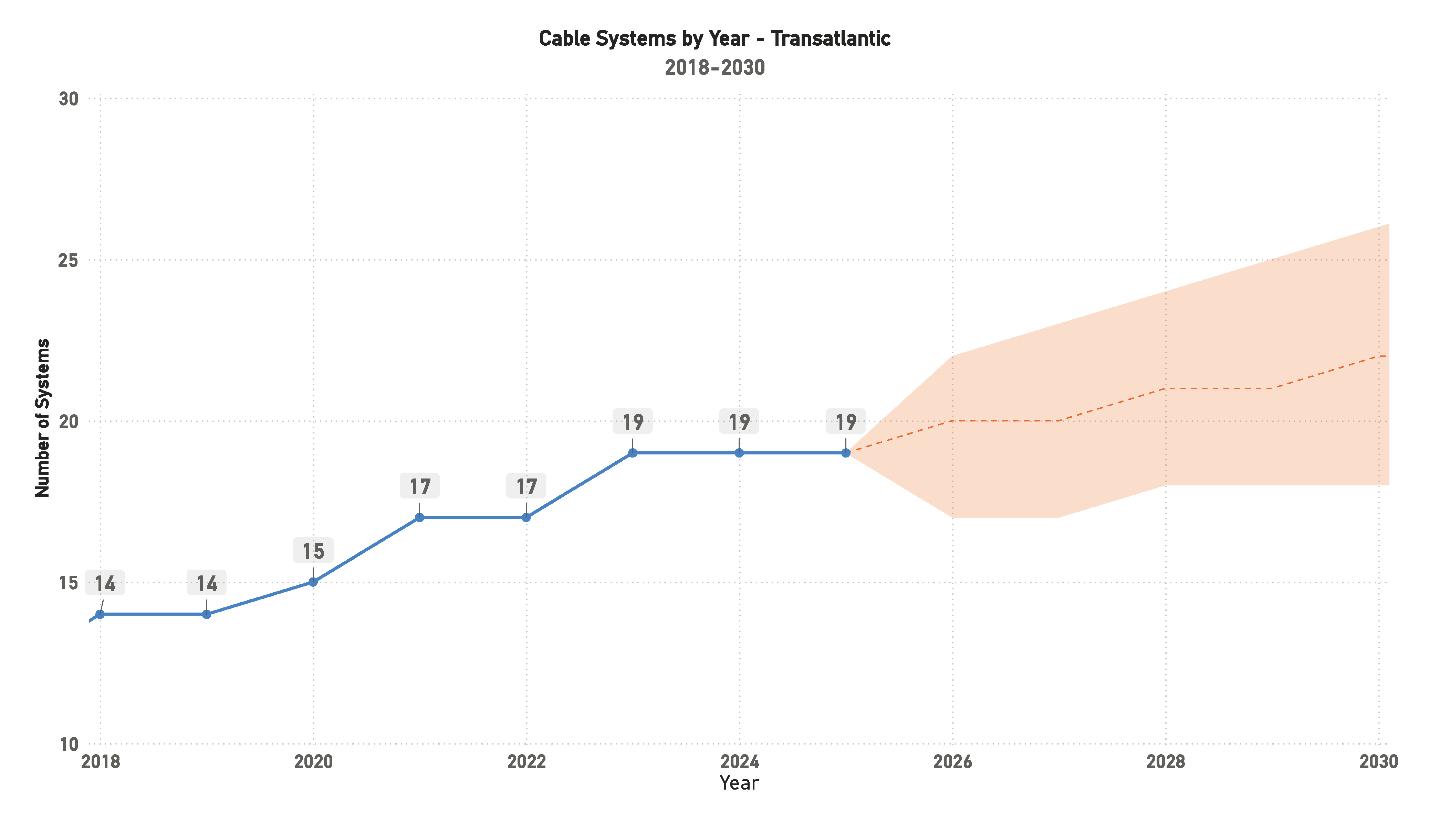
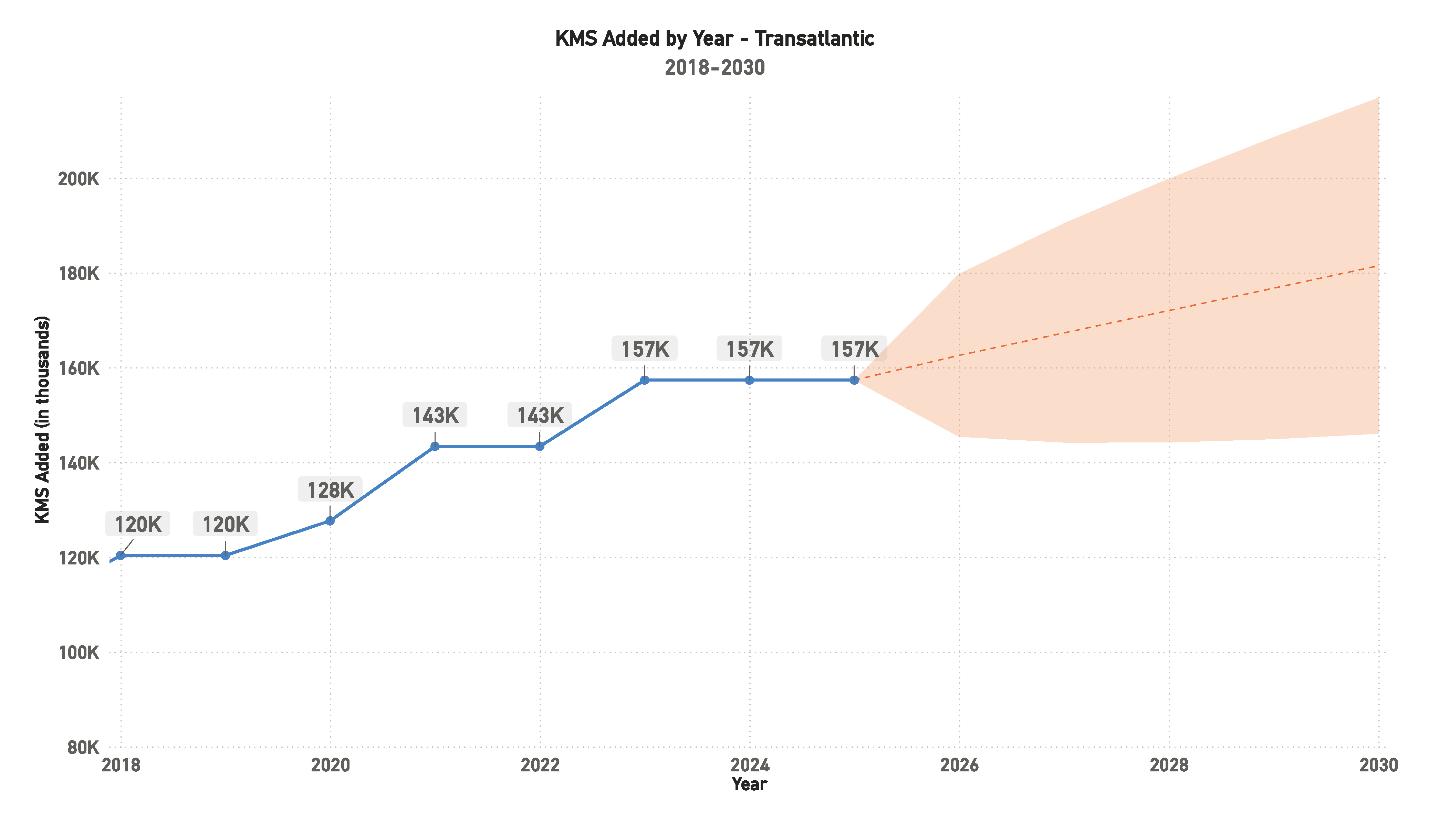
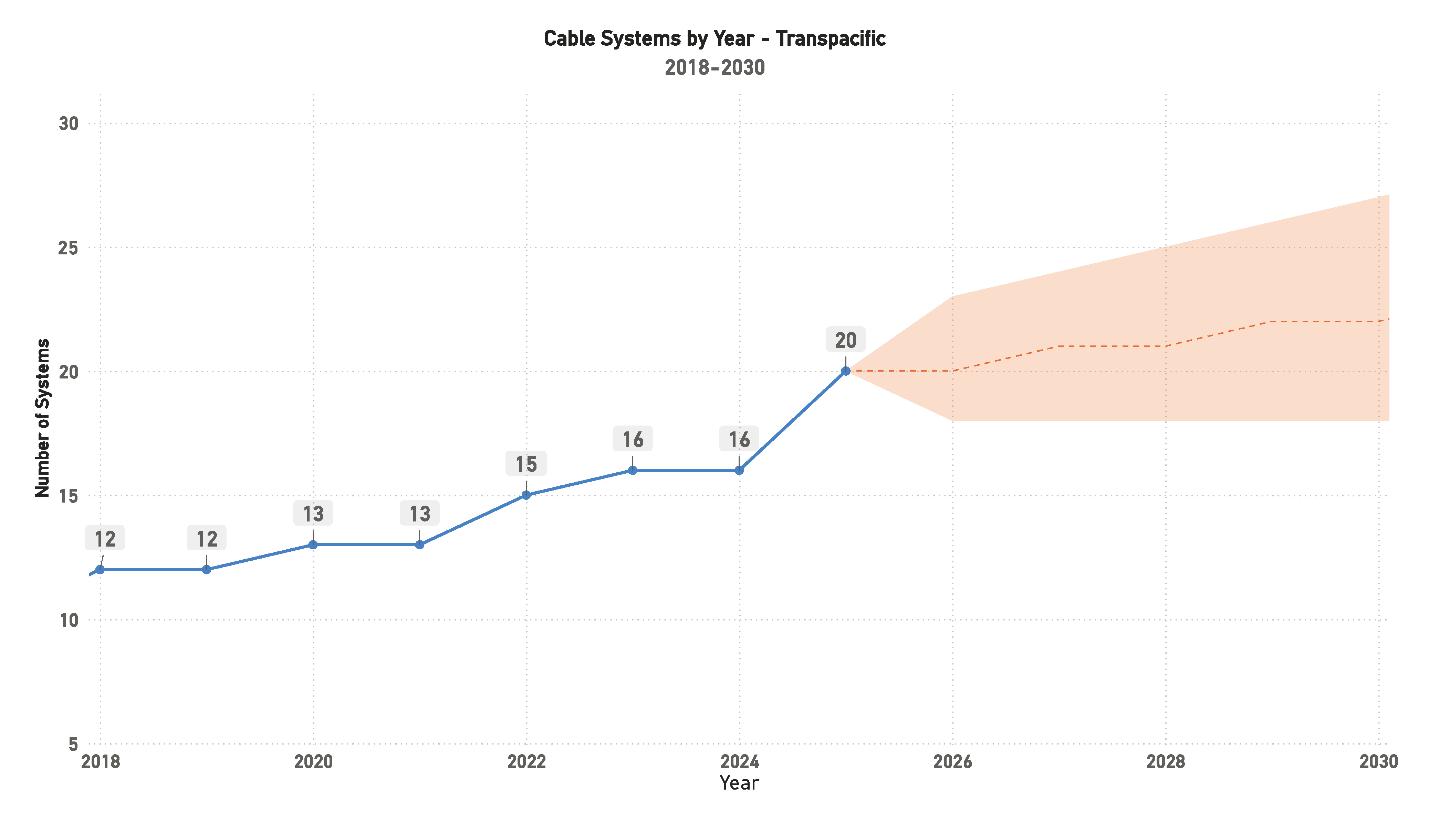
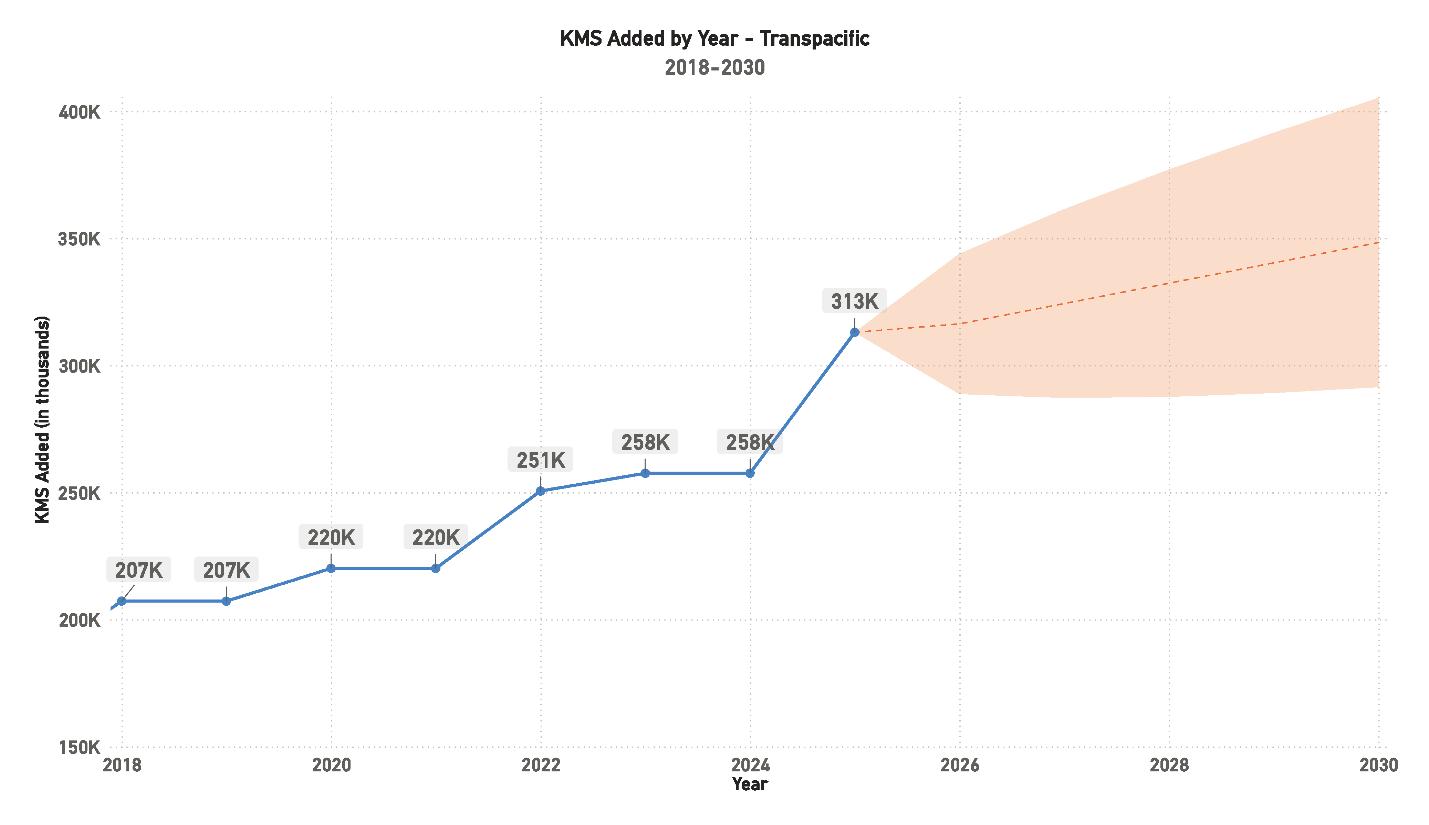
The Transatlantic and Transpacific corridors continue to define the backbone of global data transmission. The Transatlantic route remains the most established and heavily utilized, while the Transpacific corridor— now exceeding 300,000 kilometers of deployed cable—leads in new capacity additions and technology adoption. Both regions are shifting focus from expansion toward optimization, emphasizing efficiency, resilience, and route diversification as global data traffic continues to rise.
The coming years will test the industry’s ability to balance growth, resilience, and environmental responsibility within a fragmented global landscape. Market concentration among hyperscalers will continue to attract regulatory scrutiny, while investment diversification and public-private coordination will shape the next generation of connectivity projects.
Above all, the submarine cable industry stands at the threshold of an integrated era—where governance, technology, and sustainability converge to define its future. The cables that once symbolized raw expansion now represent global coordination: a networked infrastructure not just of fiber and steel, but of policy, accountability, and shared responsibility.
Rewriting how we explore SubTel Forum
Total Unique Authors: 770
Total Tags: 276
TOP 5 TAGS BY ARTICLE COUNT:
Network Operations & Management –943 articles
Technology – 820 articles
Risk & Safety Management – 720 articles
Project Management – 670 articles
Regions & Countries – 508 articles
1. GLOBAL OVERVIEW
1.1. INDUSTRY SENTIMENT
The first dedicated Industry Sentiment Survey was conducted in 2023, providing a foundational snapshot of perspectives within the submarine fiber-optic telecommunications sector. That inaugural effort captured broad industry attitudes around optimism, workload, and market confidence, offering a baseline for measuring growth and change. In 2024, the survey was refined with expanded, standardized questions to improve comparability and analytical depth. This methodological update established a consistent framework, enabling direct year-over-year trend tracking and richer insights into sentiment, investment, and operational dynamics. Now, with aligned datasets from 2024 and 2025, the survey provides a reliable, longitudinal view of how the industry perceives its health, challenges, and direction—an essential tool for understanding how confidence and activity evolve as the market continues to mature.
The 2023 responses reflected a market still emerging from several years of rapid global infrastructure expansion. Overall sentiment was positive, but cautious. Most participants described the industry as optimistic rather than very optimistic, signaling steady confidence tempered by uncertainty around project delivery timelines, regulatory pressures, and cost inflation. Investment expectations were moderate, with respondents citing selective capital deployment and regional disparities in growth potential. Workforce-related feedback emphasized both rising demand for technical expertise and growing concern about talent shortages, particularly in project engineering and marine operations. In retrospect, the 2023 findings captured an industry on the verge of acceleration—poised for the sustained optimism and activity levels that would define 2024 and 2025.
Together, the 2023 baseline and the now-standardized 2024 and 2025 surveys create a comprehensive, comparable dataset. The following analysis examines each question individually, illustrating how industry sentiment has evolved across key themes such as market outlook, investment, project performance, technology readiness, and workforce development. Each chart highlights measurable yearto-year shifts, offering a clear narrative of where the submarine cable industry stands today—and where it is heading.
“The submarine cable industry is best described as ‘coopetition’—a place where competitors and colleagues come together to confront near existential challenges… The unique capacity of this industry to cooperate remains one of its greatest assets.”
Stuart Barnes – Xtera (STF Issue 142)
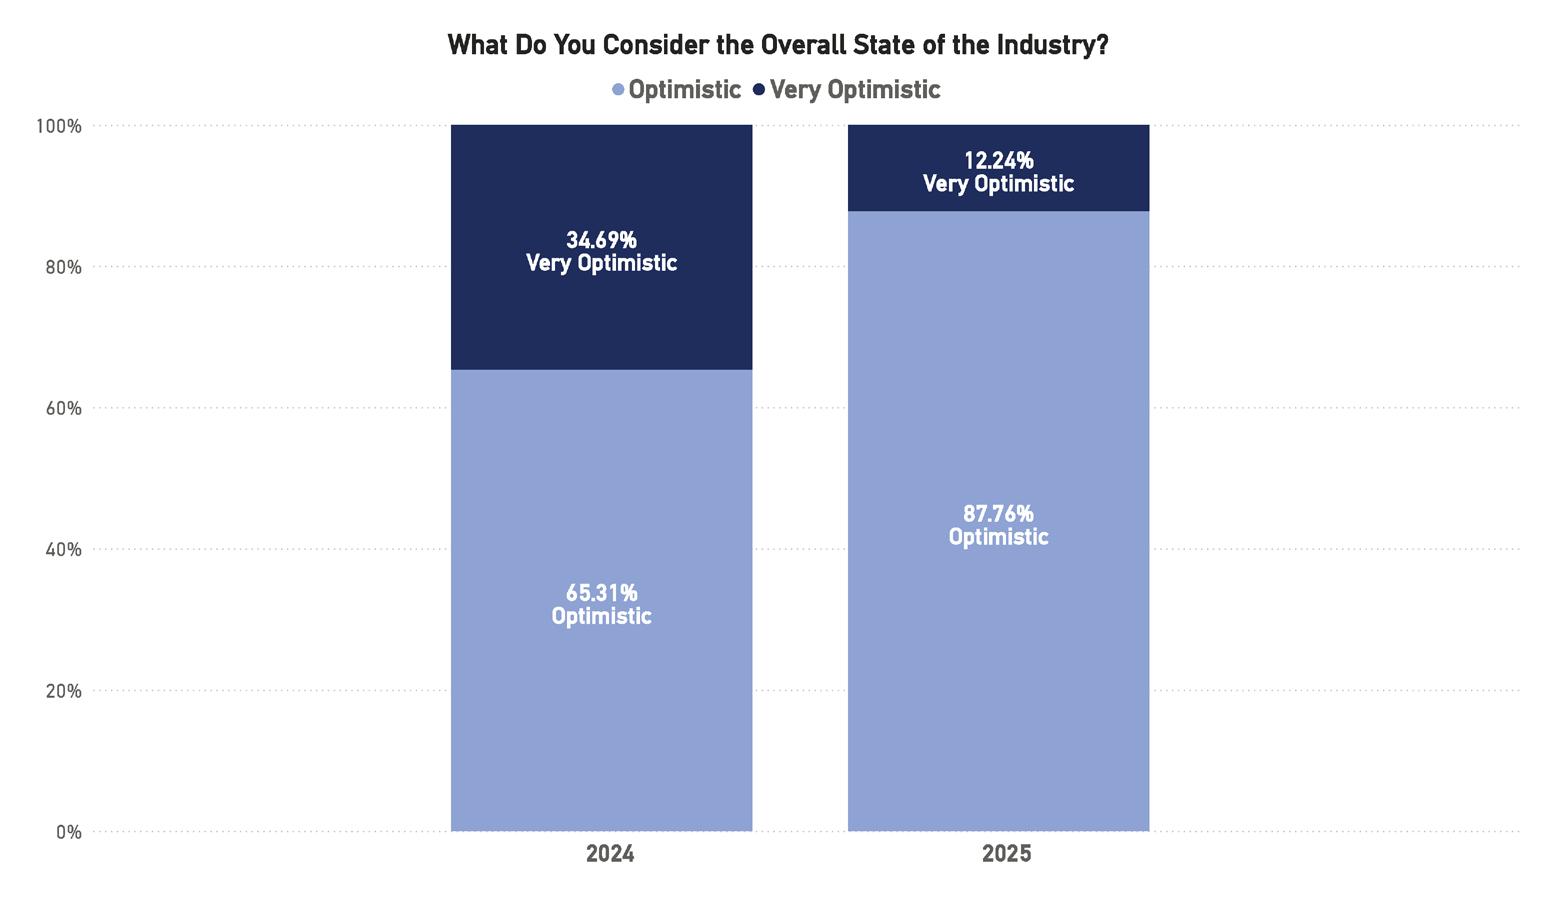
Figure 1: Overall State of the Industry
industry continues to demonstrate exceptionally strong confidence, with 100% of respondents maintaining a positive outlook for 2025. However, the composition of that optimism has shifted. The proportion of those identifying as very optimistic declined from 34.69% in 2024 to 12.24% in 2025, while those describing themselves as optimistic increased to nearly 88%. This adjustment reflects a more balanced confidence—stakeholders remain highly positive about the industry’s direction but are tempering expectations after a sustained period of expansion. Overall, the findings indicate a maturing market: enthusiasm remains high, but with a pragmatic awareness of the logistical, regulatory, and resource challenges that accompany continued growth.
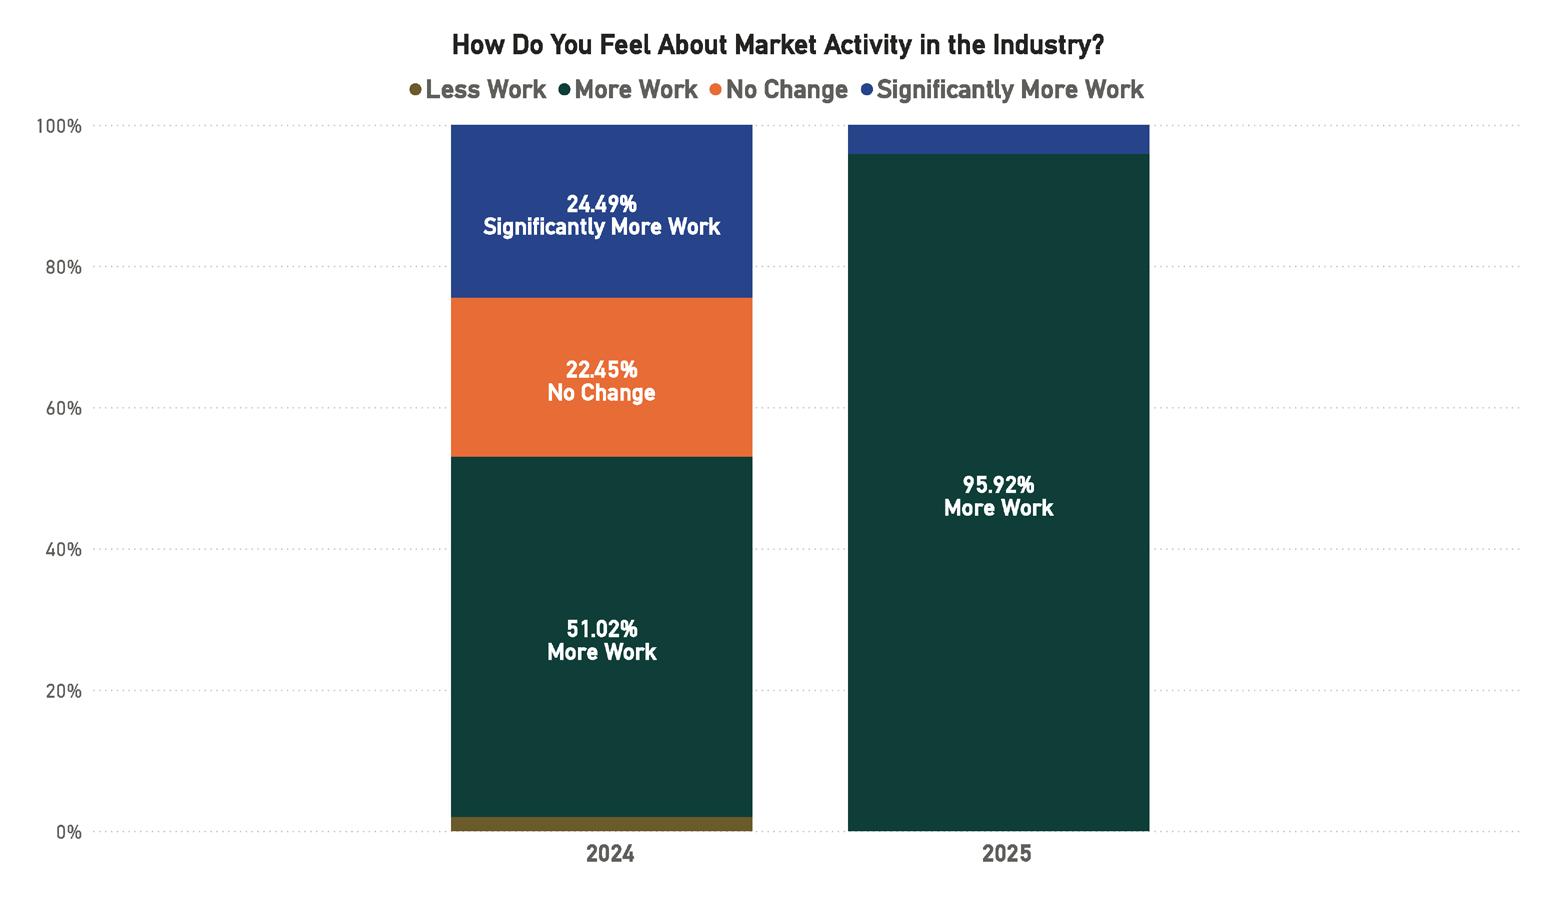
Figure 2: Industry Market Activity
Perceptions of market activity strengthened notably in 2025, marking one of the most pronounced yearover-year improvements in the survey. Nearly 96% of respondents reported experiencing more work than in 2024, compared to just 51% the prior year. Meanwhile, the share reporting no change fell from 22.45% to 0%, and those citing significantly more work consolidated into the broader category of increased activ-
ity. The virtual disappearance of negative or neutral responses underscores a period of unprecedented demand across both mature and emerging cable markets. This expansion reflects the industry’s intensified build cycle, with multiple hyperscale connectivity and intercontinental projects advancing simultaneously. The data suggest that the industry is now operating near full capacity, with sustained workloads expected to carry through 2026.
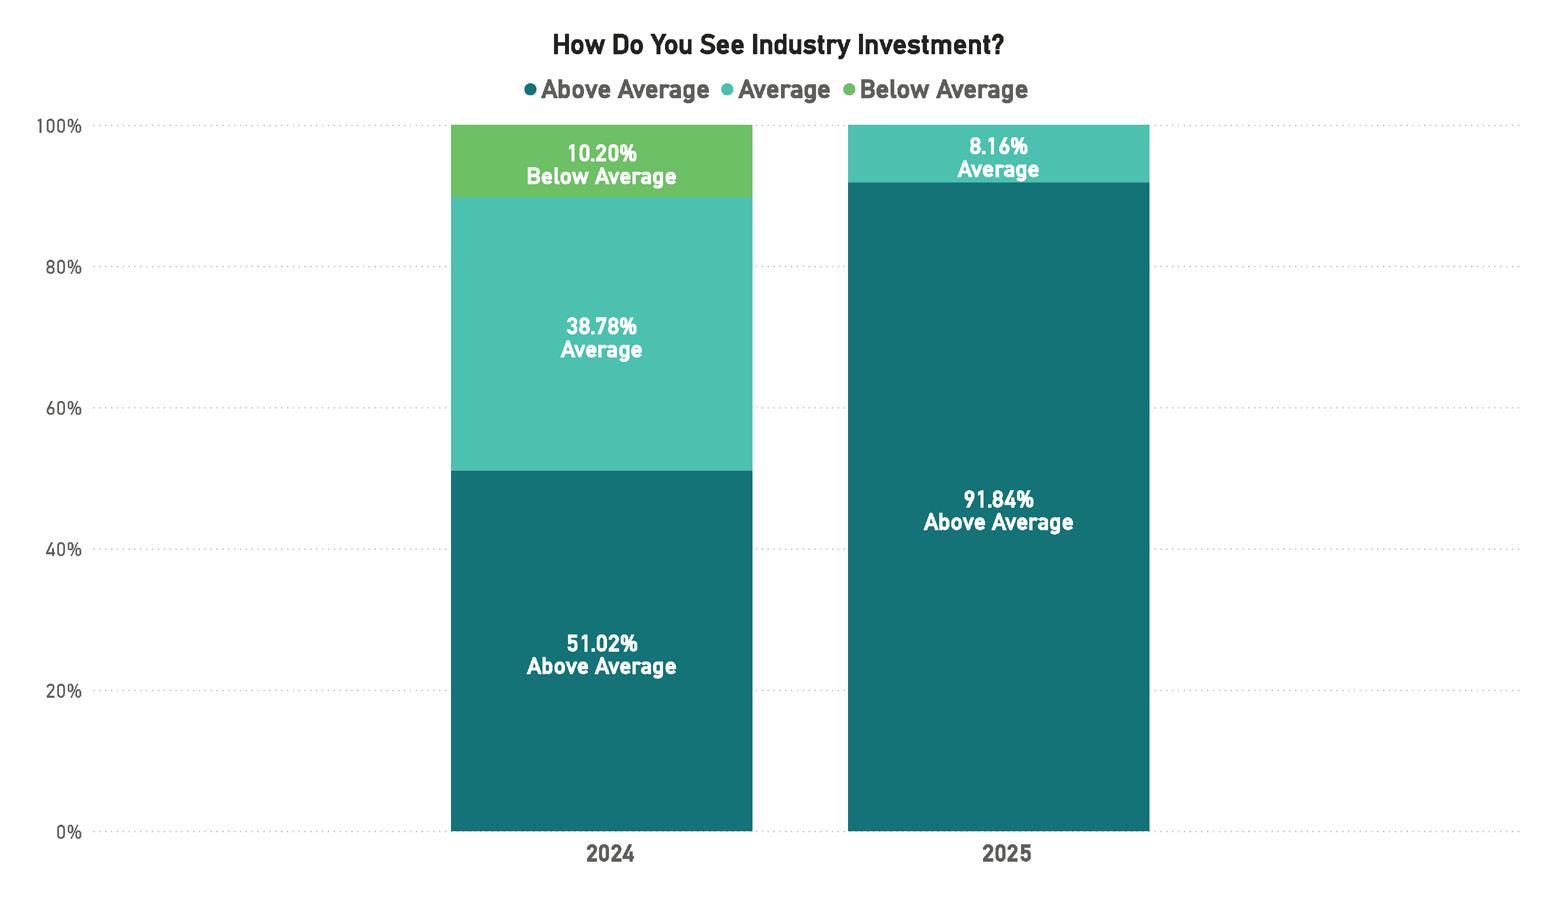
Confidence in investment has surged alongside rising workloads. In 2025, 91.84% of respondents rated industry investment as above average, a dramatic increase from 51.02% in 2024. Meanwhile, the below average category has disappeared, and only a small minority (just over 8%) described investment as average. This sharp upward shift signals robust capital confidence, supported by continued funding for large-scale system builds, technology modernization, and data center integration. The findings reflect a strong correlation between investment sentiment and project activity—capital flows are not only sustaining current growth but actively fueling industry acceleration. While external macroeconomic factors remain a watchpoint, respondents clearly view 2025 as a year of investment strength and long-term strategic commitment.
Figure 3: Industry Investment
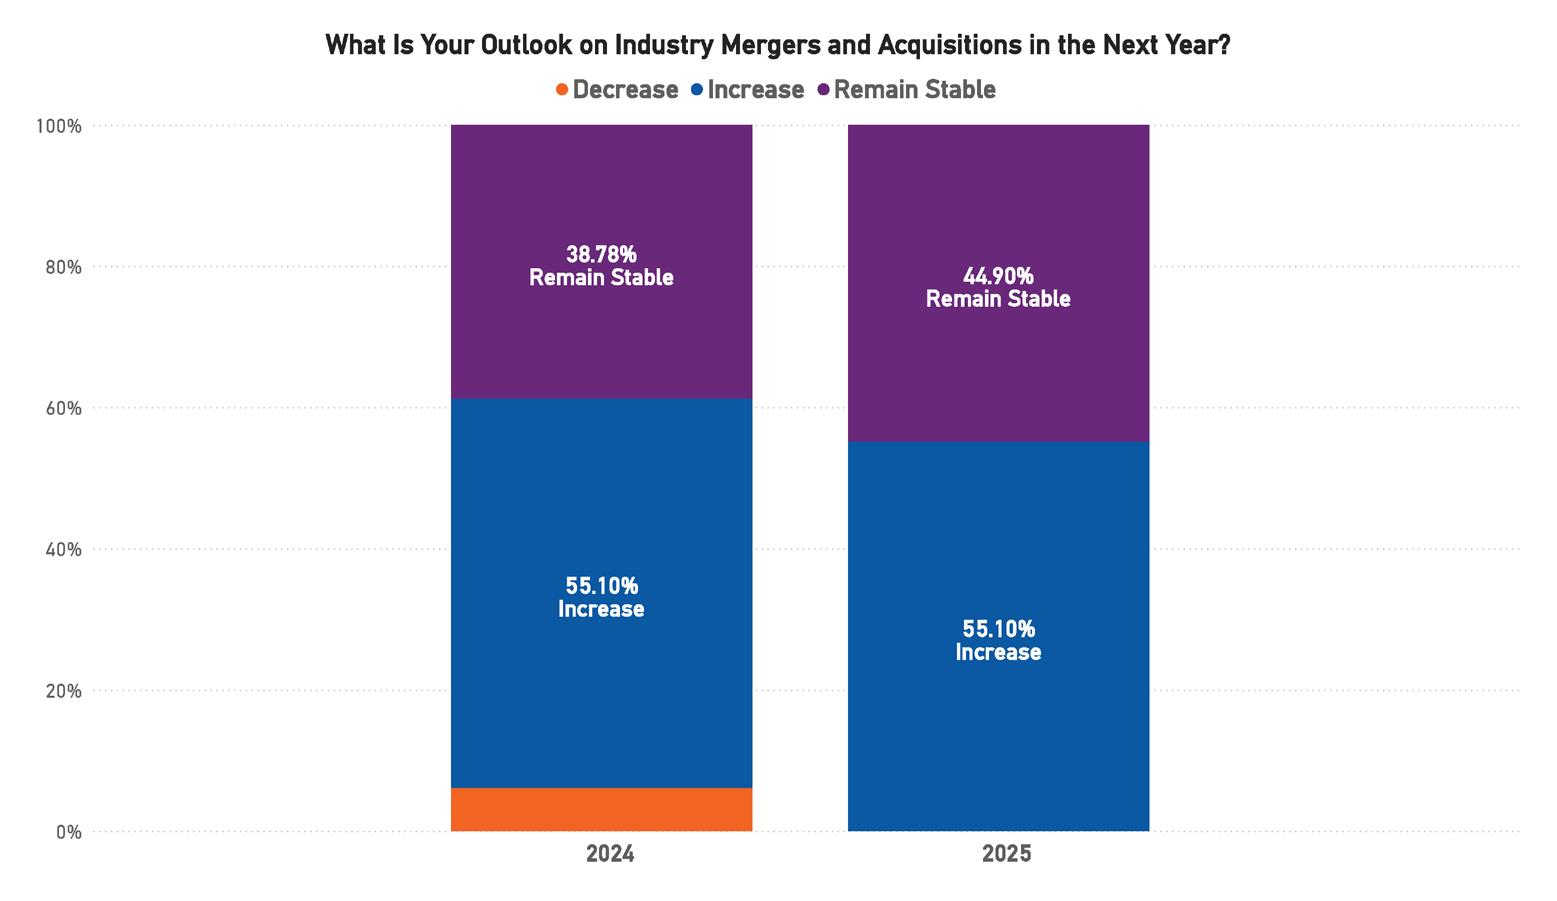
Figure 4: Industry Mergers & Acquisitions
Expectations around mergers and acquisitions remain steady compared to the previous year. In both 2024 and 2025, 55.10% of respondents expect an increase in M&A activity, while the share anticipating stable conditions rose modestly from 38.78% to 44.90%. No respondents forecasted a decrease. The data suggests that consolidation continues to be viewed as a defining feature of the industry, with participants anticipating continued strategic alignments rather than dramatic market shifts. The consistency of these responses underscores the perception that mergers and acquisitions are now a normalized component of the industry’s long-term business cycle, reflecting both investment confidence and the pursuit of scale efficiencies among operators, vendors, and infrastructure investors.
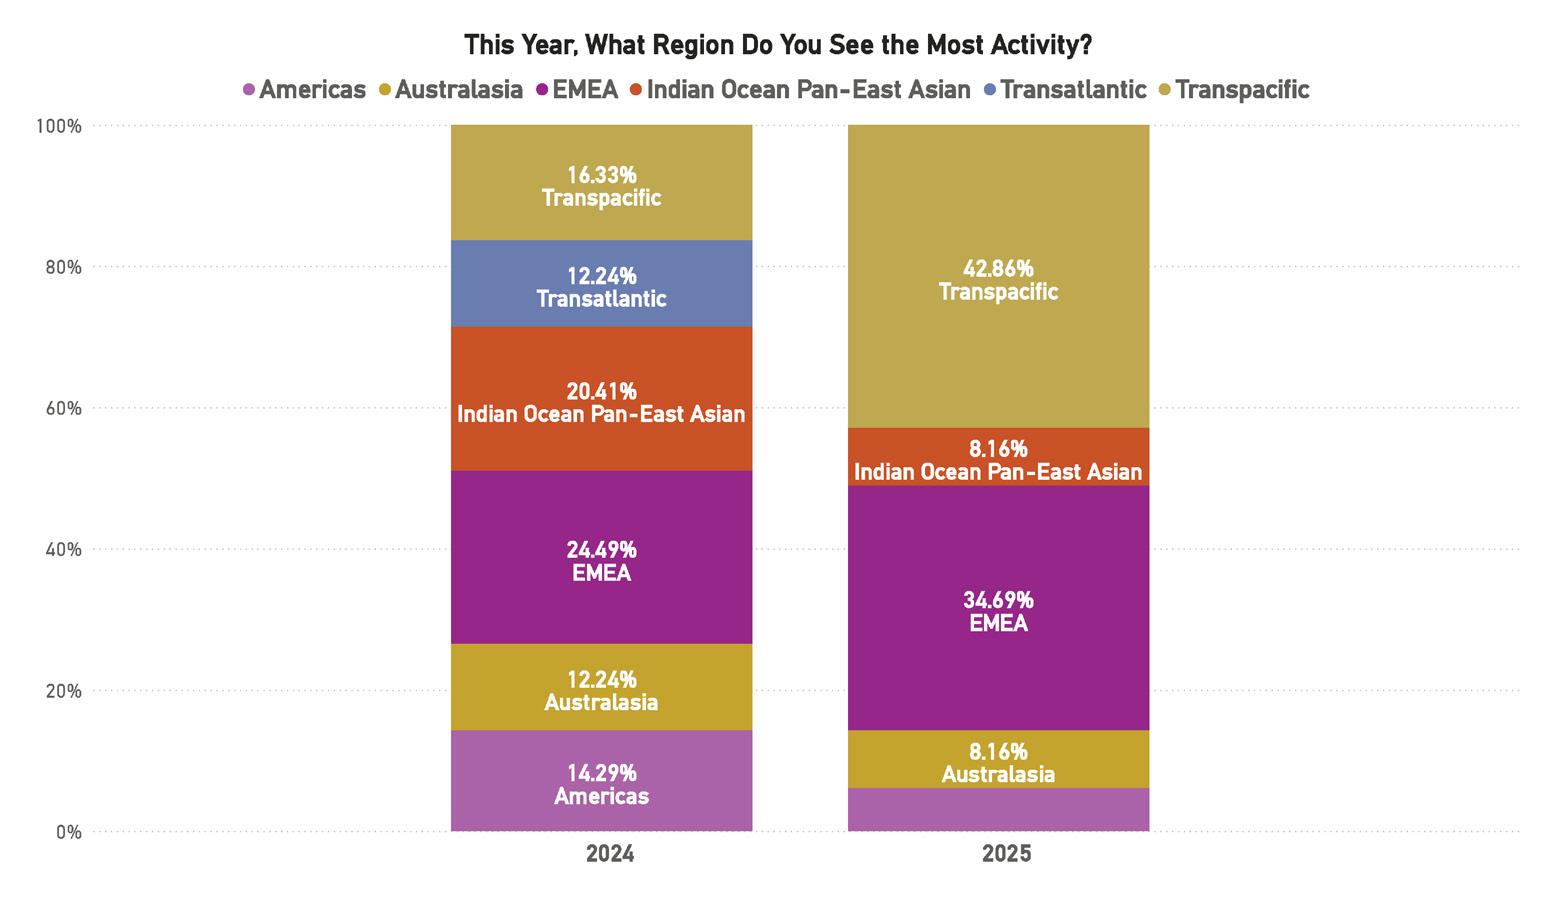
5: Region Activity
Regional market activity has shifted notably in 2025, with a strong concentration of work moving toward the Transpacific region. The Transpacific share of reported activity increased sharply from 16.33% in 2024 to 42.86% in 2025, displacing other regions that had dominated in previous years. EMEA continues to be active at 34.69%, up from 24.49%, while the Indian Ocean Pan–East Asian region saw a marked decline from 20.41% to 8.16%. Australasia and the Americas remained comparatively stable, though both represent smaller overall shares of reported activity. These shifts point to a geographic rebalancing of global infrastructure development, as Transpacific routes attract sustained investment in capacity and resiliency. The change also reflects the increasing prioritization of Asia–U.S. connectivity in global traffic patterns, with EMEA maintaining a strong second position through ongoing regional and intercontinental builds.
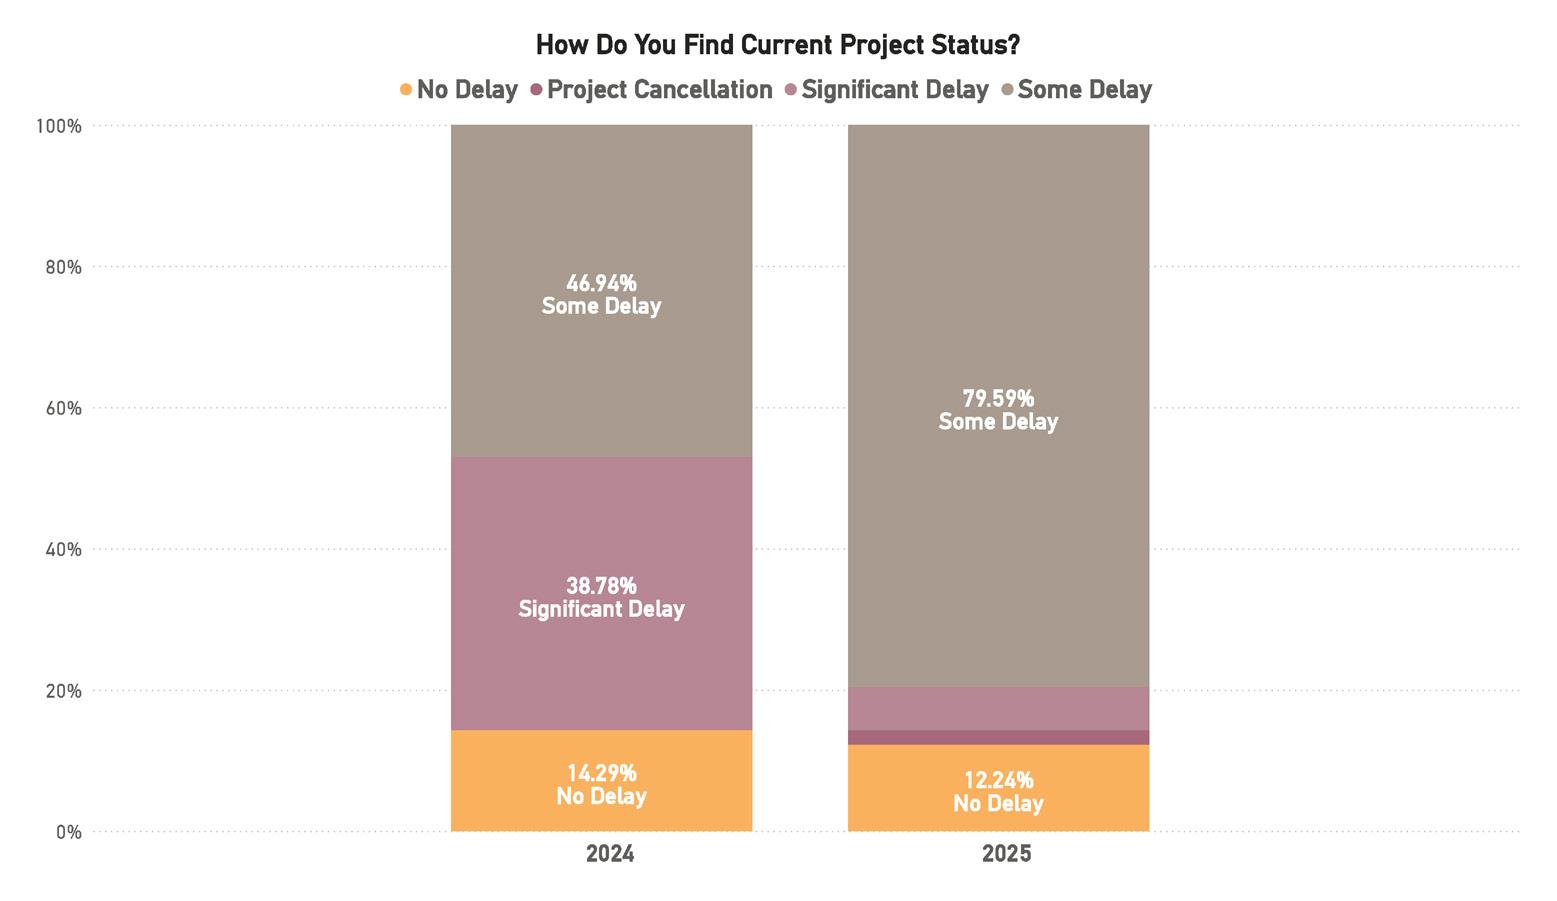
Figure
6: Project Status
Project execution challenges have intensified, with a clear increase in reported delays compared to 2024. In the current survey, 79.59% of respondents noted that projects are experiencing some delay, a significant rise from 46.94% the previous year. The share indicating significant delays fell sharply to negligible levels, suggesting that while most projects are behind schedule, fewer are facing critical disruption. The portion reporting no delays declined slightly from 14.29% to 12.24%. This data signals a broad but manageable slowdown, likely tied to ongoing supply chain strain, vessel availability, and regulatory clearance timelines. The industry continues to move forward at high volume, but capacity constraints and logistical bottlenecks remain persistent challenges that are now embedded into standard project planning.
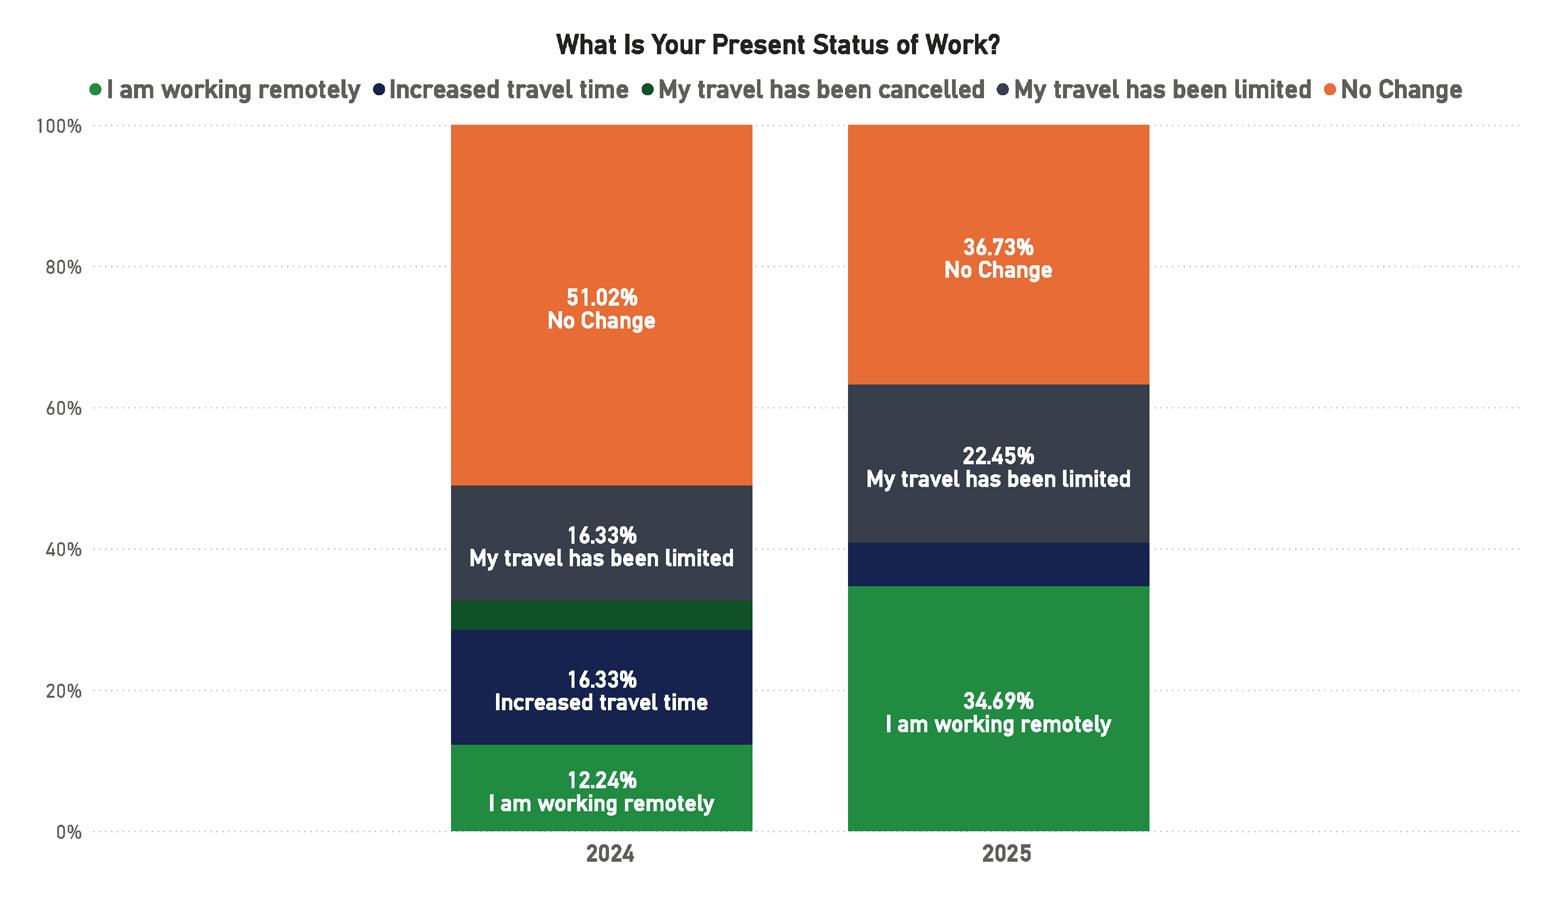
Figure 7: Work Status
Work patterns in the industry continue to evolve, with a clear trend toward greater remote flexibility in 2025. The share of respondents reporting that they are working remotely rose significantly from 12.24% in 2024 to 34.69% in 2025. Meanwhile, those indicating “no change” in their work status fell from 51.02% to 36.73%, showing that the shift in work modes is still ongoing. Reports of limited travel increased modestly, while increased travel time declined slightly, suggesting that logistical constraints continue to affect mobility but are stabilizing overall. The growing share of remote work underscores the lasting impact of hybrid
Figure
and distributed operational models within the submarine cable sector, particularly as organizations adapt to global project footprints and cross-regional collaboration demands.
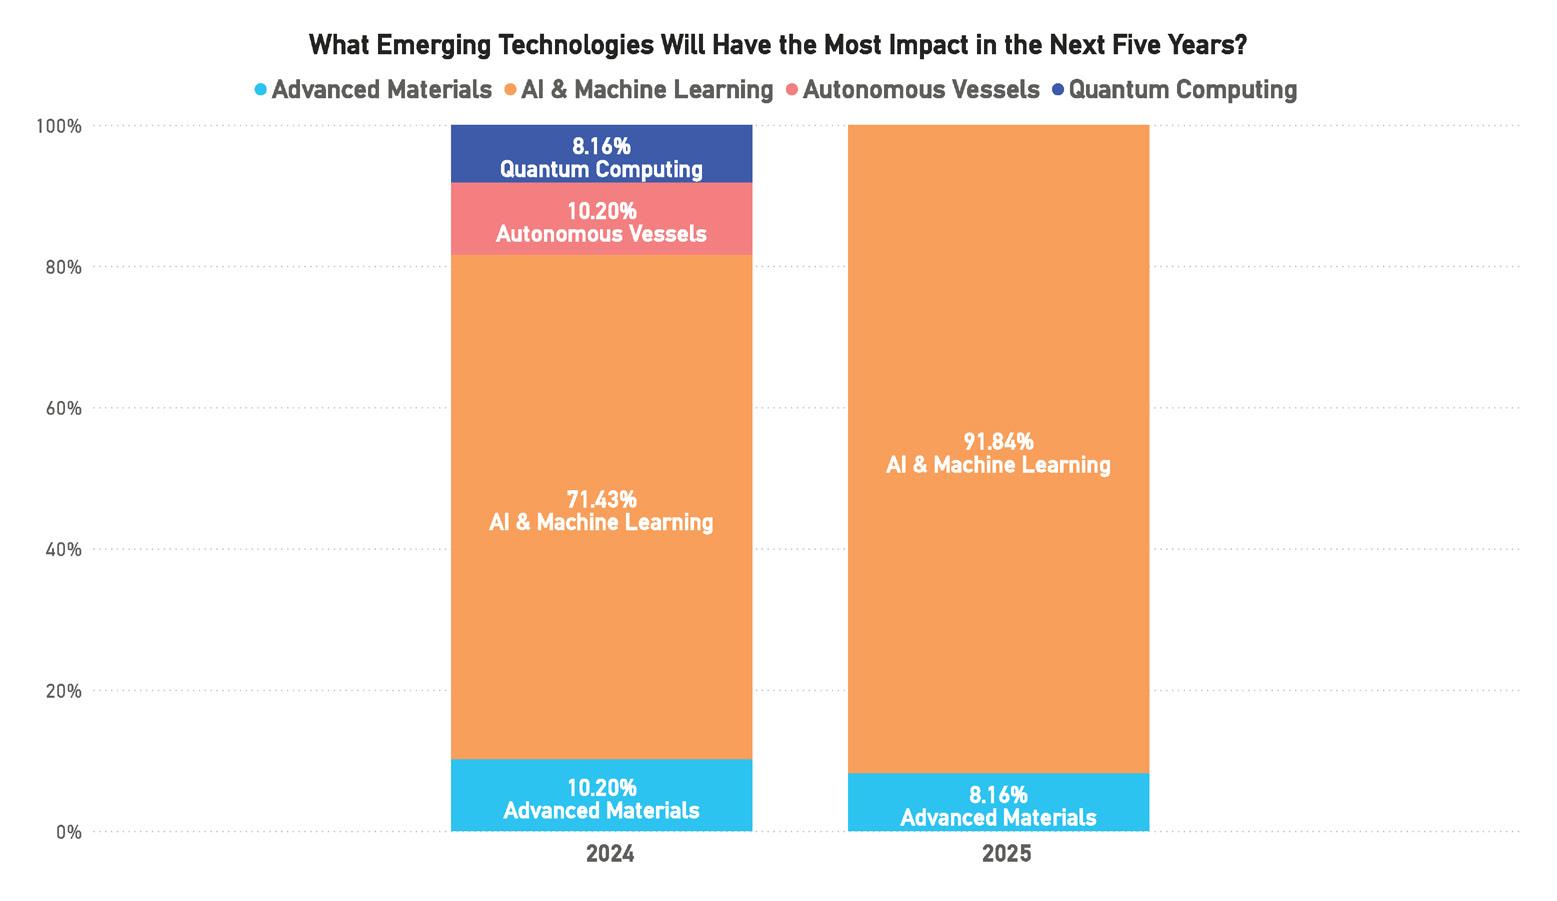
Figure 8: Emerging Technologies
Technological innovation remains a defining force in the industry, with AI and machine learning emerging as the clear frontrunner among transformative technologies. In 2025, 91.84% of respondents identified AI and machine learning as the technology expected to have the greatest impact over the next five years, up sharply from 71.43% in 2024. This steep rise reflects a broadening industry consensus that automation, predictive analytics, and intelligent network management will drive the next wave of efficiency and innovation. Other technologies, such as autonomous vessels, advanced materials, and quantum computing, saw declining mentions year over year, suggesting that while they remain on the radar, they are perceived as secondary to the immediate and tangible applications of AI across network design, maintenance, and data analytics.
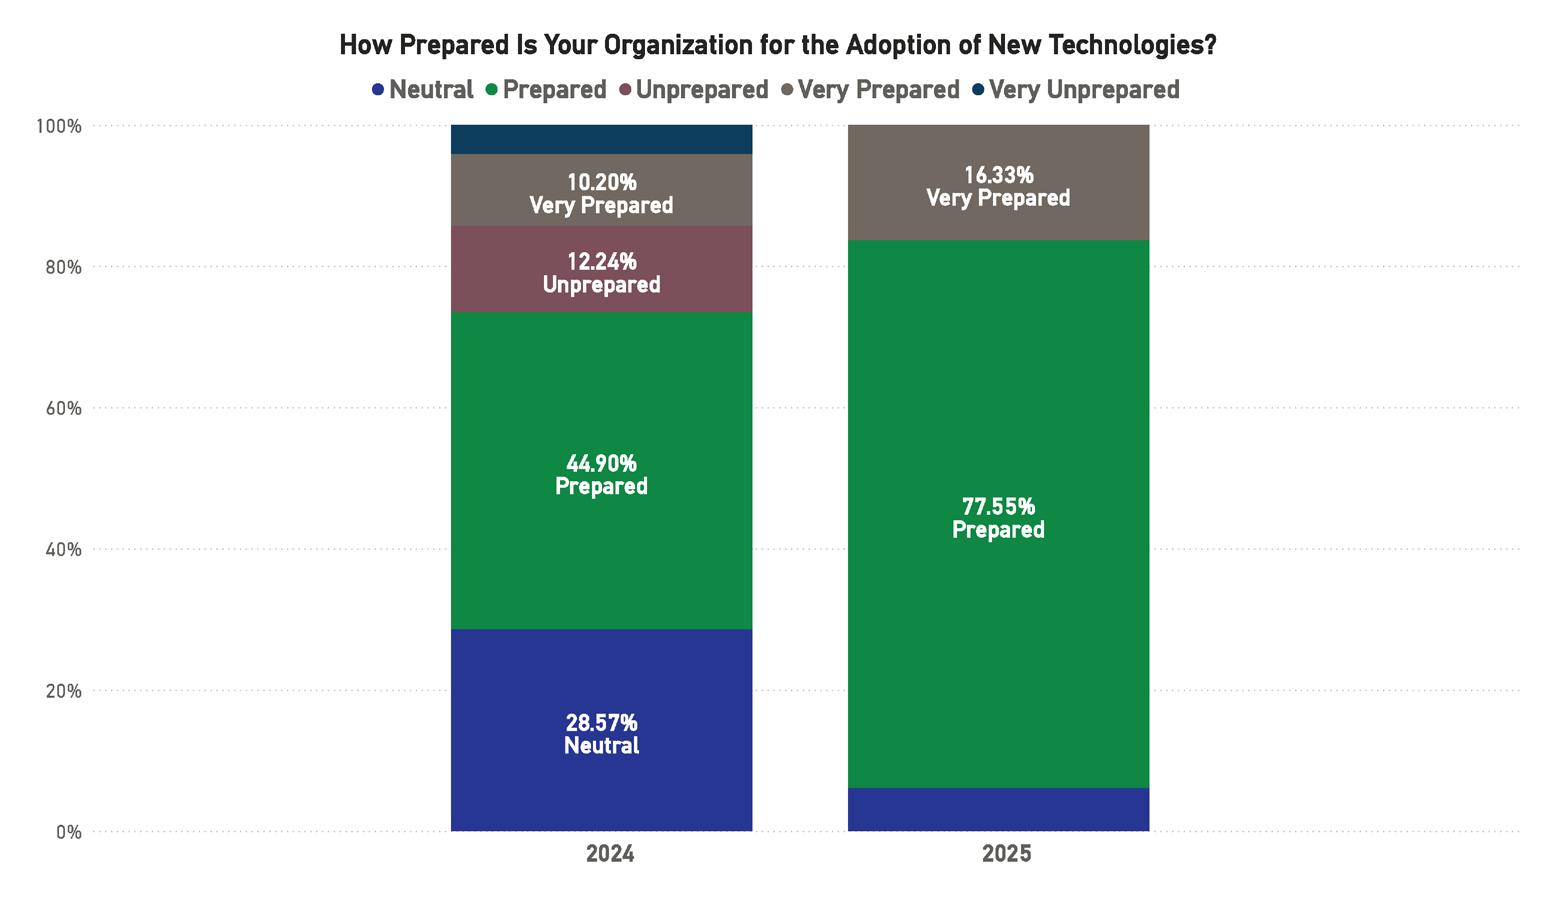
Figure 9: Technology Preparedness
The industry’s readiness for technological change has improved substantially, signaling both strategic alignment and operational progress. In 2025, 77.55% of respondents described their organizations as pre-
pared for the adoption of new technologies, compared to 44.90% in 2024. The “very prepared” category also increased from 10.20% to 16.33%, while the share identifying as unprepared declined to near zero. This strong upward movement indicates a widespread shift from awareness to execution, as companies invest in modernization and skills development. The overall trend reflects a maturing ecosystem where new tools and digital capabilities are no longer aspirational but actively integrated into business models, positioning the industry for faster adaptation in the years ahead.
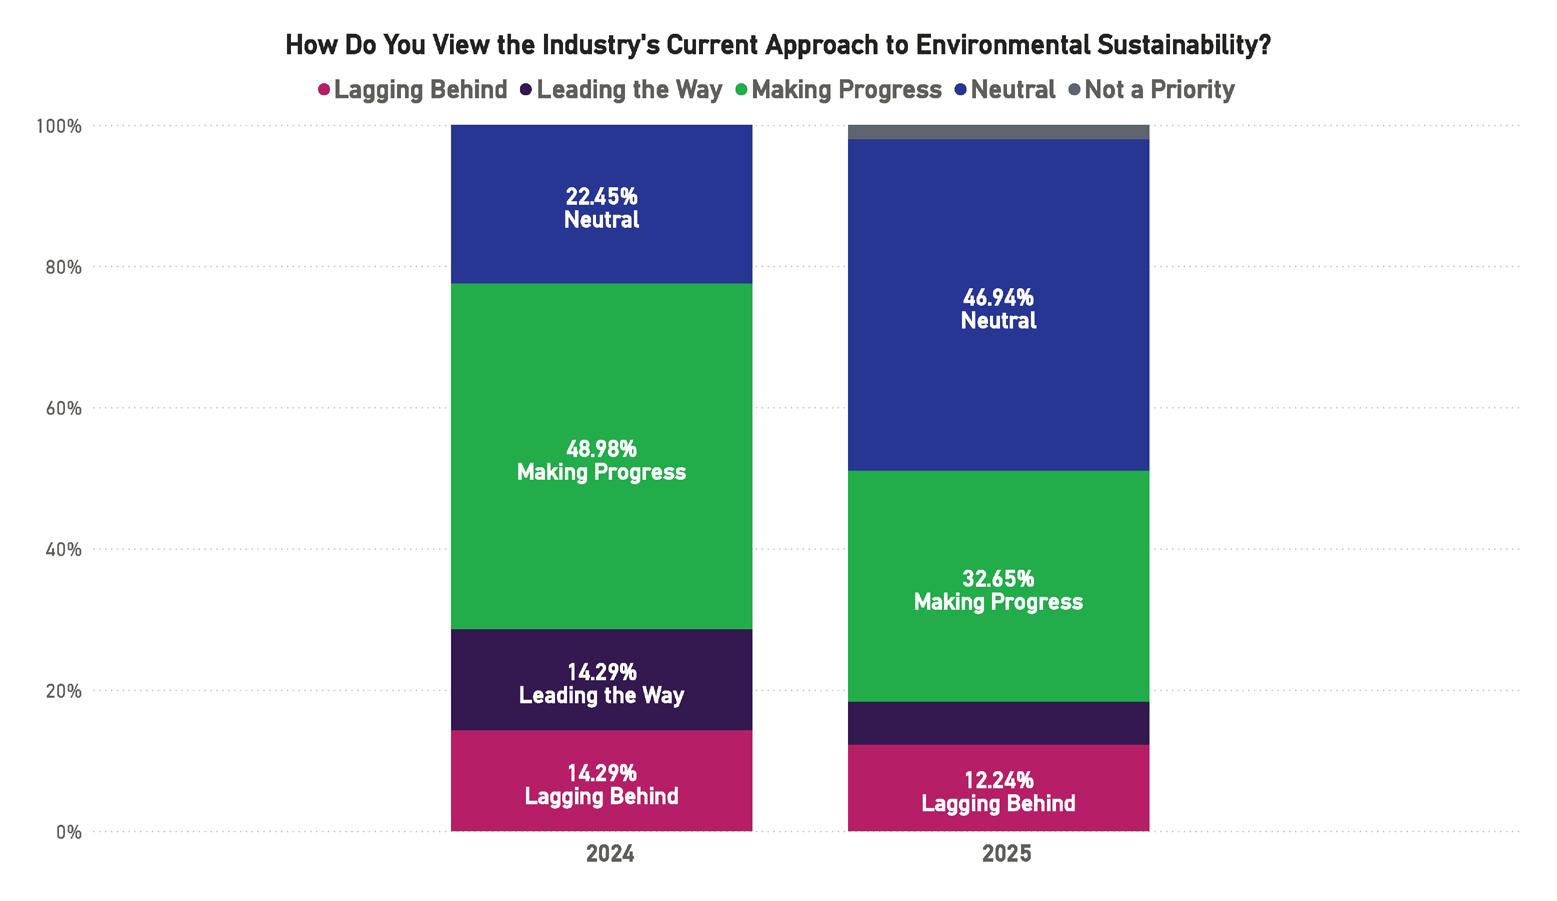
Figure 10: Sustainability Approach
Perceptions of the industry’s environmental progress shifted noticeably in 2025. While nearly half of respondents in 2024 viewed the industry as “making progress,” that share declined to 32.65% this year. Meanwhile, neutrality increased substantially from 22.45% to 46.94%, suggesting that respondents are now less certain about the pace or visibility of sustainability efforts. The shares identifying the industry as “leading the way” or “lagging behind” remained relatively stable, with a slight decline in both categories. These results point to a growing perception plateau—stakeholders acknowledge that environmental initiatives are underway, but many feel progress has slowed or that the industry has yet to demonstrate measurable outcomes. As sustainability expectations continue to rise globally, maintaining momentum and transparency may be key to sustaining confidence in this area.
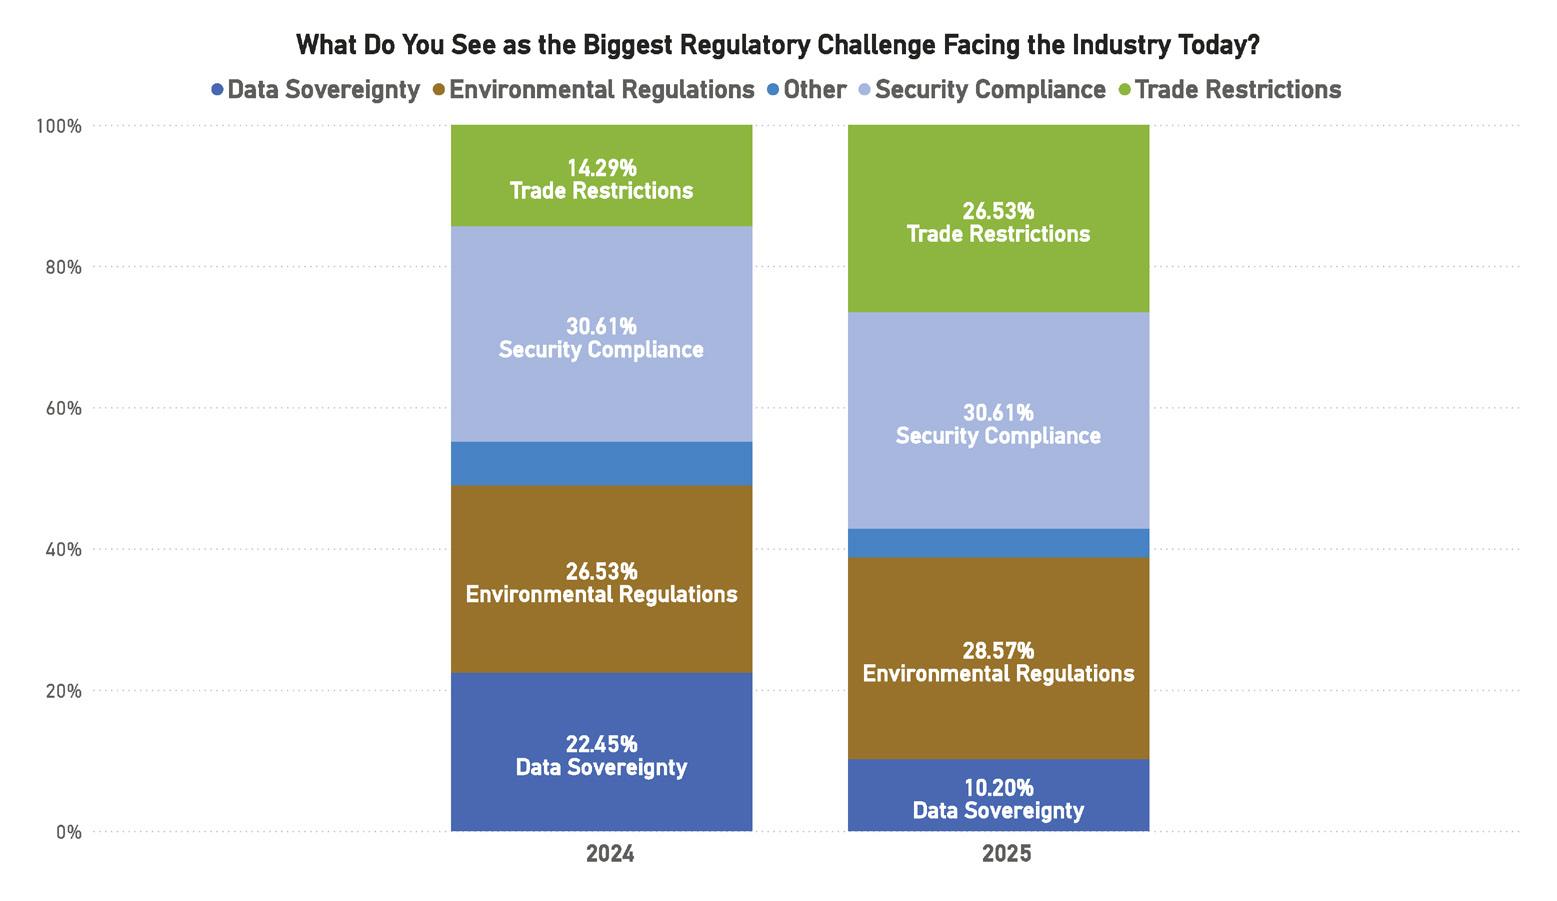
11: Regulatory Challenges
Regulatory complexity remains a defining concern across the industry, though the areas of emphasis continue to shift. In both 2024 and 2025, security compliance held steady as the most frequently cited challenge at 30.61%. However, trade restrictions rose significantly—from 14.29% to 26.53%—reflecting growing geopolitical friction and supply chain considerations. Environmental regulations also edged higher, while data sovereignty concerns declined sharply from 22.45% to 10.20%. This changing mix illustrates a dynamic regulatory landscape increasingly influenced by international trade policy, security governance, and environmental accountability. The decline in data sovereignty as a leading issue may indicate that companies have adapted to data localization requirements, while newer challenges, particularly those linked to cross-border operations and environmental oversight, are now shaping the regulatory conversation.
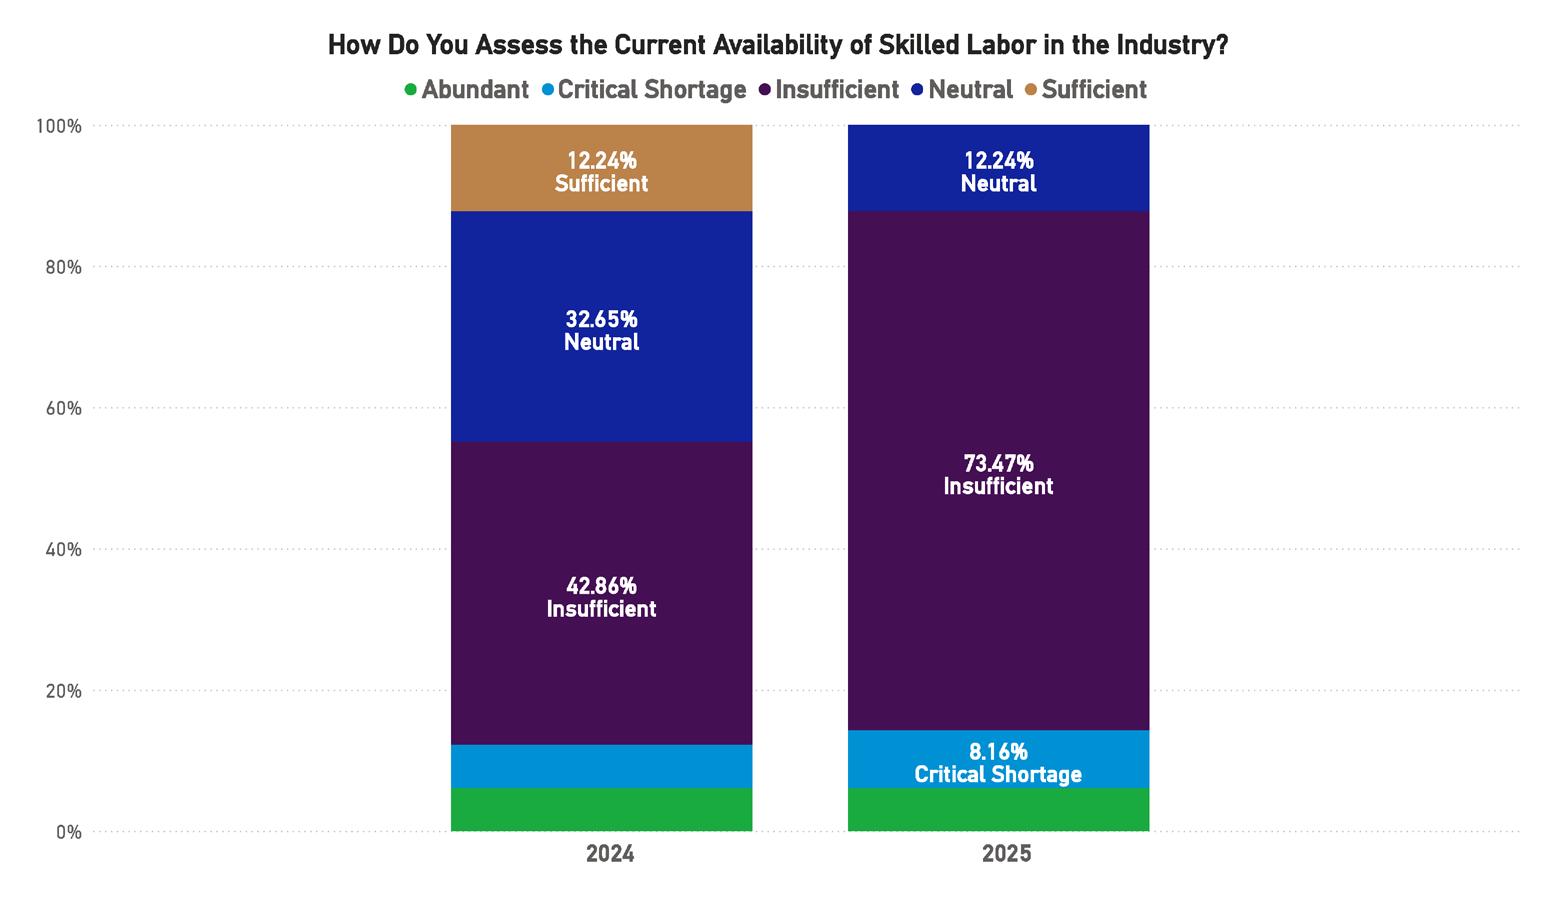
12: Skilled Labor Availability
Concerns over workforce capacity have intensified sharply in 2025. The share of respondents describing skilled labor availability as “insufficient” surged from 42.86% to 73.47%, with an additional 8.16% now identifying a “critical shortage.” The number of respondents rating availability as sufficient or abundant has effectively disappeared, while neutrality dropped from 32.65% to 12.24%. These figures point to an escalating talent gap across the submarine cable ecosystem, driven by sustained project demand, aging
Figure
Figure
technical workforces, and limited new entrant pipelines. The results underscore that skilled labor scarcity is no longer a localized or short-term issue—it has become a defining structural constraint. Industry leaders may need to prioritize workforce development, technical training, and cross-sector partnerships to mitigate long-term operational risks associated with these shortages.
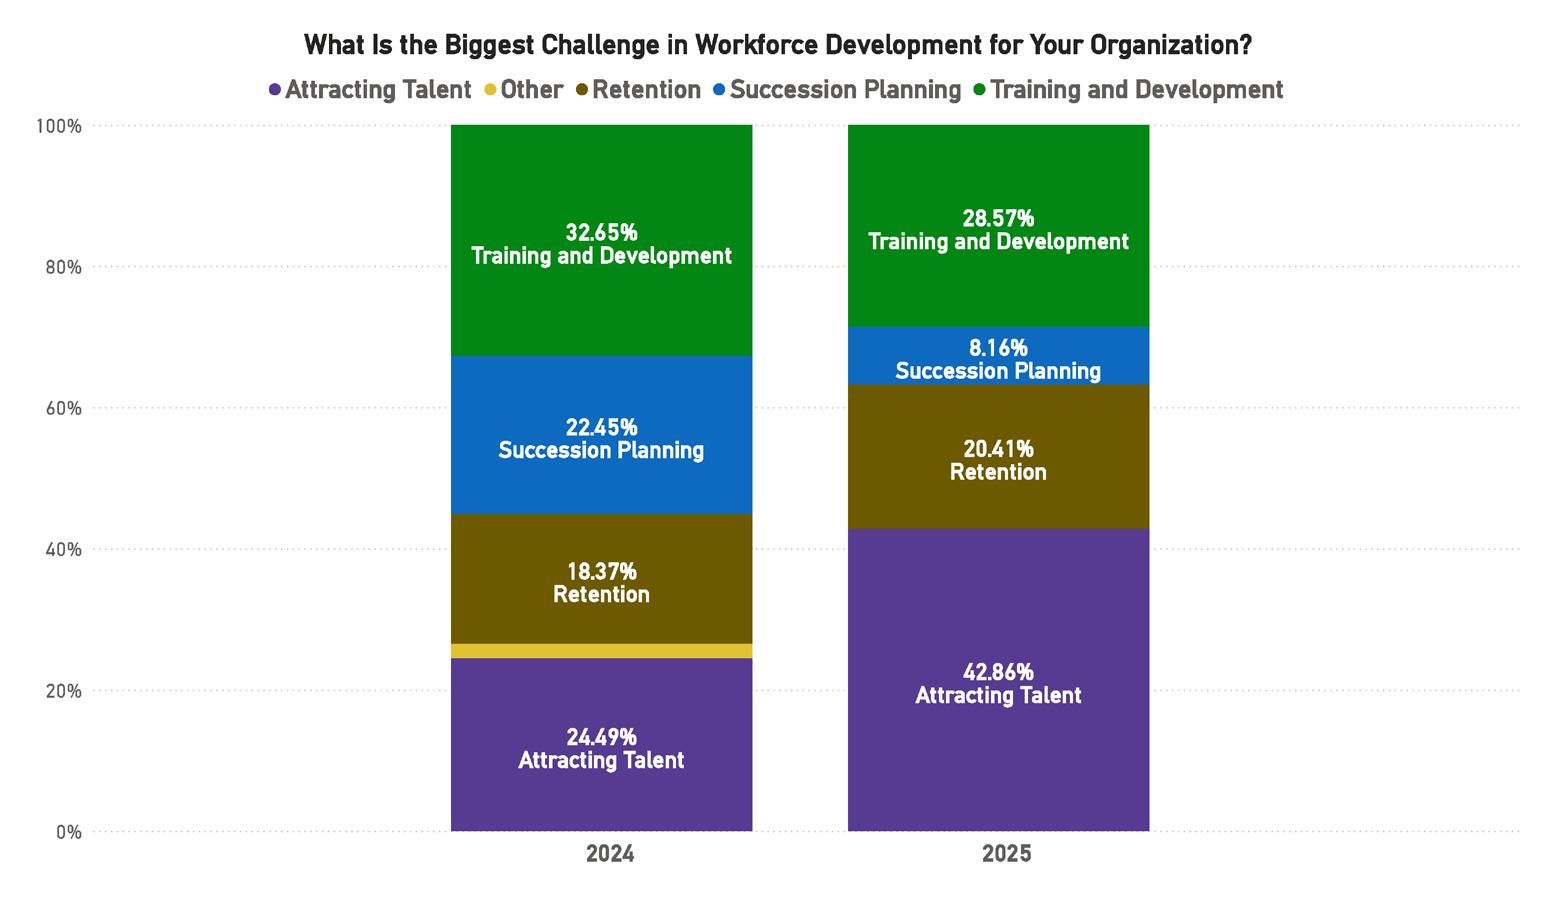
The 2025 results indicate a clear shift in how organizations view workforce development priorities. Attracting new talent has become the dominant concern, rising from 24.49% in 2024 to 42.86% in 2025. Training and development, while still a key focus, fell slightly from 32.65% to 28.57%, suggesting that many organizations now feel internal training is less urgent than replenishing and expanding the talent pipeline. Succession planning declined sharply to 8.16%, and retention increased slightly to 20.41%, pointing to a tightening labor market where recruiting qualified professionals outweighs long-term personnel planning. These findings align closely with the broader skills shortage reported across the industry, highlighting a near-term need for recruitment and outreach strategies that can attract new technical and managerial expertise into the sector.
Figure 13: Workforce Challenges
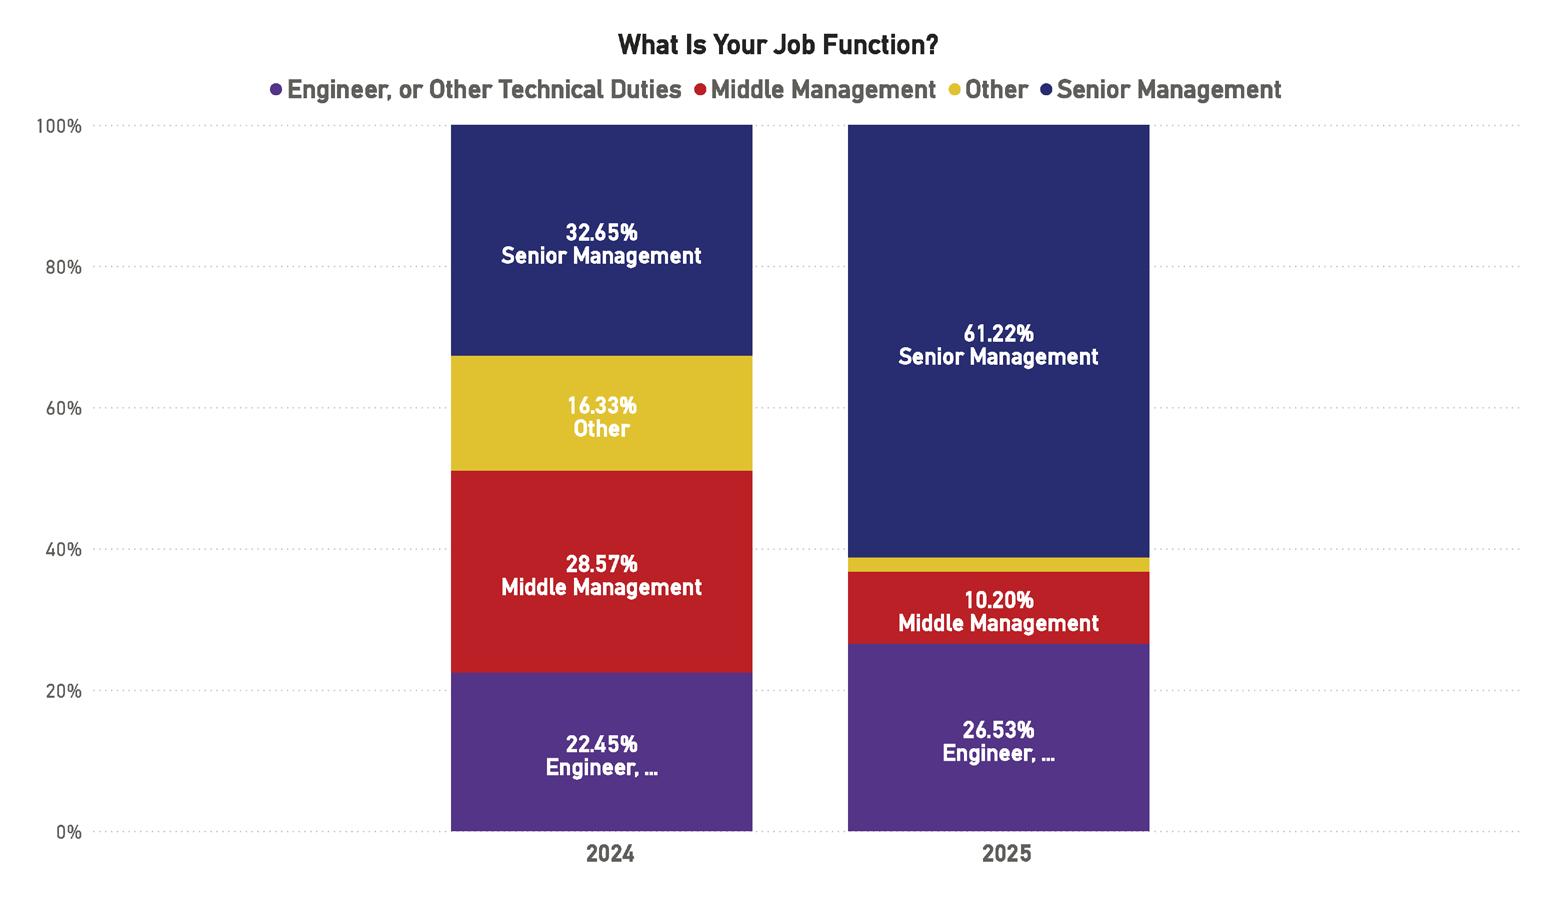
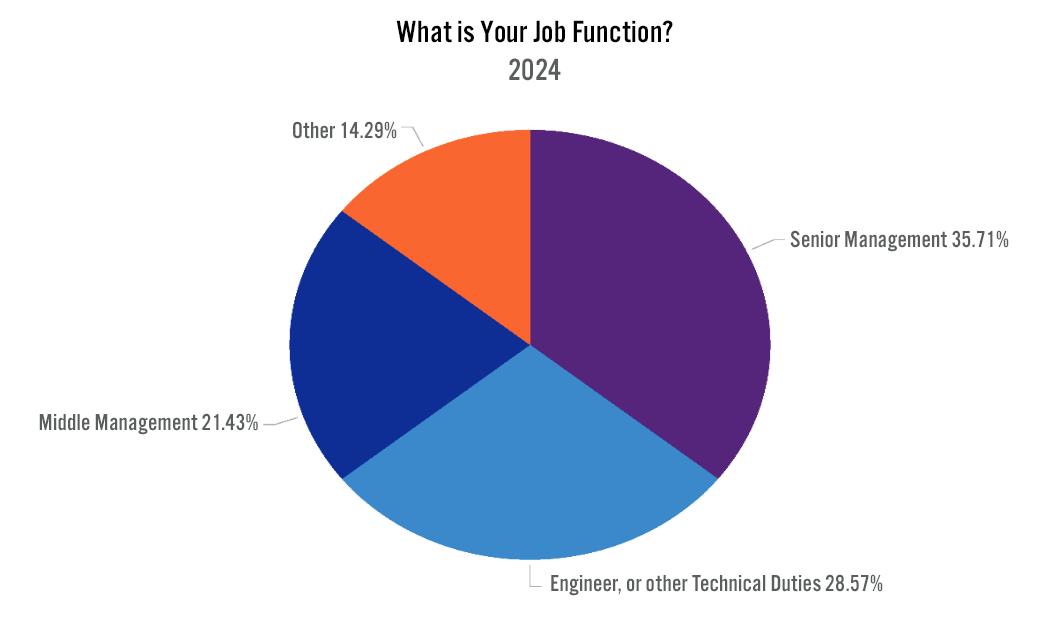
Figure 14: Job Function
The distribution of job roles among survey respondents has shifted toward senior management positions, which now account for 61.22% of participants compared to 32.65% in 2024. The representation of middle management decreased from 28.57% to 10.20%, while engineers and technical specialists remained relatively stable, rising slightly to 26.53%. The “other” category, which may include consultants or independent contractors, declined notably from 16.33% to negligible levels. This shift suggests that higher-level decision-makers are increasingly represented in the industry’s feedback base, potentially signaling greater executive engagement in strategic discussions around growth, regulation, and technology adoption. The prominence of senior management input also strengthens the survey’s value as a forward-looking indicator of organizational priorities and investment sentiment.
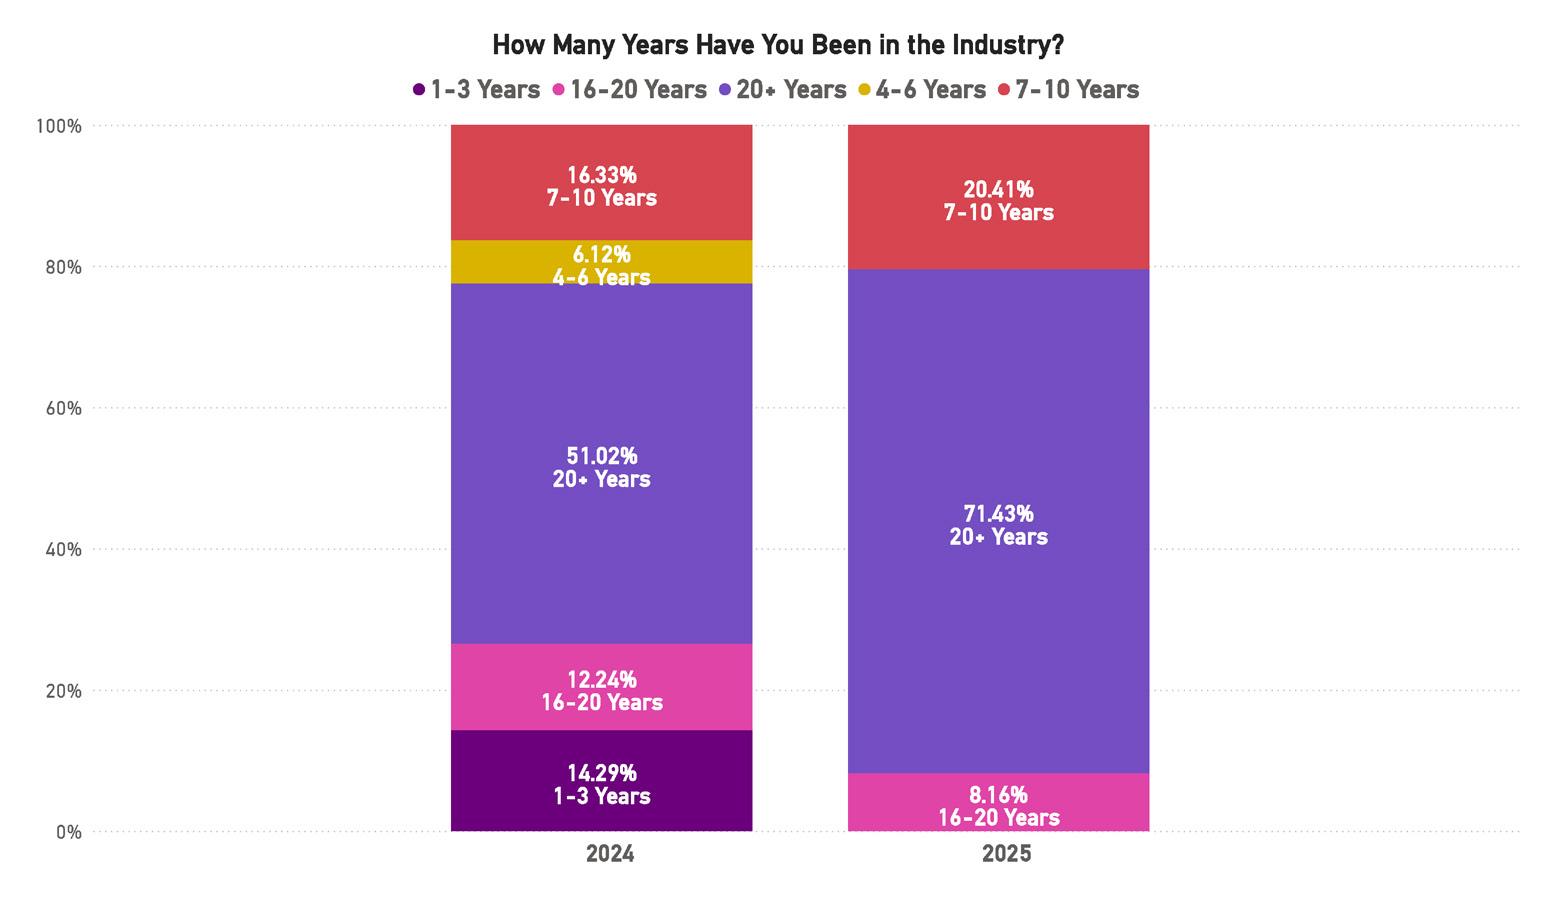
Figure 15: Years in Industry
Experience levels among respondents continue to trend toward the higher end, underscoring the submarine cable sector’s long-established professional base. In 2025, 71.43% of participants reported having over 20 years of experience, up from 51.02% in 2024. This sharp increase reinforces the perception that the industry remains dominated by long-tenured experts, many of whom have witnessed multiple technological and market cycles. Meanwhile, representation from mid-career professionals (7–10 years) grew slightly to 20.41%, while all other experience brackets declined, particularly those with fewer than 10 years in the field. These results highlight both the depth of institutional knowledge within the industry and a looming generational transition challenge, as the gap between veteran professionals and newer entrants widens further. The data suggests that without stronger recruitment and knowledge transfer programs, the industry could face difficulties sustaining expertise over the next decade.
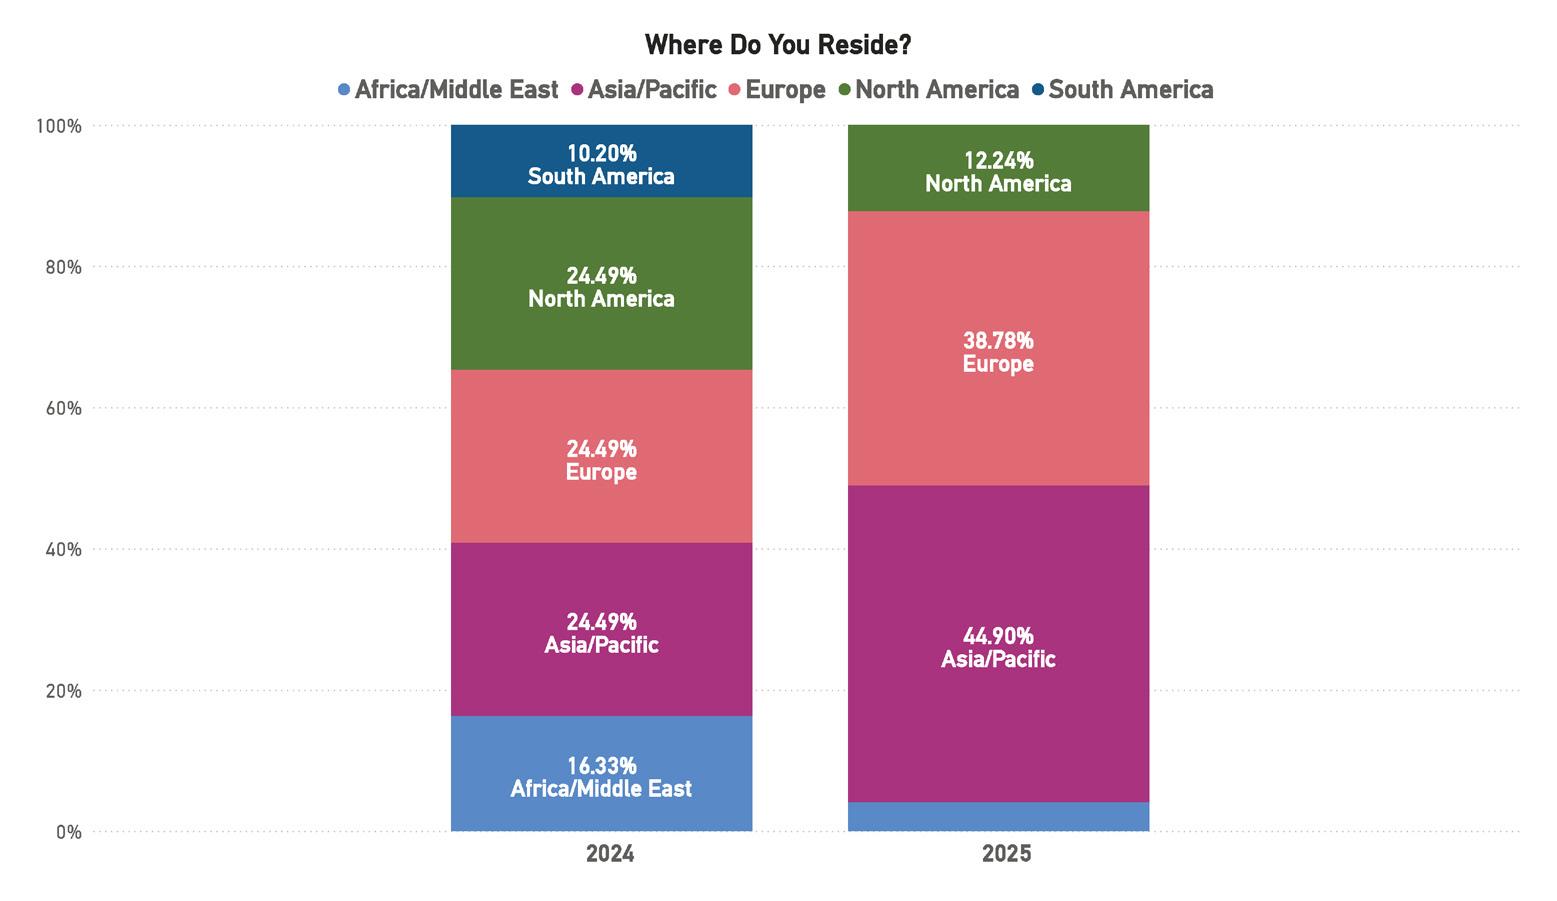
The 2025 survey reflects a notable geographic rebalancing across the industry’s global footprint. Respondents from the Asia-Pacific region rose sharply to 44.90% from 24.49% the prior year, reinforcing the region’s growing importance as both a project hub and investment center. Europe also increased its share to 38.78%, while participation from North America and Africa/Middle East declined, and South America saw minimal representation. The geographic shifts parallel trends observed in project activity, with strong growth in transpacific and EMEA systems reflected in earlier survey questions. This evolving distribution underscores the global nature of the submarine cable industry but also highlights the increasing centrality of Asia and Europe in driving market expansion, capacity upgrades, and infrastructure leadership.
Key Highlights and Conclusions
Across the three-year sentiment timeline, the submarine fiber-optic industry has entered a phase of sustained expansion and operational maturity, marked by high activity, strong investment, and growing structural challenges. The 2025 survey results portray a sector that is confident in its direction and deeply engaged in large-scale delivery but also increasingly constrained by labor shortages, regulatory complexity, and uneven progress in sustainability.
The overall tone of 2025 responses remains strongly optimistic, with nearly nine in ten participants describing the state of the industry as positive and most reporting higher workloads than ever before. This sustained optimism is underpinned by record investment levels, the acceleration of major transpacific and EMEA builds, and the broad integration of AI and digital tools into planning and operations. Industry leaders appear to view this growth period as both a validation of long-term strategy and a call to address emerging bottlenecks in talent and execution capacity.
At the same time, the data reflect a maturing awareness of the challenges that accompany expansion. Skilled labor shortages have reached critical levels, and organizations increasingly identify talent attraction—not training or succession planning—as their foremost workforce challenge. This aligns with demographic trends showing an aging professional base and limited entry of new technical personnel, pointing to an urgent need for education, recruitment, and knowledge transfer initiatives.
Technological preparedness has improved sharply, illustrating that organizations are moving from adaptation to proactive modernization. Yet this progress is tempered by slower movement on environmental sustainability, where confidence appears to have plateaued. Neutrality in this area has grown substantially, suggesting that while sustainability is widely recognized as a strategic imperative, measurable outcomes remain inconsistent.
Figure 16: Residency
Geographically, the center of gravity continues to shift eastward. Asia-Pacific and Europe now account for the majority of reported activity and residence among respondents, mirroring global investment flows and the increasing importance of transoceanic capacity routes connecting these regions. This diversification reinforces the truly global character of the industry but also introduces new regional dependencies and policy considerations.
Taken together, the 2025 sentiment data portray an industry operating at peak momentum—expansive, capital-rich, and technologically agile—but navigating constraints that could shape its next phase of evolution. The convergence of optimism, capacity strain, and leadership concentration suggests that the coming years will hinge on strategic investment in people, process, and sustainability to maintain equilibrium between growth and resilience.
Whether you're seeking a reliable landing party or hosted cable landing services, we deliver:
• 24/7 monitoring
• Remote hands support
• Redundant backup power systems
• Secure, scalable infrastructure
Contact us at US1-503-707-5376 to learn more.
1.2. STRATEGIC SHIFTS IN SUBMARINE CABLE POLICY
Insights from Kristian Nielsen
Submarine cables are the unsung infrastructure of the modern world. Carrying an estimated 99% of all intercontinental internet traffic, they are the backbone of financial systems, cloud computing, government communications, and everyday life online.
For much of their history, these systems were treated as neutral infrastructure — engineered, financed, and operated with minimal political involvement. But in the past year, that picture has changed dramatically. Governments now see cables as strategic assets, and in some cases as vulnerabilities.
Policies, regulations, and even naval operations are being reshaped by concerns about espionage, sabotage, vendor trust, and geopolitical rivalry. Major developments since late 2024 have reshaped dynamics in the United States, Europe, Russia, China, Japan, Southeast Asia, and the wider Indo-Pacific.
1.2.1. UNITED STATES: REGULATION, SECURITY, AND VENDOR TRUST
In July 2025, the U.S. Federal Communications Commission (FCC) adopted new rules creating a “presumption of denial” for submarine cable licenses involving equipment or operators linked to “foreign adversaries.” (Latham & Watkins, 2024) The rules also prohibit using technology from companies on the FCC’s “Covered List,” such as Huawei and ZTE (Submarine Networks, 2025).
FCC Commissioner Brendan Carr explained: “We have seen submarine cable infrastructure threatened in recent years by foreign adversaries, like China. We are therefore taking action here to guard our submarine cables against foreign adversary ownership, and access as well as cyber and physical threats.” (IEEE ComSoc Tech Blog)
Congress has also stepped in. In September 2025, the House of Representatives passed the Undersea Cable Control Act, which would restrict exports of sensitive cable technology, direct agencies to identify and secure critical components, and instruct the U.S. to work with allies on global standards (De Bevoise LLP Insights, 2024).
The impact is already visible. Cable projects planning landings in Hong Kong have been cancelled or rerouted (Latham & Watkins, 2024). Consortia are expected to disclose vendor ties, equipment origin, cybersecurity safeguards, and even repair ship availability. The SEA-ME-WE 6 cable is the most high-profile example: although HMN Tech’s bid was cheaper, the contract went to SubCom under U.S. diplomatic pressure, raising costs and delaying delivery (Reuters, 2025). Vendor trust is now an explicit requirement, not a background consideration.
1.2.2. EUROPE: FROM INCIDENTS TO ACTION PLANS
Europe’s awareness of cable vulnerability sharpened in late 2024, when multiple data cables between Sweden, Finland, and the Baltic states were damaged. Some incidents coincided with anchor drags by vessels flagged to China, while another involved simultaneous disruption of cables and a gas pipeline (CSIS, 2025). Although no government has published definitive proof of sabotage, officials increasingly describe such events as hybrid threats.
In February 2025, the European Commission responded with an Action Plan on Cable Security worth nearly €1 billion (Semafor, 2025). Funding is earmarked for enhanced monitoring, spare cable stockpiles, and a fleet of dedicated repair vessels. One EU official described the approach as moving from passive resilience to “active deterrence, detection, and repair.”
NATO has also taken a larger role, deploying naval assets and underwater drones and launching exercises focused on cable protection (IEEE ComSoc Tech Blog). A new Maritime Centre for the Security of Critical Undersea Infrastructure in the UK is coordinating allied responses. Meanwhile, the Critical Entities Resilience Directive requires operators to assess sabotage risks and maintain emergency plans.
Permitting processes for urgent repairs, historically slow, are being streamlined.
Europe is now treating submarine cables with the same seriousness as pipelines and power grids.
“The 2025 ICPC Plenary chose the theme ‘The Big Squeeze: Geopolitics & Spatial Planning’ because geopolitics and spatial planning are putting a squeeze on the planning of new undersea critical infrastructure.”
Ryan Wopschall – ICPC (STF Issue 141)
1.2.3. RUSSIA: ISOLATION AND SOVEREIGN PROJECTS
Since 2022, Russian companies have been largely excluded from international cable consortia (Latham & Watkins, 2024). Western governments view Russian participation as a security risk. At the same time, European navies continue to monitor Russian “research” vessels suspected of mapping or interfering with cables — the so-called “shadow fleet.”
Moscow’s response has been to build sovereign alternatives. The Polar Express cable, a 12,650 km system along Russia’s Arctic coast from Murmansk to Vladivostok, is entirely state funded (Latham & Watkins, 2024). Scheduled for completion by 2026, it will provide Russia with an independent communications corridor between Europe and Asia.
1.2.4. CHINA: EXPANSION MEETS PUSHBACK
China continues to pursue ambitious subsea cable projects under its Digital Silk Road initiative, with systems connecting Asia, Africa, and the Middle East (Subsea Cables Industry News, 2025). Companies such as HMN Technologies remain active, but their participation in global projects is narrowing.
Governments in the U.S., Europe, Japan, and elsewhere cite concerns about supply-chain transparency, foreign state influence, and the risk of espionage or sabotage. As a result, Chinese bids are increasingly excluded even when they are technically strong and economically competitive (Reuters, 2025).
The SEA-ME-WE 6 cable highlights this shift. HMN Tech initially offered the lowest bid, but the contract was reassigned to SubCom after U.S. diplomatic pressure, reflecting the growing role of geopolitics in procurement decisions.
1.2.5. JAPAN: SUBSEA CABLES AS NATIONAL SECURITY
The most significant new development in 2025 came from Japan. In September, Tokyo formally designated subsea cables as a national security priority (Financial Times, 2025).
The government is preparing to subsidize NEC, Japan’s leading subsea cable manufacturer, to acquire a fleet of large cable-laying ships (TS2.Tech, 2025). NEC currently charters vessels — for example, one from a Norwegian company under a four-year lease signed in 2022 — but officials view this as a vulnerability.
One government source told the Financial Times: “The Japanese government thinks this situation is very serious, so we are thinking we need to make some intervention.” Another cited risks of “espionage or cable-cutting sabotage,” and even the possibility that cables could one day serve as submarine detection systems [Source 1 Financial Times].
NEC has already laid more than 400,000 km of cables worldwide. Owning ships would allow NEC to guarantee faster response times for installation and repairs, making it more competitive in major tenders (Tom’s Hardware, 2025). NEC executive Takahisa Ohta acknowledged: “Owning a vessel is a huge fixed cost … but the market is booming now … one option is to acquire our own ship, and it’s something we’re considering.” (RioTimes Online, 2025)
Japan’s move has far-reaching implications. It enhances self-reliance, strengthens competitiveness, aligns with Quad and Indo-Pacific connectivity goals, and may provide a model for other governments to follow.
Southeast Asia is a region where these geopolitical tensions play out daily. Countries such as Vietnam, Indonesia, and the Philippines are building new cables to meet growing demand, but they are also being pulled by competing offers of investment and influence (Reuters, 2025).
Reuters reported in 2025 that U.S. officials have lobbied Vietnam to avoid Chinese suppliers as it plans up to ten new cables by 2030. Chinese companies continue to offer attractive pricing and financing, creating a delicate balance for regional governments.
To manage these pressures, many projects are reconfiguring routes. New trans-Pacific systems are bypassing Hong Kong, while consortia increasingly use mixed suppliers to reduce dependency on any one country (AInvest/Nikkei, 2025). Governments are tightening permits for landings and repairs, requiring local oversight, while some have relaxed cabotage rules to speed emergency work.
1.2.7. INDO-PACIFIC: ALLIANCES AND ALTERNATIVE ROUTES
The Indo-Pacific has emerged as a focal point for cooperative connectivity. The Quad alliance — the U.S., Japan, Australia, and India — has pledged to connect every Pacific Island state by the end of 2025, committing over USD $140 million in combined funding (JFIR, 2025). Japan’s forthcoming fleet would directly support these efforts by providing installation and repair capacity.
Alternative routes are also being developed to enhance resilience and bypass chokepoints. Projects such as Far North Fiber and Polar Connect in the Arctic, along with multi-branch loops across Northeast Asia, North America, and Southeast Asia, are being advanced [Source 12 Rio Times Online]. Japan’s geography makes it both a hub and a vulnerability, with many landing stations concentrated near Tokyo. The government is therefore encouraging diversification of landing sites, while projects such as the Southeast Asia–Japan Cable 2 (SJC2) already provide new routes and over 126 Tbps of capacity (AInvest/Nikkei, 2025).
1.2.8. CONCLUSION
Over the last year, submarine cables have moved from being technical projects managed quietly by private consortia to becoming critical assets at the heart of national and international security.
Key lessons are emerging. Fleet ownership matters, as Japan’s NEC subsidies show (Financial Times, 2025). Vendor trust is central, with U.S. and European policies reshaping procurement (FCC, 2025) (Semafor, 2025). Routing, redundancy, and permitting are now strategic as well as technical. And geopolitical blocs — the U.S., EU, Japan, Australia, and their partners — are increasingly aligning on what constitutes “trusted infrastructure.”
The submarine cable industry stands at a new inflection point. Politics is now as important as bandwidth. For investors, operators, and policymakers alike, understanding these dynamics is no longer optional — it is essential.
1.3. SYSTEM GROWTH
The submarine cable industry continues to demonstrate resilience and steady expansion, with new deployments reflecting the growing demand for global connectivity, low-latency routing, and enhanced resilience across major corridors. While year-to-year fluctuations remain a defining feature of the industry, the longer-term trajectory continues upward, supported by both hyperscaler-backed projects and regional consortia.
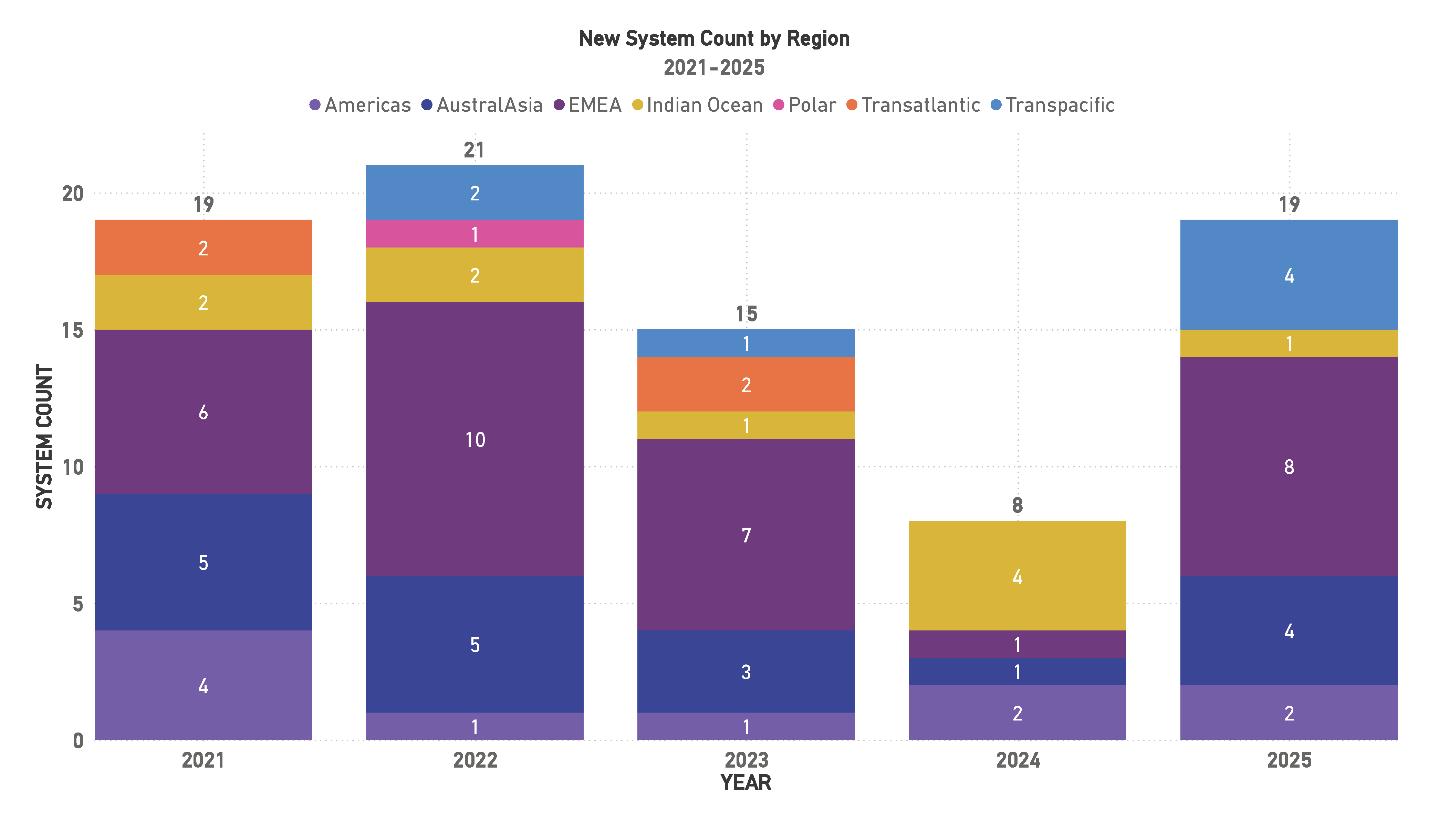
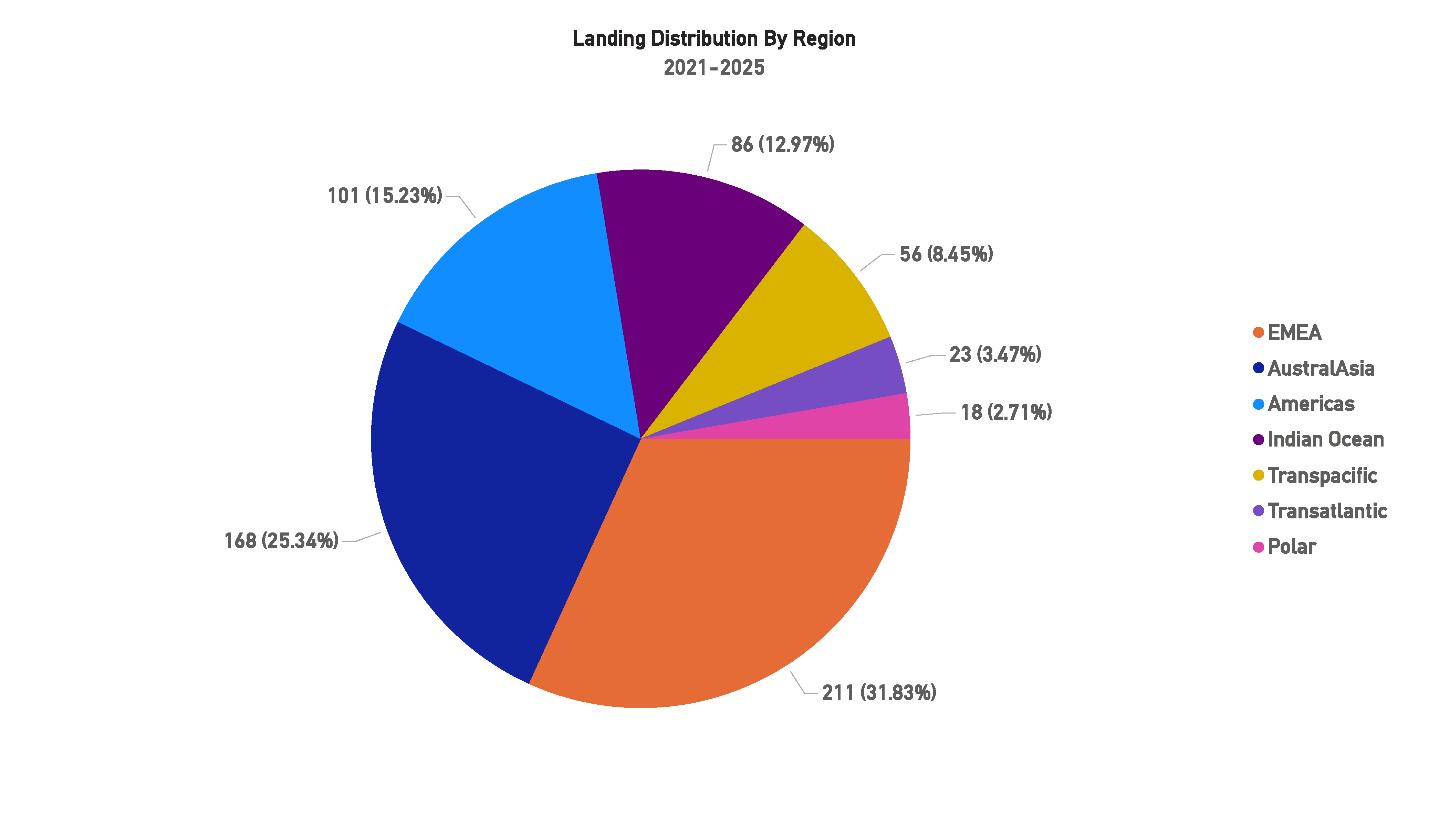
Figure 17: New System Count by Region, 2021-2025
Between 2021 and 2025, new system installations have shown both peaks and troughs as projects move through complex financing, permitting, and construction cycles. The year 2022 marked the high point, with 21 new systems coming online, followed by a decline in 2023 (15 systems) and 2024 (8 systems). Data for 2025, however, shows a rebound to 19 systems, highlighting the cyclical but resilient nature of industry growth. EMEA has consistently led in new system count, underscoring its role as the most active region for cable development, while the Transpacific’s resurgence in 2025 illustrates renewed investment in
transoceanic routes. AustralAsia continues to make steady contributions, while the Indian Ocean and Polar regions remain far less active, reflecting ongoing economic and geographic challenges.
Over the five-year period, EMEA emerges as the dominant contributor to system additions, while Transpacific growth in 2025 signals its return as a priority corridor for global capacity. Compared to last year’s report, which noted a steady decline in new installations after 2020, the updated figures suggest a more uneven but ultimately stronger recovery, with growth concentrated in high-demand long-haul routes.
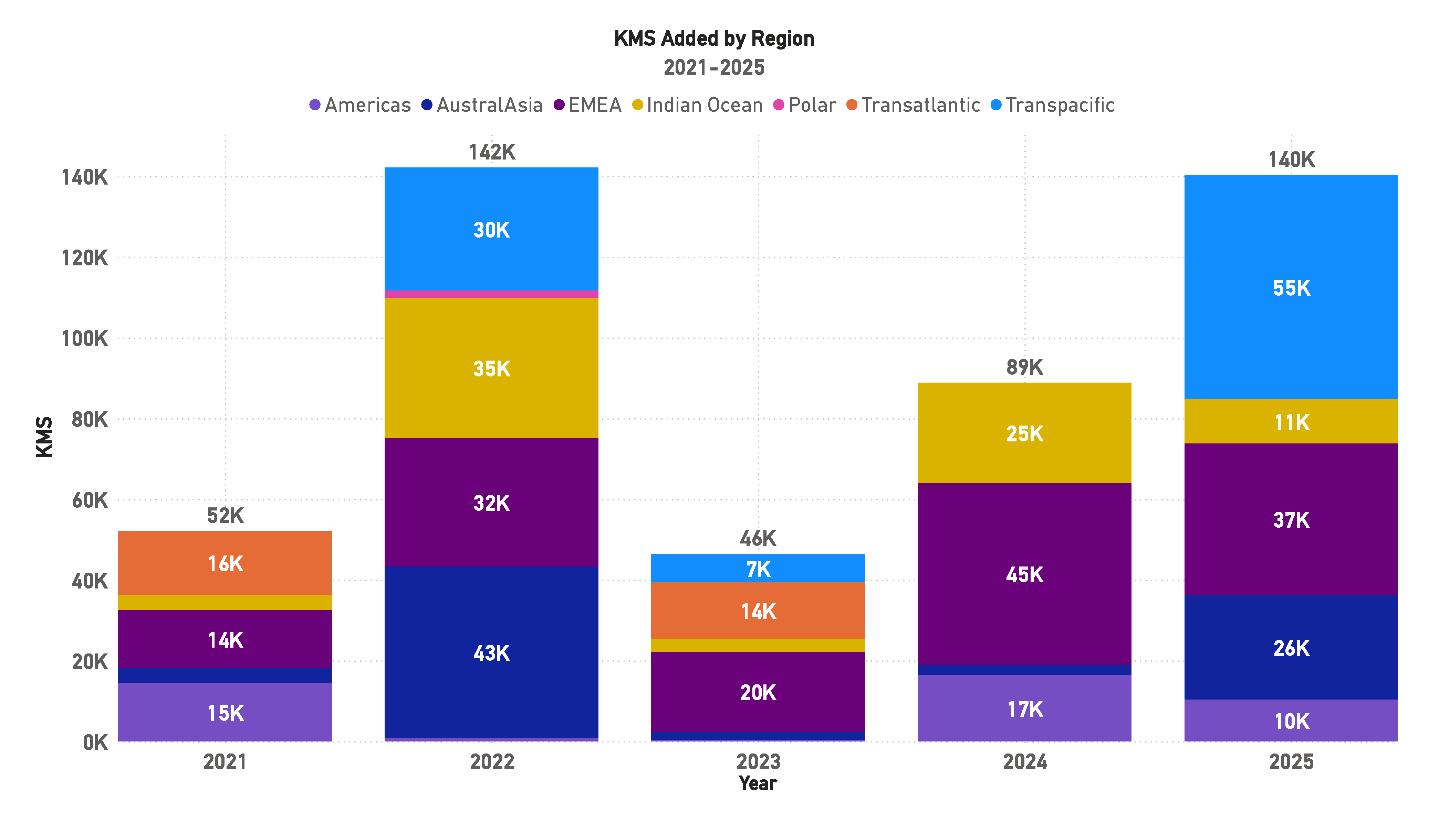
When measured in kilometers of cable installed, the story diverges from system counts, emphasizing the importance of system scale. In 2022, the 21 new systems contributed 142,000 kilometers, making it the standout year of the period. By contrast, 2023 delivered 15 systems but only 46,000 kilometers, reflecting a year dominated by shorter or regional builds. The year 2024, despite having only 8 new systems, recorded 89,000 kilometers, highlighting the scale of large projects in the Indian Ocean and EMEA. Projections for 2025 suggest another strong year, with nearly 140,000 kilometers expected to be added, supported by significant Transpacific and EMEA deployments.
Taken together, these results highlight the disconnect that can occur between system count and total kilometers installed. While smaller regional projects boost the number of systems in a given year, the longest-haul builds, particularly in the Transpacific and EMEA regions, account for the bulk of kilometers added. Compared to last year’s assessment, the growth in kilometers is greater than expected, underscoring the industry’s strategic focus on scaling capacity along its largest and most critical routes.
Figure 18: KMS Added by Region, 2021-2025
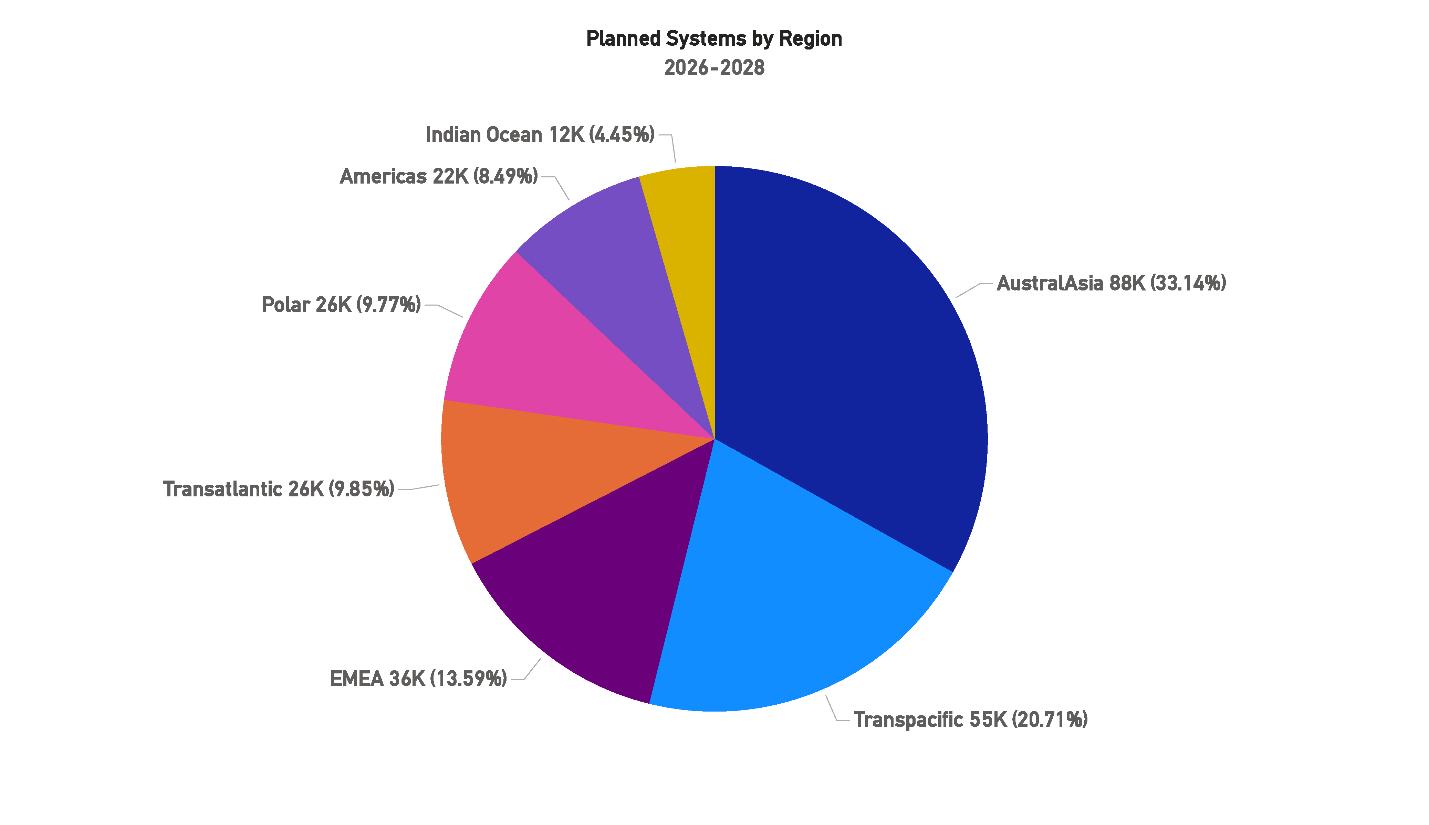
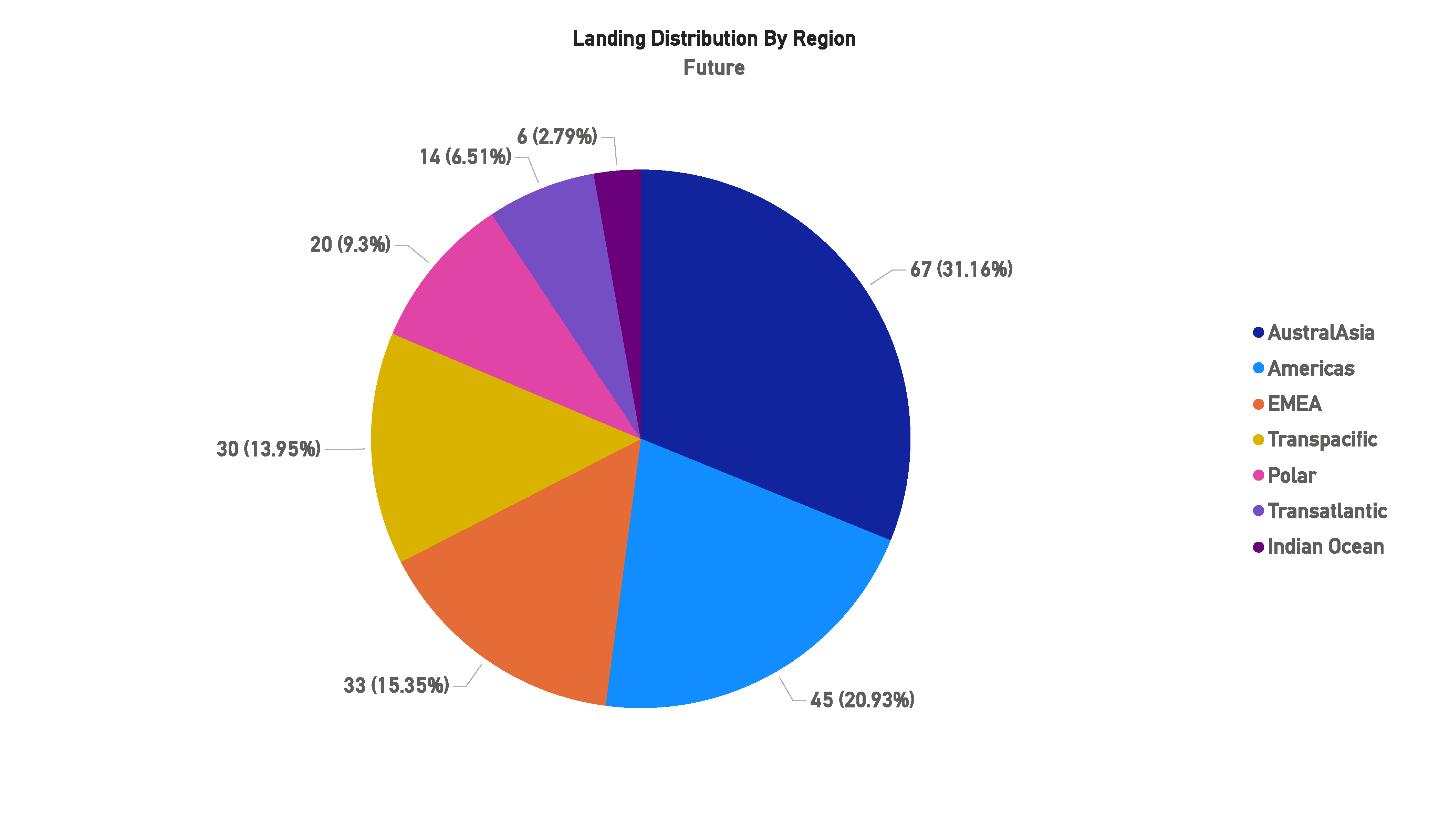
19: Planned Systems by Region, 2026-2028
Looking ahead, planned systems between 2026 and 2028 further reinforce these dynamics. AustralAsia leads with 88,000 kilometers of projected builds, accounting for one-third of future deployments, while the Transpacific follows with 55,000 kilometers, or just over 20% of the total. EMEA remains steady, with 36,000 kilometers planned, while the Transatlantic and Polar regions each account for approximately 26,000 kilometers. The Americas and Indian Ocean regions, with 22,000 kilometers and 12,000 kilometers respectively, remain on the lower end of future activity.
These projections suggest that long-haul routes will continue to dominate global growth, with AustralAsia emerging as the most active hub of development. The renewed emphasis on Transpacific builds reflects the need for both replacement of aging systems and diversification of capacity between Asia and the Americas. Compared to last year’s forecast, AustralAsia’s projected share has increased, while EMEA and the Transatlantic remain stable contributors, underscoring the broadening distribution of global infrastructure investment.
“Ten years ago the network carried over 97% of international traffic across one million km of cable with 100–150 Tbps of capacity; by 2025 it spans over 1.5 million km with more than 550 cables and 2 500–3 000 Tbps of capacity—a twenty fold increase in a decade.”
Joel Ogren – Assured Communications (STF Issue 142)
Figure
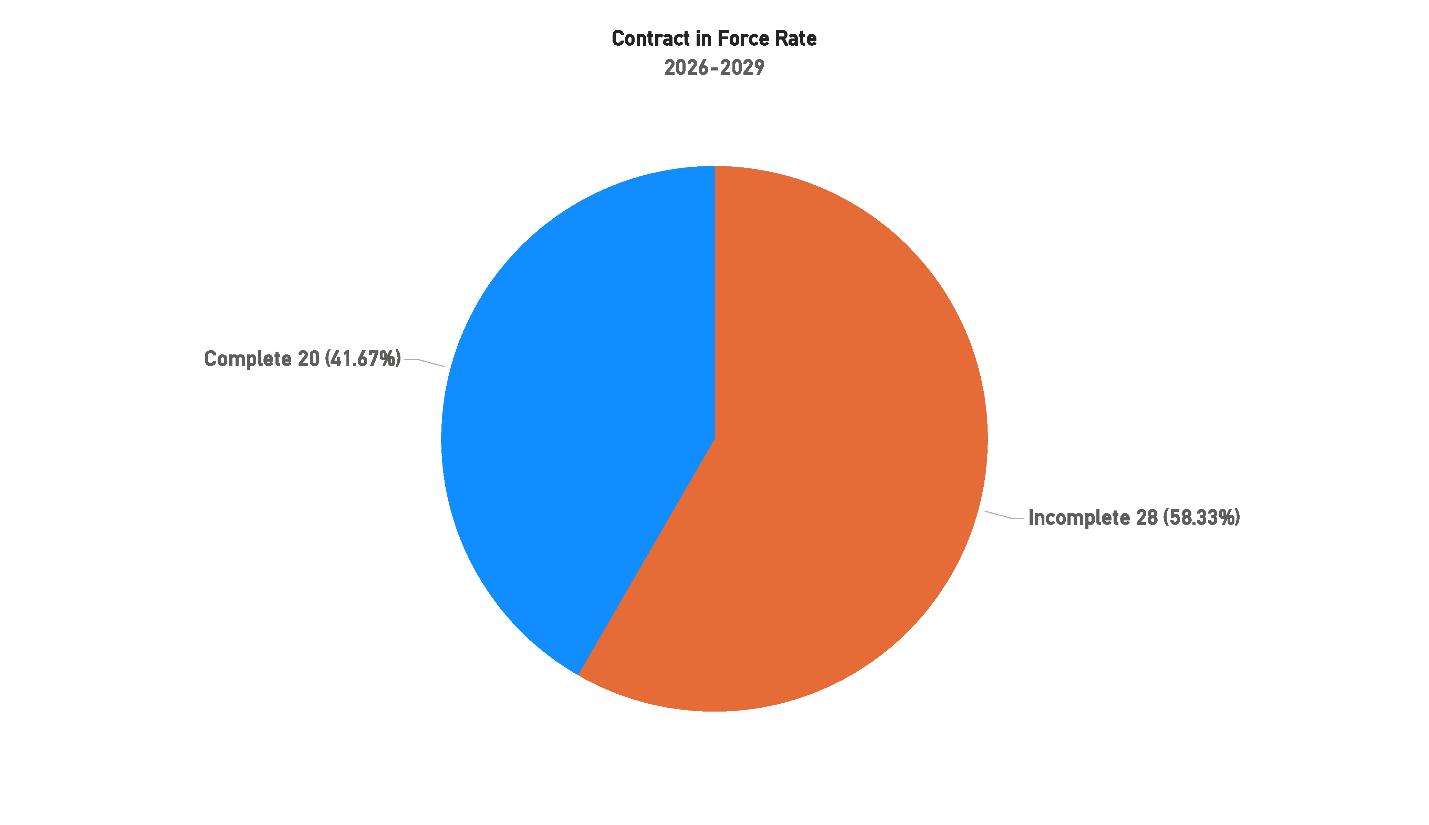
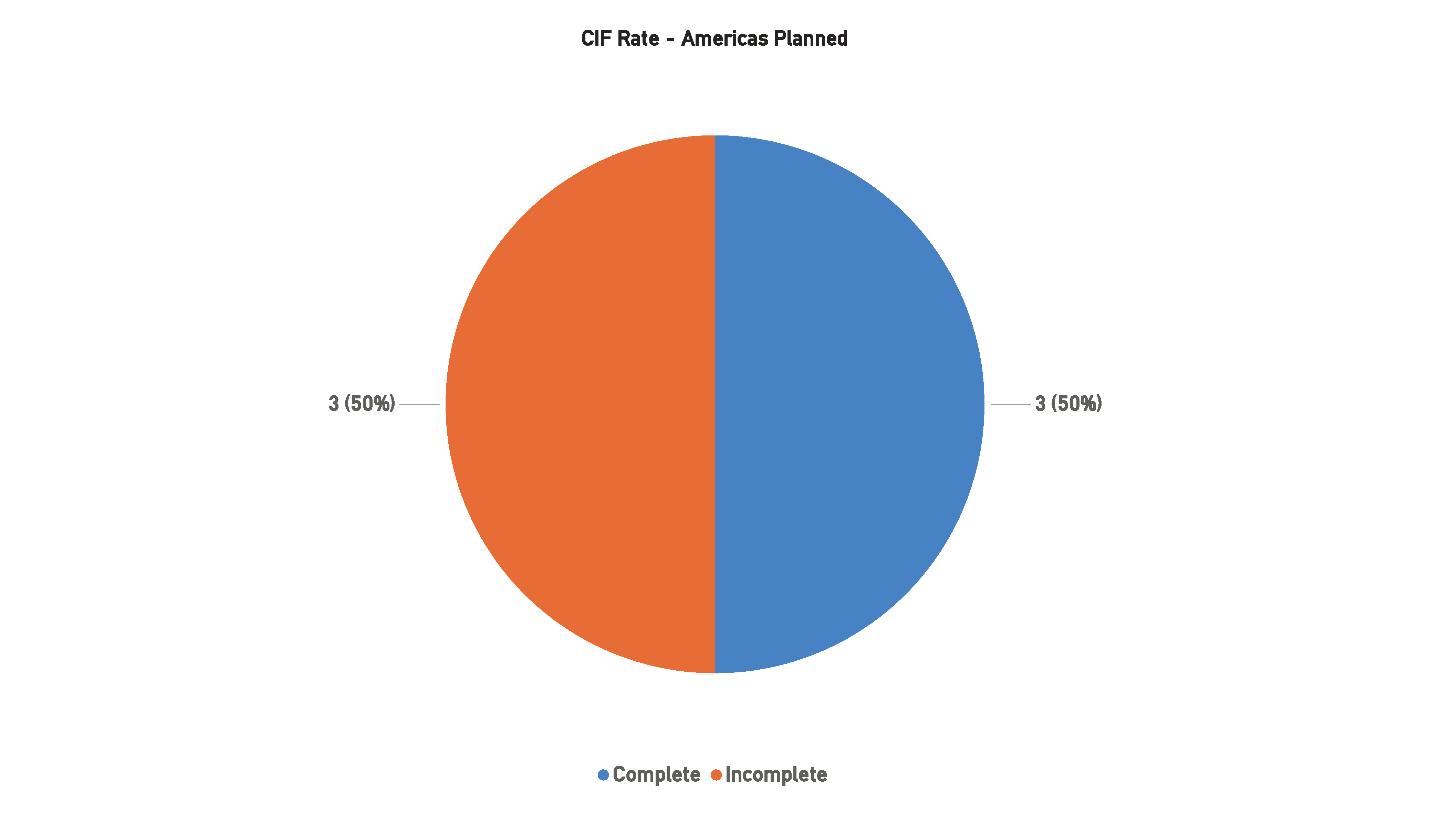
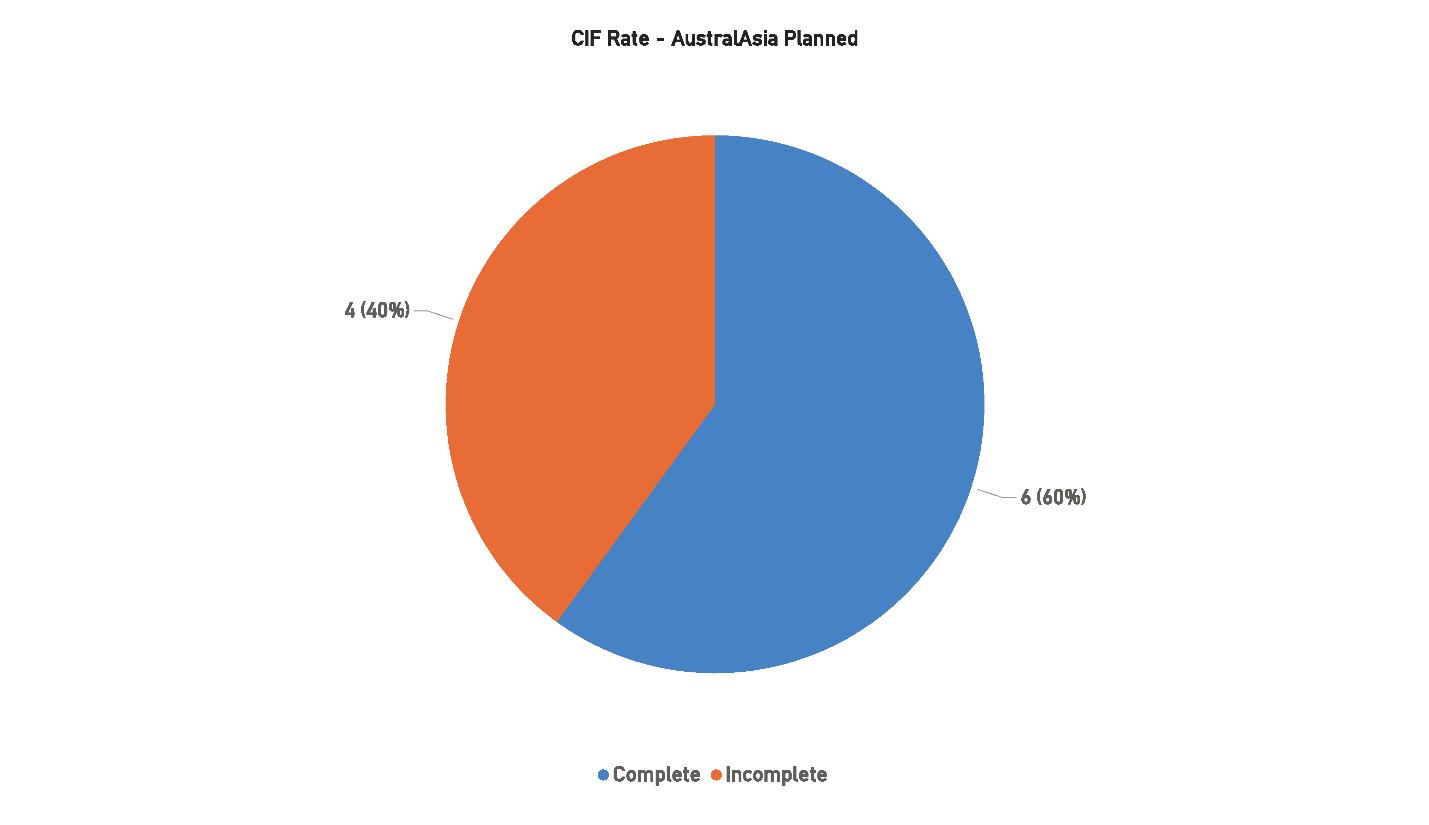
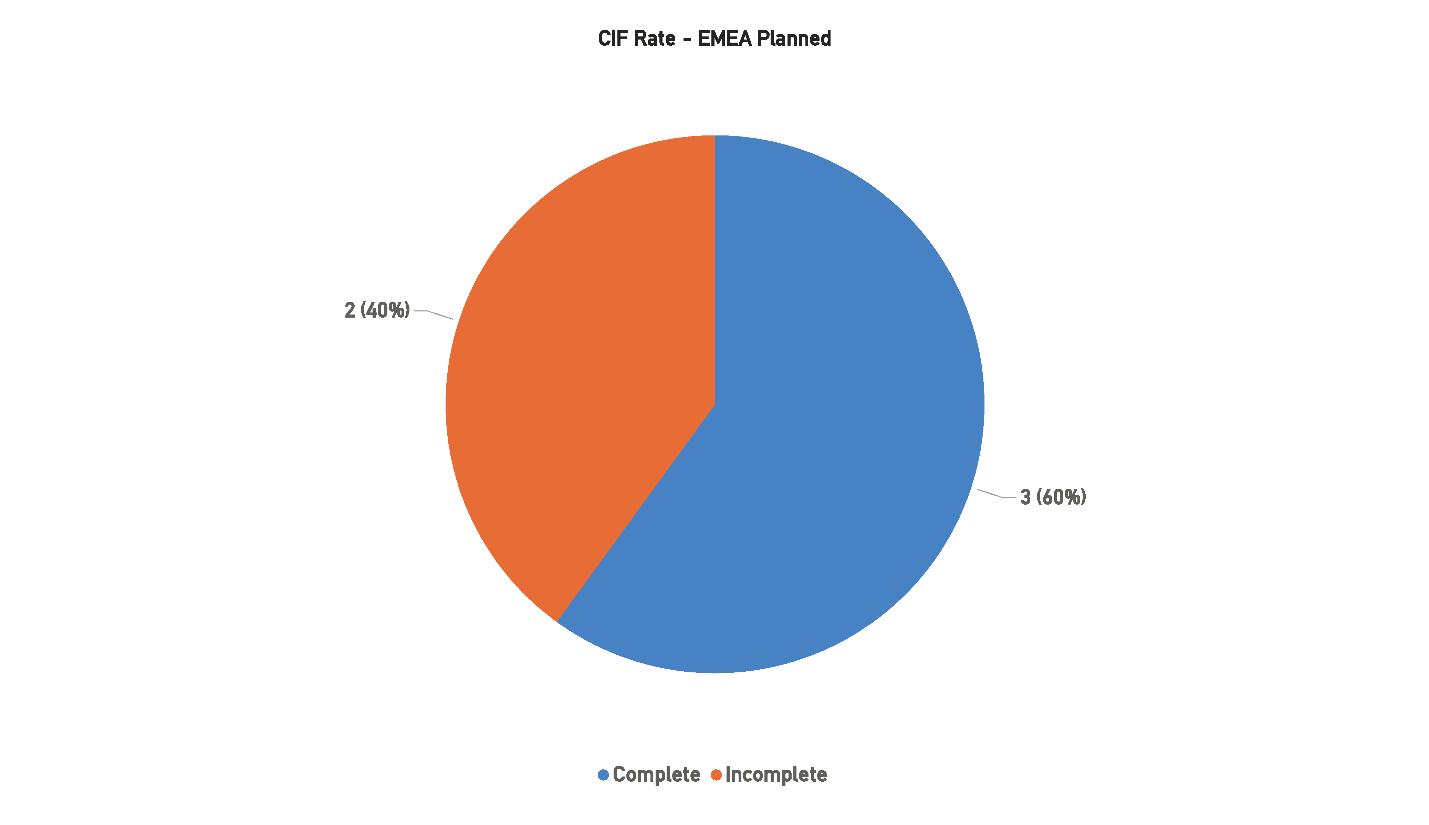
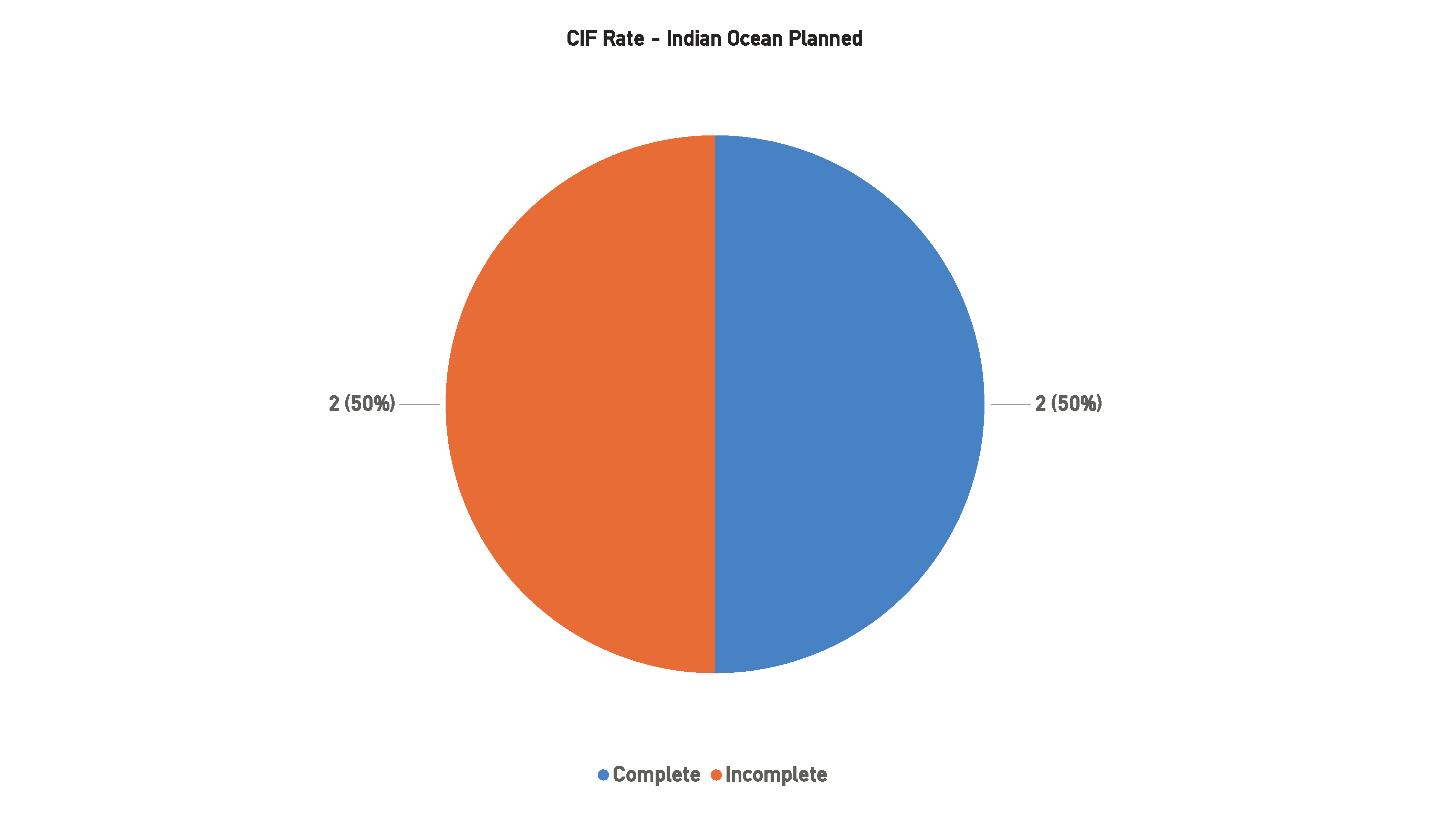
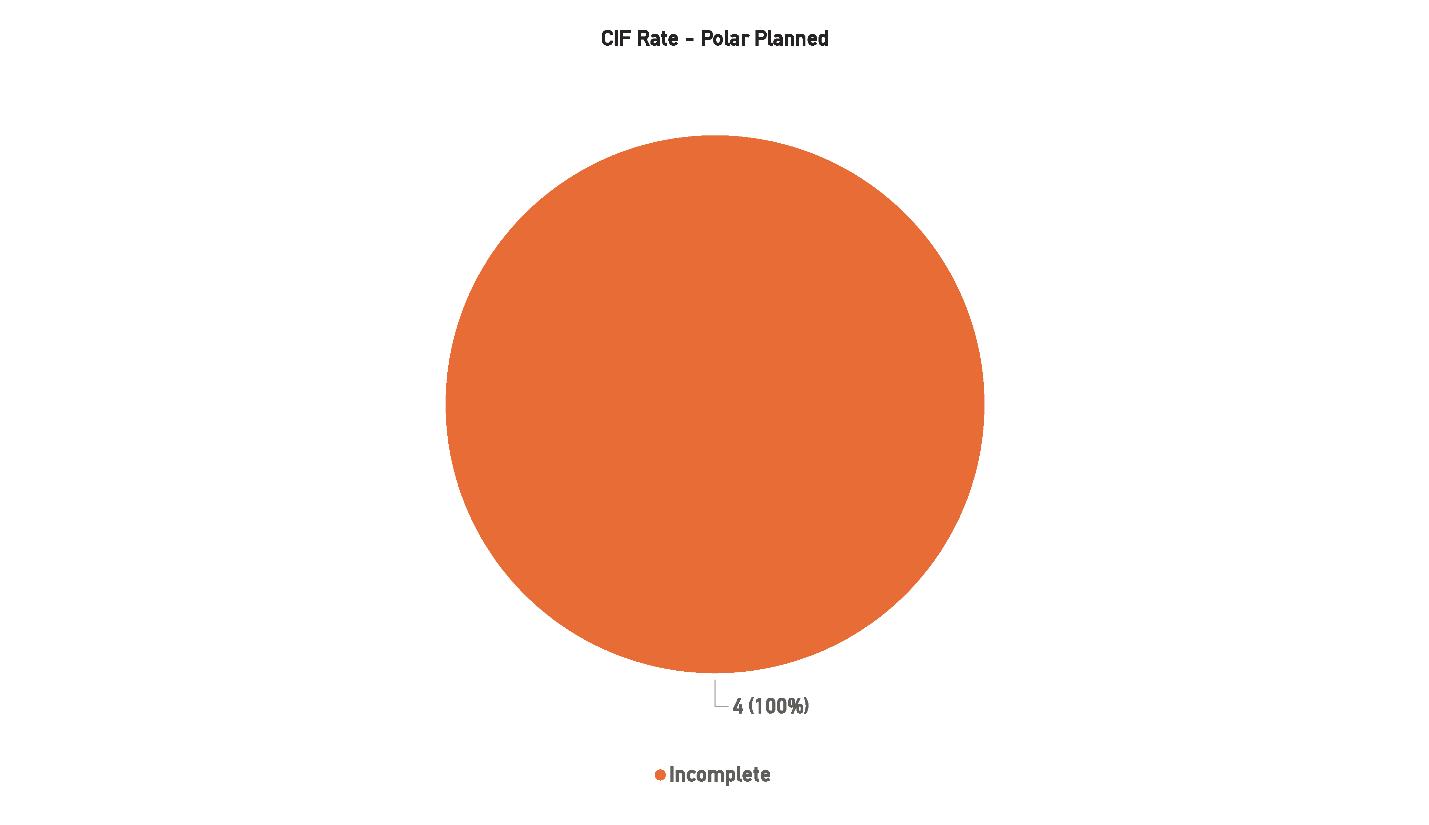
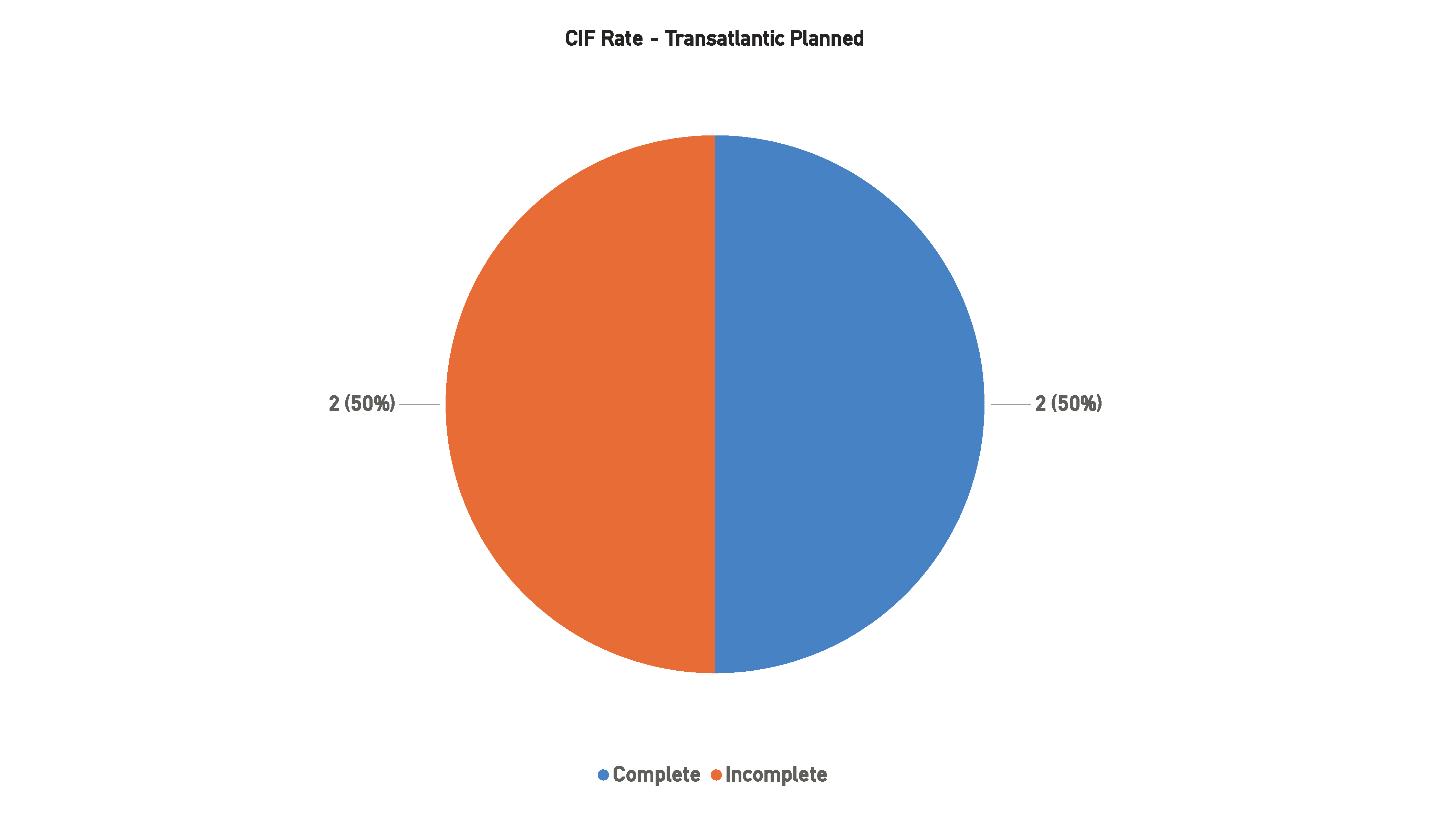
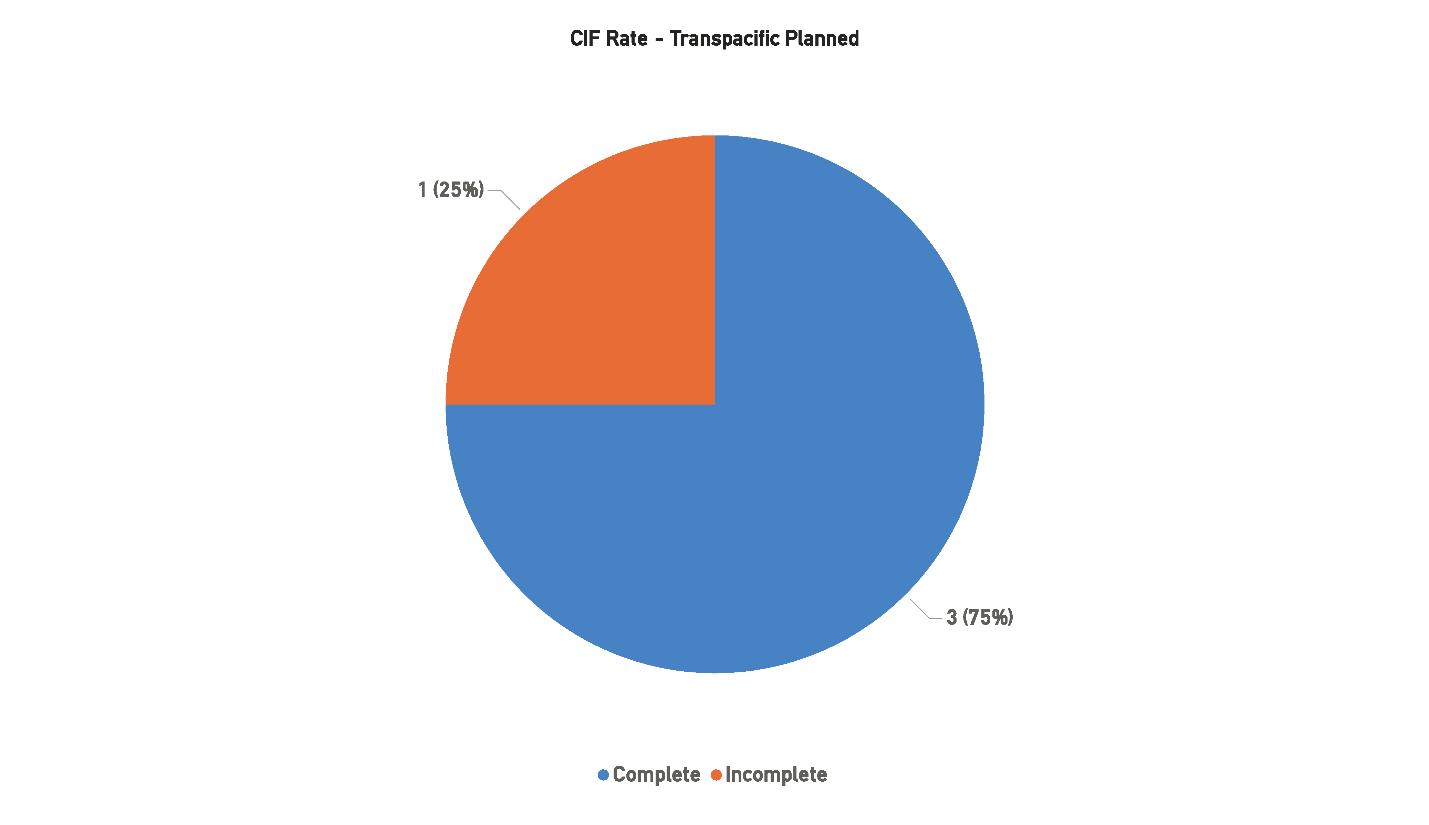
Despite this healthy pipeline, securing financing remains one of the industry’s most pressing challenges. As of the 2026–2029 forecast, 20 of the 48 planned systems have reached Contract in Force (CIF) status, representing 41.67%. While this is an improvement over last year’s report, where just over 20% of systems were CIF, it still leaves the majority of projects awaiting final commitments. The increase suggests progress in overcoming earlier financing hurdles, though challenges persist amid rising costs, regulatory complexities, and continued global economic uncertainty.
The CIF rate remains a key indicator of which systems are most likely to move forward. Projects that achieve CIF status have secured the necessary contractual and financial backing, giving them a far higher likelihood of being realized. Those that remain incomplete face the risk of delay or cancellation, particularly if they lack hyperscaler participation or sufficient consortium support. The current figures suggest that while industry activity remains strong, the timing of deployments will continue to be influenced by financing cycles and broader market conditions.
In summary, the period from 2021 to 2025 highlights the industry’s ability to adapt to fluctuating conditions, while projections through 2029 reaffirm the long-term trajectory of steady growth. EMEA, AustralAsia, and the Transpacific stand out as the primary corridors of expansion, while the CIF rate underscores the challenges that remain in bringing ambitious plans to completion.
Figure 20: Contract In Force Rate, 2026-2029
1.4. OUT OF SERVICE SYSTEMS ANALYSIS
An in-depth examination of the decommissioning of Out-of-Service (OOS) submarine cable systems highlights the growing importance of this often-overlooked stage of the industry’s lifecycle. While many cables continue to operate well past their anticipated End-of-Service (EOS) dates, the process of removing, recycling, or otherwise managing these aging systems has become increasingly relevant as global connectivity infrastructure expands. Companies such as Subsea Environmental Services, Mertech Marine, and Submarine Cable Salvage, Inc. remain at the forefront of recovery and recycling efforts, offering solutions that balance operational, financial, and environmental considerations. Mertech Marine has continued its long-standing focus on the recovery and repurposing of cables, while Subsea Environmental Services and Submarine Cable Salvage, Inc. have emphasized sustainable practices, including materials recycling and environmentally conscious removals.
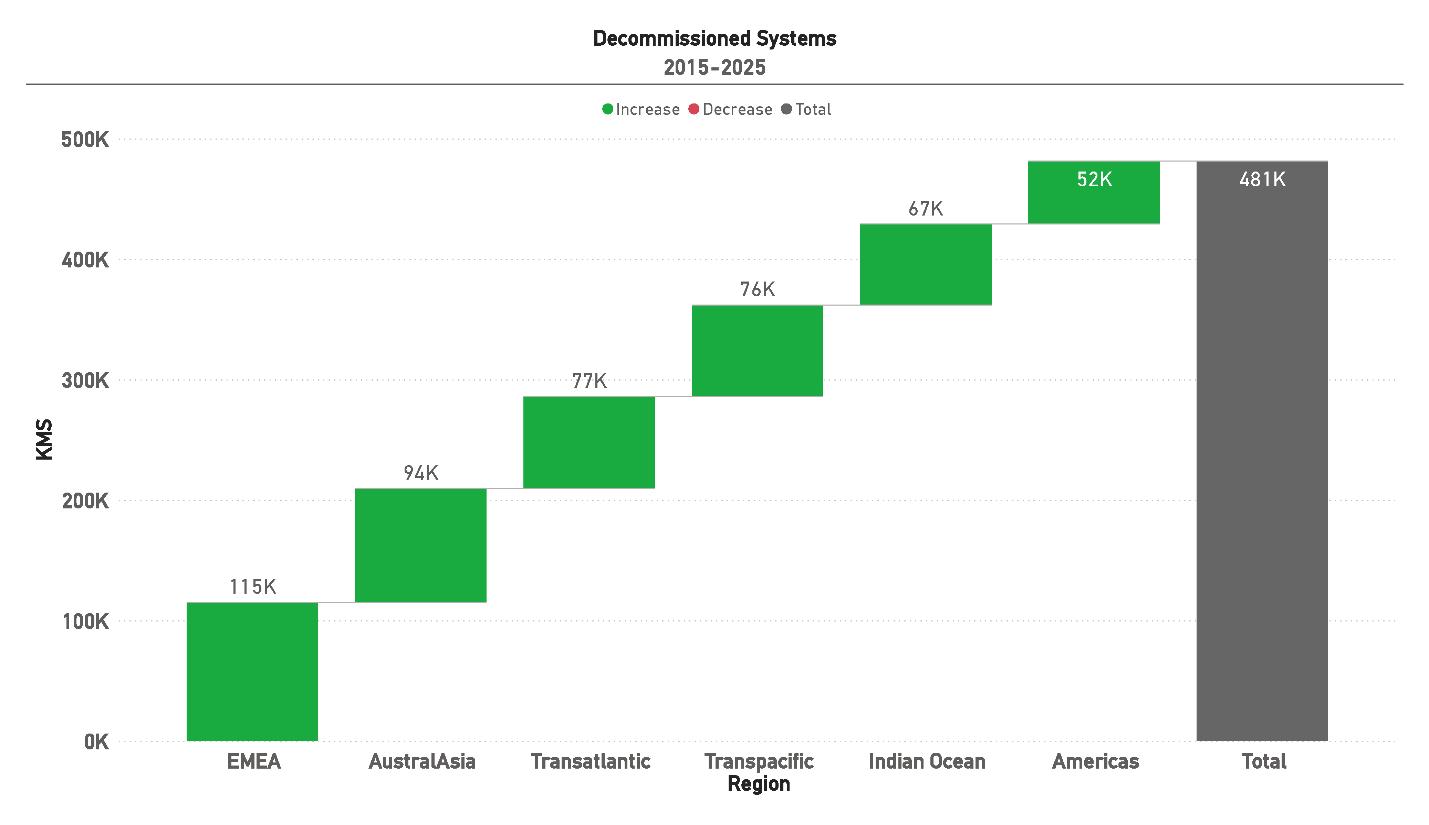
Figure 21: Decommissioned Systems, 2015-2025
Between 2015 and 2025, approximately 481,000 kilometers of submarine cable systems are expected to
be decommissioned worldwide. The EMEA region accounts for the largest share, with 115,000 kilometers taken out of service, reflecting both its historical role as a hub of subsea connectivity and the aging infrastructure concentrated in the region. AustralAsia follows with 94,000 kilometers, while the Transatlantic and Transpacific regions report 77,000 and 76,000 kilometers, respectively, underscoring the significant turnover in long-haul systems. The Indian Ocean region contributes 67,000 kilometers to global decommissioning totals, and the Americas account for 52,000 kilometers. Together, these figures highlight the ongoing transition as older systems reach the end of their useful life, particularly those built during the rapid build-out of the late 1990s and early 2000s.
Compared to last year’s analysis, which estimated 411,000 kilometers of cables taken out of service from 2014 to 2024, the updated totals reflect both continued retirements and improved tracking of decommissioned systems across multiple regions. EMEA remains the largest contributor, consistent with its status in previous years, while AustralAsia has grown in share as more regional systems age out of service. The Americas and Indian Ocean remain relatively smaller contributors but nonetheless illustrate the steady global spread of decommissioning activity.
Technological advancements have extended the lifespan of many cables beyond their expected EOS, often surpassing the standard 25-year benchmark through upgrades at landing stations and network management improvements. However, aging infrastructure inevitably faces higher risks of equipment failure, service interruptions, and increased maintenance costs, leading operators to transition systems into OOS status. The decision to physically remove these systems remains complex: while environmental regulations in some regions now mandate removal, in others, cables are left on the seafloor due to prohibitive recovery costs and the potential for ecological disturbance.
With an estimated 85 additional systems projected to reach EOS within the next five years, and another 53 by 2032, the issue of decommissioning is expected to intensify. Historical precedent shows that fewer than 60 systems have been fully removed in the past two decades, underscoring the gap between cables aging out of service and those actually reclaimed or recycled. This discrepancy places increasing pressure on both operators and regulators to address the environmental and logistical challenges of managing decommissioned assets.
Specialized companies such as Mertech Marine and Subsea Environmental Services play a vital role in bridging this gap. By focusing on recovery and recycling, these firms ensure that valuable materials can be repurposed while mitigating the environmental impact of aging infrastructure. Their expertise in cable removal and sustainable disposal practices offers a path forward for an industry facing mounting regulatory scrutiny and growing public expectations around environmental responsibility.
In conclusion, the decommissioning of Out-of-Service submarine cable systems remains a multifaceted challenge at the intersection of technical feasibility, financial cost, and environmental stewardship. As hundreds of thousands of kilometers of cable near the end of their operational life, coordinated strategies involving system owners, regulators, and specialized recovery firms will be essential. The coming decade will test the industry’s ability to not only expand global connectivity but also responsibly manage the inevitable retirement of its oldest infrastructure.
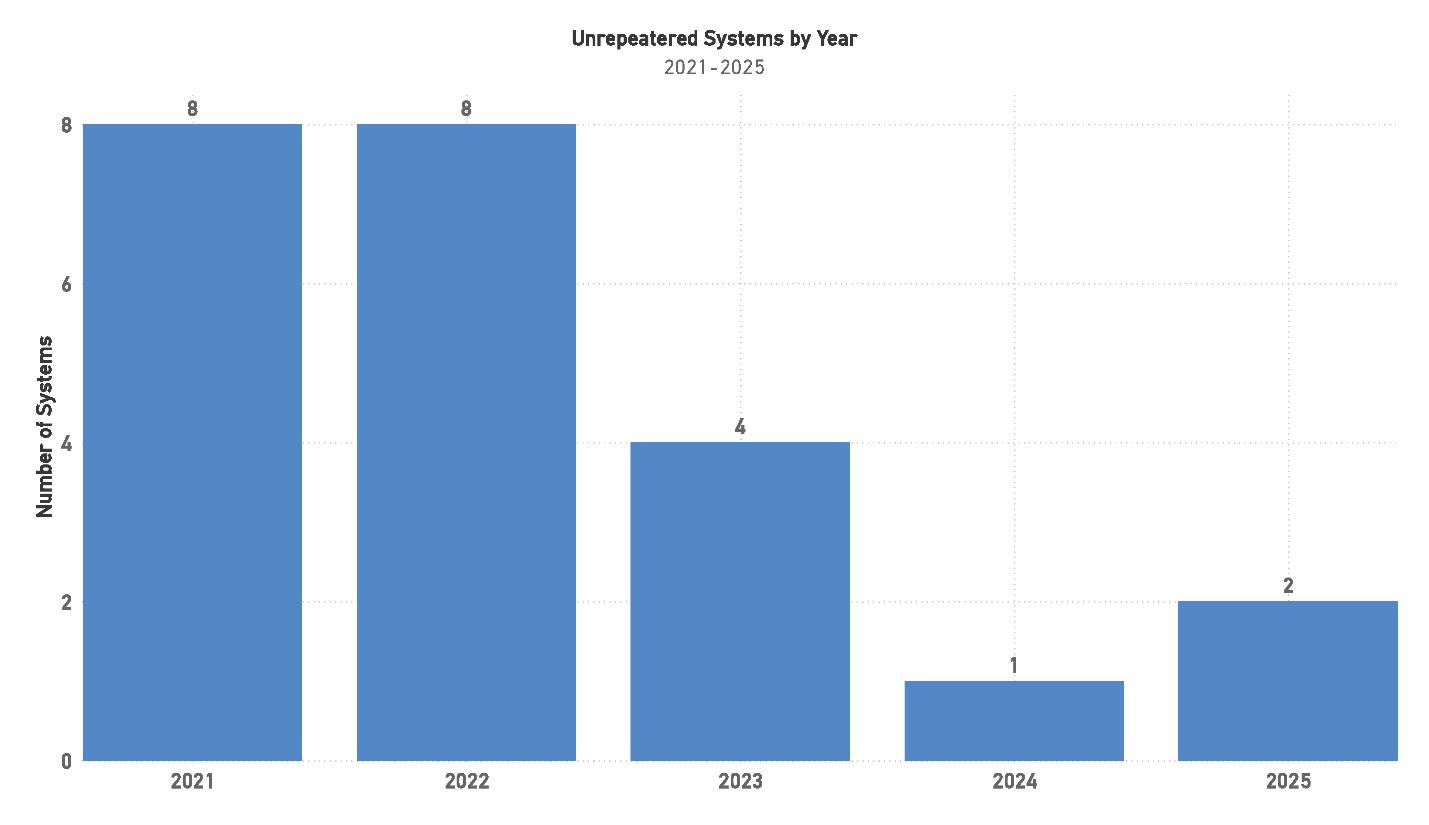
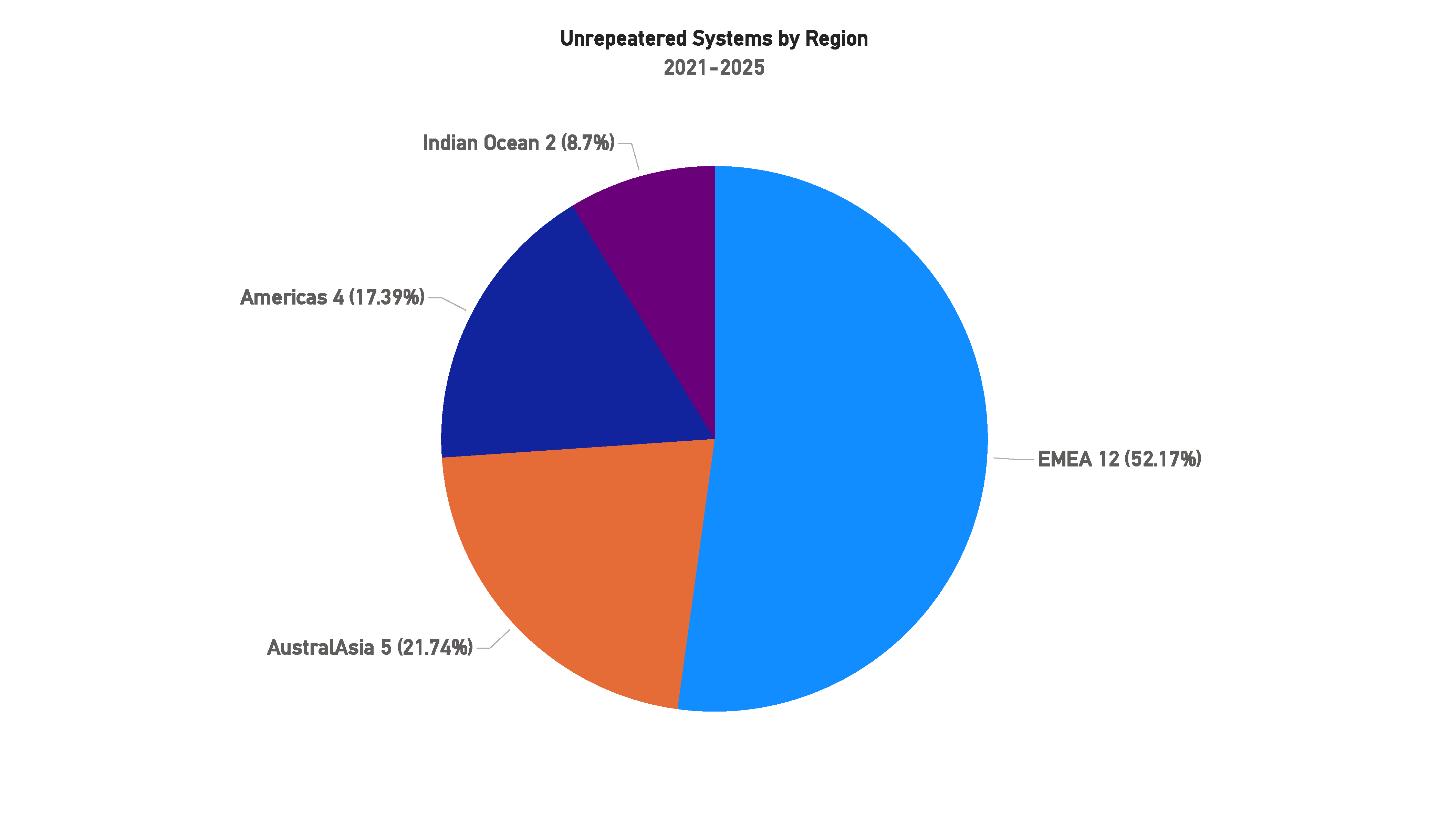
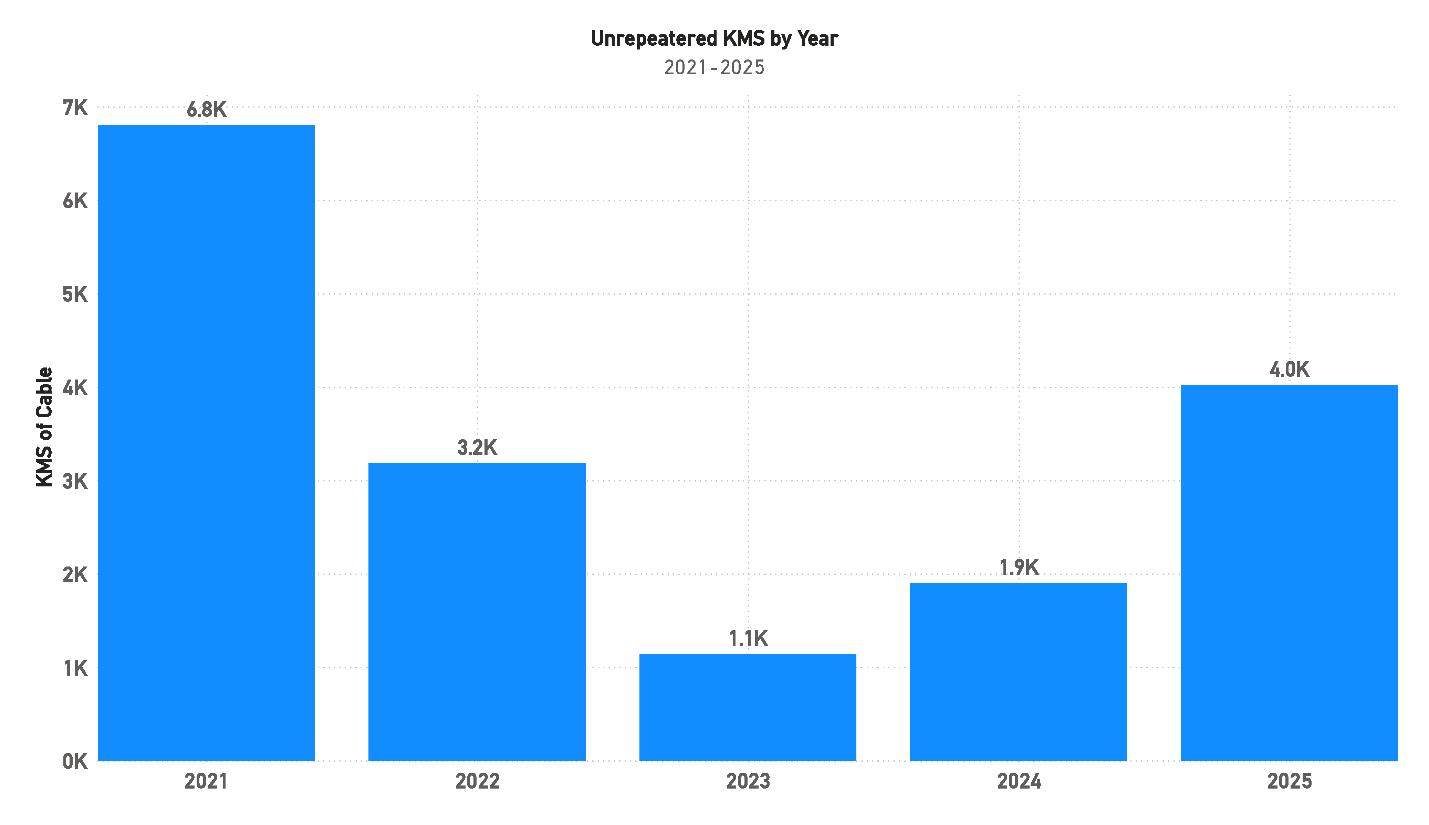
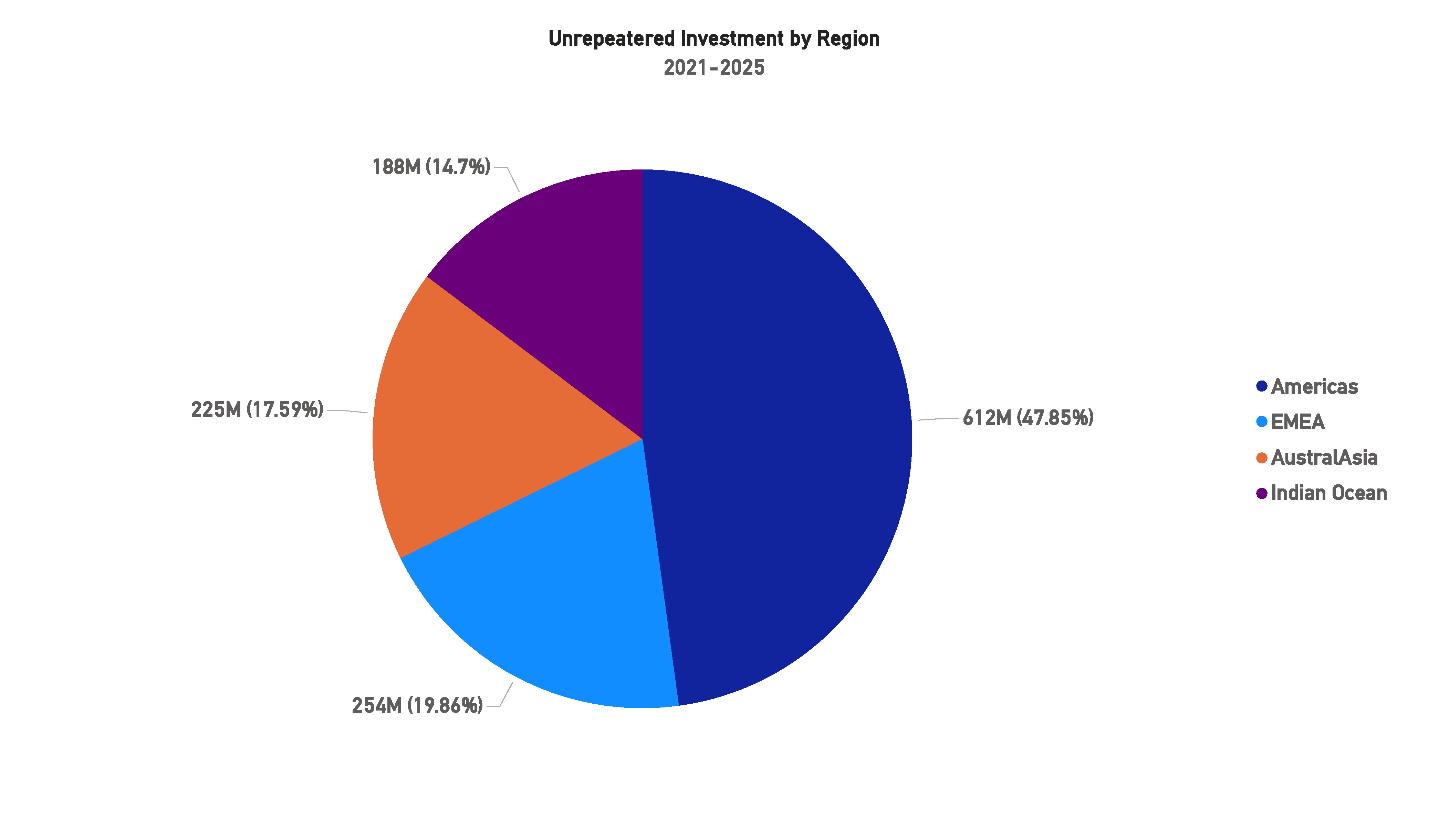
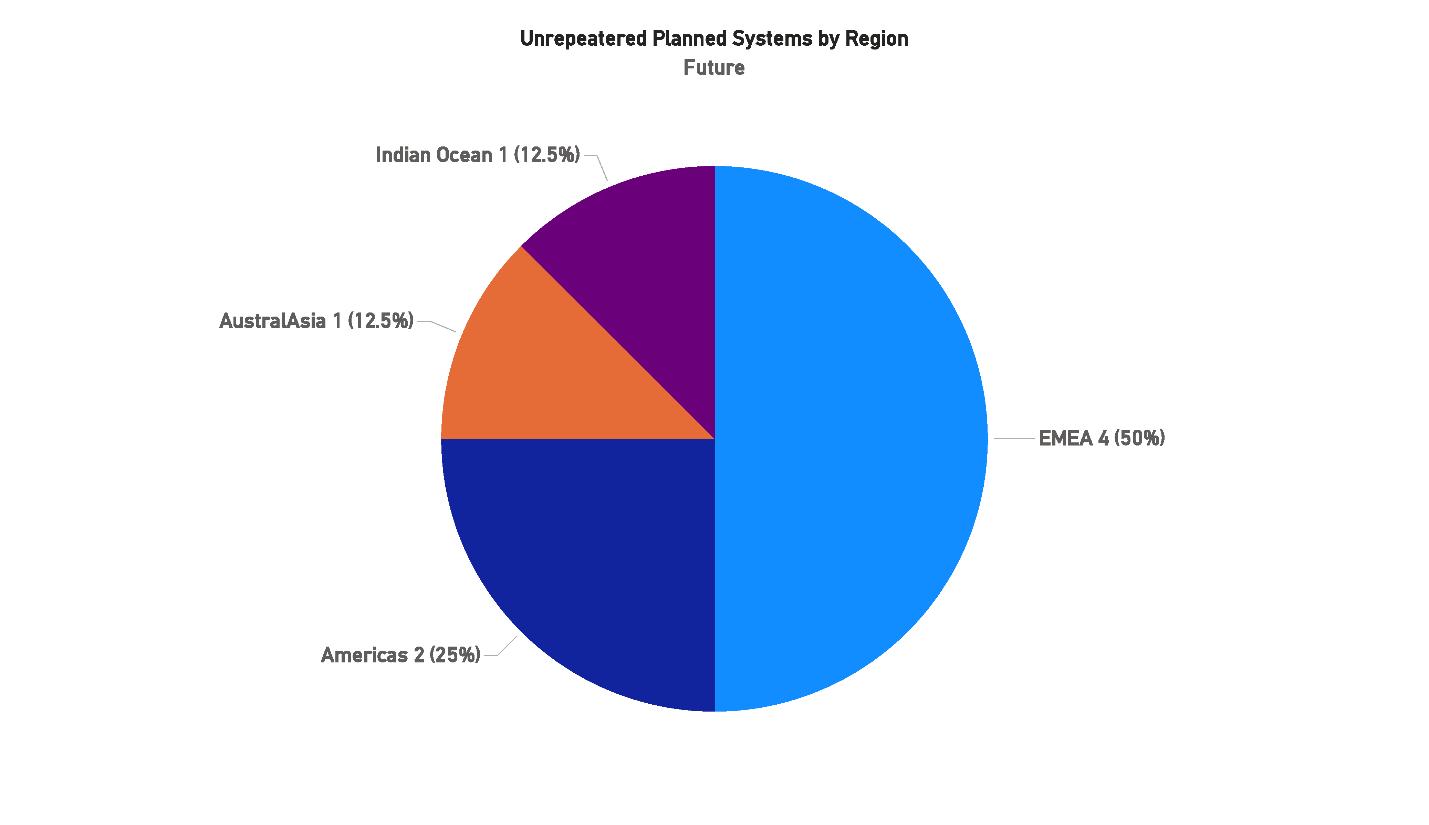
“Unrepeated submarine cables form the oldest architecture in subsea communications. They provide regional and inter island links and connect offshore installations; their simplicity and cost effectiveness make them indispensable.”
Tony Frisch (Xtera), Anders Ljung (Hexatronic) & Lynsey Thomas (Lynsey Thomas Consulting) (STF Issue 143)
2. CAPACITY
2.1. GLOBAL CAPACITY
Global capacity growth across major submarine cable routes continues to highlight the shifting dynamics of investment and demand within the industry. Between 2021 and 2025, a clear pattern emerges: while overall demand for international connectivity remains robust, the timing and distribution of new capacity along major arteries such as the Transatlantic, Transpacific, Americas, and AustralAsia routes have varied considerably year by year.
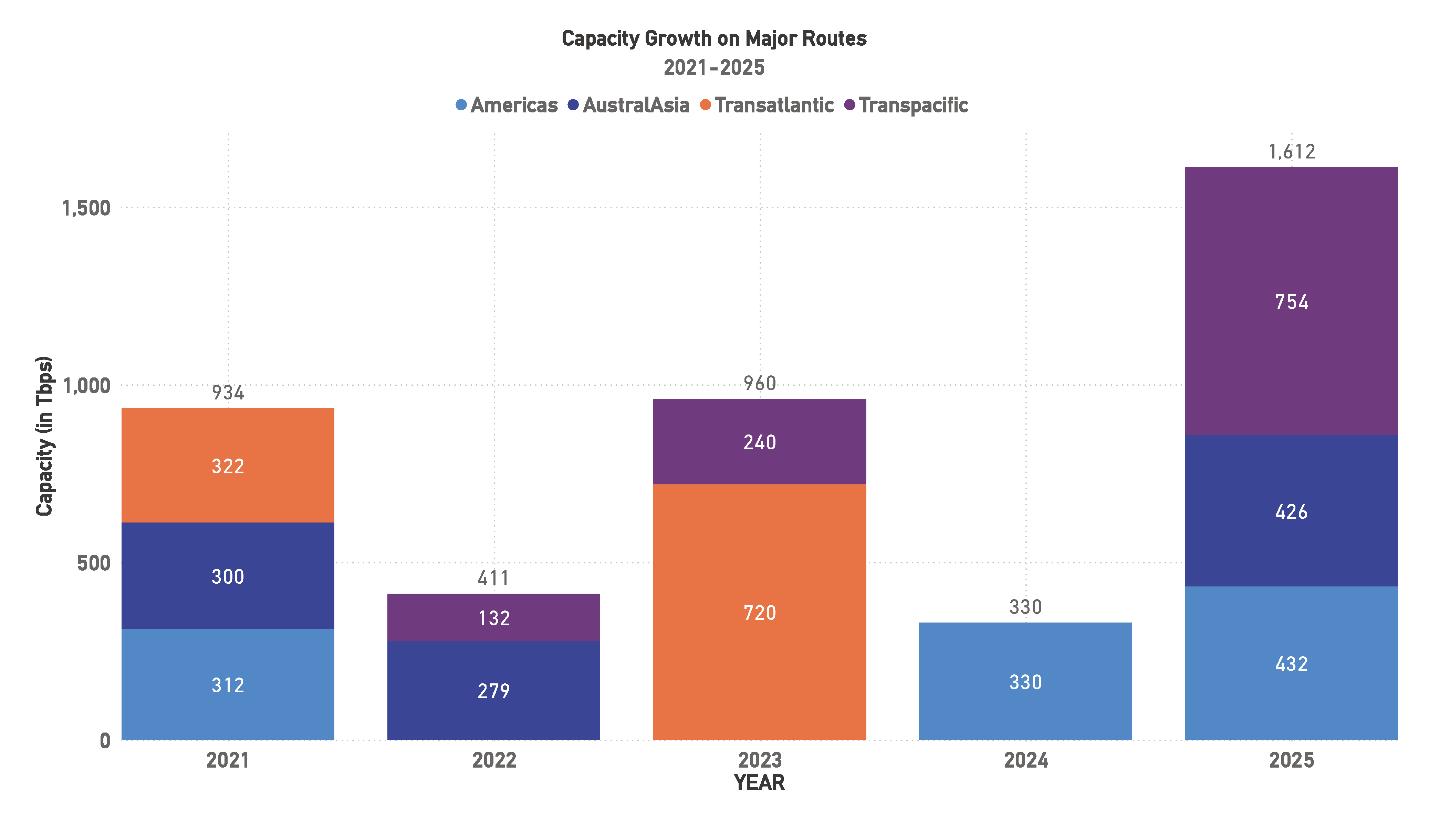
22: Capacity Growth on Major Routes, 2021-2025
In 2021, the industry recorded one of the stronger capacity additions of the period, with 934 Tbps brought online across the major routes. The largest contributions came from the Transatlantic and Americas segments, which together accounted for more than 600 Tbps of new capacity. AustralAsia also played a significant role, adding 300 Tbps during the year. This growth underscored the continued demand across both east–west and north–south routes, particularly for transoceanic systems connecting the U.S. and Europe with Asia and beyond.
Figure
By contrast, 2022 represented a sharp decline in new additions, with only 411 Tbps deployed. This drop was driven largely by a lack of growth across the Americas and Transatlantic routes, with AustralAsia adding just under 280 Tbps and Transpacific contributing a smaller 132 Tbps. The slowdown reflected a gap in the commissioning of large-scale new systems, even as demand fundamentals remained strong.
A recovery took shape in 2023, with 960 Tbps of new capacity added across major routes. The Transatlantic segment dominated with 720 Tbps, underscoring its central role as one of the most competitive and well-developed corridors. The Transpacific route contributed 240 Tbps in the same year, marking an important step forward in expanding links between North America and Asia-Pacific markets. Notably, AustralAsia and the Americas did not register major contributions during this period, highlighting the uneven distribution of capacity growth across routes.
Capacity growth slowed again in 2024, with just 330 Tbps added, all of it on the Americas route. This represented one of the lowest totals in recent years, particularly when compared to the significant volumes added in 2021 and 2023. The limited growth underscores the variability in project completions, as capacity additions remain closely tied to the timing of individual system launches.
In 2025, the industry is preparing for a substantial wave of new capacity across major routes. A total of 1,612 Tbps is projected to be added, the largest annual increase of the five-year period. The Transpacific route is expected to contribute 754 Tbps, representing nearly half of total new growth this year, followed by AustralAsia with 426 Tbps and the Americas with 432 Tbps. Together, these three regions account for more than 95% of projected additions in 2025, reflecting a renewed emphasis on strengthening intercontinental connectivity and expanding east–west traffic corridors.
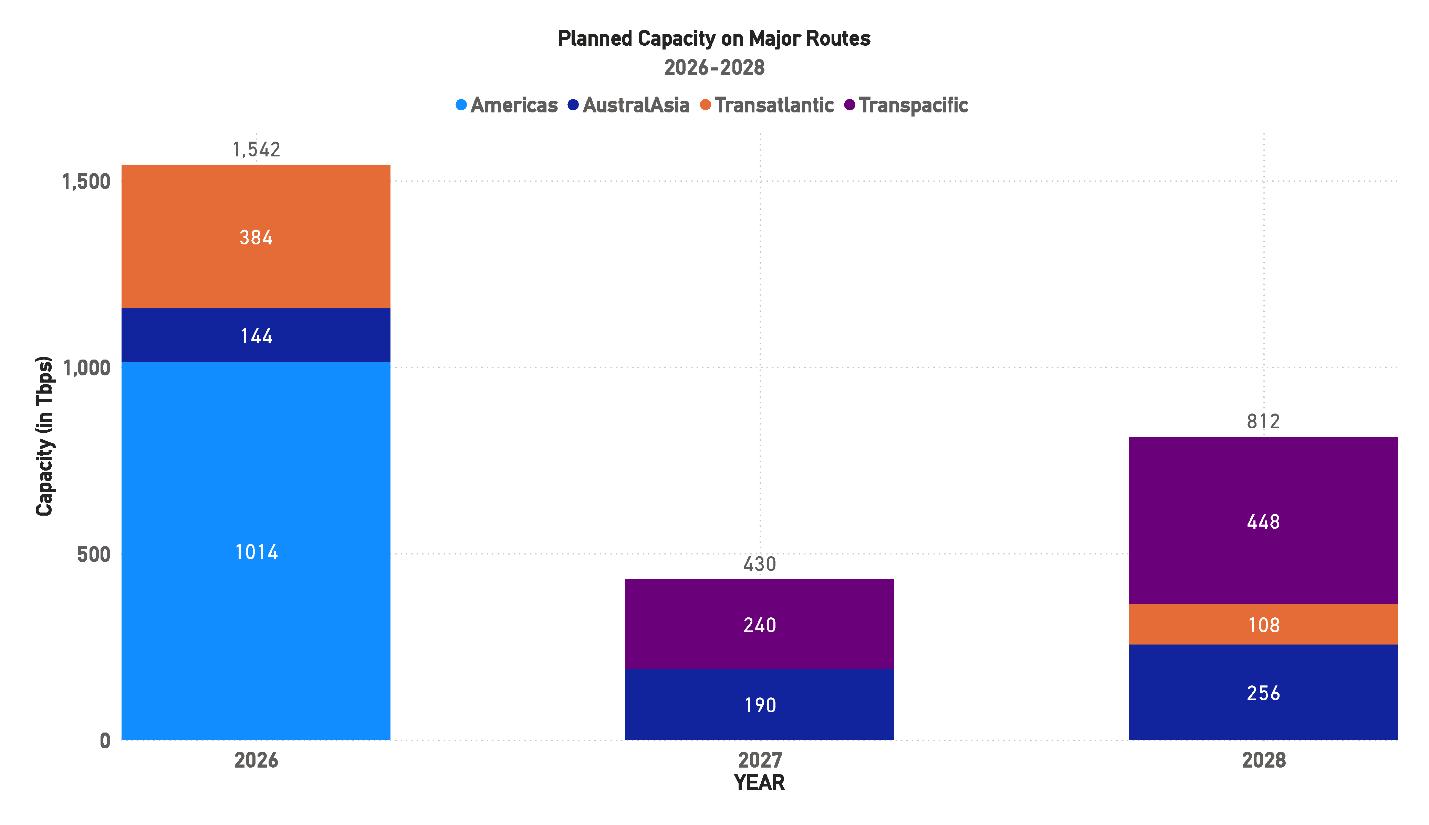
Figure 23: Planned Capacity on Major Routes
Beyond 2025, the outlook indicates continued capacity growth but at a more measured pace. In 2026, an estimated 1,542 Tbps will be added, the majority of which—over 1,000 Tbps—will come from the Americas route. This makes 2026 another high-capacity year, with important implications for data flow between the U.S., Latin America, and other regions. In 2027, capacity additions are projected to decline significantly, with only 430 Tbps planned, largely split between the Transpacific (240 Tbps) and AustralAsia (190 Tbps). By 2028, the pipeline anticipates 812 Tbps of new capacity, with Transpacific once again playing a leading
role at 448 Tbps.
Compared to last year’s projections, the timing of growth has shifted, with some systems now scheduled for later years, particularly in the Transpacific and Transatlantic segments. The concentration of activity in 2025 and 2026 highlights the clustering effect often seen in large-scale submarine cable deployments, where multiple projects reach completion within a short timeframe. At the same time, the forecast suggests slower activity in 2027 before growth resumes in 2028, a reminder of the cyclical nature of the industry.
It is important to note that these figures represent growth across the industry’s major arteries and do not capture all new capacity added globally. They are, however, indicative of where the most competitive and heavily developed routes are headed in terms of near- and medium-term growth. As in previous years, the adoption of advanced transmission technologies—including higher-order modulation, greater fiber pair counts, and spectrum sharing arrangements—will play a critical role in ensuring these new systems meet the escalating demand for global data transmission.
Taken together, the results from 2021 to 2025 and the planned deployments through 2028 underscore the scale and complexity of managing global submarine cable capacity. With demand continuing to rise across all regions, the industry’s ability to deliver large volumes of new capacity on its most important corridors remains central to supporting the world’s digital infrastructure.
“More than 70% of direct traffic between Africa and the United States now runs through the Angola Cables network, providing low latency, high capacity routes.”
Angelo Gama – Angola Cables (STF Issue 142)
2.2. LIT CAPACITY
The global submarine cable landscape continues to expand rapidly, with major routes seeing significant increases in both lit capacity (the in-service bandwidth actively being used) and total design capacity (the theoretical maximum if fully equipped). Year-over-year growth from 2024 to 2025 has been robust across all key routes, driven by hyperscaler investments, data center expansion, and surging demand from 5G and cloud services. However, regional disparities and constraints – from economic and regulatory challenges to geopolitical tensions – are influencing how this capacity is utilized. Below, we provide an updated region-by-region breakdown for the Americas, Intra-Asia, Transatlantic, and Transpacific routes, including 2024 and 2025 figures and projections for 2026, along with analysis of trends, drivers, and emerging technologies.
2.2.1. AMERICAS (NORTH AMERICA–LATIN AMERICA ROUTES)
Capacity Growth: The Americas routes (primarily connecting the U.S. with Latin America and the Caribbean) have sustained strong growth. Total design capacity nearly doubled between 2020 and 2024, rising from about 913 Tbps to 1,524.8 Tbps in 2024, while lit capacity grew from 802 Tbps to 1,102.2 Tbps over the same period. This represents a significant increase, although growth has been uneven year to year. From 2024 to 2025, total capacity continued to climb – bolstered by new systems like Google’s Firmina cable (approximately 12 fiber pairs, ~240 Tbps design) – reaching an estimated ~1,650 Tbps. Lit capacity is likewise up in 2025 to roughly ~1,200 Tbps, reflecting ongoing traffic growth. By 2026, with additional projects coming online (including high-fiber-count cables such as the planned 36-pair AMX-3/Tikal cable at ~360 Tbps (BNAmericas, 2024)), total design capacity is projected to approach ~1,750 Tbps, with lit capacity around ~1,300 Tbps as service uptake gradually fills the available bandwidth.
Table 1: Americas Route Lit Capacity 2024-Present Year
Utilization and Drivers: The Americas region currently utilizes a large share of its capacity – roughly 72% of available capacity was lit in 2024 – but growth in lit bandwidth has been slower and prone to fluctuation. In the years immediately prior, lit capacity saw double-digit growth (29% in 2020) that tapered off to
mid-single digits (around 4% in 2021) before rebounding to about 16% by 2024. This volatility stems from economic and political factors in Latin America. Demand is heavily concentrated in the United States, which continues to drive traffic, whereas many Latin American markets are still ramping up digital adoption. Hyperscalers (like Google, Meta, and Microsoft) have been key investors in new North–South cables connecting the U.S. to Brazil, Chile, Argentina and beyond.
These new private cables (e.g., Google’s Curie and Firmina, Meta’s Juno and others) contribute enormous design capacity, but much of it is dedicated to the hyperscalers’ own cloud and content needs. As a result, unless wider market demand catches up or access to these systems broadens, a significant portion of the theoretical capacity remains unlit. Indeed, the Americas route has struggled with underutilized capacity in certain segments, as cloud and streaming services growth in Latin America, though accelerating, has not yet fully tapped the available bandwidth.
Regional Considerations: Economic challenges and regulatory hurdles in parts of Latin America continue to temper demand growth. Political instability and slower enterprise cloud adoption in some countries mean that the full potential of new cables is not immediately realized. Nevertheless, there are positive signs: telecom and data center investments are increasing in major economies like Brazil, Mexico, and Chile, and 5G rollouts and rising internet use are steadily boosting international bandwidth needs. By 2025, cloud providers and content networks are expanding their presence in Latin America, driving more traffic onto subsea routes.
The utilization trend in the Americas is expected to continue upward but at a measured pace. The lit-todesign capacity ratio may actually dip in the near term (with big new cables coming online), then gradually rise as market usage catches up to the built capacity. Careful infrastructure planning will be required to avoid overbuild scenarios – recent growth has created a healthy buffer, and going forward the industry is likely to take a more measured approach to adding new cables in this region. At the same time, any underestimation of future demand could lead to bottlenecks: if Latin American digital services and cloud adoption accelerate faster than expected, currently unlit capacity will need to be lit quickly, and additional investments might be pulled forward. Operators and consortia are therefore balancing caution with readiness, ensuring that plenty of headroom exists for the Americas while monitoring indicators like data center traffic and 5G uptake in the region’s emerging markets.
2.2.2. INTRA-ASIA (WITHIN ASIA REGIONAL ROUTES)
Capacity Growth: The Intra-Asia routes (connecting major Asian hubs and emerging markets within Asia) have seen moderate but steady expansion in design capacity, punctuated by large jumps when new systems come online. In 2020, total design capacity on key intra-Asian connections was around 708 Tbps (with only ~77.5 Tbps lit). By 2024, total capacity reached approximately 1,200 Tbps, with lit capacity about 145.7 Tbps. This represents substantial growth in available bandwidth, although lit usage remains a small fraction (barely 12% of design capacity in 2024). The year 2025 is a watershed for Intra-Asia capacity: multiple high-capacity consortium cables launched or are coming online. Notably, the Apricot cable (a 12,000 km intra-Asia system led by Meta and Google) launched in late 2024 with an initial design capacity over 190 Tbps and the MIST cable (connecting Southeast Asia to India) was commissioned by 2025 with 200+ Tbps design capacity (Grey, 2025).
These, along with other new links (e.g., Asia Direct Cable and regional extensions of 2Africa in the Indian Ocean), boost intra-Asian design capacity to an estimated ~1,600 Tbps in 2025. Lit capacity is also rising but more gradually – expected to exceed ~180 Tbps by 2025, as new routes begin carrying traffic. By 2026, with additional systems (such as the long-delayed SJC2 cable potentially coming into service at ~144 Tbps and other planned upgrades), total design capacity could approach ~1,800 Tbps, while lit capacity might reach ~250 Tbps, assuming demand catches up to some of the newly added headroom.
Utilization and Drivers: Intra-Asia routes stand out for their low utilization relative to other regions. As of 2024, only about 12% of available capacity is lit – a reflection of significant capacity oversupply designed
into Asian systems and the nascent stage of demand in some markets. This route’s lit capacity Compound Annual Growth Rate (CAGR) plunged from 36% in 2021 to roughly 7% in 2024, indicating that after a burst of early growth, usage has leveled off even as new cables were added. The nature of intra-Asia infrastructure development is often irregular, with big jumps when major cables are completed and quieter periods in between. In 2024–2025, we are in one of those jump phases: demand for connectivity within Asia is climbing, driven by booming internet use and cloud adoption in countries like India, Indonesia, Vietnam, and the Philippines.
The rise of local data centers and cloud regions in South and Southeast Asia is spurring more intra-regional traffic (e.g., content delivery networks serving video and social media locally), which in turn lights up more capacity. Even so, intra-Asian lit capacity remains a small fraction of what’s installed. This suggests a huge buffer of unlit fiber – in 2024 the average lit capacity on Asian routes was only ~61% of design globally, and far lower in Asia specifically. Such a buffer can be positive, ensuring ample room for growth, but it also reflects that many Asian links (especially those involving smaller economies) are underutilized.
Regional Considerations: Several factors contribute to Asia’s capacity imbalance. First, hyperscaler investments in Asia are often forward-looking – companies like Google, Meta, and regional telecom consortia have built extremely robust cables (e.g., Apricot’s 190 Tbps, MIST’s 216 Tbps) anticipating future needs (NTT Data, 2025). Many of these systems came online only recently, so operators are in the early stages of lighting fiber pairs as traffic grows. Second, traffic patterns in Asia historically skewed toward Transpacific routes, since a large portion of Asian internet content was hosted in North America. That is gradually changing: with more content caching and cloud infrastructure within Asia, east-west intra-Asia traffic (e.g., between data hubs like Singapore, Hong Kong, Tokyo, Mumbai) is rising.
The region’s diversity is also a factor – regulatory and geopolitical issues can delay projects and constrain utilization. For example, geopolitical tensions (such as US–China tech frictions) have impacted intra-Asia cables – one consortium cable (SJC2) was delayed due to concerns about Chinese participation (Huston, 2022), and alternative routes avoiding the South China Sea are being pursued. Regulatory approval processes in various countries can be slow, affecting when capacity actually becomes available for use. Despite these challenges, the outlook for intra-Asia capacity is optimistic. Cloud and 5G adoption are accelerating in populous markets, ensuring that lit capacity will continue to grow steadily. Projections show lit capacity potentially reaching ~200 Tbps by 2028, implying a solid upward trajectory. Key to realizing this will be fully leveraging new technologies – the latest cables in Asia employ higher fiber counts and advanced optical tech (e.g., wavelength selective switches and space-division multiplexing) to maximize throughput. The implication for planning is that Asia’s network has plenty of headroom, but operators must focus on driving utilization – through initiatives like lowering bandwidth costs, improving regional connectivity (more landing stations and terrestrial backhaul), and ensuring political support for cross-border data exchange. In the near term, Asia’s lit vs. total gap signifies a buyers’ market for bandwidth, with infrastructure ready and waiting for the region’s continuing digital boom.
2.2.3. TRANSATLANTIC (NORTH AMERICA–EUROPE ROUTE)
Capacity Growth: The Transatlantic route – historically the busiest subsea corridor – has experienced
explosive capacity growth over the past few years, fueled by new generation cables. Between 2018 and 2022, several ultra-high-capacity systems (e.g., Dunant, Marea, Grace Hopper, Amitié) came online, and the trend continues. As of 2024, total design capacity on the North Atlantic route reached 2,278.6 Tbps, with lit capacity around 1,571.0 Tbps. This marked a significant year-over-year increase, as just two new 2022 cables (Grace Hopper and Amitié) had boosted Transatlantic capacity by 70% in that year alone (Hamilton, 2024). The growth persisted into 2024–2025: for example, Meta’s Anjana cable, a 24-fiber-pair system with 480 Tbps design capacity, became operational in 2024 (Hardy, 2023), further raising the Atlantic’s ceiling.
By early 2025, total Transatlantic design capacity is estimated to have exceeded ~2,700 Tbps, an increase of roughly 20% over 2024, while lit traffic rose commensurately to about ~1,700 Tbps. Looking ahead to 2026, additional projects are in the pipeline (e.g., the planned Nuvem cable from South Carolina to Portugal in 2026). With these, the Transatlantic route is projected to approach 3,000 Tbps of design capacity by 2026, and lit capacity is expected to climb toward ~1,900–2,000 Tbps, assuming current demand trends hold.
Utilization and Drivers: The Transatlantic route in 2024 had roughly 69% of its capacity lit (1.57 Pbps lit vs 2.28 Pbps total), reflecting both strong demand and the ongoing presence of unused headroom. Notably, lit capacity growth on this route has begun to moderate in percentage terms – the lit capacity CAGR peaked at ~59% in 2021 (when huge amounts of new bandwidth were activated) and has since slowed to about 9% as of 2024. This deceleration signals a maturing phase: after the early 2020s “boom” where content providers lit fibers at breakneck speed to meet surging video and cloud traffic, the rate of expansion is stabilizing. However, even a high-single-digit annual growth on such a massive base translates to enormous absolute capacity increments.
The drivers of Transatlantic demand remain very robust. The U.S.–Europe data corridor carries huge volumes of cloud computing, enterprise data replication, and internet content delivery. Hyperscalers continue to dominate this route – companies like Microsoft, Google, Meta, and Amazon are not only major users but also investors in the cable systems. Cloud services growth (enterprise migration to cloud, AI workloads, etc.) and the proliferation of bandwidth-heavy applications (high-definition streaming, augmented reality, etc.) are pushing up utilization steadily. Additionally, 5G networks and edge computing in both North America and Europe are elevating the need for low-latency, high-capacity links across the Atlantic to connect distributed data centers.
Regional Considerations: The Transatlantic segment benefits from a relatively stable geopolitical and economic context compared to other routes. There is healthy competition and diversity – currently around 17 subsea cables connect North America and Europe (Hamilton, 2024), landing in multiple countries (U.S., UK, France, Spain, Portugal, etc.). This redundancy and competition have kept prices in check and encouraged continuous upgrades. One emerging factor is security and geopolitical strategy: European policymakers have grown cognizant of the importance of subsea cables and the need for resilience. Recent concerns about potential sabotage (e.g., incidents in the North Sea) have led to increased security measures on critical Atlantic cables (Inskit Group, 2025).
There is also a push for additional diverse routes – for instance, routes that land in the Iberian Peninsula or
Nordics rather than the traditional UK landing, to distribute risk and support new data hub locations (Portugal’s upcoming Nuvem cable is an example, aiming to create a direct SC–Portugal link). Despite these developments, the main story is technology: the Transatlantic route is at the forefront of new cable tech adoption. Many cables here feature 12 to 24 fiber pairs and have been early adopters of 400 Gbps wavelength technology, with trials of 800 Gbps wavelengths successfully conducted in 2024 (Cisco, 2024). The Amitié cable, for instance, demonstrated 800 Gbps channels across 6,200 km, showcasing that next-gen coherent optics can nearly double per-channel throughput on transoceanic spans (Cisco, 2024). These advancements mean operators can light additional capacity on existing fibers, boosting lit capacity without new cable lay. Infrastructure planning for the Atlantic is now focused on incremental upgrades and selective new builds.
Given the slight cooling in CAGR, there is a cautious approach to avoid overcapacity; yet stakeholders are mindful that any demand surprise (e.g., a spike from AI or metaverse applications) could rapidly consume the reserve. The consensus is to proceed with continued investments (there are still several cables in development or recently completed) while maintaining vigilance on utilization rates. Overall, the Transatlantic corridor remains highly utilized and critical, and the industry is aligning capacity expansion to closely match the sustained, if no longer exponential, growth in traffic.
2.2.4. TRANSPACIFIC (NORTH AMERICA–ASIA ROUTE)
Capacity Growth: The Transpacific route linking East Asia (Japan, East/Southeast Asia, Australia) with North America is witnessing exceptional capacity expansion, rivaling the Atlantic in scale. In 2020, Transpacific design capacity was about 589.3 Tbps, with 464.6 Tbps lit. By 2024, total capacity had soared to 1,485.3 Tbps and lit capacity to 902.8 Tbps, reflecting massive investments in new systems. The period from 2021 to 2024 saw multiple hyperscaler-led cables completed, including JUPITER (Japan-U.S.), PLC segments, and others, which tripled Pacific capacity. Notably, the CAGR for lit capacity fell from an astounding 78% in 2020 to about 12% in 2024 as the initial boom moderated.
However, growth is picking up again with a new wave of cables in 2024–2025. By the end of 2025, at least four major Transpacific systems will have been recently RFS: JUNO (Japan-U.S., 20 fiber pairs, 350 Tbps, RFS 2024), Bifrost (Singapore-Indonesia-U.S., 260 Tbps (Keppel, 2025), RFS 2024/25), Echo (Indonesia-U.S., ~144 Tbps (Huston, 2022), first segments in service 2023–24), and Southern Cross NEXT (U.S.-Australia via Pacific Islands, 72 Tbps, RFS 2022). These have catapulted total Transpacific design capacity to an estimated ~1,900 Tbps in 2025, a ~28% jump from 2024. Lit capacity is also rising fast – likely exceeding 1,100 Tbps in 2025 as the hyperscalers begin utilizing these new routes for Asia-Pacific traffic. By 2026, with further additions (such as the planned CAP-1 cable to the Philippines and other expansions to Oceania), Transpacific design capacity is forecast to reach ~2,200 Tbps or more, while lit capacity could be in the ballpark of ~1,300–1,400 Tbps.
Utilization and Drivers: In 2024, about 61% of Transpacific capacity was lit – a substantial utilization level, but slightly lower than the Atlantic’s, indicating a bit more spare capacity in the Pacific. The Pacific route, however, is now catching up quickly in absolute terms; lit traffic (903 Tbps in 2024) is only about 10% lower than the Atlantic’s despite a later start in hyperscaler build-out. Drivers on this route are powerful: North
America-Asia internet and cloud traffic continues to grow exponentially, fueled by Asia’s large user base and digital economy expansion. The Pacific has seen the world’s largest new cables by fiber count because U.S. tech giants and Asian telecoms anticipate enormous demand. Hyperscalers like Google, Meta, Microsoft, and Amazon are heavily invested – for instance, Google and Meta’s Apricot cable (190+ Tbps) adds intra-Asia capacity that ultimately connects into U.S. routes, and Meta’s planned ORCA cable will link the U.S. and SE Asia in the coming years.
Cloud computing is a major factor: as companies in Asia adopt cloud services, cross-Pacific data flows to U.S. cloud regions surge. Similarly, media and entertainment (e.g., video streaming, gaming) and emerging applications (like AI data exchange, which often involves U.S.-Asian data center interactions) drive demand. The Transpacific route is also critical for connecting data center hubs (Silicon Valley, Tokyo, Singapore, Sydney, etc.), so enterprise network needs and financial trading routes contribute to continuous growth.
Regional Considerations: The Transpacific theater is not without challenges. Perhaps the biggest is geopolitical tension affecting cable routes. Over the past few years, U.S. authorities have blocked or scrutinized cables with direct China or Hong Kong connections, citing security concerns. This led to the cancellation or rerouting of some high-profile projects (e.g., the PLCN cable was reconfigured to avoid Hong Kong). As a result, new Pacific cables increasingly land in allied territories (Japan, Taiwan, Philippines) or use diverse paths through Southeast Asia, sometimes at the expense of direct U.S.-China connectivity. This geopolitical filtering has somewhat constrained route choices, but traffic demand has simply shifted to alternative paths (for example, more cables landing in Taiwan or Japan and then reaching China via terrestrial networks). Another consideration is natural disaster risk: the Pacific “Ring of Fire” region is prone to earthquakes (Japan, Taiwan) that can break cables, so operators have been adding redundant routes via the south Pacific and designing cables with more resiliency. In terms of utilization, the Transpacific route still has a healthy buffer – the influx of new cables means lit % may temporarily dip as of 2025 (with so much fresh capacity coming online).
But industry projections show lit usage climbing steadily thereafter; one estimate foresees Pacific lit capacity reaching 1.5–1.8 Pbps by 2028, reflecting strong demand growth. Infrastructure planning here is focused on staying ahead of an exceptionally dynamic demand curve. Stakeholders are keenly aware that Asia’s internet growth outpaces that of more mature regions, necessitating continuous investments. The pipeline of planned cables through 2027 (e.g., Hawaiki Nui connecting NZ–US, Unity-2/JUNO which achieved 350 Tbps, and others) suggests the Pacific will likely equal or surpass the Atlantic in raw capacity within a few years. Fortunately, technological advancements are keeping pace: many Transpacific systems now deploy high fiber-pair counts (12, 16, even 20) and advanced Space Division Multiplexing to maximize total capacity (Keppel, 2025). Trials of 1.3 Tbps per wavelength have even been conducted on Pacific cable segments (Qiu, 2024), hinting at future upgrades where existing cables can carry far more traffic through better modulation.
All these developments ensure that, while utilization is rising, so too is the capability to scale. The key implication is that the Pacific route’s strategic importance is ever-growing – it is the conduit for communication between the world’s largest economies – and thus it is being fortified with both sheer capacity and improved resilience (Keppel, 2025). To avoid future capacity crunches, consortiums and companies will continue to build and upgrade aggressively, mindful that any slowdown could leave the region under-provisioned given Asia’s appetite for bandwidth.
2.2.5. KEY TECHNOLOGY AND PLANNING CONSIDERATIONS
Across these regions, a common theme has emerged over the past years. Hyperscaler investments have fundamentally reshaped the submarine cable industry – today’s largest cables are often financed or wholly owned by content and cloud providers, and they boast unprecedented scale. For example, a single modern cable can offer on the order of 300–500 Tbps (as seen with Grace Hopper at 340 Tbps and Anjana at 480 Tbps) (Poutonnet, 2020), (Hardy, 2023), far outstripping earlier-generation systems. These enormous design capacities are achieved through high fiber-pair counts (12, 16, 24 pairs vs. the traditional 4 or 8) and
advances in optical transmission technology. The move from 100 Gbps wavelengths a few years ago to 400 Gbps channels is now mainstream on new cables, and the industry is already trialing 800 Gbps waves on live systems (Cisco, 2024). Vendors like Ciena, Infinera, Nokia and Cisco (Acacia) have demonstrated that even transoceanic distances can support 800 Gbps per wavelength with new modulation techniques and signal processing (Cisco, 2024). This means that lit capacity can increase not only by laying new cables but also by upgrading the equipment on existing fibers – a strategy that many operators will use to incrementally boost lit capacity (e.g., upgrading older Atlantic cables with next-gen optics effectively raises their lit throughput without changing the design capacity).
Another key development is the use of Space Division Multiplexing (SDM) design. SDM cables spread the undersea repeater power across more fiber pairs, which slightly lowers the per-fiber capacity but greatly increases total system capacity. The Atlantic’s Amitié cable and others employ SDM with 16 pairs, allowing for record overall throughput (Cisco, 2024). This reflects a shift in design philosophy: rather than pushing each wavelength to the absolute maximum bit-rate, operators add more parallel fibers to achieve higher aggregate capacity with better resiliency. Additionally, technologies like reconfigurable optical add/drop multiplexers (ROADMs) undersea are emerging (as in Apricot) to create more flexible networking under the ocean, enabling dynamic traffic routing and easier upgrades.
Market drivers continue to be cloud and content usage. The rise of AI and machine learning workloads is one new factor on the horizon – training AI models often involves replicating large datasets globally, and tech companies are interconnecting their data centers across oceans with ever-fatter pipes. Likewise, data center expansion in second-tier markets (e.g., new hubs in Africa, Latin America, Southeast Asia) is creating fresh regional routes that complement the big transoceanic links. 5G adoption indirectly fuels submarine cable demand by multiplying mobile data traffic (much of which ultimately traverses international links for cloud services or content). For instance, as 5G rolls out in South Asia and Latin America, more consumers access high-bandwidth applications, driving up international IP transit.
“Submarine cables carry well above 99% of the world’s information usage and now serve as vital HVDC power interconnectors; increased interest by hostile actors has led to incidents of damage, prompting NATO and industry to develop AI powered monitoring programmes.”
Derek Cassidy – Irish Communications Research Group (STF Issue 141)
Regional disparities, however, mean that not all capacity is utilized equally. The data shows mature routes (Transatlantic, Transpacific) have lit well over half of their available capacity, whereas routes involving emerging markets (Intra-Asia, some Americas segments) have large portions of unlit capacity remaining. Economic and regulatory barriers contribute to this: places with less developed internet ecosystems take longer to generate the traffic that fills a modern cable, and regulatory issues (like licensing and landing permits or protectionist policies) can slow down both cable deployment and usage. Geopolitical issues –from concerns over espionage to actual cable sabotage risks – overlay additional complexity. For instance, heightened geopolitical tensions have led to calls for more route redundancy to avoid single points of failure in politically sensitive areas (Inskit Group, 2025). This has planning implications: cable consortia are now more carefully considering route diversity (e.g., avoiding certain choke points or exclusive economic zones) and building in security and resilience measures.
Utilization trends overall indicate that, despite the huge growth in design capacity, the industry has managed to keep lit capacity growing in tandem with demand. Recent data collection improvements (such as more comprehensive FCC reporting on U.S.-connected cables) show that on average lit capacity is around 60% of total design capacity globally as of 2024. This is a much higher utilization ratio than observed in the mid-2010s (when it was closer to ~18% on major routes) – signaling that global bandwidth demand is indeed catching up with the massive supply that’s been deployed. It also suggests a more efficient use of infrastructure: operators are not simply laying dark fiber strands undersea; they are actively lighting
them to carry traffic for cloud, streaming, and enterprise needs. From a planning perspective, this trend underscores the importance of accurate demand forecasting. Cable systems take years to plan and build, and their lifespan is 20-25 years, so anticipating traffic growth is critical. Thus far, hyperscalers have been very adept at forecasting and have often led the push to add capacity just as it’s needed (sometimes a bit before, to ensure a cushion) (Wong, 2022)
The slight slowdown in lit capacity growth rates on the busiest routes is not an indication of slackening demand, but rather a sign that supply and demand are reaching a new equilibrium. Going forward, industry players will aim to avoid both excess and shortfall: too much excess capacity can strain project economics, while any capacity shortfall would cause congestion and higher costs.
In summary, the period up to 2025 has been marked by record deployments and the successful scaling of lit capacity across all major submarine corridors. The outlook for 2026 remains one of continued expansion, but at a more measured pace in some regions, combined with targeted technology upgrades. Hyperscaler investment, cloud and 5G-driven demand, and ongoing geopolitical considerations will all shape the next phase of submarine cable development. Each region has its unique context – the Americas balancing growth with utilization, Asia unlocking its vast potential, and the transoceanic routes fortifying their position as the backbone of the global internet. The industry’s proactive approach in recent years – building big, lighting what is needed, and innovating constantly – positions it well to meet the future bandwidth needs of our interconnected world. The challenge ahead will be to maintain this balance, ensuring infrastructure readiness for whatever new digital revolutions the coming years may bring, without losing sight of efficiency and resilience in global network planning.
2.3. CAPACITY PRICING
Insights from SubTel Forum Magazine
Over the past year the submarine cable sector has seen dramatic changes in how fiber pair capacity is priced. The price of subsea capacity is not set in a vacuum; it reflects a complex interplay of supply and demand, financing structures, technological innovation and market dynamics. As new cables have gone live, old systems have been refinanced, and contract models have evolved, capacity pricing has responded. This discussion synthesizes the past year’s reporting to explain how pricing varied across regions and what forces shaped those trends.
2.3.1. MARKET CONCENTRATION AND UNDERSERVED REGIONS
In “Under‑Served, Not Un‑Deserved” (Issue 142) Anup Gupta argues that large telecommunications carriers and cable builders target only the highest traffic routes, leaving many regions with little incentive to build new infrastructure. He highlights a “chicken and egg” dilemma: cable investors require local telecom operators to commit to anchor tenancies before financing a project, but those operators cannot commit without a reliable external cable connection. In practice, this leads to a small group of hyperscalers and Tier 1 carriers dictating where capacity is deployed, creating underserved markets where the scarcity of fibers keeps prices high. Capacity pricing on routes into developing regions such as the South Pacific or parts of Africa remains elevated because the limited supply must amortize the high capital cost over fewer paying customers. Socially equitable connectivity cannot rely on market forces alone; government backed anchors or consortium models are often needed to break the impasse.
2.3.2. SUPPLY GROWTH AND ECONOMIES OF SCALE
Global submarine networks span more than 1.5 million km of cable and deliver 2 500–3 000 Tbps of total capacity—a twenty fold increase since 2015. Innovations such as space division multiplexing (SDM) and multi core fiber (MCF) allow cables to transmit more than 250 Tbps per fiber pair. Rapid capacity growth creates economies of scale: the cost per bit plummets as more fibers are lit and transponders become more efficient. In competitive regions like the Transpacific, total capacity is projected to reach 1 468 Tbps in 2024, but the compound annual growth rate (CAGR) of lit capacity has slowed from 78% to 12% as networks become saturated. Such decelerating demand growth typically exerts downward pressure on prices. When supply grows faster than demand, operators must price capacity competitively to ensure fill rates. This dynamic partly explains why bandwidth between New York and London costs far less per gigabit than bandwidth between Lagos and São Paulo. Economies of scale and intense competition among hyperscalers have already pushed core route prices close to marginal cost, while remote routes remain expensive.
2.3.3. FINANCING MODELS AND CONTRACT STRUCTURES
Pricing is also influenced by the financial arrangements underpinning cable projects. A 2023 analysis by Costa Smith, Stuart Blythe and Jonathan Gordon notes that submarine systems have historically relied on front loaded revenue models. Capex is spent early during construction, and owners recoup their investment through a few large capacity sales once the system goes live. This approach benefits asset owners— allowing them to refinance expensive construction debt—and suits anchor customers who reserve fiber capacity with little cash outlay until the system is operational. However, as the market matures, the authors observe a shift away from fixed long term commitments toward shorter term or pay as you go contracts. For example, Crosslake Fiber now offers metered dark fiber where customers pay only for what they use. Shorter contracts allow carriers and content providers to track market pricing more accurately and reduce unused capacity, while owners benefit from a smoother and more predictable revenue stream. Flexible contracts could therefore compress prices further, because customers can switch providers or renegotiate more easily if market rates decline.
“The bigger buyers naturally seek to buy at the lowest possible price and are supported in their efforts to do so by being able to commit to significant ongoing new builds over many years.”
John Maguire - APTelecom (STF Issue 144)
Another financing theme is the entry of hyperscalers—Google, Amazon, Meta and Microsoft—who now invest in or own two thirds of new cables. Hyperscalers view cables not merely as revenue generators but as strategic infrastructure to support their cloud and platform businesses. Their deep pockets allow them to finance multi billion dollar systems without relying on external capital, and they often allocate capacity internally rather than selling to third parties. Consequently, the traditional capacity market shrinks, and price discovery becomes murkier. At the same time, hyperscalers’ investment drives supply growth and route diversity, which indirectly pressures wholesale prices lower. Smaller carriers and investors must adapt by offering niche services, latency optimized routes or flexible contracting to remain competitive.
2.3.4. REGIONAL DISPARITIES AND ROUTE DYNAMICS
Capacity pricing varies sharply by region. In underserved markets, limited supply and high capital risk keep rates high. Gupta notes that carriers often avoid remote islands because deploying cables requires infrastructure and anchor tenants. Without public funding or CSR initiatives, these markets may remain unconnected, relying on costly satellite or microwave backhaul.
At the opposite end, mature routes like the Transatlantic corridor set global pricing benchmarks. The New York–London link remains the most competitive, driven by intense financial demand and long-standing system competition. However, as hyperscalers build their own networks and exit wholesale markets, traditional carriers may struggle to justify new builds
In the Americas, pricing depends on the economic outlook of South American markets. While regional routes may never rival Transatlantic demand, countries such as Brazil, Argentina, and Chile are central to hyperscaler expansion. Investment there will decide whether prices drop with capacity or stay high due to limited demand and risk.
Across EMEA, existing links are “high latency and expensive to operate.” Proposed systems bypassing the Suez Canal or using polar paths could shorten and strengthen Europe-Asia routes, reducing prices. Failure to develop such options may keep costs high amid operational complexity.
In the Transpacific, hyperscaler-backed builds have intensified competition. STF data show falling lit-capacity CAGR, meaning supply now outpaces demand. Operators must compete on latency, resilience, or service guarantees rather than price.
The Indian Ocean and South Atlantic present mid-range cases. Angola Cables reports that 70% of Africa–US traffic now runs on its network, improving connectivity but limiting competition. In South America, the proposed Humboldt cable from Chile to New Zealand and Australia could add 144 Tbps, lowering costly bandwidth that currently detours via North America. Though expensive, such regional projects can reshape pricing through new east–west diversity.
2.3.5. MARKET INTERVENTIONS AND POLICY IMPLICATIONS
Governments and multilateral agencies increasingly recognize that market forces alone will not achieve equitable pricing. Public–private partnerships and development financing are being used to extend connectivity to remote regions. For example, the Pacific Connect Initiative that resurrected Chile’s Humboldt project involves governmental funding and the backing of a hyperscaler (Google). Such models can deliver capacity at affordable rates in low revenue markets by sharing risk and socializing returns. Policies that encourage open cable models—where independent fiber pairs are sold separately—also promote competition and flexibility in pricing. Moreover, regulatory frameworks that require non discriminatory access to landing stations and protect smaller carriers from anti competitive practices help keep prices in check.
The shift toward shorter term capacity contracts has policy implications as well. Regulators may need to adjust spectrum allocation, licensing and interconnection rules to ensure that pay as you go models do not lead to predatory pricing or lock in. A dynamic contracting environment could also increase volatility in capacity prices; however, it allows buyers to react more quickly to technological improvements and market changes, fostering innovation and efficient resource allocation.
2.3.6. OUTLOOK
Looking ahead to 2025–2026, several trends will shape capacity pricing. First, supply will continue to surge as hyperscalers, and consortia build new mega systems using SDM and MCF. The resulting increase in competitive routes should exert downward pressure on prices in core corridors. Second, financing models will become more flexible, with blended arrangements combining long term anchor commitments and short term pay as you go contracts. This will allow investors to secure baseline revenues while capturing upside from market fluctuations. Third, regional projects like Humboldt, Mediterranean Express and Africa–India corridors will gradually reduce price disparities, though remote islands may still require public subsidy. Fourth, operational innovations—self fleeting drum engines, autonomous survey vessels and AI powered cable monitoring—will lower build and maintenance costs, further reducing capacity pricing over time. Finally, greater transparency in pricing might emerge as data marketplaces and cloud providers simplify cross connect services, though hyperscalers’ dominance could also lead to proprietary ecosystems that obscure true costs.
2.3.7. CONCLUSION
Capacity pricing in the submarine cable industry is a product of technological progress, market structure, financing arrangements and policy choices. Recent STF Capacity Connection articles reveal that underserved markets remain trapped by a lack of anchor tenants, while hyperscaler dominated routes experience relentless price erosion. Innovations in cable technology and installation are driving costs down, but the benefits are unevenly distributed. Financing structures are evolving from front loaded revenue models to flexible, metered contracts, offering more options for buyers and potentially smoother revenue profiles for sellers. Policymakers and investors must work together to ensure that these developments translate into wider and more affordable connectivity, lest the digital divide persist despite an abundance of global capacity.
3. OWNERSHIP FINANCING ANALYSIS
3.1. HISTORIC FINANCING PERSPECTIVE
Financing trends within the submarine cable industry continue to provide valuable insights into how projects are being funded and advanced globally. Analyzing developments between 2015 and 2025 reveals both continuity and subtle shifts in the balance of financing strategies that underpin the growth of these networks.
Self-finance remains the predominant method of funding, accounting for the clear majority of systems and investment value. As shown in the first chart, the number of self-financed systems has grown consistently over the past decade, rising from just 1 system in 2015 to 72 in 2025. This steady trajectory underscores the ongoing preference among operators and consortia to retain direct control over projects and financing decisions. In terms of overall investment, self-financed systems represent nearly two-thirds of total funding during the 2015–2025 period, amounting to approximately $22.65 billion, or 63.88% of total global investment. This dominant share highlights both the financial strength of key players and the maturity of the industry, where many operators are now capable of independently funding large-scale infrastructure.
Figure 24: Financing Type of Systems, 2015-2025
Multilateral Development Bank (MDB) financing continues to play a significant role, particularly in supporting projects in emerging markets and regions where access to private capital may be constrained. The number of MDB-backed systems has grown gradually, reaching 14 systems by 2025, up from 2 in 2015. These projects collectively represent $7.42 billion, or just over 20.9% of total global investment. Although smaller in absolute terms compared to self-finance, MDB financing remains strategically important, enabling system deployments that might otherwise face funding barriers due to regional economic or political challenges. MDB participation also brings a level of stability and long-term support, particularly in regions where demand for connectivity continues to expand rapidly.
“After the dot-com crash, financing for submarine cable systems shifted dramatically: speculative consortium-driven projects gave way to investments led by content providers and hyperscalers, producing a more favourable investment climate and enabling new build activity.”
Chris van Zinnicq Bergmann - Consultant (STF Issue 123)
Figure 25: Investment Distribution of Systems, 2015-2025
Debt and equity financing has also shown consistent growth throughout the past decade, reflecting an increased reliance on collaborative funding models. By 2025, 22 systems were financed through debt/ equity structures, compared with only 2 in 2015. Total investment under this model now amounts to $5.39 billion, or 15.2% of global investment during the period. While this remains the smallest share of the three primary financing approaches, it demonstrates the gradual broadening of financial participation, where multiple stakeholders share both the risks and returns of major cable projects.
Comparing this year’s results to last year’s report, the overall distribution of financing remains consistent, with self-finance continuing to lead by a wide margin. Last year’s figures showed self-finance representing 63.77% of global investment, MDB financing at 20.15%, and debt/equity at 16.08%. The latest data shows
only slight adjustments in these proportions, with self-finance maintaining its majority share and MDB financing expanding incrementally in both system count and investment share. These shifts highlight the stability of financing strategies, with modest gains for MDBs and a marginal contraction in debt/equity proportions relative to last year.
The continued reliance on self-finance reflects the maturity of many operators and technology firms driving the industry, particularly those with sufficient resources to manage projects independently. At the same time, MDBs and debt/equity financing remain indispensable in enabling projects across diverse geographies, balancing the global financing landscape. As demand for connectivity persists, these complementary financing mechanisms will continue to shape the rollout of submarine cable infrastructure, ensuring that both well-capitalized markets and underserved regions can access the systems necessary for growth.
3.2. REGIONAL DISTRIBUTION OF FINANCING
3.2.1. MULTILATERAL DEVELOPMENT BANKS
MDBs remain a critical source of financing for submarine cable projects, particularly in regions where infrastructure gaps and geographic barriers make private or self-financing less feasible. Between 2015 and 2025, MDBs have invested approximately $11.17 billion into submarine cable systems worldwide, targeting areas with the greatest need for enhanced connectivity.
Figure 26: Distribution of MDB Investment, 2015-2025
The EMEA region is the largest recipient of MDB investment, accounting for $3.60 billion (32.19%) of total funds. This dominant share underscores the ongoing importance of MDB involvement in supporting both mature and emerging markets across the region. Funding in EMEA reflects the dual priorities of strengthening transcontinental connectivity and bridging persistent infrastructure gaps in underserved areas.
The Indian Ocean and AustralAsia regions follow closely behind, each receiving $2.72 billion (24.37%) in MDB investment. Together, these two regions account for nearly half of all MDB funding outside EMEA.
This distribution highlights the strategic importance of the wider Asia-Pacific and Indian Ocean basins, where rapid economic growth and expanding data demand are driving the need for new high-capacity systems. MDB support in these regions often provides essential stability for projects facing geographic, political, or environmental challenges that complicate financing through commercial means alone.
The Transpacific region has received $1.29 billion (11.54%) of MDB funding during the period. While representing a smaller share than EMEA or Asia-Pacific, this investment is notable as MDBs traditionally focused more on regional connectivity projects rather than long-haul, transoceanic systems. The growing allocation of MDB resources toward Transpacific reflects recognition of its central role in global data exchange and the need for resilient infrastructure connecting Asia and the Americas.
The Americas accounted for $0.54 billion (4.82%) of MDB funding, while the Transatlantic region received $0.30 billion (2.69%). These smaller allocations reflect the relatively mature state of connectivity infrastructure in these regions, where self-financing and private investment remain the dominant funding models. MDBs nevertheless continue to play a selective role, particularly in projects aimed at improving resilience, redundancy, or regional development objectives.
Compared with last year’s analysis, the distribution of MDB funding shows a gradual but clear rebalancing. EMEA continues to command the largest share, though its proportional weight has narrowed slightly as MDBs have diversified investments toward Asia-Pacific, the Indian Ocean, and the Transpacific. The Americas and Transatlantic regions have seen reduced proportional shares, consistent with their reliance on private or consortium-led financing.
Overall, MDB investment trends between 2015 and 2025 highlight a focus on regions where infrastructure needs are greatest and where external capital can act as a catalyst for system deployment. By concentrating resources in EMEA, Asia-Pacific, and the Indian Ocean, MDBs play an essential role in broadening global connectivity and ensuring that critical projects proceed even in environments where commercial financing alone may not suffice.
“Batam
is at a critical inflection point in Southeast Asia’s digital infrastructure; strategically located near Singapore, the island is attracting investments in new subsea cables and data center campuses and must develop carrier neutral dark fiber backbones, renewable energy PPAs and local talent to become a digital hub.”
Jessica
Halim – Independent writer (STF Issue 144)
3.2.2. DEBT/EQUITY FINANCING
Debt and Equity financing continues to serve as a vital mechanism for supporting submarine cable projects, especially those requiring substantial upfront capital. Between 2015 and 2025, the distribution of Debt/Equity-financed investment reflects the diverse regional priorities of the industry and the differing financial structures required to advance large-scale connectivity initiatives.
AustralAsia emerges as the leading recipient of Debt/Equity investment, accounting for $1.89 billion (30.77%) of the total. This reflects the region’s accelerating demand for both intra-regional and intercontinental systems, as well as the scale of projects that often require complex financing packages. Compared with last year’s analysis, where the Americas led this category, the shift toward AustralAsia highlights the growing importance of this region as a hub for international data flows.
The Transpacific region follows, attracting $1.48 billion (24.08%) of Debt/Equity investment. This significant share underscores the high costs associated with building and maintaining long-haul, transoceanic cables that span vast distances and require extensive technical and financial collaboration. Relative to last year, Transpacific’s share has expanded, reinforcing its role as a priority corridor for investment in resilient and scalable infrastructure.
The Transatlantic region accounts for $0.82 billion (13.34%), a smaller but still substantial portion of global Debt/Equity investment. While this represents a slight decline compared to earlier years, the region remains strategically important given the ongoing demand for Transatlantic capacity and the continual need to modernize infrastructure linking North America and Europe.
Figure 27: Distribution of Debt/Equity Financed Investment, 2015-2025
The Indian Ocean region has seen $0.79 billion (12.86%) in investment, a marked increase compared with historical figures where the region attracted limited Debt/Equity financing. This rise reflects the region’s growing recognition as a vital connectivity corridor, where financing support is needed to overcome geographic challenges and accelerate digital growth in emerging markets.
The Americas account for $0.56 billion (9.06%), reflecting a sharp decline from the previous period when the region was the leading recipient of Debt/Equity financing. The decline underscores the region’s increasing reliance on self-finance and consortium-backed funding, as many markets within the Americas have reached greater maturity and rely less on external debt structures. Nevertheless, Debt/Equity financing remains relevant for particularly large or complex projects in the region.
The EMEA region has drawn $0.55 billion (8.91%) in Debt/Equity financing. While modest compared to AustralAsia and the Transpacific, this investment indicates continued reliance on external financing for select projects, particularly in areas where private or consortium-led self-financing remains less prevalent.
Finally, the Polar region accounts for a very small share of global Debt/Equity-financed investment at $0.06 billion (0.98%). While limited, this figure demonstrates some interest in developing infrastructure in extreme environments, though such projects remain challenging due to high costs, technical difficulties, and uncertain commercial returns.
Taken together, the distribution of Debt/Equity financing from 2015 to 2025 reflects a clear reorientation of capital toward regions with rapidly expanding connectivity needs, particularly AustralAsia and the Transpacific. At the same time, mature regions such as the Americas and EMEA are increasingly turning to self-financing or alternative funding models. Despite these shifts, Debt/Equity financing continues to play a critical role in enabling large-scale, capital-intensive projects that form the backbone of the global submarine cable network.
3.2.3. SELF-FINANCED
Self-financing remains the dominant method for funding submarine cable systems, accounting for the largest share of investment between 2015 and 2025. This approach continues to shape the industry by giving system owners greater control over project development and execution, while reducing reliance on external financial institutions.
Figure 28: Distribution of Self-Financed Investment, 2015-2025
The Transpacific region leads in self-financed investment, totaling $5.66 billion (20.75%). This reflects the extremely high costs of building long-haul transoceanic systems, where system owners often prefer to fund projects independently to maintain strategic control.
Closely behind, the EMEA region captures $5.55 billion (20.34%), underscoring its continued role as one of the largest recipients of self-financed funding. The diversity of markets within EMEA — spanning established hubs and underserved regions — has driven the sustained need for direct investment.
The Indian Ocean follows with $4.34 billion (15.88%), highlighting the growing importance of multi-country, multi-stakeholder cables in this region. These systems, often comparable to utility infrastructure, are critical for improving connectivity and are largely advanced through self-financed commitments.
The Americas account for $4.27 billion (15.65%), reflecting steady engagement in self-financed projects across the region. While many large-scale cables are backed by Hyperscalers or private consortia, self-financing continues to play a role in regional and niche connectivity systems.
AustralAsia represents $3.70 billion (13.56%), showing that despite government-backed initiatives and consortium projects, a significant portion of systems in this region remain directly funded by owners, particularly where connectivity across vast geographies is essential.
The Transatlantic region makes up $3.64 billion (13.33%). Here, major Hyperscalers have been central in driving self-financed deployments to meet surging data transmission demand between North America and Europe.
Finally, Polar systems account for the smallest share, at $0.14 billion (0.49%), reflecting the ongoing chal-
lenges and limited commercial incentives in this frontier region.
Overall, these trends underscore the continued dominance of self-financing as the primary approach for submarine cable development. While regional distributions differ, self-financing provides owners with autonomy and flexibility to pursue strategic objectives, especially in high-cost or high-priority routes.
3.3. CURRENT FINANCING
Between 2015 and 2025, submarine cable system investment has followed a cyclical, but upward, trajectory characterized by alternating periods of expansion and contraction. In 2015, total investment reached a low of $0.8 billion, but the industry quickly rebounded, with funding levels rising to $3.2 billion in 2016 and $4.1 billion in 2017. This early recovery period reflected a wave of projects targeting both established transoceanic corridors and emerging regional routes. By 2018, $3.8 billion was invested, maintaining momentum before a moderate decline to $2.5 billion in 2019. The early 2020s saw continued fluctuation, with $3.3 billion invested in 2020 and $3.9 billion in 2021. A significant inflection occurred in 2022, when investment spiked to $6.2 billion, the highest level of the decade to date. Although funding temporarily slowed in 2023, at $3.5 billion, it increased again to $4.2 billion in 2024. Projections for 2025 anticipate a dramatic peak of $9.7 billion, signaling a new cycle of large-scale deployment and system upgrades.
Figure 29: System Investment, 2015-2025
System deployment trends parallel these investment cycles, with kilometers installed rising and falling in
response to financial flows. In 2015, 17,000 kilometers of cable were deployed, followed by sharp increases to 63,000 kilometers in 2016 and 83,000 kilometers in 2017. Deployment remained elevated in 2018 at 77,000 kilometers before falling to 33,000 kilometers in 2019. This contraction coincided with reduced investment that year. By 2020, deployment had recovered modestly to 44,000 kilometers, rising further to 52,000 kilometers in 2021. In 2022, deployment surged to 82,000 kilometers, reflecting alignment with that year’s investment spike. A temporary decline occurred in 2023, at 46,000 kilometers, before projections for 2024 and 2025 indicate major increases to 89,000 kilometers and 129,000 kilometers, respectively. The 2025 projection not only represents the largest deployment of the decade but also suggests the completion of several multi-regional and high-capacity systems.
When compared to earlier investment cycles, the current decade reflects both higher peaks and shorter troughs. In the early 2010s, investment cycles tended to span longer intervals, with extended periods of moderate growth followed by sharp rises tied to specific high-capacity projects. By contrast, the 2020s show greater volatility but also a higher baseline, suggesting that submarine cables are increasingly treated as recurring infrastructure needs rather than one-off capital expenditures. Deployment levels similarly demonstrate improved resilience: even in lower-investment years, average annual installations remain above those seen in prior cycles, indicating broader geographic diversification and steady regional demand.
“The world’s largest cloud providers, or hyperscalers, are accelerating a global infrastructure build-out to meet surging demand for resilient, low-latency services… Meta’s $10 billion Project Waterworth, a 50 000 km submarine cable linking five continents and reaching depths of 7 000m, is a key example.”
Martin Reilly – Independent writer (STF Issue 144)
Regional distribution of investment between 2021 and 2025 highlights these shifts in global priorities. EMEA accounts for the largest share, with $9.59 billion or 27.42% of total funding. This growth is linked to several landmark projects,
Figure 30: System Deployment by Year, 2015-2025
including 2Africa and Equiano, which together span multiple continents and represent a substantial expansion in African connectivity. The scale of these investments underscores EMEA’s emergence as both a transit and destination hub for global connectivity.
The Transpacific region follows with $6.97 billion (19.91%), reflecting the ongoing importance of long-haul cables connecting Asia and North America. These investments demonstrate sustained demand across one of the most competitive routes, where capacity requirements are among the highest globally. The Indian Ocean ranks closely behind, with $6.52 billion (18.65%) of investment. This is notable given the region’s limited historical role in global financing patterns. The rise in funding reflects the growing importance of multi-regional projects that link Asia, Africa, and the Middle East.
AustralAsia accounts for $5.78 billion (16.52%), highlighting continued investment across a geographically diverse region requiring extensive undersea infrastructure. Despite representing a slightly smaller share compared to previous cycles, the region remains a critical driver of new builds due to the need to connect widely dispersed markets. The Americas, by contrast, have seen a relative decline in share, capturing $3.23 billion (9.22%). This reduced proportion reflects the maturity of the market and a shift toward self-financing, particularly for systems backed by hyperscale operators.
The Transatlantic region, once a dominant focus of industry investment, represents $2.76 billion (7.89%), reflecting both its maturity and the role of upgrades to existing systems rather than new large-scale deployments. Finally, the Polar region, with $0.14 billion (0.39%), continues to represent the smallest portion of funding. While limited, this investment reflects exploratory interest in Arctic and polar connectivity routes, though such systems remain constrained by environmental and logistical challenges.
A broader comparison of investment and deployment reveals shifts in efficiency as well. In earlier years, investment volumes closely mirrored deployment kilometers, but more recent data suggest rising costs per kilometer, particularly for multi-regional and high-capacity systems. This trend highlights both the increasing technical complexity of new projects and the strategic importance of developing cables capable of supporting long-term demand growth.
In summary, the period from 2015 to 2025 illustrates a financing landscape defined by cyclical peaks,
Figure 31: Regional Investment in Submarine Cable Systems, 2021-2025
geographic shifts, and growing technical ambition. The resilience of investment cycles, alongside expanding deployment volumes, underscores the submarine cable industry’s critical role in global connectivity. With EMEA, the Transpacific, and the Indian Ocean regions capturing the majority of current investment, financing patterns reflect both immediate demand and long-term strategic positioning. The anticipated surge in 2025 marks a continuation of this trend, setting the stage for the next decade of submarine cable development.
4. SUPPLIER ANALYSIS
4.1. SYSTEM SUPPLIERS
4.1.1. CURRENT SYSTEMS
Supplier activity remains one of the defining factors shaping the pace and scope of global submarine cable deployments. Between 2021 and 2025, ASN (Alcatel Submarine Networks) continues to dominate the industry, delivering 23 systems during this period. SubCom follows with 9 systems, while NEC contributed 8 systems. HMN Technologies Co., Ltd. (Hengtong) and Prysmian Group/NSW each supplied 6 systems, positioning them as mid-tier but notable players in the supply chain. Smaller contributors included Elettra, Hexatronic, Nexans, and Xtera with 2 systems each, while Orient Link Pte. Ltd. (OLL) delivered 1 system.
Figure 32: Number of Systems by Supplier, 2021-2025
Compared to the previous reporting period (2020–2024), the supplier landscape shows signs of both continuity and change. ASN has maintained its commanding lead, maintaining 23 systems year-over-year, reinforcing its critical role in supporting major global routes. However, SubCom’s number fell from 13 to 9 systems, suggesting either a temporary lull in deployments or increased competition from other suppliers.
NEC remains consistent, though slightly lower than its earlier 10-system contribution. Meanwhile, HMN Technologies and Prysmian have increased their output compared to the last cycle, signaling a stronger foothold in the market.
This rebalancing of supplier activity underscores the industry’s competitive dynamics. While ASN, SubCom, and NEC continue to hold the lion’s share of deployments, the rising prominence of Chinese and European manufacturers such as HMN and Prysmian illustrates growing diversification of global supply options.
In terms of kilometers of submarine cable produced, ASN once again leads by a significant margin, producing 174,470 kilometers of cable from 2021 to 2025. SubCom produced 73,810 kilometers, while NEC contributed 66,460 kilometers. Notably, Elettra produced nearly as much as NEC with 65,770 kilometers, despite delivering only two systems, reflecting its involvement in large-scale or long-distance projects. HMN Technologies added 39,540 kilometers, while smaller but still active contributors such as OLL (8,100 kilometers), Xtera (7,710 kilometers), Prysmian Group/NSW (5,860 kilometers), and Nexans (4,320 kilometers) rounded out the supplier landscape. Hexatronic contributed just 350 kilometers, signaling its continued focus on niche or regional projects.
When compared to the previous cycle, ASN’s production capacity has grown dramatically from 131,470 kilometers in 2020–2024 to 174,470 kilometers in this reporting period, a clear indicator of its unmatched ability to manage the world’s largest projects. SubCom’s output, by contrast, dropped significantly from over 92,000 kilometers to 73,810 kilometers, while NEC increased slightly from 58,950 to 66,460 kilometers. The sharp rise of Elettra into the top tier of producers demonstrates that even smaller system counts can yield significant cable output when focused on very large projects.
The results highlight several key dynamics shaping the supplier market:
1. Concentration of Capacity in Top Players – ASN, SubCom, and NEC continue to dominate both systems and kilometers delivered, accounting for the bulk of global capacity.
2. Rising Mid-Tier Players – HMN and Prysmian’s increased output signals ongoing diversification, with new suppliers gaining market share and competing for major projects.
3. Outsized Contributions by Small Suppliers – Elettra’s strong cable production illustrates how
Figure 33: KMS of Cable Produced by Supplier, 2021-2025
smaller suppliers can still play an outsized role in delivering specialized or large-distance routes.
4. Shifts in Regional Competition – Chinese suppliers like HMN are gaining ground, while European suppliers such as Prysmian are leveraging their experience in subsea infrastructure to expand into telecom cable markets.
ASN and SubCom’s continued dominance also reflects their ability to diversify portfolios. Both have expanded into sectors such as offshore energy and wind power cabling, which reinforces their production scale and financial resilience. NEC, while slightly behind in absolute output, remains competitive by leveraging its technological expertise and strategic ties to Japanese and regional projects.
Looking ahead, system suppliers will continue to play a critical role in enabling the next generation of submarine cables, particularly on long-haul Transpacific and Transatlantic routes as well as Asia–Africa–Europe corridors. With demand for hyperscaler-driven projects showing no sign of slowing, only a handful of major firms—primarily ASN, SubCom, and NEC—are expected to have the scale to deliver these global routes. Smaller suppliers such as Hexatronic, Elettra, and OLL will remain critical for regional and unrepeatered systems, ensuring that local markets and specialized needs continue to be met.
4.1.2. FUTURE SYSTEMS
Looking forward, the data on planned systems between 2025 and 2028 underscores the continued dominance of established suppliers, though with a more concentrated field than in previous years. ASN (Alcatel Submarine Networks) is involved in 11 planned systems, representing the largest share of future projects. SubCom follows closely with 10 planned systems, marking a strong resurgence compared to the previous reporting cycle. NEC is tied to 2 planned systems, while HMN Technologies Co., Ltd. (Hengtong) and Prysmian Group/NSW each hold 1 planned system.
When compared with last year’s outlook, the shifts are significant. ASN has expanded its pipeline from 9 planned systems to 11, reflecting its ability to secure contracts for high-capacity, long-haul projects. SubCom’s planned activity has jumped sharply from just 2 systems in last year’s forecast to 10 today, signaling a renewed competitive push and likely wins in both transoceanic and regional builds. By contrast, NEC’s
Figure 34: Planned Systems by Supplier
involvement has dropped from 4 planned systems in last year’s report to just 2, suggesting either delays, strategic realignments, or greater competitive pressure from rivals.
The smaller players continue to maintain a foothold. HMN’s single planned system reflects China’s steady, if selective, engagement in the subsea market, while Prysmian’s involvement highlights the European group’s ongoing role in diversifying supply options and applying its expertise from energy and terrestrial networks to undersea telecom projects.
It is important to emphasize that planned system counts do not always equate to proportional kilometers of cable deployed. While ASN and SubCom dominate the future pipeline by system count, smaller suppliers may still deliver substantial volumes if their projects involve ultra-long-haul routes. For example, Prysmian or HMN could remain highly relevant even with fewer contracts, depending on the scale of the projects they secure.
Industry trends also point toward suppliers diversifying their project portfolios. Both ASN and Prysmian, for example, continue to expand into offshore wind and renewable energy cabling, which reinforces their industrial bases and can offset variability in telecom system demand. SubCom’s resurgence, meanwhile, likely reflects its focus on hyperscaler-led builds, particularly across the Transpacific and Transatlantic corridors where cloud companies are driving most of the new demand.
The competitive landscape is therefore expected to remain dynamic. Long-established suppliers like ASN, SubCom, and NEC will continue to anchor the industry, but the emergence of mid-tier and niche suppliers ensures diversity of supply and provides redundancy in a market where geopolitical, regulatory, and environmental risks increasingly influence project viability. As global data demands accelerate and cloud infrastructure expands, the balance of supplier market share is likely to continue shifting, with hyperscaler-backed systems playing an outsized role in shaping future allocations.
“Hexatronic has installed over 10 000 km of subsea fibre and expects growth from offshore wind projects and interconnect networks; to meet U.S. demand, the company plans to manufacture fibre cables in South Carolina by 2026.”
Magnus
Angermund – Hexatronic (STF Issue 142)
4.2. INSTALLERS
The global submarine cable ship ownership landscape continues to evolve, with a handful of firms maintaining a dominant share of the operational fleet. SubCom currently leads, operating eight dedicated vessels, while Orange Marine and ASN each maintain fleets of six ships. Global Marine Systems and Optic Marine follow with five vessels apiece. Collectively, these five companies account for around 60% of the global installation fleet, underscoring their pivotal role not only in deploying new systems but also in maintaining the existing subsea infrastructure.
It is important to note that these figures represent vessels directly owned and operated by each installer. In practice, many firms also rely on “vessels of opportunity” — ships chartered or temporarily outfitted for subsea work. This approach provides greater operational flexibility, enabling companies to undertake projects in a wider range of geographies without needing to permanently expand their fleets. By leveraging both owned and chartered vessels, installers can better match project demands, reduce idle time, and extend their reach into regions beyond their traditional bases of operation.
For cable owners, the increased reliance on flexible fleet models translates into greater choice of suppliers. Rather than being limited to companies with nearby vessels, owners can now contract with a broader pool of installers who can mobilize quickly in response to specific project requirements. This shift has fostered a more competitive environment, reducing barriers to entry for smaller firms while keeping the larger players highly engaged across multiple global regions.
As a result, the market for submarine cable installation is no longer defined solely by the number of ships in a company’s fleet but by how effectively firms can deploy and manage resources. The balance between dedicated fleet ownership and opportunistic chartering is now a central factor shaping competitive dynamics in the industry.
4.2.1. CURRENT INSTALLATIONS
The submarine cable installation market between 2021 and 2025 reflects both the dominance of established firms and the diversification of contributions from smaller players. ASN continues to lead the market, with 25 systems installed (29.1%) during this period. While ASN’s total system count has grown compared to the prior reporting period (24 systems in 2020–2024), its market share remains roughly consistent, reflecting the scale of ongoing projects across multiple regions.
Orange ranks second, installing 11 systems (12.8%). Although this represents a smaller absolute count compared to the 14 systems completed in the previous cycle, Orange remains one of the most active firms in the installation market. Its slightly reduced output reflects greater competition from other firms rather than any loss of strategic relevance.
SubCom installed 9 systems (10.5%), a modest but steady performance that aligns with its long-term focus on large-scale, transoceanic builds. NEC followed with 8 systems (9.3%), continuing to secure major contracts in Asia-Pacific and international projects. HMN Technologies (Hengtong) installed 7 systems (8.1%), a figure that demonstrates its expanding role as China continues to invest in global subsea infrastructure.
Among mid-tier players, Prysmian Group/NSW and Elettra each installed 6 systems (7.0%), highlighting their resilience in securing regional and specialized projects. Global Marine Systems Limited also matched this figure, maintaining its long-standing position as an important player in both telecom and non-telecom subsea installations.
Smaller contributors include Optic Marine Services (3 systems, 3.5%), as well as Cecon Contracting, IT International Telecom, Baltic Offshore, DNeX Telco, KCS, and NTT WE Marine, each with 1–2 installations. Though individually limited in scale, these companies collectively represent a meaningful share of the market, supporting niche and regional builds that contribute to overall global connectivity.
Regional Activity
From a geographic standpoint, the EMEA region remains the clear leader, with 148,450 kilometers of cable installed. This represents a substantial increase compared to last year’s cycle and reflects the major push to connect Europe and Africa, most notably through mega-projects like 2Africa.
The Transpacific corridor is second, with 92,860 kilometers, underscoring the scale of investment in high-capacity, low-latency routes between Asia and North America. The Indian Ocean (77,620 km) and AustralAsia (76,710 km) regions follow closely, both showing sustained growth as governments and Hyperscalers push for greater route diversity.
The Americas region recorded 42,640 kilometers, while the Transatlantic corridor saw 29,680 kilometers—both stable compared to prior periods, reflecting incremental growth rather than major surges. The Polar region continues to lag far behind with just 1,800 kilometers installed, highlighting the ongoing technical and environmental challenges of Arctic and Antarctic projects.
Figure 35: Systems Installed by Company, 2021-2025
Comparative Trends
Compared to the 2020–2024 cycle, the latest data highlights two key shifts:
1. Regional emphasis has moved strongly toward EMEA, the Indian Ocean, and AustralAsia, with these three areas accounting for the bulk of growth.
2. Market share among installers is slightly more distributed: while ASN continues to dominate, mid-tier firms like HMN, Prysmian, and Elettra have held or grown their shares, ensuring a broader competitive base.
The result is a more balanced installation landscape, where leading firms retain their strategic dominance, but smaller and regional players are capturing important shares of global projects. This diversification reflects the maturing of the submarine cable market, where global-scale builds coexist with regional connectivity priorities.
“Reverse Separate Shore End (RSSE) pulls the cable offshore from a container onshore, decoupling the vessel’s schedule and allowing installation to be planned for optimal conditions, reducing delays and avoiding reliance on shallow draft vessels.”
Rafiah Ayandipo – ASN (STF Issue 143)
Figure 36: KMS Installed by Region, 2021-2025
4.3. SURVEYORS
4.3.1. CURRENT SURVEYS
Between 2021 and 2025, surveying activity in the submarine cable industry has remained diverse, with leadership concentrated among a few key players but a notable distribution of market share across specialized firms. ASN continues to hold the largest share, surveying 10 systems (30.3%), reaffirming its position as the most active participant in this segment. While ASN remains dominant, its relative share shows a gradual decrease compared to earlier periods, reflecting a broadening of competition in the surveyor landscape.
Figure 37: Systems Surveyed by Company, 2021-2025
EGS has secured the second position with 7 systems (21.2%), marking a strong presence in the sector. This growth underlines EGS’s increasing role in handling projects that require advanced geophysical and geotechnical expertise, particularly in regions with complex environmental challenges. Fugro, another leading name in seabed and geotechnical analysis, follows closely with 6 systems (18.2%), maintaining its reputa-
tion as a critical provider for technically demanding surveys, often tied to long-haul, transoceanic builds.
Among mid-sized contributors, Elettra surveyed 5 systems (15.2%), continuing its steady role in consortium-led and regional projects. IT International Telecom accounted for 2 systems (6.1%), demonstrating consistent engagement in specialized or smaller-scale developments.
Several firms contributed on a smaller scale but nonetheless highlight the breadth of expertise available in the market. Axians, OGS, and Orange each surveyed 1 system (3.0%), underscoring the niche but important role of regional and specialized surveyors in meeting localized project needs.
Comparative Trends
Compared to the 2020–2024 period, the latest figures highlight three key dynamics:
1. ASN’s market share is narrowing, dropping from just under 40% previously to 30% in this cycle, as competitors strengthen their positions.
2. EGS and Fugro have expanded their roles, together accounting for nearly 40% of all surveys. Their rise reflects growing demand for localized expertise in challenging geographies.
3. Smaller players remain active, ensuring diversity in survey capacity. Even with only 1–2 projects each, firms like Orange and Axians provide valuable regional depth.
Strategic Role of Surveyors
Surveying remains a critical first phase in the cable system lifecycle. Accurate seabed mapping and geotechnical analysis not only determine safe, viable routes but also directly influence the efficiency, longevity, and resilience of subsea systems. The prominence of ASN, EGS, and Fugro illustrates the industry’s reliance on firms capable of delivering comprehensive, data-driven assessments for both established corridors and new, emerging routes.
As demand for global connectivity grows and projects push into increasingly remote and environmentally complex regions, the expertise of surveyors will remain indispensable. The current distribution of activity demonstrates an industry adapting to these demands: larger firms maintain their dominance, while specialized surveyors carve out vital roles in delivering precision data that underpins the success of future subsea infrastructure.
“Deploying
the Saildrone Surveyor instead of traditional survey vessels avoided 243.32 tons of CO₂ emissions—a 98% reduction—and showed that uncrewed survey platforms can deliver deep water route surveys with dramatically lower costs and emissions.”
Embarking on a survey is one of the most critical early steps in implementing a submarine cable system. From 2024 to 2027, the industry is showing a clear improvement in survey completion rates, marking steady progress despite the logistical and regulatory complexities that often slow this stage of development.
Figure 38: Survey Status of Planned Systems by Region
For this period, 53% of planned systems (19 of 35 total systems) have completed their surveys. This represents a significant improvement compared to the 25% completion rate recorded in the 2023–2026 period. The increase highlights the sector’s ability to accelerate projects through this crucial milestone, providing a stronger foundation for timely implementation. Nearly all systems scheduled for 2024 have already completed their survey work, signaling proactive preparation across multiple regions.
The survey completion rate is a leading indicator of potential project timelines, as the transition from survey to full system implementation typically takes 12–18 months. With just over half of the projects surveyed, a number remain on track for their target Ready for Service (RFS) dates, though delays for incomplete surveys could extend into 2025 or later.
Regional Trends
• EMEA continues to dominate future survey activity, with 13 completed surveys but also 12 incomplete, indicating strong momentum alongside challenges in approvals and execution. Despite the backlog, the region remains strategically critical and is pushing projects forward steadily.
• The Americas has completed 9 surveys versus 8 still incomplete, reflecting balanced but uneven progress. Political and economic uncertainties, particularly in South America, are likely factors slowing some projects.
• AustralAsia shows 5 completed and 10 incomplete surveys, underscoring both the scale of upcoming projects and the delays tied to survey capacity and logistics. This completion ratio suggests further catch-up will be required to keep projects aligned with projected RFS timelines.
• The Indian Ocean reports 4 completed surveys and 7 incomplete, pointing to progress despite significant environmental and logistical hurdles.
• The Transpacific region has 3 completed and 6 incomplete surveys, a reflection of the complexity and scale of the large systems planned here. While moderate progress is evident, many of the projects remain in the early stages.
• The Polar region continues to face the steepest barriers, with no surveys completed and 3 still incomplete, highlighting the persistent technical and environmental difficulties in advancing projects in this geography.
Industry Implications
The step up in completion rates from 25% to 53% demonstrates the industry’s determination to progress, even as project scopes become more ambitious and cable routes more complex. The 22 incomplete surveys highlight where bottlenecks remain, particularly in high-demand regions such as AustralAsia and EMEA.
While incomplete surveys will inevitably delay some projects into 2025 and 2026, the higher-than-average completion rate compared to prior years underscores industry resilience. The successful execution of surveys across diverse and challenging geographies reinforces confidence that planned systems will continue moving forward, albeit at varying speeds.
In summary, the submarine cable sector is managing to accelerate survey completions despite mounting challenges. These advancements reflect growing expertise and resource allocation, which will be critical in sustaining momentum as projects transition into implementation phases over the coming three years.
“At SubOptic, ask wet plant vendors how they will scale fibre pair counts beyond 32 and what amplifier pump management strategies they have; ask transponder vendors about network wide power management and optimal line rates.”
Geoff Bennett – Infinera (STF Issue 142)
Deploying a submarine cable system?
Your success depends on the right team.
At WFN Strategies, we provide access to over 150 highly qualified client representatives across 25+ countries—each pre-vetted, field-proven, and supported by our industry-leading Contractor Care Program.
From technical oversight to compliance management, our experts ensure your project stays on time, on budget, and on course.
Ensure your next project has the right people in place. Contact
www.wfnstrategies.com
5. SYSTEM MAINTENANCE
5.1. PUBLICITY
From 2015 to 2025, SubTel Forum recorded a total of 259 publicized cable fault stories across multiple global regions. As in previous years, the majority of these incidents were attributed to human activities such as anchoring and fishing operations, with natural events like earthquakes and volcanic activity contributing to a smaller portion of faults.
Regional analysis shows that the AustralAsia region remains the most fault-prone, accounting for 35.3% of all reported cases over the past decade. This marks a slight decline from last year’s 36.3% share, though the region continues to dominate fault reporting. EMEA follows with 29.1%, while the Americas contribute 20.2%. Other regions, including the Indian Ocean (8.1%), Transpacific (5.8%), and Transatlantic and Polar routes (together under 2%), remain comparatively less affected.
In terms of yearly coverage, 2024’s spike of 46 reported incidents has now been followed by 43 stories in 2025 – still far above the decade-long average, but slightly below last year’s extraordinary peak. This
Figure 39: Cable Fault Stories per Region, 2015-2025
confirms that the sharp surge in media coverage seen in 2024, fueled by the high-profile Red Sea incident, was not an anomaly. Instead, it appears to have marked the start of a sustained period of heightened media scrutiny around submarine cable vulnerabilities.
Historically, cable faults often received minimal formal coverage, with much information confined to social media or industry-specific channels. However, since 2024, mainstream media attention has grown, reflecting broader geopolitical awareness of submarine cable infrastructure. The 2025 numbers suggest that while actual fault events continue to fluctuate year over year, media reporting has entered a new, more prominent phase.
This trend underscores a shift in industry risk management: operators must not only address the physical resilience of cable systems, but also adapt to the reality of increased public and policymaker scrutiny. Even if fault frequencies stabilize or decline in coming years, the elevated visibility of submarine cables in global media discourse is likely to persist, reinforcing their role as critical – and closely watched – components of international communications.
“The digital divide isn’t some unsolvable riddle; it’s a set of structural gaps—where we build, who we prioritise and how we listen— that we’ve chosen to live with. Closing these gaps isn’t just a fairy tale; it’s a practical outcome of rethinking how and where we invest.
Emma Stevens – Digital inclusion advocate (STF Issue 144)
Figure 40: Total Cable Fault Stories, 2015-2025
5.2. REPORTING TRENDS AND REPAIR TIMES
From 2015 to 2025, the average reported repair time for submarine cable faults has continued to show significant variability. After years of fluctuation, the industry saw a marked improvement in the past two years. In 2024, the average repair time was 34 days, and in 2025 it dropped further to 32 days. This is a notable reduction compared to the severe delays of 2021 and 2022, when repair times spiked to 53 and 78 days respectively, the longest durations recorded in over a decade.
Figure 41: Average Reported Repair Time in Days, 2015-2025
The improvements seen since 2023 suggest that lessons learned during the earlier crisis years are beginning to pay off. While the global cable ship fleet remains limited, and no major additions have been made since 2001, operators have managed to better coordinate repair resources and streamline certain procedures. This is especially important as the number of deployed submarine cable systems continues to grow each year, stretching the fleet’s capacity.
Geopolitical and regulatory challenges remain a contributing factor in repair delays, particularly in South-
east Asia and the Middle East, where access permissions and security conditions can significantly slow operations. However, the overall decline in repair times indicates that the industry has become more adaptive, with improved contingency planning and regional cooperation allowing for faster mobilization when faults occur.
Another driver in recent years has been an improvement in tracking and reporting of cable faults. As more faults are formally recorded and monitored by industry bodies and the media, there is greater transparency into actual repair durations. While this contributes to a more complete dataset – and thus can make average repair times appear longer compared to a decade ago – it also helps stakeholders identify and address systemic challenges more effectively.
Looking forward, projections remain uncertain. Without investment in new cable ships or alternative repair methods, the risk of future spikes in repair times remains, particularly as global traffic grows and cable routes expand into more remote and politically sensitive areas. Current forecasts show the potential for wide variability in the years ahead – with average repair times possibly ranging from steady improvements to renewed increases if constraints worsen. This underlines the importance of continued innovation in maintenance strategies, regional collaboration, and possibly new technologies to ensure submarine cables can be restored quickly and reliably when disruptions occur.
“Reuse emerges as the most beneficial scenario as it extends the functional life of cable systems without the need for new materials, delivering cost savings, sustainability gains and operational advantages. Recycling emerges as the most viable long term strategy, especially for deep sea cables.”
Marine maintenance in the submarine cable industry operates under two primary types of agreements: private and club. These agreements provide the structure for how repair and maintenance services are delivered to submarine cable systems across the globe.
5.3.1. TRADITIONAL CLUB AGREEMENTS
Club agreements involve multiple cable owners who pool their resources to share the cost and services of maintenance. Within each Maintenance Zone, the cable owners appoint a Maintenance Authority, who acts as the main point of contact between the cable owners, the marine service providers, and depot operators. This system is advantageous because it allows cable owners to benefit from shared resources while ensuring their systems are maintained efficiently and at a lower cost.
Figure 42: Traditional Club Agreements Map
5.3.1.1.
Oceans Cable Maintenance Agreement
The 2 Oceans Cable Maintenance Agreement (2OCMA) covers the southern Atlantic and Indian Oceans, with its operations primarily based out of Telkom SA’s facilities in Cape Town, South Africa. Orange Marine supports these operations with vessels and facilities, providing coverage for several cables in the region.
5.3.1.2.
Atlantic Cable Maintenance Agreement
Established in 1965, the Atlantic Cable Maintenance Agreement (ACMA) has long set the standard for cable maintenance in the North Atlantic and beyond. The agreement extends across the Atlantic Ocean, Southeast Pacific, and Northern Europe. Key providers such as Global Marine, Orange Marine, and SubCom support the agreement with vessels and facilities.
5.3.1.3.
Mediterranean Cable Maintenance Agreement
The Mediterranean Cable Maintenance Agreement (MECMA) operates out of La Seyne-sur-Mer, France, covering the Mediterranean, Black, and Red Seas. Orange Marine and Elettra provide the marine support necessary for cable maintenance in this densely trafficked area.
5.3.1.4.
North American Zone Cable Maintenance Agreement
The North American Zone Cable Maintenance Agreement (NAZ) spans from Alaska to the Equator and covers both coasts of North and South America. Global Marine Systems Limited oversees the operations from its base in Victoria, Canada, providing crucial support for systems in this region.
The Southeast Asia/Indian Ocean Cable Maintenance Agreement (SEAIOCMA) covers an extensive area from Djibouti to Guam. It is supported by multiple operators, including ACPL, IOCPL, and Global Marine Systems Limited, who base their vessels in strategic ports like Singapore, Colombo, and Manila.
5.3.1.6.
Yokohama Zone Cable Maintenance Agreement
Focusing on the northern Asia and northwest Pacific regions, the Yokohama Zone Cable Maintenance Agreement is managed by companies such as KCS, KTS, and SBSS. Their facilities and vessels are based in ports like Yokohama, Japan; Keoje, Korea; and Wujing, China.
5.3.2.
PRIVATE MAINTENANCE AGREEMENTS
Unlike club agreements, private maintenance agreements are custom contracts tailored to the specific needs of individual system owners. These contracts allow cable owners more direct control over the terms and services provided, often through private ship operators.
“By incorporating fishing voices into early planning— particularly where target burial depths cannot be achieved—developers and cable operators may reduce conflict, avoid accidents and strengthen the social license for offshore infrastructure projects”
Sarah Hudak & Ron Larsen – Sea Risk Solutions LLC (STF
Issue 143)
5.3.2.1.
Atlantic Private Maintenance Agreement
The Atlantic Private Maintenance Agreement (APMA) provides private cable maintenance services in the Atlantic and Mediterranean regions. Support is provided by ASN and SubCom from bases located in Calais, France; Curacao; and Cape Verde.
5.3.2.2.
Asia Pacific Marine Maintenance Service Agreement
The Asia Pacific Marine Maintenance Service Agreement (APMMSA) is managed by SubCom, which provides cable maintenance for the Asia Pacific region. The vessels and facilities are based in Taichung, Taiwan.
5.3.2.3.
E-marine
E-marine focuses on the Arabian Gulf, Red Sea, and Indian Ocean regions. Their base ports are located in Hamriya, UAE, and Salalah, Oman. E-marine’s strategic positioning allows them to provide rapid response to systems in these heavily trafficked waters.
5.3.2.4.
South Pacific Maintenance Agreement
The South Pacific Maintenance Agreement (SPMA) covers the southern Pacific up to the Hawaiian Islands, supported by SubCom with vessels and facilities based in Samoa.
Figure 43: Private Maintenance Agreements Map
5.4. CHALLENGES AND TRENDS
Submarine cable maintenance continues to evolve as one of the most complex and strategically important aspects of the global telecommunications industry. While the framework of club and private agreements provides the organizational backbone for repair activities, the events of 2024–2025 illustrate that the resilience of the global network increasingly depends on external factors: geopolitics, regulation, vessel availability, and the pace of regional investment. Maintenance today is no longer a purely operational question of mobilizing ships and crews; it has become a matter of international security, infrastructure policy, and market strategy.
One of the clearest developments over the past year has been the heightened vulnerability of geopolitical chokepoints, with the Red Sea serving as a central case. Throughout much of 2025, multiple systems—including AAE-1, EIG, and Seacom—remained offline for extended periods as repair vessels idled in Djibouti without permits to enter Yemeni waters. The effect was felt across East Africa, the Middle East, and South Asia, where limited redundancy meant outages persisted for weeks. September compounded the fragility when a cluster of cables was severed near Yemen and Saudi Arabia, triggering one of Pakistan’s longest outages in recent history. Restoration was projected at four to five weeks, underscoring how a single chokepoint can disrupt traffic flows well beyond the immediate region. These events reinforced industry concerns that reliance on contested maritime corridors creates systemic risks that neither club nor private maintenance structures alone can mitigate.
In Europe, the picture is marked by structural strain and regulatory response. For several years, regional associations such as ESCA and IMCA have highlighted a shortage of modern repair vessels, rising insurance and operating costs, and delays in securing permits for at-sea work. In 2024, Finland broke new ground by prosecuting the crew of a tanker accused of dragging anchors across Baltic Sea cables, signaling a willingness to pursue legal remedies where physical deterrence is limited. By mid-2025, momentum had shifted from industry warnings to political action: the UK Parliament’s Joint Committee on the National Security Strategy called for stronger repair commitments, while Europacable pressed the European Commission to streamline permitting and invest in monitoring infrastructure. These measures indicate a transition toward coordinated governance, but the underlying shortage of vessels remains a constraint, raising concerns about Europe’s ability to absorb simultaneous multi-system failures.
In Asia-Pacific, the maintenance landscape reflects both acute vulnerabilities and proactive government responses. Indonesia’s Papua cable break in August highlighted the fragility of archipelagic systems, where limited redundancy means a single cut can isolate communities for weeks. Taiwan responded to growing threats with sweeping new legislation that designates submarine cables as critical infrastructure, mandates AIS tracking for vessels near landing zones, and imposes stricter penalties for sabotage. Japan advanced subsidies for NEC to acquire dedicated repair ships, framing this as a sovereign capability necessary to safeguard connectivity. These measures reflect a regional consensus that maintenance readi-
ness is no longer optional—it is essential for economic security and geopolitical stability.
The Arctic has also re-emerged as a focus for maintenance and lifecycle planning. In August 2025, the European Union and Japan raised the Trans-Arctic cable to the level of policy dialogue, promoting it as a strategic alternative to the Red Sea and Suez Canal routes. The project represents a shift in thinking: Arctic connectivity is no longer framed solely as engineering ambition but as diversification strategy against chokepoint risk. At the same time, Norway advanced seabed surveys for a replacement to the 2004 Svalbard cable, showing how Arctic maintenance is beginning to incorporate both new builds and end-of-life planning.
Africa remains constrained by a shortage of regional repair assets. Much of the continent still relies on a limited number of multipurpose ships, with Orange Marine’s Léon Thévenin repeatedly tasked with coverage for wide swaths of the western and southern coasts. The September 2025 deployment off Angola highlighted the critical role of a single vessel in supporting multiple countries’ connectivity. With demand for digital infrastructure surging across Africa, the imbalance between needs and available maintenance capacity is emerging as one of the industry’s most pressing gaps.
In North America, submarine cable maintenance has been elevated to the level of national security doctrine. The U.S. FCC updated licensing requirements in August to embed repair readiness into approvals, and in September, Congress passed the Undersea Cable Control Act, signaling a bipartisan push to regulate foreign involvement in maintenance operations. Yet, these policy steps contrast with operational realities: the U.S. Navy deactivated USNS Zeus, its only dedicated cable repair ship, leaving the country dependent on private contractors and allied vessels. This juxtaposition of stronger regulatory oversight with reduced national fleet capacity highlights the contradictions that define the region’s maintenance posture.
Taken together, these regional developments underscore a global maintenance ecosystem under dual pressure. On one hand, the system is constrained by aging fleets, slow permitting, and limited regional coverage. On the other, it is increasingly shaped by regulation, diplomacy, and even legal enforcement. The Red Sea case demonstrates how geopolitical constraints can keep repair ships idle, regardless of contract frameworks. Europe illustrates how legal and policy tools are being mobilized to fill gaps left by infrastructure shortages. Asia shows how states are now embedding cable protection in law and subsidy. The Arctic demonstrates lifecycle renewal framed through a strategic lens. Africa exemplifies regional gaps in assets, and North America highlights the tension between regulation and fleet capacity.
The overarching trend is clear: submarine cable maintenance has moved from a reactive engineering service to a strategic infrastructure domain. Outages and repair delays are determined as much by politics, law, and policy as by the readiness of ships and crews. Unless governments and industry accelerate investment in modern vessels, streamlined permitting, and redundancy planning, the gap between demand and capacity will widen further. With hundreds of systems aging and new ones continuing to enter service, maintenance risk is now a global infrastructure challenge on par with deployment itself.
6. CABLE SHIPS
6.1. CURRENT CABLE SHIPS
SubTel Forum continues to monitor the activities of the global cable ship fleet, which currently consists of 63 active telecommunications cable ships dedicated to maintaining and expanding submarine telecommunications infrastructure. While other vessel types such as survey vessels and power cable ships remain vital to the broader subsea industry, this report focuses solely on telecom cable ships.
In terms of ownership, the landscape has remained diverse but has seen notable reshuffling in 2025. Consolidation, vessel transfers, and targeted acquisitions have shifted the balance of fleet distribution, even as the overall number of ships has held relatively steady compared to prior years.
6.1.1. FLEET DISTRIBUTION
As of 2025, Global Marine Systems Limited and SubCom LLC now jointly lead the market, each operating seven vessels, representing the largest shares of the active fleet. This is a change from 2023, when Global Marine and Orange Marine were the top operators. OMS Group follows with six vessels, while Orange Marine and e-marine PJSC each operate five vessels.
Alcatel Submarine Networks (ASN) holds a significant share with four vessels, while mid-sized operators like IT International Telecom Inc., ASEAN Cableship, SBSS, KCS (KDDI Cable Ship), and Mertech Marine each control three ships. Smaller operators, such as Seaway Offshore Cables GmbH, Subsea Environmental Services, and NTT WE Marine, maintain two ships each. The remainder of the fleet — roughly a third of all vessels — is spread across a wide range of single-ship owners including Pirelli, Elettra, Baltic Offshore, LS Marine, Subsea 7 International, RF Navy, Relacom Finland Ltd., and PT Limin Marine & Offshore.
“Analysis of 7,608 AIS-based data points found that cable-ship activity can be projected as Maintenance (31.1%), Installation (11.5%) or Unclassified (57.4%); maintenance missions are more frequent and concentrated near depots, while installation activity is more dispersed and tied to project-specific corridors”
Where in the World Are All Those Pesky Cable Ships
(STF Issue 142)
44: Cableship Fleet Distribution by Company, 2025
This distribution highlights an ongoing trend of fragmentation alongside concentration. While the top five companies together control just under half of the fleet, the remainder is spread across more than a dozen smaller operators. Importantly, 2025 has seen ship sales and ownership transfers that reshaped the mid-tier, with several vessels changing hands between regional operators. This reflects both the high capital cost of operating specialized cable ships and the growing role of regional players in maintaining localized subsea infrastructure.
The fleet’s ownership structure today is therefore more dynamic than in previous years: the dominance of a few legacy operators remains clear, but smaller firms are steadily building their presence, creating a more distributed ownership base. This shift suggests the industry is gradually diversifying, ensuring that cable maintenance and installation capacity is not overly concentrated in the hands of only a few multinationals.
6.1.2. OPERATIONAL ACTIVITY OVERVIEW
The defining characteristic of the cable ship fleet in 2025 was not the number of hulls in service, but rather how those ships were employed throughout the year. AIS data collected and analyzed by SubTel Forum across the January, March, May, July, and September reporting windows reveals a global fleet engaged in a delicate balancing act: executing new cable installations while maintaining enough capacity to respond to faults. As in past years, the data underscores both the indispensability of these vessels and the vulnerabilities inherent in such a small, heavily tasked fleet.
From quarter to quarter, AIS data showed fluctuations in how vessels were used, but one pattern held constant: installation activities consumed a significant share of fleet time, while maintenance work remained steady but constrained. In several reporting windows, installation points outnumbered maintenance points
Figure
by a wide margin. This is consistent with the global boom in new cable projects that reached record levels of construction in 2025.
Yet maintenance activity did not decline—it remained consistent, particularly in fault-prone regions such as the Indian Ocean, Southeast Asia, and the Mediterranean. Operators were forced to prioritize urgent repairs even as their vessels were tied up on long-duration installation jobs. The data suggests that operators often delayed or redirected installation campaigns to free up ships for repairs, demonstrating the fragile equilibrium between building tomorrow’s networks and keeping today’s running.
A recurring feature of the AIS analysis was the prevalence of “unclassified” data points—ship behaviors that could not be cleanly categorized as installation or maintenance. These represented not just statistical noise but a real limitation in understanding fleet utilization. Despite ongoing efforts to refine analytic methods, a substantial portion of ship activity remained difficult to interpret.
The issue is twofold. First, AIS reporting is inconsistent: some vessels broadcast in ways that obscure their purpose, whether intentionally or due to limitations in transponders. Second, many cable ship operations blend multiple roles—survey work, cable lay support, depot operations—making it difficult to assign a single classification. As a result, unclassified behaviors sometimes rivaled installation and maintenance in sheer volume, complicating attempts to quantify how fleet time was truly spent.
Compared to 2024, the proportion of unclassified activity in 2025 showed only modest improvement, underscoring that transparency in cable ship operations remains elusive. This lack of clarity carries real-world consequences: policymakers, insurers, and even some industry stakeholders remain in the dark about the full scope of global fleet engagement.
The quarterly breakdowns show that 2025 was not uniform in fleet activity. Early in the year, the fleet was heavily engaged in pre-planned installation campaigns across the Atlantic and Pacific. By midyear, however, fault response surged, particularly following multiple incidents in the Red Sea and the South China Sea. These spikes in maintenance demand diverted ships from their scheduled work, creating bottlenecks in the installation pipeline.
Figure 45: Cableship Activity Distribution, 2025
AIS points clustered near known depot locations during these fault surges, reflecting the operational reality that ships must stage near supply bases to reload cable and gear before undertaking lengthy repairs. In contrast, the later months of 2025 showed a return to installation-heavy behaviors, with ships once again deployed on transoceanic routes and regional buildouts.
When compared to last year’s patterns, 2025 reflects continuity more than disruption. The fleet continues to spend the majority of its time either laying new systems or waiting at depots for assignments, with maintenance interventions punctuating the rhythm. The biggest differences are in scale and intensity: 2025 saw a higher total volume of installation-related activity, a reflection of the record number of new systems under construction. Conversely, fault response patterns tracked closely with historic averages, suggesting that the physical risks to cables—anchoring, fishing, natural disasters—remained constant year over year.
What emerges from the AIS record is a portrait of a fleet stretched thin but performing reliably, oscillating between major new builds and urgent maintenance. The inability to fully classify all activity is a blemish on the dataset, but the broad outlines are clear: 2025 was another year in which cable ships served as the indispensable, if overstretched, workhorses of global connectivity.
6.1.3. REGIONAL ACTIVITY AND HOTSPOTS
If the global fleet’s balance of maintenance and installation defines what the ships were doing in 2025, then the regional analysis of AIS data explains where those activities were concentrated. The year’s patterns show both continuity with long-standing hotspots and new developments that underscore how the geography of subsea operations is shifting in response to demand, geopolitics, and the sheer pace of new cable deployment.
The 2025 AIS data confirmed once again that fault-prone regions like the Indian Ocean, the Red Sea, and Southeast Asia remain the epicenters of repair activity. These waters combine dense cable routes with high exposure to external risks—anchoring, fishing, seismic activity, and, in the case of the Red Sea, heightened geopolitical instability.
Throughout the year, SubTel Forum tracking noted repeated concentrations of cable ship behavior consistent with repair operations in these regions. Vessels lingered in tight areas of activity, often within close reach of known cable corridors, indicative of cable retrieval, splicing, and relay work. These clusters mirrored incident reports and highlighted how regional operating companies are increasingly tasked with quick-turnaround repairs to minimize disruption in areas where multiple systems interconnect.
The Red Sea in particular saw heightened attention following widely reported outages in early 2025, which reaffirmed the region as both critical and vulnerable. AIS records showed ships staging near Djibouti and Jeddah during these events, underscoring the strategic importance of nearby depots and the challenge of keeping sufficient hulls within reach of such volatile chokepoints.
While maintenance was persistent, installation activity in 2025 dominated the Atlantic and Pacific theaters. AIS points revealed extended periods of straight-line, long-distance movement—consistent with cable laying—across both ocean basins. In the Atlantic, multiple ships were engaged simultaneously, reflecting the cluster of new Transatlantic systems announced in recent years and now entering the construction phase. Similarly, the Pacific basin saw concentrated activity, especially on routes linking East Asia with North America, a continuation of the region’s position as a hub of high-capacity builds.
Of note was the Indian Ocean corridor, where both installation and maintenance points were heavily represented. Here, growth in inter-Asia and Asia-to-Europe connectivity has combined with persistent fault density, creating one of the most consistently busy regions for cable ships in 2025.
Though the Atlantic and Pacific remain the long-haul centers of gravity, 2025 also revealed emerging zones of activity. West Africa, for example, saw increasing installation-related activity, aligning with new projects designed to improve connectivity across the continent. AIS data showed ships conducting prolonged operations off the coasts of Nigeria and Ghana, where new systems are extending capacity southward and tying into pan-African terrestrial networks.
Similarly, South America registered a noticeable uptick in ship activity, particularly on the Pacific side. New landing projects in Chile and Peru drew vessels into regions historically quieter in the AIS dataset, highlighting the expansion of cable infrastructure into underserved coastal markets. These shifts point to a broader diversification in the map of submarine connectivity: the fleet is no longer confined to the familiar “big three” transoceanic corridors but is being tasked increasingly with projects in emerging markets.
AIS clustering also revealed the enduring importance of regional depot ports. Concentrations of ships near key depots—Singapore, Batam, Colombo, La Réunion, Marseille, and Halifax among them—signaled staging for both repair and installation projects. These depots act as both supply bases and strategic anchors for the fleet, allowing rapid redeployment into surrounding waters. The prominence of these clusters in 2025 suggests that while cable ships may operate globally, their effective reach is still tied closely to a limited set of regional hubs.
Interestingly, the data indicated that in certain cases, ships traveled substantial distances back to depot
Figure 46: Regional Distribution of Cableship Activity, 2025
ports after prolonged installation campaigns, underscoring the need for periodic reloading of spare cable and gear. This pattern reinforces the geographic asymmetry of cable ship readiness: regions with proximate depots enjoy quicker repair response times, while areas far from these hubs risk longer outages when faults occur.
Looking at 2025 alongside 2024, the broad outlines are familiar—maintenance concentrated in the Red Sea, Indian Ocean, and Southeast Asia; installation surges across the Atlantic and Pacific. But the scale and distribution shifted meaningfully. More AIS points clustered along Africa’s west coast and South America’s Pacific seaboard, signaling that the fleet’s regional footprint is expanding in step with the industry’s diversification of landing points.
This diversification is a double-edged sword: it broadens global connectivity but also stretches the already-limited fleet across more regions. The AIS data paints a picture of cable ships increasingly being asked to “be everywhere at once”—a demand the current fleet size can only partially satisfy.
6.1.4. DEPOT AND FACTORY PROXIMITY BEHAVIORS
One of the clearest themes emerging from the AIS data in 2025 was the strong gravitational pull of depot and factory locations on cable ship behavior. These facilities—where ships reload spare cable, conduct maintenance, and coordinate with onshore teams—have long been central to fleet operations, but the 2025 data emphasizes just how dependent the fleet remains on them. While ships are inherently mobile, their activity patterns revealed that they orbit around these critical infrastructure nodes more often than might be assumed.
Across the January, March, May, July, and September reporting periods, AIS points consistently clustered around known depots: Singapore, Batam, Colombo, La Réunion, Marseille, Halifax, and Portland (UK) among others. Ships often lingered in these locations for extended periods before heading out on fault repair missions or resuming long-haul installation work. This behavior highlights two realities: the logistical necessity of reloading gear, and the strategic preference for staging vessels within reach of high-density cable corridors.
In practical terms, this depot-centric pattern provides a measure of resilience. When faults occur nearby, response times are faster, as ships can mobilize quickly. Conversely, it exposes a vulnerability for regions far removed from these hubs: long steaming times are required before work can even begin, prolonging outages. In 2025, this asymmetry became particularly evident in regions like West Africa and the South Pacific, where ships were observed traveling significant distances from depots before beginning repair work.
In addition to depot clustering, AIS records also captured behaviors linked to cable manufacturing facilities. These instances, while less common, typically occurred when new systems were being loaded out for installation. Vessels staged near factories in France, Japan, and the U.S. East Coast before embarking on installation campaigns, reflecting the supply chain pipeline that connects cable production directly to deployment at sea.
The 2025 data showed that these factory-linked points were fewer in number than depot-linked points, but they remain critical indicators of new system launches. SubTel Forum analysts noted that the timing of these clusters often aligned with known project schedules, offering a glimpse into when and where new systems were about to be deployed.
Comparing depot and factory behaviors in 2025 with those observed in 2024 reveals both continuity and subtle shifts. Depot clustering remained the dominant pattern, underscoring the enduring reliance on a handful of global hubs. However, the geographic distribution of this clustering widened modestly in 2025. For example, more AIS points accumulated around depots in West Africa and Latin America than in previous years, corresponding with new system builds and rising fault coverage needs in those regions.
This suggests that while the traditional depot strongholds still anchor most activity, regional diversification is slowly underway. Smaller depots, or even temporary staging ports, appear to be gaining relevance as the subsea network spreads into new geographies.
Figure 47: Cableship Activity by Proximity
The prominence of depot-centric operations also illustrates a deeper strategic challenge: the tradeoff between efficiency and resilience. Concentrating spare cable, equipment, and technical staff at a few depots allows operators to maximize efficiency and reduce costs. Yet this centralization means that when faults occur in distant waters, repair times lengthen dramatically. The 2025 AIS data made this tension clear, showing that ships operating far from depot bases spent considerable time in transit rather than actively repairing cables.
For operators and policymakers alike, this raises questions about whether the depot network as currently configured is adequate for the growing scale and complexity of the subsea cable system. Calls for investment in new regional depots or expanded stocks at secondary ports have grown louder, particularly from stakeholders in emerging markets that have experienced repeated delays in fault response.
Ultimately, the 2025 AIS evidence reinforces the notion that the depot and factory infrastructure is the hidden skeleton of the global cable ship fleet. Ships may be the visible actors, but their ability to operate efficiently depends on a land-based backbone of resupply and coordination points. As installation surges continue and maintenance demands persist, the importance of this network will only grow.
The lesson of 2025 is that cable ships are not free-roaming assets; they are tethered, operationally and strategically, to a small number of depots and factories. Expanding and diversifying this infrastructure may prove just as important to future resilience as building new ships.
6.1.5. TRANSPARENCY AND DATA LIMITATIONS
While AIS tracking has given the industry unprecedented visibility into cable ship operations, 2025 reinforced just how much remains hidden from view. One of the most persistent themes across SubTel Forum’s quarterly analyses was the high proportion of unclassified activity points—behaviors that could not be cleanly categorized as installation, maintenance, or any other specific task. This lack of clarity complicates efforts to measure fleet utilization accurately and, more importantly, obscures the true balance between building new systems and sustaining the existing network.
In every quarterly dataset published throughout 2025, a strikingly large number of AIS points fell into the unclassified category. Despite improvements in analytic methods and greater experience parsing ship behaviors, the proportion of movements that could not be clearly attributed remained stubbornly high. In some months, unclassified activity rivaled installation activity in sheer volume, representing not an occasional anomaly but a structural limitation of the dataset.
This problem is compounded by the fact that unclassified does not mean “irrelevant.” Rather, it often represents real and important work that simply does not fit into neat categories. Survey operations, test runs, standby positioning, and depot logistics all generate AIS tracks that resist simple interpretation. The result is a statistical blind spot that narrows our ability to quantify how cable ships spend their time.
Several factors explain why so much activity resists classification. First is the variability of AIS reporting itself. Ships broadcast position and course, but the fidelity of this data depends on equipment, transmission quality, and whether the vessel is in an area of strong coverage. Technical inconsistencies often muddy the signal.
Second is the hybrid nature of many operations. A ship might spend part of a voyage on survey work, then transition to cable installation, and finally reposition to a depot—all within a single operational window. AIS alone cannot always capture such nuance, meaning those tracks default to unclassified.
Third, some operators intentionally limit the visibility of their operations. While AIS broadcasting is generally required, the details are sparse enough that certain activities remain opaque. Whether driven by commercial sensitivity or simple operational practice, the net effect is that outsiders cannot fully parse what a vessel is doing at any given time.
These limitations have meaningful consequences. For analysts and policymakers, the inability to disaggregate unclassified activity obscures the real balance of global fleet commitments. Are ships primarily engaged in installations, leaving fewer hulls available for repair? Or are they performing a mix of duties, including standby and logistical work? The lack of clarity hinders efforts to answer such questions with precision.
For operators themselves, the issue is less acute—they know what their ships are doing—but for the wider ecosystem of customers, regulators, and insurers, the opacity reduces confidence in the fleet’s capacity. In an industry where trust in resilience is paramount, this lack of transparency carries risks.
SubTel Forum’s reporting this year made clear that progress is being made, albeit slowly. Analysts have refined their methods for identifying characteristic AIS patterns—tight clusters suggest repairs; long straightline transits suggest installation—and cross-referencing with known project schedules has improved classification accuracy. However, these gains were incremental rather than transformative. The unclassified share remained stubbornly high, a reminder that AIS analysis alone can never fully replace operator disclosures.
Figure 48: Unclassified AIS Activity Share, 2025
Some stakeholders have suggested that greater voluntary transparency from operators could close the gap, perhaps through anonymized reporting of activity types without revealing commercial details. Others argue that investment in better analytic tools—leveraging machine learning to detect subtle behavioral signatures—might help. But as of 2025, these remain proposals rather than standard practice.
The persistence of unclassified activity points to a larger issue: the opacity of cable ship operations in general. Beyond AIS, very little data is publicly available on the fleet’s readiness, utilization rates, or capacity bottlenecks. This stands in contrast to other critical infrastructure sectors, where more robust reporting frameworks exist. The subsea industry remains reluctant to share operational data, citing both commercial competition and security concerns.
This opacity has consequences beyond analytics. It complicates planning for global resilience, limits the ability of governments to make informed policy decisions, and fuels misconceptions among the broader public. The 2025 reporting made clear that while the industry has grown in importance, it has not yet matured into one that fully embraces transparency.
If 2025 highlighted one thing, it is that the unclassified problem is not going away on its own. Without systemic changes in reporting practices or a step change in analytic sophistication, the share of activity that cannot be explained will remain high. This poses ongoing challenges for anyone seeking to understand the true balance of global fleet activity.
The implication is clear: as cables become ever more central to global connectivity and geopolitics, the industry will need to find ways to reconcile commercial sensitivity with the demand for greater transparency. Whether through voluntary initiatives, improved analytic methods, or policy intervention, the “dark water” around cable ship operations cannot remain opaque indefinitely.
6.1.6. CONCLUSIONS AND FORWARD OUTLOOK
The story of cable ship operations in 2025 is one of continuity under strain, but with clear signs of imbalance intensifying. The AIS analysis of the year painted a consistent picture: a global fleet running close to its effective limits, pulled in opposite directions by the demands of new system installations and the ongoing need to repair faults. While the ownership landscape has shifted modestly and regional activity has diversified, the fundamentals remain unchanged—too few ships for too many tasks, stretched across an expanding global subsea cable ecosystem.
The data for 2025 makes one conclusion inescapable: installation activity is consuming a greater share of fleet capacity. With hundreds of new submarine cable systems either under construction or slated to come online within the next three years, installation campaigns have surged to the forefront of operational demand. By contrast, maintenance—while steady in absolute terms—represents a shrinking share of observed fleet behavior, as vessels are increasingly tied to long-duration installation contracts.
At the same time, unclassified activity remains significant. Despite better analytic tools and more refined classification methods, roughly one-fifth of AIS points in 2025 could not be assigned to a clear category. Some of this represents necessary but hard-to-parse work such as surveys, trials, and repositioning. Still, its persistence underscores ongoing challenges in transparency and hampers the ability to quantify the true balance of fleet utilization.
Taken together, these observations provide the basis for a forward-looking projection. If installation demand continues to rise, and if no significant newbuilds or depot expansions materialize, the share of fleet time allocated to installations will climb still higher in 2026. Maintenance will be pressured further, and unclassified activity may decline slightly as more behaviors are absorbed into the expanding installation category.
The projection model illustrates this likely shift. In 2025, installation accounted for approximately 55% of observed fleet activity, with maintenance at 25%, and unclassified at 20%. By 2026, installations could reasonably grow to 60%, with maintenance dropping to 22%, and unclassified activity narrowing to 18%.
This is not a precise forecast but a directional trend line. The imbalance between new build demand and fleet availability is widening, and unless structural changes are made, maintenance capacity will be further crowded out. The implication is stark: while the fleet can sustain today’s load, tomorrow’s may prove unmanageable without additional resources.
The projection reinforces the key lessons of 2025. First, installations dominate fleet activity and will continue to do so as cloud providers, telecom carriers, and hyperscale operators pursue massive new system builds. Second, maintenance remains steady but pressured, with fault-prone chokepoints like the Red Sea, Southeast Asia, and the Indian Ocean consuming disproportionate attention. Third, unclassified activity remains a blind spot, one that obscures the full picture of how the fleet is deployed. And fourth, depot reliance shapes global responsiveness, creating asymmetries in repair times and resilience across regions.
The vulnerabilities exposed in 2025 are magnified by this projection. If installation demands indeed rise to consume 60% of fleet time, repair response windows may lengthen further, particularly in regions far from depot hubs. With an ageing fleet and limited newbuild momentum, the risk of capacity shortfall grows sharper. Geopolitical instability adds yet another layer of unpredictability, as seen in the Red Sea disruptions this year.
Without strategic intervention, the imbalance between installations and maintenance will only deepen, threatening the resilience of global subsea connectivity. A major outage coinciding with multiple long-duration installations could stress the fleet beyond its ability to respond effectively.
Despite these risks, there are opportunities to rebalance. Regional operators—such as smaller companies maintaining local ships—are emerging as important resilience multipliers, adding capacity in underserved geographies. Technological advancements in cable monitoring, predictive fault detection, and automated repair equipment could improve efficiency and reduce downtime. And most importantly, newbuild invest-
Figure 49: Cableship Activity Projection, Future
ment remains a potential game-changer. Even a handful of new cable ships, strategically deployed, could tip the balance back toward sustainability.
As 2026 begins, the fleet stands at a critical juncture. The record of 2025 demonstrates that the current system can meet demand—but only barely, and only by operating at full stretch. The projection for 2026 suggests that without new resources, installation will dominate to an even greater degree, narrowing the space left for repairs. The fleet remains resilient, but that resilience is fragile, built on the assumption that failures will be manageable and demand predictable.
In sum, the data and projection for 2025–2026 depict a system under mounting strain. The accompanying chart highlights the imbalance: installations climbing, maintenance narrowing, and unclassified activity holding steady. If the industry is to maintain its role as the backbone of global communications, urgent decisions on investment, depot expansion, and operational transparency will be required. The fleet cannot afford to remain static in the face of accelerating demand.
6.2. FUTURE CABLE SHIPS
The past year has seen a surge of attention on the future of the global cable ship fleet, as both industry players and governments grapple with the capacity crunch and ageing profile of these highly specialized vessels. Unlike previous years, when newbuild announcements were sporadic and often limited to conversions, 2025 has brought a mix of new ship launches, high-level government subsidies, private investment, and a renewed industry conversation around modernization. Collectively, these developments suggest that while challenges remain, the sector is entering a pivotal period of fleet renewal.
One of the most significant stories of 2025 was Japan’s decision to subsidize NEC’s acquisition of its own fleet of ocean-going cable-laying vessels. Historically, NEC—Asia’s largest installer of subsea fiber systems—relied on leased tonnage, including a Norwegian vessel under charter, leaving the company exposed to availability gaps. The Japanese government, recognizing that 99% of the nation’s communications transit via subsea cables, concluded that this reliance was a national security risk.
Tokyo has therefore committed hundreds of millions of dollars to share the cost of up to two new vessels with NEC, each valued at ~$300 million. These newbuilds are expected to be delivered around 2027, providing Japan sovereign capability for the first time in this domain. Once in service, the ships will ensure faster emergency response, greater independence from foreign fleets, and more resilient connectivity for Japan and its Indo-Pacific partners. This marks a strategic shift: subsea cables are now officially framed as vital infrastructure tied directly to national defense.
Parallel to Japan’s national initiative, the SubOptic Association published a landmark report warning of a looming capacity crisis. According to the study, nearly half of the current global fleet will reach the end of its 40-year design life by 2040. At the same time, demand is projected to skyrocket: 1.6 million kilometers of new systems are forecast to be laid by that year—double the amount being retired. Annual repair activity is expected to grow by 36%, increasing the pressure on ships already stretched thin.
The report estimates that a minimum of $3 billion in new investment will be required simply to sustain repair capabilities and ensure service quality. It highlights how the industry’s massive investment in cables themselves contrasts sharply with the “sporadic and uneven” spending on the vessels required to build and maintain them. This warning has lent weight to calls for coordinated industry and government action to avert what some analysts describe as a looming chokepoint for the global digital economy.
Despite these challenges, 2025 also saw tangible fleet additions. NTT World Engineering Marine launched CS Vega II, a Philippine-flagged cable-laying vessel that expands its existing fleet of four. Crewed jointly by Filipino and Japanese engineers, the ship will focus primarily on the dense cluster of domestic and regional systems in and around the Philippines—one of the most cable-heavy regions in the world. This is a notable step for regional capacity, adding resilience in a geography that has often been underserved by the larger, transoceanic-focused fleets.
In addition, IT International Telecom completed the conversion of IT Infinity, formerly a platform supply vessel, into a fully equipped cable-laying ship. The conversion included a DP2 station keeping upgrade, a new HVAC system, accommodation for 32 crew, and installation of specialized cable-lay equipment such as a cable drum engine, plough system, and ROV support. This represents the continued importance of second-life conversions as a cost-effective way of adding capacity, even as purpose-built vessels remain prohibitively expensive.
Another 2025 milestone was the acquisition of Louis Dreyfus Armateurs (LDA) by InfraVia Capital Partners. With €1 billion earmarked to expand and modernize the fleet, this investment is expected to more than double the company’s tonnage. For subsea cables, this could translate into additional European-based cable-laying and support ships, accelerating modernization and strengthening supply chain resilience. The move reflects growing recognition among investors that cable ships are critical infrastructure assets, not merely specialized maritime tools.
Taken together, these developments suggest the start of a new era for the cable ship industry. For the first time in years, multiple pathways of renewal are converging: state-backed newbuilds (Japan, France, China), private equity investment (InfraVia/LDA), regional fleet expansions (NTT, Philippines), and continued conversions (IT Infinity). Yet the gap between projected demand and available capacity remains daunting.
If the $3 billion upgrade forecast by SubOptic is accurate, the few high-profile projects of 2025 may only scratch the surface of what is required. The next decade will therefore be pivotal. If industry and governments succeed in stimulating sustained investment in fleet renewal, the subsea cable sector will emerge more resilient and responsive. If not, the very ships upon which the global internet depends could become its weakest link.
“As subsea cable systems age and traffic demands grow, the need for responsive maintenance capacity remains constant. Vessels clustered near depots operate with high frequency, underscoring the strategic role of depot locations and resourcing in enabling rapid response”
Where in the
World Are All Those Pesky Cable Ships
(STF Issue 142)
6.3. SHORE-END ACTIVITY
6.3.1. CURRENT SHORE-END ACTIVITY
The deployment of shore-end landings remains one of the most important aspects of submarine cable development, as these facilities determine the geographic reach and resilience of global networks. Between 2021 and 2025, a total of 663 landings were recorded worldwide, distributed across all major regions. The pattern of activity highlights both the concentration of cable projects in regions with established infrastructure and the growing presence of new landing points in emerging markets.
Figure 50: Landing Distribution by Region, 2021-2025
EMEA (Europe, Middle East, and Africa) continues to lead in shore-end activity, with 211 landings, representing 31.83% of the global total. This share reflects the region’s role as a global connectivity hub, linking Europe with Africa, the Middle East, and Asia. The scale of EMEA’s landing activity also reflects the impact of several large-scale systems nearing completion during this period, particularly in Africa, where new cables are significantly expanding international bandwidth and route diversity. Compared to the prior reporting
cycle, EMEA has consolidated its position, underscoring its centrality in multi-regional network strategies. AustralAsia follows as the second-largest region, with 168 landings, or 25.34% of the total. This distribution underscores the continued importance of the Asia-Pacific as a driver of global demand for connectivity. The region’s geography, characterized by large numbers of islands and diverse coastal markets, necessitates numerous landing points to support intra-regional and transoceanic systems. Investments in Southeast Asia and the Pacific Islands in particular have increased landing density, reflecting a strategy to improve redundancy while meeting surging data demand.
The Americas account for 101 landings, or 15.23% of the total. While the region ranks third overall, its share has declined slightly compared to earlier years, reflecting a shift toward system upgrades and route diversification rather than rapid expansion of new landing sites. Many landings in the Americas focus on enhancing resilience—particularly in the Caribbean and along the U.S. East and West Coasts—where operators seek to ensure reliability against outages or faults.
The Indian Ocean region accounts for 86 landings, or 12.97% of the total. This represents one of the most notable shifts in recent years, as the region increasingly acts as a crossroads for cables linking Africa, Asia, and the Middle East. The rise in landing activity signals the growing importance of the Indian Ocean as a strategic transit zone, particularly as operators expand east–west systems designed to bypass congested or geopolitically sensitive chokepoints.
The Transpacific region has 56 landings, representing 8.45% of the global total. While lower in share compared to EMEA or AustralAsia, the region continues to hold strategic weight, as each landing supports some of the most data-intensive and technically complex systems in the world. Most landings are concentrated in East Asia and the U.S. West Coast, where high-capacity systems anchor the global internet’s largest traffic corridor.
The Transatlantic region accounts for 23 landings, or 3.47% of the total. Despite its relatively small number, these landings remain highly significant, as the Transatlantic continues to serve as the backbone for connectivity between North America and Europe. Much of the infrastructure here is mature, but ongoing landing development focuses on building diversity into routes, including systems connecting to southern Europe and North Africa.
“Extremely shallow coastal waters and intense, often uncontrolled marine activity—such as fishing and anchoring—have made the installation process more complex and costly. These factors raise the risk of cable damage during operation, leading to increased long-term repair and maintenance costs.”
Henry el Bahnasawy – Independent commentator (STF Issue 144)
Finally, the Polar region has seen 18 landings, representing 2.71% of the total. Although this remains the smallest regional share, the number is higher than in previous cycles, reflecting steady progress in Arctic connectivity initiatives. These projects remain technically challenging and capital-intensive, but interest continues to grow due to the potential for shorter routes between Asia, Europe, and North America.
Overall, the 2021–2025 distribution of shore-end landings underscores both continuity and change in global submarine cable deployment. EMEA and AustralAsia maintain their dominance, while regions like the Indian Ocean and Polar areas have seen measurable growth in activity. Together, these trends illustrate the continued expansion and diversification of global networks, with operators balancing the need for new routes, resilience, and coverage in both mature and emerging markets.
6.3.2.
FUTURE SHORE-END ACTIVITY
Looking ahead, shore-end landing activity is projected to continue its critical role in shaping the global
submarine cable landscape, but with notable shifts in regional distribution. Between 2024 and 2027, approximately 215 new landings are expected across seven key regions. This forward-looking deployment reflects operators’ focus on balancing route diversity, regional resilience, and the evolving demands of data-centric economies.
Figure 51: Landing Distribution by Region, Future
AustralAsia is projected to lead all regions, with 67 new landings representing 31.16% of the total. This reinforces the region’s long-standing dominance in global subsea connectivity, though its future share is expected to plateau compared with earlier cycles. While infrastructure in markets such as Australia, Singapore, and Japan is maturing, the need for expanded intra-Asian routes and additional Pacific island landings continues to drive activity. The strategic priority in the region is shifting from establishing connectivity to strengthening redundancy and ensuring resilience across multiple pathways.
The Americas follow with 45 landings (20.93%), highlighting the region’s continuing importance in linking both intra-continental and intercontinental systems. Although its future share shows a modest decline relative to earlier cycles, the Americas remain central for systems linking to Asia across the Pacific and to Europe and Africa via Transatlantic and Caribbean routes. Many of these landings are expected to be concentrated along the U.S. East and West Coasts, as well as in Latin America, where demand for hyperscale-driven connectivity continues to expand.
EMEA is expected to account for 33 landings (15.35%), underscoring its continued role as a hub for multi-regional connectivity. While the absolute number of landings is steady compared with recent cycles, its share is slightly lower, reflecting stronger growth in other regions. Much of this activity will center on southern Europe, North Africa, and the Middle East, where landings provide critical gateways between Europe and Asia and support the expansion of large-scale data center ecosystems.
The Transpacific region is forecasted to capture 30 landings (13.95%), reinforcing its position as one of the most strategically important corridors in the world. This represents a significant increase compared to prior reporting periods, reflecting renewed investment in long-haul systems designed to support rising intercontinental bandwidth demand. The growth of cloud infrastructure and hyperscale data flows across Asia and the Americas is driving this uptick, with operators prioritizing diverse landing points to mitigate risks from
natural hazards and geopolitical pressures.
The Polar region, while small in absolute terms, is expected to grow significantly, accounting for 20 landings (9.30%). This marks one of the largest proportional increases across all regions, as operators explore Arctic routes to create shorter and potentially more resilient global connections. Although projects in this region face unique engineering and environmental challenges, their inclusion in future plans reflects increasing interest in diversifying beyond established corridors.
The Transatlantic region is projected to add 14 landings (6.51%), continuing its steady role as a mature but vital corridor. Although it represents a smaller share of total future landings, this reflects the heavy concentration of capacity already present in the Atlantic basin. Future landings are expected to focus on route diversification—particularly toward southern Europe and West Africa—where they can complement existing systems and expand redundancy.
Finally, the Indian Ocean region will contribute 6 landings (2.79%). While representing the smallest share of future activity, these landings remain strategically important for linking Africa, South Asia, and AustralAsia. The lower figure compared to prior years reflects the recent surge of activity already undertaken in this corridor, with future development expected to focus on upgrades and targeted new routes rather than large-scale expansions.
Taken together, the projected distribution of shore-end activity for 2024–2027 illustrates both continuity and emerging shifts in global deployment priorities. AustralAsia, the Americas, and EMEA will remain central to the majority of planned activity, while the Polar and Transpacific regions show the strongest relative growth, reflecting the industry’s drive toward redundancy, diversity, and new intercontinental routes.
7. HYPERSCALERS & DATA CENTERS
7.1. HYPERSCALER ANALYSIS
7.1.1. CURRENT SYSTEMS IMPACTED
Since 2016, the ownership and development of submarine cable systems have steadily shifted toward Hyperscalers such as Google, Amazon, Microsoft, and Meta. These companies have increasingly prioritized building or co-owning infrastructure to support the global distribution of cloud services, content delivery, and interconnection of massive data center campuses. Where telecom operators once dominated as primary builders and owners, Hyperscalers now represent one of the most consistent sources of demand for new cable projects.
Figure 52: Systems Driven by Hyperscalers, 2021-2025
Between 2020 and 2024, Hyperscalers were responsible for driving 20 submarine cable systems, accounting for 25.64% of the 78 total systems during this period. While traditional telecom operators still account for the majority of builds, this share demonstrates the steady and growing influence of large-scale cloud and content companies in shaping global connectivity. In the 2019–2023 period, Hyperscalers ac-
counted for 24 out of 102 systems, or 23.5%. Although the absolute number is slightly lower in the most recent period, their proportional influence is higher, underscoring that Hyperscalers remain consistent participants even as overall project volumes fluctuate.
When examining year-by-year trends, the growth in Hyperscaler-driven systems is more pronounced. In 2021, only 3 such systems entered service, compared to 16 projects led by other actors. By 2022, the number of Hyperscaler-driven systems more than doubled to 7, increasing again to 11 in 2023, and reaching 13 in 2024. This reflects not just a rising number of projects, but also a growing consistency of participation: Hyperscalers are now involved every year, whereas in earlier periods their investments appeared more episodic.
This trend illustrates how Hyperscalers have become long-term strategic players rather than opportunistic participants. The increasing number of systems they sponsor, or co-sponsor is tied directly to demand for interconnection across global cloud regions, streaming platforms, and enterprise data ecosystems. Control over infrastructure offers several advantages: (1) the ability to design routes and landing points aligned with their data center footprints; (2) the capacity to allocate bandwidth flexibly without competing for limited leased circuits; and (3) resilience against supply constraints or geopolitical restrictions affecting vendor choice and route design.
The financial implications are also notable. Although constructing transoceanic cables typically requires investments exceeding $100 million per system, Hyperscalers view these expenditures as cost-saving over time. By internalizing connectivity rather than relying on leased capacity, they reduce long-term operational costs and gain scalability to match exponential growth in cloud usage. This shift also alters industry dynamics: traditional carriers increasingly act as partners or minority consortium members, while Hyperscalers assume the lead role in funding and technical design.
While Hyperscalers’ share of total systems remains around one-quarter, their influence on pricing, route development, and technical specifications far outweighs this percentage. For example, decisions made by Hyperscalers often dictate whether a project is viable, which suppliers are selected, and how capacity is marketed. This growing strategic role highlights the extent to which submarine cables are no longer simply
Figure 53: Systems Impacted by Hyperscalers by Year, 2021-2025
telecom infrastructure, but critical digital arteries tailored to the needs of the world’s largest data-centric enterprises.
7.1.2. FUTURE SYSTEMS IMPACTED
Looking forward, Hyperscalers are expected to account for a significantly larger share of upcoming submarine cable systems compared to earlier projections. Out of 48 systems currently planned, 17 are identified as Hyperscaler-driven, representing 35.42% of the total. This marks a clear increase over last year’s forecast, which anticipated Hyperscalers would drive only 26.47% of planned builds, and a more than doubling compared to the 14% projection made two years ago.
Figure 54: Systems Driven by Hyperscalers, Future
This upward trend underscores the sustained commitment of companies such as Google, Amazon, Microsoft, and Meta to investing directly in critical connectivity infrastructure. While overall market conditions have become more complex — with pressures from inflation, supply chain challenges, and shifts in global regulatory frameworks — Hyperscalers continue to deploy capital strategically to secure the global bandwidth required by their core businesses. Importantly, Hyperscaler-backed projects are more likely to move from planning into service than projects led by traditional carriers, due to the financial stability, large-scale demand, and internal financing structures these companies bring.
In terms of investment volume, Hyperscalers are projected to contribute approximately $14.59 billion to future cable systems, equating to 57.31% of the total projected $25.45 billion. This marks a major shift in the balance of industry financing: while Hyperscalers are responsible for just over a third of systems in number, their funding accounts for the majority of global investment. By contrast, non-Hyperscaler systems, though more numerous, represent only $10.86 billion or 42.69% of the total spend.
Hyperscalers are not only increasing system counts but reshaping the financial base of the global cable industry. Their funding minimizes project risk by securing financing early and speeds deployment by avoiding the long sales cycles traditional carriers face.
Historically, only about half of announced cable systems reach readiness for service. Hyperscaler-backed
projects, by contrast, typically move forward once the Contract in Force (CIF) milestone is met, resulting in far higher completion rates and reinforcing their position as the industry’s most reliable project drivers.
Figure 55: System Investment Driven by Hyperscalers, Future
Their growing investment ensures that key cloud and content routes — especially transoceanic and inter–data center links — continue to expand. Meanwhile, carrier-led systems may increasingly require Hyperscaler or government backing as funding gaps widen. This marks a structural shift: Hyperscalers have evolved from major customers to central architects of global connectivity.
Google, Amazon, and Microsoft remain the leading investors, with Meta maintaining selective but strategic involvement. While no new entrants are expected soon, their ongoing capital commitments ensure that Hyperscalers will define future priorities — focusing on route diversity, redundancy, and avoidance of geopolitical chokepoints.
In short, Hyperscalers will shape the next era of submarine networks more than ever before. Though they represent just over one-third of planned systems, their nearly 60% share of total investment highlights their dominance — accelerating timelines, setting new reliability standards, and consolidating influence over global network infrastructure.
“More than 400 submarine cables manage 99% of global internet traffic, with private investors and major technology companies controlling over 40% of the market; Lower Earth Orbit satellites provide fast services in underserved regions and can complement cables to reduce infrastructure risks.”
John
Hibbard & Paul McCann
Hibbard Consulting and McCann Consulting (STF Issue 143)
7.2. DATA CENTER GROWTH
Data center providers have become increasingly integral to the submarine telecommunications ecosystem in recent years. A major trend has been the strategic positioning of data centers and colocation facilities directly adjacent to submarine cable landing stations to enhance interconnection and optimize network performance. Placing data centers at cable landings is driven by the need for ultra-low latency and highspeed data transmission – closer proximity to where subsea cables come ashore can dramatically reduce network hops and latency. In practice, modern subsea cables are now often terminated inside carrier-neutral data centers at these hubs (rather than at remote beach manholes), effectively drawing cables “from data center to data center” across oceans. This configuration simplifies network architecture and improves reliability by aggregating international bandwidth in one place. It is especially advantageous at landing sites where multiple submarine cables converge, as a co-located data center can tap into all of them and provide customers with extensive interconnection options across many networks.
One prominent example is Marseille, France, which has solidified its role as a key global interconnection hub due to its strategic cable landing facilities. Marseille’s proximity to three continents has made it a gateway city for high-speed connectivity spanning Europe, Africa, the Middle East, and Asia. As of 2024, Marseille hosts around 16 international submarine cables (including the 45,000 km 2Africa cable that landed in late 2022), up from 13 cables just a few years prior. Data centers in Marseille – such as those operated by Digital Realty (Interxion) – directly house the termination equipment for these cables, giving them immediate access to enormous international capacity. This has attracted a large community of carriers, content providers, and cloud services to cluster in Marseille’s facilities. By one account, over 120 international and regional network operators and several Internet Exchanges are present at Interxion’s campus there, leveraging the city’s status as Europe’s telecommunications gateway to Asia, Africa and the Middle East. Customers benefit because from these landing-station data centers they can “land and expand” their traffic – receiving incoming intercontinental data and then instantly relaying it via low-latency backhaul to inland digital hubs like Paris, Frankfurt or London. In essence, locating data centers at cable landings creates a one-stop interconnection point, reducing transit costs and latency for international data flows.
This trend of pairing data centers with submarine cables is not limited to Marseille. Around the world, data center investment is clustering in coastal “gateway” markets. In North America, for instance, hubs like Virginia Beach (U.S.) and Hillsboro, Oregon (U.S.) have grown as they receive new Pacific and Transatlantic cables, and similar dynamics are seen in Asia (e.g., Singapore and Mumbai) and Africa (e.g., Mombasa). Data center developers and carriers are proactively expanding near these strategic landing points. Industry leaders Equinix and Digital Realty have continued to grow their portfolios in such locations, providing high-density interconnection platforms at the subsea edge of the network. Equinix in particular has opened new International Business Exchange (IBX) centers in Mediterranean markets like Lisbon, Genoa, and Barcelona to complement Marseille and offer alternative landing hubs. By establishing facilities at multiple cable endpoints, they can attract a broader customer base seeking resilient, low-latency connec-
tivity to global networks. The business case justifies the heavy capital outlay: despite the substantial cost of building and powering data centers (typically around $7–12 million per megawatt of capacity for new construction), proximity to undersea cables unlocks access to massive bandwidth and customers willing to pay for fast, direct connections. These factors have incentivized carriers and colocation providers – including smaller non-hyperscalers – to invest in markets close to cable landing stations, enhancing their competitiveness by becoming essential interconnection hubs in the international data chain.
Globally, data center capacity continues to expand at a record pace, underscoring the interdependence of the data center and submarine cable industries. 2024 saw an unprecedented boom in data center construction, and 2025 is on track to set new highs. Real estate firm JLL estimates that 10 GW of new data center capacity will break ground worldwide in 2025, with another 7 GW of capacity reaching completion during the year. This represents roughly a 15–20% annual growth rate in total installed capacity – a rate that is straining power grids and outpacing many earlier projections. Such growth is fueled by surging demand for cloud services, streaming, and AI applications, which in turn drives new submarine cable deployments to carry the traffic. The symbiosis between cables and data centers is tighter than ever: new cables require robust data centers at the landing points, and conversely, data centers flourish when fed by multiple high-capacity cables. This virtuous cycle is expected to continue, with each side spurring further investment in the other. By the end of 2025, analysts anticipate over 500 additional hyperscale and large colocation data center projects in the global pipeline (up from 440 a year earlier), many of them positioned in key landing station markets. In short, the submarine cable and data center industries are set to grow even more interdependent, jointly underpinning the next generation of global connectivity.
The global data center market is indeed experiencing remarkable growth, with hyperscale data centers driving much of the expansion. Hyperscale facilities – massive cloud and internet data centers owned by the likes of Amazon (AWS), Microsoft, Google, Meta, and Alibaba – crossed an important threshold in early 2024, surpassing 1,000 total sites in operation worldwide. By the end of 2024, the count of large hyperscale data centers had reached 1,136, and it continues to rise rapidly in 2025. This is more than double
Figure 56: Growth of Hyperscale Data Centers, 2017-2024)
the number of hyperscale sites just five years ago. Correspondingly, the aggregate capacity of hyperscale data centers (measured in megawatts of critical IT load) has doubled in under four years and is on track to double again in roughly the next four years according to Synergy Research. Each year is seeing on the order of 130–140 new hyperscale data centers come online – in 2024 alone, 137 new hyperscale facilities were activated. Crucially, not only are there more sites, but the average size of each new data center is increasing. The build-out of energy-hungry AI infrastructure is a prime reason: companies are deploying much larger server clusters (with thousands of GPUs) for training generative AI models, which require greater power and space. This has “supercharged” the scale of hyperscale campuses coming online in the past year.
The increasing reliance on AI is reshaping data center design and investment. Hyperscale operators are now routinely planning facilities exceeding 100 MW each to accommodate AI supercomputing needs – a stark jump from typical facilities a few years ago. These AI-focused builds feature higher rack densities and novel cooling systems to handle the heat output. NVIDIA’s latest AI chips, for example, consume up to 300% more power than their predecessors, driving the adoption of liquid cooling and other advanced thermal management in data centers. Many cloud providers have begun segmenting their infrastructure into AI-specific “training” data centers (sited near abundant power sources) versus more conventional “inference” or general-purpose data centers closer to end-users. Still, as core hyperscale campuses grow ever bigger, operators are also deploying an increasing number of smaller, distributed data centers to push services closer to customers at the edge. This bifurcation – mega-scale central facilities paired with satellite edge nodes – has become more pronounced in the last few years. The smaller facilities, often located in secondary cities or emerging markets, cache content and handle local traffic to further reduce latency for users, complementing the giant regional hubs.
Geographically, the distribution of hyperscale capacity remains uneven and highly concentrated in a few countries. The United States is by far the dominant home of hyperscale infrastructure – as of late 2024, the U.S. alone accounts for roughly 54% of the world’s total hyperscale data center capacity. This is more capacity than Europe, China, and the rest of Asia-Pacific combined. China and Europe each account for only about 15–16% of global hyperscale capacity (with the remainder in other regions). Within the U.S., Northern Virginia (specifically Loudoun County’s “Data Center Alley” and adjacent areas) remains the single largest hyperscale cluster on the planet – so much so that Northern Virginia along with the Greater Beijing area in China together make up around 20% of all global hyperscale capacity. According to Synergy’s latest rankings, just 20 metropolitan areas or states host 62% of the world’s hyperscale capacity, and 14 of those top 20 locations are in the U.S. Besides Northern Virginia, other leading hyperscale markets include Oregon and Iowa (ranked #3 and #4 globally, thanks to huge cloud campuses with access to cheap power), the Dallas/Fort Worth metro in Texas, and Ohio – as well as Dublin, Ireland (the one European market in the top ten), and Shanghai, China. In fact, Dublin is currently the only market in all of Europe to crack the top 20 list for hyperscale capacity – Frankfurt and Amsterdam, historically big colocation hubs, have slipped just outside the top 20 as their growth has been outpaced by faster-expanding U.S. and APAC markets.
“Content and cloud providers now account for more than 70% of international bandwidth usage…global demand has nearly tripled since 2019.”
Martin Reilly - MOFN feature (STF Issue 144)
Looking ahead, new hyperscale growth markets are beginning to emerge, which could gradually shift the global landscape. Within the U.S., the “center of gravity” for hyperscale development is expected to broaden beyond Northern Virginia to include more sites in southern and midwestern states that offer abundant land and power. Industry analysts note that factors like power availability, cost of energy, land prices, and tax incentives have become pivotal in site selection – sometimes outweighing proximity to traditional tech hubs. This favors certain less densely populated areas: for example, states such as Oregon, Iowa, Nebraska, and Georgia (each of which appears in the top 20 list) have attracted massive projects due to lower costs or utility incentives.
By contrast, some major world cities face constraints: London, Frankfurt, Tokyo, and others are grappling with grid congestion, scarce real estate, and permitting challenges, which temper their hyperscale growth. Outside the U.S. and China, countries poised for greater hyperscale investment include India, which has a booming cloud user base; Malaysia and other Southeast Asian nations; Spain (leveraging new cables and strategic location for Europe/Africa connectivity); and Saudi Arabia in the Middle East. These up-and-coming markets are expected to claim a bigger share of hyperscale deployments over the next 3–5 years, as the global cloud giants extend their footprint to reach new users. In 2024, hyperscalers already ramped up their capital expenditures to accelerate expansion into new regions – collectively spending over $200 billion on data center builds (a jump from roughly $150 billion per year in 2022–2023). Colocation providers are following suit by investing in those geographies, often in partnership with hyperscalers or to provide regional capacity for enterprises. This robust investment pipeline (with 535 future hyperscale sites reportedly in planning or construction worldwide as of mid-2025) suggests that double-digit annual growth in capacity will continue in the near term. In fact, Synergy Research projects that all regions will see at least 10%+ yearly growth in total data center capacity through 2030, with hyperscale cloud infrastructure growing on the order of 20% YoY globally.
Notably, hyperscale operators are capturing an ever-larger share of the overall data center market. As cloud adoption accelerates, the industry is witnessing a shift away from traditional enterprise-owned data centers toward concentration in big cloud and colocation facilities. As of early 2025, hyperscale data cen-
Figure 57: Regional Share of Hyperscale Capacity, 2024
ters (cloud and internet giants) account for about 44% of all installed data center capacity worldwide, up from roughly one-third just a few years ago. Correspondingly, the share of on-premises enterprise data centers has fallen to around 34% of total capacity and continues to decline. By 2030, current projections suggest hyperscalers will command nearly 60% of global data center capacity, while the enterprise onprem share may shrink to only 22%. (The remaining balance is capacity in multi-tenant colocation facilities, which is growing in absolute terms but will likely form a smaller percentage of the total pie.) In short, cloud giants and their hyperscale campuses are becoming the predominant form of data center infrastructure worldwide. Even enterprise IT workloads are increasingly being shifted to either cloud or edge colocation sites, except for certain niches requiring on-premises due to latency or data governance. One interesting nuance: after years of decline, enterprise-owned capacity saw a slight uptick in 2023–24 driven by AI and high-performance computing labs (some companies built private GPU clusters), but this does not alter the overall trend – hyperscale and cloud providers are expected to dominate new capacity additions through the end of the decade.
The breakneck expansion of data centers has heightened the industry’s focus on energy efficiency and sustainability. Power consumption by data centers is soaring as larger facilities and AI hardware come online – global data center power demand is forecast to double by the end of the decade if current trends continue. The need to balance this growth with environmental responsibility is driving a wave of innovation in how data centers are powered and cooled. Operators are investing heavily in renewable energy: hyperscale cloud firms have become some of the world’s largest corporate buyers of wind and solar power purchase agreements (PPAs), aiming to run their servers on carbon-free energy. For example, Nordic countries have become prime locations for new data center projects in part due to their abundant cheap renewable electricity (hydropower, wind) and naturally cold climate. The Nordics are “gearing up for a data centre gold rush” over the next five years, thanks to advantages like low-cost green power and investor-friendly regulations. Major operators such as Microsoft, Google, and Amazon have announced or opened large facilities in Sweden, Finland, and Denmark, leveraging those nations’ cooler temperatures for free cooling and their robust grids for clean energy. Regions like Scandinavia and the Pacific Northwest in the U.S. (e.g., Oregon) not only offer renewable-rich power grids (hydroelectric, wind, etc.) but also benefit from climate conditions that reduce cooling costs – making them attractive for sustainable expansion.
At the same time, data center engineering is increasingly oriented toward high efficiency. Almost all new hyperscale builds feature state-of-the-art cooling designs – including widespread adoption of liquid cooling for racks hosting AI chips – and advanced energy management systems. In many new facilities, liquid coolant circulation has become the default instead of traditional air cooling, because modern AI servers dissipate heat at levels that air cooling cannot handle efficiently. This allows operators to maintain higher densities with less energy overhead for cooling, thereby improving PUE (Power Usage Effectiveness) even as compute loads intensify. Operators are also exploring innovative power solutions to meet growing demand. There is rising interest in nuclear energy, for instance – both conventional nuclear and small modular reactors (SMRs) – as a potential long-term clean power source for energy-hungry data center campuses. In 2024 several hyperscale companies signed agreements tied to nuclear power supply, and more such deals are expected in 2025 as companies look to lock in reliable, carbon-free power for future facilities. (Notably, some U.S. data center operators even inquired about placing SMRs directly next to their data centers, though utilities note that practical deployment of on-site mini-reactors is still many years away.) Finally, governments and industry coalitions in places like the European Union are putting pressure on data centers to improve energy reuse – for example, by capturing waste heat from servers to warm nearby buildings – and to minimize water use in cooling.
In summary, the data center sector’s growth is showing no signs of slowing – if anything, it is entering an even more ambitious phase driven by cloud, AI, and ever-increasing digitalization. Analysts forecast a continued double-digit annual increase in global data center capacity for the next several years, along with a massive pipeline of projects across all regions. Hyperscale data centers will remain at the forefront of this build-out, enabling new technologies and services but also concentrating much of the world’s compute power in their facilities. This will further entwine the fate of submarine cables and data centers: as
hyperscale platforms expand to every corner of the globe, they will rely on high-bandwidth submarine links between regions, and those cables will in turn land in proximity to large data centers.
The next generation of digital infrastructure will thus be defined by strategic convergence – cables, cloud data centers, and terrestrial networks all coming together to deliver seamless global connectivity. The challenge ahead lies in managing this growth sustainably, through smart site selection (favoring low-impact locations), renewable energy, and innovation in cooling and power technology, so that the digital ecosystem can scale responsibly over the coming decade.
“A few key insights emerged: coastal redundancy was overserved; inland diversity undersupplied; competitors had superior scale but lacked route resilience; and new data centers under development in two interior cities presented emerging demand hotspots”
Nielsen – WFN Strategies (STF Issue 142)
Kristian
8. SPECIAL MARKETS
8.1. OFFSHORE ENERGY
Subsea fiber optic cables remain indispensable to the offshore energy sector, connecting remote facilities to high-capacity networks. Over the past year, both the offshore oil & gas industry and the offshore wind industry have expanded their use of subsea fiber communications to support operations in harsh, isolated environments. Notably, offshore oil & gas – traditionally the larger market for subsea telecom – continues to drive most demand, as data-intensive activities like drilling, seismic imaging, and real-time platform monitoring require robust connectivity. Meanwhile, the offshore wind sector is rapidly growing and starting to integrate fiber optics primarily for control, monitoring, and grid integration. This section reviews current developments in subsea fiber communications for offshore energy, emphasizing the oil & gas domain while also covering the emerging needs of offshore wind.
8.1.1. OFFSHORE OIL & GAS AND FIBER COMMUNICATIONS
In the offshore oil & gas sector, high-bandwidth, low-latency communications are critical for supporting complex platform operations (drilling, extraction, safety monitoring, logistics). Operators are increasingly adopting advanced fiber-optic networks to enable real-time data exchange and remote control of offshore installations (MarketsandMarkets, 2025). These fiber links provide the backbone for applications such as real-time equipment monitoring, high-definition video feeds, and automation systems, allowing onshore teams to supervise offshore facilities with minimal delay. The rising need for reliable, high-speed data across remote oilfields has driven robust growth in offshore communication infrastructure (MarketsandMarkets, 2025). In practice, fiber-optic cables are often complemented by 4G/5G wireless networks on the platforms, but it is the fiber to shore that ensures the bulk data can be transmitted for cloud-based analytics, IoT sensors, and other digital oilfield applications (MarketsandMarkets, 2025).
Recent expansions of subsea fiber networks underscore their importance for oil & gas. In the Gulf of Mexico, specialized telecom operators have now deployed around 1,500 km of subsea fiber, connecting roughly 20 deepwater platforms to onshore landing stations (Tampnet, 2025). For example, a new 200 km fiber extension was awarded in 2025 to link the Woodside–Pemex Trion project in Mexican waters to shore, enabling that deepwater field to be operated and monitored from an onshore control center in real time (Tampnet, 2025). In Brazil, Petrobras’s major Malha Óptica initiative is rolling out a 440 kilometer subsea fiber system to modernize communications in the Campos Basin, connecting 12 offshore production platforms with two onshore stations (Offshore Mag, 2024). This system, coming online in 2025, will greatly enhance data capacity for Brazil’s most important oil fields, linking them directly to onshore operation centers for improved safety and efficiency (Offshore Mag, 2024). Similar upgrades are occurring in other regions like the North Sea and Middle East, as operators replace legacy satellite or microwave links with fiber to achieve higher throughput and more reliable connectivity.
The benefits of fiber-optic communications for offshore oil & gas are evident in day-to-day operations.
High-capacity fiber links allow experts on land to conduct remote inspections (through sensors or even robots) and oversee drilling or production adjustments without needing to be physically present on the platform. This reduces the number of personnel required offshore and enhances safety. For instance, the fiber connection to the Trion field will enable remote operations, safety oversight, and even virtual training from Woodside’s onshore facility in Mexico (Tampnet, 2025). Oil companies are increasingly leveraging such links to implement “digital twins” of their platforms and subsea equipment, gaining live data feeds that support predictive maintenance and quick decision-making. As one industry leader noted, when it comes to data speed, reliability, and scalability, “no other technologies can compete with fibre optics,” which is why offshore projects focused on safety, low carbon emissions, and efficiency consistently “invest in fibre to shore.” (Tampnet, 2025) Fiber’s virtually unlimited bandwidth and low latency compared to satellite make it the preferred option for real-time analytics, big data transfers (such as seismic survey data or high-resolution video), and critical control signals. In short, fiber-optic networks form the digital backbone of the modern offshore oilfield, enabling initiatives in automation, AI-driven analytics, and the Internet of Things to be fully realized in remote ocean locations (MarketsandMarkets, 2025).
8.1.2. EXPANSION OF OFFSHORE WIND AND FIBER COMMUNICATIONS
While oil & gas remains a dominant driver of subsea telecom demand, the offshore wind industry’s rapid growth is creating a new frontier for fiber communications. Global offshore wind capacity has been expanding at an unprecedented pace – roughly tripling from about 29 GW in 2020 to over 75 GW by the end of 2023, and reaching 83 GW in 2024 (Business Norway, 2024), (GWEC, 2025). Projections indicate this growth will continue aggressively, with analysts forecasting on the order of 400–500 GW of offshore wind worldwide by the early 2030s (Business Norway, 2024), (GWEC, 2025). Europe still leads the market (with the UK, Germany, the Netherlands and others at the forefront), but China has now emerged as the single largest player, accounting for roughly 50% of global installed offshore wind capacity (Business Norway, 2024). New markets are also coming online in the Asia-Pacific and North America – for example, the United States has set a target of 30 GW by 2030 and began installing its first large-scale projects, while countries like South Korea and Japan have ambitious plans for offshore wind deployments (Business Norway, 2024). This worldwide surge in offshore wind farms is driving demand for reliable communications to manage the far-flung arrays of turbines.
In offshore wind farms, fiber-optic cables are integrated mainly for control, monitoring, and grid integration rather than heavy data transfer. Typically, fiber strands are built into the submarine power cables that link turbines to offshore substations and bring power to shore. These fibers carry the Supervisory Control and Data Acquisition (SCADA) signals, protective relay communications, and other telemetry needed to operate the wind farm (Roy, 2023). In fact, virtually all modern wind farms use optical fiber to connect the turbines’ control systems back to the central platform or onshore control center (Roy, 2023). This allows operators to monitor turbine performance in real time (e.g., rotational speed, power output, vibration), remotely control turbine settings, and coordinate the farm’s output with the onshore grid. The bandwidth requirements per turbine are modest – mainly sensor data and control commands – especially compared to an oil platform streaming video or seismic data. However, the scale of wind projects (often dozens or hundreds of turbines spread over a wide area) means a robust communication network is still critical. As offshore wind farms grow larger and are installed farther from shore, reliable fiber communications become essential to maintain control and safety. Fiber ensures that even far-off turbines (including future floating wind turbines in deep water) can be supervised continuously despite distance or harsh weather. It also enables remote diagnostics and software updates for turbines, reducing the need for maintenance vessels to make frequent trips. Overall, fiber-optic connectivity in offshore wind underpins the farm’s operational efficiency and stability – from transmitting SCADA data to enabling quick fault detection in subsea cables via distributed fiber sensors (Roy, 2023). Given the massive expansion projected (with the industry expecting dozens of gigawatts of new capacity annually toward 2030 (GWEC, 2025)), the installation of fiber communications for offshore wind is set to accelerate, ensuring these renewable energy installations have the same level of network reliability as other critical infrastructure.
8.1.3. INTEGRATION OF OFFSHORE OIL, GAS, AND WIND INFRASTRUCTURE
As the offshore energy sector evolves, there is growing interest in hybrid energy systems that integrate oil & gas platforms with offshore renewables like wind. Such integration can include sharing subsea infrastructure (power cables, communications links) and even direct power supply from wind turbines to oil & gas facilities. Fiber optics will be the nervous system of these integrated networks, enabling unified monitoring and control across different energy assets. One prominent example is the Hywind Tampen project in the North Sea – the world’s largest floating offshore wind farm – which was built specifically to provide electricity to nearby oil and gas platforms (Business Norway, 2024). This 88 MW floating wind farm, located ~140 km off Norway, now supplies power to several petroleum production platforms (in the Snorre and Gullfaks fields), helping to cut their carbon emissions by an estimated 200,000 metric tons per year (Business Norway, 2024). The hybrid setup relies on subsea cables that carry both power and communication signals, allowing the wind farm and the oil platforms to operate in sync. For instance, fiber-optic communications link the wind farm’s control system with the oil installations and onshore control centers, so that power flow and platform electricity demand can be balanced in real time.
More broadly, oil & gas companies looking to decarbonize their offshore operations are exploring co-locating renewable energy sources or battery storage with their rigs. Some projects propose using excess wind power to run platform equipment or to generate green hydrogen at sea. These scenarios will depend on high-speed data links: a common fiber network could connect turbines, gas platforms, and onshore grids into one integrated system. By sharing communications infrastructure, an operator can manage multiple energy assets from a single control room – for example, simultaneously overseeing a wind farm’s performance and an oil production platform’s processes via unified fiber-optic telemetry. This kind of integration promises cost savings (sharing cables and facilities) and improved sustainability (using renewables to power fossil-fuel operations), but it also elevates the importance of a resilient communications backbone. Fiber optics provide the secure, high-bandwidth channel needed to coordinate such complex interdependent systems, ensuring that whether it’s a wind turbine or a gas compressor, each component can be monitored and controlled as part of one large network. As hybrid offshore energy parks become more common (especially in regions like the North Sea), we can expect fiber networks to expand in tandem, effectively blurring the line between “telecom cable” and “power cable” in the offshore domain.
8.1.4. FUTURE OUTLOOK AND CHALLENGES
Looking ahead, the demand for subsea fiber communications in offshore energy is poised to grow significantly. Both oil & gas and offshore wind are pushing further offshore and relying more on digitalization, which will require ever-more extensive communication networks. Industry forecasts project steady growth in the oilfield communications market (nearly 8% annually through 2030), driven by the need for reliable, high-speed data links in remote operations (MarketsandMarkets, 2025). Similarly, the continued build-out of offshore wind – with hundreds of new turbines to be connected each year – will entail a parallel buildout of fiber connectivity. However, there are several challenges and uncertainties that could influence the pace of these developments:
• Oil & Gas Sector Uncertainties: The oil & gas industry faces cyclical and geopolitical risks. Fluctuating oil prices can impact capital spending on infrastructure like telecom cables – a prolonged price downturn might delay fiber network investments if companies cut costs. Additionally, regulatory pressures to reduce carbon emissions could change offshore development plans, while geopolitical events (territorial disputes or sanctions) might restrict operations in certain regions. These factors create a cautious environment for long-term investments, even as the need for digital connectivity grows. Nonetheless, the drive for efficiency and safety means that most new offshore projects are likely to include fiber communications from the outset, as it’s seen as mission-critical infrastructure rather than an optional add-on.
• Offshore Wind Headwinds: Despite positive long-term growth projections, the offshore wind sector has encountered near-term challenges including supply chain bottlenecks, rising costs,
and policy uncertainty. In 2023–2024, several government power auctions in established markets failed or saw weak participation due to cost inflation and unclear subsidy frameworks, and key turbine manufacturers struggled with backlogs and component shortages (GWEC, 2025). These issues have led to a slight downgrading of short-term offshore wind installation forecasts (GWEC, 2025). Fewer or delayed wind projects in the immediate future could slow down the rollout of new subsea fiber links that would have accompanied those farms. Furthermore, offshore wind developers are grappling with grid connection delays and permitting hurdles, which in some cases postpone the need for communication cables until projects get on track (GWEC, 2025). Overcoming these hurdles will be essential for the industry to resume its rapid growth, and by extension, for the expansion of its supporting fiber-optic networks.
• Infrastructure Resilience: As offshore communications networks become more extensive, ensuring their resilience and security is paramount. Subsea cables face hazards from anchors, fishing activities, and even potential malicious interference. In the wind sector, for instance, cable failures (whether due to mechanical stress or external damage) have been a leading cause of project downtime and insurance claims (Roy, 2023). A severed fiber cable to an oil platform or wind farm can instantly cut off vital data flows. To mitigate this, operators are investing in cable protection measures, redundancy (backup links or alternate routing), and advanced monitoring – for example, fiber sensing technologies that can detect and locate cable disturbances in real time. There is also increasing attention on cybersecurity for these networks, since they carry operational commands for critical energy infrastructure. Building robust, redundant, and secure fiber systems will be a continuing challenge as the offshore energy communication web grows larger and more interconnected.
Despite these challenges, the long-term outlook for subsea fiber in offshore energy remains very positive. Both industries recognize that high-capacity, reliable communications are no longer a luxury but a necessity for modern operations. The push toward real-time data, automation, and remote operation will only intensify in the coming years, making fiber-optic cables as fundamental to an offshore project as pipelines or power cables. Indeed, technologies like edge computing, AI analytics, and remote-controlled robotics are beginning to feature in offshore operations – all of which depend on solid connectivity. In the offshore wind realm, larger farms and new technologies (e.g., energy islands, floating turbines) will require even more sophisticated network solutions to maintain control over widely distributed assets. In the oil & gas realm, digital oilfield initiatives will extend to more fields, with fiber enabling onshore experts to be virtually present on offshore platforms 24/7.
In conclusion, subsea fiber-optic networks will continue to form the communications backbone of offshore energy infrastructure. They enable efficiency gains, safety improvements, and the integration of cleaner energy sources by providing the fast, dependable links that tie it all together. As offshore oil & gas and wind projects both expand and increasingly intersect, the demand for these high-bandwidth connections is set to rise unabated. The coming decade will likely see further innovation in how we deploy and utilize subsea fiber – from smarter cable designs to multi-use cables serving power and data – ensuring that even in the most remote oceans, energy operations stay connected in real time to the rest of the world.
“Telecom cables, wind-farm array cables, HVDC and HVAC export cables, oil & gas pipelines, umbilicals and CO₂ pipelines often share corridors and shore approaches; pinch points such as busy fishing grounds, anchorages and fairways create concentrated risk, so cross-sector situational awareness benefits both telecom and energy operators”
Anders Tysdal – Tampnet (STF Issue 144)
8.2. UNREPEATERED SYSTEMS
An unrepeatered cable system is defined by the absence of submerged repeaters between landing stations, allowing optical signals to traverse the full span without intermediate amplification. Typically, these systems are constrained to distances under 250 kilometers, though a few projects have successfully extended beyond that range. Their appeal lies in several key advantages: lower capital expenditure, simplified design and deployment, and faster implementation where shorter connections meet regional needs. They can also accommodate higher fiber counts, and when configured in festoon arrangements, they enhance redundancy and resilience for coastal networks. These traits continue to make unrepeatered systems a compelling option for specialized applications, even as the global market increasingly emphasizes long-haul, repeatered networks.
Between 2021 and 2025, the number of publicly announced unrepeatered cable systems has declined compared with earlier periods. A total of 23 systems have been publicly announced for deployment during this five-year span, versus 26 in the previous cycle. The trend was front-loaded, with eight systems each announced in 2021 and 2022. By comparison, only four systems were announced in 2023, with projections of one in 2024 and two in 2025. This pattern highlights a tapering trend, as annual announcements have fallen from near double digits early in the cycle to very low single digits by the mid-2020s. Unlike the steadier rhythm of announcements seen in the preceding period, the 2021–2025 window reflects greater volatility and a sharper slowdown in unrepeatered system development activity.
“Unrepeatered systems may lack the glamour of their repeatered counterparts, but their simplicity, flexibility, and cost-effectiveness make them indispensable to the digital infrastructure of many regions.”
Tony Frisch, Anders Ljung & Lynsey Thomas (STF Issue 143)
This decline may suggest that the core markets for unrepeatered systems—particularly shorter coastal connections—may be reaching saturation, or are experiencing difficulty with financing. In many mature regions, the most critical festoon and short-haul networks have already been built, leaving fewer opportunities for new systems. The timing also reflects a global reorientation toward repeatered cables, which better align with surging demand for high-capacity, long-haul routes. Nevertheless, the persistence of a small number of unrepeatered builds each year shows that they remain essential for filling in connectivity gaps. The outlier years, such as 2021 and 2022, likely reflect the commissioning of multi-segment festoon systems, where one large project generates several entries in annual counts.
Regional distribution further emphasizes the importance of unrepeatered systems in certain geographies. EMEA continues to dominate, with 12 of the 23 systems—over half the global total—laid between 2021 and 2025. This is broadly consistent with the previous reporting cycle, when EMEA also led with roughly twothirds of global unrepeatered builds. The region’s geography explains much of this trend: extensive coastlines, numerous mid-sized markets, and a need for festoon systems around the Mediterranean and North Sea. AustralAsia ranks second with 5 systems, or 22% of the total. Its consistent share demonstrates the continued reliance on unrepeatered infrastructure for inter-island connectivity, particularly across Southeast Asia and the Pacific. The Americas added 4 systems, representing 17%, down slightly from the prior cycle. Meanwhile, the Indian Ocean recorded 2 systems, a modest 9%, but notable for an area that previously contributed little to this category.
Figure 58: Unrepeatered Systems by Year, 2021-2025
The comparison with previous cycles highlights how regional priorities are shifting. While EMEA’s dominance is unchanged, the Americas’ decline suggests that coastal festoon networks there have matured, reducing the need for new unrepeatered builds. AustralAsia’s steady participation indicates the ongoing relevance of unrepeatered cables in geographically fragmented markets. The emergence of the Indian Ocean, though small in absolute terms, reflects a diversification of demand, with unrepeatered cables now being deployed in areas previously considered marginal. This broadening of regional participation underscores the specialized but still necessary role of these systems.
When measuring total kilometers of unrepeatered cable installed, the picture becomes more nuanced. In 2021, 6,800 kilometers of unrepeatered cable were deployed—an extraordinary total that dwarfs all other years in the cycle. This spike likely corresponds to a handful of large festoon systems linking multiple coastal nodes, where cumulative kilometers rise quickly even though individual links remain short. In 2022, 3,200 kilometers were installed, again well above the average for unrepeatered builds. By contrast, 2023 saw only 1,100 kilometers added, one of the lowest figures of the period. Projections for 2024 and 2025 indicate 1,900 kilometers and 4,000 kilometers, respectively. This uneven pattern demonstrates that kilometer totals are more sensitive to the presence of large-scale festoon projects than to overall system count.
Figure 59: Unrepeatered Systems by Region, 2021-2025
Comparing with the 2020–2024 cycle, the sharp peaks in 2021 and 2022 mirror earlier years when major festoon projects inflated kilometer counts. However, the long-term trend points downward: even with periodic spikes, the average annual kilometers installed are lower than in past cycles. This suggests that while unrepeatered systems are not disappearing, they are increasingly confined to specific regional or project-driven needs. The volatility in deployment also highlights the reliance of the unrepeatered market on a few large projects, as opposed to the steadier, more predictable growth of repeatered systems.
Investment patterns provide another angle. Between 2021 and 2025, total investment in unrepeatered systems has been heavily skewed toward the Americas, which account for $612 million, or nearly half the global total. This is striking given that the Americas deployed only 4 systems in the period. The implication is that projects in the region are significantly more expensive on a per-system basis, likely due to longer coastal spans, higher fiber counts, or greater requirements for armoring and burial. EMEA, despite leading in system count, invested only $254 million (20%), reflecting a large number of smaller-scale builds. AustralAsia invested $225 million (18%), consistent with its role in inter-island projects, while the Indian Ocean contributed $188 million (15%).
Figure 60: Unrepeatered KMS by Year, 2021-2025
The disparity between system counts and investment underscores the dual nature of the unrepeatered market: some regions deploy numerous small, relatively inexpensive systems, while others focus on fewer but capital-intensive projects. Compared to the previous cycle, the Americas have increased their share of investment even as their system count has declined, showing a shift toward higher-value projects. EMEA’s lower investment per system reflects the efficiency of its festoon builds, while AustralAsia’s steady investment highlights ongoing needs across fragmented geographies. The Indian Ocean’s 15% share is notable, marking its emergence as a legitimate participant in the unrepeatered segment.
Looking ahead, the pipeline of planned systems remains modest but regionally diverse. Eight new unrepeatered systems are expected, led once again by EMEA with 4 systems, or half of the total. The Americas are projected to add 2 systems, reflecting a continued if selective role for unrepeatered projects in the region. AustralAsia and the Indian Ocean will each add 1 system, accounting for 12.5% each. This planned distribution suggests that the market will remain steady, with small but regionally significant deployments continuing in line with historical patterns.
Figure 61: Unrepeatered Investment by Region, 2021-2025
Compared to prior outlooks, the planned pipeline is smaller, suggesting that the major opportunities for unrepeatered projects may already have been addressed. However, the regional balance points to resilience: EMEA remains the anchor of the market, the Americas continue to play a capital-intensive role, and AustralAsia and the Indian Ocean sustain participation based on local geographic needs. This balance illustrates that unrepeatered systems will remain relevant, but increasingly as niche solutions rather than a growth driver.
In summary, unrepeatered systems have entered a phase of stabilization, with fewer overall deployments but continued regional importance. The data from 2021–2025 show declining system counts, volatile kilometer totals, and highly uneven investment patterns. EMEA dominates by number of builds, while the Americas dominate by capital outlay, and AustralAsia and the Indian Ocean sustain smaller but steady shares. Looking forward, the limited pipeline confirms that unrepeatered systems will continue to play a specialized role, particularly in coastal and inter-island markets, even as the industry overall prioritizes long-haul, repeatered capacity.
Figure 62: Unrepeatered Planned Systems by Region
8.3. SUSTAINABILITY YEAR IN REVIEW
In 2025, the global subsea cable industry’s relationship with sustainability grew deeper, broader, and more urgent. Building on the momentum of 2024, when the conversation shifted from aspiration to implementation, this year saw measurable progress in the development of standardized metrics, the deployment of greener technologies, and the institutionalization of sustainability as part of global digital infrastructure planning. At the same time, new challenges emerged. The unprecedented growth in energy demand driven by artificial intelligence, the persistence of geopolitical instability, and the complexities of marine regulation forced industry stakeholders to confront the limitations of existing approaches and to consider bolder, more collaborative solutions.
The year’s sustainability milestones reflected three interconnected realities: first, that climate change is no longer a distant pressure but a present force shaping how and where cables are deployed; second, that digital infrastructure can only expand responsibly if it embraces both circular practices and measurable performance; and third, that the next generation of professionals will play an outsized role in ensuring that environmental responsibility is embedded into the industry’s culture as well as its operations.
8.3.1. POWERING DIGITAL INFRASTRUCTURE SUSTAINABLY
Energy sourcing remained one of the central issues in 2025. As data centers continue to anchor global networks and demand grows with AI, 5G, and cloud computing, the subsea cable industry has increasingly found itself drawn into debates once confined to terrestrial operators. At PTC’25, the message was clear: without a comprehensive strategy for green energy, the digital infrastructure sector will struggle to meet demand at all, let alone sustainably.
The “Bring Your Own Power” (BYOP) movement, introduced in earlier years, expanded considerably. The approach, which emphasizes building on-site microgrids, offers a way to reduce reliance on fragile or overburdened national grids. In the United States, microgrids are increasingly viewed as a hedge against both high grid costs and climate-related instability. By generating power locally, data centers and cable landing stations can not only reduce emissions when renewable sources are used but also improve operational resilience. Some operators even suggested that surplus power could be resold back to the grid, effectively turning infrastructure into both a consumer and producer of clean energy.
Beyond microgrids, the discussion at PTC’25 reflected a widening spectrum of potential solutions. Nuclear energy, particularly small modular reactors (SMRs), was highlighted as a potential “gamechanger.” Unlike traditional nuclear plants, SMRs promise faster deployment and smaller footprints, but they remain years away from broad commercial adoption. In the interim, natural gas—particularly when paired with carbon capture—was framed as a transitional measure. Though not carbon neutral, gas-fired plants can provide reliable baseload power, buying time as renewables scale up.
Still, the strongest emphasis fell on renewables. Panelists pointed to the growing role of wind, solar, and geothermal power in supporting both data centers and cable stations. Claudia Masset of Schneider Electric argued that renewable procurement is not an optional supplement but a structural necessity, insisting that without sustainable power the sector cannot hope to keep pace with demand. This sentiment was echoed by executives from AdaniConneX and Firma-Rise, who emphasized the need for holistic, regionally adaptable solutions that blend renewables with transitional technologies while aligning with both market forces and government regulation.
Compared to 2024, the tone of the conversation was markedly more urgent. Whereas last year’s discussions often framed sustainability as an opportunity, 2025’s panels reflected a growing recognition that without sustainable power strategies, growth itself may be constrained. This shift marks an inflection point: sustainability is no longer framed as an external pressure but as a prerequisite for industry viability.
8.3.2. BUILDING SUBSEA RESILIENCY
If power dominated conversations about sustainability on land, resiliency defined discussions at sea. The events of 2024 had demonstrated how vulnerable global communications remain: three cables in the Red Sea were severed in a single incident, accidental breaks in the Baltic highlighted risks from shipping, and outages in Africa disrupted communication and banking systems. These events reverberated through 2025, shaping how the industry approached both sustainability and resiliency.
Resiliency is often defined narrowly as redundancy—building more cables, landing stations, and diverse routes to mitigate single points of failure. But in 2025, the industry began to view resiliency more holistically, linking it directly to sustainability. Emergency repairs require vessels, fuel, and often environmentally disruptive interventions, which increase emissions and put further strain on marine ecosystems. By investing in redundancy and better planning upfront, operators can reduce not only downtime but also the ecological and economic costs of repair.
At PTC’25, panelists emphasized the growing role of governments in shaping resiliency. Regulators, once largely uninvolved in subsea projects, are now far more engaged, introducing oversight that aims to protect national security and environmental interests. Ryan Wopschall of the International Cable Protection Committee noted that while this oversight reflects the increasing importance of subsea infrastructure, it has also lengthened permitting timelines and complicated project execution. In regions such as Africa and the Pacific, where resilience depends on the addition of new routes, regulatory delays pose particular risks.
Satellites were also highlighted as critical to resiliency, especially for regions dependent on a single subsea system. In Pacific Island nations, satellites are often the only viable backup, providing redundancy during outages. While satellites cannot match the capacity of fiber, they are increasingly recognized as essential partners in ensuring continuity of service. This perspective reflects a shift from seeing subsea cables and satellites as competitors to recognizing them as complementary parts of a resilient global system.
Geopolitics loomed large in these discussions. Panelists acknowledged that diversifying routes often requires navigating politically sensitive waters, such as the South China Sea, where tensions complicate both permitting and security. Here again, resiliency and sustainability overlap: geopolitical obstacles can force longer routes, which raise costs and environmental impacts, while instability increases the risk of deliberate cable damage. The challenge for operators is to balance efficiency, environmental stewardship, and security in an increasingly complex global landscape.
8.3.3. REGULATION, RECOVERY, AND CIRCULAR PRACTICES
One of the most significant shifts in 2025 was the growing emphasis on circular economic practices. Cable recovery and recycling, long discussed in theory, are increasingly being treated as essential components of sustainability. At PTC’25, research presented by undergraduate teams and industry scholars highlighted both the potential and the obstacles of recovery.
On one hand, recovery offers clear environmental benefits. By removing decommissioned systems, operators reduce seabed clutter, minimize long-term ecological risks, and lower the demand for new raw materials. Recovered cables can be recycled for valuable metals, reducing extraction pressures elsewhere. On the other hand, recovery is complicated by regulation. Environmental impact assessments, designed to protect marine ecosystems, can make recovery more difficult to approve even when its net benefits are clear. Marine biodiversity protections sometimes leave uncertainty about whether cables can be removed from sensitive zones. Import and export regulations add logistical hurdles, in some cases forcing operators to ship recovered materials along longer routes that increase emissions.
These challenges underscore a paradox at the heart of sustainability regulation: frameworks designed to protect the environment can, at times, hinder practices that would reduce ecological footprints. The task for the industry is not to circumvent these protections but to collaborate with regulators to streamline processes, ensuring that recovery can occur responsibly and efficiently.
Companies such as Mertech Marine have already demonstrated models for cable recycling that integrate both environmental responsibility and economic viability. By establishing remote processing facilities close to recovery sites, they reduce transport-related emissions while creating local economic value. Such approaches illustrate how circular practices can align with broader sustainability goals if regulatory frameworks are adapted to support them.
In 2025, cable recovery moved closer to the center of sustainability discourse. It is increasingly seen not only as a technical challenge but as a cultural one: a test of whether the subsea industry can embed circularity into its identity rather than treat it as a marginal activity.
8.3.4. ADVANCING SUSTAINABILITY METRICS FOR CLSS
Perhaps the most consequential sustainability milestone of 2025 was the publication of the Report on Best Practices in Cable Landing Station Sustainability. Produced by the SubOptic Foundation, the report represented the culmination of a two-year research effort and marked the first time the industry has attempted to standardize sustainability metrics for CLSs.
Based on a survey of approximately 150 facilities worldwide, the report highlighted significant gaps in current practice. Carbon emissions are rarely tracked comprehensively and almost never disaggregated by Scopes 1, 2, and 3. Electricity usage, though often monitored, is not measured at the resolution needed to calculate key metrics. Ownership and colocation models create additional complexity, as data is not always shared between operators.
“Subsea
telecommunication cables carry over 99% of digital data traffic worldwide and span more than 1.6 million km; about a quarter of recorded cable faults between 1965 and 2019 were due to natural hazards such as earthquakes, volcanic eruptions and submarine landslides.”
To address these challenges, the report recommended adopting four core metrics from the data center industry: Power Usage Effectiveness (PUE), Carbon Usage Effectiveness (CUE), Water Usage Effectiveness (WUE), and Renewable Energy Factor (REF). These metrics, when applied consistently, provide a framework for benchmarking performance, identifying inefficiencies, and tracking progress over time. Importantly, the report emphasized that metrics must be paired with absolute figures—kilowatt-hours consumed, tonnes of carbon emitted, and cubic meters of water used—to prevent misleading comparisons.
Dr Lucy Bricheno, Dr Mike Clare & Dr Isobel Yeo National Oceanography Centre (STF Issue 141)
The report also called for the adoption of continuous improvement cycles. By establishing baselines, implementing upgrades, and re-measuring performance, CLS operators can build sustainability
into their daily operations while also reducing costs and improving resilience. This approach reflects lessons learned from the data center industry, where similar cycles have driven significant efficiency gains over the past decade.
What made the report significant was not only its technical recommendations but its symbolic value. By treating CLSs as focal points of sustainability, the industry has begun to move from high-level commitments to operational practices that can be measured, compared, and improved. For many, the report represents a turning point, laying the groundwork for a new era of accountability and transparency.
8.3.5. EDUCATION, RESEARCH, AND THE NEXT GENERATION
In 2025, the role of young professionals in shaping sustainability became more visible and influential than ever before. The Sustainable Subsea Networks (SSN) team at the University of California, Berkeley expanded its presence, presenting research at PTC’25 on topics ranging from cable recycling to satellite governance. Their work not only advanced technical knowledge but also highlighted the importance of academic-industry collaboration.
Equally significant were the educational initiatives launched in 2025. UC Berkeley introduced the first undergraduate Certificate in Global Digital Infrastructure, an interdisciplinary program that integrates environmental studies, engineering, and policy. The program is designed to broaden access to the field, enabling a new generation of students from diverse backgrounds to enter the industry with sustainability as a core competency.
The SSN team also developed and taught the “Building a Sustainable Internet” course, which grew from 30 students in its first semester to over 100 in its second. The course exposes students to the environmental and geopolitical dimensions of digital infrastructure, ensuring that sustainability becomes a default part of how future professionals think about subsea cables and data centers.
Beyond the classroom, the team launched the Byte-Sized podcast in collaboration with Data Center Dynamics. By translating conference discussions into accessible conversations, the podcast extends the reach of sustainability dialogue beyond industry insiders. It reflects a recognition that awareness and education are critical for building cultural as well as technical change.
The involvement of students and early-career professionals has had a tangible impact on the industry. Their contributions at conferences are no longer treated as symbolic gestures but as substantive inputs to ongoing debates. In many cases, they have introduced fresh perspectives that challenge entrenched practices and broaden the scope of sustainability discourse. This generational shift ensures that environmental responsibility will remain a central part of the industry’s culture moving forward.
8.3.6. OUTLOOK: STANDARDIZATION AND COLLABORATION
Looking forward, the subsea cable industry’s sustainability journey will depend on its ability to transform frameworks into standards and aspirations into outcomes. The adoption of CLS metrics represents a major step, but the real challenge lies in consistent implementation across regions and operators. Regulatory harmonization will be equally important, particularly in enabling circular practices like cable recovery.
The broader context of 2025 suggests that sustainability and resiliency are now inseparable. A sustainable subsea industry is one that not only reduces emissions but also withstands disruptions, whether from geopolitics, climate change, or market volatility. It is also one that is inclusive, drawing on the perspectives of young professionals, academic researchers, and diverse stakeholders worldwide.
The progress of 2025 indicates that the industry is moving in the right direction. From power innovation to lifecycle management, from educational outreach to regulatory adaptation, the subsea sector is building the foundations for a more resilient and climate-conscious future. But the work is far from complete. Sustained collaboration, continuous measurement, and cultural change will be required to ensure that sustainability is not just a theme of annual conferences but a defining feature of the industry’s legacy.
9. TECHNOLOGY
9.1. INTRODUCTION
The past year marked a decisive turning point in submarine fiber-optic technology. As global bandwidth demand accelerates under the weight of artificial-intelligence workloads, hyperscale data centers, and cloud-driven services, the subsea network has re-emerged as the indispensable backbone of the digital economy. Innovation has shifted away from incremental capacity increases toward a fundamental re-engineering of the optical layer itself—encompassing fiber architecture, amplification, and coherent transmission.
Between late 2024 and 2025, the industry reached several milestones once thought to be a decade away. Research groups demonstrated petabit-scale multi-core fibers, while commercial operators transmitted terabit-class wavelengths across live transoceanic systems. In parallel, vendors introduced C + L-band repeaters, sixth-generation coherent modems, and multi-core diagnostic tools that are reshaping both wet-plant and dry-plant design.
These advances are converging toward a single goal: enabling the next generation of submarine cables to deliver unprecedented throughput, energy efficiency, and operational intelligence. This section reviews the most significant breakthroughs of 2024–2025—from multi-core and terabit-scale transmission to SDM architectures and AI-enhanced monitoring—illustrating how subsea communications are entering an era defined by massive parallelism and adaptive, software-driven performance.
“The self fleeting capstan drum engine eliminates the need for fleeting rings or knives and significantly reduces moving parts, operations manpower, maintenance costs and deck space while minimising cable damage and operator error.”
Rob Cash – Parkburn (STF Issue 142)
9.2. PETABIT BREAKTHROUGHS
The transition of multi-core fiber (MCF) technology from laboratory proof-of-concepts to deployable subsea systems became one of the defining technical milestones of 2025.
In May 2025, Japan’s National Institute of Information and Communications Technology (NICT) achieved a world-record 1.02 Pb/s transmission over 1,808 km using a 19-core optical fiber of standard 125 µm diameter (NICT, 2025). The demonstration employed both C and L bands across 180 wavelengths modulated with 16QAM, and incorporated a custom multi-core EDFA design capable of simultaneously amplifying all 19 cores. This pushed the capacity-distance product to 1.86 Exabit·km, verifying that spatially parallel amplification can sustain transoceanic spans within standard-sized fiber geometries—an essential requirement for compatibility with current repeater housings and cable architectures.
Complementing this capacity breakthrough, Anritsu and KDDI Research introduced the world’s first remote fault-diagnosis and monitoring system for multicore submarine cables, a major leap for the practical operation of these complex fibers (Anritsu, 2025). Using Anritsu’s Coherent OTDR MW90010B and a KDDI-designed transmission system, the partners successfully measured optical-path characteristics such as loss profiles and inter-core crosstalk within a simulated repeatered submarine cable. The trial confirmed that coherent OTDR—long the backbone of single-mode maintenance—can visualize and locate faults across multiple cores in parallel, allowing operators to remotely assess the health of each core within a single multicore cable. This development directly addresses one of the key obstacles to field deployment: maintaining quality assurance and fault localization in MCF environments.
Meanwhile, the first commercial implementations began to emerge. NEC Corporation confirmed the deployment of a two-core submarine system on the TranspacificTranspacific TPU cable (Submarine Cable Networks, 2025), marking the first time multicore fiber has been integrated into a repeatered transoceanic route. NEC also disclosed ongoing engineering of a four-core variant aimed at next-generation system capacity. These initiatives collectively demonstrate that multicore fiber has progressed from research to production and early network integration, inaugurating a new era of petabit-scale subsea infrastructure.
9.3. TERABIT TRANSMISSION
While multi-core research is redefining future subsea fiber design, 2025 also marked a major leap in real-world transmission performance on existing single-mode systems. Vendors and operators achieved record data rates per wavelength across transoceanic and regional networks, demonstrating that spectral-efficiency gains can continue even before the arrival of new fiber geometries.
In June 2025, Ciena and Telxius achieved the first live 1.3 Tb/s single-wavelength transmission across the 6,600 kilometer Marea trans-Atlantic cable (Ciena, 2025). The trial, conducted over production traffic paths, used Ciena’s WaveLogic 6 Extreme (WL6e) coherent modem, operating at 7 bits/s/Hz spectral efficiency. Running on standard G.654-type ultra-low-loss fiber, the test confirmed that transoceanic systems can now deliver beyond-terabit per-channel throughput without needing new wet-plant infrastructure. The result not only extended record-setting reach for a single wavelength but also validated the energy-efficiency claims of WL6e, which delivers a 15% reduction in power per bit relative to prior 800 Gb/s generation gear.
Just three months later, Altibox Carrier (Norway) and Ciena set another milestone on the NO-UK Cable between Stavanger and Newcastle (Ciena, 2025). Over this ≈720 kilometer link, engineers demonstrated 1.6 Tb/s per channel—the highest single-carrier rate ever recorded on a live submarine span—while sustaining >9 bits/s/Hz spectral efficiency. This regional-distance result complements the Marea trial by highlighting the scalability of sixth-generation coherent optics across different span lengths: where long-haul systems maximize reach at 1.3 Tb/s, regional and express-routes can now operate at 1.6 Tb/s per wavelength. Both results used the same WL6e DSP and electro-optical engine, showing that a single hardware platform can flexibly adapt modulation formats and baud rates to the span characteristics.
9.4. PATHS TOWARD PETABIT CABLES
While multi-core and terabit-class single-mode technologies are reshaping the physical layer, 2025 also marked a decisive evolution in the system architecture of subsea networks. The industry’s focus has shifted toward spatial-division multiplexing (SDM) and ultra-wideband repeater design, enabling total cable capacities that now exceed 1 Pb/s per system.
At SubOptic 2025 in Lisbon, multiple vendors presented a unified vision for the petabit-class subsea era (Tagare, 2025). Papers and panels highlighted how system designers are moving beyond simple increases in wavelength count to adding more parallel fiber pairs and repeater channels, optimizing for aggregate throughput per cable rather than maximum reach per wavelength. This trend, first hinted at in early SDM deployments such as 16-fiber-pair systems, is now pushing toward 24 and 48 fiber-pair configurations. Researchers emphasized that the true gains arise not only from parallelization but from co-optimized power feed, amplifier noise management, and pump sharing, which improve energy efficiency per transported bit by nearly 30% relative to traditional C-band systems (Tagare, 2025).
A notable enabler of these capacities is the C + L band dual-stage repeater, which expands usable spectrum without adding repeaters [6]. This architecture—adopted by SubCom and its peers—integrates two optical amplifier chains within each repeater housing, one for each spectral band, with shared electrical and mechanical subsystems. The result is nearly double the optical bandwidth (12 THz or more) across a single wet plant. Such designs are already moving from laboratory validation into commercial tendering, allowing existing repeater spacing to support far denser wavelength plans. Industry summaries from SubOptic noted that these wideband repeaters have become the default baseline for next-generation cable tenders slated for 2026–2027.
The most visible commercial manifestation of SDM came from Alcatel Submarine Networks (ASN), which announced its 48 fiber-pair E2A Pacific architecture (ASN, 2025). The design leverages compact repeater modules, optimized pump-sharing ratios, and balanced launch power to maintain noise uniformity across dozens of parallel fiber paths. ASN’s data indicated that total system capacity now surpasses 1 Pb/s, while end-to-end efficiency (expressed as Tb/s per watt) improves by more than 25% relative to the 24-pair generation. The company also confirmed that similar 48-FP designs are under consideration for Atlantic and Indian Ocean corridors.
Meanwhile, Meta, SubCom, and ASN jointly unveiled details of the Candle system, a 24-fiber-pair SDM cable connecting the U.S. West Coast with Asia (Softbank Corp., 2025). The Candle initiative epitomizes the maturing of SDM principles: lower per-fiber power, optimized fanout management at branching units, and open-cable interoperability that allows each participant to light distinct fiber pairs independently. SoftBank’s official release confirmed construction start in 2025 and service entry targeted for 2027 (Softbank Corp., 2025).
9.5. FUTURE OUTLOOK
The innovations of 2025 collectively signal a structural transformation in subsea optical technology. The year’s record-setting demonstrations—spanning multi-core transmission, terabit-class wavelength modulation, and high-density SDM architectures—revealed a unified direction across research, manufacturing, and operations: every part of the subsea system is being redesigned to scale capacity through spatial and spectral parallelism.
At the fiber level, multi-core technologies demonstrated by NICT, Anritsu/KDDI, and NEC have proven that parallel optical paths within a single cladding can maintain long-haul performance comparable to legacy single-core systems. Commercial readiness is now clear. The ability to diagnose multicore fibers remotely using coherent OTDR ensures that operational challenges such as crosstalk, loss profiling, and fault isolation can be managed effectively in the field. Together, these advances are establishing the operational framework that will allow petabit-per-cable systems to move from prototype to production within the decade.
At the terminal layer, coherent transmission technology continued to evolve at a rapid pace. The sixth generation of modems—typified by Ciena’s WaveLogic 6 Extreme—broke the 1 Tb/s barrier on live systems while simultaneously improving power efficiency. The Marea and NO-UK trials proved that current subsea infrastructure still has headroom for upgrades without new wet plant, buying operators valuable time as multicore and SDM technologies mature. These advances underscore that performance gains are increasingly being realized through smarter optics and DSP rather than raw fiber replacement.
At the system and network design level, the momentum toward spatial-division multiplexing (SDM) has now become irreversible. Vendors such as ASN, SubCom, and SoftBank are converging on architectures that maximize total throughput per cable rather than spectral efficiency per wavelength. Forty-eight-pair SDM designs and dual C + L band repeaters have transitioned from concepts to commercial baselines. The results presented at SubOptic 2025 confirm that fully equipped SDM systems can surpass 1 Pb/s of total capacity while maintaining lower energy per bit—a balance that defines the next decade of subsea builds.
A critical takeaway from 2025 is that the lines between laboratory innovation and field deployment are disappearing. Multi-core, wideband, and high-baud systems are not competing paths but complementary ones—each addressing a different constraint in the overall Shannon budget of subsea capacity. The resulting ecosystem is more modular, adaptable, and power-efficient than any prior generation.
Looking ahead, integration will define the coming phase of subsea technology. The next generation of systems will likely blend multiple parallelism methods: dual-band repeaters amplifying multi-core fibers, each carrying terabit-class wavelengths on coherent modems that automatically adapt to span conditions. Achieving this integration will require closer coordination between fiber manufacturers, repeater designers, and transmission vendors than ever before.
By late 2025, the subsea industry had clearly entered the petabit decade. The experiments of the past few years have matured into deployable systems, and the global supply chain—from Sumitomo and NEC to Ciena and ASN—is now aligning to deliver real-world capacity scaling at the pace demanded by AI-era data growth. The message of 2025 is unambiguous: the technical ceiling for subsea communications is rising faster than at any point in the last twenty years, and the foundation for the next generation of global connectivity is already being laid beneath the oceans.
10. REGULATORY OUTLOOK
10.1. YEAR IN REVIEW
Insights from Andrés Fígoli
The year 2025 has stood out as one of the most transformative for the global submarine cable industry. The intersection between law, technology, and geopolitics has never been more visible. The sector faces an era of unprecedented regulatory complexity. These developments underline an urgent need for coordinated governance that balances investment incentives, sustainability, and resilience in a globally interconnected ecosystem.
10.1.1. MARKET SUSTAINABILITY
The sustainability of the submarine cable market is increasingly linked to its structural diversity — both in infrastructure ownership and operational models. In 2025, several developments highlighted how market concentration can directly affect resilience, competition, and innovation within the global connectivity ecosystem.
In April 2025, six European competition authorities issued a joint statement (European National Competition Authorities, 2025) warning that a reduced number of infrastructure providers can undermine resilience, service quality and innovation. Also, during this year the UK Parliament’s Joint Committee on the National Security Strategy heard evidence (Steventon-Barnes, 2025) that nearly 75% of potential UK–US transatlantic capacity is concentrated in just two cables, with both landings at a single point. Even though this news was repeated without the proper clarifications from its authors (e.g. use of alternative routes), it created the valid mass media concern as to whether such clustering would pose strategic risks. Indeed, route and landing diversity remains a key element of resilience, and market concentration can create vulnerabilities in contingency planning, such as when older cables fail or are decommissioned.
These dynamics extend beyond wholesale telecom markets to cable laying and maintenance services. In response, many countries have undertaken information-gathering initiatives to better understand subsea activity, while collaboration among competition authorities is emerging as a way to support robust and fair market conditions. (A&O Shearman, 2025)
Now, the current trends in antitrust agencies’ enforcement efforts rely on perfect coordination among several of them for carrying out unannounced antitrust inspections (dawn raids) in many states at the premises of any company, and the power to require companies and individuals to produce documents and information held even in foreign nations.
10.1.2. SECURITY: EVIDENCE
As it does every year, the International Cable Protection Committee (ICPC) has published its statistics (Palmer-Felgate, 2025)about cable repairs stating that the total number for 2024 was kept under 210 (4
incidents per week). And not surprisingly, in +80% of cases the causes of cable damage continue to be the result of human activity such as fishing and anchoring (86%), while the remainder is distributed among causes such as system failure, abrasion or geological activity (e.g. earthquakes).
The recently established Brazilian Submarine Cable Protection Committee (Comitê Brasileiro de Proteção de Cabos Submarinos or CBPC) reported that, among the 16 submarine systems currently landing in Brazil, six cable damage incidents occurred in the last two years, with an average repair cost of USD 1.5 million. In a prudent move, its members decided to restrict the publication of further details, leaving disclosure to each individual cable owner. This approach seeks to avoid media or social media speculation, which often spreads inconclusive or misleading statements about such incidents.
10.1.3. RESILIENCE MATTERS
In partnership with the ICPC, the International Telecommunication Union (ITU) launched in the International Advisory Body on Submarine Cable Resilience in November of last year, its aim being to promote dialogue and collaboration on potential ways and means for improving the resilience of telecommunication submarine cables. Its 42 members comprise representatives from governments, industry and international organisations that often have no voice in industry events.
This Advisory Body held its first International Submarine Cable Resilience Summit in Nigeria in February 2025, culminating in the Abuja Declaration, (International Advisory Body on Submarine Cable Resilience, 2025) with a clear commitment to advancing policy discussions and capacity-building efforts to help countries develop and implement best practices for cable resilience.
Furthermore, during May 2025, the Advisory Body established 3 working groups comprising more than 160 members to focus on key areas that are critical to strengthening global submarine cable resilience (“Timely Deployment & Repair”; “Risk Identification, Monitoring & Mitigation”; and “Fostering Connectivity & Geographic Diversity”). Each working group is tasked with producing an action-oriented report by early 2026 that will surely re-shape the agenda in the UN ecosystem, including the International Maritime Organization (IMO), the International Seabed Authority (ISA) and others, placing the submarine cable resilience topic where it is most needed.
Other similar regional initiatives are underway. The UN Office on Drugs and Crime (UNODC) continues its efforts in the Indian Ocean region to improve the regulatory framework (e.g. Maldives, Sri Lanka). Moreover, with 50 cable disruptions per year occurring in the Asia-Pacific and Indian Ocean regions, many governments are actively working to update the 2019 “ASEAN Guidelines Asean Guidelines for Strengthening Resilience and Repair of Submarine Cables”.
Similarly, in South America, Mercosur adopted a Recommendation (Mercosur, 2025) on submarine cable security and resilience in July 2025. While it signals political awareness, the text is too generic to produce tangible results without concrete follow-up.
10.1.4. NATIONAL REGULATORY DEVELOPMENTS
Regarding national governments, in May 2025 Argentina enacted a new maritime navigation regime (MARITIME, RIVER AND LAKE NAVIGATION REGIME, 2025) prohibiting anchoring and fishing in cable zones. Yet the maximum fine for damaging a cable amounts to roughly USD 1,580 — negligible compared to repair costs in those latitudes (USD1.5-2 millions). Local statistics indicate that no cable damage has been reported in Argentinean waters due to human activities, making the measure less relevant domestically. This stands in contrast to other jurisdictions where such incidents are more frequent, and where fines should be updated to serve as an effective deterrent.
Elsewhere, following on its 2021 National Maritime Security Strategy, Oman created an enforceable, new legal framework (Telecommunications Regulatory Authority – Oman, 2025) with clear rules for cable laying and maintenance activities. Similarly, Somalia introduced new legislation, with an obligation (National
Communications Authority (Federal Republic of Somalia), 2025) to report any cable failure within two hours from its occurrence.
Furthermore, in August 2025, the Federal Communications Commission (FCC) in the United States adopted new rules (Federal Communications Commission (FCC), 2025) aimed at strengthening existing policies to protect submarine cables from so-called “foreign adversaries.” The new framework also introduces additional reporting requirements on the commercialization of capacity and all use of existing seabed infrastructure.
10.1.5. SUSTAINABILITY AND INTERNATIONAL TREATIES
In July 2025, the International Court of Justice (ICJ) issued a landmark advisory opinion (Belgian Institute for Postal Services and Telecommunications (BIPT), 2025) confirming that states have binding international obligations to curb greenhouse gas emissions — and can be held liable for environmental harm caused by companies under their jurisdiction. The opinion follows a similar 2024 ruling by the International Tribunal for the Law of the Sea (ITLOS), which classified anthropogenic emissions as marine pollution.
For the submarine cable sector, this introduces a new layer of risk and responsibility. Environmental licensing for cable landing permits or even for crossing Exclusive Economic Zones (EEZs) may increasingly require carbon footprint assessments and mitigation plans, influencing project financing and insurance. The entry into force of the BBNJ Treaty by early 2026 could mean that additional obligations are imposed, such as the requirement to conduct environmental impact assessments for cables in new marine-protected areas.
Moreover, in April 2025 the International Maritime Organization approved the “Net-Zero Framework”, a proposal aimed at reducing global greenhouse gas emissions from international shipping by or around 2050. It is expected to be adopted in October 2025 and come into effect from 2027.
In June 2025, the Intergovernmental Oceanographic Commission (IOC) of UNESCO approved a recommendation (UNESCO Intergovernmental Oceanographic Commission / The Ocean Decad, 2025) urging Member States to collaborate with industry, research and other data infrastructure stakeholders to standardise ocean data-sharing practices. This is to be done through the establishment of national data-sharing policies, regulations, and permissions for all ocean-related activities conducted within their territorial waters and Exclusive Economic Zones.
Such objectives can be achieved by including mandatory data-sharing provisions into licensing and permitting requirements for operations in waters within their jurisdictions, including cable installation permits. This missing piece in the regulatory puzzle could enable countries to obtain valuable survey data whenever a new submarine cable is installed, thereby supporting national maritime spatial planning, enhancing the sustainable use of natural resources, and maximising the potential of SMART Cables.
“The November 2024
FCC
Notice of Proposed Rulemaking proposes substantial amendments to
submarine cable licensing, compliance, reporting and security procedures, extending regulatory burdens to entities controlling Submarine Line Terminal Equipment
and
even capacity customers or data centre providers.”
Andrew D. Lipman & Ulises R. Pin Morgan Lewis & Bockius LLP (STF Issue 141)
Finally, during the International Seabed Authority (ISA) Council meeting of July of this year, negotiations continued regarding exploitation regulations. Singapore took the lead on submarine cable protection provisions by proposing some improvements to the consolidated text (International Telecommunication Union, 2025) that are yet to be approved. However, coordination between mining and cable activities remains limited, leaving cable owners responsible
for properly notifying other stakeholders of their intentions.
10.1.6. CONTRACTUAL DEVELOPMENTS
Landing cable agreements as stand-alone business models have gradually become a growing trend in the industry. Although many countries lack specific legislation to govern them, these arrangements have often been permitted or tolerated without major opposition.
This model provides an attractive way of monetizing the use of a cable landing station, no longer restricting it exclusively to the subsea system owned by the cable station’s operator. In some cases, it is not even necessary for the interested party to hold co-ownership of the submarine infrastructure or to be a direct user of the system. Ultimately, this is a new contractual scheme that is gaining ground in the market. However, it can only be viable in jurisdictions where a prior legal opinion from a local law firm provides all parties with assurance that the arrangement is sound from a legal and regulatory perspective.
A key issue in such contracts is the limitation of liability regarding works on the wet plant. The landing party may be required to provide and maintain its cable station in efficient working order, but should not assume risks related to EHS (environmental, health, and safety), intellectual property rights, or regulatory permits associated with the installation of the wet plant, even if it has taken ownership of the local portion of the system to comply with regulatory requirements. These risks are shared appropriately — not as partners, since the parties are not partners, but under a subcontracting framework, where the principal contractor retains the primary obligation and cannot allocate its risks to an entity that lacks clear control over seabed operations during the installation or subsequent operation of the system once activated.
10.1.7. LOOKING AHEAD
The legal and regulatory landscape of submarine cables in 2025 reveals both progress and fragmentation. While some national authorities have taken decisive steps, their actions often lack the cohesion needed for a unified global framework. The growing intersection between legal frameworks and market dynamics reveals that existing laws have not yet adapted to the realities of today’s interconnected and privately operated submarine cable networks — underscoring the need for modernized international instruments and closer inter-governmental coordination.
For the private sector, these developments signal a shift from reactive compliance to proactive legal strategy — anticipating regulatory changes and embedding sustainability and resilience into business models. As we move toward 2026, the challenge for policymakers and industry alike is to translate growing awareness into coherent, enforceable, and future-proof governance mechanisms that ensure the world’s digital arteries remain both resilient and sustainable.
10.2. INDUSTRY ACTIVITIES
The global submarine cable industry in 2025 has been marked by a wave of strategic consolidation, state intervention, regulatory reform, and financing milestones that underscore the sector’s importance to global communications. Following several years of heightened geopolitical focus on undersea infrastructure, governments and private investors alike are moving more aggressively to secure, expand, and control cable networks.
Europe continues to strengthen its regulatory and security frameworks, investing in resilience measures and prioritizing trusted vendors in response to repeated disruptions and geopolitical uncertainty. In parallel, national governments such as India and Malaysia have adopted reforms to lower costs and streamline cable deployment, reflecting a growing recognition of subsea systems as critical economic infrastructure.
On the corporate front, major transactions such as private equity investments in subsea operators, strategic fleet expansions, and the restructuring of debt for regional players demonstrate ongoing investor confidence in the long-term fundamentals of global connectivity. Notable acquisitions and partnerships signal an industry realignment, where ownership structures and financing strategies are evolving to meet rising demand and heightened security expectations.
The year also saw multiple state-backed initiatives, including Japan’s moves to strengthen national ship capacity, West Africa’s call for global cooperation on cable protection, and several large financing packages for operators expanding their global fleets. Together, these developments highlight how the submarine cable sector is no longer a quiet corner of telecom infrastructure but a strategic focus point for both governments and global capital markets.
In summary, 2025 has reinforced the dual narrative of opportunity and vulnerability in subsea cables: demand for bandwidth is driving sustained investment, while geopolitical and security pressures are reshaping ownership, financing, and regulation. The following key events illustrate this evolving landscape.
10.2.1. EU ADVANCES CABLE SECURITY FRAMEWORK
The European Commission introduced new measures to reduce reliance on high-risk vendors, strengthen resilience, and accelerate repair permitting across the continent. This builds on 2024’s action plan and reflects heightened concern following Baltic Sea cable disruptions. https://subtelforum.com/eu-advances-cable-security-framework-2025/
10.2.2. ITALY FINALIZES TIM SPARKLE SALE TO KKR AND GOVERNMENT STAKEHOLDERS
After prolonged negotiations, Italy and private equity firm KKR finalized control of Telecom Italia’s Sparkle
submarine cable division. The deal ensures partial public ownership while granting KKR operational leadership, underlining Sparkle’s strategic importance.
10.2.3. INDIA EXTENDS DUTY EXEMPTIONS ON CABLE-LAYING VESSELS
India renewed its exemption on customs duties for subsea cable-laying ships, reducing operational costs for system deployment. The move is intended to accelerate national connectivity and attract foreign-led projects.
10.2.4. MALAYSIA PERMANENTLY WAIVES RESTRICTIONS ON FOREIGN REPAIR SHIPS
Malaysia confirmed the permanent removal of restrictions on foreign-flagged vessels repairing submarine cables in its waters. The reform opens the market to global operators and enhances resilience for regional networks.
10.2.5. NIGERIA CALLS FOR GLOBAL CABLE PROTECTION ALLIANCE
Nigeria announced an initiative to spearhead international collaboration on undersea cable protection, citing repeated outages across West Africa. The plan includes coordination with international telecom bodies and legal reviews of maritime infrastructure protections.
Japan committed to subsidizing NEC’s acquisition of dedicated cable-laying vessels, reducing reliance on foreign-chartered ships. The move positions NEC as a more competitive player and strengthens Japan’s strategic control over subsea infrastructure.
10.2.7. NOKIA COMPLETES SALE OF MAJORITY STAKE IN ASN TO FRENCH STATE
Nokia finalized the transfer of majority ownership in Alcatel Submarine Networks to the French government, while retaining a minority share and board representation. This ensures state oversight of a strategic infrastructure asset.
NOKIA’S $2.3 BILLION ACQUISITION OF INFINERA ADVANCES
Nokia advanced its acquisition of optical networking firm Infinera, a $2.3 billion deal designed to consolidate its position in high-capacity optical systems for subsea and terrestrial networks.
OMS Group signed a syndicated loan agreement valued at nearly $300 million to fund global fleet expansion and new subsea projects. The financing underscores investor appetite for infrastructure operators.
RTI JGA ASSET ASSIGNMENT FINALIZED IN SINGAPORE COURT
The Japan-Guam-Australia cable operator RTI JGA transferred assets to receivers following debt restructuring proceedings, ensuring operational continuity of the North and South systems despite financial challenges.
The FCC resolved investigations into América Móvil’s submarine cable operations, levying penalties and mandating compliance upgrades to strengthen oversight of U.S.-linked infrastructure.
SINGTEL EXPLORES PARTIAL STAKE SALE IN SUBMARINE UNIT
Singtel announced plans to explore a partial divestment of its subsea cable unit, aiming to unlock value while maintaining operational control. The move follows regional peers pursuing strategic partnerships.
HENGTONG MARINE SECURES $400 MILLION BOND FOR EXPANSION
China’s Hengtong Marine issued $400 million in bonds to fund new subsea systems and fleet upgrades, highlighting Beijing-linked firms’ continued push despite geopolitical headwinds.
10.2.14. ORANGE MARINE ADDS NEW REPAIR VESSEL TO MEDITERRANEAN FLEET
Orange Marine expanded its fleet with a new vessel dedicated to Mediterranean and Atlantic repair operations, reinforcing Europe’s capacity for faster cable maintenance.
PRYSMIAN ACQUIRES REGIONAL FIBER ASSETS TO BOLSTER SUBSEA BUSINESS
Prysmian Group acquired regional fiber holdings to expand its submarine business footprint, aiming to integrate supply chains and strengthen its global leadership in cable manufacturing.
Following its sale, Sparkle unveiled a new investment plan focusing on resilience and route diversity, signaling ongoing public-private support for strengthening Mediterranean and transcontinental connectivity.
10.2.17. E-MARINE EXPANDS GULF OPERATIONS WITH NEW PORT HUB
E-Marine opened a new operations hub in Oman to support faster repairs across the Arabian Gulf, Red Sea, and Indian Ocean regions. The expansion reflects growing demand for rapid-response maintenance.
10.2.18. SEACOM RESTRUCTURES DEBT TO SUPPORT EXPANSION
SEACOM completed a debt restructuring package, providing financial stability for continued expansion of African connectivity projects. The deal highlights ongoing capital challenges for regional operators.
10.2.19. HUAWEI MARINE REBRANDS AND PURSUES REGIONAL PARTNERSHIPS
Huawei’s subsea arm rebranded and launched new regional partnerships to maintain market presence amid global restrictions, signaling adaptation to tightened geopolitical scrutiny.
“Recent industry conversations around circular-economy principles raise an important question: Are recycled submarine-cable materials reintroduced into cable manufacturing or related industry applications, thus achieving true circularity? Currently the answer is generally “no, not yet”. There are no widespread initiatives or strong collaborations between cable manufacturers and cable recyclers to reuse these recovered materials at scale.”
For a full list of systems in this region click here
11.1.1. CURRENT SYSTEMS
The Americas region continues to demonstrate steady growth in submarine cable systems, extending a trend that has been observable since the early 1990s. In 2016, the region supported 62 operational cables, and by 2023 this number had climbed to 89. As of 2025, the total now stands at 91 operational systems, underscoring the region’s consistent expansion.
Figure 63: Cable Systems by Year - Americas, 2018-2030
In reviewing the past seven years, the Americas’ system count has increased at a fairly predictable pace, averaging close to two additional systems per year. Growth was particularly strong in 2018–2020, when multiple new deployments were commissioned to serve both transoceanic and regional routes. While the past two years have shown slower absolute growth—adding only two systems from 2023 to 2025—the upward trajectory continues to hold.
Compared to last year’s forecast, which anticipated a potential flattening of growth beyond 2024, the data indicates that momentum has been preserved. Rather than a sharp slowdown, the trend points to a measured increase. Forecasts for 2026–2030 suggest the Americas could reach 105–110 systems in operation by decade’s end, depending on the pace of approvals and financing for planned projects.
This expansion is not solely dependent on new builds. A growing share of investment is being directed toward upgrades of existing systems, particularly through spectrum sharing, branching units, and capacity enhancements that extend the utility of established infrastructure. This dual path—new builds complemented by upgrades—illustrates the maturity of the Americas market. The steady increase is less about rapid expansion, as was seen in earlier decades, and more about ensuring resilience, redundancy, and efficiency of the regional network.
The Americas’ enduring importance to global connectivity is reflected in the concentration of major east–west and north–south routes. Transatlantic systems continue to evolve as high-capacity corridors linking North America to Europe, while Pacific systems connect the U.S. West Coast to Asia. At the same time, intra-regional systems have proliferated, linking the Caribbean, Central America, and South America more tightly into the global fabric. These dynamics underscore the role of the Americas as both an origin and a transit hub for global data traffic.
11.1.2. FUTURE SYSTEMS
Measured in kilometers of cable added, the Americas have also sustained growth. The region added approximately 285,000 kilometers in 2025, compared to 275,000 kilometers in 2024. This increase follows three years of relative plateau, when additions hovered at or near 257,000–258,000 kilometers annually between 2021 and 2023.
64: KMS Added by Year - Americas, 2018-2030
The 2025 figure is notable for several reasons. First, it reflects the delivery of long-haul projects that had been in planning stages for multiple years, including extensions across the Pacific and new links into underserved Latin American markets. Second, the increase underscores the importance of regional connectivity enhancements, with several mid-range systems completed to link Caribbean nations, Central American states, and secondary landing points in South America.
Compared with last year’s assessment, which emphasized a potential tapering of growth after 2024, the 2025 data suggests that demand for additional kilometers remains robust. While the long-term projection continues to show moderation—stabilizing in the 300,000–320,000 km range by 2030—the near-term trend highlights the persistence of projects aimed at extending reach and improving resilience.
Environmental and logistical considerations remain critical factors shaping this growth. The Americas span an extraordinary range of geographies, from the Arctic waters of northern Canada to the equatorial climates of Brazil and the Amazon basin. This diversity creates uneven project timelines, as installations in more challenging environments often face delays. The Caribbean and Gulf of Mexico, for example, carry heightened risk due to hurricane exposure, requiring system designs that incorporate additional resilience features such as shore-end protections and alternate landing options.
Another key indicator is the Cable In Force (CIF) rate. As of 2025, the CIF rate for planned systems in the Americas is 50%, with 3 of the 6 planned systems completed and the other 3 still under development.
Figure
This marks a decline from 2024, when 62.5% of planned systems (5 of 8) had reached CIF status. The reduction highlights the reality that while some systems have been successfully delivered, others are progressing more slowly, possibly due to financing delays, shifting market priorities, or regulatory barriers. The fact that half remain incomplete underscores ongoing hurdles. Nevertheless, achieving 50% completion reflects meaningful progress, demonstrating that despite challenges, project execution is advancing at a steady if sometimes uneven pace.
Taken together, the increase in kilometers deployed and the balanced CIF rate indicate that the Americas are continuing to move forward. While not every planned system advances on its original schedule, the overall picture reflects a resilient market that adapts to setbacks and sustains its role in global connectivity.
11.1.3. REGION OUTLOOK
The Americas remain a cornerstone of the global submarine cable industry. From 70 operational systems in 2018 to 91 in 2025, the data reflects nearly a 30% increase over seven years. Kilometers added tell a similar story, rising from 223,000 in 2018 to 285,000 in 2025. These numbers illustrate steady, incremental progress that strengthens the region’s connectivity backbone.
Compared with last year’s report, the 2025 data introduces several important shifts. The CIF rate slipped from 62.5% to 50%, suggesting that planned projects face more significant challenges this year than last. However, this was offset by stronger year-over-year growth in kilometers added, which climbed by 10,000 km between 2024 and 2025. This mixed picture underscores both the opportunities and risks facing the Americas.
Looking forward, future growth will likely be characterized less by rapid deployment of new corridors and more by enhancements to existing infrastructure, capacity upgrades, and targeted new builds to address underserved areas. Major east–west and north–south routes are already in place; thus, the focus will increasingly be on latency improvements, redundancy, and resilience. For example, new systems are being designed to bypass high-risk zones, diversify landing points, and incorporate sustainability measures to address both climate-related risks and environmental sensitivities.
Figure 65: CIF Rate - Americas Planned
Challenges Facing the Region
1. Regulatory and Political Instability:
While North America continues to offer a stable environment for investment, South America remains a source of uncertainty. Brazil and Argentina in particular face shifting regulations and policy changes that can delay approvals or disrupt financing arrangements. These dynamics have persisted year over year and remain a limiting factor for regional project momentum.
2. Environmental Risks:
Natural disasters remain a persistent threat. Hurricanes in the Atlantic and Caribbean, earthquakes along the Pacific Rim, and volcanic risks in Central America create vulnerabilities for subsea infrastructure. The growing impact of climate change, with more frequent and intense storms, adds a new layer of long-term concern. Mitigation strategies increasingly focus on diversified routing and greater structural resilience.
3. Economic Factors:
Inflationary pressures, currency volatility, and difficulties in accessing affordable capital continue to complicate investment in some Latin American markets. While demand for bandwidth remains strong, the ability to finance new systems can be unpredictable, requiring collaboration with international partners and multilateral organizations to bridge funding gaps.
4. Geographical Diversity and Logistical Complexities:
The sheer scale and diversity of the Americas present unique challenges. Deployments in polar regions face extreme conditions, while projects in equatorial climates such as the Amazon basin must contend with environmental sensitivities and complex permitting processes. These factors add cost, complexity, and longer timelines to projects.
The Americas’ outlook for submarine cable development remains cautiously optimistic. While the rate of new system deployments is slower than in past decades, the combination of incremental growth in systems and kilometers, sustained CIF progress, and continued investment in upgrades ensures that the region remains integral to global connectivity.
The year-over-year trends show a balanced mix of advancement and challenge: systems and kilometers are steadily increasing, while CIF progress highlights the difficulties of navigating political, economic, and regulatory headwinds. Ultimately, the Americas are set to maintain their central role in the global submarine cable landscape, leveraging both geographic position and infrastructure maturity to sustain their contribution to worldwide data traffic.
“Chile’s Humboldt Cable will deliver 144 Tbps and connect Chile, French Polynesia and Australia via New Zealand and Sydney, positioning Chile as a gateway for data entry into South America and an attractive location for data centers.”
For a full list of systems in this region click here
11.2.1. CURRENT SYSTEMS
The AustralAsia region has maintained its position as one of the most dynamic and consistently expanding submarine cable markets worldwide. In 2017, the region had 75 operational systems. By 2024, that figure rose to 113, and as of 2025 the system count stands at 114 active cables, underscoring the steady pace of expansion across the region.
The data highlights a year-over-year increase from 110 systems in 2024 to 114 in 2025, reflecting continued demand for international bandwidth and intra-regional connectivity. This growth, while modest compared with the rapid expansion of earlier years, is consistent with last year’s forecast, which suggested that AustralAsia was entering a phase of more measured growth rather than large spikes. Projections indicate the region could support 130–140 systems by 2030, marking sustained though moderate increases over the coming five years.
The drivers behind this expansion remain the same: accelerating digital transformation, particularly in Southeast Asia, combined with hyperscaler investments in data center infrastructure. Singapore continues to act as a strategic hub, connecting multiple intra-Asian and transcontinental routes. Indonesia remains a key growth engine, with strong demand for new deployments driven by its geography as an archipelagic state. Meanwhile, Australia has strengthened its role as a southern anchor, connecting the region to North America, Europe, and increasingly Africa via trans-oceanic systems.
Compared to last year’s assessment, the pace of system additions has slightly slowed, with just four new systems added in the past year versus five in 2023. This indicates that while demand remains strong, much of the region’s future growth will likely stem from capacity upgrades and technological enhancements to existing systems, as opposed to entirely new builds. This trend reflects a maturing market—one where infrastructure already in place is expanded or modernized to keep pace with rising traffic.
11.2.2. FUTURE SYSTEMS
Growth in terms of kilometers of cable added has also remained robust. By 2025, the AustralAsia region
Figure 66: Cable Systems by Year - AustralAsia
added 388,000 kilometers, up from 362,000 kilometers in 2024.
This represents a significant year-over-year increase of 26,000 kilometers, a stronger gain than anticipated in last year’s forecast, which predicted more moderate stabilization. The 2025 figure likely reflects the completion of several large-scale projects, including new long-haul transoceanic systems and expansions connecting underserved island nations and secondary markets within Southeast Asia.
Since 2018, the region’s cumulative kilometers added have grown from 281,000 to 388,000 in 2025, underscoring AustralAsia’s role as one of the fastest-growing regions globally in terms of subsea reach. While growth is expected to moderate in the years ahead, projections indicate totals could climb to 450,000 km or more by 2030.
AustralAsia’s expansion is tempered by its unique geographical and environmental challenges. The region spans vast and diverse landscapes—from densely populated urban hubs to remote Pacific islands. This complexity translates into longer timelines for permitting, installation, and maintenance. Additionally, the region’s location along the Pacific Ring of Fire introduces heightened risks from earthquakes, tsunamis, and volcanic activity. These risks not only complicate deployment but also demand that new systems be designed with greater resilience, redundancy, and alternate routing strategies.
Another key metric is the Cable in Force (CIF) rate. As of 2025, 60% of planned systems in the region have reached their CIF milestone, representing 6 completed projects out of 10 planned.
Figure 67: KMS Added by Year - AustralAsia
This is an improvement over 2024, when only 50% of planned systems had reached CIF status. The rise demonstrates the region’s ability to push through regulatory and logistical hurdles to bring projects online. However, the remaining 40% of incomplete systems—4 projects—highlight ongoing challenges, particularly in remote or politically sensitive areas where financing and permitting remain obstacles.
Taken together, the increase in kilometers deployed and the higher CIF rate signal that AustralAsia continues to execute on its project pipeline effectively. The region is balancing its ambitious expansion goals with the realities of political, economic, and environmental hurdles.
11.2.3. REGION OUTLOOK
The AustralAsia region remains one of the most active hubs of submarine cable development worldwide, a position it has held for over a decade. The current data reinforces this: from 85 systems in 2018 to 114 in 2025, and from 281,000 kilometers in 2018 to 388,000 in 2025, the region’s infrastructure base has expanded dramatically.
Compared with last year’s projections, the 2025 update paints an encouraging picture. The CIF rate has improved (from 50% to 60%), signaling successful project completions, while kilometers added jumped sharply, beating forecasts of gradual stabilization. The only area of moderation is in system count growth, which has slowed slightly, confirming that AustralAsia’s market is maturing but still growing steadily.
Future growth will likely prioritize both new long-haul builds and targeted upgrades. With many major routes already in service, upcoming investments will focus on improving latency, expanding redundancy, and addressing regional connectivity gaps. These include diversifying routes away from congested or high-risk corridors and improving connections for smaller island economies across the Pacific.
Challenges Facing the Region
1. Regulatory and Political Instability:
While Southeast Asian governments generally support digital infrastructure, regulatory uncertainty in markets like Indonesia and the Philippines continues to pose challenges. Shifts in government policies or
Figure 68: CIF Rate - AustralAsia Planned
delays in permitting can disrupt timelines and financing for new systems.
2. Environmental Risks
The region’s location in the Pacific Ring of Fire exposes it to earthquakes, tsunamis, and volcanic activity, all of which can disrupt both construction and long-term operations. Climate-related risks, including rising sea levels and storm intensity, add new complications that must be addressed in system design.
3. Economic Factors
While the overall outlook remains positive, fluctuations in currency values and inflationary pressures in emerging markets could increase project costs or delay investment decisions. Dependence on international capital and hyperscaler partnerships will remain critical to sustaining growth.
4. Geographical Diversity and Logistical Complexities
The region’s vast geography—from remote Pacific islands to heavily urbanized hubs—introduces logistical challenges in both deployment and maintenance. Coordinating across multiple governments and regulatory regimes increases costs and timelines, particularly for ecologically sensitive projects in coral reef zones or remote marine areas.
AustralAsia’s trajectory continues to be one of strong, steady growth, though tempered by the realities of a maturing market. With 114 systems in service and 388,000 kilometers added by 2025, the region demonstrates its importance as a global connectivity hub. The improvement in CIF rates and strong yearover-year growth in kilometers added suggest that projects are progressing, even as system count growth moderates.
The region’s ability to sustain momentum will depend on how effectively it addresses political, environmental, and logistical challenges. If managed successfully, AustralAsia is well positioned to surpass 130 systems and 450,000 kilometers by 2030, cementing its role as a cornerstone of international connectivity.
“Telecom Egypt’s infrastructure has evolved to meet increasing demand for diversity, agility and resilience; investments in landing stations, trans Egypt crossings and subsea routes enable global connectivity between Asia, Africa and Europe.”
Magda Abdelkader – Telecom Egypt (STF Issue 143)
11.3. EMEA
Regional Snapshot:
Current Systems: 209
Capacity: 1,940 Tbps
Planned Systems: 16
Planned Capacity: 1,772 Tbps
For a full list of systems in this region click here.
11.3.1. CURRENT SYSTEMS
The EMEA region—comprising Europe, the Middle East, and Africa—continues to show steady expansion in submarine cable deployments. This region’s importance stems not only from its scale, spanning three continents, but also from its geographic chokepoints such as the Mediterranean Sea and the Suez Canal, which make it one of the most strategically critical areas for global connectivity.
As of 2025, the region has 216 operational cable systems, compared to 208 in 2024 and 173 in 2018. This reflects the addition of eight new systems in the past year, one of the stronger year-over-year increases among global regions.
Figure 69: Cable Systems by Year - EMEA, 2018-2030
The upward trajectory in system counts highlights EMEA’s long-standing role as a reliable market for new deployments. Since the early 2000s, the region has averaged between four and six new systems annually, and that trend continues today. Europe remains a core hub of this activity, but new cables increasingly serve Africa’s west and east coasts, as well as intra-Middle Eastern connections.
Compared with last year’s projections, growth has slightly outpaced expectations. The 2024 forecast anticipated a gradual rise from 208 systems toward ~240 by 2029. With the region already at 216 in 2025, the possibility of reaching or surpassing that mark earlier in the decade is now likely. This reflects momentum behind both intercontinental mega-projects (such as 2Africa and Equiano) and regional systems connecting secondary markets.
Intercontinental corridors like SEA-ME-WE, ACE, and WACS remain central to the region’s role, linking Europe with Asia, Africa, and the Middle East. Complementing these large systems are numerous smaller builds, such as Mediterranean and Red Sea links that tie into terrestrial networks. This layering of large and small deployments underscores the dual nature of EMEA: a crossroads for global data flows and a diverse region with unique intra-regional needs.
11.3.2. FUTURE SYSTEMS
In terms of kilometers of cable added, EMEA continues to show impressive growth. By 2025, the region
had added 433,000 kilometers of cable, up from 396,000 kilometers in 2024.
Figure 70: KMS Added by Year - EMEA, 2018-2030
This represents an annual increase of 37,000 kilometers—the second consecutive year of strong growth after a major jump between 2023 and 2024. The latest figure is also well ahead of last year’s forecast, which anticipated moderation after the surge of long-haul deployments.
Since 2018, when the region accounted for 281,000 km, EMEA has added more than 150,000 km of subsea cable in just seven years. Much of this growth comes from long-haul, multi-landing projects such as 2Africa, which will eventually encircle the African continent, and Equiano, which extends along Africa’s western seaboard. These projects are transformative not just in scale but also in their ability to connect underserved African markets to Europe and beyond.
The near-term forecast suggests continued additions, though at a steadier pace. Projections to 2030 show EMEA reaching around 500,000–550,000 km, reflecting both the completion of ongoing mega-projects and incremental upgrades. Increasingly, new kilometers are being added not only to meet rising demand but also to provide resilience and route diversity—critical for mitigating risks in regions prone to disruption.
The Cable in Force (CIF) rate provides further insight into progress on planned projects. In 2025, EMEA shows a 60% CIF rate, with three projects complete out of five planned.
This represents stability compared with 2024, when the CIF rate also stood at 60% (six of ten planned projects completed). While the percentage has held steady, the total number of projects has changed, reflecting a refreshed pipeline of activity. The consistency in CIF performance indicates that EMEA is continuing to move projects forward, but it also highlights the persistence of challenges that prevent full completion. The incomplete systems (two projects, or 40%) remain subject to delays tied to financing, permitting, and political hurdles. These challenges are most acute in parts of Africa and the Middle East, where fluctuating economic conditions and shifting political landscapes complicate delivery.
11.3.3. REGION OUTLOOK
The EMEA region remains a cornerstone of global submarine connectivity, with strong momentum across both system counts and kilometers deployed. From 173 systems in 2018 to 216 in 2025, and from 281,000 kilometers in 2018 to 433,000 kilometers in 2025, the data reflects substantial investment and expansion.
Compared with last year, the region has posted stronger-than-expected gains. System count growth accelerated (adding eight systems year over year), while kilometers added rose sharply. The CIF rate, while unchanged at 60%, demonstrates that projects continue to move ahead even amid headwinds.
Looking forward, EMEA is projected to surpass 240 systems and 500,000 km of cables by 2030. The outlook remains strong, though growth is expected to moderate as current mega-projects near completion. The focus is shifting toward regional diversity, capacity upgrades, and resilience, particularly across Africa and the Middle East where connectivity gaps remain wide.
Challenges Facing the Region
1. Regulatory and Political Instability
Political instability remains the most significant obstacle to future deployments. The Middle East continues to face unpredictable regulatory environments, while Africa contends with shifting government policies in key markets like Nigeria, South Africa, and Egypt. The latter is particularly sensitive as Egypt’s Red Sea and Suez Canal crossings remain chokepoints for global traffic. Any disruption here carries global conse-
Figure 71: CIF Rate - EMEA Planned
quences.
2. Environmental Risks
EMEA’s geographic diversity exposes it to a wide range of environmental risks. Storms in the Atlantic and Mediterranean can damage coastal landings, while seismic activity in East Africa poses long-term threats. Protecting against these hazards requires investment in resilient engineering and multiple route options.
3. Economic Factors
While Europe provides a stable financial base, parts of Africa and the Middle East continue to experience currency volatility, inflation, and limited access to capital. These challenges can delay financing or raise costs, especially for multi-nation projects requiring significant upfront investment.
4. Geographical Diversity and Logistical Complexities
Deployments across three continents require coordination among diverse regulatory regimes and multiple stakeholders. The Red Sea and Suez Canal corridors, for example, remain among the most geopolitically sensitive cable routes worldwide, with high costs and complex permitting. At the same time, extending connectivity to remote African regions requires long builds across challenging terrain and ecologically sensitive areas.
The EMEA region continues to expand its role as a global connectivity hub, with growth fueled by both regional and intercontinental systems. By 2025, the region reached 216 systems and 433,000 kilometers, surpassing last year’s forecasts. While the CIF rate remains unchanged, steady progress on new builds and upgrades reflects resilience in the face of political, economic, and environmental challenges. Looking ahead, EMEA is on track to exceed 240 systems and half a million kilometers of subsea infrastructure by 2030. Achieving this will depend on the region’s ability to manage regulatory complexity, finance large-scale projects, and design systems resilient to environmental risks. The expansion of connectivity across Africa and the Middle East will be particularly critical, as these areas continue to represent both the greatest challenges and the greatest opportunities for growth.
“Mauritania, The Gambia, Guinea Bissau, Guinea, Sierra Leone and Liberia continue to depend largely on a single subsea cable—the Africa Coast to Europe (ACE) system—for access to the global internet… There is a need to create a more resilient, affordable and inclusive digital ecosystem that can support sustainable socioeconomic change.”
Henry el Bahnasawy – Independent commentator (STF
Issue 144)
11.4. INDIAN
Regional Snapshot:
Current Systems:
Capacity: 1,093
Planned Systems: Planned Capacity:
For a full list of systems
INDIAN OCEAN
Snapshot: Systems: 39
1,093 Tbps Systems: 5 Capacity: 308 Tbps systems in this region click here.
11.4.1. CURRENT SYSTEMS
The Indian Ocean region has maintained its steady growth trajectory in submarine cable systems, reflecting its role as a strategic junction connecting Europe, Africa, the Middle East, and AustralAsia. While geographically smaller than other regions, its placement along vital east–west and north–south corridors ensures that it remains a critical component of global data infrastructure.
As of 2025, the region supports 40 operational systems, up from 39 in 2024 and 27 in 2018.
The past decade has seen consistent growth, though marked by occasional spurts of activity rather than a uniform pace. For instance, multiple systems were launched between 2019 and 2022, and 2023 saw a rare spike with the addition of five systems. Since then, growth has been more measured, with one additional system added in the past year. This aligns with the region’s historical “feast-or-famine” development pattern, where years of intense build activity are followed by quieter intervals.
The Indian Ocean’s importance is underscored by its function as a crossroads of major intercontinental systems, including the SEA-ME-WE series (3, 4, and 5) and AAE-1. These systems connect Europe and Asia through Middle Eastern and South Asian landing points, forming some of the most heavily trafficked global corridors. In addition, smaller-scale regional projects—such as cables linking India to Southeast Asia or the Middle East—continue to provide resilience and diversity to the broader network.
Compared with last year’s analysis, the system count increase is modest, but the region remains firmly on track toward projections of reaching 50 or more systems by 2030. This reinforces the view that while new builds will occur, much of the near-term focus will also involve upgrades to existing infrastructure, extending the life and capacity of critical intercontinental routes.
11.4.2. FUTURE SYSTEMS
In terms of kilometers added, the Indian Ocean region has posted strong gains over the past several years. By 2025, total kilometers added reached 268,000, up from 257,000 in 2024.
Figure 72: Cable Systems by Year - Indian Ocean, 2018-2030
73: KMS Added by Year - Indian Ocean, 2018-2030
This represents a 10,000 km increase year over year, continuing the upward trend that began in 2021 when the region surpassed 200,000 km for the first time. The sharpest rises came in 2022 and 2024, when major trans-regional systems were delivered. The 2025 increase, while smaller, is consistent with steady expansion rather than another sudden surge.
Looking ahead, projections suggest that kilometers will continue to rise, potentially surpassing 300,000 km by the early 2030s. Much of this growth will be driven by ongoing demand for Asia–Europe connectivity, as well as Australia’s push for greater route diversity along its western coast. The involvement of hyperscalers in planning new routes is also expected to influence development, with interest in potential direct links between the United States and India further strengthening the region’s role.
The Cable in Force (CIF) rate offers additional insight into project progress. As of 2025, the Indian Ocean region shows a 50% CIF rate, with two systems completed out of four planned.
Figure
This mirrors last year’s percentage, though the total pipeline has shifted as projects advance. The equal balance between completed and incomplete systems reflects steady but cautious progress. For the incomplete projects, delays often stem from political or regulatory hurdles in landing countries, financing constraints, or overlapping competition among multiple proposed routes.
A notable feature of the Indian Ocean’s planned systems is that many function as “pass-through” projects—cables that originate outside the region but cross it en route between Asia, the Middle East, and Europe. These systems provide essential route diversity and redundancy, but their viability can depend heavily on broader global demand and competing projects in adjacent regions such as the Mediterranean or Southeast Asia.
11.4.3. REGION OUTLOOK
The Indian Ocean region remains strategically vital, even though its absolute system count lags behind regions like EMEA or AustralAsia. Its importance lies in its function as a convergence zone: the shortest and most cost-efficient paths between Asia and Europe continue to pass through its waters.
From 27 systems in 2018 to 40 in 2025, and from 187,000 km to 268,000 km over the same period, the region has expanded steadily. Compared with last year, the gains are smaller—just one new system and an 11,000 km increase—but these increments reflect a market that is maturing and stabilizing. The CIF rate, unchanged at 50%, indicates steady but uneven progress across projects.
Looking ahead, forecasts suggest the Indian Ocean could reach 50 systems and 300,000+ kilometers of subsea infrastructure by 2030. Growth will likely remain incremental, with an emphasis on enhancing resilience, capacity, and route diversity rather than raw system count.
Challenges Facing the Region
1. Regulatory and Political Instability
The Indian Ocean corridor touches regions prone to political uncertainty, including parts of the Middle East and Africa. Delays in approvals and financing due to shifting regulations or unstable governments continue
Figure 74: CIF Rate - Indian Ocean Planned
to slow progress.
2. Environmental Risks
While less disaster-prone than the Pacific, the Indian Ocean faces cyclones, storms, and occasional seismic activity, which can affect both installation and long-term reliability. Designing cables to withstand these risks remains a priority.
3. Economic Factors
Currency volatility and inflation in parts of Africa and the Middle East complicate financing. However, strong demand for connectivity—particularly from international hyperscalers and cloud providers—is driving external investment, helping offset regional capital challenges.
4. Geographical Diversity and Logistical Complexities
The region spans India, Middle Eastern hubs, and remote island nations, requiring coordination across diverse stakeholders. Multiple planned systems compete along similar routes, adding both logistical challenges and market risks for developers racing to meet early RFS (Ready for Service) targets.
The Indian Ocean region remains a critical pathway for global data traffic, linking Europe, Asia, and AustralAsia. With 40 systems and 268,000 km in place by 2025, it has made steady progress, even as growth has slowed compared with prior years. The unchanged CIF rate reflects the challenges of navigating political, economic, and logistical headwinds, but also the resilience of a region that continues to advance key projects.
Future development will hinge on the demand for route diversity and resilience, particularly to serve India’s rising connectivity needs and to safeguard global traffic flows between Asia and Europe. While growth will likely remain modest in absolute terms, the Indian Ocean’s role as a strategic bridge between regions ensures its continued importance in the global submarine cable landscape.
11.5. POLAR
Regional Snapshot:
Current Systems: 3
Capacity: 64 Tbps
Planned Systems: 4
Planned Capacity: Not Announced
For a full list of systems in this region click here.
11.5.1. CURRENT SYSTEMS
The Polar region remains one of the most challenging yet strategically significant frontiers for submarine cable development. While growth has been limited compared with other regions, its importance lies in its potential to provide shorter, lower-latency routes between Europe, Asia, and North America by traversing Arctic waters.
As of 2025, the region supports three operational systems, unchanged from 2024. This represents a slight increase from two systems in 2021, when the most recent deployments came online.
The system count has remained flat for three consecutive years, underscoring the difficulties of pushing projects forward in such a harsh environment. However, maintaining three operational systems is itself a milestone, given the logistical and environmental challenges. These cables—including the Quintillion Subsea system, completed earlier in the decade—serve as proof of concept that Polar routes are both technically viable and commercially valuable.
While no new systems were added in 2025, industry interest remains strong. Polar corridors are increasingly viewed as alternatives to congested or politically sensitive traditional routes through the Suez Canal, Middle East, and Pacific crossings. This strategic advantage ensures the region continues to attract attention, even as progress remains slow.
11.5.2. FUTURE SYSTEMS
The Polar region’s expansion is more visible when measured in kilometers of subsea cable. By 2025, the total remains at approximately 6,000 kilometers, unchanged from 2024.
Figure 75: Cable Systems by Year - Polar, 2018-2030
The most recent significant increase occurred in 2022, when total kilometers jumped from 4,000 to 6,000. Since then, growth has plateaued, reflecting the absence of newly completed projects. Forecasts for 2026–2030 present wide uncertainty bands, ranging from stagnation to modest expansion, depending on the pace of investment and regulatory progress.
The Cable in Force (CIF) rate further illustrates the challenges. As of 2025, none of the four planned systems have reached CIF status.
This 0% CIF completion rate highlights the difficulty of moving projects from planning to execution. Delays are attributed to the region’s narrow construction windows, extremely high costs, and unresolved geopolitical tensions in the Arctic. By contrast, last year’s pipeline included three planned systems with no CIF progress; the increase to four planned projects suggests interest is expanding, but execution remains elusive.
Looking forward, Polar projects aim to cut Europe–Asia route lengths from ~20,000 km to ~14,000 km, effectively halving latency. Achieving this would provide a significant competitive advantage for financial markets, cloud providers, and hyperscalers that depend on near-instantaneous data transfer.
While no Antarctic cables exist today, research is underway into potential connections from Antarctica to South America or New Zealand. Such systems would be primarily research-driven, likely government-backed, and could help establish Polar infrastructure as a cornerstone of international scientific collaboration.
11.5.3. REGION OUTLOOK
The Polar region presents both extraordinary opportunities and substantial risks. Its three operational systems confirm technical feasibility, but progress has stalled in recent years, with no new completions since 2022.
From two systems in 2018 to three by 2025, and from 4,000 km to 6,000 km in the same period, the region’s growth is modest but symbolically important. Compared with last year’s projections, the outlook
Figure 76: KMS Added by Year - Polar, 2018-2030
remains unchanged: the Polar market is in a holding pattern, waiting for a breakthrough in investment, regulatory alignment, or geopolitical stability that could unlock its full potential.
Figure 77: CIF Rate - Polar Planned
Forecasts to 2030 indicate system counts could remain flat or expand modestly to four or more, depending on which planned projects secure financing and approvals. In kilometers, growth could range from no further increases to several thousand kilometers if at least one large-scale build proceeds.
Challenges Facing the Region
1. Extreme Environmental Conditions
The Arctic’s severe cold, ice coverage, and limited daylight impose narrow construction windows and high risks for long-term cable durability.
2. High Project Costs
Specialized ships, equipment, and insurance premiums make Polar projects among the most expensive globally, often requiring government or consortium backing.
3. Limited Infrastructure
A lack of local landing stations, terrestrial backhaul, and data centers raises costs and complicates project planning.
4. Political and Regulatory Hurdles
Overlapping territorial claims in the Arctic and strict regulations—particularly in Russian waters—create uncertainty and can delay approvals.
5. Uncertain Demand
While reduced latency is attractive, current demand levels may not yet justify the high costs, especially when established routes are available.
6. Limited Experience and R&D
Few projects have been attempted, leaving limited data on long-term cable performance in polar environments, such as resilience against shifting ice floes.
The Polar region remains a frontier market in the submarine cable industry—its challenges immense, but its strategic potential equally significant. With three operational systems and 6,000 km deployed as of 2025, the region has proven feasibility but is currently in a period of stagnation.
The planned pipeline of four projects indicates sustained industry interest, but the absence of CIF progress highlights the steep barriers to entry. Future development will depend on overcoming extreme environmental challenges, securing financing, and resolving geopolitical uncertainties.
Should these obstacles be managed, Polar systems could redefine global connectivity by creating ultra-low-latency corridors between Europe, Asia, and North America. Interest in Antarctic connections also hints at future expansion into the southern hemisphere, driven by scientific and governmental needs. For now, however, the Polar region’s role remains largely aspirational—an area of high strategic promise, awaiting the breakthroughs necessary to fulfill its potential.
“Oceania is particularly vulnerable, with fewer connections and lower bandwidth than other areas of the globe… For SIDS, the reliance on internet connectivity extends beyond convenience. It’s a lifeline for essential services like education, healthcare and economic activities.”
Dr. Lucy Bricheno & Dr. Isobel Yeo - National Oceanography Centre (STF
Issue 144)
11.6. TRANSATLANTIC
Regional Snapshot:
Current Systems: 19
Capacity: 1,754 Tbps
Planned Systems: 5
Planned Capacity: 972 Tbps
For a full list of systems in this region click here.
11.6.1. CURRENT SYSTEMS
The Transatlantic corridor continues to serve as one of the most vital arteries of global connectivity, linking the data-intensive economies of North America and Europe. As of 2025, the region supports 19 operational cable systems, unchanged from 2024. This stability follows a period of growth earlier in the decade, when the number of systems rose from 14 in 2018 to 19 by 2023, reflecting strong investment in transoceanic bandwidth.
78: Cable Systems by Year - Transatlantic, 2018-2030
The system count illustrates a plateau beginning in 2023, with the line holding steady at 19 for three consecutive years. This flattening contrasts with earlier growth spurts, such as the 2020–2021 period when multiple hyperscaler-backed systems entered service. The Transatlantic remains characterized by a mix of long-standing legacy cables and state-of-the-art deployments, including MAREA, Dunant, Grace Hopper, and Amitié, which collectively account for a significant share of the corridor’s modern capacity.
The traditional New York–London route continues to dominate, but newer systems are broadening landing diversity to France, Spain, and Ireland. This evolution reflects the growing need to de-risk connectivity by spreading capacity across multiple landing points. While no additional systems came online in 2025, several undersea upgrades have increased total available capacity, underscoring the corridor’s resilience.
11.6.2. PLANNED SYSTEMS
Growth in the Transatlantic is increasingly measured by kilometers of cable rather than system count alone. By 2025, the total cable length remains at 157,000 kilometers, unchanged from 2024 but substantially higher than the 143,000 kilometers in 2022.
Figure
The flat trendline from 2023 to 2025 reflects the maturation of several major builds and the completion of hyperscaler projects that defined the early 2020s. Nonetheless, forecasts project moderate gains in the second half of the decade, potentially pushing totals beyond 180,000 kilometers by 2030.
A key indicator of progress is the Cable in Force (CIF) rate, which in 2025 stands at 50%, with two planned systems having reached CIF and two still under development.
Figure 79: KMS Added by Year - Transatlantic, 2018-2030
Figure 80: CIF Rate - Transatlantic Planned
This is consistent with last year’s CIF rate, suggesting that while project pipelines are advancing, financing and regulatory hurdles remain significant. Unlike other regions where sovereign or regional connectivity programs drive deployments, the Transatlantic is dominated by private investment, particularly from hyperscalers. Their deep resources ensure projects progress steadily, while smaller, non-hyperscaler-backed initiatives often face slower timelines.
Future systems are expected to emphasize route diversity, including connections to Southern Europe and secondary landing points in North America. Some proposals also explore South America–Europe–North America tri-continental routes, reflecting broader efforts to diversify global backbone connectivity.
11.6.3. REGION OUTLOOK
The Transatlantic corridor remains the most bandwidth-intensive global subsea market, carrying the bulk of data traffic between two of the world’s largest digital economies. While system counts have plateaued, ongoing upgrades and continued CIF activity ensure the region will retain its centrality in global connectivity.
From 14 systems in 2018 to 19 in 2025 and from 120,000 kilometers in 2018 to 157,000 kilometers today, the data highlights significant infrastructure expansion over the past decade. While year-over-year growth has slowed, this reflects a shift toward quality over quantity: investments are now focused on increasing redundancy, lowering latency, and extending system lifespans.
Looking forward, the region is expected to surpass 20 systems by the late 2020s, with total kilometers approaching 180,000–200,000. Growth will be driven by hyperscaler demand, with additional routes developed primarily to support data center interconnection, cloud traffic, and content distribution.
Challenges Facing the Region
1. Regulatory and Political Complexities
Divergent regulatory regimes across the U.S. and Europe create hurdles, particularly concerning data privacy, environmental approvals, and cybersecurity standards. These can delay deployments and add to compliance costs.
2. Aging Infrastructure
While modern hyperscaler systems dominate new builds, many legacy cables are nearing end-of-life. Coordinating upgrades and decommissioning remains an ongoing challenge, requiring careful planning to avoid capacity bottlenecks.
3. Environmental Risks
Although the Atlantic Ocean is less hazardous than regions like the Pacific, risks remain from shipping routes, fishing activity, and undersea seismic events. Environmental protections around landing sites in Europe also introduce further constraints.
4. Competitive Landscape
The Transatlantic is highly competitive, with hyperscaler-driven consortia commanding most of the market. Independent developers face steep competition in financing and market capture, often limiting their ability to launch new projects.
5.
Financial
Barriers for Non-Hyperscaler Systems
Projects lacking hyperscaler backing face difficulties in securing capital. This results in a two-tiered market: hyperscaler projects progress quickly, while others face delays or risk cancellation.
The Transatlantic corridor remains the backbone of international data traffic, carrying unparalleled volumes of bandwidth between North America and Europe. With 19 systems and 157,000 kilometers deployed as of 2025, the region has reached a phase of consolidation and optimization rather than rapid expansion.
Future developments will prioritize latency reduction, redundancy, and route diversity, ensuring the corridor continues to evolve in step with rising global demand. Hyperscalers will remain the dominant force, shaping deployment strategies and driving investment. At the same time, challenges around regulation, aging infrastructure, and financing will continue to define the pace and structure of growth.
Overall, the Transatlantic’s trajectory is one of steady, incremental enhancement rather than explosive growth, ensuring it remains one of the most stable and strategically important subsea regions through the end of the decade.
11.7. TRANSPACIFIC
Regional Snapshot:
Current Systems: 16
Capacity: 949 Tbps
Planned Systems: 9
Planned Capacity: 1,442 Tbps
For a full list of systems in this region click here.
11.7.1. CURRENT SYSTEMS
The Transpacific region remains one of the most strategically important corridors for global data traffic, linking the United States and Asia across the Pacific Ocean. As of 2025, the region supports 20 operational cable systems, an increase from 16 in 2024. This represents one of the sharpest year-over-year gains in system count among global subsea corridors and underscores the critical role the Transpacific plays in enabling high-capacity, low-latency international connectivity.
Figure 81: Cable Systems by Year - Transpacific, 2018-2030
The system count trajectory highlights steady, incremental growth between 2018 and 2022, followed by a period of acceleration. From 12 systems in 2018, the corridor rose to 15 by 2022 and then 16 by 2024. The jump to 20 in 2025 reflects multiple systems reaching RFS (Ready for Service) dates almost simultaneously, including projects led by Hyperscalers and major consortia.
Key systems such as JUPITER, Curie, Hawaiki, Echo, and Apricot have significantly expanded bandwidth, creating new landing diversity beyond traditional routes between the U.S. West Coast and Japan. Recent deployments also reflect a growing emphasis on routes connecting Southeast Asia and Oceania, reducing reliance on legacy Transpacific cables concentrated in Northeast Asia.
Despite the impressive gains, challenges remain. Many of the earlier Transpacific cables are nearing the end of their design lifespans, and upgrading or decommissioning these legacy systems will be necessary to maintain capacity levels. The region’s long distances, frequently exceeding 15,000 kilometers per system, also continue to impose cost and logistical hurdles.
11.7.2.
FUTURE SYSTEMS
In terms of kilometers, the Transpacific region has seen one of the most dramatic expansions in recent years. By 2025, the region supports 313,000 kilometers of subsea cable, up from 258,000 in 2024.
This year’s surge represents the single largest year-over-year increase for the corridor since 2017, underscoring the scale of new builds. The forecast projects steady growth toward 350,000 kilometers by 2030, reflecting both new system deployments and planned upgrades.
The CIF (Contract in Force) metric illustrates how project pipelines are advancing. As of 2025, the Transpacific region has achieved a 75% CIF rate, with three of four planned systems having reached CIF.
Figure 82: KMS Added by Year - Transpacific, 2018-2030
Figure 83: CIF Rate - Transpacific Planned
This marks a significant improvement over 2024, when only 67% of planned systems had achieved CIF. The increase reflects the growing dominance of Hyperscaler-backed projects, which enjoy stronger financing, regulatory clearance, and construction momentum compared to independently funded systems. The one incomplete project signals that barriers remain, particularly for smaller developers, but overall the CIF performance is among the strongest globally.
Future deployments will emphasize route diversity to reduce risks associated with undersea seismic activity and geopolitical tensions. Several systems in development are designed to create South Pacific and Southeast Asian landings, improving connectivity to emerging markets while enhancing redundancy for core U.S.–Japan and U.S.–China traffic.
11.7.3. REGION OUTLOOK
The Transpacific remains the longest and one of the most complex subsea corridors, but also one of the most indispensable. With 20 systems and 313,000 kilometers deployed as of 2025, the corridor has entered a new phase of accelerated growth, driven by hyperscaler demand and the expanding digital economies of Asia-Pacific.
From 12 systems in 2018 to 20 in 2025, and from 207,000 kilometers to over 313,000 in the same period, the Transpacific’s infrastructure base has expanded by more than 50% in less than a decade. Year-overyear growth in both system count (+4 systems) and kilometers (+55,000 km) since 2024 highlights the exceptional pace of investment.
Looking ahead, forecasts suggest system counts will stabilize somewhat, growing incrementally to 22–23 systems by 2030, while kilometers could exceed 350,000. Much of this growth will continue to be led by hyperscalers, whose expanding data center footprints in Japan, Singapore, and Australia require ever-increasing transoceanic capacity.
Challenges Facing the Region
1. Regulatory and Political Complexities
Differing regulatory regimes across North America and Asia complicate project approvals. Issues such as cybersecurity standards, national data sovereignty, and environmental permitting can delay timelines.
2. Aging Infrastructure
Legacy systems deployed in the early 2000s are nearing end-of-life, requiring costly replacements or upgrades. Transitioning traffic without service disruption will remain a logistical challenge.
3. Environmental Risks
The Pacific Ocean’s depth and seismic activity increase risks from earthquakes, undersea landslides, and volcanic activity. Long cable spans also heighten exposure to accidental damage from shipping and fishing activity.
4. Competitive Market Dynamics
With multiple systems pursuing similar routes, competition is intense. Smaller, non-hyperscaler developers face difficulties securing landing stations and financing against larger, resource-rich hyperscaler consortia.
5. Financing Gaps for Independent Systems
Systems not backed by hyperscalers face persistent financial uncertainty, as capital-intensive projects must compete in a market dominated by a few large players. This dynamic risks limiting market diversity.
The Transpacific corridor stands out in 2025 as one of the fastest-growing subsea markets. With 20 systems and more than 313,000 kilometers deployed, the region has achieved record-setting year-over-year gains. A CIF rate of 75% underscores the strong momentum behind planned builds, particularly those supported by hyperscalers.
While regulatory, financial, and environmental challenges persist, the Transpacific’s strategic role ensures it will remain a critical global data corridor for decades to come. Future growth will be defined less by sheer system count and more by route diversity, capacity optimization, and system resilience. Ultimately, the Transpacific will continue to serve as the backbone of U.S.–Asia connectivity, enabling the bandwidth needed to power global trade, cloud services, and digital economies across the Pacific Rim.
AFTERWORD
This year’s report reveals an industry no longer defined solely by expansion, but by coordination. The submarine cable sector has matured into a permanent pillar of global infrastructure — stable, self-sustaining, and deeply integrated with every facet of the digital economy. Yet, for all that maturity, volatility hasn’t disappeared; it has only evolved. Instead of being driven by technology cycles, today’s uncertainty stems from geopolitics, regulation, and supply constraints. We’ve entered a new phase where stability and unpredictability coexist — where the industry’s greatest strength lies in its ability to adapt under pressure.
One of the clearest shifts has been in how projects are financed. Self-financing remains dominant, but capital is now flowing toward regions once considered peripheral. Development bank funding has quietly migrated toward the Indian Ocean and Asia-Pacific, following both risk and opportunity. What was once a quiet corridor has become the strategic hinge connecting Europe, Africa, and Asia — a route that embodies redundancy, resilience, and strategic depth. This transition signals a broader rebalancing of global connectivity: one where investment, strategy, and infrastructure increasingly converge eastward.
The Industry Sentiment Survey reinforces this transformation. Confidence across the sector remains remarkably strong, with 100% of respondents reporting optimism for 2025 — yet that optimism has matured. The share identifying as “very optimistic” fell, replaced by a broader and steadier sense of pragmatic confidence. The industry knows where it stands: growth is assured, but delivery and execution are harder than ever. With nearly 96% of respondents reporting higher workloads and 91% rating investment as above average, the data paints a picture of an industry running at full capacity — energized, but stretched.
“Confidence across the sector remains remarkably strong, with 100% of respondents reporting optimism for 2025 — yet that optimism has matured.”
“Project delays are increasingly common, with nearly 80% of respondents citing some form of delay — a testament to both high activity and persistent supply-side friction.”
Constraint, rather than demand, has become the defining feature of this phase. The cable ship fleet remains flat, straining timelines and reshaping deployment priorities. Project delays are increasingly common, with nearly 80% of respondents citing some form of delay — a testament to both high activity and persistent supply-side friction. And beneath it all lies an emerging structural risk: talent. Over 70% of respondents now describe skilled labor as insufficient or critically short, marking the sharpest workforce challenge in the survey’s history. Attracting new talent has overtaken training and succession as the foremost workforce concern, suggesting an urgent need to cultivate the next generation of subsea professionals before institutional knowledge gaps widen further.
At the same time, technological readiness has surged. Nearly four in five organizations now describe themselves as prepared for new technologies, up from less than half just a year ago. Artificial intelligence and machine learning have moved from the margins to the center of operational strategy, cited by over 90% of respondents as the most transformative technologies of the coming decade. This readiness mirrors a broader cultural shift: the industry is no longer merely adopting new tools — it is integrating them as core infrastructure, applying data-driven efficiency to design, route planning, and maintenance.
Sustainability, meanwhile, stands at a crossroads. Measurable progress has plateaued; nearly half of re-
spondents now describe the industry’s environmental trajectory as neutral or unclear. Yet, this plateau may reflect growing expectations rather than stagnation. As performance standards like PUE, CUE, and REF become embedded into project design, environmental accountability is evolving from compliance to culture — a transition led increasingly by universities, research centers, and new entrants to the field. The next challenge is visibility: proving that these internal commitments translate into measurable global outcomes. Regulation continues to emerge as a defining force. The intersection of antitrust, competition, resilience, and sustainability has reshaped how policymakers view submarine networks. What were once telecom assets are now seen as critical international infrastructure. The implications are profound: the industry must now meet not only market demand but geopolitical expectation — proving that resilience is every bit as important as reach.
Taken together, these findings reveal an industry balancing maturity with momentum. It is confident, capital-rich, and technologically agile, yet constrained by human capacity and global logistics. The optimism that once fueled expansion is now tempered by awareness — of risk, responsibility, and the limits of speed. The submarine cable sector is learning not just to grow, but to govern itself.
Looking across it all, the story of 2025 is one of integration. Investment, sustainability, technology, and governance are no longer separate tracks; they have merged into a single framework for progress. The next era of this industry will not be measured in kilometers or terabits, but in coherence — in how effectively we align innovation, policy, and people to sustain the networks that sustain the world.
As we look toward 2026 and beyond, the message is clear: the subsea industry has evolved from a frontier into a foundation. It no longer thrives in the margins between continents — it is the connective tissue of the global economy. And as we navigate this era of coordination, collaboration, and accountability, one truth remains constant: the cables beneath our oceans still carry more than data. They carry trust, ambition, and the shared progress of a connected world.
“As we look toward 2026 and beyond, the message is clear: the subsea industry has evolved from a frontier into a foundation. It no longer thrives in the margins between continents — it is the connective tissue of the global economy.”
Thanks for reading, and for continuing this journey with us — one year, one system, one connection at a time.
Kieran Clark Senior Analyst, Submarine Telecoms Forum
WORKS CITED
A&O Shearman. (2025, March). Global Antitrust Enforcement Report, March 2025. Retrieved from A&O Shearman: https://www.aoshearman.com/en/insights/global-antitrust-enforcement-report
AInvest/Nikkei. (2025). apan to back undersea cable investments for national security. Retrieved from AInvest/Nikkei: https://www.ainvest.com/news/japan-to-back-undersea-cable-investments-for-national-security-nikkei-2502100003bc6cd838731fe5/
Anritsu. (2025, September 30). World’s First Successful Remote Diagnosis for Multicore Optical Fiber Cable by Anritsu and KDDI Research. Retrieved from Anritsu: https://www.anritsu.com/en-us/test-measurement/news/news-releases/2025/2025-09-30-us01
ASN. (2025, March 24). E2A Consortium Unveils Next-Generation Submarine Cable Connecting Asia and the United States. Retrieved from ASN: https://www.asn.com/press-release/e2a-pacifc-submarine-cable/
Belgian Institute for Postal Services and Telecommunications (BIPT). (2025, July 23). Public Consultation on the Draft Royal Decree on Submarine Cable Installations. Retrieved from Belgian Institute for Postal Services and Telecommunications (BIPT): https://www.icj-cij.org/sites/default/files/case-related/187/187-20250723-adv-01-00-en.pdf
BNAmericas. (2024, November 22). Data Insight: The upcoming submarine cables for Latin America and the Caribbean. Retrieved from BNAmericas: https://www.bnamericas.com/en/features/data-insight-the-upcoming-submarine-cables-for-latin-america-and-the-caribbean
Business Norway. (2024, December 19). Offshore wind farm locations: a global overview. Retrieved from Business Norway: https://businessnorway.com/articles/offshore-wind-farm-locations-a-globaloverview
Ciena. (2025, September 8). Altibox Carrier Achieves World’s First 1.6 Tb/s Submarine Cable with Ciena. Retrieved from Ciena: https://www.ciena.com/about/newsroom/press-releases/altibox-carrierachieves-worlds-first-1-6-tbs-submarine-cable-with-ciena
Ciena. (2025, June 25). Telxius and Ciena Achieve First Live 1.3 Tb/s Data Transmission Across the Atlantic. Retrieved from Ciena: https://www.ciena.com/about/newsroom/press-releases/telxius-and-cienaachieve-first-live-1.3-tbs-data-transmission-across-the-atlantic
Cisco. (2024, February 12). Cisco Delivers 800Gbps on Amitié Transatlantic Cable in Collaboration with Microsoft to Support Exponential Growth of Cloud and AI Services. Retrieved from Cisco: https:// newsroom.cisco.com/c/r/newsroom/en/us/a/y2024/m02/cisco-delivers-800gbps-on-amitie-transatlantic-cable-in-collaboration-with-microsoft-to-support-exponential-growth-of-cloud-and-ai-services.html
Converge! Digest. (2025, August). US FCC Adopts Order to Accelerate and Secure U.S. Subsea Cables. Retrieved from Converge! Digest: https://convergedigest.com/fcc-adopts-new-rules-to-accelerateand-secure-u-s-subsea-cables
CSIS. (2025). The Strategic Future of Subsea Cables: Japan Case Study. Retrieved from CSIS: https://www. csis.org/analysis/strategic-future-subsea-cables-japan-case-study
De Bevoise LLP Insights. (2024, November). FCC Proposes New Rules to Strengthen National Security in Submarine Cable Systems. Retrieved from De Bevoise LLP Insights: https://www.debevoise.com/ insights/publications/2024/11/fcc-proposes-new-rules-to-strengthen-national-sec
European National Competition Authorities. (2025, April 22). Strengthening Competitiveness and Competition in the EU Single Market . Retrieved from Bundeswettbewerbsbehörde: https://chatgpt. com/c/68f785fb-0970-8329-b3ba-a9fb4b4b2c77
FCC. (2025). Review of Submarine Cable Landing License Rules and Procedures to Assess Evolving National Security, Law Enforcement, Foreign Policy, and Trade Policy Risks. Retrieved from FCC: https://www.fcc.gov/document/fcc-acts-accelerate-submarine-cable-buildout-security-0
Federal Communications Commission (FCC). (2025, May 7). Cable Landing License Act: Amendment of Section 1.767 – FCC 25-49A1. Retrieved from Federal Communications Commission: https://docs. fcc.gov/public/attachments/FCC-25-49A1.docx
Financial Times. (2025, September 16). Japan set to make subsea cables a national security issue with support for new fleet. Retrieved from Financial Times: https://www.ft.com/content/8bf18101-4afa4110-aad8-66fc76c4c70a
Grey, D. (2025, March 17). NTT DATA commissions MIST submarine cable system to link India and Southeast Asia. Retrieved from w.media: https://w.media/ntt-data-commissions-mist-submarine-cablesystem-to-link-india-and-southeast-asia/
GWEC. (2025, June 25). Offshore wind installed capacity reaches 83 GW as new report finds 2024 a record year for construction and auctions. Retrieved from Global Wind Energy Council: https://www. gwec.net/gwec-news/offshore-wind-installed-capacity-reaches-83-gw-as-new-report-finds-2024a-record-year-for-construction-and-auctions
Hamilton, D. D. (2024, March). The Transatlantic Digital Economy Chapter 5. Retrieved from Transatlantic Relations: https://transatlanticrelations.org/wp-content/uploads/2024/03/Chapter-5.pdf
Hardy, S. (2023, June 6). Meta’s Anjana submarine cable to land at DC BLOX South Carolina cable landing station. Retrieved from Lightwave Online: https://www.lightwaveonline.com/network-design/ packet-transport/article/14294806/metas-anjana-submarine-cable-to-land-at-dc-blox-south-carolina-cable-landing-station
Huston, G. (2022, June 2). The politics of submarine cables in the Pacific. Retrieved from APNIC: https:// blog.apnic.net/2022/06/02/the-politics-of-submarine-cables-in-the-pacific/
Inskit Group. (2025, July 17). Submarine Cables Face Increasing Threats Amid Geopolitical Tensions and Limited Repair Capacity. Retrieved from Recorded Future: https://assets.recordedfuture.com/insikt-report-pdfs/2025/ta-2025-0717.pdf
International Advisory Body on Submarine Cable Resilience. (2025, February 26). The International Advisory Body on Submarine Cable Resilience Declaration . Retrieved from ITU: https://www.itu.int/ digital-resilience/submarine-cables/wp-content/uploads/sites/2/2025/02/summit-declaration-nigeria-2025.pdf
International Telecommunication Union. (2025, January 10). Revised Consolidated Texts of the International Telecommunication Regulations – 2025 Draft. Retrieved from International Telecommunication Union (ITU): https://www.isa.org.jm/wp-content/uploads/2025/01/10012025-Revised-Consolidated-Text-2.pdf
JFIR. (2025). Strengthening Economic Resilience and Security through US Japan Cooperation. Retrieved from JFIR: https://www.jfir.or.jp/en/studygroup_article/4628/
Keppel. (2025, October 2). Bifrost Cable System achieves Ready for Service status, primed for trans-pacific connectivity. Retrieved from Keppel: https://www.keppel.com/media/bifrost-cable-systemachieves-ready-for-service-status-primed-for-trans-pacific-connectivity/
Latham & Watkins. (2024). FCC Reviews Submarine Cable Rules to Address National Security and Law Enforcement Risks. Retrieved from Latham & Watkins: https://www.lw.com/en/admin/upload/SiteAttachments/FCC-Reviews-Submarine-Cable-Rules-to-Address-National-Security-and-Law-Enforcement-Risks.pdf
MARITIME, RIVER AND LAKE NAVIGATION REGIME. (2025, July). Retrieved from Boletin Oficial: https:// www.boletinoficial.gob.ar/detalleAviso/primera/319825/20250120
MarketsandMarkets. (2025, October 25). Oilfield Communications Market worth $8.60 billion by 2030 | MarketsandMarkets™. Retrieved from PRNewswire: https://www.prnewswire.com/news-releases/ oilfield-communications-market-worth-8-60-billion-by-2030--marketsandmarkets-302572190.html Mercosur. (2025, July). SEGURIDAD Y RESILIENCIA DE INFRAESTRUCTURAS DE CABLES. Retrieved from MERCOSUR: https://normas.mercosur.int/simfiles/normativas/107695_REC_001-2025_ES_Seguridad%20Infraest%20cable%20submarinos.pdf
National Communications Authority (Federal Republic of Somalia). (2025, May). Submarine Cable Regulations 2025. Retrieved from National Communications Authority (NCA): https://nca.gov.so/wp-content/uploads/2025/05/Submarine-Cable-Regulations-2025.pdf
NICT. (2025, May 29). World Record Achieved in Transmission Capacity and Distance: With 19-core Optical Fiber with Standard Cladding Diameter 1,808 km Transmission of 1.02 Petabits per Second. Retrieved from National Institute of Information and Communications Technology: https://www.nict. go.jp/en/press/2025/05/29-1.html
NTT Data. (2025, March 18). NTT DATA Announces Commissioning of 8,100-km MIST Submarine Cable System by 2025. Retrieved from Wire & Cable India: https://www.wirecable.in/ntt-data-announces-commissioning/
Offshore Mag. (2024, October 1). Pioneer Consulting to support deployment of Petrobras’ fiber-optic cable system offshore Brazil. Retrieved from Offshore Mag: https://www.offshore-mag.com/regional-reports/latin-america/news/55172943/pioneer-consulting-to-support-deployment-of-petrobras-fiber-optic-cable-system-offshore-brazil
Palmer-Felgate, A. (2025). Global Cable Repair Data Analaysis. ICPC Annual Plenary. Montreal. Poutonnet, P. (2020, July 31). Infrastructure for all: What happened at Next OnAir this week. Retrieved from Google Cloud Blog: https://cloud.google.com/blog/topics/google-cloud-next/what-happenedweek3-of-google-cloud-next20-onair
Qiu, W. (2024, December 10). Aqua Comms and Ciena Trial 1.3Tbps Wavelength on 5500km Trans-Atlantic AEC-1 Cable Route. Retrieved from Submarine Cable Networks: https://www.submarinenetworks. com/en/systems/trans-atlantic/aeconnect/aqua-comms-and-ciena-trial-1-3tbps-wavelength-on5500km-trans-atlantic-aec-1-cable-route
Reuters. (2025, July 16). US aims to ban Chinese technology in undersea telecommunications cables. Retrieved from Reuters: https://www.reuters.com/world/china/us-aims-ban-chinese-technology-submarine-cables-ft-reports-2025-07-16/
RioTimes Online. (2025). Japan Bolsters Submarine Cable Investments Amid Rising Security Concerns. Retrieved from RioTimes Online: https://riotimesonline.com/japan-bolsters-submarine-cable-investments-amid-rising-security-concerns
Roy, A. (2023, January 3). Submarine Cable – A Critical Component of Offshore Wind Project. Retrieved from TATA Consulting Engineers Limited: https://www.tataconsultingengineers.com/blogs/submarine-cable-a-critical-component-of-offshore-wind-project/
Semafor. (2025, September). Japan invests in subsea cable-laying ships. Retrieved from Semafor: https:// www.semafor.com/article/09/16/2025/japan-invests-in-subsea-cable-laying-ships
Softbank Corp. (2025, September 22). SoftBank Corp. and Partners Agree to Build “Candle” Submarine Cable System Connecting Japan and Singapore. Retrieved from Soiftbank: https://www.softbank. jp/en/corp/news/press/sbkk/2025/20250922_01/
Steventon-Barnes, J. (2025, March 6). Written evidence submitted by Jeremy Steventon-Barnes, former Chief Technology & Information Officer, EXA Infrastructure. Retrieved from UK Parliament: https:// committees.parliament.uk/writtenevidence/138729/pdf/
Submarine Networks. (2025). U.S. FCC Adopts Order to Accelerate Submarine Cable Buildout & Security. Retrieved from Submarine Networks: https://www.submarinenetworks.com/en/nv/insights/ us-fcc-adopts-order-to-accelerate-submarine-cable-buildout-security
Subsea Cables Industry News. (2025). Japan Backs NEC Fleet to Secure Undersea Cable Infrastructure. Retrieved from Subsea Cables Industry News: https://www.subseacables.net/industry-news/japan-backs-nec-fleet-to-secure-undersea-cable-infrastructure
Tagare, S. (2025, July 10). Takeaways From Lisbon SubOptic 2025. Retrieved from Internet Society Pulse: https://pulse.internetsociety.org/blog/takeaways-from-lisbon-suboptic-2025
Tampnet. (2025, March 4). Tampnet to provide high-speed, fibre based connectivity enabling remote operations for Woodside’s Trion Project in the Gulf of Mexico. Retrieved from Tampnet: https://www. tampnet.com/press/tampnet-to-provide-high-speed-fibre-based-connectivity-enabling-remote-operations-for-woodsides-trion-project-in-the-gulf-of-mexico
Telecommunications Regulatory Authority – Oman. (2025, May 4). Decision No. 1151/2/30/2025-9. Retrieved from Telecommunications Regulatory Authority – Oman: https://www.tra.gov.om/En/DownloadFile.jsp?type=PublicationList&code=295
Tom’s Hardware. (2025, September). Japan subsidizes undersea cable vessels over ‘very serious’ national security concerns. Retrieved from Tom’s Hardware: https://www.tomshardware.com/networking/japan-to-subsidize-undersea-cable-vessels-over-very-serious-national-security-concerns-will-frontup-to-half-the-cost-for-usd300-million-vessels-bought-by-nec
TS2.Tech. (2025). Japan’s $300 Million Undersea Cable Gamble: Inside the Global Race to Secure the Internet’s Lifelines. Retrieved from TS2.Tech: https://ts2.tech/en/japans-300-million-undersea-cablegamble-inside-the-global-race-to-secure-the-internets-lifelines/
UNESCO Intergovernmental Oceanographic Commission / The Ocean Decad. (2025, August 27). Advancing Ocean Data Sharing for Sustainable Development in Areas Within National Jurisdiction. Retrieved from The Ocean Decade: https://oceandecade.org/publications/advancing-ocean-data-sharing-for-sustainable-development-in-areas-within-national-jurisdiction/
Wong, S. (2022, April 6). Google’s subsea fiber optics, explained. Retrieved from Google Cloud Blog: https:// cloud.google.com/blog/topics/developers-practitioners/googles-subsea-fiber-optics-explained
A T A GLANC E
SubTel Forum continues to be the most trusted voice in the global submarine cable industry, with unparalleled reach, deep market engagement, and a proven platform for thought leadership and brand visibility.
We continue to provide industry suppliers with a wide range of connection options and for 2026 we are excited to introduce a new product, the Cableship Codex! The Cableship Codex is a quarterly industry reference dedicated to the world of cableships and their operators, vendors, and innovations. Like all SubTel Forum offerings, the Codex is built to inform, connect, and elevate the industry.
OU R SPONSORS INCL U DE :
Top 10 Countries by Readership
United States (30.1%)
France (13.22%)
United Kingdom (11.23%)
South Africa (10.47%)
Singapore (7.11%)
India (6.78%)
Japan (6.1%)
Australia (5.48%)
Germany (5.46%)
Philippines (4.05%)
THE DECISION MAKERS: 64.28% of the SubTel Forum audience are either the final decision maker or have a high influence on the final purchase. 35.72% are involved in making purchasing recommendations.
DEEP INDUSTRY EXPERIENCE: 85.72% of the SubTel Forum audience have greater than ten years of industry experience.
Lorem ipsum
Subtel Forum Bi-Monthly
SubTel Forum, the premier publication in the submarine telecoms industry, offers focused issues that delve into specific market aspects. Each issue stands out with:
• An average of more than 1,000 unique reads per issue and an average read time of more than 8 minutes
• Two Months Exposure & Endless Archiving: Extended visibility and perpetual access for your ads
SPONSO R SHIP BENEFITS W ITH SUBTEL FO R UM :
• Video Embedding: Optional 30-second slot for Full and Two-Page ads.
• Social Media Shoutouts: For Full and Two-Page spreads on LinkedIn, Facebook, and Twitter.
• Print Ads: 300 dpi in PDF or JPG with crop marks.
• Video Ads: 30-second clips in 1280x720 or 1920x1080 resolution, mp4 format.
• Optional Video - 30 seconds
▪ 1280x720 or 1920x1080 resolution - mp4 Video File
EDITORIAL CALENDAR:
January 2026: Global Outlook, SNW EMEA '26 Preview
March 2026: Finance & Legal, ICPC '26 Preview
May 2026: Global Capacity
July 2026: Regional Systems, SNW '26 Preview
September 2026: Offshore Energy, IWCS '26 Preview
November 2026: Data Centers & New Tech, PTC '27 Preview, STF @25
Learn more, customize your campaign, or place an order by contacting Kathleen Turner at [+1] 804-469-0100 or kturner@associationmediagroup.com
Subtel Forum Quarterly
The SubTel Form Almanac, released quarterly, is a key reference for the submarine cable industry. Each issue showcases major international systems with detailed pages featuring system maps, landing points, capacity, length, and RFS year, among other data.
QUA R TE R LY DO W NLOADS & EXPOSURE :
• Each issue averages about 850 unique reads, 215 clicks, and a greater than 24 minute read time.
• Three months of exposure plus permanent archiving.
SPONSO R SHIP BENEFITS :
• Banner Ad on the Quarterly Almanac web page for the issue duration.
• Prominent Two-Page Spread Ad near the front.
• Logo/Link on cover and webpage acknowledgement.
• Web Banner on News Now feed.
• Social media acknowledgement.
• Press release and mailer mention.
R T & V IDEO R EQ U I R EMENTS :
• Size: 17” W x 11” H for Two-Page Spread. Resolution: 300 dpi, in PDF or JPG
EDITORIAL CALENDAR:
February 2026: By System Age
May 2026: By Region
August 2026: By System Supplier
November 2026: By System Owner
Subtel Forum
CABLESHIP CODEX
The SubTel Forum Cableship Codex is a brand new publication delivering expert analysis, fleet intelligence, and operational insights on the global fleet of cable installation and maintenance vessels. An essential reference for marine coordinators, project managers, operators, and decision-makers in subsea cable deployments, each issue includes featured profiles of cable ships, regional fleet coverage and deployment maps, quarterly insights and trends, and much more.
QUA R TE R LY DO W NLOADS & EXPOSURE :
• Each issue averages about 850 unique reads, 215 clicks, and a greater than 24 minute read time.
• Three months of exposure plus permanent archiving.
SPONSO R SHIP BENEFITS :
• Banner Ad on the Cableship Codex web page for the issue duration.
• Prominent two-page spread in the first third of the publication (or location as requested).
A R T & V IDEO R EQ U I R EMENTS :
• Size: 17” W x 11” H for Two-Page Spread. Resolution: 300 dpi, in PDF or JPG
EDITORIAL CALENDAR:
December 2025: Year in Review - Missions, Metrics & Standouts
March 2026: The Global Fleet - Capacity, Age & Coverage
June 2026: Cable Ship Operators - Who Runs the Fleet?
September 2026: Tools of the Trade - Systems, Deck Gear & Innovation
Subtel Forum Industry
REPOR T
The SubTel Forum Annual Report offers the latest, comprehensive data on the submarine fiber market, analyzing system capacity, productivity, and industry outlook. The yearly Industry report typically generates more than 2700 unique reads with an average read time of more than 11 minutes.
ANNUAL PRICE: $3,350
SPONSO R SHIP BENEFITS :
• Two-page Spread Ad.
• Social media acknowledgement.
• Press release and mailer acknowledgement.
A R T & V IDEO R EQ U I R EMENTS :
• Two-page Spread: 17” W x 11” H, 300 dpi in PDF or JPG.
• Optional video: include a blank box for overlay; no size restrictions.
LOCK IN NO W FO R 20 2 6 !
Sponsors can secure a spot in one of the various categories below. First come-first served!
• Global Overview
• Capacity
• Ownership Financing Analysis
• Supplier Analysis
• System Maintenance
• Cable Ships
• Hyperscalers and The Evolution of Submarine Cable Ownership
• Special Markets
• Regulatory Outlook
• Regional Analysis and Capacity Outlook
Note: Subtel Forum reserves the right to change categories
THE SUBMARINE TELECOMS FORUM DIRECTORY
This new directory is designed for industry professionals to locate companies that provide products or services to the submarine telecom cable and network operations sector. In the last twelve months more than 5,600 users viewed more than 10,000 pages. Make sure your company is featured prominently!
• Starting at $625/year
Subtel Forum
PRINT CABLE MAP
Feature your logo on our beautiful, large format print map, which proudly showcases every major international submarine cable system. This map is a fixture in many offices across the industry.
Limited Availability:
Wide Distribution:
Only 22 spaces for logos.
Over 4,500 copies shared at key industry events including Pacific Telecommunications Council (January 2026), Submarine Networks EMEA (May 2026), Submarine Networks World (September 2026), and IWCS Cable & Connectivity Industry Forum (November 2026).
ANNUAL PRICE: $4,500
SPONSO R SHIP PERKS :
• Comlimentary Web Banner on News Now feed
• Social Media shoutouts
• Acknowledgement in press releases and mailers
• In addition to the print copies that you may pick up during key industry events you can secure a print-ready PDF to print copies for staff and customers. Updated quarterly!
Subtel Forum
ONLINE CABLE MAP
New for 2026, the SubTel Forum Online Cable Map will feature quarterly themes that spotlight the biggest conversations in our industry.
• Q1: System Age & Lifecycle – Maintenance, repair & replacement