MED OIL & GAS
2023 Magazine

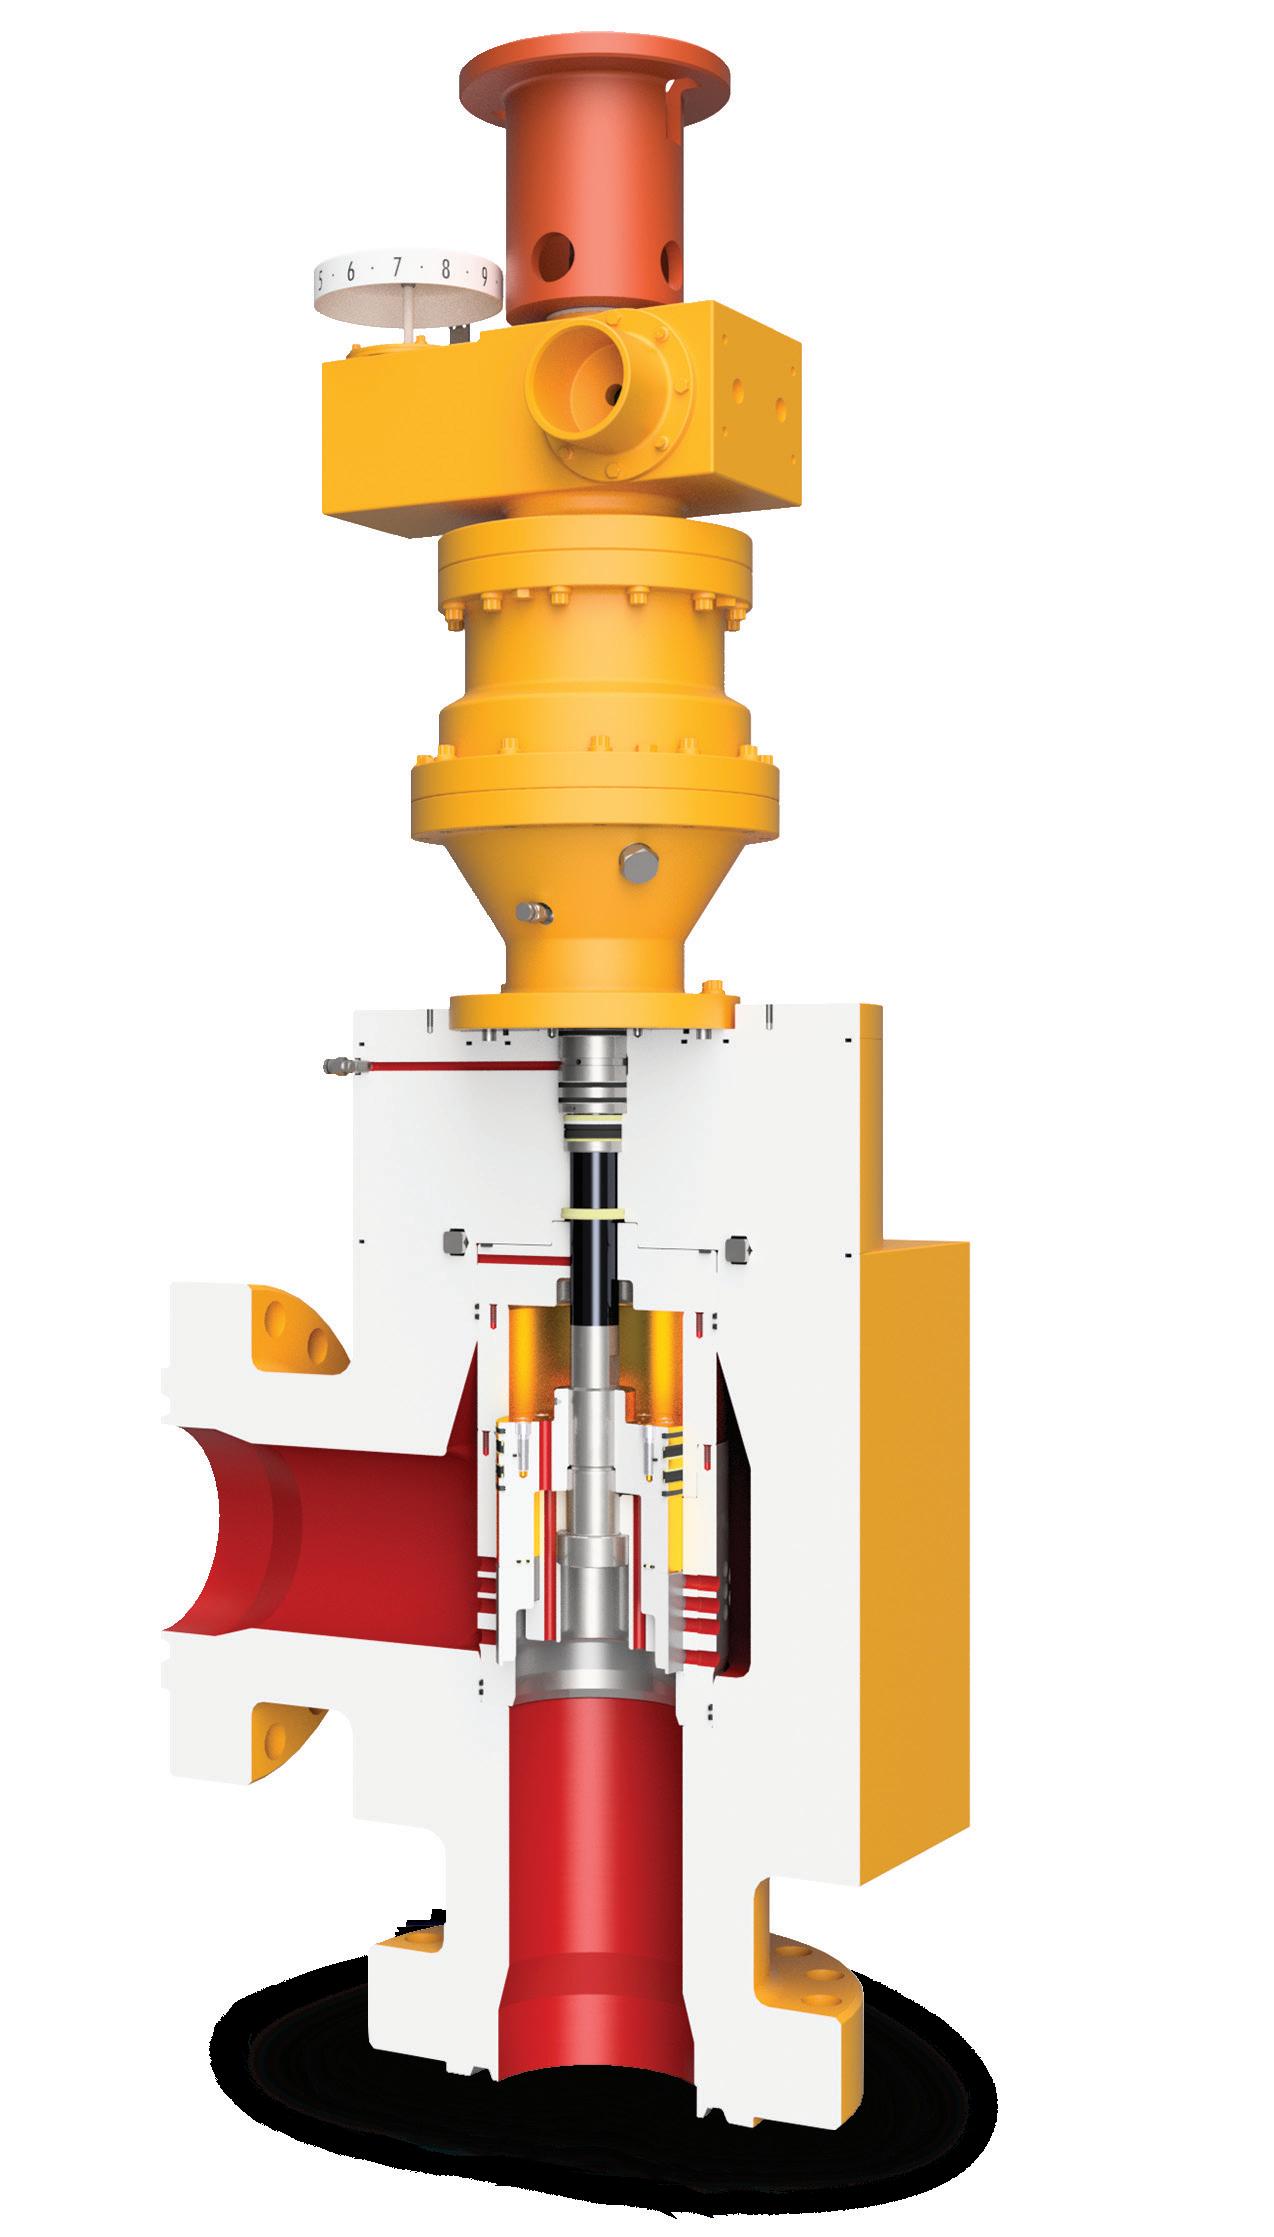
The Series 1275 Subsea Control Valves are a new and fully qualified range, designed, engineered and tested at our Brighouse facility in the UK.
Key features include:
- Specialist trim technology to suit all applications
- Repeatable and dependable operation

- Enhance wear resistance
- Backlash removal
- Highly accurate
- Power efficient
KOSO Kent Introl has over 35 years’ experience in the subsea industry manufacturing a range of Control and Choke Valves for the world’s largest energy companies.


Shell reported a write-down of $5 billion on its exit from Russia last year but said that would not affect its oil and gas profits. It was one of the first companies to declare it would leave Russia after the Ukraine invasion.
TotalEnergies, on the other hand, was slow to exit. The French supermajor had a stake in an LNG project led by Novatek and, in late 2022, Total said it would drop it and leave, taking an impairment of $3.7 billion since it could not sell it back to Novatek because of the Western sanctions on Russia.
• BP, Shell, and TotalEnergies collectively account for 40% of the total $110 billion losses after leaving Russia.
• While higher oil and gas prices helped buffer these energy giants, other industries like carmakers and utilities also faced substantial financial setbacks from their Russian exit.
• Despite hefty exits, over half of European businesses and some Japanese energy majors continue to operate in Russia for varied reasons, including energy security.
The oil industry, including companies BP, Shell, and TotalEnergies, was the industry that suffered the greatest financial losses from leaving Russia, an analysis by the Financial Times has revealed.
Out of total losses of some 100 billion euro, or some $110 billion, the losses incurred by Big Oil majors account for about 40%. Next were utilities, which account for over 15% of the total losses.
BP last year booked an impairment cost of $24 billion on its Russian business after it left the country. The supermajor had a minority stake in Rosneft. The 19.75% interest accounted for around 50% of BP’s total oil and gas reserves and a third of its oil and gas production.
Earlier in the year, TotalEnergies said it would incur an impairment of some $4.1 billion on its exit from Russia, to be booked in its first-quarter 2022 report. The biggest portion of that impairment came from the Arctic LNG 2 project of Novatek and the reduction in gas reserves TotalEnergies had to book with its pullout. According to FT calculations, TotalEnergies’ total cost of leaving Russia came in at $14.8 billion.

‘Paris, April 27, 2022 – On March 22, 2022, TotalEnergies announced that, given the uncertainty created by the technological and financial sanctions on the ability to carry out the Arctic LNG 2 project currently under construction and their probable tightening with the worsening conflict, TotalEnergies SE had decided to no longer book proved reserves for the Arctic LNG 2 project.
Since then, on April 8th, new sanctions have effectively been adopted by the European authorities, notably prohibiting export from European Union countries of goods and technology for use in the liquefaction of natural gas benefitting a Russian company. It appears that these new prohibitions constitute additional risks on the execution of the Arctic LNG 2 project.
As a result, TotalEnergies has decided to record in its accounts, as of March 31, 2022, an impairment of $4.1 billion, concerning notably Arctic LNG 2.’
Yet these were only the direct hits to the supermajors. The Financial Times studied their more recent financial reports to calculate the losses, meaning those impairment charges
were just the start. The calculations also did not include the surge in oil and gas prices last year.
That surge certainly benefited oil and gas companies, somewhat cushioning the blow for BP, Shell, and TotalEnergies, but at the same time, it delivered a blow to all other companies that had already booked billions in losses from their pullout from Russia.
Meanwhile, BP, Shell, and Total booked the biggest individual write-downs on their Russian operations when they left because of the size of their exposure to the local oil and gas industry. Yet higher oil and gas prices more than made up for those impairments as the three booked a combined 95 billion euro in profits, equal to some $104 billion and more than twice as high as the combined impairment costs of around $40 billion.
Carmakers such as Volkswagen and Renault, as well as chemicals producers, also suffered hefty losses from their exit from Russia. But there are also some multinational majors such as Nestle and Unilever that remain in Russia. Banks, including UniCredit and Raiffeisen, also continue to operate in the country, although both have said they were looking for a buyer for their Russian businesses. Utility companies such as Uniper and Wintershall Dea also lost billions from leaving Russia, with the total cost coming in at 14.7 billion euro, equal to about $16 billion.
Even so, more than half of European businesses that were operating in Russia prior to 2022 remain in the country, according to the Kiev School of Economics, a research institute. Prior to 2022, these totalled 1,871 entities, according to the KSE data.
A couple of Japanese energy majors also remain in Russia despite G7 sanctions, to which Japan is a party. The government in Tokyo last year judged the stakes Japanese companies held in the Sakhalin-1 and Sakhalin-2 oil and gas projects as critical for the country’s energy security. As a result, the Japanese shareholders in these projects were offered to retain their stakes, which they did.
Digital twins have in recent years received increasingly more attention as their value creation has become more apparent when utilised in an efficient manner. More are realizing that an efficient use of digital twins might be the key to not only a more optimised future, but also in supporting other important aspects in the industry.
By Nadir Azam and Anders Andreasen, RambollThere are many understandings of what a digital twin is and what it is not. In this article, a digital twin is understood as a virtual representation of an object or system that potentially spans its lifecycle, can be updated from real-time data, and uses simulation, machine learning and reasoning to help decision-making.
A digital twin consists of several facets and layers, which may separately or combined contribute to increased value in their own way within different disciplines. In this article, we will focus on showing how digital twins specific for structural integrity, referred to in this article as True Digital Twin, and process simulations, referred to as Process Digital Twin, have been used to create value and support a safer, more optimised, and sustainable industry.
There are several quantifiable and unquantifiable benefits of using a digital twin. The True Digital Twin technology, focusing on structural integrity of structures, has demonstrated its value throughout the past 25 years. It enables cost reduction, provides safer operation, and supports sustainability by allowing for optimisation of operational performance and life cycle management. These benefits are highly valuable in for example lifetime extension projects where the technology may be the differentiator between being able to reuse existing
structures or having to decommission and build new ones.
The technology may at the same time provide invaluable information in time of need, for example during expected or unexpected critical events such as storms, ship impacts, vibrations etc.
The True Digital Twin technology allows for moving from costly and time-consuming experimental testing in the laboratory to cost-reducing full-scale testing in the field under real operational conditions, which enables safer and more cost-efficient operation of the asset.
Utilising a digital twin for process simulations can enable optimisation and offers unparalleled insight and facilitates increase in revenue, reduction in OPEX and more importantly reduced greenhouse gas emission footprint. The methodology presented in this article can be applied for brownfield optimisation as well as for basic design of greenfield facilities. In the design phase, the method can assist in choosing the best process scheme and selecting favourable operating conditions for minimisation of both CAPEX and OPEX. Another interesting and increasingly important area is lifetime extension and maximising the usability of existing facilities for tie-backs through detailed bottleneck identification studies.
Digital Twin
Ramboll combines digitalisation with innovative structural health monitoring to create the True Digital Twin for structures. The technology is a state-of-the-art methodology to facilitate coupling between the real physical conditions and their structural analysis models, which captures the real-life behaviour of structures in real-time.
The True Digital Twin technology has several applications within optimised operational performance and life cycle management.
Specific use cases include among others lifetime extension projects, root cause analyses, uncovering knowledge gaps, detection of changes, and predictive maintenance.
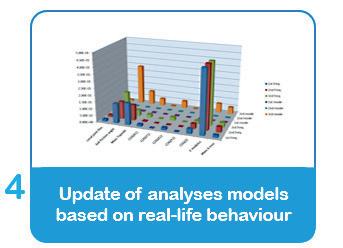
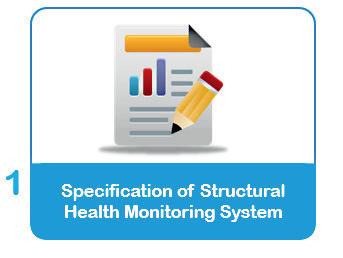
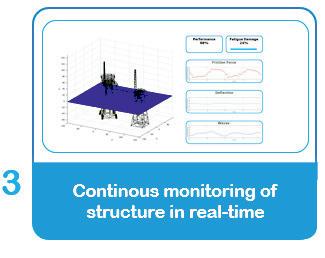
The value creation expected from a True Digital Twin starts already in the specification of a structural health monitoring system as illustrated in figure 1. It is critical that the sensors defined are up to the required task and placed at the right locations to fulfil the overall purpose and objectives. There are several parameters to consider and evaluate when specifying a structural health monitoring system with the purpose of utilising it within structural integrity assessments. These parameters
for thesensors include
for example: type, frequency range, accuracy, sensitivity, resolution, location of sensors and which post-processing methods will be utilised.
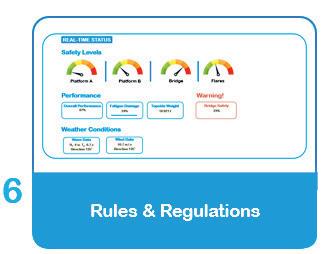
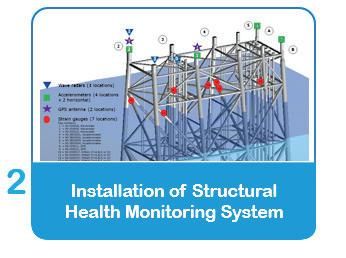
When the system is up and running, the real conditions are continuously identified using the Structural Health Monitoring System (SHMS), which provides information about the actual environmental loads and the corresponding structural response before the data from the monitoring system are analysed through a cloud computing solution. The True Digital Twin technology combines a variety of sensing technologies with an embedded measurement controller to capture, log and analyse real-time data.
The real-time data from the Structural Health Monitoring System (SHMS) is used to compare the real-time behaviour with the analysis model, and the analysis model is updated by using several novel methods to create a True Digital Twin, i.e. a structural analysis model that simulates the real-life behaviour of the structure.
Advanced analyses may now be performed using the True Digital Twin and assessment of the measured uncertainties associated with the analysis of structures, relating to elements such as quantification of model uncertainties and the direct link to Risk- and Reliability-Based Inspection planning (RBI).
Continuous monitoring hence allows for continuous assessment of the structural integrity of the structures.
Lifetime extension
The technology has been used in several lifetime extension projects throughout the years. The use of True Digital Twins in lifetime extension projects have resulted in large savings and sustainable reuse of structures, since quantifying the actual uncertainties leads to a safer and usually more optimised predictive risk-based inspection program.
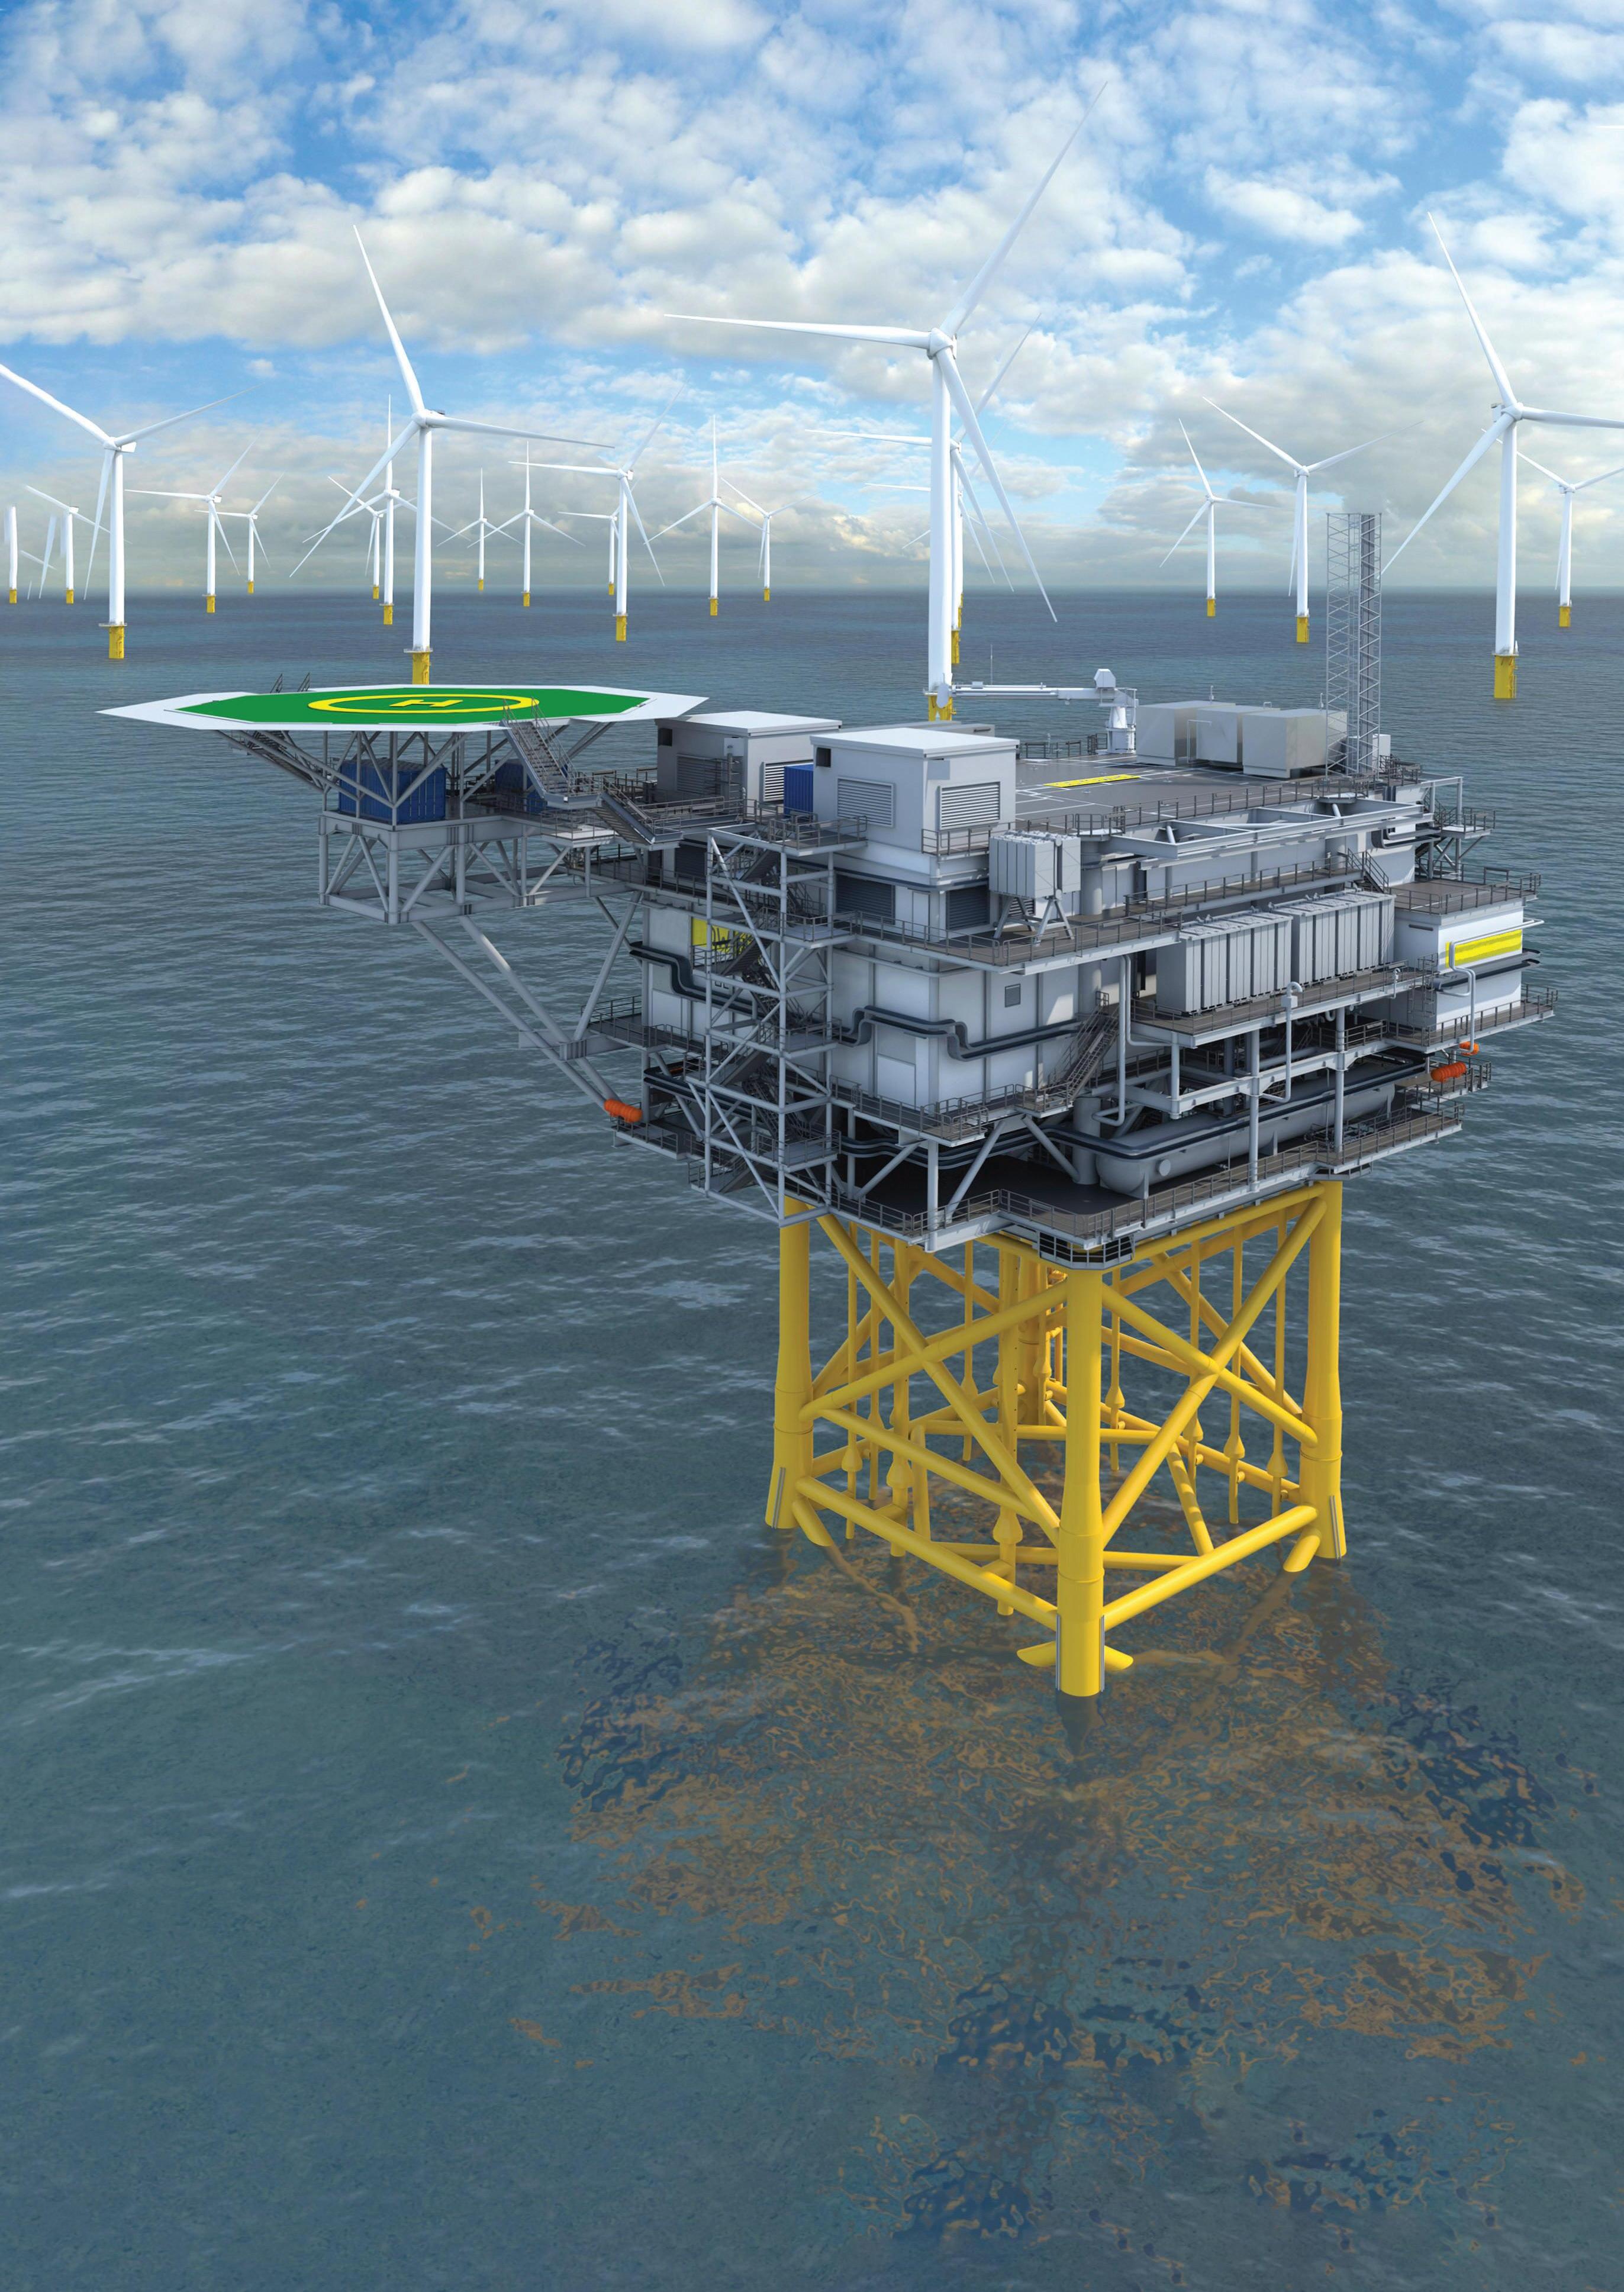
Currently there are on-going projects where reusing oil & gas platforms as substations for offshore wind farms is being investigated and will also include this technology combined with advanced analyses.
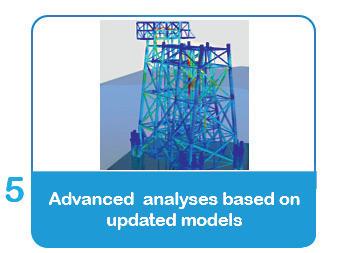
In cases where unexpected and unknown events occur, it might be invaluable to have measurement data from the events and being able to utilise it within structural integrity when it comes to understanding the root causes and how to mitigate these events from occurring in the future. Such events could for example include vibrations of either entire platforms or parts of a platform such as a topside module
or flare tower. The technology has been used to monitor large structures to identify root causes of unexpected and unknown events, to provide an efficient mitigation strategy.
The process digital twin is a process simulation representation of the chemical (and physical) processes taking place inside the plant process equipment. The process simulation invokes appropriate thermodynamic models of the fluid phase behaviour as well as correlations for transport properties etc. The process simulation combines several unit operations to make a digital representation of the real plant, which can be explored for several tasks such as for example: plant design, optimisation studies, diagnostics and troubleshooting, bottleneck identification and mitigation, training, safety studies, and what-if scenarios.
Process simulations have been used for decades as a representation of the real plant. However, extensive multi-parameter optimisation of complex process facilities is a more recent discipline, which has not yet achieved widespread foothold in the industry, especially where machine learning and multi-objective evolutionary algorithms are applied. In the following, we aim at describing the basic methodology and presenting some recent examples.
The starting point is a high-fidelity model of the real plant. While the highest fidelity can be provided by a detailed process simulation model, a surrogate model may be a better choice, provided the model is well trained via e.g. supervised machine learning.
Using a surrogate, the insight of the model can be fully leveraged through massively parallel computations while minimising software license cost. The model is leveraged in combination with global optimisation methods. The number of variables of interest, which for example may include pressure, temperature, flow etc. from various places in the process, range from a few parameters up to hundreds of variables, with a typical range being 10-20 variables of interest.
The objective of the optimisation may for example be maximisation of a product yield, improved product quality, minimisation of production cost/OPEX, minimisation of emission-footprint / energy optimisation or any combination of these objectives. However, not all variables can be set freely due to natural limitations such as design pressure limits, design temperature limits, cooling/heating medium constraints etc. Constraints may include product quality such as crude oil export RVP/TVP, gas export quality, equipment constraints etc. All these limitations and constraints must be handled while seeking the best solution for the objectives.
Increased product yield
In various optimisation studies considering both full process simulation as well as surrogate models, the process digital twin approach has identified a significant optimisation potential for increased stabilised oil production.
Authors
is Business Development Manager, working with digitalisation and innovation within structural integrity management for offshore structures. He has 15 years of experience in working with complex lifetime extension projects.


An increase of 0.1-1.3 % can be achieved, which over lifetime is a significant increase in revenue, and this is achieved without any hardware modifications, i.e. only obtained through changes in the operating parameters. The magnitude depends on for example the reservoir fluid and plant topology. Elucidating the optimisation potential requires a vast amount of simulation realisations, often 10,000-100,000 evaluations.
A main challenge is competing forces of different objectives. Often an increase in recoverable stable oil comes with an expense of increased power demand, see figure 2. Thus, the challenge is to identify the sweet spot that gives the most value for money - either the highest increase in production (starting from operating point A) at the lowest increase in energy demand or the highest reduction in energy demand for the lowest penalty in oil
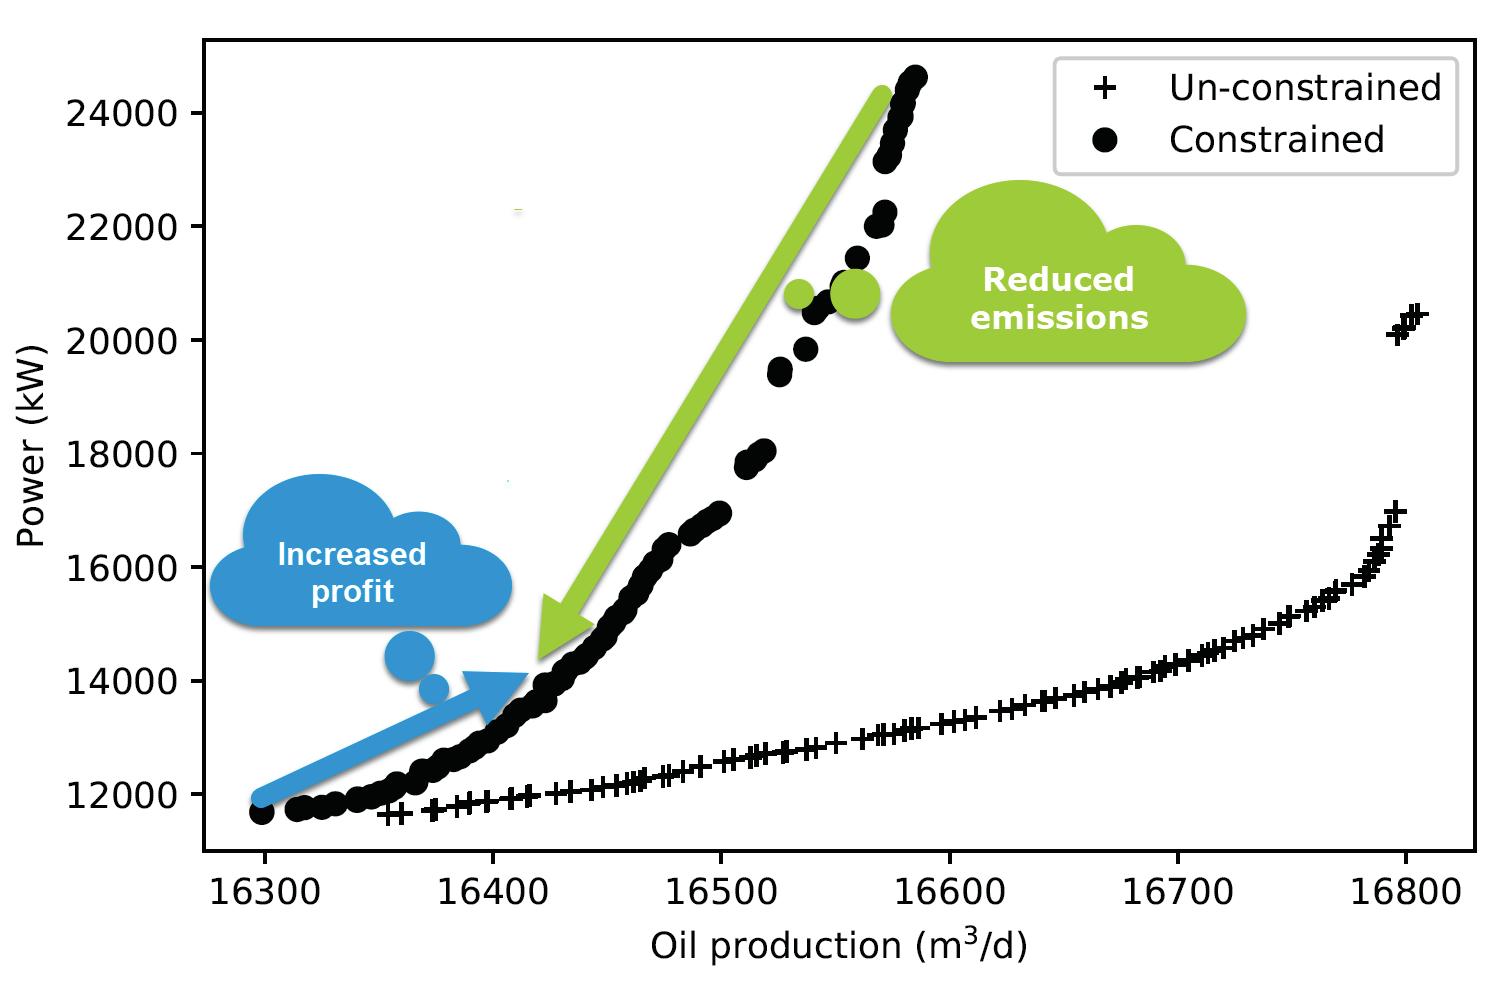
production (starting at point B). For processes not continuously optimised it may be possible to improve both parameters (starting at suboptimal point C).
During recent years, several projects including various development phases for reservoirs rich in NGL (natural gas liquids) have been executed, such as for example the Hejre and the Solsort fields in the Danish sector of the North Sea and the Yme re-development on the Norwegian continental shelf.
Such fluids are challenging since NGL may build up in the compression system and condensate recycle streams, increasing the power requirement substantially. For some fluids it may not be feasible to extract NGL offshore and it may be chosen to export excess NGL via either off-spec gas or off-spec crude. Using a process digital twin approach, it has been demonstrated that for a realistic hypothetical fluid, the topside energy requirement could be reduced by approx. 20% by choosing the gas export over the crude export for transport of NGL to shore for downstream extraction. This would translate into a significant downsizing of the entire compression system and gas treatment facilities with a significant concurrent reduction in CAPEX.
Anders
is Technical Manager and chemical engineer, working with chemical process design for energy storage, carbon capture, utilisation & storage, Power-to-X, and gas production and utilisation.
We are still in the early days of digitalisation, but we believe it will be a vital part in creating an optimised transition from fossil fuels to renewables and support the green transition with accelerated technology-based knowledge.
Bright ideas. Sustainable change.
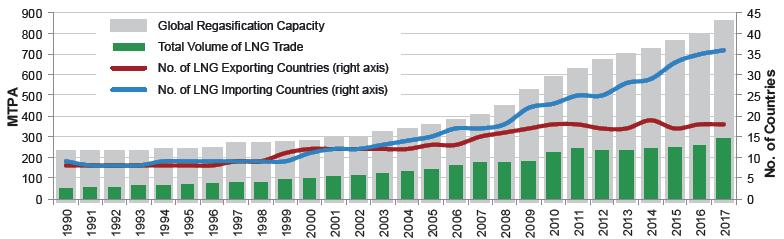
Since the first tanker shipment of LNG took place in 1958 aboard the experimental vessel (the Methane Pioneer)1 the LNG global market has undergone an unprecedented expansion of production capacity. During the last 50 years, LNG started being imported from Pacific countries and later from the Atlantic Basin (Europe, North America), and the market developed in an exponential manner, averaging, in last decades, an annual growth of 7.5%2.
Globally, in 2017 the LNG volumes traded set an historical annual record of 293.1 Mtpa (Million Tonnes Per Annum) with an increase of 35.2 MT (see Figure 1). For the same year, LNG demand across Mediterranean markets were enhanced by severe summer drought (resulting in low hydropower energy production) and heat waves (correlated with strong air conditioning demand) with an increase of LNG imports for France (+2.0 Mtpa), Italy (+1.5 Mtpa), Portugal (+1.5 Mtpa), and Spain (+2.3 Mtpa)3
Based on demand estimates, it is plausible that LNG trade will grow to 360-420 Mtpa by 2020 and the number of LNG importing countries will probably reach about 404
Nonetheless, even if these numbers are impressive, the LNG trade market has been in a state of overproduction since late 2014, with a plethora of suppliers competing with each other, resulting in prices fluctuations and investors insecurity, that it is likely to produce a ‘boom and bust cycle’. Also, investors were counting on higher prices to guarantee that their new LNG plants would be economical and remunerative5. This condition is the product of on historical element of the LNG trade: the idea that LNG plants must be supported by long-term contracts covering most of their capacity due to high capital costs. Anyway,
this assumption is clearly conflicting with current saturated market conditions since the oversupply situation is challenging the future of long-term contracts as they stand today6,7
It is not surprising that LNG trade is already going through an interesting shifting from the traditional pattern of long-term contracts of distribution to one based on spot and shortterm contracts (contracts of less than four years)8. If in the early 2000 spot and shortterm contract accounted only for 5.4% of the LNG trade, in 2014 they rose up to 29% and they are expected to continue rising, potentially reaching 45% of global LNG trade by 2020. The rise in spot and short-term LNG trade will allow buyers to source more and more of their LNG from the oversupplied market rather than rely on long-term contracts, possibly leaving cargoes available at penurious prices, below long-term oil-indexed contracts9
In the present market condition, it seems unlikely that new greenfield LNG projects will move ahead. Brownfields expansion are probably standing better chances, but demand uncertainty is still a challenge10
This complex market condition, joint with new environmental emissions policies and the advancement of new technologies, are together leading the affirmation of a new trend in LNG project development: the LNG Small Scale business (SSLNG)11. This business is receiving growing attention form exporters, since allows the convenient distribution of LNG to several kind of end-users. Due to relatively novelty of SSLNG market, statistical figures are not yet available. Figures and volumes on SSLNG provided in this report are the result of thorough research of the study group, but may not be exhaustive.
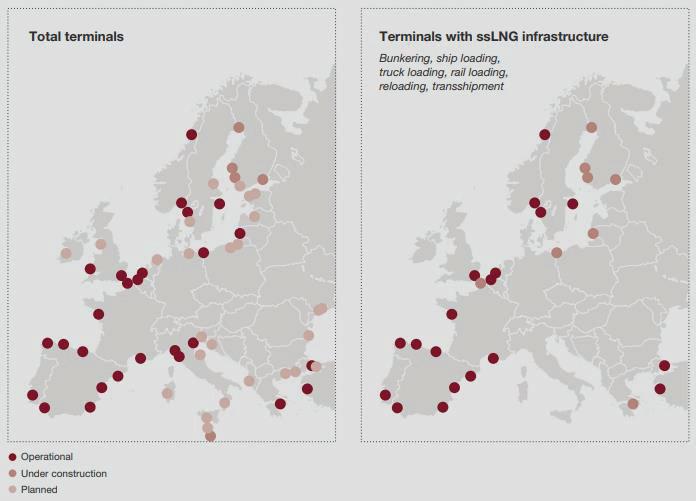
Today, a total amount of approximately 100 small scale LNG production plants is found globally. In 2017 in Europe, the number of LNG import terminals offering SSLNG infrastructure was clearly on the rise, with hotspot concentrated in Spain and Northern Europe, Greece and Turkey12. As illustrated in Fig. 2, it must be noted that, to date, no Italian regasification terminal is able to provide SSLNG services yet; however, with appropriate technical modifications, it would be feasible to adapt present regasification terminals and make them capable to also offer LNG storage and refuelling services for both vessels and road-vehicles. In addition, at 2018 several projects exist in Italy for covering at least some SSLNG activities, especially in the field of LNG storage and refuelling services vessels13
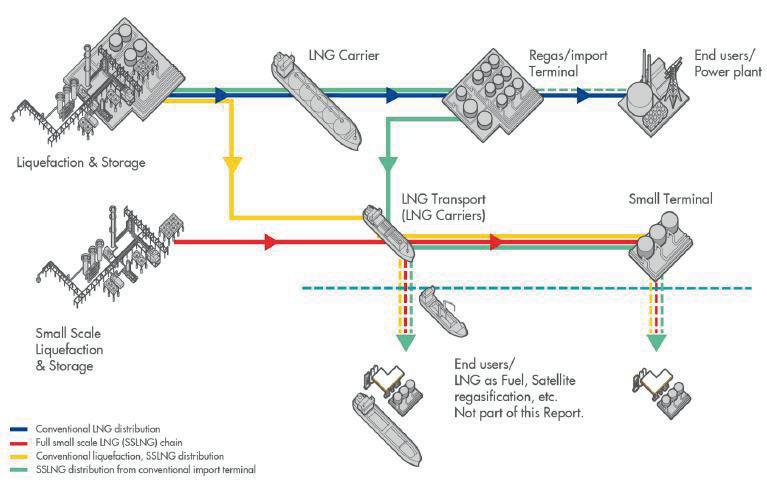
But what exactly is SSLNG? While the traditional pattern of LNG market can be assimilated to a “straightforward chain” of activities, mainly consisting of a liquefaction plant, transport, regasification and end-users (power plant or domestic); the small-scale business can be defined as 3 a “network of activities” related to the transport, distribution and supply of LNG deriving directly from traditional large-scale LNG (hereafter LSLNG)14.
The main nodes (activities) of SSLNG network can be summarised as follows (see also Fig. 3): • supply of LNG from break-bulk, (i.e. the distribution of LNG cargoes into smaller fractions and the loading of LNG from carriers or regasification terminals onto bunker vessels1 or coastal or land storage depots, by ship, truck or train);
transport of the LNG cargoes, by ships or tankers, to LNG storage depots possibly equipped with small regasification plants, also for the purpose of streaming natural gas into the distribution network;
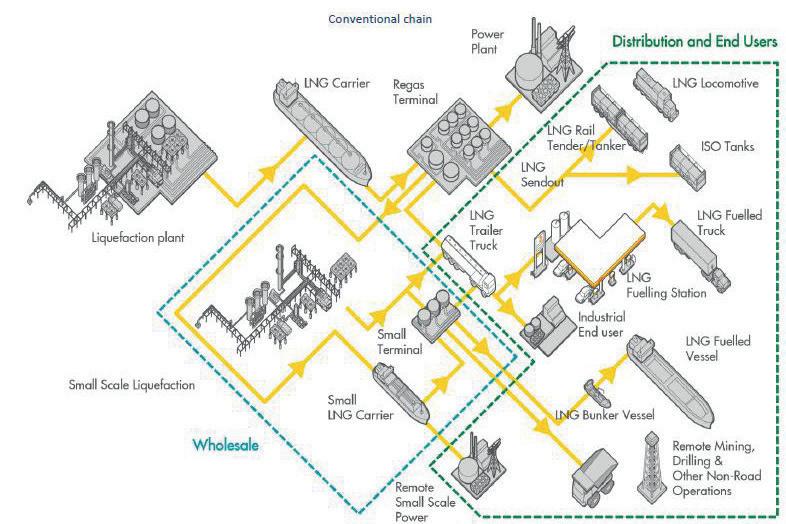
• secondary transport, mainly by road, to: i. tanks located in areas not connected to existing networks for the supply of gas to industrial and civil users (so-called off-grid users); ii. vehicle refuelling stations;
• end uses: production of electricity with LNG, industrial and civil (off-grid) consumption, fuel for direct transport in liquid form.
lThe activities listed above are possible through the provision of specific “SSLNG Services”15 (see also Figure 4) such as:
• service of unloading LNG from carriers onto small scale vessels;
• storage service, using LNG depots at regasification terminals (typically used only for regasification service), or other LNG depots;
• LNG loading service on bunker vessels, (i.e. loading of ships with LNG stored in regasification terminal/coastal depots). Bunker vessels can, in turn, be used as refuelling stations for LNG-fuelled vessels (bunkering service) or for transporting LNG to other coastal depots;
• LNG loading service on tankers/ISO-containers (only for onshore terminals), used for road/rail transport. Tankers and ISO-containers can, in turn, be used as refuelling stations for LNG-fuelled vehicles, local storage facilities, bunkers, industrial and civil uses, trains;
• additional services (only for onshore terminals), such as supplying LNG through the use of infrastructures built near regasification terminals or LNG storage depots and directly connected to them (e.g. loading LNG onto bunker ships/tankers through a dedicated line connected to the terminal, or the refuelling service for road/ rail vehicles through a dedicated station connected directly to the terminal, etc.).
Considering all of the above, it seems that the LNG business is entering in a new era, and has started dealing with present necessity and trends, embracing the future possibility offered by present technologies16. In synthesis, LNG business has begun the process of adapting to an ever-changing market development scenario, and to (partially) free itself from largescale dynamics. In this context, SSLNG seems to be “the next big thing” in the LNG world, capable to offer real possibility of LNG market enlargement, with all the benefits associated to the diffusion of the cleanest hydrocarbon of all, as well as at the same time maintaining acceptable costs.
As always, during the affirmation of a new method/technology, the society is requested to understand it - in order to deal with possible unexpected issues, or criticalities - and to regulate it in order to allow a fair and sustainable use of it. In this context, the present article aims at providing an overview of, and gather
data on, two of the most important themes associated at SSLNG development:
• health, safety, social and environmental issues of LNG;
• the legislative framework of SSLNG installations, with a special focus on Italian permitting process.
When talking of LNG, several elements are usually misunderstood by general public, leading to an erroneous understanding of LNG real dangers, thus reducing project acceptability, today one of the main issues during project development. In the following, is presented a brief analysis of LNG typical HSSE elements that must be put at the center of discussion with general public during the promotion of a project.
First, it is necessary to highlight the lessons learned from the development of previous
LSLNG projects, suggesting that, in order to promote and boost the acceptance of projects, careful attention must be put on the following aspects:
• site location: it is always preferable to propose projects development in brownfield and other underused areas that can be converted for “cleaner” productive uses, and can be associated to the revival of an abandoned and/or contaminated area, linking the project to immediate benefits for the local population both in terms of employment opportunities in the energy sector and from the point of view of improving the health and safety of the area;
• identification of territorial constraints (land planning, natural protected areas, cultural goods, etc.): projects are better accepted when their interference with territorial constrains is minimized. In this manner, it is possible to avoid the typical drawbacks derived from the association of an “socio-emotional” value that any stakeholders detect in a given area, but also to minimize any problems that may arise in the authorization phase and that as a result could lengthen the time of implementation of a project;
• adequate baseline data collection, to assess the status of the environment prior the commencement of the work, and to identify potential sensitiveness, that in a similar manner to the above mentioned identification of territorial constrains, will help the project proponent to avoid many of the problems that may arise in the authorization phase, but also to identify adequate actions in order to reduce the footprint of the project; in depth impact assessment, resulting from the previous items, crossing the project actions vs the environmental sensitiveness;
• identification of mitigation measures and definition of monitoring plan for construction and operation phases: these elements are very important not only to comply with typical Authorities requests, but also are needed in order to present to the general public the considerable and remarkable effort of the proponent to improve the project ensuring its presence will not negatively affect the area in which is developed.
Of no minor importance, it is necessary to leverage on the understanding real proprieties of the LNG17: it is a high energetic fuel, clear,
odorless, non-corrosive, non-toxic, cryogenic liquid at normal atmospheric pressure. If spilled on water, it floats on surface and vaporizes rapidly because it is two times lighter than water, if spilled in open air, it rapidly dilutes18
In order to obtain LNG form natural gas (NG), the mixture of gasses must undergone to a liquefaction process. Such process is based on a pre-treatment of the natural gas stream to remove impurities such as water, nitrogen, carbon dioxide, hydrogen sulphide and other sulphur compounds. After that, the pre-treated gas is refrigerated to a temperature of approximately –160°C. At this temperature the gas liquefy and it is ready for storage and shipping. Liquefied gas occupies 1/600th of the original gas volume, clearly representing a very convenient way of moving GN around. Another advantage is that, since LNG is obtain through refrigeration, it can be stored at atmospheric pressure.
It can became flammable, but explosive only under certain (well-known) conditions. Anyways, in a closed, secure storage tank where the vapor concentration is approximately 100% methane, it cannot ignite because there is no oxygen to sustain the combustion. Methane gas will ignite only if the ratio gas/ air is within the limited flammability range (5 to 15%). An often-expected hazard is ignition from flames or sparks, therefore all LNG facilities are equipped with several fire detection and protection systems in order to eliminate
the ignition hazard. In addition, the NG auto-ignition temperature at atmospheric pressure is above 540°C, an unlikely condition that requires strong source of thermal radiation, heat or hot surface19, 20
In the end, all of the potential hazards concerning LNG facilities operators and surrounding communities are direct consequences of physical and chemical properties of natural gas. Primary and secondary containment, safeguard systems as well as separation distance are measures applied across the entire LNG value chain, from production, liquefaction and shipping, to storage and re-gasification, providing effective and redundant layers of protection from LNG hazards. This explain why the LNG industry has an excellent safety record: up to 2012 more than 50,000 LNG carrier voyages were performed, without significant accidents or safety problems either in port or in the high seas. Data form 1986 to 2016 show that globally, only 19 LNG-related accidents happened, of those, only 5 are considered “notable” by the EU Major Accident Hazards Bureau and only one with fatalities (2 victims, in 1989). All considered, LNG is the safest hydrocarbon. For reference, ITOPF (Internationfal Tanker Owners Pollution Federation Limited) estimated that between 1970 and 2016 approximately 5.73 million tons of oil were lost as a result of about 460 tanker incidents21
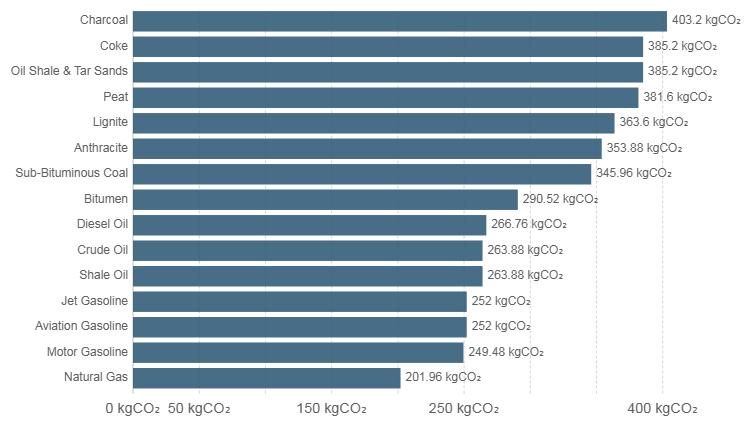
LNG is also the cleanest non-renewable energy source. In general, natural gas combus-
tions products are cleaner than other fossil fuels: air emissions resulting from combustion of vaporized LNG as a fuel in vehicles or for electric power generation present significant lower concentration of carbon monoxide (CO), nitrogen oxides (NOx), non-methane volatile organic compounds (VOC), and fine particulates (less than 2.5 microns in size). In addition, as shown in Fig. 5, natural gas has lower emissions of carbon dioxide (CO2) and toxic, heavy metals. Since the liquefaction process requires removal of all impurities from the produced natural gas, LNG actually has lower air emissions than natural gas when it is produced (since sulfur content of LNG is near zero)22.
The usage of LNG as a fuel for heavy-duty road transport, shipping and rail is the best alternative to diesel and heavy fuel oil. Indeed, due to recent stringent regulations on emissions in the marine sector (MARPOL 73/78 Annex VI)23, LNG is getting more and more attractive for ship builders. Up to 2017, LNG is used as a fuel in more than 100 vessels, and in 2019 LNG will fuel two of the world’s largest passenger cruise ships and the world’s first LNG-powered cruise ships. In the near future, a similar process is expected to involve also road and rail transport24
In this context, the affirmation of SSLNG may pose the foundation of a new beginning for the LNG market, contributing to a more sustainable usage of energy resources spurring further and in a capillary way the utilization of LNG among geographically isolated and infrastructure-poor regions and everywhere pipeline construction is not a viable investment.
The Directive 2014/94/EU of the European Parliament and of the Council of 22 October 201425 constitutes the common framework of measures for the construction of infrastructure for alternative fuels in the European Union. In Italy, the Directive was implemented by the Legislative Decree No. 257 entered in force on 16 December 2016, the so-called DAFI Decree26, aimed at defining a set of rules for the establishment of an infrastructure for “alternative fuels”, and of course, LNG is one of them. However, it must be highlighted that the regulatory framework governing LNG-related activities and the relative construction of facilities is still a “work in progress”, quite far from being completed.
Firstly, it must be noted that the current legislation (Article 2 of Legislative Decree No. 164/2000, the Italian implementation of Directive 98/30/EC concerning common rules for the internal market in natural gas)27 defines “LNG plant” as the terminal used for the liquefaction of natural gas or the import operations, and/or the unloading and regasification of LNG, including all the auxiliary services and temporary storage necessary for the regasification process and subsequent delivery to the transport system. It is immediately obvious that this definition does not correctly apply to SSLNG, since it excludes any tanks located in the plant that are not functional to the regasification cycle.
On the other hand, the law qualifies a “storage facility” as a facility used for the storage
of natural gas, including LNG, and owned or operated by a company. Again, this definition does not match exactly the SSLNG since it excludes the part of the facility used for production operations and facilities reserved for transmission system.
The much-needed clarification on the matter of SSLNG activities and services, expected with the Legislative Decree No. 257/2016, did not arrive. The Decree indeed regulates the administrative procedure, the so-called “Autorizzazione Unica” (on national, regional or communal scale according to the dimension of the activities), necessary to obtain authorisations for the construction of “storage and transport infrastructures” of LNG.
In particular Art. 9 regulates the case of facilities that are connected or functional to the construction of/ the linkage to the national gas transmission network, or isolated parts thereof, and thus defining them as “works of public utility” and “strategic importance”. Therefore, according to a strict literal interpretation of the Art. 9, the qualification of infrastructure of “strategic importance” can be attributed only to storage facilities that could have a functional or systemic role in the construction of portions of the national network for the transmission of natural gas. A role which would necessarily require the performance of the activity of LNG regasification. However, it is self-evident that DAFI Decree does not regulate traditional regasification infrastructures and their possibility of providing SSLNG services, for which the Decree merely redirect to the single procedure referred to in Article 46 of Decree No. 15 of 1 October 2007, valid for the construction of any type of regasification plant, regardless of size, thus linking them to more complex permitting national procedure.
In synthesis, it should be noted that the definitions referred in the DAFI do not succeed in resolving the complexity of the regulatory issues in relation to the variety of situations that arise in SSLNG practice. In particular, a grey area is left unsolved on the matter of which rules are applicable to mixed-purpose infrastructures under authorisation or design. Of those, some will be forced to mainly allocate their reception capacity to regasification activities, reserving a marginal share for the supply of so-called “SSLNG services”; while others, on the contrary, will have to act for the most part as storage depots not destined to supply natural gas transmission networks, but with the possibility of starting a regasification activity to the advantage of isolated network portions.

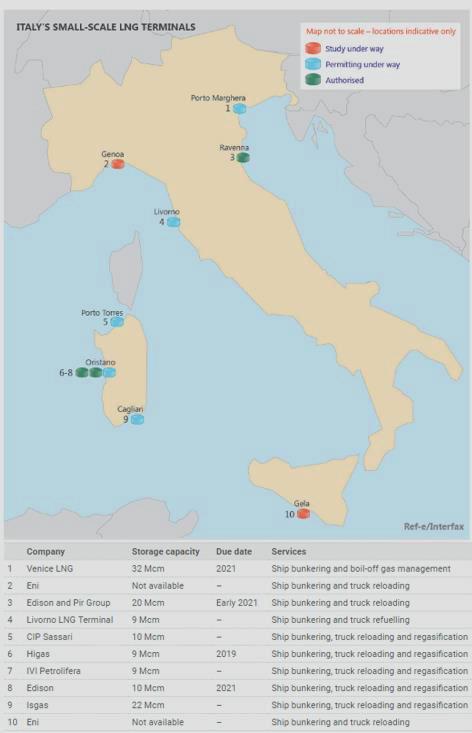
The above explains why, up 2018, all new Italian projects relating SSLNG are defined as “storage” depots of LNG that do not foresee the additional (and potentially remunerative) presence of small-scale sub-services28, 29. Anyways, it must be noted that other players are increasing their interest to SSLNG possibilities, with more projects being proposed every now and then (see Fig. 5)31
In addition to new projects, following the considerations on DAFI Decree, some LSLNG providers are imaging the possibility to modify their traditional regasification plants in order to propose SSLNG services.
In this context of blurred boundaries, it is also necessary to highlight the existence of a possible inconsistency in the administrative procedures required to obtain authorisation to build LNG facilities or storage facilities.
On one hand, Legislative Decree 257/2016 provides for the existence of three different procedures for the construction of storage facilities, each of which is calibrated on the basis of the size and function of the plant (Articles 9 to 11), while on the other hand, for the construction of traditional regasification infrastructure, the same Article 9 of the DAFI confirms the existence of the most burdensome procedure under Article 46 of Decree No. 15/2007, valid for the construction of any type of plant, regardless of size.
The absence of administrative procedures proportionate and appropriate to the capacity and functioning of regasification/liquefaction plants (especially those with reduced capacity that also perform activities functional to SSLNG services), may be an obstacle to the construction and development of new project, in clear contradiction with the role assigned to LNG in the national energy strategy.
Moreover, the lack, in the Italian normative, of a precise legal definition of the so-called “Small Scale LNG services”, generally recognised as the means by which liquefied natural gas is managed in small/medium quantities directly in liquid form, such as the loading, storage and subsequent unloading of part of the LNG not destined for the national natural gas transmission network (see Introduction), also weighs heavily on the regulatory level and exacerbate the complexity of the permitting processes.
On top of that, SSLNG services, as confirmed by the Authority in its resolution No.
141/2017/R/GAS of 16 March 2017, are not subject to tariff regulation but would be managed on a free market basis. With this in mind, the Authority, with the aforementioned resolution, initiated a procedure aimed at gathering the main information necessary for
the definition of an initial regulation of the technical and economic conditions of access to/supply of the services provided by the LNG storage facilities and infrastructures referred to in Article 9 of DAFI Decree, and for the exact qualification of SSLNG services
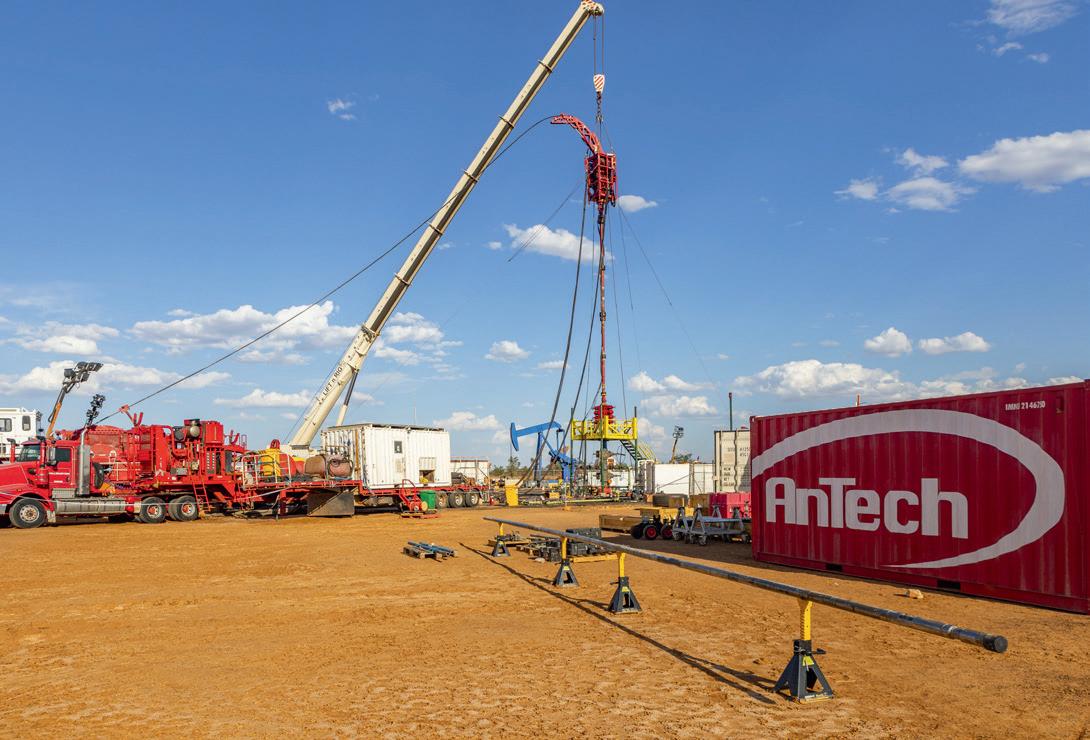
Laptops on wellsites were once a rare sight, but a much-needed evolution in wellsite IT is providing the system capability, reliability and security needed to support today’s technically advanced, data-intensive drilling techniques.
Despite the staggering volume of data required for Underbalanced Coiled Tubing drilling (UBCTD) applications, for a recent UBCTD job in Western Australia it would have been perfectly possible for a directional driller to have steered the directional drilling assembly from the comfort of an office in the UK via satellite internet. Whilst this might not always be desirable in practice, the mere fact that it is possible demonstrates the significant capability of modern communications and computing systems, and highlights the opportunities this can bring to the field.
Just as Internet servers in data centres driving e-commerce and online banking are managed remotely using software specifically adapted to configure, monitor and control hardware from a distance, this same capability can be employed in the oilfield where the fundamental requirements are the same (namely to provide timely, reliable and secure data to users).
To understand why UBCTD is so data intensive, it is worth considering the measurements being acquired. Downhole data from up to 200 sensors at a time is transferred at electric wireline speeds, rather than slow mud pulse speeds. This downhole data is then combined with surface data from the CT rig and the flowback equipment in real time. Throw in the complica-
tion of these data points being controlled by different providers and you begin to get an idea of the processing power required. In short, traditional methods of data transfer are no longer viable for these applications.
Before the advent of the PC, the most sophisticated piece of IT at the wellsite was the wireline logging truck. As PC technology became more widespread, it was harnessed by the industry and internet-enabled laptops were increasingly used on wellsites for reporting, email and data acquisition. However, this evolution has not been without its problems and, in many cases, the solution has been ad hoc fixes rather than long term strategy.
Clearly, wellsites are rugged environments that require robust equipment. However, consumer
grade equipment is significantly cheaper and more readily available, thus it often tends to be the preferred choice. But dust and other contaminants inevitably shorten the useful life of consumer grade equipment, making this a flawed logic. Then there’s the connectivity issues. Back before equipment was WiFi enabled, cables were strung across the wellsite and many hours were frequently lost repairing communications cables damaged by trucks. When WiFi did become available, many of us will recall instances where the source of a slow-running communication link was tracked down to a crew member streaming video on their mobile phone. In addition, data stored on desktop computers is inaccessible from the time it’s packed up to the time it arrives back at base, resulting in the costly and inefficient loss of valuable post job processing and reporting time. These factors and the associated security
risks and performance issues are all common features of an IT system under limited control, but by adopting a new strategy using readily available technology, things can be improved dramatically.
The speed, reliability and ubiquity of the internet has unquestionably made it an integral feature of modern life. Long gone are the days of dial-up and logging into a single server with static web pages. Nowadays it’s all about load balanced server farms, redundant databases that power e-commerce and network switches that efficiently and quickly connect users globally.
Billions of dollars and man hours have been spent rigorously improving the technology necessary to enable companies to operate their businesses online. This has primarily included automating the IT tasks that keep the system running. A key feature of modern internet management is that the person doing the managing is very rarely anywhere near the physical hardware being used, and the end user (in oilfield terms: the wellsite crew) requires minimal understanding of the technology to be able to use it. This is made possible by running many applications directly online through a browser without having to download any additional software. These so-called web apps can be up-
dated centrally, and all updates are available to end users at the same time.
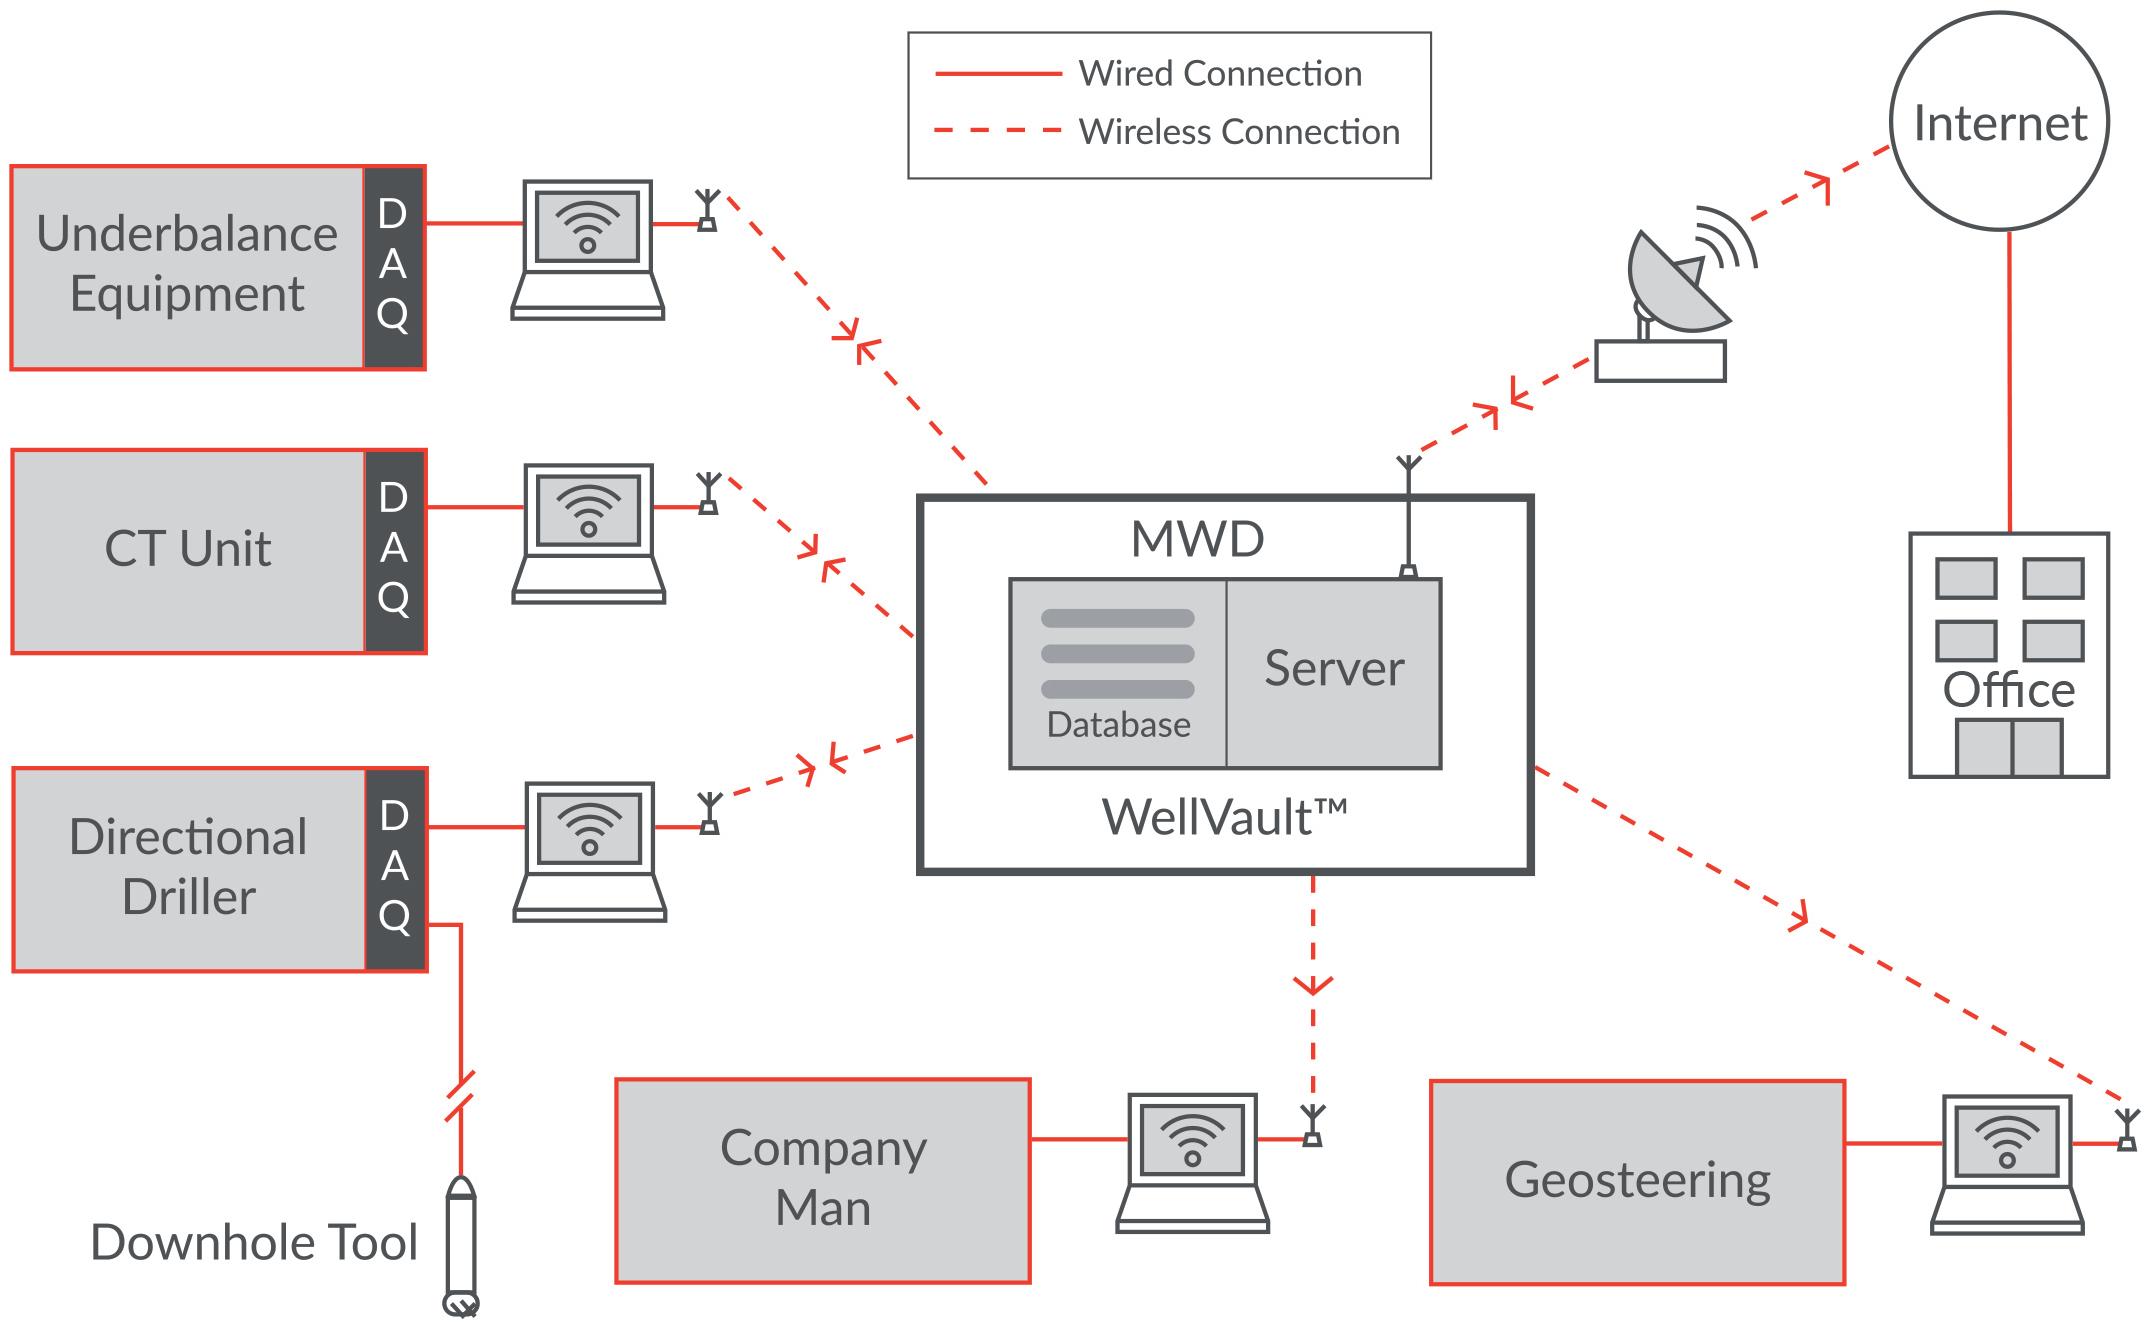
This concept can be applied to the wellsite by installing a mini data center at the heart of the wellsite IT system and ensuring a reliable connection to it. This ensures on-site quality-of-service to local users is maintained, essentially becoming part of the ‘cloud’ for the purposes of management and remote data processing.
The key to optimising the wellsite IT system is to treat it as an integral part of the wellsite, central to wellsite operation, rather than an added productivity tool. In a UBCTD setup, the time between rig up and rig down is relatively short, and there is usually no existing installation such as a rig communication system to plug into, and certainly not one configured for the data-intensive nature of a UBCTD operation.
The essential features are:
Environmental protection: Heat, cold, water, dust and vibration, all common wellsite features, are the enemies of delicate IT equipment. While these factors can be mitigated, measures can conflict with one another. For example, specifying fan-less computers may seem the obvious choice for minimising the impacts of
excess dust, but such computers have reduced computer clock speed impacting performance. Therefore it will be necessary to provide dust protection and filtering for fan cooled computers. In addition, protective cases can isolate equipment from shock and vibration in use and during shipping.
Internet connection: Optimum connection type (e.g. satellite, mobile internet or microwave link) is location-dependent, but must always be planned and tested rather than being considered as an afterthought or nice-to-have feature as has often been the case.
Data interfaces and displays: Individual data displays placed around the wellsite provide the communication required for integrated operations such as UBCTD. These also serve as a connection to third party data sources and drive the WiFi access points.
Long range point-to-point WiFi: Specialist WiFi access points provide longer range than consumer items. The challenge here is to be able to offer a range of secure fixing methods in order to position them as required, preferably on the outside of cabins with reliable cable entry into cabins.
Remotely configurable routers: Every device must be able to be configured, monitored and
maintained remotely to avoid costly downtime. Consumer products are cheap and readily available but, unlike enterprise-grade devices, don’t offer the control of configuration or feedback of data required for a remotely controlled industrial system.
Redundancy: To ensure reliability, especially where there is limited IT knowledge on site, a
The advantages of the new WellVault™ mini data centre were demonstrated during a recent project in Australia. UBCTD was used to drill a multilateral well with RockSense® porosity log used for geosteering. The objective was to drill two laterals in the reservoir section. The remoteness of the operation, 1200km north of Perth, and the fact that the support locations were in the US and the UK meant a minimum 2 day travel time to bring in equipment and support staff if required. Therefore, it was essential that equipment was reliable and could be configured remotely. The requirement was to send real-time data and logs to the client’s office in Perth and to the UK for interpretation. Additionally, the equipment maintenance data and inventory usage needed to be recorded in
The era of ad-hoc IT systems at the wellsite that do not meet the requirements for functional capability, reliability, security or remote control required for advanced drilling applications has passed. Modern development of internet data storage and communications technologies means it is possible to place a portable, internet connected, mini data center at the wellsite that can match the data security and equipment uptime capability of larger systems. Suitable precautions must be taken to physically protect hardware from harsh wellsite environments but, with care, this is achievable with relative ease.
robust redundancy setup is required. At least two servers must operate concurrently so that in the event the first server goes down, operation can switch to the backup servers without a loss of data. Currently, the switch over requires intervention by a remote engineer, but newer technologies can enable an automated switch over, potentially removing server failure as a cause of downtime.
Encryption and access control: To ensure data security, end-to-end encryption is essential and each device must have its own firewall and anti-virus software. To prevent the system being used by crew members for non-operational reasons, access should be limited using IP address control.
the cloud-based ERP system to provide daily updates on cost and any pending spares or stock requirements.
This was the first operation where it was deemed unnecessary to send a dedicated IT engineer to provide pre-job setup. A satellite link from the wellsite provided an internet connection and the WellVault™ data centre was configured to automatically provide a secure VPN connection to the UK, with any further setup tasks completed remotely. WiFi access points were setup around the wellsite by the local crew to provide connectivity to the underbalance equipment and the CT unit. Their data was provided in WITS format, with communication links having been tested before the job started.
Reliable, if slow, satellite internet connection meant that the wellsite database could be replicated in the UK for job support, troubleshooting and to create the RockSense® log for geosteering. Wellsite equipment needed to withstand extreme heat and pervasive dust. The value of a robust internet setup was proven during a server power supply failure on-site. Whereas a less sophisticated setup might have meant stopping operation for a few hours, and would have created data splicing problems later on, the new redundant setup allowed the backup server to be activated remotely, minimising downtime.
While most operations are not as data intensive as UBCTD, the era of integrated wellsite IT systems drawing and streaming data from multiple sources is most definitely upon us. Implementation of cutting edge remote controlled internet technologies enables wellsite crews to focus on their primary roles without having to undergo training to support additional equipment, while reducing the need for additional specializations on site and placing control of IT hardware and data within the IT department, where it can be managed and kept secure. The evolution of internet technology relies on users adapting the way they interact with it. Oilfield IT needs to similarly adapt in order to fully benefit from the digital transformation.
About the author
Toni is founder and Managing Director at AnTech Ltd where he has led the company’s entry in the Underbalanced Coiled Tubing Drilling market. Before founding AnTech, Toni worked for Schlumberger both in the field and in engineering development. He has a Batchelor’s degree in Mechanical Engineering from Imperial College, London and is the holder of several patents for downhole technology.


The LevelEx cable gland for non-armoured cables and the LevelEx AC for armoured cables o er you excellent explosion protection with all the necessary certifications such as ATEX and IECEx. With the ignition protection types „Ex d“ flameproof enclosure and „Ex e“ increased safety, they guarantee reliable protection in the potentially explosive atmospheres G (Gas) and D (Dust).
You are also on the safe side when it comes to costs: thanks to the outstanding ease of installation and a convincing price-performance ratio. What else speaks in favour of LevelEx and LevelEx AC? You can find out at www.pflitsch.de/en


LevelEx and LevelEx AC. Simply ingenious. Ingeniously simple.


The zone will include decommissioning and late life technology service providers, and a conference theatre programme.
In partnership with OGTC and Elevator, featuring cutting-edge innovation from UK & International start-ups.
Purpose-built for OE: Input from the event directors has shaped the new 48,000m2 venue


More space, better facilities: New on-site hotels, conference areas and expanded parking
Advanced Technology: Lightening fast connectivity, interactive seminar rooms and luxurious VIP lounges
Following successful launch of the ENGenious event, the community has clearly outlined the need for a platform to showcase the ever developing technologies in oil and gas. The ENGenious Zone will bring together Automation, Data Analytics, Robotics and Smart Communications.


Introduction
Due to the ever more challenging, and thus “investment-intensive”, contexts in which new wells are to be drilled, together with uncertainties of the current market, existing oil & gas assets do not only ensure an important cash source for Operators, but they also represent a low-risk and maybe the easiest opportunity to sustain production and reserves with a relatively limited cost. Furthermore, the availability of effective secondary and tertiary enhanced recovery technologies allows today to2 achieve a longer productive life of mature fields. These factors put together, definitely suggest that the extension of the existing wells’ life is a more advisable option than the drilling of new wells.
However, wells age and, if not properly maintained, may generate safety risks and environmental concerns, due to the degradation of the relevant Well Barrier Elements (WBEs).
Similar considerations also apply to gas storage wells, for which the degradation of WBEs is even amplified compared to production wells, because of the alternating production and injection cycles at the original reservoir pressures every year.
That said, a specific methodology and software for the proactive management of ageing wells have been developed. Such methodology is described herein, in terms of tasks involved and the related software functionalities to support them. Moreover, the results achieved from their implementation in two gas storage fields in France are also provided, namely the opportunity to keep wells ageing under control through a customized Workover Plan.
The concept of Well Life Extension is to keep wells “young”; to this aim, it is necessary not only to get a comprehensive understanding of
their current “health conditions”, but also to predict future critical WBEs in order to put in place suitable preventive measures. In other words, it is key to analyse the ageing mechanisms of specific WBEs and proactively maintain them.
A typical Well Life Extension Study consists of the following tasks:
1. Assessment of the current integrity status of well, along with the execution of a Failure Modes, Effects and Criticality Analysis (FMECA), to identify the potential failure modes of WBEs and assess the related risks.
2. Collection of well integrity failures experienced in the field, analysis of corrosion logs, and definition of possible corrosion scenarios and degradation mechanisms.
3. Estimation of WBEs degradation factors (tubing and casing corrosion/erosion factors and elastomers degradation factors).
4. Prediction of current and future criticalities and estimation of the residual well life (“well ageing”) of each well subject of the study.
5. Definition of various Workover Plan options for the specific field, based on the priority levels resulting from wells and asset integrity, ageing, safety and performance factors.
6. Execution of a cost-benefit analysis.
Substantially, the Well Life Extension Methodology includes three main phases:
• Well Integrity Assessment
Estimation of Wells Ageing
Definition of Workover Plan Options
Each phase is described below, along with the main results obtained for two gas storage fields in France.
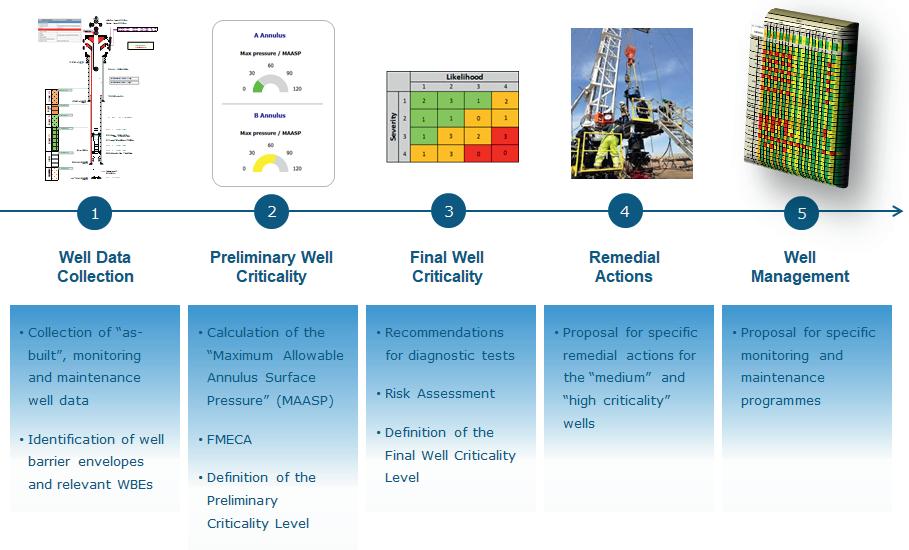
The first phase of any Well Life Extension Study is represented by the assessment of the current integrity status of wells, with the aim to evaluate whether the wells can be still operated safely. Previous papers Fig. 1. (1), (2) describe the applied well integrity assessment methodology, whose main steps are summarized in Fig. 1.
In the specific case of the well integrity assessment performed for two gas storage fields in France, the main results achieved are as follows:
• Field A: 10 wells have been identified as having a Medium Criticality Level
Field B: 6 wells have been identified as having a Medium Criticality Level.
Within the assessment, calculation of MAASPs and the definition of the preliminary wells criticality level has been performed by using the well integrity software developed in accordance with the criteria established by the ISO/ TS 16530-2.
The future performance standards of WBEs,
and consequently the “ageing mechanisms” of wells, are affected by degradation over time; from this point of view, the main “time-dependant factors” are:
corrosion/erosion factor, which has a progressively increasing impact on the resistance of WBEs due to possible corrosion/ erosion phenomena;
• elastomer ageing factor, which has a progressively increasing impact on the sealing capability of WBEs, due to degradation of elastomers.
The application of such degradation factors to the current WBEs’ performance standards allows to predict when the resistance of the weakest WBE(s) will become lower than the operational load it is exposed and, therefore, evaluate the residual well life and identify the
WBEs that are expected to become critical in the future. The residual well life has been estimated by using the previously mentioned well integrity software.
Such software starts introducing “non-time dependant (safety) factors”:
• Design safety factor, which is normally included in Operators’ well design standards, to take into account the uncertainty of the manufacturing process.
• Hydrostatic factor, to take into account the differential pressures generated by fluids inside and outside tubing/casings, as a result of their different densities and the related uncertainties.
• Wear factor, to take into consideration the possible erosion of casing internal diameter, caused by drill string during the drilling
of the subsequent well phase,
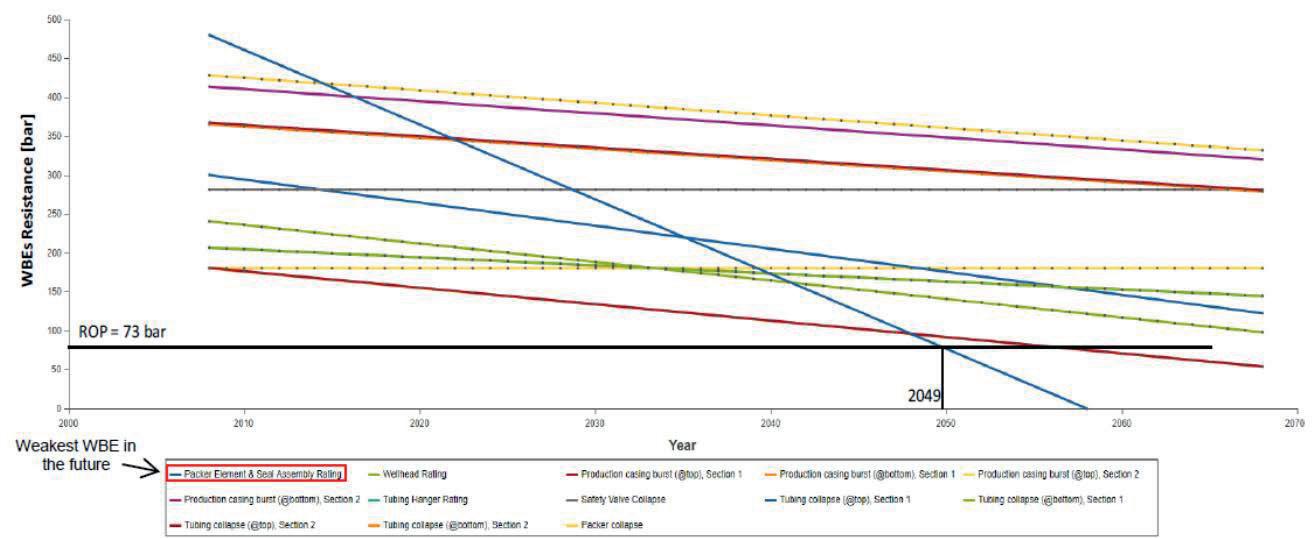
to calculate the resistance of each WBE at the time of installation. Then, by applying the above mentioned time-dependant degradation factors, the software provides the graph shown in Fig. 2.
Such graph, produced for each well included in the study, shows how the resistance of each WBE of the well decreases over time.
As operation load, a Reference Operating Pressure (ROP) equal to the maximum Tubing Head Pressure (THP) of the well under study is used. THP is the maximum pressure value that can be potentially found in the tubing and affects the barrier elements of the A-Annulus.
By drawing the horizontal line of ROP, the first declining line that is intersected defines the weakest WBE that is expected to become critical in the future (in the example of Figure 1, it is the Packer and Seal Assembly elastomers). The intersection point defines the well remaining life-time (in the example, 2049).
It is worth pointing out that the residual well life is an estimation aimed at anticipating the WBEs which are more likely to fail in the future; as such, it should not be considered as an exact value, but rather as a range of years in which failure may occur.
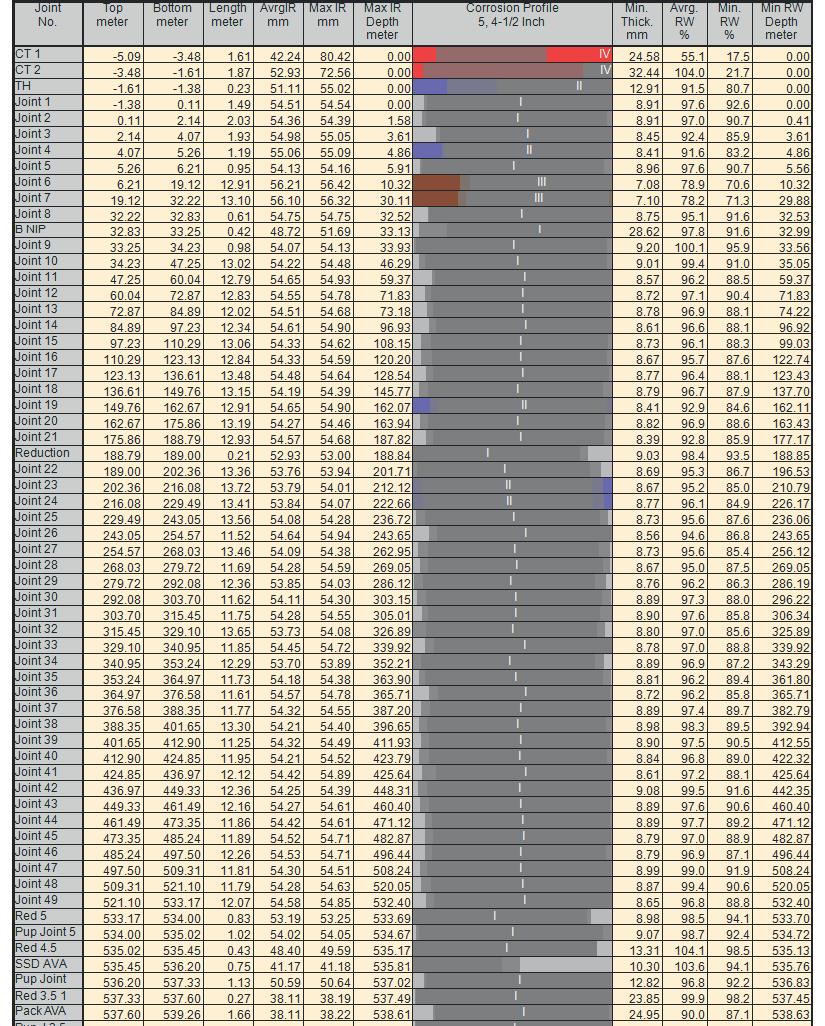
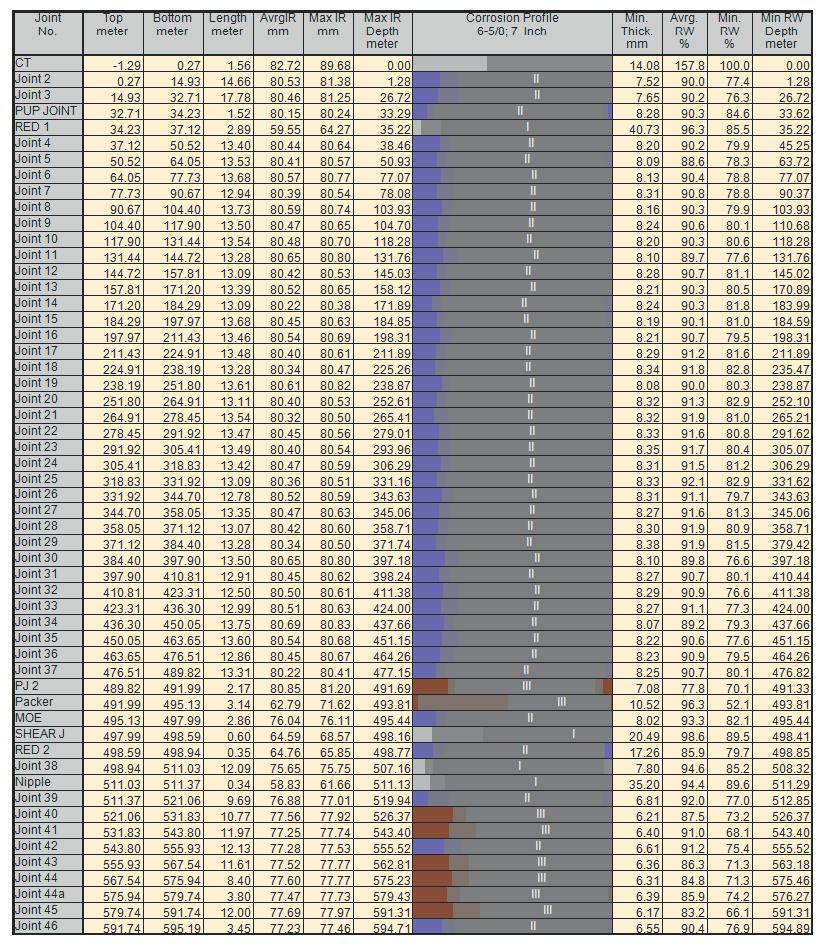
Corrosion/erosion factors are typically defined based on the analysis of the logs performed in the well of interest or in reference wells. In the performed gas storage fields applications, in addition to the extensive experience gained in similar works, the results of the Multifinger Caliper/Electro-Magnetic Defecto-Scope (MFC/EMDS) logs carried out on two reference wells of the fields (a gas storage well and a reservoir pressure monitoring well) have been used. Such logs had the objective of evaluating the extent of wear and corrosion on both the tubing and production casing: the combination of the two tools has allowed determining the reduction of wall thickness (WT) from inside and outside of both pipes.
By deeply analysing, joint by joint, the values of the average and minimum remaining wall pipe thickness reported in the two logs, some “false” erosion/corrosion detections have been identified and excluded. In particular:
Fig. 3. The “PJ2” of the reference gas storage well’s tubing showed a very different thickness reduction compared to previous joint. By verifying the joint top and bot
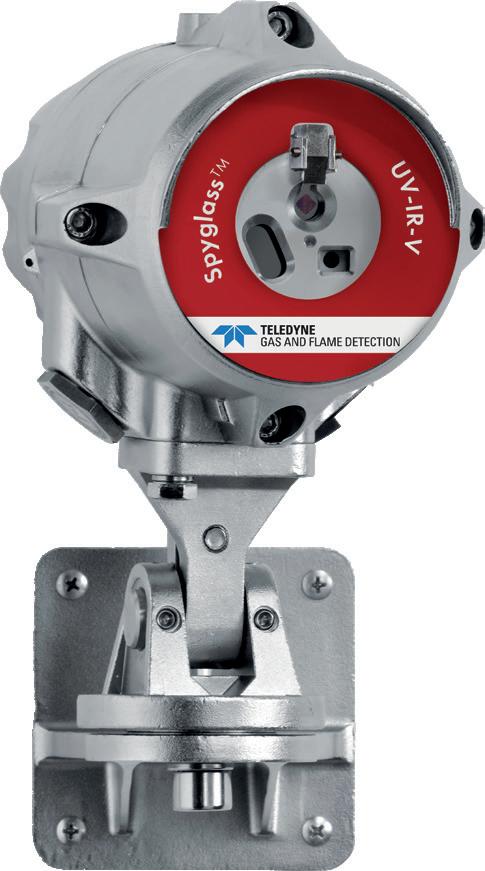


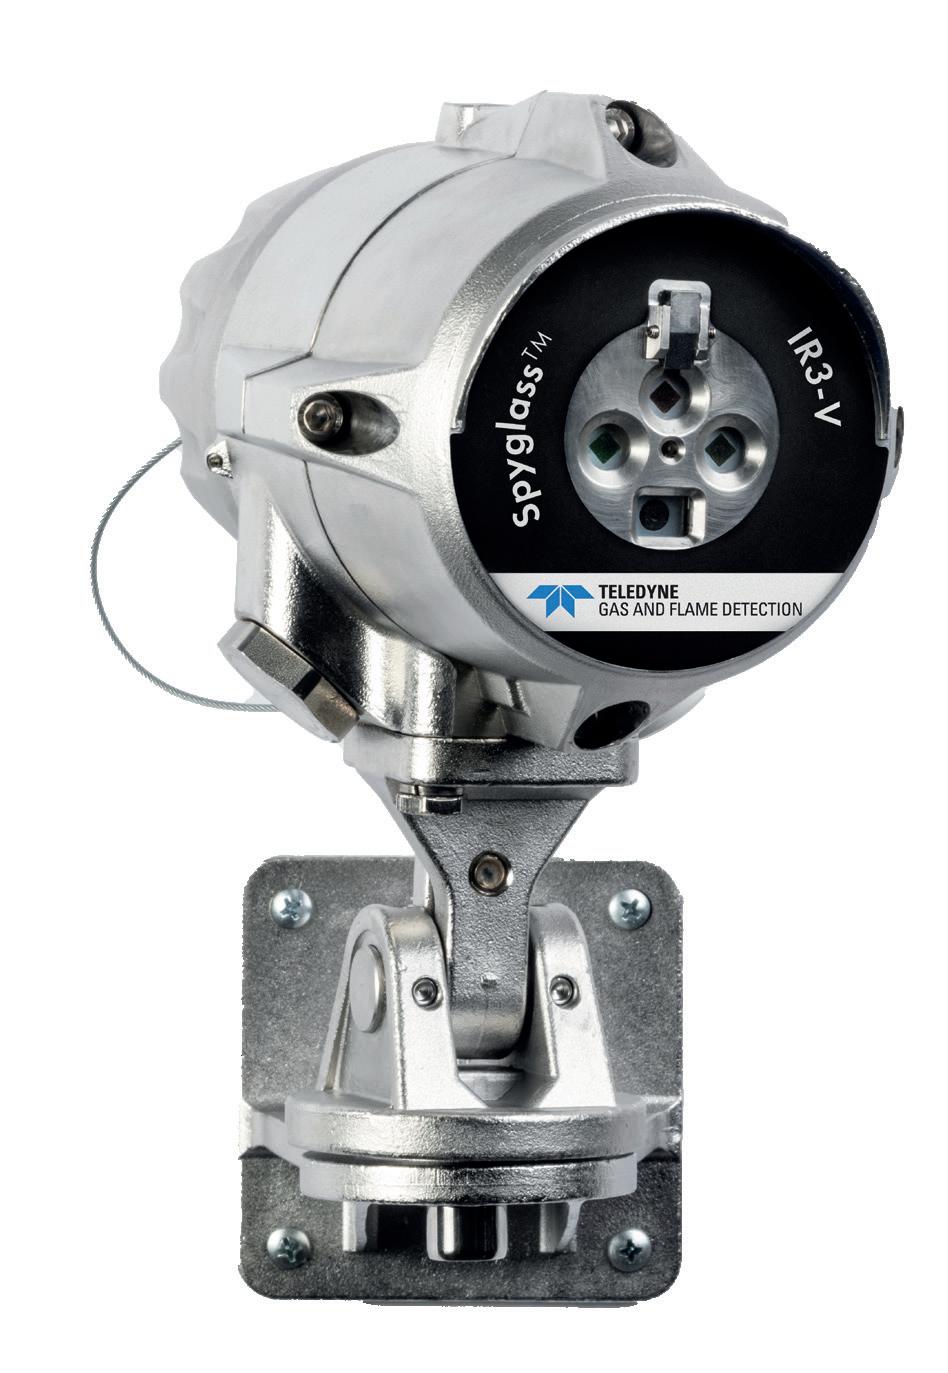
The Spyglass™ family of triple IR and UV-IR flame detectors feature top-tier optical technology, providing the fastest and most effective detection of fires and explosions to prevent or reduce damage to people and property.
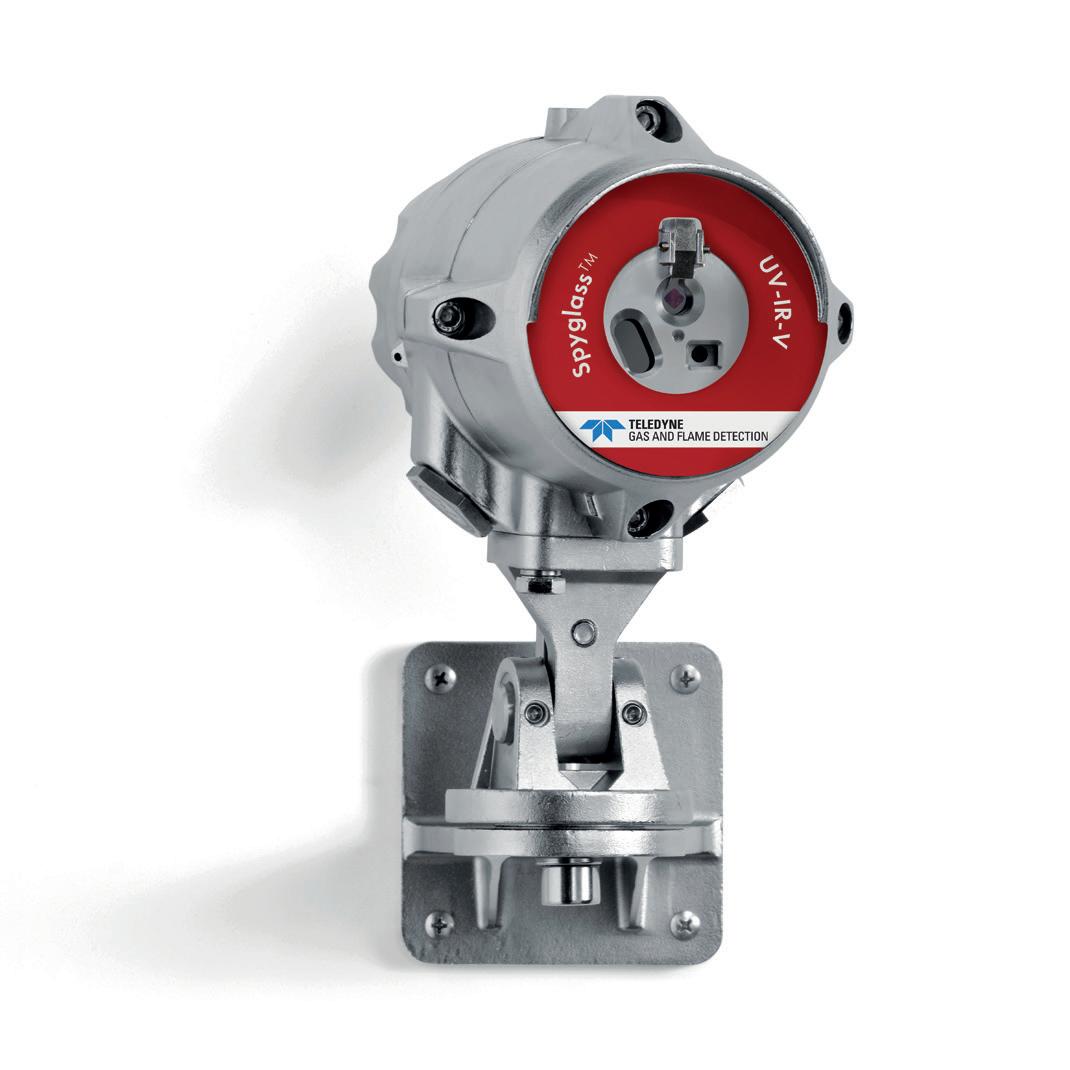
UV-IR & UV-IR-F - Hydrocarbon, ammonia and metal fires
www.teledynegasandflamedetection.com


gasandflamedetection@teledyne.com
 IR3 - Hydrocarbon fires
IR3-H2 - Hydrogen fires
IR3 - Hydrocarbon fires
IR3-H2 - Hydrogen fires
the third from the average remaining wall pipe measured for each
(low scenario).
In each scenario, the values of resulting corrosion factors are given by the average of the calculated for each joint (Table 1).
values of the “low corrosion scenario”, a sensitivity analysis has been performed to assess the impact of the “high” and “medium” corrosion/erosion scenarios on wells residual life, and define the final tubing corrosion/erosion factor.
t has been decided to use the tubing corrosion/erosion factors
After the decision to exclude the values of the “low corrosion scenario”, a sensitivity analysis been performed to assess the impact of the “high” and “medium” corrosion/erosion scenarios wells residual life, and define the final tubing corrosion/erosion factor.
sensitivity analysis, it has been decided to use the tubing corrosion/erosion summarized in Table 2
previously defined tubing and casing corrosion/erosion factors have to as storage fields applications, the following factors have been used: tubing/casing corrosion/erosion factors: values of the “high corrosion scenario”; elastomers degradation factors: three sets of annual degradation factors, as shown For permanent packers with locator, a higher annual degradation factor retrievable packers and permanent packers with anchor has been used in all scenarios, to take into account the greater degradation to which elastomers could incur due to their possible movements.
Table 2
Tubing Corrosion/Erosion Factors Used in the Sensitivity
also performed for production casings, for which two corrosion scenarios have been defined: a “high corrosion scenario” and a “low corrosion scenario”. In this maximum corrosion/erosion factor calculated from the log of 0.045 mm/y). The same value has been applied to intermediate
As the result of the sensitivity analysis, it has been decided to use the tubing corrosion/erosion the “high corrosion scenario”, as they better meet the frequency of the failures fields.
EMDS tool for each joint at a specific depth and azimuth (high corrosion scenario); the second from the maximum wall thickness reduction measured for a specific depth over the entire tubing circumference (medium corrosion scenario); the third from the average remaining wall pipe measured for each joint (low corrosion
In each scenario, the values of resulting corrosion factors are given by the average of the values calculated for each joint (Table 1).
After the decision to exclude the values of the “low corrosion scenario”, a sensitivity analysis has been performed to assess the impact of the “high” and “medium” corrosion/erosion scenarios on wells residual life, and define the final tubing corrosion/erosion factor. To carry out the sensitivity analysis, it has been decided to use the tubing corrosion/erosion factors summarized in Table 2.
Furthermore calculations have been also performed for production casings, for which two
corrosion scenarios have been defined: a “high corrosion scenario” and a “low corrosion scenario”. In this case, it has been decided to use the maximum corrosion/erosion factor calculated from the log of the reference gas storage well (0.045 mm/y). The same value has been applied to intermediate casings as well.
alculations have been also performed for production casings, for which two scenarios have been defined: a “high corrosion scenario” and a “low corrosion scenario”. t has been decided to use the maximum corrosion/erosion factor calculated from the reference gas storage well (0.045 mm/y). The same value has been applied to intermediate
the sensitivity analysis have shown that: by applying the elastomers degradation factors of the “minimum degradation scenario all the wells of the fields under study have a residual well-life that goes beyond 2029 (the decade 2020-2029 has been the period of interest for the definition of lan). A number of 18 wells have shown a residual well-life lower than
Elastomers Degradation Factors
in order to estimate the impact that packer and seal assembly have on the residual wells life, taking into account the past and those identified within the Well Integrity Assessment.
As the result of the sensitivity analysis, it has been decided to use the tubing corrosion/ the “high corrosion scenario”, as they better meet the frequency of the previously experienced in the specific fields.
y applying the elastomers degradation factors of the “medium degradation scenario
- 6 wells have shown a residual well-life between 2020-2029;
As the result of the sensitivity analysis, it has been decided to use the tubing corrosion/ erosion factors relevant to the “high corrosion scenario”, as they better meet the frequency of the failures previously experienced in the specific fields.
- the total number of wells having a residual well-life less than 30 years is 26;
• by applying the elastomers degradation factors of the “high degradation scenario”:
- 13 wells have shown a residual well-life between 2020-2029;
values of the “high corrosion scenario”; elastomers degradation factors: three sets of annual degradation factors, as shown in Table 3. For permanent packers with locator, a higher annual degradation factor than retrievable packers and permanent packers with anchor has been used in all the scenarios, to take into account the greater degradation to which elastomers could incur due to their possible movements.
A sensitivity analysis is carried out in order to estimate the impact that packer and seal elastomers annual degradation factors have on the residual wells life, taking into account failures experienced in the specific field and those identified within the Well Integrity Assessment.
- the total number of wells having a residual well-life less than 30 years is 30.
The results of the sensitivity analysis have shown that:
It has been decided to apply the elastomers degradation factors defined in the second scenario, which have been deemed to be able to reliably represent the actual wells ageing conditions:
• retrievable packers and permanent packers with anchor: 1,5%
• permanent packers with locator: 2%
A sensitivity analysis is carried out in order to estimate the impact that packer and seal assembly elastomers annual degradation factors have on the residual wells life, taking into account the past failures experienced in the specific field and those identified within theWell Integrity Assessment.
• annual degradation of wellhead and tubing hanger elastomers: 0,5% (as derived the experiences in similar works)
• by applying the elastomers degradation factors of the “minimum degradation scenario”, all the wells of the fields under study have a residual well-life that goes beyond 2029 (the decade 2020-2029 has been the period of interest for the definition of the Workover Plan). A number of 18 wells have shown a residual well-life lower than 30 years;
By applying the above corrosion/erosion and elastomers degradation factors, the wells ageing been defined for the studied fields, as shown in Figure 5:
• 4 wells with a residual well-life within 2027;
• by applying the elastomers degradation factors of the “medium degradation scenario”:
In such analysis, the previously defined tubing and casing corrosion/erosion factors have to be considered.
• 2 wells with a residual well-life within 2028;
• 26 wells with a residual well-life less than 30 years
- 6 wells have shown a residual well-life between 2020-2029;
In the performed gas storage fields applications, the following factors have been used:
• tubing/casing corrosion/erosion factors:
- the total number of wells having a residual well-life less than 30 years is 26;
• by applying the elastomers degradation factors of the “high degradation scenario”:
- 13 wells have shown a residual well-life
In order to define a suitable W orkover Plan, based on past failures and able to anticipate the future ones, in addition to wells ageing, possible failures of SCSSV and other sudden failures have been also considered, which do not depend on WBEs degradation and, thus, cannot be foreseen advance.
between 2020-2029;
- the total number of wells having a residual well-life less than 30 years is 30.
It has been decided to apply the elastomers degradation factors defined in the second scenario, which have been deemed to be able to reliably represent the actual wells ageing conditions:
• retrievable packers and permanent packers with anchor: 1,5% permanent packers with locator: 2% annual degradation of wellhead and tubing hanger elastomers: 0,5% (as derived from the experiences in similar works).
By applying the above corrosion/erosion and elastomers degradation factors, the wells ageing has been defined for the studied fields, as shown in Fig. 5:
4 wells with a residual well-life within 2027;
• 2 wells with a residual well-life within 2028;
• 26 wells with a residual well-life less than 30 years.
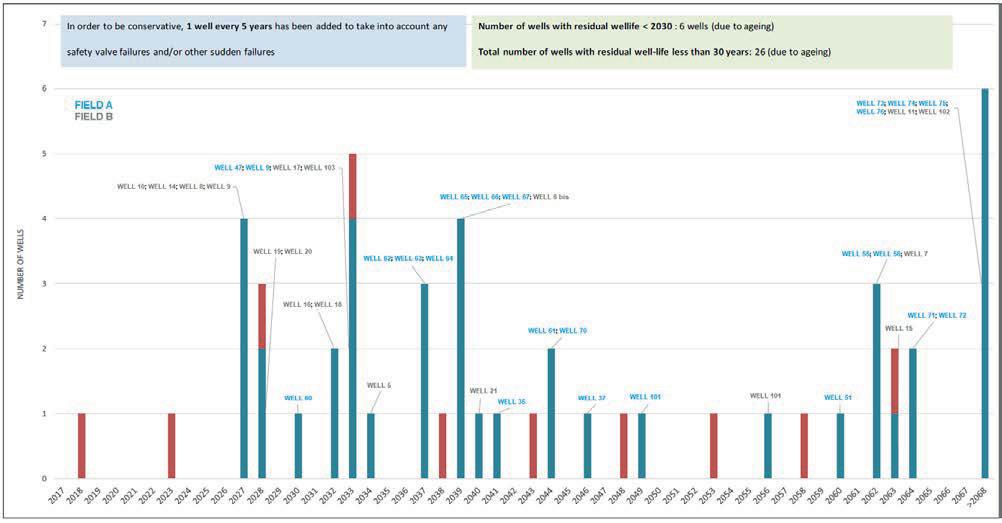
On the basis of the well integrity failures experienced in the two fields of interest and with a conservative approach, it has been decided to consider one further failed well every 5 years, additional to those which are expected to fail due to ageing.
The final results of the study are shown in Fig. 6, where:
• blue bars indicate the wells that are expected to fail because of their ageing condition; red bars indicate the additional wells that are expected to fail due to SCSSV/other sudden failures.
Based on the results of previous phases, wells are classified as a function of specific parameters such as well integrity, ageing, performance, asset and safety in order to produce Priority Lists for planning future workover activities. Then, a cost/benefit analysis is carried out.
• Performance: assigned based on the maximum production flow rate of each well. Safety/Location: this parameter refers to the distance from houses or facilities of each well; the greater the distance, the lower the assigned priority level.
• Asset: this parameter takes into consideration if a well is an isolated well or not: higher priority levels are assigned to isolated wells.
For the analysed fields, priority levels assignment criteria have been defined as described in Table 4, which also reports the values attributed to each priority level.
Then, a weight has been assigned to each of the above parameters in order to attribute them a “percentage of impact” on the final well priority value (Table 5).
In order to define a suitable Workover Plan, based on past failures and able to anticipate the future ones, in addition to wells ageing, possible failures of SCSSV and other sudden failures have been also considered, which do not depend on WBEs degradation and, thus, cannot be foreseen in advance.
To define a priority list for future workover activities, priority levels (and related priority values) are assigned to each well for the following parameters:
The weights for Safety/Location and Asset parameters have been assumed equal to zero because, when performing a workover, the geographic position of the well does not change; therefore, these parameters have no impact on the wells final priority values in the definition of a Priority List for workovers.
On the basis of the well integrity failures experienced in the two fields of interest and with a conservative approach, it has been decided to consider one further failed well every 5 years, additional to those which are expected to fail due to ageing. The final results of the study are shown in Figure 6, where:
Well Integrity: assigned based on the results of the Well Integrity Assessment.
• Ageing: assigned based on the results of the Wells Ageing Study.
• blue bars indicate the wells that are expected to fail because of their ageing condition;

A third factor has been finally attributed to each well, named function, aimed at reducing (or excluding) the impact of a specific parameter to specific wells (e.g., a function factor equal to zero has been assigned to the per
• red bars indicate the additional wells that are expected to fail due to SCSSV/ other sudden failures.
Based on the results of previous phases, wells are classified as a function of specific parameters such as well integrity, ageing, performance, asset and safety in order to produce Priority Lists for planning future workover activities. Then, a cost/benefit analysis is carried out.
To define a priority list for future workover activities, priority levels (and related priority values) are assigned to each well for the following parameters:
• Well Integrity: assigned based on the results of the Well Integrity Assessment.
• Ageing: assigned based on the results of the Wells Ageing Study.
• Performance: assigned based on the maximum production flow rate of each well.
• Safety/Location: this parameter refers to the distance from houses or facilities of each well; the greater the distance, the lower the assigned priority level.
• Asset: this parameter takes into consideration if a well is an isolated well or not: higher priority levels are assigned to isolated wells.
For the analysed fields, priority levels assignment criteria have been defined as described in Table 4, which also reports the values attributed to each priority level.
(*) A low priority level for Well Integrity has been assigned to wells with pressure in B-Annulus, since a workover would not be able to restore the integrity of such wells.
the definition of a Priority List for
(*) A low priority level for Well Integrity has been assigned to wells with pressure in B -Annulus, since a workover would not be able to restore the integrity of such wells. Table 4 Priority Levels Criteria for the definition of a Priority List for Workover
Then, a weight has been assigned to each of the above parameters in order to attribute them a “percentage of impact” on the final well priority value (Table 5).
The weights for Safety/Location and Asset parameters have been assumed equal to zero because, when performing a workover, the geographic position of the well does not change; therefore, these parameters have no impact on the wells final priority values in the definition of a Priority List for workovers.
Then, a weight has been assigned to each of the above parameters in order to attribute them “percentage of impact” on the final well priority value (Table 5).
The weights for Safety/Location and Asset parameters have been assumed equal when performing a workover, the geographic position of the well does not change; parameters have no impact on the wells final priority values in the definition workovers.
A third factor has been finally attributed to each well, named function, aimed at reducing (or excluding) the impact of a specific parameter to specific wells (e.g., a function factor equal to zero has been assigned to the performance parameter of monitoring wells, to exclude it from the calculation of the weighed priority value of these wells).
A third factor has been finally attributed to each well, named function, aimed excluding) the impact of a specific parameter to specific wells (e.g., a function has been assigned to the performance parameter of monitoring wells, to calculation of the weighed priority value of these wells).
By entering the defined priority values, weights and functions in the following equation, the current weighed priority value of each well has been calculated.
By entering the defined priority values, weights and functions in the following weighed priority value of each well has been calculated.
where:
formance parameter of monitoring wells, to exclude it from the calculation of the weighed priority value of these wells).
The weights for Safety/Location and Asset parameters have been assumed equal to zero because, when performing a workover, the geographic position of the well does not change; therefore, these parameters have no impact on the wells final priority values in the definition of a Priority List for workovers.
where:
• Pr.Lev param : priority level value for a specific parameter (e.g., Pr.LevelWI: priority level value for Well Integrity etc.)
The weights for Safety/Location and Asset parameters have been assumed equal to zero because, when performing a workover, the geographic position of the well does not change; therefore, these parameters have no impact on the wells final priority values in the definition of a Priority List workovers.
where:
• F param : function assigned to the well for a specific parameter
• Wt param : weight assigned to a specific parameter.
By entering the defined priority values, weights and functions in the following equation, the current weighed priority value of each well has been calculated.
• Pr.Levparam: priority level value for a specific parameter (e.g., Pr.LevelWI: priority level value for Well Integrity etc.)
• Pr.Lev param : priority level value for a specific parameter (e.g., Pr.LevelWI: value for Well Integrity etc.)
Fparam: function assigned to the well for a specific parameter
A third factor has been finally attributed to each well, named function, aimed at reducing (or excluding) the impact of a specific parameter to specific wells (e.g., a function factor equal to zero has been assigned to the performance parameter of monitoring wells, to exclude it from the calculation of the weighed priority value of these wells).
• F param : function assigned to the well for a specific parameter
By ordering the wells according to their weighed priority values in a descending order (a higher priority value means that a well is a good “candidate” to be abandoned and replaced by a new well), the Weighed Priority List for Workover shown in Table 6 has been obtained.
A third factor has been finally attributed to each well, named function, aimed at reducing excluding) the impact of a specific parameter to specific wells (e.g., a function factor equal to zero has been assigned to the performance parameter of monitoring wells, to exclude it from the calculation of the weighed priority value of these wells).
• Wtparam: weight assigned to a specific parameter.
By ordering the wells according to their weighed priority values in a descending order (a higher priority value means that a well is a good “candidate” to be abandoned and replaced by a new well), the Weighed Priority List for Workover shown in Table 6 has been obtained.
• Wt param : weight assigned to a specific parameter.
By entering the defined priority values, weights and functions in the following equation, the current weighed priority value of each well has been calculated.
By entering the defined priority values, weights and functions in the following equation, the current weighed priority value of each well has been calculated.
where:
By ordering the wells according to their weighed priority values in a descending priority value means that a well is a good “candidate” to be abandoned and well), the Weighed Priority List for Workover shown in Table 6 has been obtained.
where:
• Pr.Lev param : priority level value for a specific parameter (e.g., Pr.LevelWI: priority level value for Well Integrity etc.)
• F param : function assigned to the well for a specific parameter
• Pr.Lev param : priority level value for a specific parameter (e.g., Pr.LevelWI: priority level value for Well Integrity etc.)
• Wt param : weight assigned to a specific parameter.
• F param : function assigned to the well for a specific parameter
• Wt param : weight assigned to a specific parameter.
By ordering the wells according to their weighed priority values in a descending order (a higher priority value means that a well is a good “candidate” to be abandoned and replaced by a new well), the Weighed Priority List for Workover shown in Table 6 has been obtained.
By ordering the wells according to their weighed priority values in a descending order (a higher priority value means that a well is a good “candidate” to be abandoned and replaced by a new well), the Weighed Priority List for Workover shown in Table 6 has been obtained.
List for drilling activities in the fields of interest.
In this case, different priority level assignation criteria for Well Integrity (Table 7) and different weights (Table 8) have been defined.
In this case, different priority level assignation criteria for Well Integrity (Table 7) and different weights (Table 8) have been defined.
In fact:
In fact:
To verify the advisability of workovers/interventions on existing wells vs. drilling of new wells, the same methodology described in the previous paragraph has been also applied to define a Priority List for drilling activities in the fields of interest. In this case, different priority level assignation criteria for Well Integrity (Table 7) and different weights (Table 8) have been defined.
In fact:
• the weights for the Safety/Location and Asset parameters are not equal to zero as for workover, since, for drilling, the geographic location of the well is properly selected (e.g., cluster);
• the weights for the Safety/Location and Asset parameters are not equal to zero as for workover, since, for drilling, the geographic location of the well is properly selected (e.g., cluster);
• the weight for the Performance parameter, compared to workover, increases from 0,10 to 0,15 thanks to the possibility of installing higher-performance completions.
• the weight for the Performance parameter, compared to workover, increases from 0,10 to 0,15 thanks to the possibility of installing higher-performance completions.
By entering the priority values, weights and functions (as described in the previous paragraph) in Eq.1, the current weighed priority value of each well has been calculated and, as a consequence, the Weighed Priority List for drilling has been defined (Table 9).
• the weight for the Well Integrity e Ageing parameters are lower because of the increase of the other parameters
• the weights for the Safety/Location and Asset parameters are not equal to zero as for workover, since, for drilling, the geographic location of the well is properly selected (e.g., cluster); the weight for the Performance parameter, compared to workover, increases from 0,10 to 0,15 thanks to the possibility of installing higher-performance completions.
• the weight for the Well Integrity e Ageing parameters are lower because of the increase of the other parameters.
By entering the priority values, weights and functions (as described in the previous paragraph) in Eq.1, the current weighed priority value of each well has been calculated and, as a consequence, the Weighed Priority List for drilling has been defined (Table 9).
The average of all the calculated weighed priority values represents the “wells average priority value”: this value can be used as a measure of the current quality of the field.
By entering the priority values, weights and functions (as described in the previous paragraph) in Eq.1, the current weighed priority value of each well has been calculated and, as a consequence, the Weighed Priority List for drilling has been defined (Table 9).
• the weight for the Well Integrity e Ageing parameters are lower because of the increase of the other parameters.
The average of all the calculated weighed priority values represents the “wells average priority value”: this value can be used as a measure of the current quality of the field.
The average of all the calculated weighed priority values represents the “wells average priority value”: this value can be used as a measure of the current quality of the field.

• costs for wells abandonment have not been included in the costs estimate;
• the analysis does not include considerations on OPEX.
The graph in Figure 7 shows the distribution of costs over the years for the two options. Costs of Option 2 are represented with yellow bars, while costs of Option 3 with green bars.
Three different Workover/Drilling Plan options for the period 2020-2039 have been analysed:
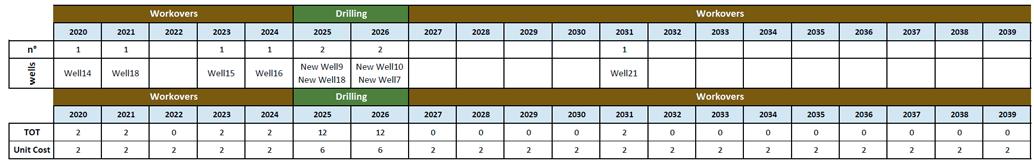
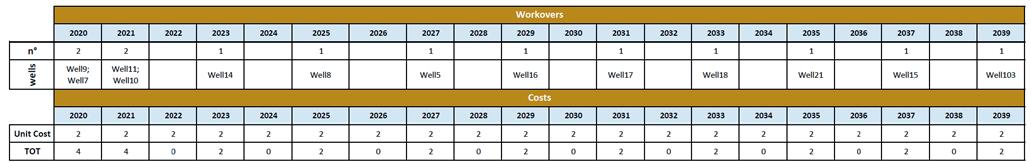
forming workovers to maximize the reduction of the wells average priority values.
• costs for wells abandonment have not been included in the costs estimate;
• Option 1 - “No Action”: this option consists in not carrying out any specific actions (neither workovers nor new wells drilling) and evaluate how the wells average priority value changes over the years.
• Option 2 - “Perform Only Workovers”: this option consists in performing only workovers to improve wells integrity and ageing, and also to try and improve performances (by increasing tubing sizes, eliminating crossovers, etc.)
Option 3 - “Perform Workovers and Drill New Wells”: this option consists in drilling new wells (to replace old wells) and per-
Since Option 1 implies an unacceptable increase of the wells average priority value over the years (blue line in Figure 8), a cost-benefit analysis has been performed to compare Option 2 and 3.
• the analysis does not include considerations on OPEX.
Figure 8 shows the trend of the wells average priority value of the two options, while Figure 9 shows the trend of the cumulative cost of the two options
The analysis of costs has been performed considering that:
• workover/drilling activities are executed according to the schedule shown in Table 10 and Table 11 respectively; the average cost of a workover for the studied wells is about 2 M¤;
• the average cost of a new well is about 6 M¤;
The graph in Figure 7 shows the distribution of costs over the years for the two options. Costs of Option 2 are represented with yellow bars, while costs of Option 3 with green
Figure 8 shows the trend of the wells average priority value of the two options, while Figure 9 shows the trend of the cumulative cost of the two options.
The graphs show that:
• In the first years (2020-2024), the wells average priority value in both options is
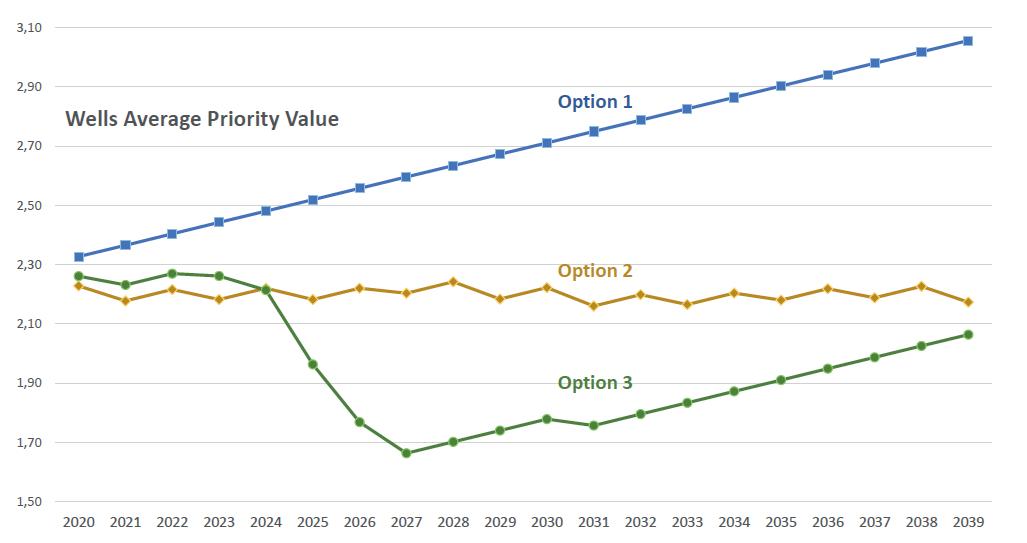
almost constant, around 2,20.
• In 2025-2027, the wells average priority value in Option 3 decreases significantly, due to the new wells drilling.
• In Option 3, starting from 2027, the wells average priority value starts to grow again; however, the final value in 2039 is lower than the value obtained in Option 2.
• Option 3 total cost is 8 M¤ higher than the total cost of Option 2 (34 M¤ vs. 26 M¤).
• Cost of Option 2 is distributed over the years; in Option 3, most of the total cost is concentrated in the years 2025-2026 (years in which the drilling of new wells is planned).
Therefore, Option 2 involves lower costs than Option 3 and a stable average wells priority value over the years.

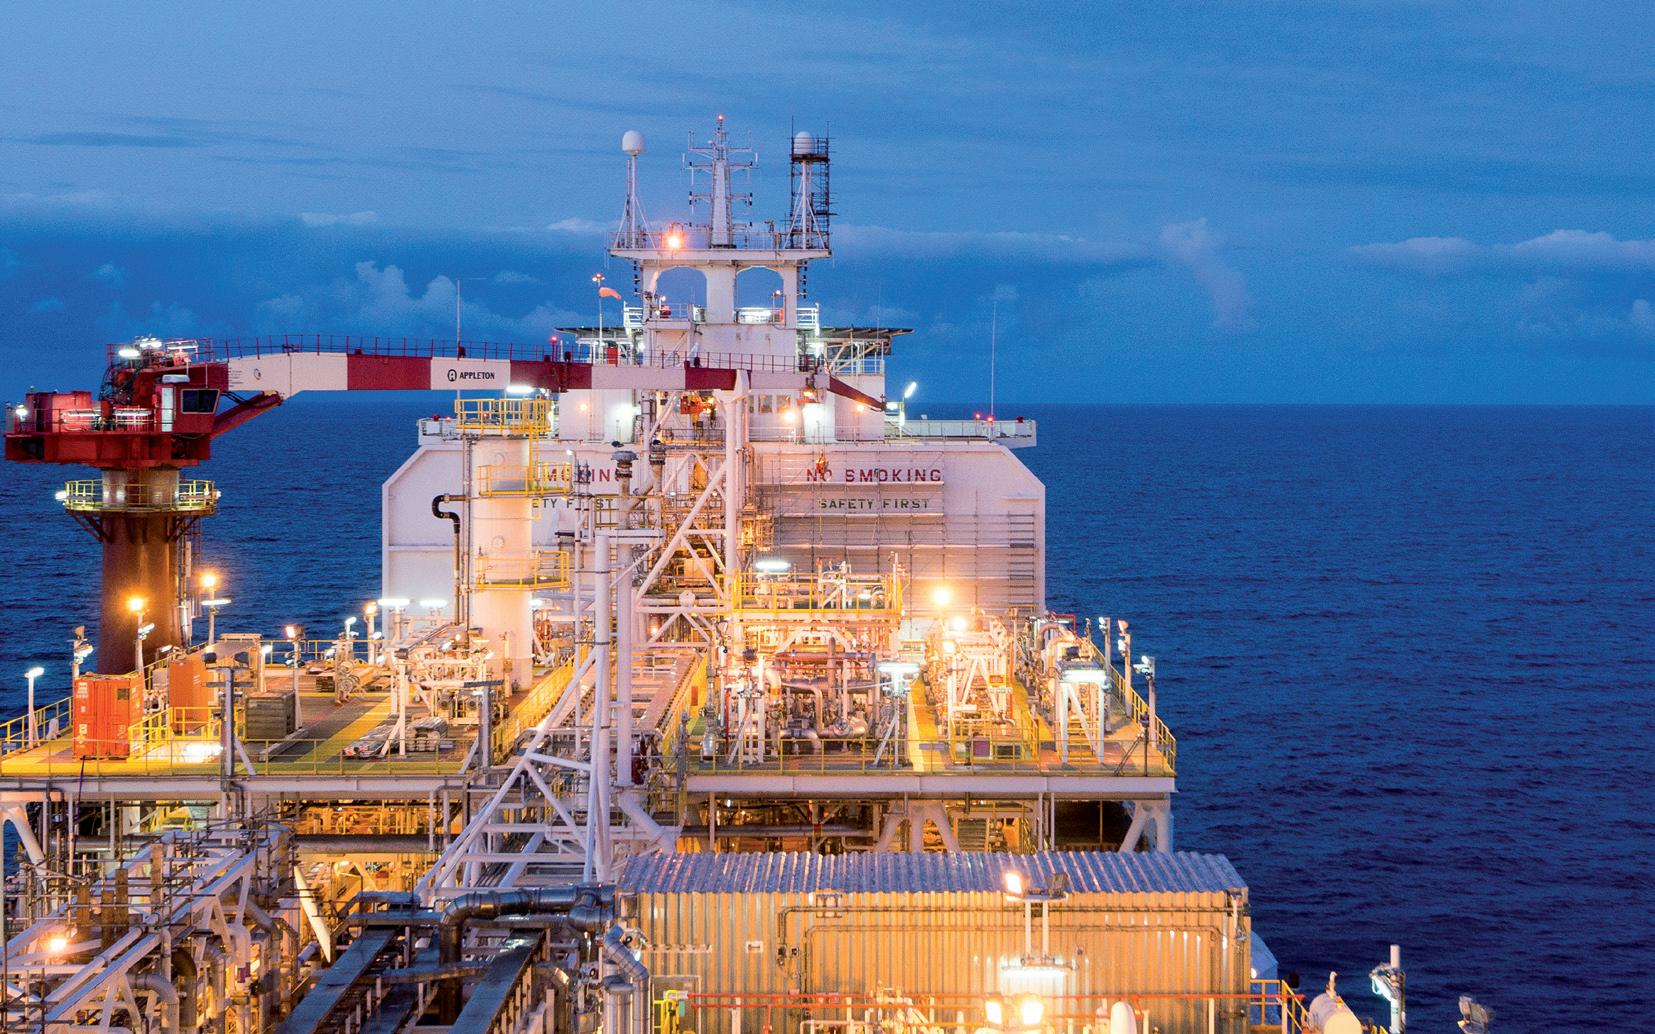
Introduction
The GreenStream pipeline is an offshore pipeline laid in the Mediterranean Sea. It is 516 km long natural gas pipeline which has 32 inches diameter. It runs from Mellitah in Libya to Gela in Sicily, Italy. It was constructed with initial capacity of 8 billion cubic meters (bcm) of natural gas per year. Later the capacity of the pipeline was increased to 11 bcm. The pipeline parameters are given in Table -1.
Maintaining pipeline in a safe and reliable condition is one of the major tasks for pipeline owners and operators. Assuring safety and reliability of a pipeline demands an integrated and efficient integrity management system. Pipeline integrity management is a process for assessing and mitigation pipeline risks in order to reduce both the likelihood and consequences of incidents. The U.S. Office of Pipeline Safety (OPS) has established1 a set of regulations impacting operators of hazardous liquids and natural gas transmission lines. Part of the mandate is the development of a comprehensive integrity management program to address ongoing pipeline safety. Other international references related to pipeline integrity management are:
ASME B31.85 - 2012: Managing System
Integrity of Gas Pipelines2
• UK Pipelines Safety Regulations3
• Pipeline Risk Management Manual – by Muhlbauer4
Corrosion is one of the leading causes of failures in onshore transmission pipelines. Corrosion failures can be either leaks or ruptures. Table 2 provides a summary of the major accidents reported to the U.S. Department of Transportation by the operators for the 6-year period between 1994 and 19995. The data show that for transmission pipeline systems (both hazardous liquid and natural gas), approximately 25% of all reported accidents were due to corrosion. For natural gas transmission pipeline accidents, 36% were caused by external corrosion and 63% were caused by internal corrosion. For natural gas distribution pipeline accidents, only approximately 4% of the total accidents were caused by corrosion, and the majority of those were caused by external corrosion. The accidents reported in Table 2 are for major accidents that resulted in injury, fatality, or more than $50,000 in property damage. In addition to the reportable accidents, an average of 8000 corrosion leaks per year are repaired on natural gas transmission pipelines6. In a summary report for incidents between 1985 and 1994, corrosion accounted for 28.5% of pipeline incidents on natural gas transmission and gathering pipelines7
U.S. Department of Transportation (DOT) regulations governing the maintenance and preservation of pipelines require that pipeline operators identify and evaluate all potential threats to every high consequence area (HCA)
along their pipeline system. HCAs, which typically are areas where there is a relatively high population density or sensitive environment near the pipeline, are defined in the regulations. The rules for the integrity management of gas pipelines are contained in Title 49 CFR Part 192, Transportation of Natural Gas and Other Gas by Pipeline: Minimum Federal Safety Standards.
Part 192.917 specifically mentions internal corrosion, external corrosion, and stress corrosion cracking (SCC) as three of the threats that must be considered for gas pipelines.
Degradation of pipelines is the result of the persistent attack by the external environment on pipeline materials (pipe, welds, coatings, etc.) and the characteristics of fluids flowing in the pipeline. External corrosion is a function of the interaction between the pipeline and the sea water that surrounds it in offshore pipelines. Seawater is high salinity water and corrosive in nature. Natural gas transmission pipelines are far more susceptible to external corrosive attack than similar operating oil pipelines. To explain the difference, it is proposed that the internal liquid content of the natural gas transmission pipeline may actually promote corrosive chemical reactions on the outside steel surface of the pipeline. It is common knowledge when given enough time that steel
will eventually absorb a high concentration of hydrocarbon and other liquids within the grains structure itself. A welder that attempts to cut and weld “in-service” natural gas pipelines will realize that the steel contains contaminants that will react with the weld metal deposited and cause blisters and hard compounds to develop. Special weld procedures are developed with the most common remedy is to bake out the steel for several hours at high temperatures to evaporate most of the liquids/gas contained within the steel prior to welding.
Internal corrosion in the natural gas pipeline is mostly due to water wetting6,7 the steel surface in the presence of acid gases including carbon dioxide (CO2) and hydrogen sulfide (H2S). Processed natural gas can contain small concentrations of water, carbon dioxide, hydrogen sulfide, and potentially oxygen that can be corrosive to the steel pipeline transporting the gas. The average composition of natural gas transported in GreenStream pipeline from Mellitah gas plant to Geila, Italy is presented in Table -3. Internal corrosion on gas pipelines is influenced by temperature, CO2 content, H2S content, flow velocity, water wetting and composition and surface condition of the steel. A small change in one of these parameters can change the corrosion rate considerably, due to changes in the properties of the thin layer of corrosion products that accumulates on the steel surface.
When products formed as a result of corrosion may spall off the steel surface and become entrained in the gas becoming what is commonly known in the oil and gas industry as “black powder”8. Black powder particles vary in size and can range from 100 nm to 1 mm9. The composition of black powder can also vary and can include corrosion products, salt, dirt, and other materials trapped in the pipeline during construction. The production of black powder is most significant in gas transmission pipelines.
Sherik, et al.10, collected black powder samples from Saudi Aramco sour gas and sales gas pipelines for analysis by X-ray diffraction (XRD) and X-ray fluorescence (XRF). The sour gas pipeline black powder samples were predominantly composed of FeS and FeS2 with minor amounts of Fe3O4, FeO(OH), and FeCO3. XRD of black powder samples from the sales gas pipelines detected Fe3O4, α-FeO(OH), and α-FeO(OH) with small amounts of FeCO3. However, sulfur was detected in all collected samples by XRF, which suggests the black powder may contain an amorphous sulfur-con-
• ASME B31.85 - 2012: Managing System Integrity of Gas Pipelines2
• UK Pipelines Safety Regulations3
• Pipeline Risk Management Manual – by Muhlbauer4
Table 1: GreenStream pipeline parameters
Pipeline Characteristics:
Nominal Diameter:
Wall Thickness:
Line Pipe Material:
Manufacturing Process:
Bend Radius:
Valve Stations:
Type of Fittings:
Pipeline Coating Buried & Underwater:
Above Ground, Special Items, Bends: Pipeline Weld-Joint Coating:
Internal Lining:
Concrete Coating:
Pipeline Cathodic Protection
Cathodic Protection – Offshore
Anode Type & Material:
Anode Spacing:
Cathodic Protection –Onshore
Anode Type & Material
Other Features of Pipeline
Mechanical Design Pressure:
Design Temperature: Min. / Max.:
Design Life:
32 inches
30.2 mm & 26.1 mm
SAWL L450MC (ISO 3183-3)
UOE, Longitudinal SAW
7 D 2
Barred Tees
3-layer polyethylene / 6.0 mm, and reinforced polyurethane tar (2.0 – 2.5 mm)for concrete over-weighted sections
Epoxy paint, DFT 370 µm min.
Polyethylene heat shrinkable sleeve
Epoxy/ 60 microns min
Thickness 40 – 100 mm, density 2400 –3040 kg/m3
Al alloy half-shell bracelet anodes
Every 3 to 8 pipe joints
Sacrificial Mg anodes
223.2barg 0 / 60 oC 50 years
report for incidents between 1985 and 1994, corrosion accounted for 28.5% of pipeline incidents on natural gas transmission and gathering pipelines7
Table 2: Summary of corrosion-related accident reports on natural gas transmission, and natural gas distribution pipelines from 1994 to 19995
Corrosion is one of the leading causes of failures in onshore transmission pipelines. Corrosion failures can be either leaks or ruptures.Table 2 provides a summary of the major accidents reported to the U.S. Department of Transportation by the operators for the 6-year period between 1994 and 19995. The data show that for transmission pipeline systems (both hazardous liquid and natural gas), approximately 25% of all reported accidents were due to corrosion. For natural gas transmission pipeline accidents, 36% were caused by external corrosion and 63% were caused by internal corrosion. For natural gas distribution pipeline accidents, only approximately 4% of the total accidents were caused by corrosion, and the majority of those were caused by external corrosion. The accidents reported in Table 2 are for major accidents that resulted in injury, fatality, or more than $50,000 in property damage. In addition to the reportable accidents, an average of 8000 corrosion leaks per year are repaired on natural gas transmission pipelines6. In a summary
Internal corrosion in the natural gas pipeline is mostly due to water wetting6,7 the steel surface in the presence of acid gases including carbon dioxide (CO2) and hydrogen sulfide (H2S). Processed natural gas can contain small concentrations of water, carbon dioxide, hydrogen sulfide, and potentially oxygen that can be corrosive to the steel pipeline transporting the gas. The average composition of natural gas transported in GreenStream pipeline from Mellitah gas plant to Geila, Italy is presented in Table -3. Internal corrosion on gas pipelines is influenced by temperature, CO2 content, H2S content, flow velocity, water wetting and composition and surface condition of the steel. A small change in one of these parameters can change the corrosion rate considerably, due to changes in the properties of the thin layer of corrosion products that accumulates on the steel surface.
Table 2: Summary of corrosion-related accident reports on natural gas transmission, and natural gas distribution pipelines from 1994 to 19995
U.S. Department of Transportation (DOT) regulations governing the maintenance and preservation of pipelines require that pipeline operators identify and evaluate all potential threats to every high consequence area (HCA) along their pipeline system. HCAs, which typically are areas where there is a relatively high population density or sensitive environment near the pipeline, are defined in the regulations. The rules for the integrity management of gas pipelines are contained in Title 49 CFR Part 192, Transportation of Natural Gas and Other Gas by Pipeline: Minimum Federal Safety Standards.
Part 192.917 specifically mentions internal corrosion, external corrosion, and stress corrosion cracking (SCC) as three of the threats that must be considered for gas pipelines.
Degradation of pipelines is the result of the persistent attack by the external environment on pipeline materials (pipe, welds, coatings, etc.) and the characteristics of fluids flowing in the pipeline. External corrosion is a function of the interaction between the pipeline and the sea water that surrounds it in offshore pipelines. Seawater is high salinity water and corrosive in nature. Natural gas transmission pipelines are far more susceptible to external corrosive attack than similar operating oil pipelines. To explain the difference, it is proposed that the internal liquid content of the natural gas transmission pipeline may actually promote corrosive chemical reactions on the outside steel surface of the pipeline. It is common knowledge when given enough time that steel will eventually absorb a high concentration of hydrocarbon and other liquids within the grains structure itself. A welder that attempts to cut and weld “in-service” natural gas pipelines will realize
When products formed as a result of corrosion may spall off the steel surface and become entrained in the gas becoming what is commonly known in the oil and gas industry as “black powder”8. Black powder particles vary in size and can range from 100 nm to 1 mm9. The composition of black powder can also vary and can include corrosion products, salt, dirt, and other materials trapped in the pipeline during construction. The production of black powder is most significant in gas transmission pipelines.
Sherik, et al.10, collected black powder samples from Saudi Aramco sour gas and sales gas pipelines for analysis by X-ray diffraction (XRD) and X-ray fluorescence (XRF). The sour gas pipeline black powder samples were predominantly composed of FeS and FeS2 with minor
taining species. Elemental sulfur was detected with XRD in some samples.
GreenStream pipeline is large capacity pipeline that deliver gas from processing plant to the consumer or distributor. The pipeline is designed to move large quantities of natural gas over long distances, therefore, pipeline has large diameter and high operating pressure. The presence of Black Powder in the pipeline can have a large number of detrimental effects in the pipeline operations and also at customerαs delivery points including fouling of compressors, blocking of orifice of meters, contamination of instrumentation and control valves, blocking of furnace nozzles and plugging filter systems.
Since the conditions for producing SCC are far more limited than those for producing uniform or pitting corrosion, it would not be appropriate to identify SCC as a threat for all pipeline segments or high consequence areas (HCAs).
Appendix A3 of ASME B31.8S, a part of ASMEαs integrity management standard2 for gas pipelines, states that SCC would not be identified as a threat unless the following three conditions are present:
(a) Operating stress level greater than 60% of the specified minimum yield strength (SMYS),
(b) Age of pipe coating greater than 10 years, and
(c) Any corrosion coating system other than plant-applied or field-applied FBE or liquid epoxy (when abrasive surface preparation was used during field coating application). Bare pipe is included, and field joint coating systems also should be considered for their susceptibility.
High-pH SCC also would be eliminated unless:
• The operating temperature was above 100° F (38° C), and
• The distance from an upstream compressor station is less than 20 miles (32 km).
According to the Federal Pipeline & Hazardous Materials Safety Administration (PHMSA), the majority of pipeline incidents caused by sulfide stress corrosion (SCC) are found on natural gas pipelines rather than hazardous liquid pipelines.
The other factors which also contribute to the pipeline integrity are discussed below:
Temperature – The temperature of the surroundings as well as the temperature of the pipe may create favorable conditions for attack
on pipeline materials. Liquid and gas pipelines have slightly different operating temperature characteristics but both are still susceptible.
Stresses (Residual and Others) – Stresses in the pipe may lead to premature degradation of pipeline strength. The stresses acting on the pipe include:
a) residual stress from the manufacturing process,
b) external stress such as those incurred due to bending, welding, mechanical gouges, and corrosion, and
c) secondary stresses due to soil settlement or movement.
Pipe Pressure – Corrosion, in particular cracking, is related to the pressures exerted on the pipe. As the pressures within the pipe are increased, the growth rates for cracks also increase. The circumferential stress (hoop stress) generated by the pipeline operating pressure is usually the highest stress component that exists.
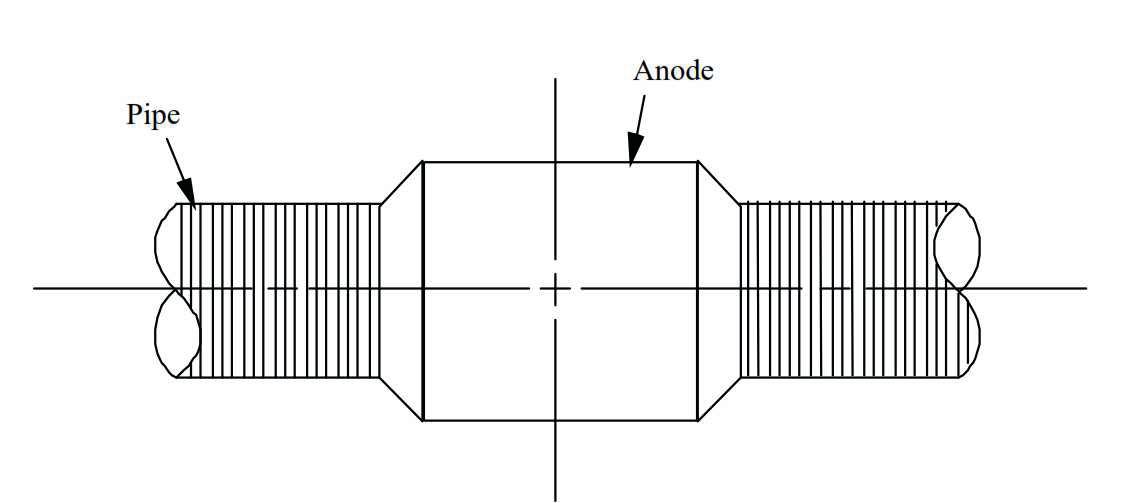
Cyclic Loading Effects – Conditions where the pipe is under cyclic loads may result in increased crack growth rates. The pipeline pressure continually fluctuates due to loading and unloading of product and is influenced by pump activity. This applies to both gas and liquid lines but has greater influence in liquid systems.
High performance pipeline coatings and cathodic protection (CP) are used to combat external corrosion13,14 of submerged pipelines.
Coatings – The most effective method to prevent external corrosion or SCC on submerged
pipelines is to use high performance coatings, applied to a surface abrasive blast cleaned to a white15 or near white16 metal surface finish, in conjunction with effective CP. An intact coating that prevents contact of electrolyte with the steel surface will prevent external corrosion or SCC. The surface abrasive blast cleaning promotes good coating adhesion. A high-quality abrasive blast cleaning also will impart compressive residual stresses in the pipe surface that improve SCC resistance.
The pipe is treated internally using a spraying device, which moves along the inside of the pipe, efficiently applying a two-part polyurethane primer. This is followed by another coat of primer and once dry a single coat of epoxy /60 microns min applied in the same manner rendering the internal surface acid and heat resistant. The outer surface is treated similarly with two coats of primer and a slightly modified polyurethane topcoat of anti-impact design, then a coat of concrete applied.
For extra insulation several layers of this type of protection can be applied, with extra care taken to repair any damage to the pipe coatings especially in areas where underwater pipe welding has been used to join the pipeline lengths. It is imperative that these areas are repaired, as corrosion will attack the weakest point. Therefore it is recommended that a specialist contractor experienced in this field is employed to carry out the work.
Inadequate coating performance is a major contributing factor in the corrosion and SCC susceptibility of an underground or submerged pipeline. The function and desired characteristics of a dielectric-type pipeline coating are covered in NACE RP-016917. This specification states that the function of such coatings is to control corrosion by isolating the external surface of the submerged piping from the en-
vironment, to reduce CP requirements, and to improve (protective) current distribution.
Coatings must be properly selected and applied, and the coated piping must be carefully installed to fulfill these functions.The desired characteristics of the coatings include:
• Effective electrical insulation
• Effective moisture barrier
• Good adhesion to the pipe surface
• Applicable by a method that will not adversely affect the properties of the pipe
Applicable with a minimum of defects
Ability to resist the development of holidays with time
• Ability to resist damage during handling, storage, and installation
• Ability to maintain substantially constant resistivity with time
• Resistance to disbanding
• Resistance to chemical degradation
Ease of repair
Retention of physical characteristics
• Nontoxic to environment
• Resistance to changes and deterioration during above-ground storage and long-distance transportation
Cathod Protection (CP) - External corrosion is electrochemical phenomena and, therefore, can be prevented or mitigated by altering the electrochemical condition of the corroding interface. Altering the electrochemical nature of the corroding surface is relatively simple and is done by altering the electrical potential field around the pipe. By applying a negative potential and making the pipe a cathode, the rate of corrosion (oxidation) is reduced (corrosion is prevented or mitigated) and the reduction process is accelerated. This means of mitigating or preventing corrosion. Cathodic protection, also alters the environment at the pipe surface, which further enhances corrosion control. The pH of any electrolyte at the pipe surface is increased, the oxygen concentration is reduced, and deleterious anions, such as chloride, migrate away from the pipe surface.
Corrosion control of marine pipelines is provided by galvanic anodes. For structural, economic, and installation considerations galvanic anodes are invariably of the bracelet type, as illustrated schematically in Figure 1. For structural and installation considerations the size and, hence, weight of bracelet anodes is limited such that the spacing between anodes is, according to current practice, only about 250 meters. Consequently, voltage drop in the pipeline is insignificant; and life of CP system is governed by anode mass considerations.
It is generally recognized that corrosion of
steel in sea water is arrested by polarization to a potential of –0.80 V or more negative, and so achieving and maintaining a minimum polarization based upon this potential has been established as the goal of cathodic protection18,19. Figure 2 illustrates schematically a pipeline with identical, equally spaced bracelet anodes and the resultant polarized potential profile. Thus, the pipeline is most polarized immediate to the anodes; and potential attenuates with increasing distance there from. The factors determine the magnitude of this potential attenuation are as follows:
Anode resistance - This resistance is encountered as current leaves the anode and enters the electrolyte. It is a consequence of the geometrical confinement in the vicinity of the anode. Accordingly, attenuation from this cause is greatest immediate to the anode and decreases with increasing distance. Anode resistance is higher the greater the electrolyte resistivity and the smaller the anode.
Coating resistance - The intrinsic resistivity of marine pipeline coatings is relatively high; however, coating defects and bare areas from handling, transportation, and installation are invariably present. Consequently, the CP current enters the pipe at these locations where steel is directly exposed. Thus, the coating serves to reduce the exposed surface area of the pipeline compared to an uncoated situation, which, in turn, enhances the effective-
ness, efficiency, and distance to which protection is achieved.
Polarization resistance - This resistance term reflects an inherent resistance associated with the cathodic electrochemical reaction whereby ionic current in the electrolyte is translated to electronic conduction in the pipeline.
Metallic resistance - Although resistivity of steel is in orders of magnitude less than that of sea water, the confined pipeline cross section combined with the relatively long distance that current may have to travel in returning to electrical ground results in this term being influential, if not controlling, in some situations.
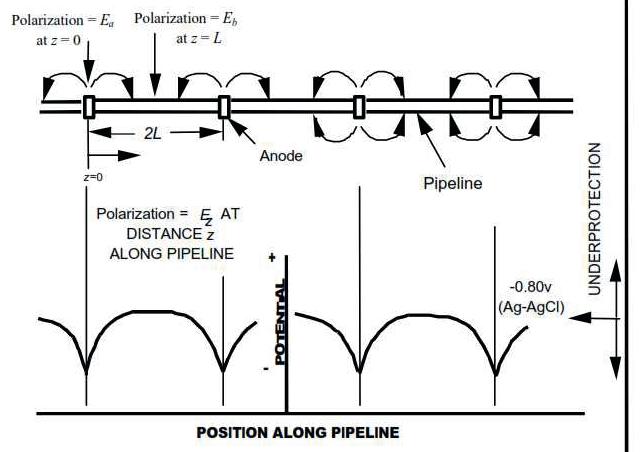
Portions of a pipeline for which potential is -0.80 VAgCl or more negative are protected, whereas locations where potential is more positive are unprotected. Cathodic protection (CP) is used in conjunction with a high performance pipeline coating for Greenstream pipeline. There are always flaws in the coating due to application inconsistencies, construction damage, or the combination of natural aging and stresses. The effect of these factors on corrosion mitigation is discussed below:
Disbonded Coatings - The most significant corrosion problem on coated and cathodically protected pipelines is that of disbonded pipeline coatings that shield cathodic protection when disbondments occur and water
Innovative insulation system for pipeline construction:
Top-performing under pressure:
l High-performance solid polyurethane elastomer
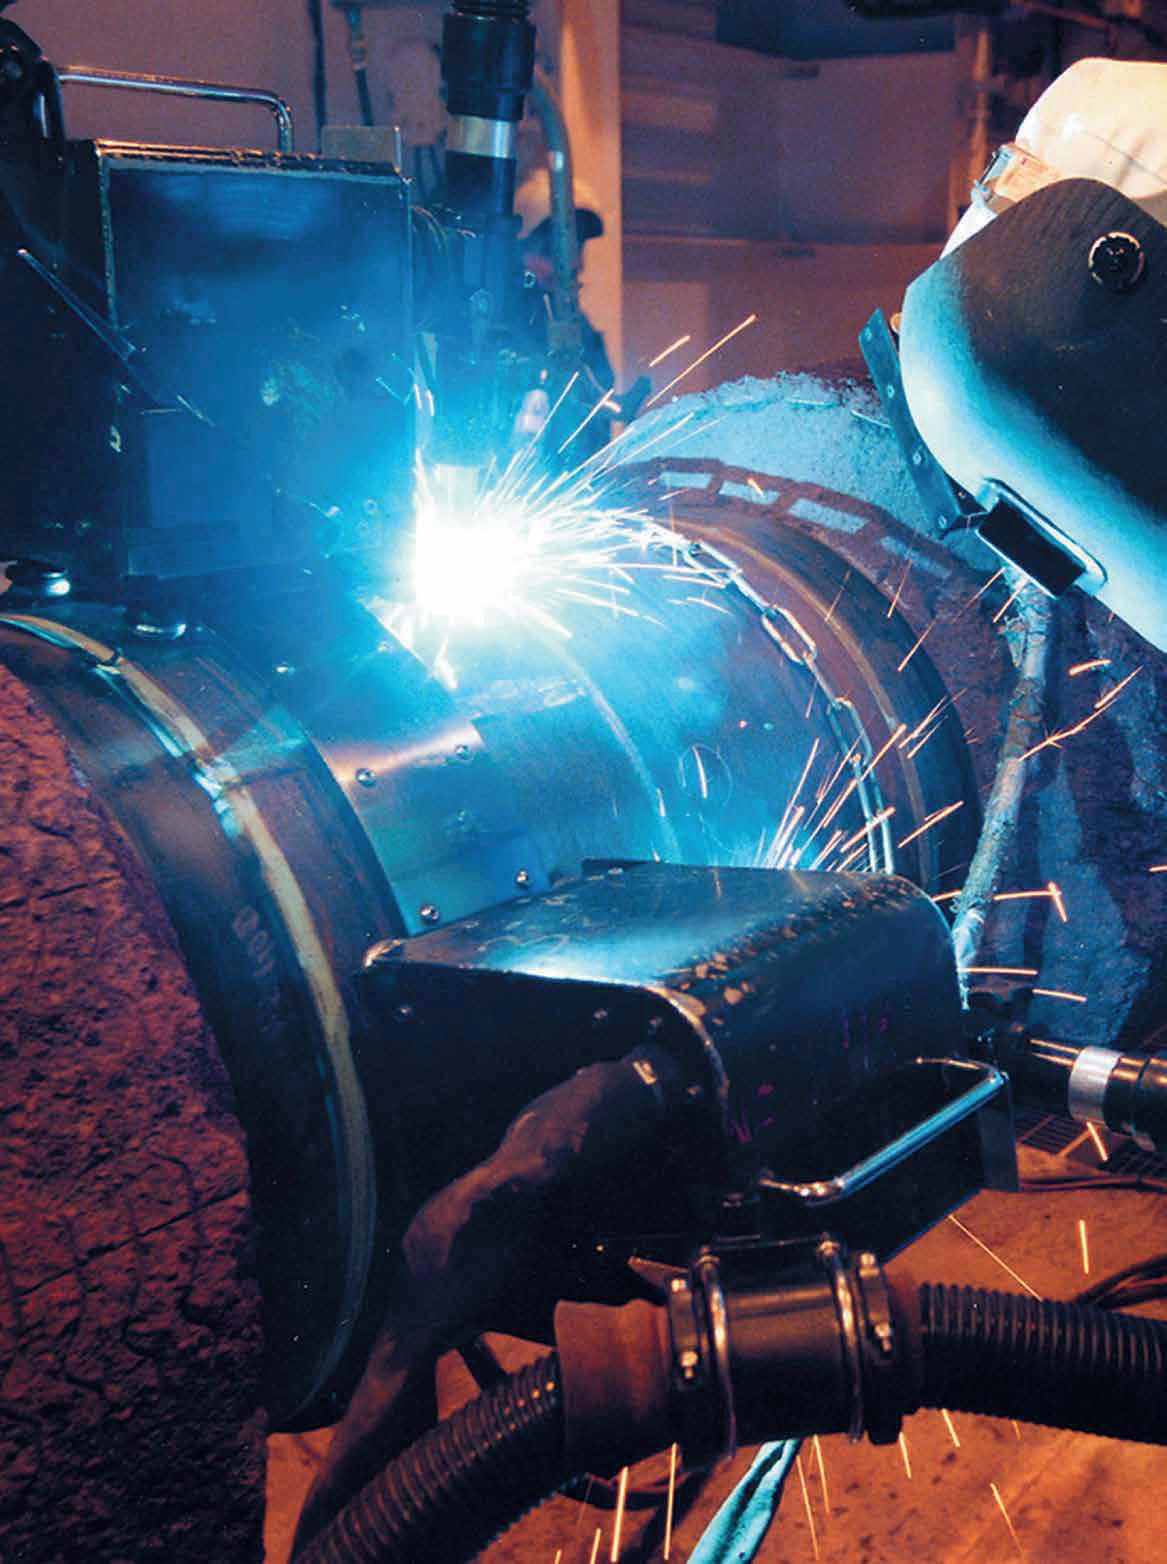
l Suitable for application areas such as field joints, line coat and static structures like manifolds, jumpers or tiebacks
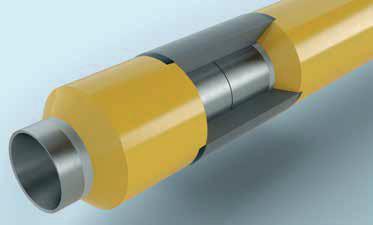
l Mould to subsea deployment in less than 5 minutes (field-joints)
l Fast and efficient application
l Single moulded operation
l Homogeneous system, excellent adhesion
l Low maintenance, reduced downtime
Functional, easy to process and globally available: Elastoshore® GS – the no. 1 thermal insulation solution.
penetrates between the coating and the pipe. All coatings can and will disbond for various reasons. Poor application procedures, temperature and a variety of other reasons can cause coatings to disbond. All coatings must have the ability to shield CP when properly adhered to the pipe. The problem happens when a disbondment occurs and water penetrates between the coating and the pipe. This problem exists more for certain types of coatings than for others. Some coatings will shield CP current in some situations and not in others.
Holidays and Coating Damage - If holidays or damage occur during the coating application, during construction of the pipeline, these areas can become spots where corrosion can occur, but are not usually a corrosion problem if CP is adequate. One problem that exists with the proposed changes in the criteria as quoted in NACE SP0169 is that many companies will be using more and more stringent criteria trying to meet a polarized – 80 mVAgCl or more negative potential at all sites on the pipeline system. This will cause more cathodic disbondment that may lead to more shielding of the CP current from the pipe by coatings that shield. Holidays should be located and repaired as the pipe is being constructed, but a proper repair with the proper repair material must be performed. Many times the repair material will lose adhesion and may shield the CP allowing corrosion to occur.
Inadequate Cathodic Protection - This is the least likely cause of corrosion on cathodically protected and coated pipelines. With the use of ILI (In-Line Inspection) tools and ECDA (External Corrosion Direct Assessment), the true causes of external corrosion on these systems are now being proven. If companies, government agencies, and contractors will spend more time training their employees on the proper evaluation techniques for determining the cause of external corrosion, the industry will find that inadequate CP is not the likely cause of corrosion.
Internal corrosion is also an electrochemical process; however, CP is not a viable option for mitigation internal corrosion in a pipeline. One of the first defense systems against corrosion for transmission pipelines is to ensure that the product being transported is free of moisture. Dry, aerated natural gas and moisture-free oil are not corrosive. For corrosion to occur, there must be moisture, CO2, oxygen, H2S, or some other reduction reactants, such as one produced by microbes (H2S). Operators typically control moisture, oxygen, H2S and CO2 con-
tents of the transported oil or gas, but these constituents can enter the pipeline through compressor or pump stations, metering stations, storage facilities, or other means. Chemical inhibitor programs are used in Greenstream pipeline to mitigate internal corrosion. Periodical cleaning by pigging is also performed in the pipeline to prevent internal corrosion and removal of water and black powder.
The monitoring and inspection techniques provide20 a way to measure the effectiveness of the corrosion control systems and provide an early warning when changing conditions may be causing a corrosion problem. The rate of corrosion dictates how long a pipeline can be safely operated. Corrosion monitoring techniques can help in several ways: by providing an early warning that damaging process conditions exist which may result in a corrosion-induced failure.
• by studying the correlation of changes in process parameters and their effect on system corrosivity.
• by diagnosing a particular corrosion problem, identifying its cause and the rate controlling parameters, such as pressure, temperature, pH, flow rate, etc. by evaluating the effectiveness of a corrosion control/ prevention technique such as chemical inhibition and the determination of optimal applications.
• by providing management information relating to the maintenance requirements and ongoing condition of a pipeline.
The severity of internal corrosion of a pipeline can be determined21 using corrosion monitoring techniques and the extent of corrosion damage is determined using inspections and assessments. Modelling is a tool for estimating corrosion rate and identifying monitoring locations. Corrosion rate models can be used to determine the effect of gas or liquid constituents on the corrosion rate of a pipeline.
Standard NACE SP0208 provides22 descriptions of various corrosion rate models. Modeling requires knowledge of operating conditions and gas quality data. Typical operating conditions include pressure, temperature, and flow rate (at a minimum). Gas quality data includes moisture content, CO2, H2S, and O2 content.
Sampling methods are considered intrusive methods because access to the interior environment is required to obtain a sample. Table 4 lists and describes the characteristics of monitoring techniques commonly used.
Corrosion monitoring devices only provide information about the specific location where they are installed. Therefore, carefully selecting representative locations to monitor internal corrosion is essential in order to collect data that is meaningful. Proper selection requires knowledge of the internal environment and the system design. The categorization of corrosion rates are defined in NACE Standard SP 077523
The problem of marine pipelines becoming under-protected because of under-performance or expiration of the CP system anodes is compounded by the difficulty of characterizing the corrosion state. This is not the case for offshore platforms where a simplified potential survey (drop cell method) is performed annually and a comprehensive close interval survey at five year intervals. Here, the space frame nature of such structures is such that protection to a given region is normally provided by multiple anodes; and even if corrosion develops locally, it is likely to be of little consequence. For pipelines, on the other hand, 1) a single galvanic anode typically protects a specific line length, 2) localized corrosion, if undetected, can lead directly to failure, and 3) corrosion survey logistics are relatively complex. Because of the last point, present regula-
tions specify only that measurements be made at locations of convenience, which are likely to be where the pipeline contacts a platform or pumping station. However, because such facilities are themselves cathodically protected and the pipeline may be in electrical contact with these, the pipeline may be protected here irrespective of the state of its own CP system. Protection may not be present, however, at more remote locations. Nonetheless, methods do exist and are practiced whereby over-theline corrosion and CP assessment surveys are performed. These include the following:
• Towed Vehicle/Trailing Wire Potential Measurements.
• ROV Assisted Remote Electrode Potential Measurements.
• ROV Assisted/Trailing Wire Potential Measurements.
• Electric Field Gradient Measurements.
Inspection methods are used to detect and evaluate damaged areas. Inspection techniques provide information on the extent of corrosion damage. However, they do not provide information on the time period over which the corrosion occurred. When inspection methods are performed at regular intervals, they can be used as a monitoring technique. The commonly used inspection techniques are:
(i) Visual inspection, (ii) Magnetic flux leakage (MFL), (iii) Ultrasonic testing (UT), (iv) Guided wave ultrasonic testing (GWUT), (v) Eddy current (ED), and (vi) Radiographic testing .
In-line inspection tools, also referred to as smart or intelligent pigs, are devices that are propelled in the pipeline and are used to detect and characterize metal loss caused by corrosion. There are two primary types of ILI tools: magnetic flux leakage (MFL) tools and ultrasonic tools (UT). The more advanced ILI tools (high-resolution tools) are capable of discriminating between internal and external corrosion. A magnetic flux leakage inspection pig uses magnetism to detect changes in the thickness of the pipe wall. The pipe wall is magnetized using a strong magnet. Any metal-loss in the pipe wall will cause the induced magnetic field to change. This change can be sensed using a detector and hence metal-loss defects can be identified. Post-processing of the collected data can be used to size and in some cases characterize (i.e. manufacturing, corrosion, etc.) the features identified in the pipeline. Magnetic flux leakage pigs can be run in both liquid or gas pipelines (i.e. they do not require a liquid couplant) and are capable of measuring metal-losses, even in thin-walled
pipe. The inspection provides a relative (i.e. percentage wall thickness) measurement of defect depth. Another type of commonly used intelligent pig is ultrasonic inspection pig. An ultrasonic inspection pig uses ultrasound to detect changes in the thickness of the pipe wall. A transducer transmits signals perpendicular to the pipe wall surface and receives signals back from both the internal and the external surface of the pipe wall. The time taken to receive the signals can then be used to determine the wall thickness of the pipeline. Ultrasonic pigs must be run in a liquid, since they require a couplant. Hence, ultrasonic pigs cannot be used in gas pipelines.
External corrosion direct assessment (ECDA) is a structured process that is intended to improve safety by assessing and reducing the impact of external corrosion on pipeline integrity23. It is explained in NACE standard practice SP 0502 – 201024. It is based on following four steps:
The Pre-Assessment Step - The “Pre-Assessment” step involves the collection and evaluation of historical data and pipeline characteristics. Based on this information, the feasibility of an ECDA application is determined and once affirmed, the pipeline is divided into regions with similar exposure and areas where the same indirect inspection tools may be used.
The Indirect Inspection - The “Indirect Inspection” step uses a combination of two or more above ground survey techniques such as close interval potential survey (CIPS), alternating current voltage gradient (ACVG), direct current voltage gradient (DCVG), AC attenuation for the identification of areas with corrosion activities or coating faults. The data is evaluated via systematic analysis and high-risk areas are identified for excavation.
The Direct Examination - The “Direct Examination” step covers the selection of sites to be excavated and the physical identification of defects requiring repair or replacement.
The Post Assessment - The “Post Assessment” step evaluates the previous three steps of the ECDA process and establishes a future assessment schedule.
Most of the data that is received by a control station is provided by Supervisory Con-
trol and Data Acquisition (SCADA) systems. These systems are essentially sophisticated communications systems that take measurements and collect data along the pipeline (usually in a metering or compressor stations and valves) and transmit it to the centralized control station. Flow rate through the pipeline, operational status, pressure, and temperature readings may all be used to assess the status of the pipeline at any one time. These systems also work in real time, meaning that there is little lag time between the measurements taken along the pipeline and their transmission to the control station. The data is relayed to a centralized control station, allowing pipeline engineers to know exactly what is happening along the pipeline at all times. This enables quick reactions to equipment malfunctions, leaks, or any other unusual activity along the pipeline. Some SCADA systems also incorporate the ability to remotely operate certain equipment along the pipeline, including compressor stations, allowing engineers in a centralized control center to immediately and easily adjust flow rates in the pipeline.
1. The material of GreenStream pipeline was selected keeping into consideration of Mediterranean sea conditions.
2. External corrosion on GreenStream pipeline is controlled with a combination of coatings and cathodic protection.
3. Internal corrosion on the pipeline is controlled with a combination of injection of chemical inhibitors, process control, internal lining, and periodic cleaning.
4. The monitoring and inspection techniques provide a way to measure the effectiveness of the corrosion control systems and provide an early warning when changing condition may be causing problem. Therefore, there is a need to improve corrosion monitoring and cathodic protection monitoring.
5. Intelligent pig survey is conducted at regular intervals to know the condition of the pipeline. The results were used to establish maintenance program and maintain the integrity of the pipeline.

Introduction
In a market scenario dominated by low oil prices, operators are keen to find new architectural solutions for field development that bring about a reduction in the CAPEX and OPEX. In this context, developing new floating facilities and the related subsea network for a production of around 50kbopd is overly expensive. Today, the preferred solution appears to be a subsea tieback to an existing facility. Traditionally, the industry has developed tiebacks within a range of 10 to 30km.
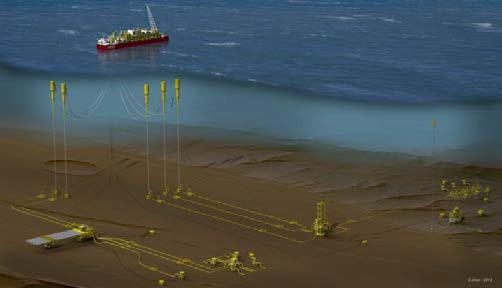
Looking towards the future, the target tieback length could increase to 50km or more (see Fig. 1) but several challenges have to be overcome to make it technically feasible and economically viable, mainly:
• flow assurance linked to hydraulic, thermal and operability requirements, especially in transient conditions (see next section). technologies needed to overcome the flow assurance challenges, especially considering the long distances from the wells to the topside facilities.
• the necessary topside equipment integration and/or modifications.
The long distance between the oil production wells and the treatment facilities generally requires the use of subsea pumps that have to be installed in the correct position based on the fluid characteristics and the well flowing conditions along with the chosen transport line diameter. Moreover, wet insulated or PiP and heated lines become necessary.
By increasing the step-out distance, other elements of the traditional architecture may reach their technical and/or economical limits. For example, conventional chemical distribution and subsea facility control using hydraulic systems will have to be rethought, switching to
the subsea chemical distribution and all electric concept.
Optimizing the development of these types of tiebacks considering all these challenges is not an easy exercise but it is one that offshore O&G industry players are trying to do.
To offer the best response, considering all the aspects involved such as system design, selection and procurement of the main technologies, fabrication and installation challenges etc., SAIPEM launched an in-house project whose aim was to design, develop and optimize the subsea field scheme. This project is based on SAIPEM’s extensive experience in challenging URF EPCI projects and on technologies that SAIPEM has already developed or is developing. Identification of technology requirements and their relative status along with the potential development plan is an essential part of this initiative.
To achieve the project’s aim, several case studies were selected and investigated to define the best development schemes with the aim of identifying and developing technologies to be used as building blocks for long subsea tiebacks and to generalize the results achieved. The goal was to build the main innovative elements of subsea field architecture to propose to Clients in order to fulfill specific project requirements and constraints, and to make the exploitation of new reservoirs profitable, maximizing the use of existing facilities.
Some key or new technologies were identified and included in specific R&D programs aimed at developing proprietary technologies, or at entering into agreements with potential partners (i.e. Siemens for the Control System) in order to gain a commercial advantage in that market segment.
requirements and respect brownfield constraints for specific field requirements. Since some of proposed technologies require high subsea electrical power, the subsea power distribution system will become a main part of the new developments, to be integrated and optimized in conjunction with more conventional systems
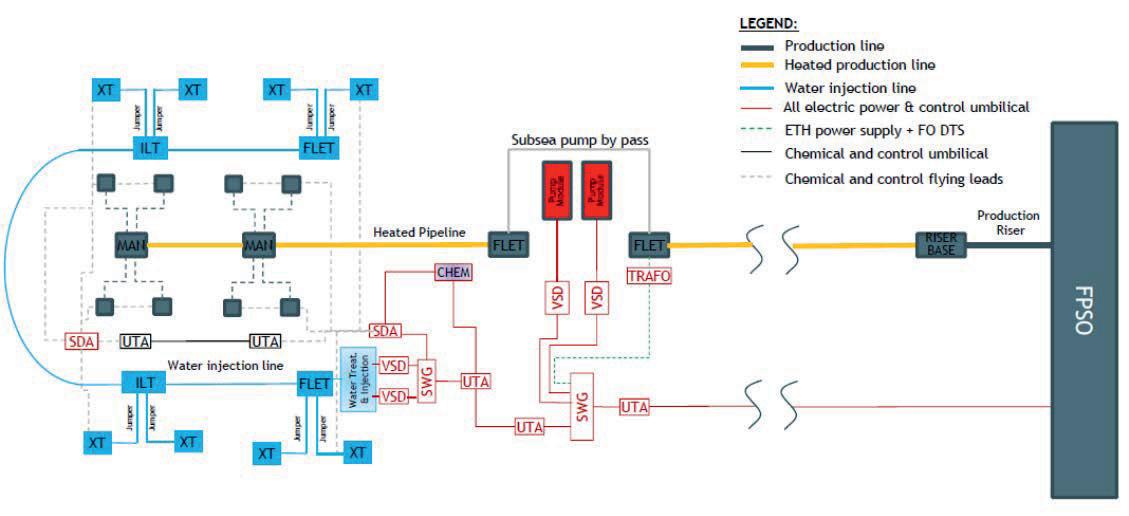
The transportation of live oil over long distances poses several challenges due to a combination of factors:
• the fluid characteristics, such as the intrinsic risk of deposits (asphaltene, scaling, waxes)
The heated flowline is the main building block in these types of developments. Other building blocks need to be identified to propose solutions that are effective in solving the criticalities of tiebacks to existing facilities and that enable the development of reliable and flexible solutions. Table 1 below sums up the main building blocks to take into consideration and that are applicable to long subsea oil tieback development. Considering that the most promising solution is a transport system based on a single heated line, different configurations can be arranged to fulfill production requirements and respect brownfield constraints for specific field requirements. Since some of the proposed technologies require high subsea electrical power, the subsea power distribution system will become a main part of the new developments, to be integrated and optimized in conjunction with more conventional systems.
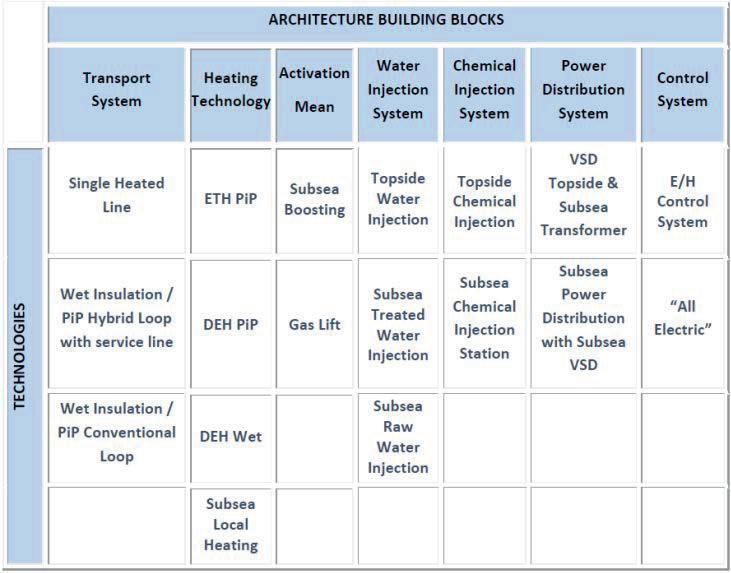
• the available pressure and temperature downstream of the production chokes to produce reservoir fluid up to the topside •the low ambient temperature leading to the risk of hydrate formation
These criticalities, which are also present in short tiebacks, are managed through a combination of the design of the transport facilities, the injection of chemicals (at the correct point of the subsea systems) and the development of appropriate operating procedures, to keep the operating envelope away from dangerous conditions, above all in transient conditions.
The main flow assurance issues are traditionally managed using thermal insulated looped lines (conventional loop with identical production lines or hybrid loop with a dedicated service line) with the aim of delivering production fluid above the wax or hydrate appearance temperature (WAT/HAT). This design minimizes the use of chemicals because of the possibility of displacing live fluid in the case of shut-down and the possibility of pre-heating the flowlines before the field restarts.
For pressure management in the transport system, the tools typically used in the scenarios considered are gas lift, either in the subsea wells or at the riser base and the use of production
subsea pumps. Considering that the preservation of additional long tiebacks to existing facilities will be postponed until after the original production loops and that the distance from-to the floater increases, this design and operating philosophy are difficult to apply due to:
• CAPEX of double line time constraints to put the displacement and heating in place
• large volume of displacement fluid to be hosted onboard the FPSO
For the above reasons, new concepts have been introduced in the development of these fields, specifically, the single heated line. The following operating scenarios can be managed with a heated line:
• keeping the production flowline transport system warm: the heating system is maintained at minimum power to keep the fluid above HAT in the case of short shut-down
Figure 2 below shows an example of a subsea architecture solution for a tieback of around kbpd and 50 - 60 km with very limited space on the host facilities
• •re-heating operation: in the case of a prolonged shut-down, the live fluid cools down to sea bed temperature. When production is ready to be restarted, the heating system is activated to raise the fluid temperature above HAT or WAT
• low turn-down/transient management: the heating system can be kept on to enable production at a reduced rate or to manage specific transient operations
Current technologies to heat a subsea pipeline are:
Figure 2 below shows an example of a subsea architecture solution for a tieback of around 50 kbpd and 50 - 60 km with very limited space on the host facilities.
the life of the field. Figures 3 and 4 below summarize the main architecture and flowline system potentially applicable in long subsea oil tiebacks. The configuration with heated pipeline is the most promising to manage the shut-down and restart phases from the point of view of both cost and flexibility
the life of the field. Figures 3 4 flowline system potentially applicable in long subsea oil tiebacks. The configuration with heated pipeline is the most promising to manage the shut-down and restart phases from the point of view of both cost and flexibility
• Direct Electrical Heating (DEH) with wet or pipe-in-pipe insulation
Electrical Tracing Heating (ETH) with pipe-in-pipe
The DEH technology is well-proven with wet insulation even if improvements are ongoing in order to optimize it for more challenging scenarios. SAIPEM has focused on the development of ETH – PiP because it represents the best combination in terms of thermal performance and optimization of power consumption and, hence, a containment of the OPEX.
As stated above, the key element able to make long subsea tiebacks feasible is the heated pipeline. This technology has several benefits:
• it reduces the number of pipelines from-to the FPSO it reduces the amount of displacement fluids and chemicals that has to be stored onboard the topside facility
• it removes the preservation of long subsea flowlines from the critical path n the case of emergency shut-down
The heated flowline is the main building block in these types of developments. Other building blocks need to be identified to propose solutions that are effective in solving the criticalities of tiebacks to existing facilities and that enable the development of reliable and flexible solutions. Table 1 below sums up the main building blocks to take into consideration and that are applicable to long subsea oil tieback development. Considering that the most promising solution is a transport system based on a single heated line, different configurations can be arranged to fulfill production requirements and respect brownfield constraints for specific field requirements. Since some of the proposed technologies require high subsea electrical power, the subsea power distribution system will become a main part of the new developments, to be integrated and optimized in conjunction with more conventional systems
Figure 2 below shows an example of a subsea architecture solution for a tieback of around 50 kbpd and 50 - 60 km with very limited space on the host facilities.
A single heated production line is envisioned. Together with the subsea pumps, the heating system is supplied via a subsea electrical power chain. Seawater treatment and injection and chemical injection could be located subsea allowing significant savings in the number of slots required to tie in the new field and in the
footprint on the FPSO. This concept, coupled with the all-electric control system, simplifies the main umbilical that could become a power cable. This solution allows a reduction in the investment in power cables, reducing the cross-section diameter and simplifying the power cable packing and installation tasks
The flowline system is the backbone of a subsea production and transportation system. Its sizing must respect the hydraulic and thermal requirements in all the operating phases envisaged during the life of the field. Figures 3 and 4 below summarize the main architecture and flowline systems potentially applicable in long subsea oil tiebacks. The configuration with heated pipeline is the most promising to manage the shut-down and restart phases from the point of view of both cost and flexibility.
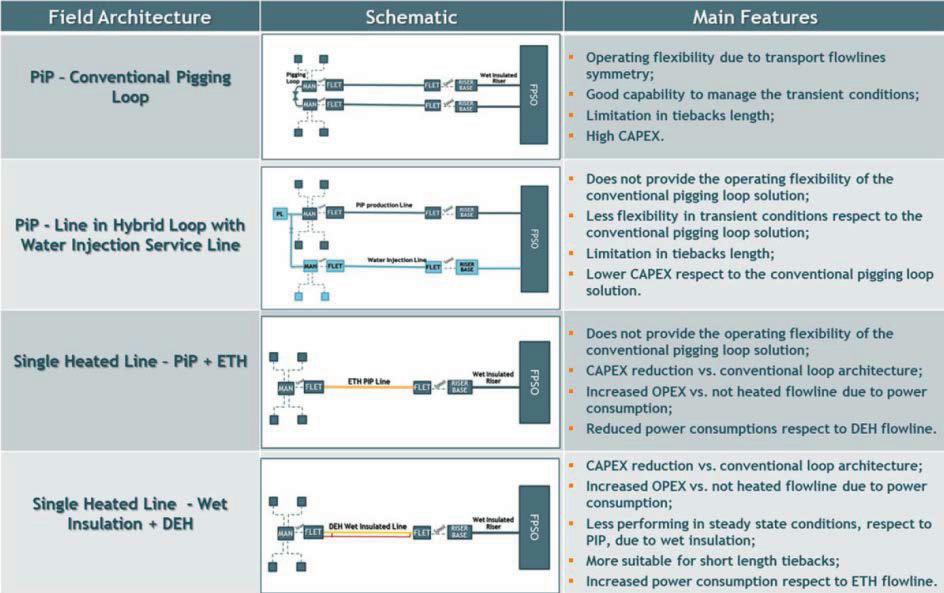
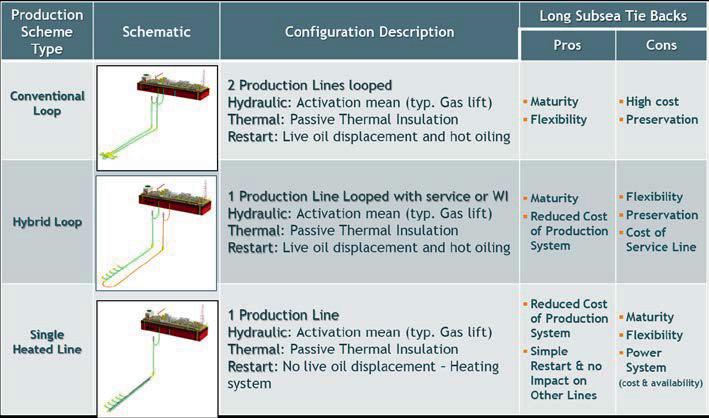
The need to develop a SAIPEM ETH PiP emerged during the numerous field architecture studies, showing the advantages of this highly efficient heating solution in long subsea tiebacks and the need for an ETH PiP suitable for very to ultra-deepwater.
The SAIPEM Electrically Trace-Heated PipeIn-Pipe (ETH PIP) is the heated version of the field-proven SAIPEM sliding PIP that has been installed in subsea fields for distances of more than 100 km.
Historically, for deep waters, SAIPEM developed a non-heated sliding PiP system adapted to J-lay for installation using the FDS or the FDS 2 installation vessels starting from quadjoints fabricated at an onshore yard.
The main principle of the ETH PIP is to couple the performant dry insulation of a pipe-inpipe with an active heating system. This system includes several 3-phase electrical cables
on the other, the J-lay installation method can unlock water depths, pipe size or geographical zones that are inaccessible at present with reeling. Moreover, the J-Lay can be more cost effective for very long distances where the reeling operation has to be split into many sections due to the limit set by the allowable packing and/or weight of the lay vessel.
wrapped around the inner pipe. An electrical current is injected into these cables which, due to the resistive effect, generate heat. In turn, this heat is transferred by conduction to the steel inner pipe and the production fluid. In order to guarantee efficient control of the heating system in operating conditions, one or more fiber optic cables are also laid inside the annulus, thus allowing real time monitoring of the temperature and pipeline strain along the pipeline.
In order to ensure the heating of the overall flowline, each quad joint is fitted with these cables and continuity between two adjacent quad joints is obtained using an electrical connection system at each end. These connections are performed offshore on every quad-joint during J-Lay installation.
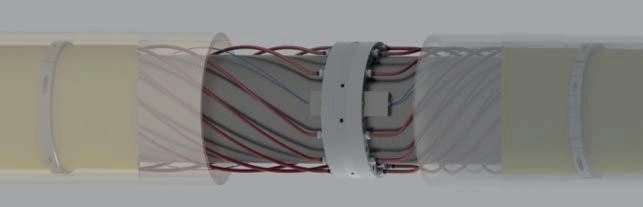
The development and qualification of the technology and the related components began in 2014-2015. In this period, SAIPEM designed a 1st generation ETH PIP system featuring their field-proven sliding PIP concept and hosting heating cables capable of delivering the required power over 12 km with a voltage of less than 3 kV. The 1st generation technology passed a qualification program performed at SAIPEM facilities in France, achieving an overall maturity level of API 17Q TRL 4.
In 2017, SAIPEM launched the development of the 2nd generation ETH PIP able to cover longer tiebacks thanks to a higher voltage (6.6 kV).
The qualification program is ongoing at component level to reach a maturity level of API 17Q TRL 4 for each new component. A full scale qualification test on the integrated system will then allow for the achievement of an overall maturity level of API 17Q TRL 5 by the end of 2019.
The 2nd generation ETH PIP is being developed for both J-lay and reel-lay installation methods to enable SAIPEM to propose the most suitable and cost effective solution for every project. Indeed, on one hand, the reel-lay installation method is well-known for ETH PIP in the Oil & Gas industry; on the other, the J-lay
installation method can unlock water depths, pipe size or geographical zones that are inaccessible at present with reeling. Moreover, the J-Lay can be more cost effective for very long distances where the reeling operation has to be split into many sections due to the limit set by the allowable packing and/or weight of the lay vessel.
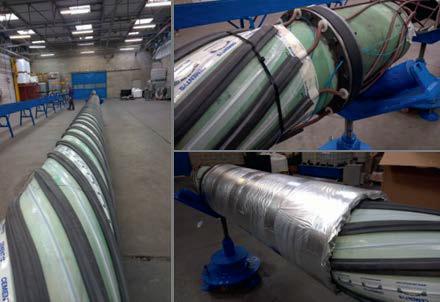
The use of a subsea boosting station in a long tieback is made necessary by the lack of pressure from the wellhead to overcome the combination of long distance and great water depth.
As a secondary effect, the presence of a subsea boosting station helps reduce the Gas Volume Fraction (GVF) of the fluid and limits the velocity based on the erosion criteria. Moreover, the pump usually increases the temperature of the fluid by a few degrees and this also has a positive effect on the system.
Subsea boosting is often required from early
life. Boosting is usually also required at mid/ end life to tackle the increase in water content. In the case of very deep fields, in addition to the subsea pumping system, gas lift could also be necessary to facilitate the management of the transient phase such as field restart or flow rate turndown, especially in late life.
Depending on the nature of the produced fluid, above all the GVF, a different configuration of the boosting pumps may be required: Hybrid (GVF<30%) or Multiphase (GVF>30%).
The sparing philosophy for the subsea pump usually ranges from 2x70% or 80% up to full redundancy.
In terms of architecture, the boosting station has been designed in such a way as to have a foundation pile supporting a flowbase and two retrievable Subsea Boosting Systems working in parallel, in order to fulfil possible requirements in terms of sparing philosophy.
The subsea boosting module configuration will be inspired by the following general design: Pump control is achieved using Variable Speed Drives (VSD) installed subsea in order to minimize the distance between the Pump Motor and the VSD itself, as described in more detail abve. The location of the pumping station in the field layout is based on:
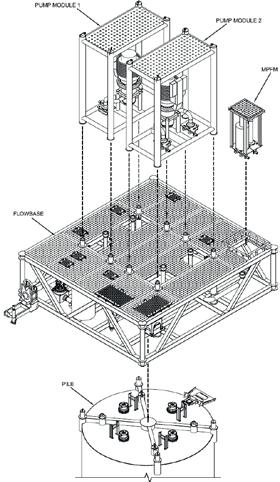
the characteristics of the produced fluid the location of the wells and gathering structure
• the need to minimize the GVF at suction to improve efficiency
• the attempt to minimize the cost of the electrical feeding system, if possible
The pumping station is normally the main consumer of subsea power so it is the driving factor in the design of subsea power distribution.
The main building blocks in a long subsea tie-
back development (subsea boosting, active heating, subsea water injection, subsea chemical injection) are usually characterized by a significant power demand and so they pose a real challenge in terms of the electrical power distribution from the topside facilities down to the subsea field. Typical long step-out developments include two boosting pumps (working in parallel usually with an operational philosophy of 2x70%), one or more sections of heated pipelines and other technologies that are coming onto the stage such as subsea water treatment/injection and subsea chemical injection.
The high power demand of this technology requires a distribution system for medium voltage (MV) electrical power from the topside facilities (FPSO or platform) down to the subsea equipment. This, together with the long distances, poses new challenges compared to traditional field development.
In a field development where the power chain equipment is located topside, each utility would require a dedicated electrical feeder, namely:
architecture could require a long FPSO shutdown.
• Normal operation: pumps running at their maximum, while the heating system is switched off
Detailed electrical simulations and analyses have been carried out using the Electrical Analyzer Program (ETAP®) Power Station software version 12.5.0.
Turndown phase: pump running at reduced rate, while part of the heating system is switched on
After the preliminary sizing of the power chain, a market study was performed to actual status of the technology of the subsea electrical component and to understand each system component.
• for active heating, an off-load tap changer step-up or step-down transformer, type of transformer depending on the point of connection to the PiP (at the riser base or far away from it), power cables, subsea step-down transformer (far from the riser base)
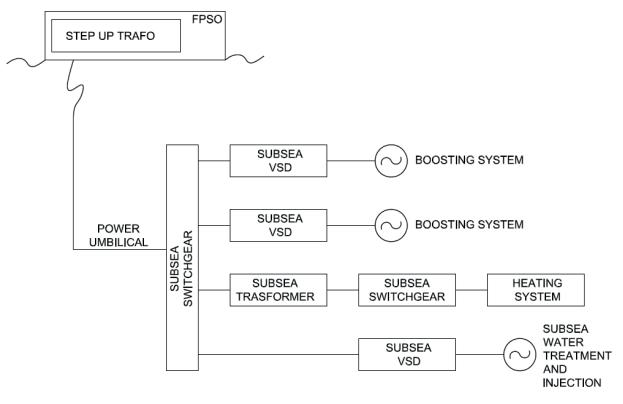
• for each pump, a dedicated VSD, step-up transformer, power cables and step-down transformer
It is clear that, due to the high number of subsea utilities and the long distance, such a solution is likely to be extremely expensive and/ or not feasible. In addition to this, there are limits to the maximum distance between a Variable Speed Drive VSD and the controlled motor. At present, the longest installed chain for a subsea motor exceeds 40 km in the Asgard field. SAIPEM carried out simulation analyses, together with the vendors of the subsea power chain equipment, that ascertained the controllability of the motor up to 70 km.
Another aspect to consider is the significant impact that a topside based power architecture would have on an FPSO. In a brownfield development, an FPSO may not have such a large footprint available for all of the topside power system and may not have the required number of free positions available at the hang-off balcony or turret, therefore the traditional topside power architecture may not be feasible at all. Furthermore, the topside power distribution
Bearing in mind the above considerations, SAIPEM’s studies have focused on the use of subsea power distribution components that have been qualified in recent years by the two main suppliers (ABB and Siemens) and will be ready for the market in the near future. These components are the subsea Switchgear, subsea Variable Speed Drive (VSD) and subsea High Voltage Wet Mate Connectors.
• Start up: pump running at reduced rate, with part of the heating system switched on
Vendor feedback showed that all of the main components of the subsea electrical least TRL 4.
These forthcoming technologies will drastically reduce the amount of power equipment installed topside as well as the subsea power cables between the FPSO and the subsea utilities with an ensuing reduction in equipment and installation related costs.
Other constraints that affect the architecture of the power distribution system for long tieback field development are:
• retrievability of subsea components - systems must be as modular as possible and connected by wet mateable connectors. The use of wet mateable connectors reduces intervention costs and duration and allow the use of intervention vessels with lower rated equipment since only the faulty module has to be retrieved system branches will be individually isolable to avoid the propagation of faults
A key factor in the design of the electrical chain is the expected contemporaneity of the loads.
In the cases studied, the following operating philosophy was considered for the system, based on flow assurance analysis and considerations on the operational philosophy of the fields:
9
• Preservation: pump off, heating system switched on
In all the above cases, the normal operating case dictates the sizing of the electrical chain. The typical values of the electrical power demand identified during the study are summarized below:
• Max shaft power of the subsea pumps is around 3 MW for each pump
• The heating system duty depends on specific flow assurance requirements. It may range between 0.5 MW and 1.5 MW for 50 km step out distance
Given the above, the subsea power supply for the ETH system has no impact on the subsea power cable, as this is normally driven by the energy demand of the boosting station.
By adopting a subsea electrical power distribution with a subsea switchgear it is possible to install just one subsea power cable, providing power at high voltage for all subsea utilities.
In all cases studied by SAIPEM, the typical power demand of a 50-60 km step-out can be met with a transmission voltage that does not exceed 30 kV and with conductor cores in the range of 150 to 300 mm2. Since the VSD for the subsea motors can accept an input voltage of to 30 kV, no subsea step-down transformer is required for the pumps, so they can be connected directly to the subsea switchgear.
Subsea step-down transformers are needed for the ETH system, in order to adapt the transmission voltage to the exact voltage required by each function of the ETH system itself. Fig. 8 below shows the typical subsea architecture described above.
Detailed electrical simulations and analyses have been carried out using the Electrical Transient Analyzer Program (ETAP®) Power Station software version 12.5.0.
injection system and for subsea separation. SAIPEM-Siemens all-electric control system is currently under qualification and is due to achieve TRL 4 certification by the 2nd quarter of 2019. The results and experience gained during the design and industrialization of SPRINGS have been transferred to long subsea tie-back field development.
• Subsea Power and Communication Distribution Modules (PCDM) that receive the electrical power and distribute it to the subsea local control facilities (x-mas trees and manifold control modules) and receive the fiber optic signals, convert them to electrical signal and communicate with the subsea facilities local control equipment
power typically ranging from 40-70W for a SEM in idle mode, up to 300W for a SEM equipped tree, when in operation.
After the preliminary sizing of the power chain, a market study was performed to benchmark the actual status of the technology of the subsea electrical component and to understand the TRL of each system component.
Vendor feedback showed that all of the main components of the subsea electrical chain are at least TRL 4.
The overall architecture is the same as a traditional E/H control system with the hydraulic actuators replaced by electric ones, with: Topside located control equipment: MCS, EPU and modem unit connected via the ethernet network and an open protocol such as MDIS with the host DCS
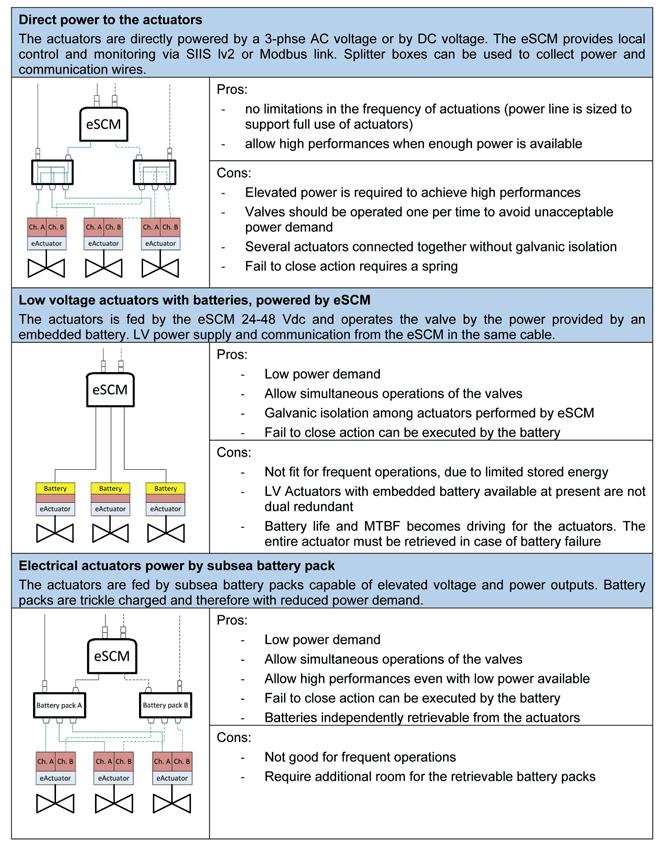
• Distribution of the chemical services by the main umbilical from the topside facilities down to one or more hydraulic distribution units located in the field, from which the chemicals are distributed to the manifold and x-mas trees by means of flying leads or infield umbilicals
For all-electrical actuators, the power is inversely dependent on the required operating SAIPEM calculated that, to achieve performances comparable to hydraulic actuators, a type all-electrical actuator for a 5-1/8” gate valve would require at actuator terminals between 3kW and 12kW for operating times of between 120” and 30”. In addition to this must be considered that the brushless motor electronic boards have constant power absorption typically of between 5W and 15W. This means that an XT with 15 valves would have a minimum power demand up to 225W.
• Subsea power cables and fiber optic cables to provide to the subsea control equipment the necessary dual redundant electrical power and communication
The first result of introducing an all-electric system is the elimination of the low and high pressure supply lines.
Bearing in mind the above, the power supply architecture becomes of paramount importance. SAIPEM identified the following philosophies, each having its pros and cons:
The hydraulic and chemical lines are among the most burdensome components of the subsea control system distribution CAPEX, accounting for up to 80% of the cost of a subsea control umbilical.
For this reason, a key optimization to reduce subsea control system procurement and installation costs is the elimination of the hydraulic and chemical lines from the umbilicals and this can be achieved by adopting all-electric control systems, where the valves are no longer actuated by hydraulic power but by electrical motors.
In recent years various players have developed or are developing all-electric systems and a few of them have been already installed and are being operated by Oil Companies, creating reassurance that the technology has gained sufficient maturity for a wider use in the present or near future.
The potential benefits that they can provide in the context of a long tie-back have been evaluated by SAIPEM including the all-electric control systems in the studied innovative schemes. Several projects have been carried out together with subsea equipment manufacturers (e.g. Siemens) to design and optimize control system architectures, perform verification analyses of the chosen design and identify technology gaps and future areas of development. In this respect, SAIPEM has been active for several years, conducting a development program in cooperation with Siemens for the subsea all-electric control system for the SAIPEM SPRINGS® water treatment and


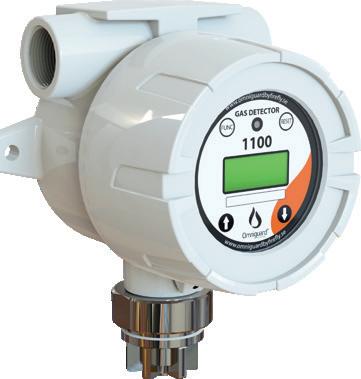
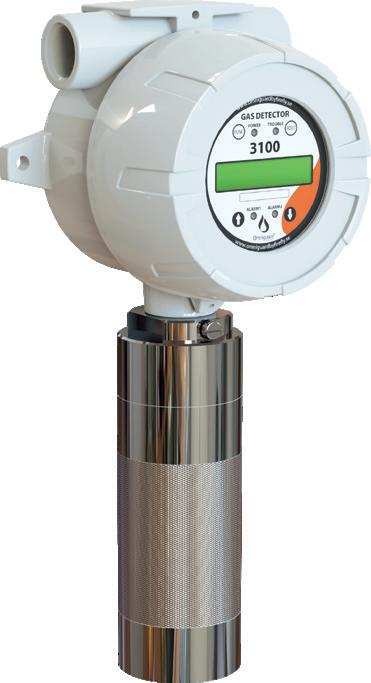

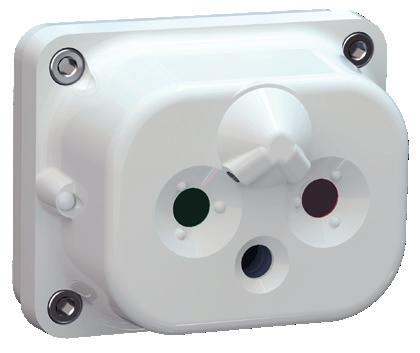
By adopting an all-electric control up to the x-mas trees it is possible to eliminate the low and high pressure control lines (typically 2 + 2) from the main umbilical, the hydraulic subsea distribution module, flying leads and infield umbilicals. SAIPEM calculated that on a typical steel tube umbilical for an oil field, the elimination of the control lines would save between 10% and 15% on the cost of the main umbilical and between 15% and 20% on the infield umbilicals.
A further significant optimization can be obtained by introducing subsea chemical storage and injection facilities that enable a further reduction of the umbilical tubing, see the following section. The most relevant factor in system sizing is the power demand of the subsea control system equipment, which is significantly influenced by the required performance of the electrical actuators and by the architecture selected for their power feeding.
In a traditional E/H control system, the power demand of a x-mas tree or a manifold can be determined knowing the current drawn by each equipment in, or connected to, the SEMs, with power typically ranging from 40-70W for a SEM in idle mode, up to 300W for a SEM of a fully equipped tree, when in operation.
For all-electrical actuators, the power is inversely dependent on the required operating times. SAIPEM calculated that, to achieve performances comparable to hydraulic actuators, a drop-in type all-electrical actuator for a 5-1/8” gate valve would require at actuator terminals a power between 3kW and 12kW for operating times of between 120” and 30”. In addition to this power, it must be considered that the brushless motor electronic boards have constant power absorption typically of between 5W and 15W. This means that an XT with 15 valves would have a constant minimum power demand up to 225W.
Bearing in mind the above, the power supply architecture becomes of paramount importance. SAIPEM identified the following philosophies, each having its pros and cons:
From the studies carried out it emerged that no “fit-for-all” design can be identified among the alternatives indicated above.
The direct power architecture best suits applications requiring high power combined with frequent operations of the valves. Typically, this is the situation of subsea factory applications.
Valves at ILTs and PLETs are infrequently operated and do not normally have strict performance requirements so SAIPEM proposes LV actuators with embedded batteries for this type of application, with the actuators tied back to the closest eSCM. The capability of accepting 24-48 Vdc makes this solution feasible also as a retrofit solution, in the presence of E/H X-mas trees. Direct power can be considered as well if dual redundancy is required and as long as the available power is sufficient for acceptable operating times.
The all-electric x-mas trees represent a factor of uncertainty as today there is no consolidated design. Albeit all of the above alternatives can be adopted for x-mas trees and manifolds, direct power seems to have several disadvantages.
In a cluster populated by a manifold, 4-6 production wells and other water injection wells, direct power feed would require very large and powerful electrical distribution units to switch and isolate the utilities and large conductor diameters in the umbilicals to avoid excessive voltage drops. On the contrary, all-electric x-mas trees with subsea batteries (either embedded in the actuators or centralized), would have a power demand that is similar to traditional E/H systems, greatly simplifying
the power management of the subsea control system. Over long step-out distances, efficient transmission of electrical power to the control equipment is necessary to limit the cost of electric cables. The situation is aggravated by the all-electric control system, whose power demand is inherently higher than a traditional E/H one.
Several electrical distribution methods were investigated. For these high power demands, it is necessary to increase the transmission voltage (typically to 3kV) and to consider quite large conductors, such as 35-50mm2, to avoid unacceptable voltage drops. The AC voltage was preferred, as the conversion is generally simpler. In addition to the above, the use of AC voltage is a good match with the medium voltage already present in the field to provide power to the boosting station and the heated pipelines. SAIPEM believes that the most straightforward way for control system power supply for long tie-backs is to obtain the low voltage from the MV power where possible. This will provide very high power and at the same time eliminate the need for large low voltage conductors for the control power through the entire length of the main umbilical.
The communication distribution architecture for a long subsea tie-back development, either with E/H or all-electric control system, can be considered consolidated, consisting of fiber optic communication for the long-step distance between the topside or shore facilities up to a communication distribution unit (typically integrated in the PCDM) in the field. From the communication distribution unit, the communication signals are converted to electrical signal and transmitted to the manifold and to the x-mas trees.
Even although this is an established architecture, the presence of the fiber optic link, necessary due to the long distance, enables several important features and future improvements.
With an ethernet infrastructure reaching any point in the field, it would be possible to run several protocols such as a deterministic industrial ethernet for fast control loops (<10ms), condition monitoring protocols or power system management protocols based on IEC 61850.
A further interesting development is the possibility of implementing a safe protocol to be used with SIL compliant devices. This would consist of a safety overlay working over the standard ethernet equipment via a technique known as “back channel” and that would allow for the construction of a safety chain up to the x-mas tree.
A possible interesting future development is the possibility of having all the sensors and electrical actuators in the manifolds, x-mas trees or PLETs, directly implementing an Ethernet protocol.
Subsea components would connect directly to the ethernet network by means of a subsea ethernet switch, like those normally present in the communication distribution units, and be directly controlled and monitored from topside, without necessarily being connected to a SCM.
The traditional approach adopted to supply chemicals to a subsea tieback is to position the chemical injection pumps on the topside platform/FPSO and the associated chemical lines in a high pressure umbilical down to the subsea injection points.
In the development of a long tieback, because of the very long distance from the receiving facilities, the cost and complexity of the traditional umbilical grows and pressure drops and control of chemical delivery pressures and flowrates through such a long umbilical can be extremely challenging. The consequence is high diameters and big unit weights umbilical that can create packing and installation challenges. These factors have led to the need to review this architecture to make the development of a long tieback sustainable from the point of view of both cost and technology.
To overcome these major criticalities, the idea is to move the chemical injection system subsea, possibly close to the injection points.
The advantages of this solution are:
Simplification of the umbilical due to the elimination of the steel tubes for the (if coupled with “all electric control” allows the elimination of all steel tubes) transport of chemicals
• Simplification of the installation procedures
Reduction of topside space requirements by placing the chemical injection package (storage tanks, pumps, regulation systems, etc.) subsea.
Over recent years, SAIPEM has mapped the typical chemical demand for a representative size of oil fields, with the main aim of defining a subsea chemical injection system architecture and the related main components.
The main result of this exercise is the definition of a concentrated architecture for subsea chemical storage and injection facilities to be located close to the wells. The overall system can comprise modules individually dedicated to one specific chemical that include the pump system, the tank and the relevant control and power system.
As far as we are aware, there is still no real case of permanently installed subsea chemical storage and injection systems but there are many players that are working on different technologies to make this feasible. SAIPEM also is active in this field to identify and qualify the needed technologies.
Water injection (either Raw Sea water or Treated Sea Water) can be managed by the Total/ SAIPEM/Veolia SPRINGS® unit powered through the subsea electrical distribution system.
This solution avoids the installation of the entire water injection loop and the related modification to the topside facilities. The SPRINGS station can be located at the wellhead area to minimize the cost of water injection line.
The studies and analyses performed on both study cases and real fields, whose main results are summarized in this paper lead to the following main conclusions:
• New field development architectures for challenging subsea fields like oil long subsea tiebacks can be achieved by combining different building blocks, each expressing a suitable technology for a specific function (Product Transportation, Control, Power, etc.), in the optimum architecture that minimizes costs;’
The best selection and combination of technologies, along with the overall architecture is strictly linked to the flow assur-
ance peculiarities of the field itself and its topology;
Technology has advanced greatly in terms of technical readiness in recent years. In particular, Pipeline Heating Systems, Subsea Power Distribution Systems and All-Electric Control Systems are now field-proven or at least ready to be integrated in a complex system;
• The above technologies, combined with Subsea Water Treatment and Injection, like SPRINGS®, and Subsea Chemical Storage and Injection, can significantly improve the development scheme enabling feasible and cost effective development of subsea fields far from the product receiving/treatment unit;
• From an economic point of view, it has been noted that, in the case of a long step-out distance, economic benefits in terms of CAPEX and OPEX can be obtained by adopting a combination of these technologies. It has also been noted that the flexibility offered by new development schemes based on the new technologies described here can significantly improve plant operations in transient conditions, at startup and at shut-down and can consequently reduce the OPEX.
• AIPEM is active in the development of new technologies for challenging subsea field developments, in particular long subsea tieback distances and is also a knowledge owner and integrator of new technologies developed by others.
DCS: Distributed Control System
DEH: Direct Electrical Heating
EPU: Electrical Power Unit
ETH: Electrical Trace Heating
GVF: Gas Volume Fraction
HAT: Hydrate Appearance Temperature
MCS: Master Control Station
PCDM: Power & Control Distribution Module
PiP: Pipe in Pipe
SCM: Subsea Control Module
SEM: Subsea Electrical Module
TRL: Total Readiness Level
URF: Umbilical Risers Flowlines
VSD: Variable Speed Driver
WAT: Wax Appearance Temperature
Introduction
Norwegian Statistics has published a report detailing CO2 emissions from the Norwegian oil and gas industry /4/. The report is based on historical data on production levels, emission data, physical data, and commercial data from 41 fields on the Norwegian Continental Shelf from 1997 to 2013. One of the findings was that gas production is less emission intensive compared with oil production. Further, oil production is increasingly emission intensive as the reservoir pressure declines and water cut increases as the field matures. This implies that the heavier the fluid is, the more energy demanding it is to produce. Artificial lift is often applied to enable production at an economically attractive level. For an offshore asset, this typically implies use of gas lift, electric submersible pumps (ESPs), seabed pumps, or a combination of gas lift and seabed pumps
The United Nations has adopted a set of sustainable development goals (SDGs) for attainment by 2030. Agencies such as IPIECA have outlined how oil and gas industry contributes to SDGs /2/, one of the big contributions is in energy efficiency, which is related to power consumption as well as gas flaring. The IEA estimated that 46% percent of CO2 emission savings would come from end-use efficiency compared with 17% from renewable energy /3/.
model is built to represent a typical production system. This generic model will not be specific to any fields or reservoirs but will hold enough information to evaluate the relative differences between the different cases. Sensitivities have been performed on tieback distances, number of wells, water cut, and water depth to obtain a comprehensive overview for the comparison.
In this study, carbon emissions for a field requiring artificial lift is evaluated based on either gas lift or subsea pump system. The results are compared, and correlations are highlighted. To evaluate this, a purpose-made simulation model is built to represent a typical production system. This generic model will not be specific to any fields or reservoirs but will hold enough information to evaluate the relative differences between the different cases. Sensitivities have been performed on tieback distances, number of wells, water cut, and water depth to obtain a comprehensive overview for the comparison.
In recent years, CO2 emission in the oil and gas industry has gained more attention on a global basis because of climate change. The industry focus is shifting toward more environmentally friendly alternatives to reduce the overall CO2 impact. This change is also driven by new legislation that regulates CO2 emissions, both nationally and internationally.
oil and gas industry /4/. The report is based on historical data on production levels, emission data, physical data, and commercial data from 41 fields on the Norwegian Continental Shelf from 1997 to 2013. One of the findings was that gas production is less emission intensive compared with oil production. Further, oil production is increasingly emission intensive as the reservoir pressure declines and water cut increases as the field matures. This implies that the heavier the fluid is, the more energy demanding it is to produce. Artificial lift is often applied to enable production at an economically attractive level. For an offshore asset, this typically implies use of gas lift, electric submersible pumps (ESPs), seabed pumps, or a combination of gas lift and seabed pumps.
Gas lift is the most commonly used artificial lift technology for offshore wells and is often the base case for most reservoir engineers early in a field’s development. A simplified schematic of a production system with downhole gas lift is shown in Fig. 1. Gas lift may be injected into the well stream either downhole or at a riser-base location. The former is considered in this report.
Gas lift is the most commonly used artificial lift technology for offshore wells and is often the base case for most reservoir engineers early in a field’s development. A simplified schematic of a production system with downhole gas lift is shown in Fig. 1. Gas lift may be injected into the well stream either downhole or at a riser-base location. The former is considered in this report.
Norwegian Statistics has published a report detailing CO2 emissions from the Norwegian
In this study, carbon emissions for a field requiring artificial lift is evaluated based on either gas lift or subsea pump system. The results are compared, and correlations are highlighted. To evaluate this, a purpose-made simulation
topside separator. The compressed gas at the pump discharge also reduces the friction losses in the flowline. Generally, more power transferred to the fluids through the pump will lead to a higher production. As the inlet pressure approaches very low pressures, the expansion effect becomes significant, thus reducing the benefits of reducing the pump inlet pressure further
Multiphase Boosting System
umbilical. The main loss of energy for this system will be in the electrical system.

The main purpose of gas lift is to lighten the weight of the hydrostatic column between the reservoir and topside facility. Produced gas is recompressed topside and fed down a gas lift riser and through a gas lift flowline and into the subsurface infrastructure. The gas is mixed with the well fluids in the well, resulting in lower fluid density, lower backpressure for the wells, and higher production rates. Because the gas will continue expanding as the pressure decreases toward topside, there is an optimal gas lift rate where any further increase in gas lift rate will lead to a choking effect in the flowline. Hence, the amount of gas lift needs to be balanced between the added production due to reduced hydrostatic height and the added frictional losses from the added gas volumes.
Topside gas compression is the main energy consumer and contributor to CO2 emissions related to gas lift.
A simplified schematic for a production system with subsea multiphase boosting system is illustrated in Fig. 2. The pump is normally installed in by-pass to the flowline downstream of the wellhead trees and manifolds, enabling boosting of multiple wells through a single pump system. The lifting energy is added directly into the produced fluids by reducing the wellhead pressure and boosting it to the topside separator. The compressed gas at the pump discharge also reduces the friction losses in the flowline. Generally, more power transferred to the fluids through the pump will lead to a higher production. As the inlet pressure approaches very low pressures, the expansion effect becomes significant, thus reducing the benefits of reducing the pump inlet pressure further.
The power to the pump is supplied from a topside drive system and down through a power umbilical. The main loss of energy for this system will be in the electrical system.
The energy efficiency study is developed to enable comparing energy consumption and CO2 emission at a high level A generic field model is used to analyze the energy consumption using different improved oil recovery (IOR) technologies in gas lift and multiphase boosting. A hydraulic simulator is used as the engine to calculate pressure drops and system deliverability. A simple general subsea system is established (Fig. 3), and the following parameters are assumed for the reservoir, well, and flowline conditions.
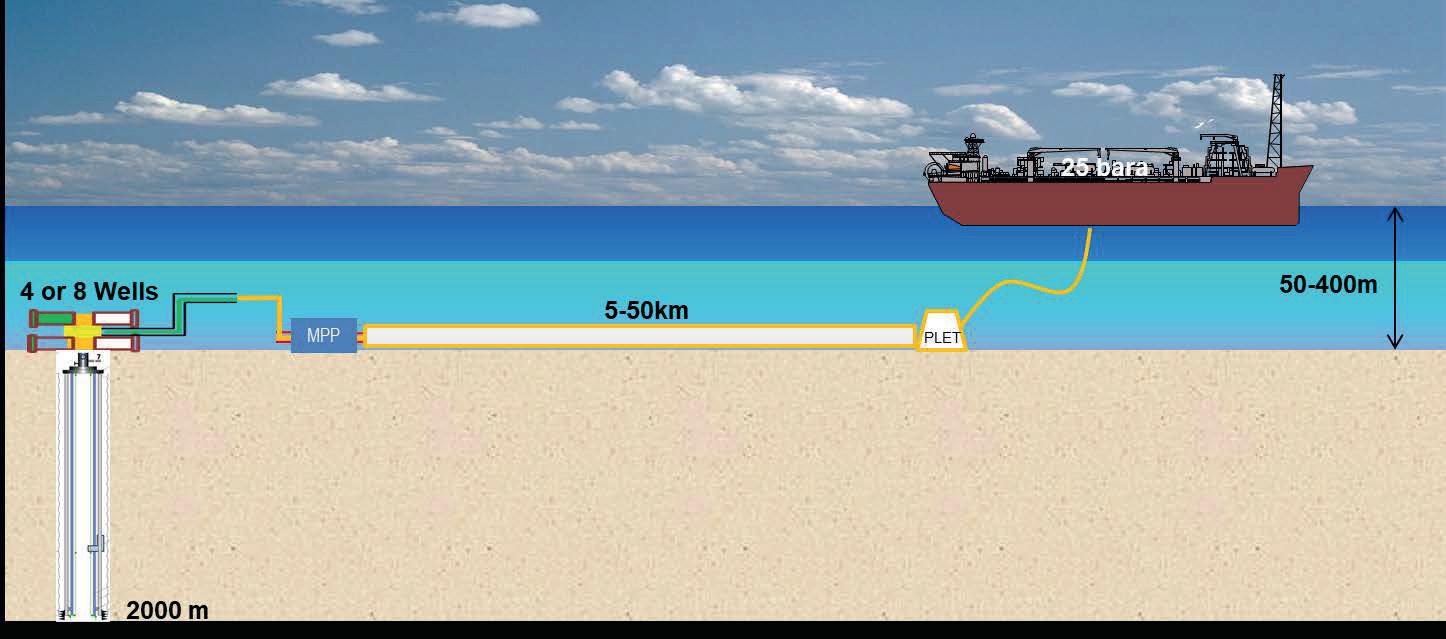
The energy efficiency study is developed to enable comparing energy consumption and CO2 emission at a high level. A generic field model is used to analyze the energy consumption using different improved oil recovery (IOR) technologies in gas lift and multiphase boosting. A hydraulic simulator is used as the engine to calculate pressure drops and system deliverability. A simple general subsea system is established (Fig. 3), and the following parameters are assumed for the reservoir, well, and flowline conditions.
The power to the pump is supplied from a topside drive system and down through a power
Because the oil production system can vary significantly from field to field, the generic model looked at key system parameters in the typical oil and gas system to reflect the trends

power consumption comparison with gas lift and MPP
However, for optimal production using gas lift, the MPP can achieve the same production with much energy consumption. It means that more energy-efficient production is possible, if only to achieve the same production target. The MPP could have higher production in comparison because produce a much higher differential pressure in the system. This paper discusses the IOR difference but only in terms of energy efficiency and potential energy savings.
using gas lift, the MPP can achieve the same production with much means that more energy-efficient production is possible, if only to target. The MPP could have higher production in comparison because differential pressure in the system. This paper energy efficiency and potential energy savings.
To evaluate the energy savings potential when comparing MPP and gas lift, an energy saving ratio has been defined as
evaluate the energy savings potential when comparing MPP and g been defined as below.
potential when comparing MPP and gas lift, an energy saving ratio
example of energy savings ratio is demonstrated in the power consumption from 2.6 kW to 0.6 kW and previously mentioned, the potential energy savings can be impacted by the actual configuration, such as the tieback distance, water depth, reservoir depth, or reservoir conditions such as pressure and GOR. To investigate different parameters, simulations were performed wit well system, the energy saving map with respect to tieback distance and water depth can be in Fig. 5
is demonstrated in Fig. 4; for the same flow rates, it is possible from 2.6 kW to 0.6 kW and save 77%.
An example of energy savings ratio is demonstrated in Fig. 4; for the same flow rates, it is possible reduce the power consumption from 2.6 kW to 0.6 kW and save 77%.

potential energy savings can be impacted by the actual the tieback distance, water depth, reservoir depth, or reservoir GOR. To investigate energy savings potential with regards to were performed with the simulation matrix. As an example, for a saving map with respect to tieback distance and water depth can be
As previously mentioned, the potential energy savings can be impacted by the actual production and system configuration, such as the tieback distance, water depth, reservoir depth, or reservoir conditions such as pressure and GOR.
The energy savings potential increases with water depth and tieback distance. Up to 80% energy savings can be achieved
Schlumberger-Private
To investigate energy savings potential with regards to different parameters, simulations were performed with the simulation matrix. As an example, for a four-well system, the energy saving map with respect to tieback distance and water depth can be seen in Fig. 5.
The energy savings map can be changed with other factors, such as water cuts, reservoir conditions, and arrival conditions at the separator. The following sections discuss the impact of other factors.
The energy savings potential increases with water depth and tieback distance. Up to 80% energy savings can be achieved. The energy savings map can be changed with other factors, such as water cuts, reservoir conditions, and arrival conditions at the separator. The following sections discuss the impact of other factors.


During the life of field, one can expect increasing water cut, which may impact the energy efficiency of the lifting strategy. It is widely believed that gas lift is required for the late life of the field when the water cut is high, which points to a lower efficiency for gas lift in low water cuts and higher efficiency for gas lift in water cuts.
The power savings potential is high at low water cut, and it decreases slightly with higher water when the gas lift efficiency increases. At a very high water cut (>60%), the power savings potential increases because the MPP efficiency would also dramatically increase with higher water cuts and lower gas-volume fraction (GVF), but the energy savings stay above 50% for all water cuts.
During the life of field, one can expect increasing water cut, which may impact the energy efficiency of the lifting strategy. It is widely believed that gas lift is required for the late life of the field when the water cut is high, which points to a lower efficiency for gas lift in low water cuts and higher efficiency for gas lift in water cuts.
Another reason that could contribute to this trend is that the higher mixing viscosity with the increasing water cut increases the power consumption from boosting.
The power savings potential is high at low water cut, and it decreases slightly with higher water cut when the gas lift efficiency increases. At a very high water cut (>60%), the power savings potential increases because the MPP efficiency would also dramatically increase with higher water cuts and lower gas-volume fraction (GVF), but the energy savings stay above 50% for all water cuts. Another reason that could contribute to this trend is that the
higher mixing viscosity with the increasing water cut increases the power consumption from boosting.
For a gas lifted system, lowering the separator pressure will give the following effects:
As wellhead pressure drops with time because of falling reservoir pressure, increasing water cut, or both, a common way to maintain or increase production is to reduce the first stage separator pressure topside. This will cause a reduced backpressure for the wells, but there are some energy aspects associated with this to be aware of, depending on the artificial lift method selected.
• The inlet pressure to the gas lift compressor is decreased, but the compressor discharge pressure remains as the lift requirement at the injection point also remains. This leads to an increase in the required compression work.
As wellhead pressure drops with time because of falling reservoir pressure, increasing water cut, or both, a common way to maintain or increase production is to reduce the first stage separator pressure topside. This will cause a reduced backpressure for the wells, but there are some energy aspects associated with this to be aware of, depending on the artificial lift method selected.
• Increased friction losses occur in the production because of the expansion effect from the gas. This effect is bigger when lift gas is added compared with multiphase boosting, where no gas is added.
• The inlet pressure to the gas lift compressor is decreased, but the compressor discharge pressure remains as the lift requirement at the injection point also remains. This leads to an increase in the required compression work.
• Increased friction losses occur in the production because of the expansion effect from the gas. This effect is bigger when lift gas is added compared with multiphase boosting, where no gas is added.
For a multiphase boosting system, lowering the separator pressure will give the following effects:
For a multiphase boosting system, lowering the separator pressure will give the following effects:
For a gas lifted system, lowering the separator pressure will give the following effects:
• The backpressure will be reduced while the pump inlet pressure remains. The required differential pressure for the pump is therefore reduced.
• The backpressure will be reduced while the pump inlet pressure remains. The re-
• Some frictional losses will occur because of the expansion of the gas but are marginal compared with using gas lift (adding gas volumes).
The above effects from lowering the separator pressure will give the following effects on the power requirement:
quired differential pressure for the pump is therefore reduced.
Some frictional losses will occur because of the expansion of the gas but are marginal compared with using gas lift (adding gas volumes).
The above effects from lowering the separator pressure will give the following effects on the power requirement:
• increase in the power requirement for a gas lifted system decrease in the power requirement for a multiphase boosting system.
Therefore, more savings can be realized for the system with lower separator pressures (Fig. 7).
Gas lift compressor discharge pressure also has a significant impact on the energy consumption for gas lift systems. The case assumed the constant discharge pressure of 250 bar absolute pressure, but the discharge pressure could vary depending on the injection point, reservoir pressure, and if the compressor was also used for exporting gas. With an increasing discharge pressure, the energy savings potential for using an MPP increases (Fig. 8).
Therefore, more savings can be realized for the system with lower separator pressures (Fig. 7)
Gas lift compressor discharge pressure also has a significant impact on the energy consumption for gas lift systems. The case assumed the constant discharge pressure of 250 bar absolute pressure, but the discharge pressure could vary depending on the injection point, reservoir pressure, and if the compressor was also used for exporting gas. With an increasing discharge pressure, the energy savings potential for using an MPP increases (Fig. 8)
Gas lift compressor discharge pressure also has a significant impact on the energy consumption for gas lift systems. The case assumed the constant discharge pressure of 250 bar absolute pressure, but the discharge pressure could vary depending on the injection point, reservoir pressure, and if the compressor was also used for exporting gas. With an increasing discharge pressure, the energy savings potential for using an MPP increases (Fig. 8)
In many cases, MPP and gas lift can be combined to maximize lifting efficiency. It is common in some cases that the well does not flow naturally without gas lift or boosting. In a deep well with high water cuts, the gas lift can be required to reduce the hydrostatic head.
In many cases, MPP and gas lift can be combined to maximize lifting efficiency. It is common in some cases that the well does not flow naturally without gas lift or boosting. In a deep well with high water cuts, the gas lift can be required to reduce the hydrostatic head.
In many cases, MPP and gas lift can be combined to maximize lifting efficiency. It is common some cases that the well does not flow naturally without gas lift or boosting. In a deep well water cuts, the gas lift can be required to reduce the hydrostatic head.
In Fig. 9 on the left, the gas lift rate of 100,000 m3/d is used to achieve the bottomhole pressure (BHP) of 120 barg. After the MPP is put into place, a small pressure boosting from the MPP reduces the wellhead pressure (WHP) to 20 barg If looking at lift gas in well as champagne bubbles in a glass, with the lower WHP, With the lower WHP, the champagne bubbles get bigger and more gas comes out of the oil, which reduces the required gas lift rate for the same BHP.
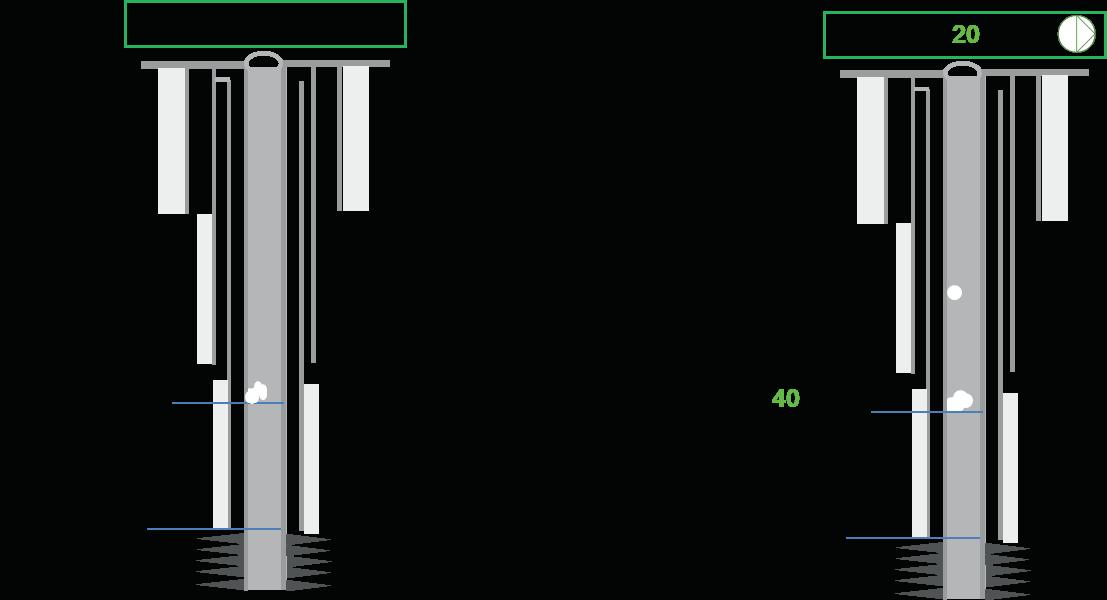
In Fig. 9 on the left, the gas lift rate of 100,000 m3/d is used to achieve the bottomhole (BHP) of 120 barg. After the MPP is put into place, a small pressure boosting from the MPP the wellhead pressure (WHP) to 20 barg If looking at lift gas in well as champagne bubbles glass, with the lower WHP, With the lower WHP, the champagne bubbles get bigger and comes out of the oil, which reduces the required gas lift rate for the same BHP.
In Fig. 9 on the left, the gas lift rate of 100,000 m3/d is used to achieve the bottomhole pressure (BHP) of 120 barg. After the MPP is put into place, a small pressure boosting from the MPP reduces the wellhead pressure (WHP) to 20 barg. If looking at lift gas in well as champagne bubbles in a glass, with the lower WHP, With the lower WHP, the champagne bubbles get bigger and more gas comes out of the oil, which reduces the required gas lift rate for the same BHP.
The gas lift efficiency energy can be high at low gas lift rate with the low gas lift rates, as shown in Fig. 10, when combined with a small boosting, the total lifting efficiency is maximized.
While it should be recognized that multiphase boosting has significant potential to improve energy efficiency, gas lift can be very beneficial in many cases. From an operational point
The gas lift efficiency energy can be high at low gas lift rate with the low gas lift rates, as shown in Fig. 10, when combined with a small boosting, the total lifting efficiency is maximized.
80% of energy to achieve the same IOR effects strategy for all oilfield developments
The authors would like to acknowledge Norwegian Statistics for their input and tools
significant potential to improve energy operational point of view, the present. From a requirement of and the water cut is increasing. This requires supply of electrical power to compressors or pumps. The amount of ortion of the overall power consumption for
a gas lift system could typically require 20MW in compression work. With an uptime of 90% per year, this becomes 158 million kWh per year. What does this relate to in
, the 20MW compression system is 000 cars or the consumption of electricity in
often
efficient lifting strategy in more than
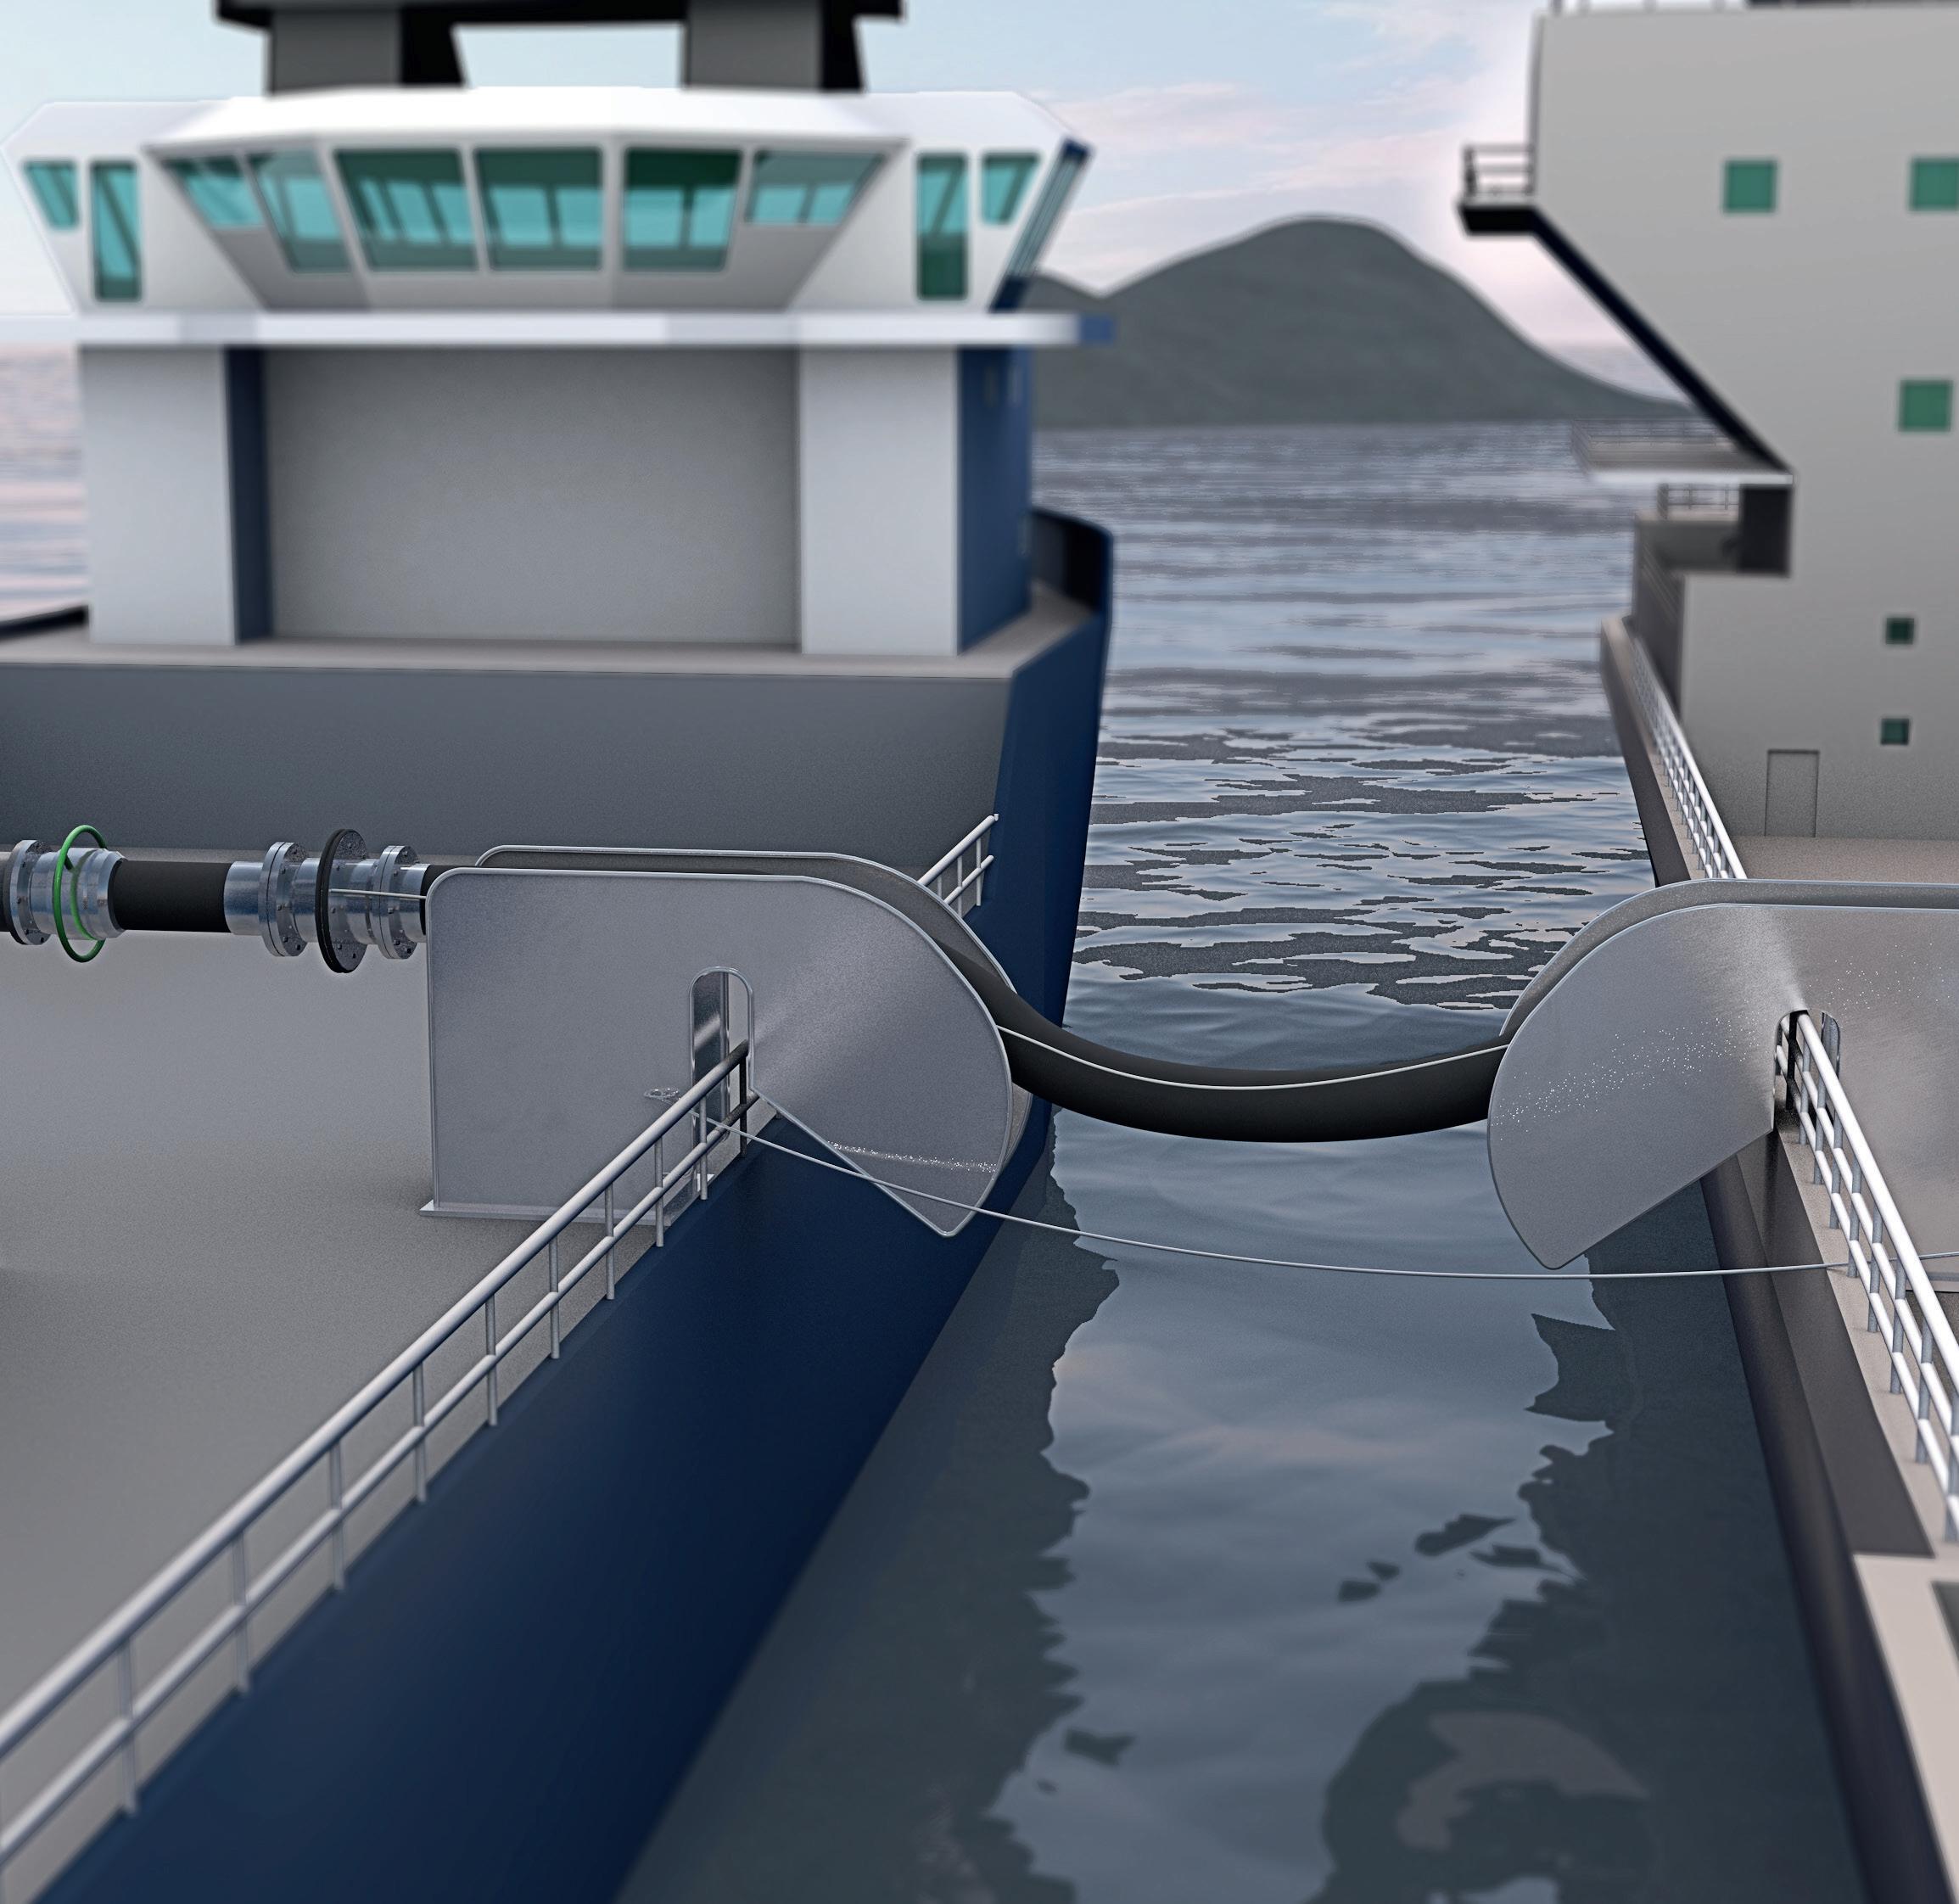
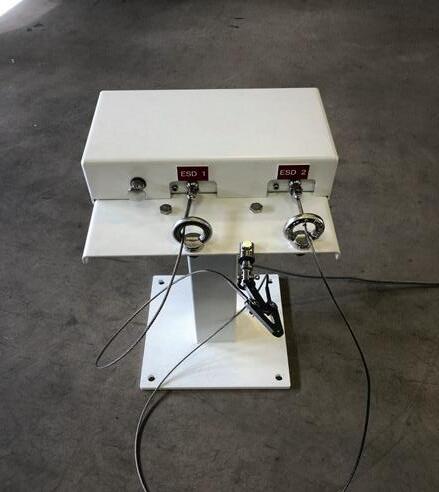
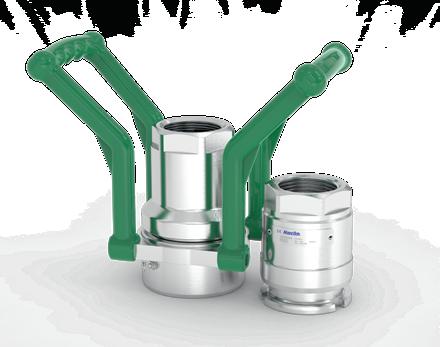
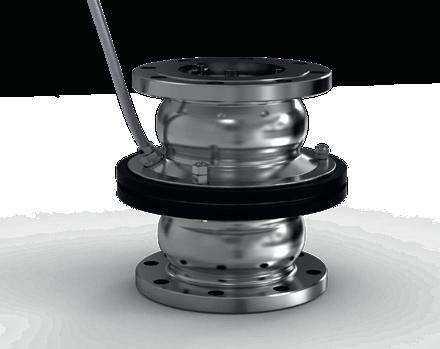
– Cadeler A/S, a key supplier with the offshore wind industry, purchases new Ram Luffing Crane of type RL 2600 in support of growing offshore wind energy projects – The crane has a lifting capacity of 25 tonnes and a boom length of 45 metres, and will support the installation of wind turbines
– The deck crane will be installed in early 2024 on the Wind Osprey vessel, and it is the first deck crane delivered directly to Cadeler by Liebherr.
One of the leading Danish suppliers in the offshore wind industry, Cadeler, is supporting its Wind Osprey vessel with the latest RL 2600. This acquisition is part of the company’s upgrade initiatives through which by early 2024, its O-class vessels will be ready to support the nextgeneration of wind turbines. Cadeler visited Liebherr Rostock in March for a personal kick-off meeting, discussing project-specific developments of the deck crane, and touring the high-tech factory in which the crane is built. This project paves the way for a long and fruitful partnership.
Rostock (Germany), June 2023 – Building on the winds of change. Wind turbines are sizing up, as are demands for even larger cranes with higher specifications. Established in 2008, Cadeler has become one of the leading offshore wind industry companies. They have installed over 500 offshore wind turbines and equally as many foundations and are aiming to become the key supplier in the industry’s ongoing development. Among the essential assets of their work are two highly efficient Windfarm Installation Vessels, the Wind Orca and Wind Osprey. In addition to offshore wind farm installation, these vessels are very well suited for maintenance and decommissioning tasks within offshore wind. The latest-generation Liebherr Ram Luffing Offshore Crane, the RL 2600, is part of the modernisation of Wind Osprey. With its focus on logistical support moving tools and
Liebherr-MCCtec Rostock GmbH is one of the leading European manufacturers of maritime handling solutions. The product range includes ship, mobile harbour and offshore cranes. Reach stackers and components for container cranes are also included in the product portfolio.
The Liebherr Group is a family-run technology company with a highly diversified product portfolio. The company is one of the largest construction equipment manufacturers in the world. It also provides high-quality and user-oriented products and services
Cadeler visited Liebherr Rostock for a kick-off meeting to discuss crane design details, and tour the factory in which the crane is being built (f.l.t.r.: Ilie Toma, Project Manager at Liebherr; Gregor Levold, General Manager Sales - Offshore, Ship and Port Cranes at Liebherr; David Möller, Design Engineer at Liebherr; Matti Basan, Senior Sales Manager General Purpose Offshore Cranes at Liebherr; Marc Findeisen, Head of Customer Service Offshore Cranes at Liebherr; Jacob Grønvald Nielsen, Crane & Heavylift Specialist at Cadeler; Michael Strandgaard Merrild, Technical Superintendent at Cadeler).
smaller attachments, the deck crane is well positioned to support the vessel’s larger main crane. It has also been optimised to feature a small tail radius and the absence of machinery housing, which allows it to operate in confined space conditions and environments. Its 7 m3 cabin is highly ergonomic and ensures low-fatigue work for the operator. The combination of these features, as well as Liebherr’s high reliability and extensive service network, were among the main reasons why Cadeler chose Liebherr for its next-generation upgrades.

“Besides upgrading the lifting capacity of our Windfarm Installation Vessel main cranes to effectively handle larger and heavier wind turbines, we are also upgrading our equipment with innovative features and seeking strategic alliances with companies that will be with us in the long run. Liebherr fulfils our 2/3 criteria for innovation, reliability, and service, and we are looking forward to working with them closely on our flagship projects,” says Jacob Heinricy Jensen, Chief Operations Officer at Cadeler. The Wind Osprey’s main crane will also be upgraded. It will feature a lifting capacity of 1,600 metric tonnes at a radius of 40 metres, and a main hook able to reach 160 metres above the main deck. The Liebherr RL 2600 will replace
in a wide range of other areas. The Liebherr Group includes over 140 companies across all continents. In 2022, it employed more than 50,000 staff and achieved combined revenues of over 12.5 billion euros. Liebherr was founded in Kirchdorf an der Iller in Southern Germany in 1949. Since then, the employees have been pursuing the goal of achieving continuous technological innovation, and bringing industry-leading solutions to its customers.
About Cadeler A/S Cadeler A/S is a key supplier with the offshore wind industry for installation services and operation and maintenance works that provides marine and en-
an older cylinder luffing deck crane, and it is primed to support the installation of larger wind turbines for years to come.
“Our new partnership with Cadeler marks a remarkable opportunity for us to work with a leading provider in the wind energy industry,” says Stefan Schneider, Global Application Manager General Purpose Offshore Cranes. “This is a synergistic foundation for us in which we provide reliable products for Cadeler, while learning from our collaboration to further innovate our technologies to accommodate future industry growth. We look forward to a long and fruitful collaboration.”
The RL series is distinguished by its particularly lightweight and compact design. The cranes are primarily used for maintenance and supply work on both fixed and floating offshore installations, particularly in the wind power industry and the oil and gas sector. Another special feature of the new RL crane series is the innovative cabinet inside the slewing column. The technology behind this innovation is called “EXpressure,” the world’s first explosion-proof Ex d cabinet that safely releases explosion pressure. It has been developed by Liebherr partner R. Stahl AG. The crane can also be ex-certified (through ATEX and IECEx).
gineering operations to the offshore wind industry with a strong focus on safety and the environment. Cadeler’s reputation as provider of high-quality offshore wind support services, combined with an innovative vessel design, positioning the company to deliver premium level services to the industry. As a company, Cadeler continues to pursue new levels of efficiency, pushing beyond the current boundaries of the supply chain. Cadeler enables and facilitates the global energy transition towards a future built on renewable energy. Cadeler is listed on the Oslo Stock Exchange (ticker CADLR).


Lithium-ion batteries are used in a wide variety of applications in the oceans such as for vehicles, to supply sensors, as energy storage systems and to electrify the Oil & Gas production. Kiel-based SubCtech has solutions for a sustainable, reliable and safe energy supply based on Li-Ion batteries.
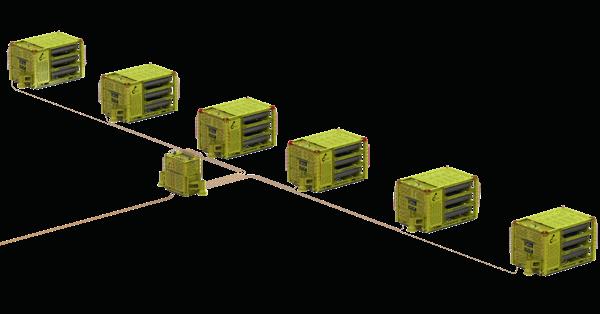
For many years, SubCtech recognised the ever-increasing demands for power and capacity within the subsea sector. It recently responded by introducing a new Li-Ion Battery series particularly aimed at large subsea storage, vehicle propulsion but also for the electrification of Oil & Gas production facilities (see fig. 1) – playing a crucial role within the transition from electrohydraulic to “All-Electric” Systems. The special requirements of the offshore Oil & Gas industry have triggered the development of extremely reliable batteries with a lifetime of up to 25 years. With the UN T38.3, MIL-STD, DNV-GL or API17F standards & qualifications depending the target market, batteries have to withstand rapid temperature changes as well as extensive shock and vibration tests. Such qualifications as well as highest reliability are compulsory for operations in the deep sea and shallow waters, as service or failure would cost millions.
SubCtech is present in many communities especially for Li-Ion technologies and underwater applications. Regular meetings and cooperation with leading institutes, manufacturers, users and standardization bodies guarantee the latest information for reliability, security and performance. At present, SubCtech is supporting the future revision 5 of the API17F on the subject of fully electric production facilities “All-Electric Systems” containing batteries. With this standardization and consideration and integration of functional safety according IEC 61508, the safety of future electrical underwater systems is significantly increased. The energy of the batteries is easily scalable by stacking SmartPowerBlock™ (SPB) battery modules. Power distribution units (PDU) and voltage conversion as well as data interface can be added to the titanium or duplex steel
housing completing a battery system. Combining these functions in a single pressure housing reduces the number of subsea connectors and simplifies system integration.
The Li-Ion cell technology, which is used, offers enormous advantages in terms of safety, energy and power density at moderate costs. Due to the flexible design, the charger can be external or can be integrated into the pressure housing, e.g. for AUV/ROV docking stations or subsea storage solutions. SubCtech has developed DC and AC converter technology that allows high charge power and therefore short charging times without complex cooling.
The transformation into an “All-Electric System” technology protects the oceans and enables a sustainable, careful use of our limited resources. Here, the innovative, modular
maintenance-free over their design life. The same applies to the Li-Ion batteries used. These also have a service life of up to 25 years, so that here, too, no maintenance or even replacement is necessary, which reduces cost significantly.
Since SubCtech also produces large titanium housings, battery systems can also be easily scaled to different water depths and form-factors. This, as well as the battery itself, through innovative and modular engineering and construction methods and processes with little effort, i.e. extremely cost-efficient.
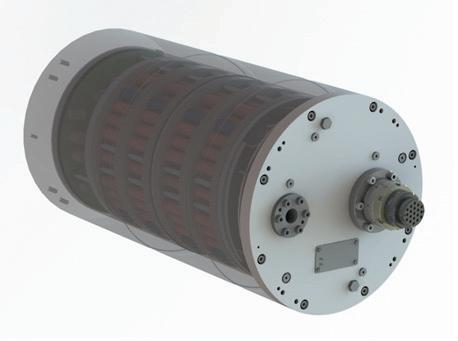
The ability to adjust operating parameters during operation without retrieving and service on board enables simple testing at significantly reduced costs.
SubCtech battery system plays an elementary, almost indispensable role and offers new, equally innovative “All-Electric Systems” a wider range of options.
All markets and applications have in common that the use of the oceans is advancing, but must be more sustainable and safer. With the aim of making technologies more efficient and using ocean resources cost-effectively, future solutions must always consider protection and sustainability.
With SubCtech’s standardized, safe and reliable Li-Ion batteries with longest design life, we make underwater energy reliable and cost-effective. The high level of safety, the elimination of maintenance reducing OPEX significantly. Another part to optimize OPEX costs and increase sustainability is the pressure housing. Unlike traditional duplex and 316L steel canisters, SubCtech specializes in titanium. A coating and corrosion protection (CP) is not required and thus reduces the possible entry of pollutants into the water. In contrast to regular expensive maintenance at subsea structures with ROV support, titanium housings are 100%
The benefit of SubCtech’s “All-Electric Systems” Technology is global for the offshore Oil&Gas industry. A current large Energy Storage System is being build right now, which offers enormous added value through the installation of an electrical backup system for a large gas extraction system. The “All-Electric Systems” offers cost advantages compared to conventional systems, which are more expensive to maintain and purchase. With this product, an industrial standard could be created that would add significant value for many other Oil & Gas production platforms.
Furthermore, we develop standards for safe operation, maintenance and obsolescence, commissioning, de-comissioning and disposal, but also data exchange with major companies. SubCtech therefore also supports the further development, standardization and implementation of the framework of SIIS (Subsea Instrumentation Interface Standardisation). With its long-term focus on safety-critical applications, SubCtech is ideally positioned to meet the current and coming industrial requirements.
For the future world market, we see great opportunities for all-electric systems and SubCtech’s Li-Ion Subsea UPS and storage batteries. It’s a safer way to cut costs.


• Schneider Electric and H2-Enterprises join forces to develop clean hydrogen solutions for buildings in the Middle East and Africa.
• The collaboration combines Schneider Electric’s energy management expertise with H2-Enterprises’ clean hydrogen technology.
• The collaboration includes joint projects, pilot programs, and knowledge sharing to drive decarbonization and achieve net-zero goals in the region.
Since 1994, BUTTING has been producing meRiyadh (Saudi Arabia), June 21, 2023 –Schneider Electric, the leader in the digital transformation of energy management and automation, today announced the signing of a Memorandum of Understanding (MOU) with H2-Enterprises to explore and develop innovative solutions for energy supply and management in buildings. The collaboration aims to leverage Schneider Electric’s expertise in energy management and H2-Enterprises’ innovative technology in clean hydrogen to contribute to the decarbonization and net-zero objectives of the Middle East and Africa.
As a global leader in energy management and industrial automation, Schneider Electric is committed to creating a positive impact on the environment and working towards a climate-positive world. The company offers integrated solutions across multiple end-markets, including buildings, data centres, industries, and infrastructure. Schneider Electric is an impact company with a mission to bridge progress and sustainability for all. We believe access to energy and digital is a basic human right, and we believe in the power of digital and clean, sustainable energy to advance equity and inclusion.
H2-Enterprises is an integrated energy company operating in the Hydrogen and Renewable Energy Sector. They specialize in project
About Schneider Electric
Schneider’s purpose is to empower all to make the most of our energy and resources, bridging progress and sustainability for all. We call this Life Is On. Our mission is to be your digital partner for Sustainability and Efficiency. We drive digital transformation by integrating world-leading process and energy technologies, endpoint to cloud connecting products, controls, software, and services, across the entire lifecycle, enabling integrated company management, for homes, buildings, data centres, infrastructure, and industries.
From left to right: Yasser Ahmed, Director of Digital Buildings & Software, MEA, Schneider Electric – Sascha Gaede, COO, H2-Enterprises – Manish Pant, Executive Vice President for International Operations, Schneider Electric – Amel CHADLI, Vice President Digital Energy and Software - Middle East & Africa, Schneider Electric –Michael STUSCH, Executive Chairman and CEO, H2-Enterprises and Walid Sheta, President, Middle East & Africa, Schneider Electric.
development, system integration, component production and supply, as well as power plant operation. With expertise in clean hydrogen production, storage, and conversion into electrical or thermal energy, H2-Enterprises plays a vital role in advancing sustainable energy solutions.
The memorandum of understanding (MOU) between Schneider Electric and H2-Enterprises sets the stage for collaboration on various initiatives. The collaboration will involve joint project development, pilot programs, technology exchange, and knowledge sharing. By leveraging the strengths and capabilities of both organizations, they will explore, develop, and implement innovative solutions for energy supply and management in buildings.
Under the MOU, Schneider Electric will provide its expertise and technical support in energy management, infrastructure, building automation, and related areas. This collaboration will enhance the development and implementation of clean hydrogen solutions. H2-Enterprises, on the other hand, will contribute its expertise and technologies in clean hydrogen
We are the most local of global companies. We are advocates of open standards and partnership ecosystems that are passionate about our shared Meaningful Purpose, Inclusive and Empowered values.
www.se.com
About H2-Enterprises
H2-Enterprises Group Inc. is a global hydrogen enabler and energy storage solutions company headquartered in New York City, USA. Founded by Dipl.-Ing. Michael Stusch, in 2010, the business
production, storage, and conversion. This includes waste-to-hydrogen, hydrogen from solar and wind, Liquid Organic Hydrogen Carriers (LOHC) for hydrogen storage and transport, renewables integration, and fuel cells.
To ensure effective implementation of the collaboration, the MOU establishes a governance structure. Amel CHADLI, Vice President Digital Energy and Software - Middle East & Africa, will represent Schneider Electric, while Michael STUSCH, Executive Chairman & Chief Executive Officer, will represent H2-Enterprises. Regular meetings will be organized to review progress, address challenges, and foster cooperation in the areas of interest.
“Schneider Electric envisions buildings of the future that are sustainable, resilient, hyper-efficient, and people-centric. Through our Electricity 4.0 approach, combining digitalization for efficiency and electrification for decarbonization, we are committed to making this vision a reality. By joining forces with H2-Enterprises, we aim to leverage their clean hydrogen technology and expertise to further accelerate the transition towards a sustainable and green future.” - Amel CHADLI, Vice President Digital Energy and Software - Middle East & Africa, Schneider Electric.
“Through our collaboration with Schneider Electric, H2-Enterprises aims to revolutionize the global energy landscape. By leveraging our innovative technologies, including clean hydrogen production, safe storage, and efficient transportation solutions, together with Schneider Electric’s expertise, we are driving the transition towards a sustainable and emission-free future. Join us in creating a world where clean, affordable energy is accessible to all, making a lasting impact on the environment and future generations.” -
Michael STUSCH, Executive Chairman and CEO, H2-Enterprises.focuses on developing technologies that generate clean hydrogen from waste and renewable energy and store, transport, and trade clean hydrogen using Liquid Organic Hydrogen Carriers (LOHC). At present, H2-Enterprises operates in several countries around the world, collaborating with leading suppliers and consultants worldwide. To learn more about how H2-Enterprises is changing the renewable energy supply landscape, visit https://h2-enterprises.com/en.)
www.h2-enterprises.com


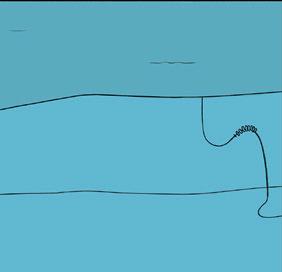
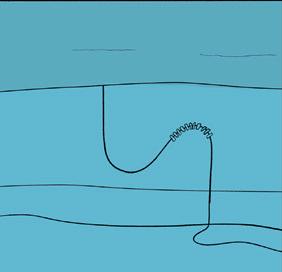

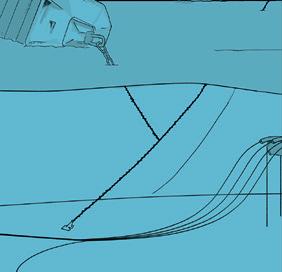
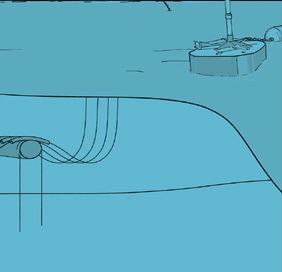


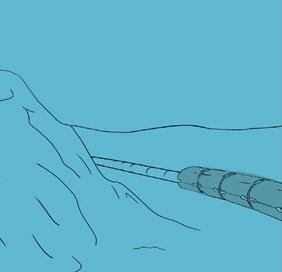


Introduction
Optimizing hydrocarbon recovery in offshore hydrocarbon fields involves decisions involving costly investments, like drilling infill wells or installing compression facilities. A good understanding of the dynamical behaviour of the reservoir over the lifetime of the field is of key importance to support and reduce the risk related to such investments.
Time-lapse seismic is generally accepted as a suitable monitoring technology. However, it involves considerable operational costs and it remains difficult to process 4D seismic information in a timely
manner for reservoir management decisions. Time-lapse gravity and subsidence surveys can provide complimentary information to 4D seismic in a timely manner at a cost of typically 10% of that of seismic surveys. This approach has been used on the NCS for two decades, and field cases demonstrate that 4D gravity and subsidence monitoring can sometimes provide information beyond the reach of seismic, and timely enough to guide important reservoir management decisions.
Time-lapse gravity changes at the seafloor are sensitive to fluid redistribution in the reservoir. As an example, vertical movements of water-gas contacts smaller than a meter can be detected under some circumstances (Ruiz et al., 2015). That is possible because of the high accuracy of the time-lapse gravity measurements, which is at the level of a few μGal (Agersborg et al., 2017).
Seafloor subsidence monitoring uses precise water pressure measurements at the seafloor as a starting point. After processing which involves for example correcting for tides and oceanographic effects, the method reaches accuracies as low as 2 mm. Subsidence is not only a required correction for the interpretation of gravity results, but also a valuable monitoring tool by itself, as it is sensitive to important reservoir and overburden properties. The lateral development of a subsidence bowl is related to pressure depletion and lateral compartmentalization, and in some cases, it is a key factor for the safety of the installations.
The marine 4d gravimetry and subsidence method
Gravity and seafloor subsidence data are acquired simultaneously in combined surveys. A sensor frame containing three relative gravimeters and three pressure sensors is used for the measurements.
Gravity and water pressure are measured with the sensor frame at a number of lateral positions across the field. The sensor frame is placed on a semi-permanent concrete platform at the seafloor. The number of stations ranges from 20 to 120, depending on the size of the field, with station spacing being typically similar to the reservoir depth below the seabed. The top surface of the platforms is circular with a diameter of approximately 1 m, and their role is to guarantee time-lapse repeatability in the measurement location. The concrete platforms are left on the seafloor during the field lifetime and can be retrieved at the end of production. During a survey, a vessel is positioned se-
quentially above the concrete platforms, and a remotely operated vehicle (ROV) deploys the sensor frame to perform the 20-minute measurements on top of each of them. The duration of a survey ranges from one to five weeks.
Surveys are organized in loops starting and ending at one or two centrally-placed platforms, called base stations. Repeat measurements at the base stations are used as a reference to model instrumental drifts, by constraining the measurements at the different visits to have the same value after the correction.
Stations are located both above and surrounding the hydrocarbon field. Zero-level stations are placed in peripheral locations were production is expected to induce neither a change in gravity nor vertical seafloor deformation. That allows using those stations as a calibration reference in time-lapse computations. The survey aperture, including the offset of zero-level stations from the field outline is a function of reservoir depth.
In a subset of stations, tide gauges are deployed during the whole survey, as a means for correcting raw pressure measurements for tides and other oceanographic effects. By applying these corrections, pressure measurements obtained with the frame at the concrete platforms are converted in measurements of platform depths. Depth differences between surveys provide a measurement of subsidence with a precision of a few millimeters. Gravity changes are computed after correcting measurements for instrumental drift, tides, water
density and the effect of seafloor subsidence. Gravity data is easy to integrate in history matching workflows. This is because forward-modelling time-lapse gravity signals is an unambiguous and linear operation, involving a simple summation of Newton’s law on all reservoir cells. Contrary to seismic attributes, gravity is sensitive to density only, a scalar property without any dependence on other rock or fluid parameters.
Incorporating information from seafloor subsidence in the reservoir model can be a more involved process. The transfer function between reservoir compaction and the observed seafloor subsidence depends on properties of rocks outside the reservoir. Tools for modelling subsidence range from simple analytical models to advanced numerical simulations (van Opstal, 1974; Pettersen and Kristiansen, 2009). However, for several field applications, simple analytical modelling tools have been shown to be sufficient to provide an accurate picture of reservoir compaction or to identify non-producing compartments. See, for example Rocca et al. (2013), van Thienen-Visser et al. (2015) and the examples presented below.
We use five case studies from the NCS to illustrate how subsidence and 4D gravity data are incorporated into reservoir management.
The first example refers to Midgard, a gas field within the sgard complex with seafloor depths between 240 and 310 m and the reservoir 2800 m below sea level. The reservoir segments in the south-east of the field feature challenging fault patterns that made seismic interpretations highly uncertain (Statoil ASA, 2015). By including information on fluid flow and reservoir compaction from 4D gravity and subsidence, it was concluded that one segment experienced less drainage than the rest of the field. The reservoir model was then updated to incorporate new sealing faults, and a decision was taken to drill a new production well in the segment. The well became the highest producing one in the sgard complex area.
Similar challenges were present at the Ormen Lange field, with initial gas reserves of 4x10¹¹ Sm3. The seafloor depth ranges between 300 and 1,100 m, while the reservoir lies 2,600 to 2,900 m below sea level. In 2014, the discussion on near-future developments involved decisions on infill wells, installation of compression facilities, and enhanced gas recovery (van den Beukel et al., 2014). Additional information was required on compartmentalization and aquifer strengths. Feasibility studies con-
Fig 2: Gravity changes corrected for seafloor subsidence in the 2012-2014 time-lapse at the Ormen Lange field (from Vatshelle et al., 2017). The original gas-water contact is depicted as a black line, and wells as shorter, thick black lines.
cluded that gravity and subsidence would provide the required input earlier than time-lapse seismic. Thus, since 2012, full 4D gravimetric field surveys for acquiring gravity and subsidence data are carried out biannually over the field, the latest in the summer of 2018.
Figures 1 and 2 show the results of the 20122014 time-lapse. Note that signals compatible with zero are observed at the zero-level stations. For subsidence, two homogeneous and roughly independent subsidence bowls with different rates are observed. This data represents the main source of information on reservoir compaction. On the map of subsid-
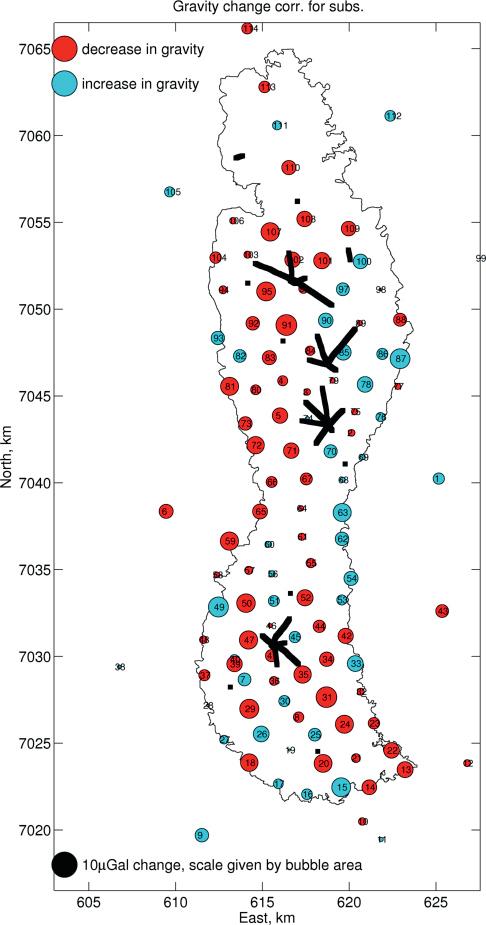
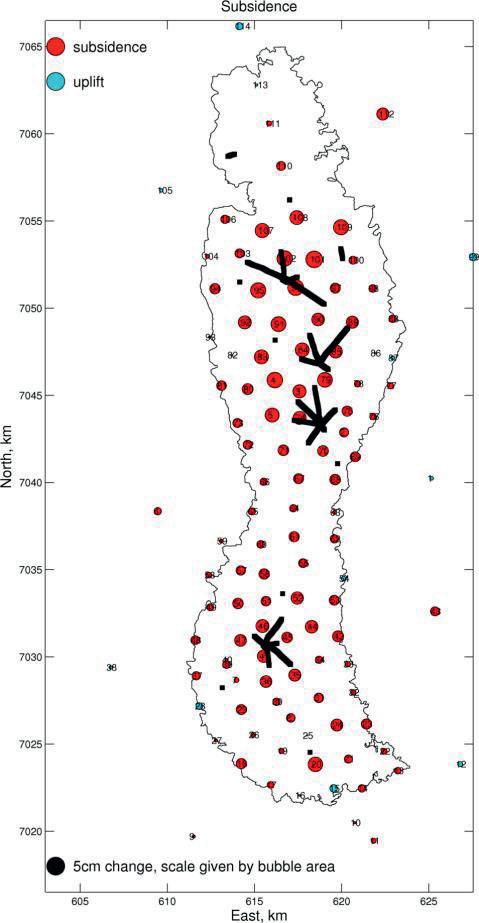
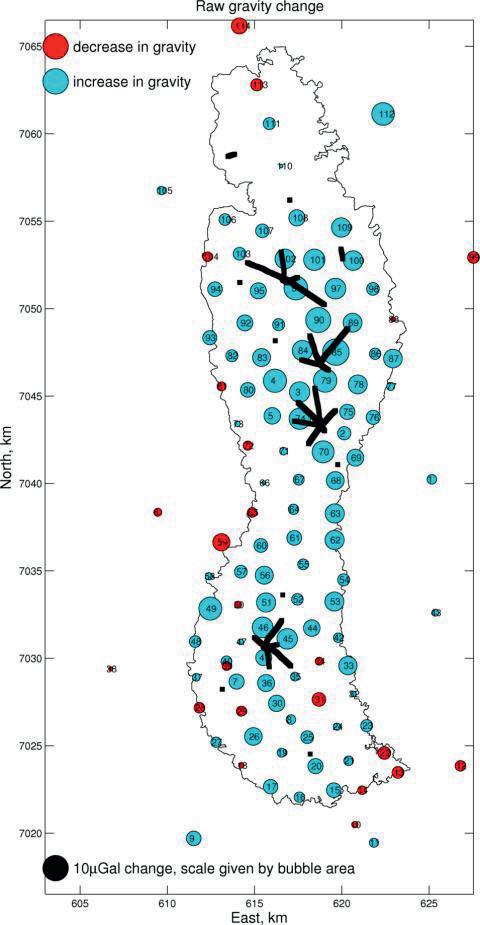
ence-corrected gravity, positive values indicate areas where the dominating effect on gravity arises from water influx from the aquifer, while negative values correspond to areas where the mass reduction caused by gas production dominates.
Troll is a large field with an initial 13x1011 Sm3 of recoverable gas. Seafloor depths range between 300 and 340 m, with the reservoir lying between 1300 and 1500 m below the seafloor. Gas is produced from the thicker Troll East compartment, while both gas and oil are produced from Troll West.
At Troll East, a 1 cm/year subsidence is observed together with a clear positive signal in 4D gravity. The latter is interpreted as water influx from the aquifer and allows quantifying the aquifer strength. At Troll West, on the other hand, the descending gas-oil contact produces a smaller though significant gravity decrease signal, which provides insight in the drive mechanism and mass balance of the field. Gravity and subsidence data were used for improved material-balance calculations at Troll and to optimize the overall strategy of gas and oil production (Alnes et al., 2010).
Mikkel is a gas-condensate field with an initial estimate of reserves of 23x109 Sm3. The seafloor depth at Mikkel is 220 m, with the reservoir lying 2500 m below. It is a much smaller reservoir than that of Troll, at a much larger depth. Differences of about 4 μGal between measured time-lapse gravity data and reservoir model predictions lead to the conclusion that the water influx from the aquifer was significantly lower than expected (Vevatne et al., 2012). The information had important implications for reservoir management: it had been anticipated that in case of water breakthrough in one of the wells, the two remaining ones would not be able to sustain the minimum required flow rate in the pipeline. Updating the anticipated time for breakthrough allowed for a better management of pipeline occupation rights.
At the Statfjord oilfield, subsidence measurements were used to calibrate the geomechanical model of the overburden. From this improved geomechanical model, the discrepancies between the measured and modelled seismic time-shifts in the overburden could then be used to identify undrained segments in the reservoir (R ste and Ke, 2017).
A large fraction of the cost of gravimetry and subsidence surveys correspond to the vessel and the ROV. Cost-effectiveness can be introduced in two ways: by reducing the duration of the surveys and by making the instrumentation more compact, so smaller vessels and ROVs can be utilized.
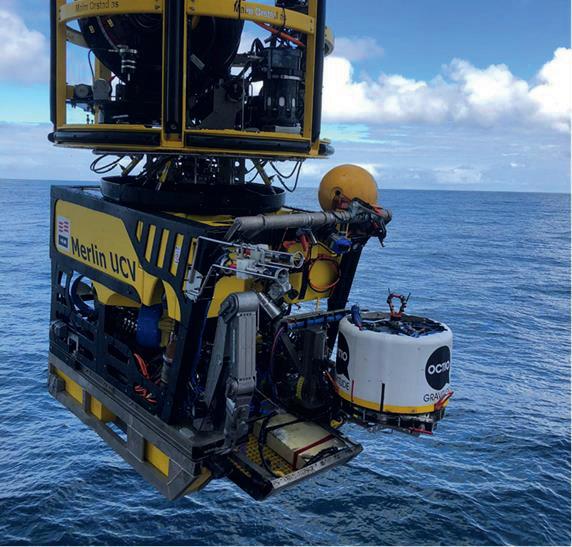
An important driver of survey time is gravimeter drift. Multiple measurements need to be performed at the concrete platforms to construct an accurate drift model that can be used to correct the measurements.
A second driver is the duration of the measurements themselves, which is in turn driven by two factors. The first one is the high-frequency noise introduced by microseisms, that needs to be averaged out. The second is the initial instability of gravimeters that have been subject to tilt in the transition between concrete plat-
forms (gravimeter recovery), that needs to be modelled and corrected for.
The industry has recently introduced improvements in the gravimeters that provide higher frequency sampling, less recovery after tilt and less drift, together with a significant reduction of volume and weight of the instrumentation. A new generation of offshore gravimetry instrumentation has been introduced with new sensor technology, and much improved handling and automatization (see Figure 3). The effect on the reduction of requirements in ROV and vessel size has been realized in two surveys in 2018.
The data acquired on those surveys represent an excellent benchmark for planning for an optimal reduction of the duration of the surveys in the future.


The industrial focus on flow measurements and metering systems for single phase oil and gas, wet gas, multiphase, including also sampling and analysis is strong. This is valid both for traditional and new applications and includes initiatives towards higher accuracy, more environmental focus, unmanned operations and online diagnostics and performance monitoring.

We are now in a time with a combination of energy shortage in Europe and climate change. This makes the fluid flow of oil, natural gas, carbon dioxide, hydrogen and other fuels even more important.
Book a seat at the conference now and be updated on traditional flow measurement topics, besides flow subjects related to new technologies, developments, CO2 reduction and new energies.
Read more and register at Tekna.no/GFM23
Maintenance rethought
liebherr.com
Maritime cranes
Liebherr Intelligent Maintenance - LiMain
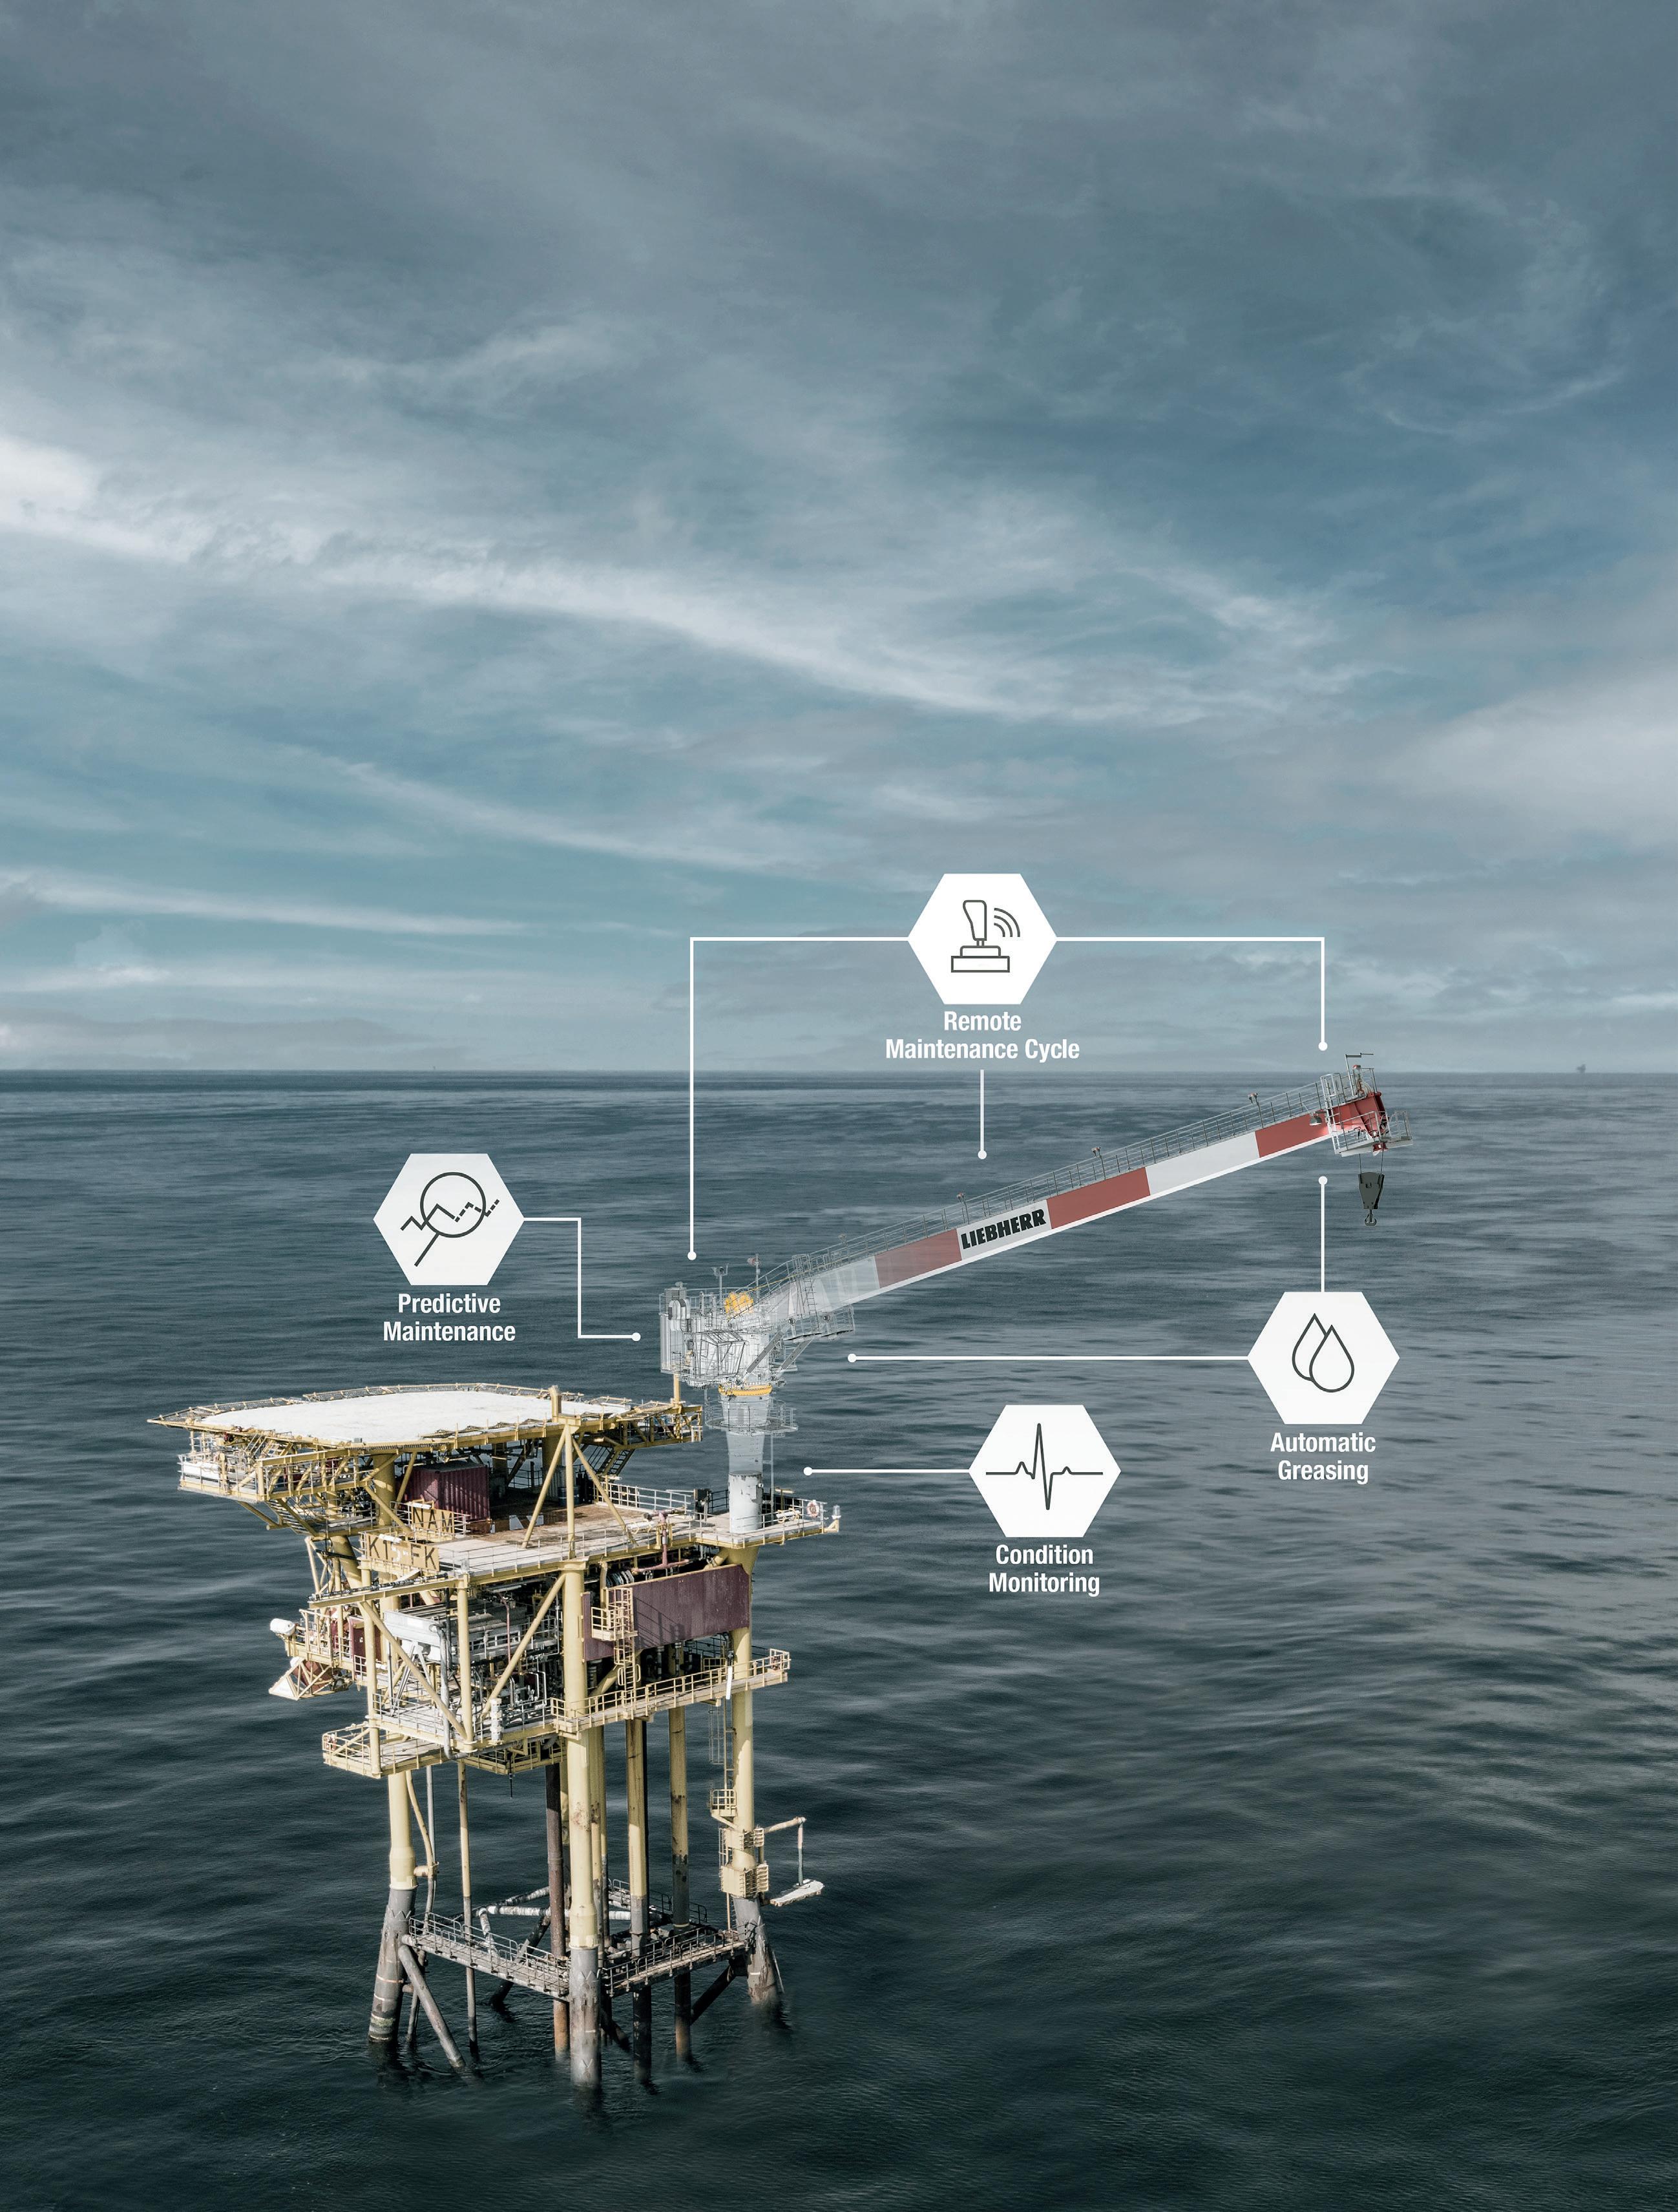
Teledyne Gas and Flame Detection is unveiling its GD1 laser-based gas detector with full SIL2 3rd party approval. This ground-breaking development means that the GD1 SIL2 is the market´s first open-path gas detector for hydrogen sulphide (H2S) safety-related applications.

The global importance of SIL (Safety Integrity Level) has grown substantially in the oil, gas, petrochemical and other process industries over the past 10 years. It makes sense, therefore, that devices such as gas detectors demonstrate their suitability and competence in line with the latest SIL2 third-party certification. The GD1 from Teledyne GFD first entered the market in 2011, with well over 1600 units since deployed at oil and gas exploration and production (Onshore & Offshore) companies throughout the Middle East and the rest of the world. With its new certification, the GD1 is now suitable for use in systems with SIL2 requirements. To provide some context, a typical SIL1 ATEX-certified gas detection device/ system will come complete with the functional approval according to IEC 60079-29-3 and require regular maintenance. The step from SIL1
to SIL2 requires built-in automatic self-testing of hardware components and this means reduced maintenance intervals for sensors, and reduced downtime.
GD1 complies to the latest standard for IEC 60079-0:2017 (IECEx).
Teledyne GFD´s innovative GD1 will prove attractive in SIL2 applications for several reasons, not in the least its unique customized tunable laser diode that eliminates environmental effects from sun, rain or fog. In fact, the GD1 can operate with up to 98% obscuration, boosting overall site safety. This capability is possible because light emitted by the detector travels as a cone from one point to another, rather than as a conventional straight beam. In other words, the beam expands after transmission and is almost a meter in diameter when it
reaches the receiver mounted 75m away. It can therefore penetrate harsh environments that competitor solutions may find difficult.
With its fast and fail-safe laser, the GD1 performs real-time dual automatic calibration and automatic proof testing, thus eliminating the need for manual intervention and reducing maintenance costs. Further advantages include low power consumption (15W), very long lifespan and a high sampling/detection rate of 8000 times per second thanks to its ultra-stable optomechanical construction.

All these added-value characteristics mean the GD1 can replace multiple standard detectors to cover the same risk, making it an economic solution that typically demonstrates real cost savings within two years.
For more information, visit www.TeledyneGFD. com or contact gasandflamedetection@teledyne.com
Every customer scenario demands a different, customized approach, and Teledyne Gas & Flame Detection applies expertise in building the right plan for the right hazards every time. Our complete portfolio and industry-leading of fixed and portable gas and flame detection solutions offer expert perspective and quality products you can rely on in the most critical situations. When it comes to superior value, efficacy, efficiency, and service, the gas and flame detection team from Teledyne delivers like no one else. Always sensing safety, everywhere you look. www.TeledyneGFD.com.
Trelleborg Sealing Solutions launches the H2Pro™ range of sealing materials for every application of the hydrogen value chain, including a new ethylene propylene diene monomer (EPDM) rubber for high-pressure environments across a wide range of temperatures, and a unique thermoplastic polyurethane (TPU) for very low temperatures.
Designed to accelerate innovation for sustainable technology, H2Pro™ has solutions for the challenges of hydrogen production, transport and storage, and end-use. Proven to withstand challenging application environments, the materials are suitable for high pressures, low temperatures, and resist permeation, making them better able to withstand rapid gas decompression, while also demonstrating excellent wear and extrusion properties.
The range includes two new materials specially engineered for hydrogen applications. H2Pro™ EBT25 is a new EPDM for high-pressure environments across a wide range of temperatures, and Zurcon® H2Pro™ ZLT is a unique TPU for very low temperatures.
James Simpson, Global Segment Director Energy, says: “Hydrogen has a major role to play in the transition to a carbon neutral world, both as a fuel source and as a storage medium for surplus energy from renewable sources. Due to its inherent characteristics, hydrogen is difficult to seal. The expanding H2Pro™ range, engineered by our advanced global R&D teams, offers reliable sealing solutions for a wide array of applications, including pumps, valves, connectors, and numerous other devices in the hydrogen supply chain.”
The challenges include permeation and leakage, as hydrogen is the simplest element with the smallest molecular structure. Another is rapid gas decompression (RGD), where hydrogen in a high-pressure system can be absorbed into a seal. If the pressure in the system is suddenly relieved, gas trapped in the seal can expand, potentially causing the seal to blister and crack as the gas tries to escape. Finally seals
for different hydrogen systems need to withstand seriously tough environments, including high pressures of up to 1,000 bar/14.34 psi (for example in high-pressure valves) and extremely low temperatures down to -250 °C/-418 °F (for example in liquid hydrogen storage and transportation).
Simpson adds: “Because it is so challenging to seal, Trelleborg is creating the materials and application-specific solutions to support every type of business involved in hydrogen, including those in the energy generation, aerospace, off-highway, truck and bus, CPI, chemical transportation and marine industries. As a longstanding global leader in polymer and elastomer solutions, we are ideally positioned to be their sealing partner of choice for hydrogen.”
All H2Pro™ materials are designed specifically for excellent application-specific wear and extrusion properties and are validated to key industry standards in a range of challenging conditions typical of hydrogen environments. Trelleborg uses advanced testing rigs to assess materials for oxygen and ozone aging, hydrogen compatibility, leakage, permeation and the ability to withstand RGD, and compliance with relevant international standards.
Zurcon® H2Pro™ ZLT has very low permeability and displays a superior ability to withstand RGD. It has a wide operating service temperature range, with outstanding low-temperature capabilities, displays excellent extrusion and wear-resistance properties, and is compliant with Regulation (EC) 79/2009, SAE J2600 and
ANSI CHMC 2. It can be produced as O-Rings for static sealing on valves, filters, refueling nozzles, pumps, connectors and fittings, and as U-Cups for static and dynamic applications such as valve stems, actuators, and regulators. H2Pro™ EBT25 demonstrates a superior ability to withstand RGD, and features low permeability, a wide operating service temperature range, 85 Shore A hardness and excellent extrusion resistance. It is compliant with Regulation (EC) 79/2009, SAE J2600 and ANSI CHMC 2, and can be manufactured as O-Rings for static sealing on valves, filters, refueling nozzles, pumps, connectors and fittings, and custom molded parts and frame seals for fuel cells and electrolysis equipment.
H2Pro™ materials are also available in a range of other compounds and seal profiles including:
• Turcon® polytetrafluoroethylene (PTFE) and thermoplastic compounds for use as Varilip® lip seals
• V-Stack seals for use in static and dynamic applications with cryogenically compressed hydrogen and liquid hydrogen (LH2)
• FKM seals for blue hydrogen
• Lower-hardness EPDM compounds and silicone compounds for lower-pressure applications
• Metal seals for static LH2 applications

• Wear-resistant composite bearings and piston rings for compressor applications.
For more on the H2Pro™ range: https://www.trelleborg.com/en/seals/ products-and-solutions/latest-innovations/ h2pro-hydrogen-sealing-materials.

The North Sea has energy that Europe needs. And place for the emissions we need to get rid of.