


of Market Technician, the journal of the Society of Technical Analysts.
As we approach the milestone of our 100th edition, it’s striking how this issue captures the breadth, energy and evolving sophistication of our discipline. The world of technical analysis continues to balance historical wisdom with forward-thinking innovation.
This edition offers clear evidence of that progression.
Sankar Sharma MSTA (pg.12) opens the journal with an in-depth exploration of the Cup and Handle pattern - a formation familiar to many but here presented with fresh precision and strategic depth. This analysis serves as a reminder that even the most recognisable patterns can yield new insights when approached with discipline and a systematic mindset.
Karen Jones FSTA (pg.21) contributes a powerful critique of the Efficient Market Hypothesis, combining her own experience with behavioural finance and a nuanced understanding of market dynamics. Her work challenges long-standing academic assumptions and reinforces the practical, real-world value of technical analysis in today’s environment.
Priya Mittal and Sasha Medin’s (pg.24) quantitative study on candlestick patterns spans four decades and over a hundred million data points.
Their rigorous research offers a fascinating look at how the effectiveness of familiar signals has evolved - or in some cases been eroded - in response to changing technologies, market structures and trader psychology.

The announcement of London as the host city for IFTA 2026 marks an exciting moment for our organisation.
This issue also reflects the vibrant personality of our STA community.
We are delighted to welcome Michael Hewson MSTA (pg.35) to the Board: in conversation he shares thoughtful reflections on his journey, the tools that shaped him and the lessons learned over decades of market engagement.
The announcement of London as the host city for IFTA 2026 (pg.11) marks an exciting moment for our organisation and we are bringing together a truly international group of technical analysts to share knowledge, insights and connections.
As ever, our STA courses (pg.42) continue to grow in impact, helping experienced and new professionals
to formalise their learning and build confidence in their analytical approach.
As you read through this issuewhether you’re revisiting foundational techniques or exploring the latest research - I hope you feel the same sense of energy and dedication that defines the STA and its members.
This journal exists not only to inform but to celebrate the craft of technical analysis and the people who carry it forward.
Thank you for reading.


Specialising in Employment Tribunals, Consumer Law, Landlord and Tenant Law and Family Law, Affordable Law for You was set up by Deborah Aloba, a Fellow of the Chartered Institute of Legal Executives.
We assist by
• Reviewing and commenting upon legal documentation
• Assisting you to respond appropriately to communications in legal proceedings
• Preparing legal documents in a format required and accepted by the Courts
• Researching and providing relevant statutes and case law supporting your legal arguments
For further details visit our website or contact us direct: affordablelawforyou@gmail.com 07964 805 397


The STA and Chartered Institute for Securities & Investment renew Memorandum of Understanding
On Tuesday the 8th April, our Chair, Eddie Tofpik, renewed our Memorandum of Understanding (MOU) with the Chartered Institute for Securities & Investment (CISI), continuing a long-standing collaboration focused on a shared passion for professional education and capital markets.
We are looking forward to more insightful events and finding other ways to collaborate for the benefit of our members.

Don’t forget that the STA is active on LinkedIn, X , Facebook, Instagram, YouTube, Spotifyand even TikTok!
Across these platforms you can keep up with the latest market news, member activities, interviews and watch short educational videos with STA’s content editor, Karen Jones - former Managing Director, Commerzbank.
Click on the icons to find us and follow!
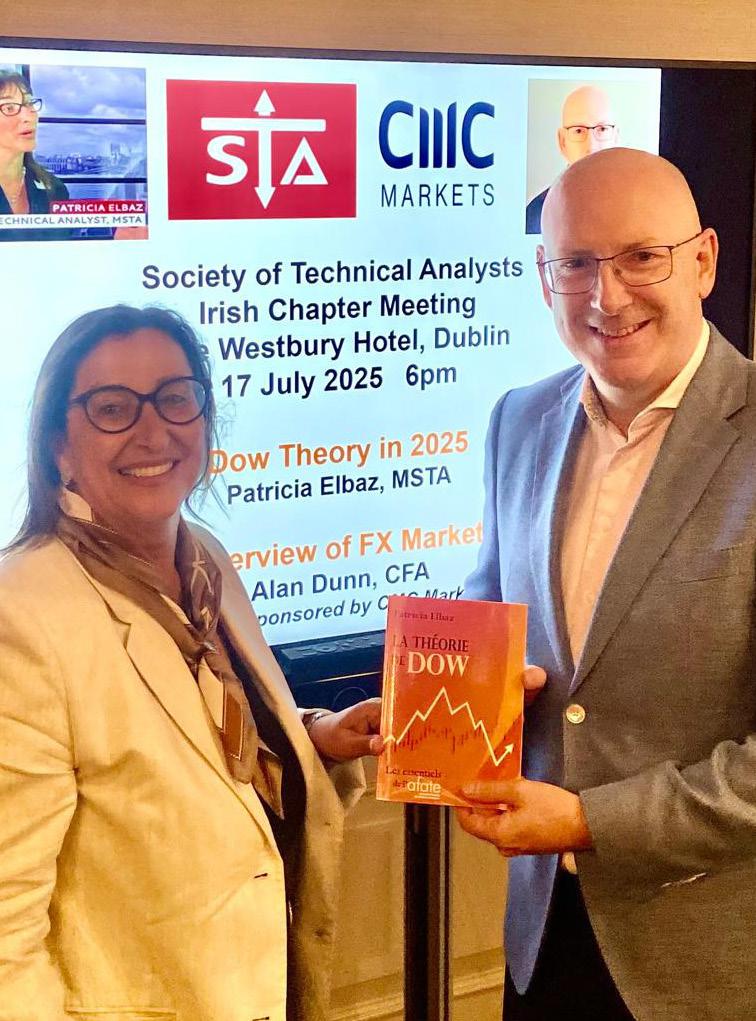
On Thursday 17 July, the STA’s Irish Chapter hosted a networking event at The Westbury Hotel in Dublin, generously supported by CMC Markets
The evening featured engaging presentations from guest speakers Alan Dunne, CEO of Archive Capital, and Patricia Elbaz , independent Technical Analyst and lecturer, who shared their expertise on the FX markets before members and guests gathered for a networking reception. Alan opened the session with a concise overview of the current FX landscape, outlining the key macroeconomic themes, primary market drivers, and the ways in which the market has evolved in recent years.
Patricia followed with a thought-provoking talk that explored the origins and enduring relevance of Dow Theory, its influence on FX trading, and the significance of crowd behaviour, market psychology, and the distribution phase. She concluded with a forward-looking discussion on the practical application of Dow Theory in today’s FX and equity markets, with particular attention to developments anticipated in 2025.
Congratulations to Quiz winner John Sweeney, who identified the Silver Chart and went home with a signed copy of Patricia’s book on Dow Theory in French, his reaction ‘I’m grateful for google translate!’.
Market discussion continued over a reception which was generously sponsored by CMC Markets. Look out for our next event and an opportunity to network during the reception!
The Society of Technical Analysts (STA) recently conducted a membership survey. Given my role as a board member, I didn’t feel it was appropriate for me to take part but it did make me stop and reflect. Why did I join the STA in the first place? Why do I remain a member? And why have I committed to serving on the board?
I began my career in the city as a junior technical analyst. It didn’t take long to realise how little I knew. Technical analysis was fascinating - full of potential - but I lacked a proper foundation. I had to teach myself and fast. More importantly, I had to understand how others were actually using technical analysis in real-world trading.
Over time, I noticed a clear trend: successful traders were using technical analysis not just to place trades or spot profit opportunities, but - crucially - to manage risk. They were using it to decide where to place stops, how to avoid big losses and how to approach the market with discipline. That insight shaped the rest of my career.
As I developed, I found myself drawn to education. I wanted to help others understand how technical analysis could be used not just to trade, but to trade well - with a plan, with purpose and with a strong grasp of risk management.
But this raised an unexpected challenge: I had become so fluent in the language of technical analysis that I’d lost touch with how to teach it. I was skipping over the basics because they had become second nature to me. That’s when I realised that I had to go back to school myself.
Attending STA monthly seminars helped me reconnect with the fundamentals. I re-learned concepts like Fibonacci retracements and how to choose the right RSI settings - tools I’d long used instinctively. Revisiting these basics reminded me just how important they are and how crucial it is to be able to explain them clearly to others.
The STA provided that structure. It helped me verbalise what I’d previously just done automatically. Just as importantly, it gave me a network - a community of like-minded professionals who are as committed to learning and sharing as I am.
Even now, years into my career, I’m still learning. Recently, Stephen Hoad introduced me to Renko charts (pg.37)something I hadn’t used much before. It was a reminder that in technical analysis there’s always something new to discover.
That’s one of the biggest advantages of STA membership: access to a community of experts who are not only deeply knowledgeable but incredibly generous with their time and insight. The willingness of STA members to share what they know openly and freely is what makes this organisation so special.
So, why am I still a member? Because the STA continues to offer value - education, connection, inspiration. And why am I a board member? Because I want to give back. I want to ensure others have access to the same opportunities for growth that I’ve had.
If you’re on your own journey with technical analysiswhether you’re just starting or have decades of experience - I can’t recommend STA membership enough. It’s not just about learning charts. It’s about joining a community dedicated to improving the way we understand, teach and apply technical analysis.
For more information about membership to the Society please click here

KAREN JONES FSTA
“Over
time, I noticed a clear trend: successful traders were using technical analysis not just to place trades or spot profit opportunities, but - cruciallyto manage risk.”
KAREN JONES
The Society of Technical Analysts will be celebrating International Technical Analyst Day again this year on 9 September.
Eddie Tofpik, the Chair of the STA, first launched this initiative in 2022. The idea was and remains to give technical analysts and those using technical and chart analysis at funds, banks, brokers, proprietary trading shops or for themselves, a day to get recognition for the hard work, dedication and diligence that they display through all market conditions and events.


We encourage colleagues, clients and counterparties to say, ‘Thank you!’ to their staff technical analysts and TA providers from around the world on this day. We are thrilled that this year it coincides with a special online fireside chat with legendary professional trader and consultant, Tony LaPorta who will be in conversation Clive Lambert FSTA, Founder of FuturesTechs. Clive and Tony first met working at the London International Financial Futures Exchange (LIFFE) back in the 90s.
Tony LaPorta (left) has been active in the futures industry for 46 plus years including membership at the Chicago Mercantile Exchange (CME) and the London International Financial Futures Exchange (LIFFE). Tony is an ex pit-trader turned screen-trader. He writes with deep insight providing well-documented and highly educational chart analysis in his daily financial market commentary. Through technical expertise and a keen ability to translate market indications and correlations, Tony identifies swing trades for his clients and himself. His years of experience and gut intuition is what separates Tony from the competition.
Starting at 6.30pm UK time, join us online in what promises to be a lively session as they recount trading stories and talk about trading ‘rules’.
Join the Fireside Chat with Tony LaPorta
ITAD 2025 with Eddie Tofpik


We are delighted to announce that the STA will be hosting the 2026 International Federation of Technical Analysis (IFTA) conference here in London.
The two-day event will be held on Friday 9 October and Saturday 10 October 2026 at One Moorgate Place, London.
This conference will bring together the world’s leading experts in technical analysis, quantitative trading and financial markets, exploring cutting-edge strategies, modern applications, and emerging trends.
The theme running through the two days will be very much focused on TA in the age of AI.
With an exceptional speaker-line up, this will be a fantastic networking event, culminating in a Gala Dinner on the Saturday evening at Plaisterers’ Hall, City of London.
If you are interested in sponsoring or taking part in any way please do contact the STA office on info@technicalanalysts.com


SANKAR SHARMA, MBA (FINANCE), MSTA
Keynote Speaker | Author | Trading and Investing Mentor
Founder, Pathway to Prosperity™ and RiskRewardReturn.com
Featured six times in Forbes and over 100 top financial media outlets
Member of STA and IFTA
This curious shape has been making money for my clients, customers, traders and for the students I have been mentoring. It would be a disservice not to share this with my fellow members of the STA, IFTA, and associated institutions.
It always begins with a peculiar curve on a price chart, a gentle, rounded dip, followed by a fierce downward pull. Most traders ignore it, branding it as ‘market noise.’ but this price formation offers a powerful and precise opportunity to capture big move profits before they happen.
Why does this strange teacup-like formation so often lead to explosive price moves and remarkable gains?
Is it just a storm in a teacup that boils over into a breakout? Or could it be due to crowd psychology, human behaviour,the rhythm of the market or is it a pretty shape with a hidden magic portion?
What makes the cup and handle pattern one of the most precise, powerful, reliable, and consistent profit-making patterns in technical analysis?
In this article, we’ll take a deep dive into:
i. The step-by-step strategy implementation; ii. Alternative ways to use the pattern for profits; iii. Tips to improve the probability of success; and iv. Real-world case studies that illustrate its power.
Next time you take a sip of your afternoon tea, consider whether this might just help you to lock in some precise profit moves.
If this work inspires you to start using the cup and handle pattern, drop me an email - I would love to hear about it.
If you haven’t tried it before, I encourage you to give it a go, and you might just capture the next big move in your favourite market before it happens!
Here is how to implement the Cup and handle strategy for profits.
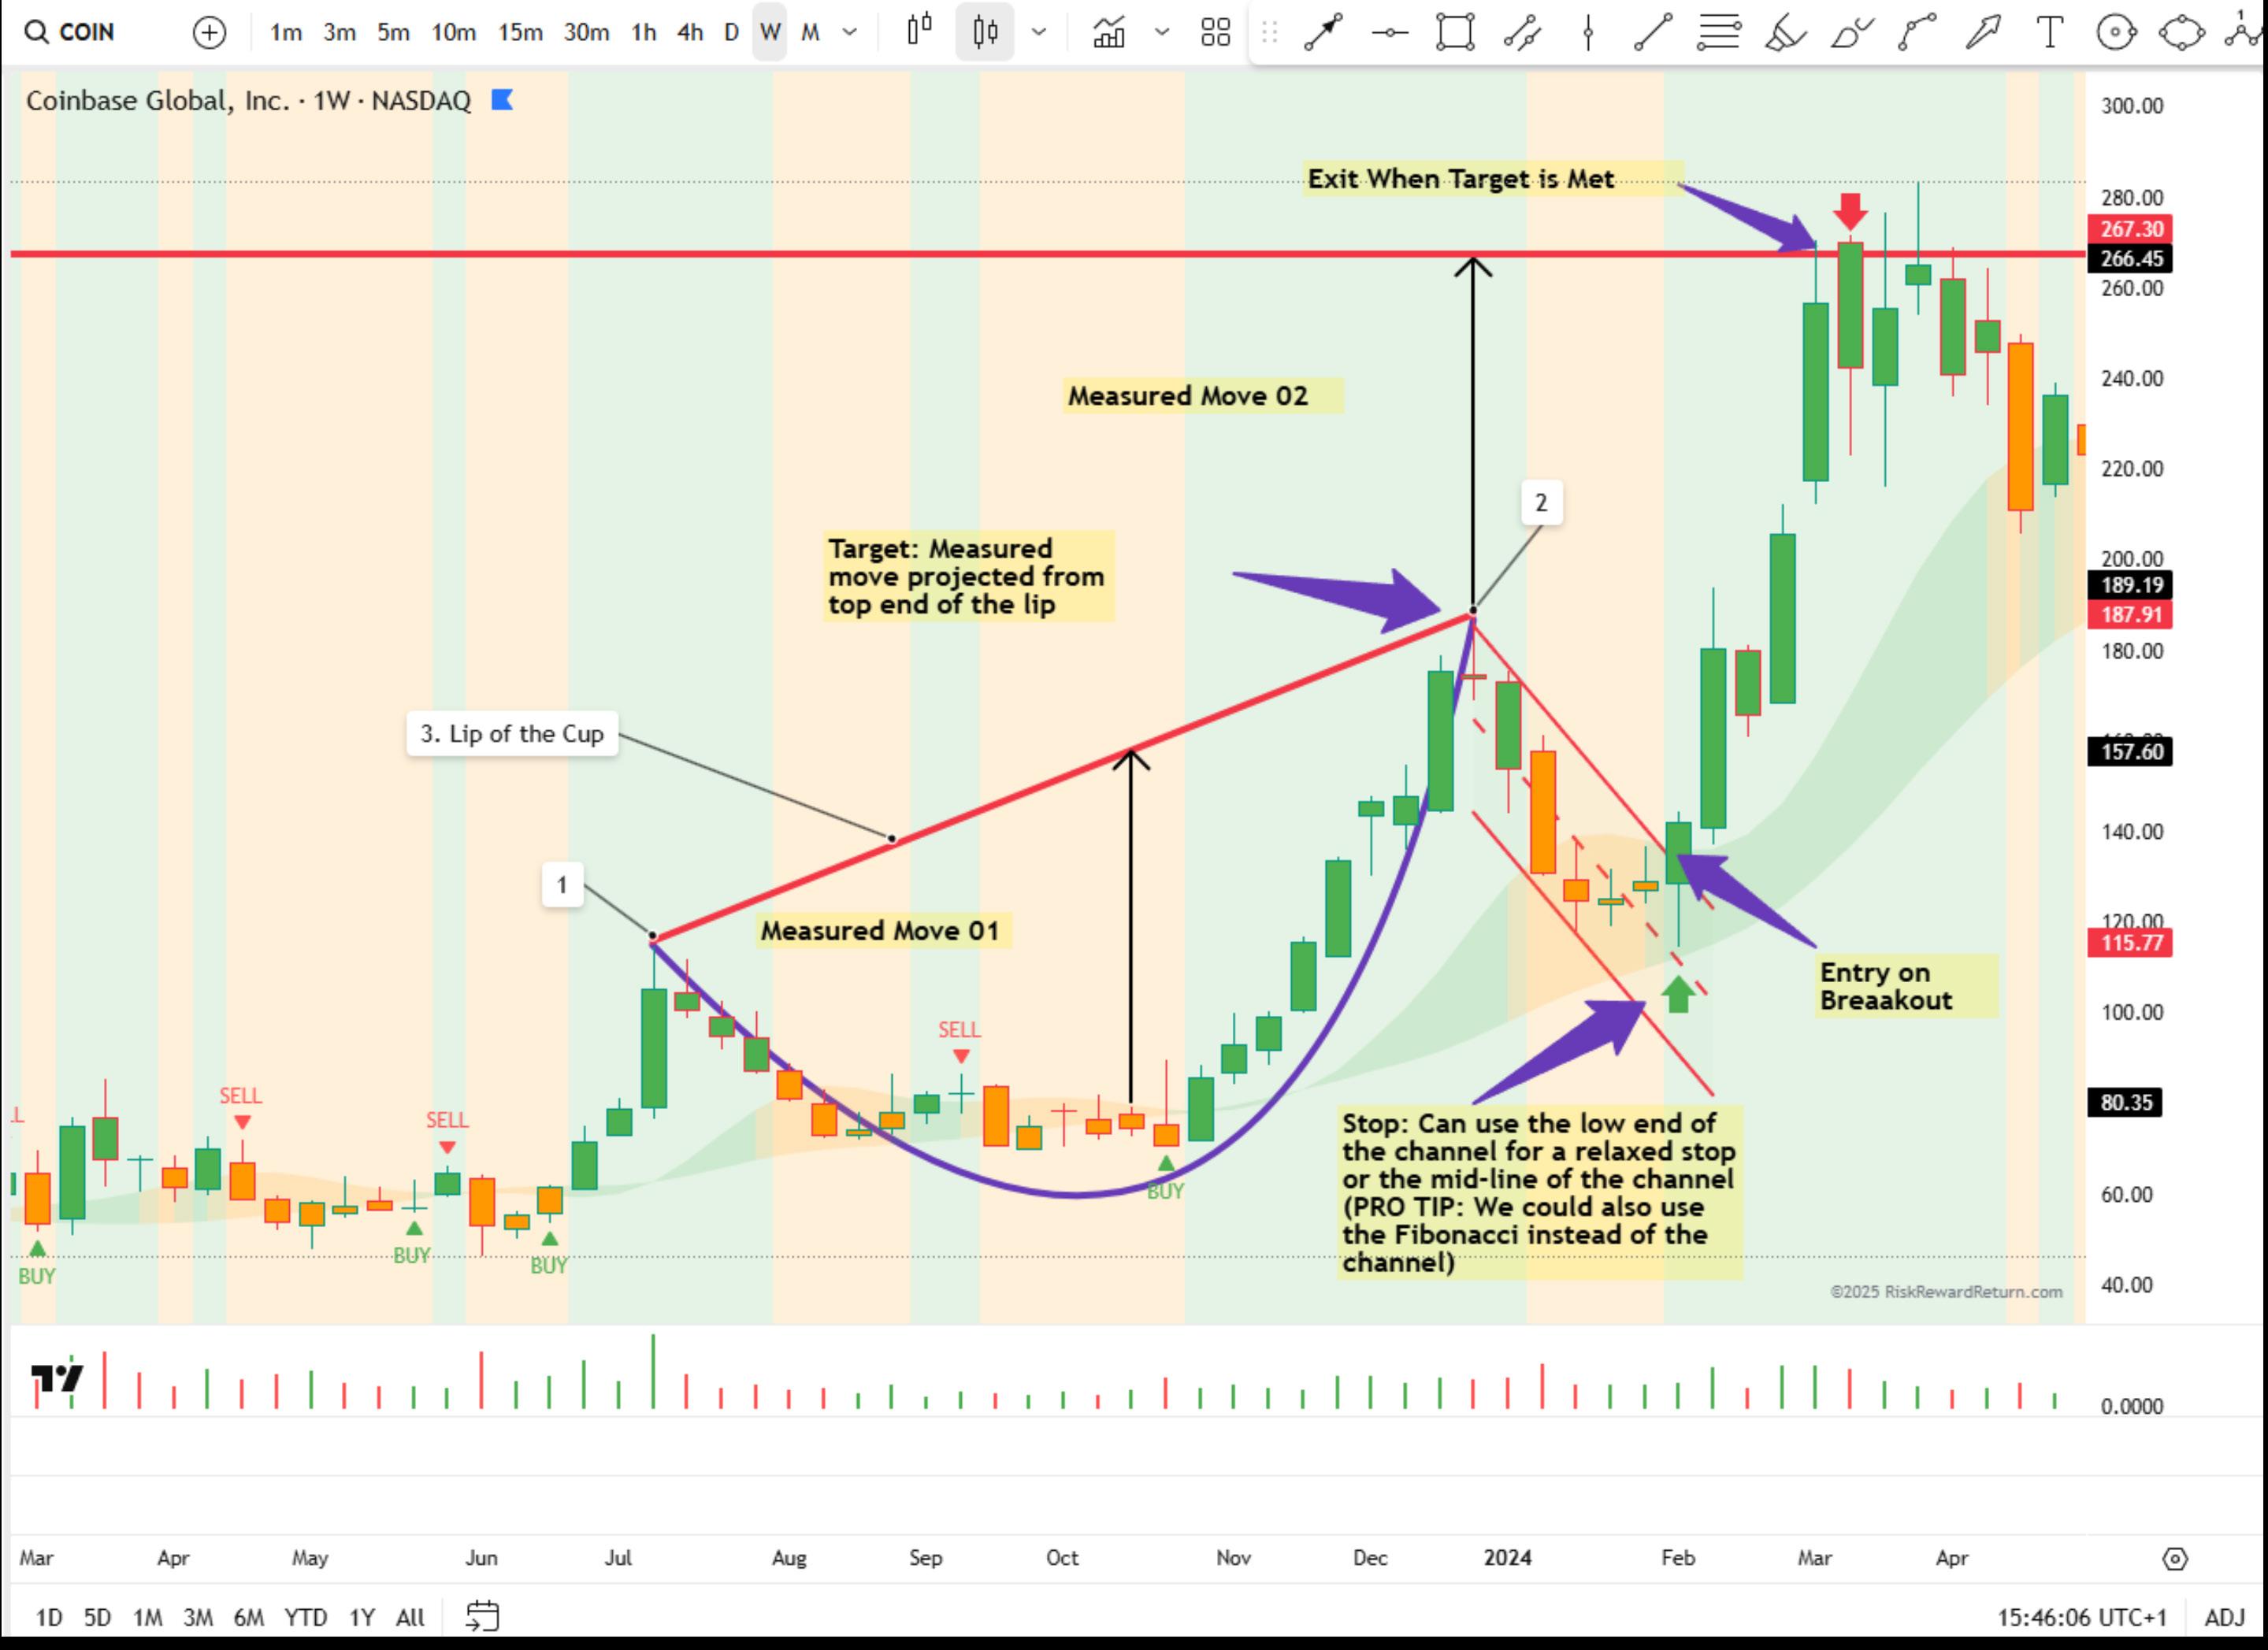
• Identify the low end of the cup (marked as ‘1’ on the chart)
• Identify the high end of the cup (marked as ‘2’ on the chart)
• Join points ‘1’ and ‘2’, we get the Lip of the cup (marked as ‘3’, the red line)
• Join points ‘1’ and ‘2’ with the cup using a curved line (marked in purple)
• Get Measured move 01, from the lip to the lowest point (approximately)
• Project the Measured move from high lip node ‘2’ to get Measured move 02
• Draw a parallel channel from node 2 to the low-price pivot
• Enter the trade when the price breaks above the channel
• Take profits when the Measured move 02 is hit
• For stops, you can use either the bottom of the channel or the mid-level of the parallel channel
• PRO TIP: You could also use Fibonacci and volume for identifying stops!
The psychological and behavioural patterns of the traders are unique during the Cup and Handle price pattern formation. This can be seen repeating itself and applies to all time-frame. During the Cup and Handle formation, the psychology goes through the three phases of Fear, Greed, and Confirmation Bias. We can see it in greater detail as follows:
• The lower end of the cup starts with ‘Fear’.
• During the cup, the ‘Fear slowly but surely turns into optimism'.
• During the handle, ‘Doubt creeps in, weak hands are shaken out’.
• During the breakout, ‘Euphoria sets in and momentum builds'.
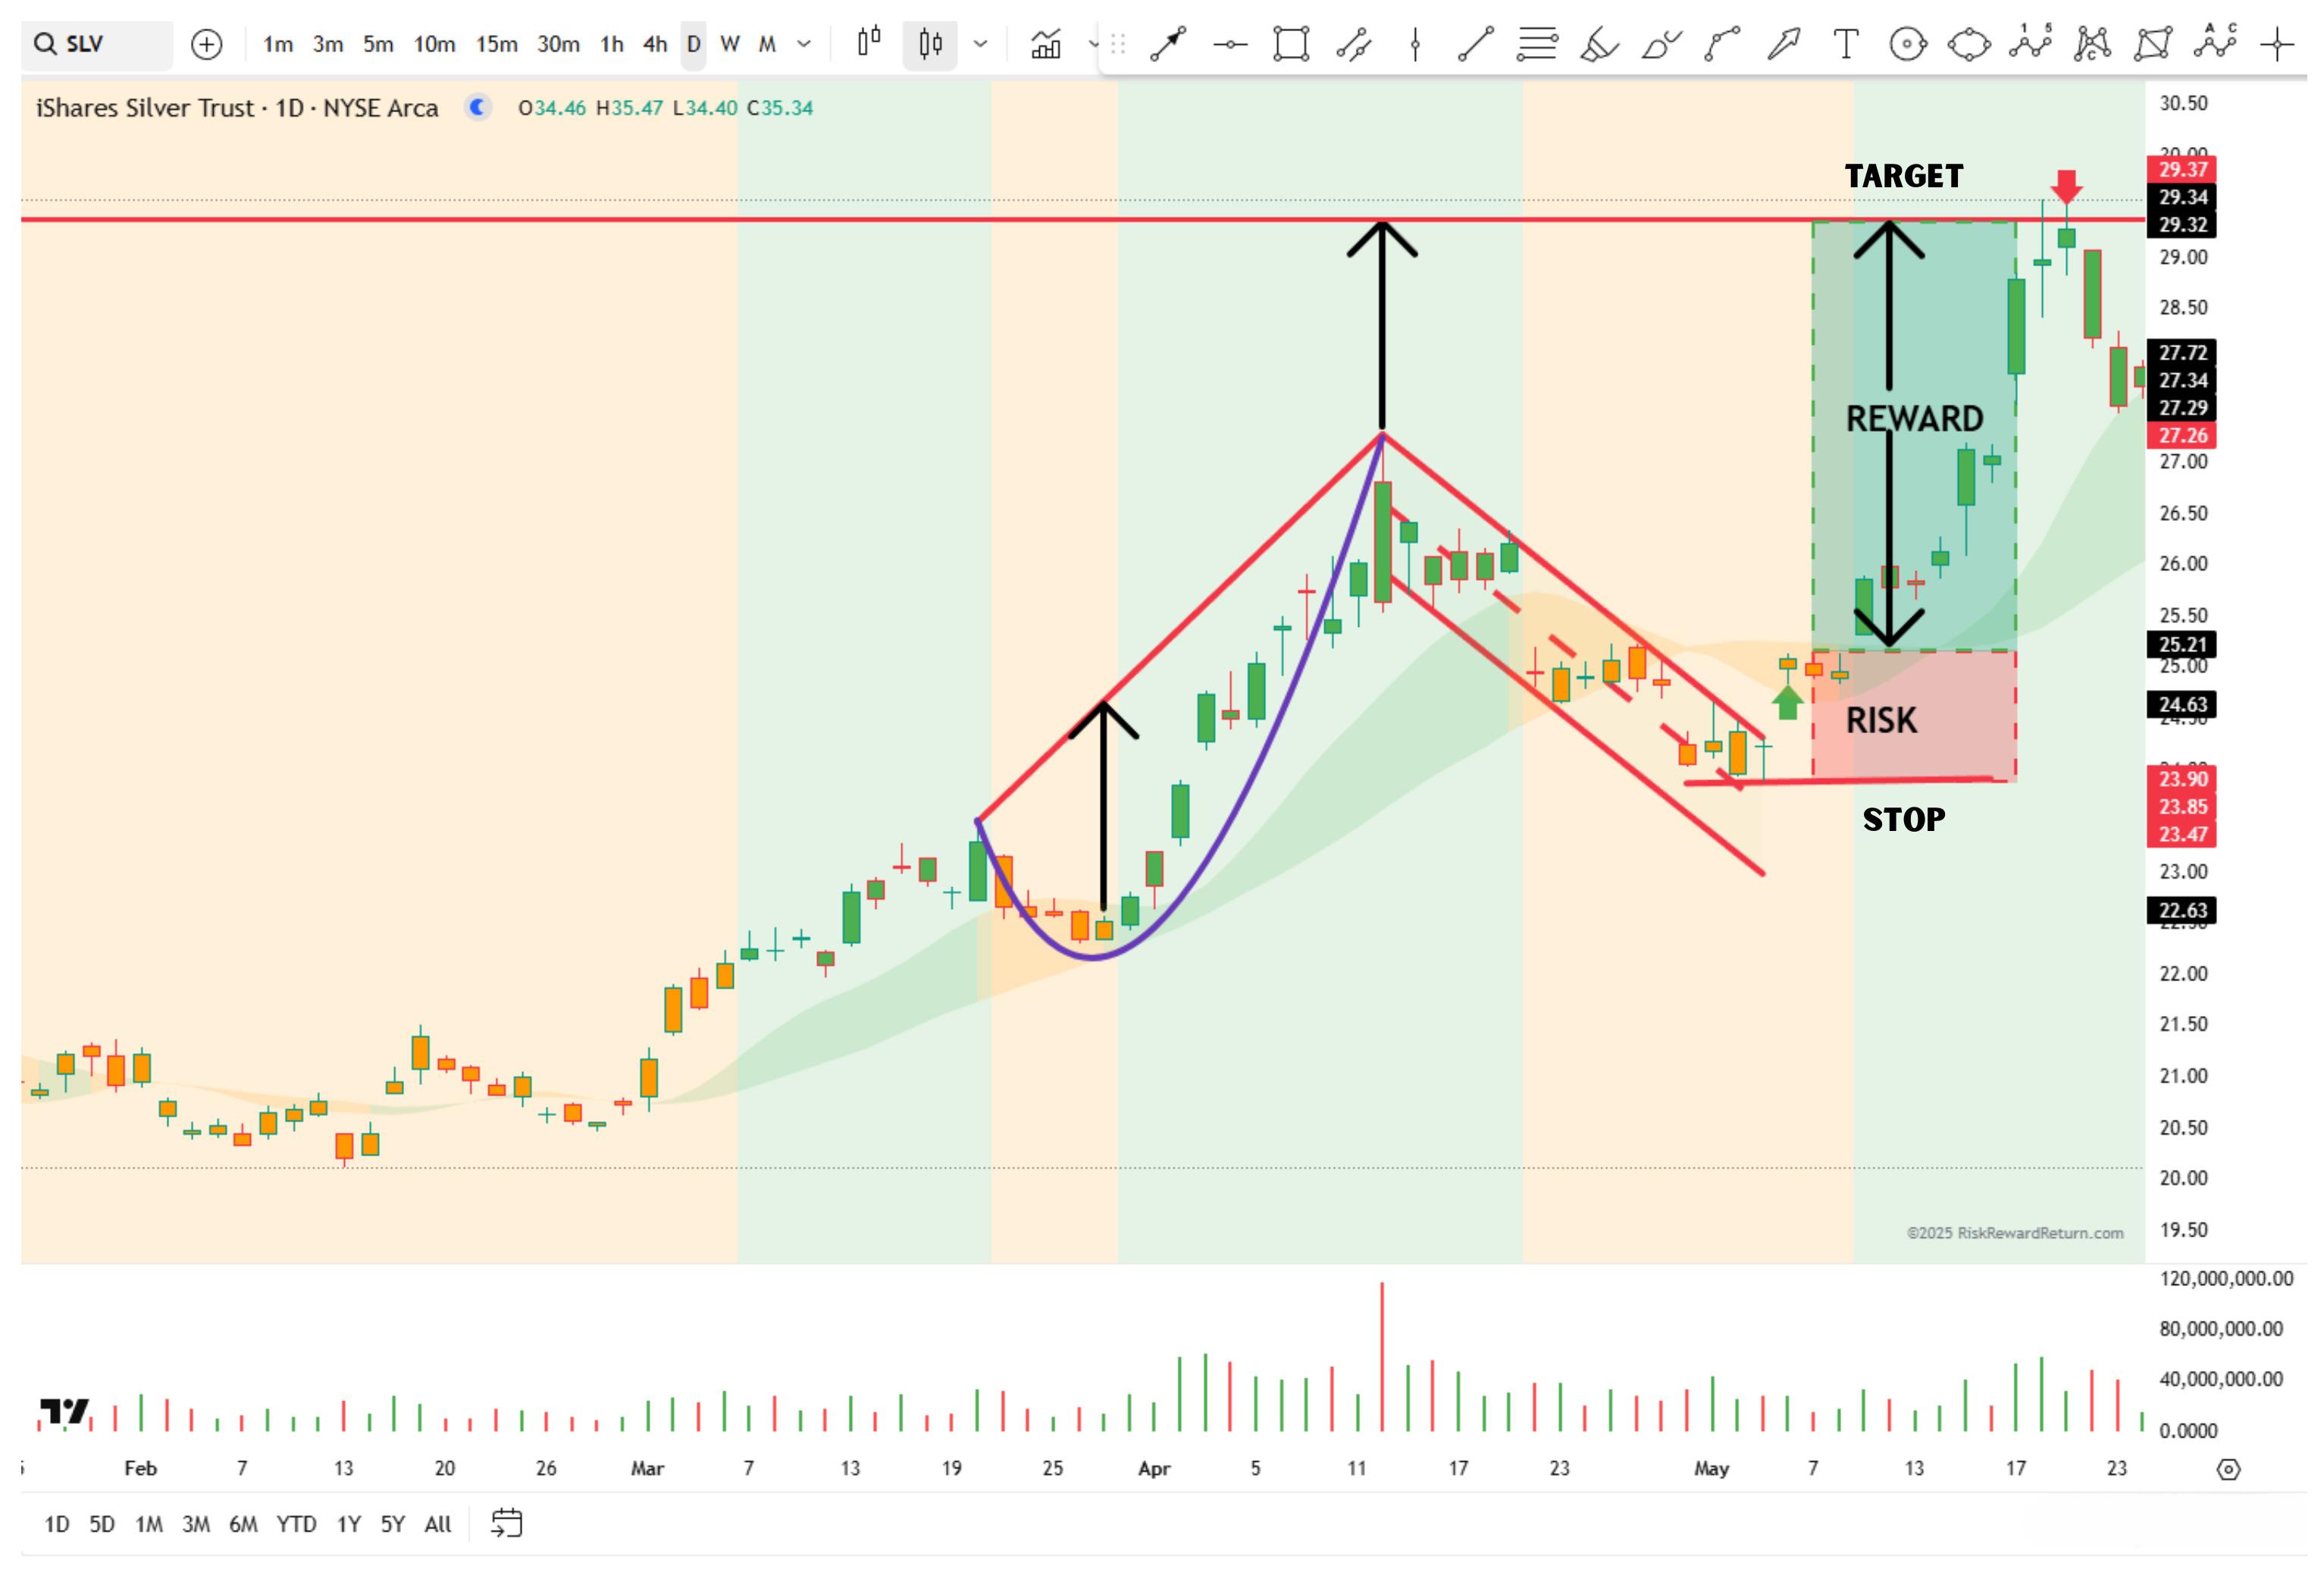
Below is a commodity trade example: iShares Silver Trust (NYSE: SLV). This is a demonstration of the explosive profits that a Cup and Handle pattern can capture.
If you observe the daily chart of SLV, this is a high-probability price breakout with a precise profit target. The reward is multiple times greater than the risk in the trade. The entry is triggered by the breakout of the parallel channel, the stop-loss is placed just below the channel, and the target is measured from the high point of the right lip of the cup.
A beautiful commodity trade.
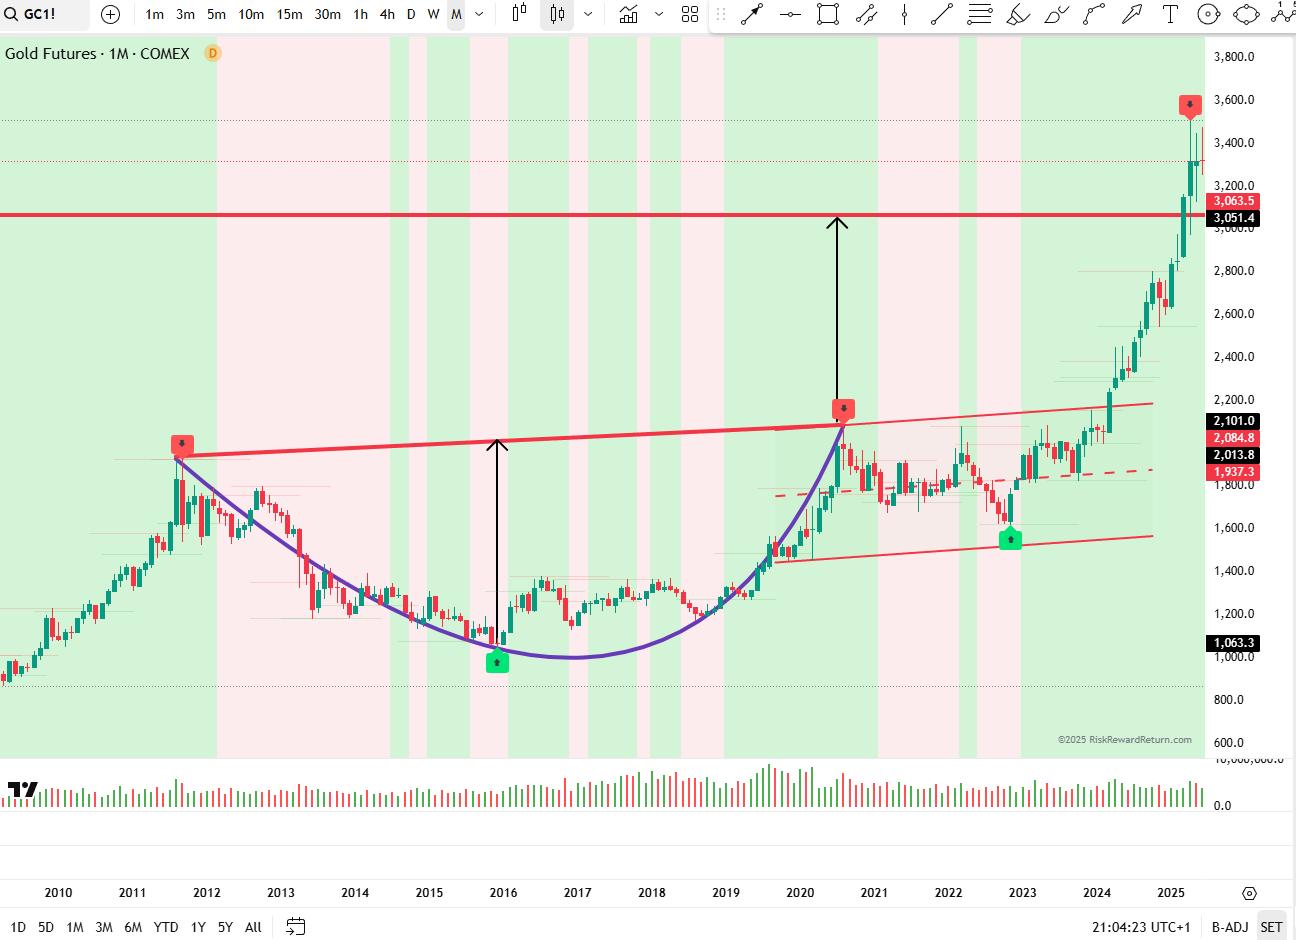
Below is another commodity trade example: Gold Futures (COMEX: GC1!) and anotherillustration of the explosive profits that a Cup and Handle pattern can capture.
Note the second green upward arrow around the $1600 level; this move resulted in an explosive breakout on the Monthly chart. This is not a move to laugh at or dismiss as market noise.
Since the chart we’re using is the Monthly timeframe, the move took some time to fully manifest but it ultimately met the target with precision
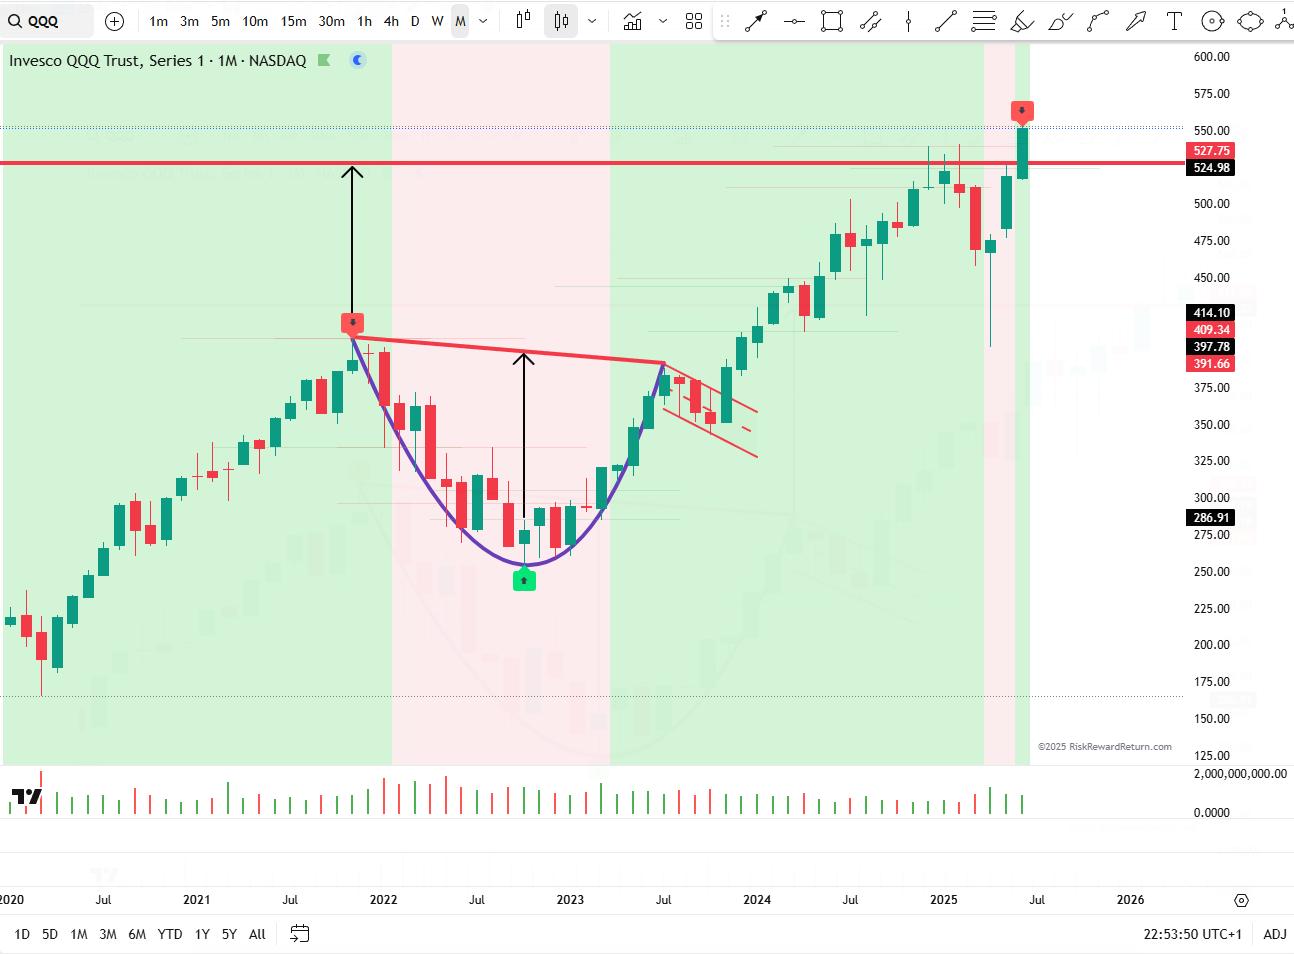
Here is the Monthly chart of QQQ (NASDAQ: QQQ). We can see that the Cup and Handle target has been met. The entry was triggered by the breakout from the parallel channel and the measured move was comfortably achieved.
Remember that the target should be measured from the high point of the lip of the cup. In this case, that high point is on the left side of the cup (see the exact projection starting point from the left lip).
Had we measured the target from the right lip, we would have underestimated the potential move and left a significant amount of profit on the table. This is why it is essential to always project the measured target from the highest point of the cup’s lip.
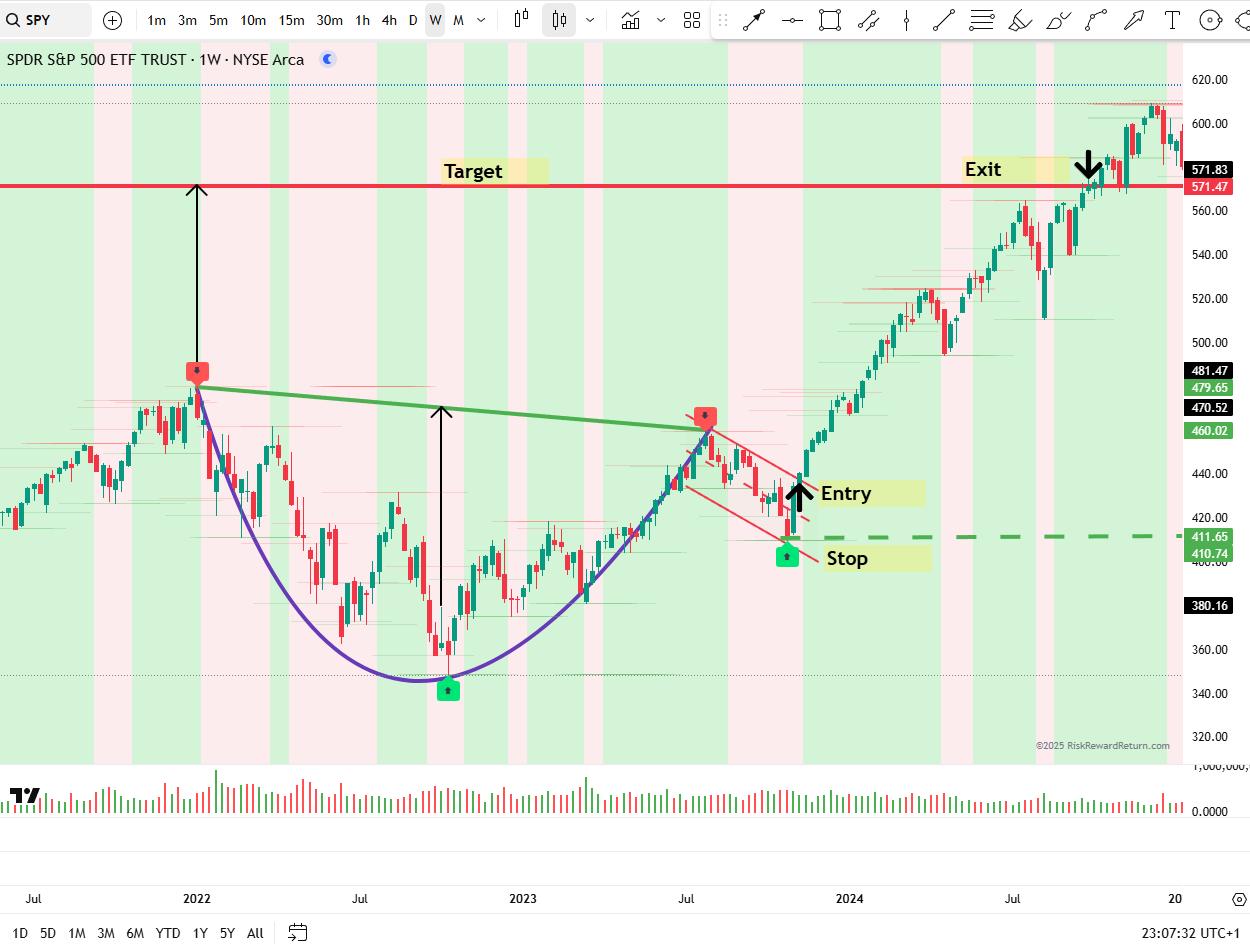
Here is the Weekly chart of the S&P 500 ETF. We can see that the Cup and Handle target has been met. The entry point was triggered by the breakout from the parallel channel (marked by the black upward arrow) and the measured move was comfortably achieved.
As with the QQQ example, it’s important to remember that the target should be measured from the high point of the cup’s lip In this case, that point is on the left side of the cup (see the exact projection starting point from the high side of the formation).
Had we measured the target from the right lip, we would have significantly underestimated the move and left substantial profits on the table. This reinforces a key rule: always project the measured target from the highest point of the cup’s lip
Here is a four-hour intraday chart of the Bitcoin/U.S.Dollar (BTCUSD). We can see that the Cup and Handle price pattern worked very well, even on a four-hour BTCUSD chart.
Again, it is important to remember that the target should be measured from the high point of the cup’s lip. In this case, that point is on the left side of the cup (see the exact projection starting point from the high side of the formation).
Entry in this case is the break of theHandle to the upside (channel breakout to the upside). Stop below the last pivot price. The target is the measured move from the bottom of the cup to the top of the lip.
The rules remain the same, whether it is Commodity, Forex, Stock, Index, Bitcoin, Crypto, Bonds, or any other asset class.

Here are two simple mindset hacks that can help you get better results. Exercise patience during the Cup and Handle formation and have the courage to join the price rally at the time of breakout.
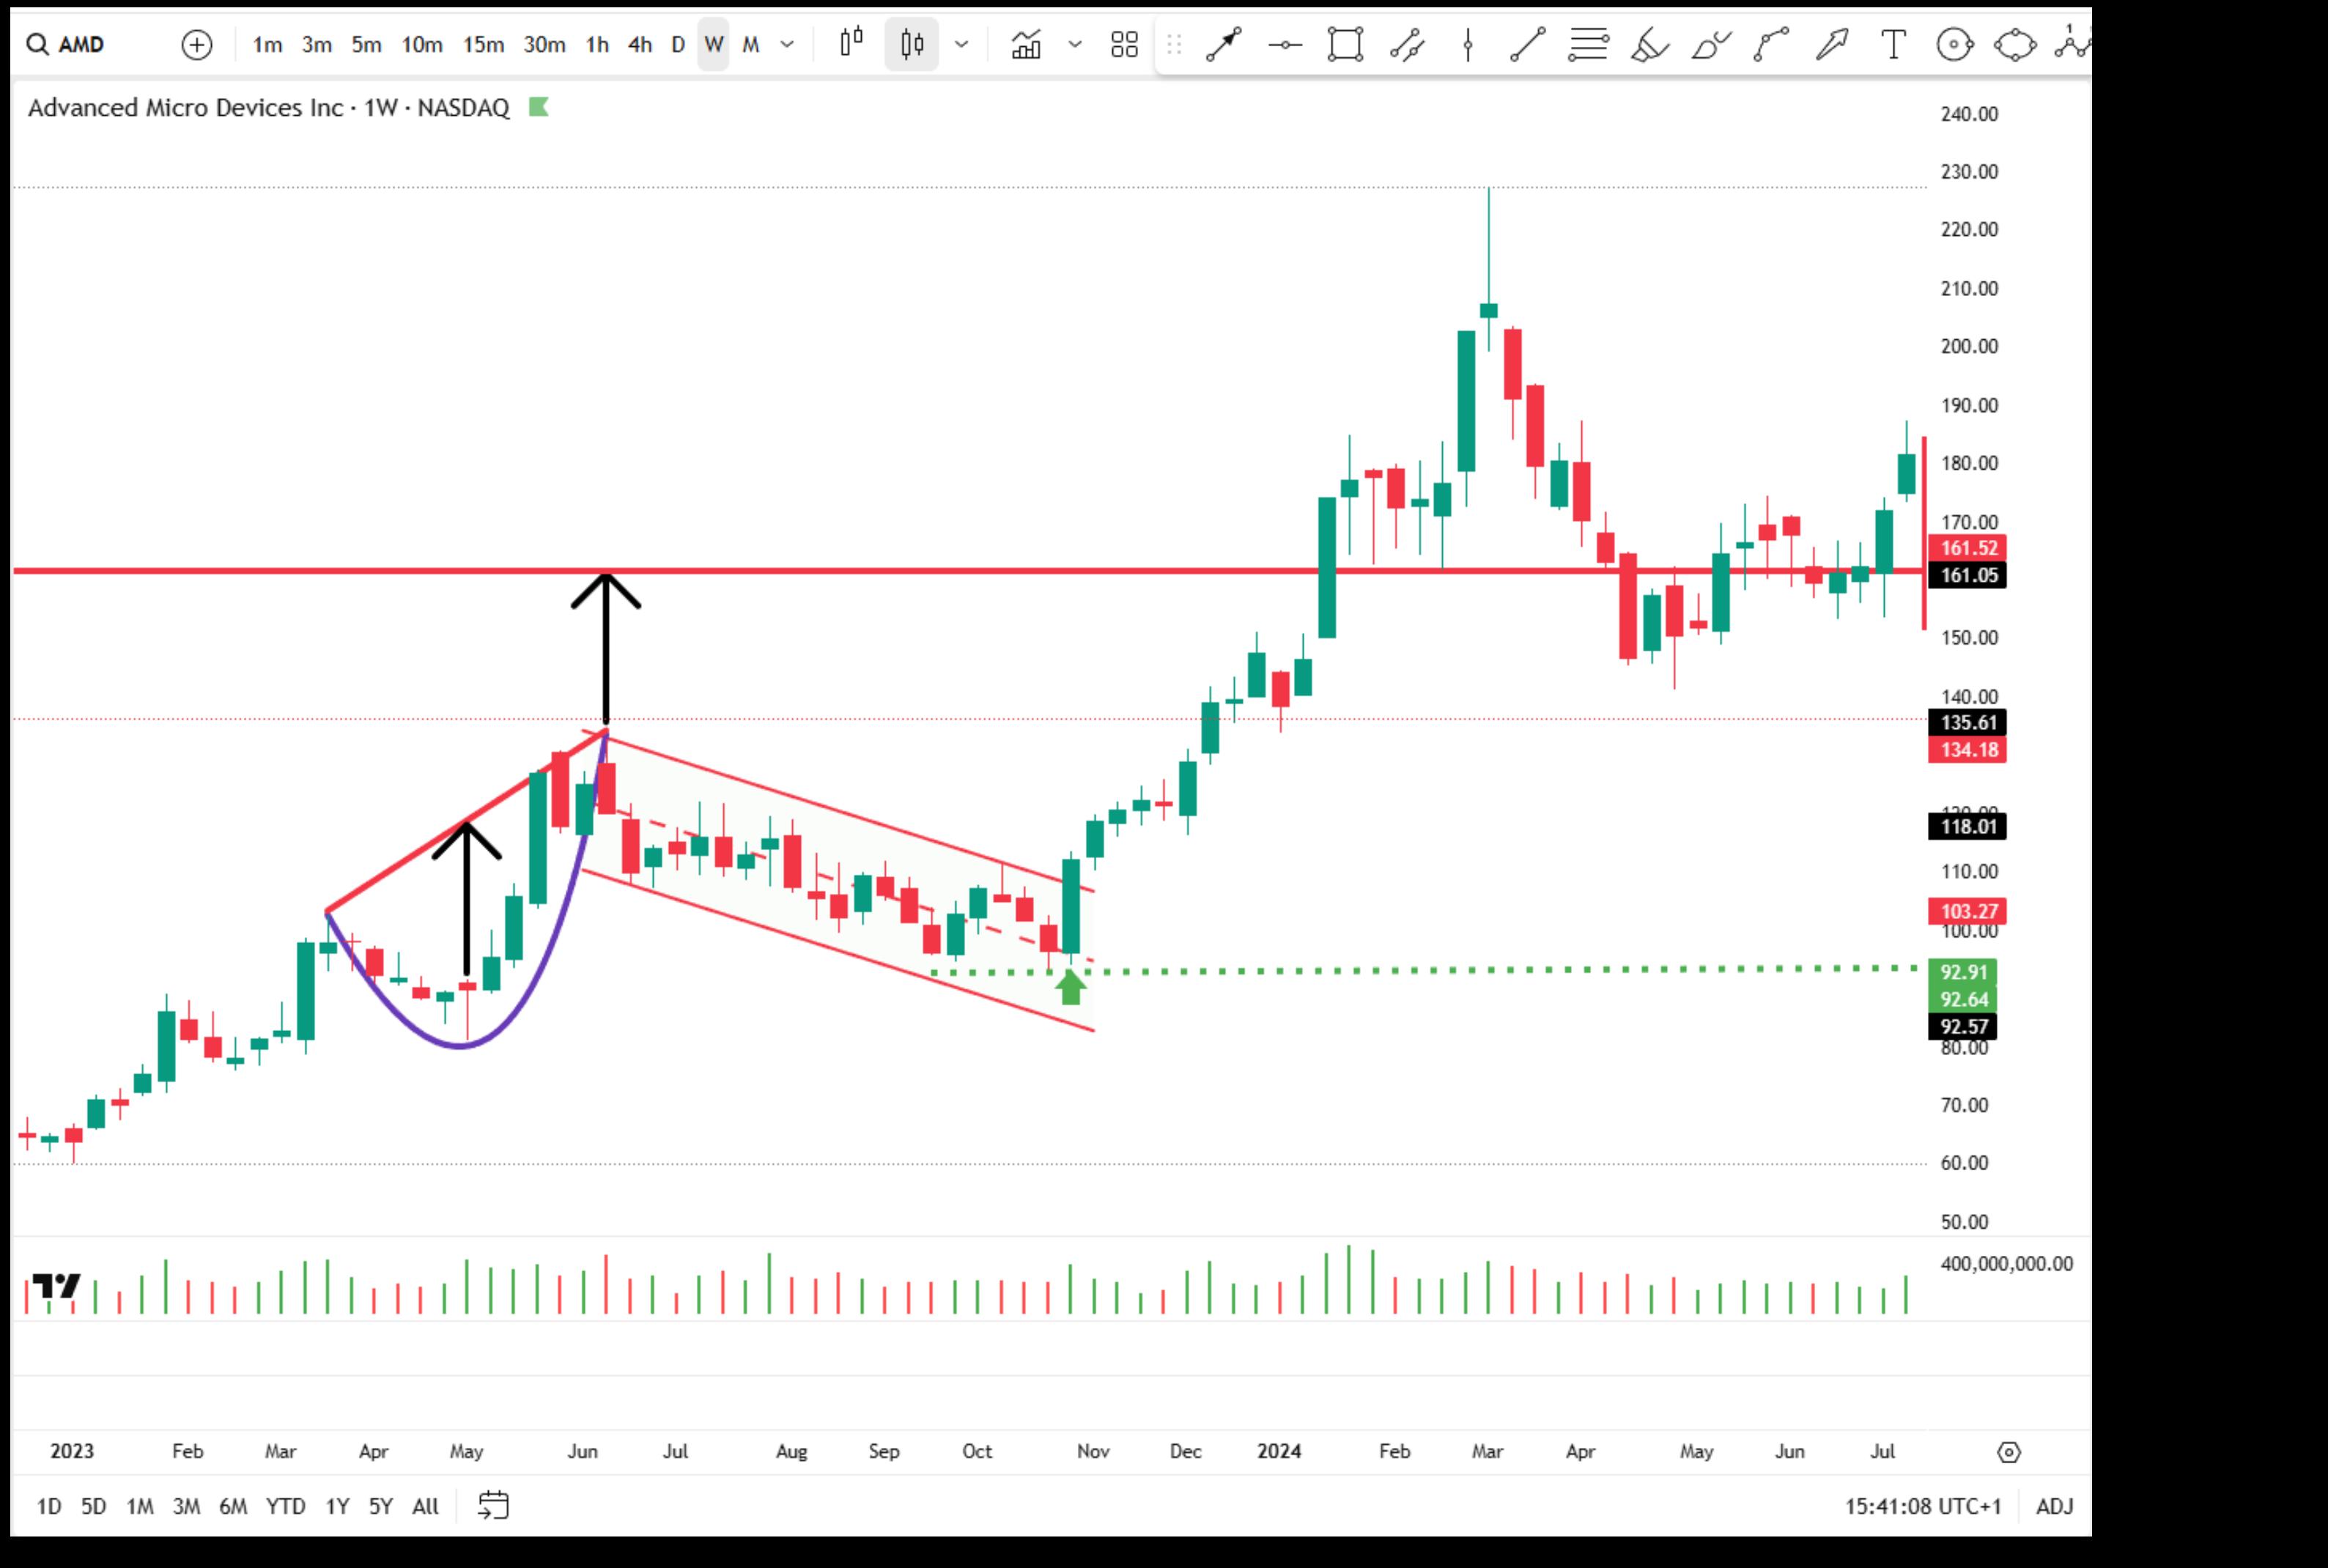
Traders were wrongly led to believe that Cup and Handle patterns work only in bull markets. Our research found this to be untrue. Traders were made to believe that this pattern works only with large-cap stocks. This is untrue. Cup and Handle works on all timeframes and works on all asset classes.
This is a simple variation which has been working very well for the past 4 years. In this variation, wait until the price breaks out of the handle range and use that as an entry (identified by the up arrow in the AMD – Applied Micro Devices chart). The target is the highest lip end of the cup (marked by the dotted line towards the top of the price chart). The stop is below the lower end of the handle, price pivot. Simple yes: but it makes money and works well consistently.
While the Cup and Handle pattern is a powerful and elegant setup for capturing big-move profits, it is important to note that if the handle pullback is as deep as, or deeper than, the cup itself, the trade should be avoided.
While the Cup and Handle pattern alone is sufficient to determine entries and exits, you can further enhance your precision and confidence by combining it with tools such as Volume, Ichimoku or Fibonacci. Using these in conjunction with the Cup and Handle pattern can help you identify high-probability and well-timed entries and exits with greater accuracy.
Disclaimer: All forms of investing and trading involve risk; asset classes mentioned here are not a recommendation to buy or sell.
The Cup and Handle pattern is not a myth. It works consistently across all chart timeframes and in all types of markets However, it is important to remind ourselves that success doesn’t come from recognizing the pattern alone. To truly benefit from its potential, one must also master the discipline and strategy behind it.
Learn more about price pattern profits

Karen Jones is Vice Chair, Treasurer and Content Editor for the STA. She was formerly Managing Director and Head of FICC Technical Analysis Research at Commerzbank Corporates and Markets.
“We argue that technical analysis, when applied judiciously and in conjunction with behavioural finance insights, offers a valid and valuable approach to market analysis.”
KAREN JONES
The Efficient Market Hypothesis (EMH) has long been a cornerstone of modern financial theory, asserting that asset prices fully reflect all available information. According to EMH, technical analysis is futile, as price movements are essentially random and unforecastable.
This article challenges that assertion by critically examining the assumptions underlying EMH, empirical anomalies in financial markets, and the evolving nature of market dynamics. We argue that technical analysis, when applied judiciously and in conjunction with behavioural finance insights, offers a valid and valuable approach to market analysis.
The EMH, particularly in its strong and semi-strong forms, posits that market prices instantly incorporate all available information, rendering any attempt to outperform the market through analysis redundant. This theoretical position has led many academics to dismiss technical analysis as pseudoscientific. However, real-world market behaviour frequently contradicts EMH assumptions, suggesting room for alternative analytical frameworks.
One of the most well-documented violations of EMH is the Momentum Effect Stocks that have performed well in the past 3 to 12 months can continue performing well in the near future while underperformers continue lagging. This phenomenon directly contradicts the central EMH premise that all known information is instantly reflected in stock prices and that past price movements cannot predict future returns.
Seminal research by Jegadeesh and Titman (1993) demonstrated that momentumbased strategies yielded returns well beyond what could be explained by riskbased models. Subsequent studies confirmed these findings across various markets and time periods, suggesting that behavioural factors like investor overreaction and underreaction play a significant role - these factors are not accounted for by EMH.
EMH rests on several key assumptions:
i. rational behaviour among investors; ii. homogeneous expectations; and iiii. instantaneous information dissemination.
However, these assumptions have been increasingly scrutinised. Behavioural finance has shown that investors often act irrationally due to cognitive biases,
herd behaviour and emotional influences. Additionally, information asymmetry and latency in dissemination challenge the notion of perfect markets.
Here is a strong example that illustrates the irrationality of investors and the limitations of EMH due to behavioural and informational factors:
During the late 1990s, investor enthusiasm for internetbased companies led to a massive speculative bubble in technology stocks. Many companies with little to no earnings - and sometimes not even viable business models - saw their stock prices soar simply due to market hype and herd behaviour.
Behavioural finance explains this through cognitive biases such as over-confidence, confirmation bias and herding (where investors mimic the actions of others, assuming the crowd must be right). Emotional drivers like fear of missing out (FOMO) further fuelled irrational investment decisions.
At the same time, information asymmetry and latency in understanding the real value of these companies allowed prices to detach dramatically from fundamentals. The eventual market crash in 2000 revealed how inefficient the market had been, directly undermining the EMH assumption that prices always reflect all relevant information rationally and instantaneously.
Numerous market anomalies contradict EMH. These include momentum effects, mean reversion, seasonal patterns (e.g., the January effect) and technical chart patterns that persist over time. Studies have shown that strategies based on moving averages, relative strength and breakout signals can yield statistically significant returns.
Rather than being a futile exercise, technical analysis can be viewed as a method for interpreting collective investor psychology. Patterns such as support and resistance levels, head-and-shoulders formations and volume trends often reflect underlying sentiment and decision-making heuristics. Technical tools, therefore, provide insight into market psychology that cannot be captured by purely fundamental or informational metrics.
Andrew Lo's Adaptive Market Hypothesis (AMH) presents a more nuanced view, suggesting that market efficiency is not static but evolves over time based on competition, adaptation and innovation. This framework accommodates periods of inefficiency which is where technical analysis can be particularly effective and advancements in
machine learning and algorithmic trading only enhance the sophistication and efficacy of technical strategies.
During my tenure as a professional technical analyst, I observed behavioural patterns on the trading floor that consistently contradicted the assumptions of the Efficient Market Hypothesis. There were frequent periods when nearly every trader held the same directional position on a particular asset—an alignment that, to me, signalled a potential reversal point. The logic was simple: if the majority of participants were already long, the question becamewho was left to buy?
These consensus-driven positions were not purely the result of objective analysis. Traders would openly discuss their positions. When someone held a contrarian view, they often faced subtle peer pressure to conform. There was a palpable social dynamic at play, driven by performance anxiety and the imperative to avoid losses. Traders are evaluated primarily on profit and loss. Fear of underperformance and the ego associated with being on the “winning side” led many to abandon their convictions in favour of the crowd.
I noticed that these behavioural cues became even more pronounced as price approached key technical levels. The alignment of sentiment and positioning at these junctures often preceded sharp reversals. Over time, I systematised

this observation into what I termed a “reversal watch” framework, integrating chart analysis with behavioural finance principles. This approach - grounded in both technical patterns and the psychological context of the market - provided a reliable contrarian indicator, highlighting the limitations of EMH in accounting for human behaviour.
This real-world experience aligns with criticisms of EMH from some of the most successful investors of our time. Warren Buffett and Charlie Munger, for example, have long been sceptical of EMH.
Buffett has noted that while the theory suggests consistent outperformance is impossible, his own success - and that of his mentor Benjamin Graham - offers strong evidence to the contrary. In a public discussion, Buffett compared the persistence of EMH in academia to believing “the world is flat” while running a merchant shipping business. “If all of your competitors believe the world is flat,” he quipped, “you have a huge edge.”
Munger added that the academic contamination from EMH has been “massive,” though he acknowledged that it is waning. He criticised the reluctance of economists to revise their theories when confronted with contradictory evidence, likening the dismissive term “anomaly” to rejecting inconvenient truths rather than re-examining flawed premises. In his view, the enduring belief in EMH despite overwhelming empirical refutation is more a product of intellectual inertia than robust scientific reasoning.
Notably, Munger once mocked a leading proponent of
EMH who tried to explain Buffett’s success as a six-sigma event of pure luck—statistically improbable to the point of absurdity. As Buffett’s consistent performance continued, the theorist shifted to calling it “six or seven sigma's of skill,” underscoring the lengths to which EMH defenders go to preserve the theory in the face of mounting contradictions.
These insights reinforce a crucial point: markets are neither fully rational nor perfectly efficient. Behavioural biases, crowd dynamics, and psychological influences all play roles in shaping price movements—factors that technical analysis can help interpret when used with discipline and insight
While EMH offers a valuable baseline for understanding market dynamics, its assumptions do not consistently hold in practice. Technical analysis, far from being a relic of pre-modern finance, provides a flexible and empirically grounded framework for navigating market complexity. By integrating technical analysis with behavioural and adaptive insights, investors can develop more robust strategies that acknowledge the nuanced reality of financial markets.

PRIYA MITTAL
Priya is a financial mathematician and research scholar at the Delhi Institute of Technology, specializing in convolutional neural networks.
“We crunched the numbers across 40 years and 127 million bars.”
PRIYA MITTAL & SASHA MEDIN

Sasha is the creator of several data projects and the author of the statistical YouTube channel Data is Beautiful. He is also a hobbyist algorithmic trader.
We crunched the numbers across 40 years and 127 million bars.
This publication is the first in a series of studies we are conducting on the effectiveness of technical analysis in market trading. The next instalment will focus on the most commonly used technical indicators and the seasonality of market regimes.
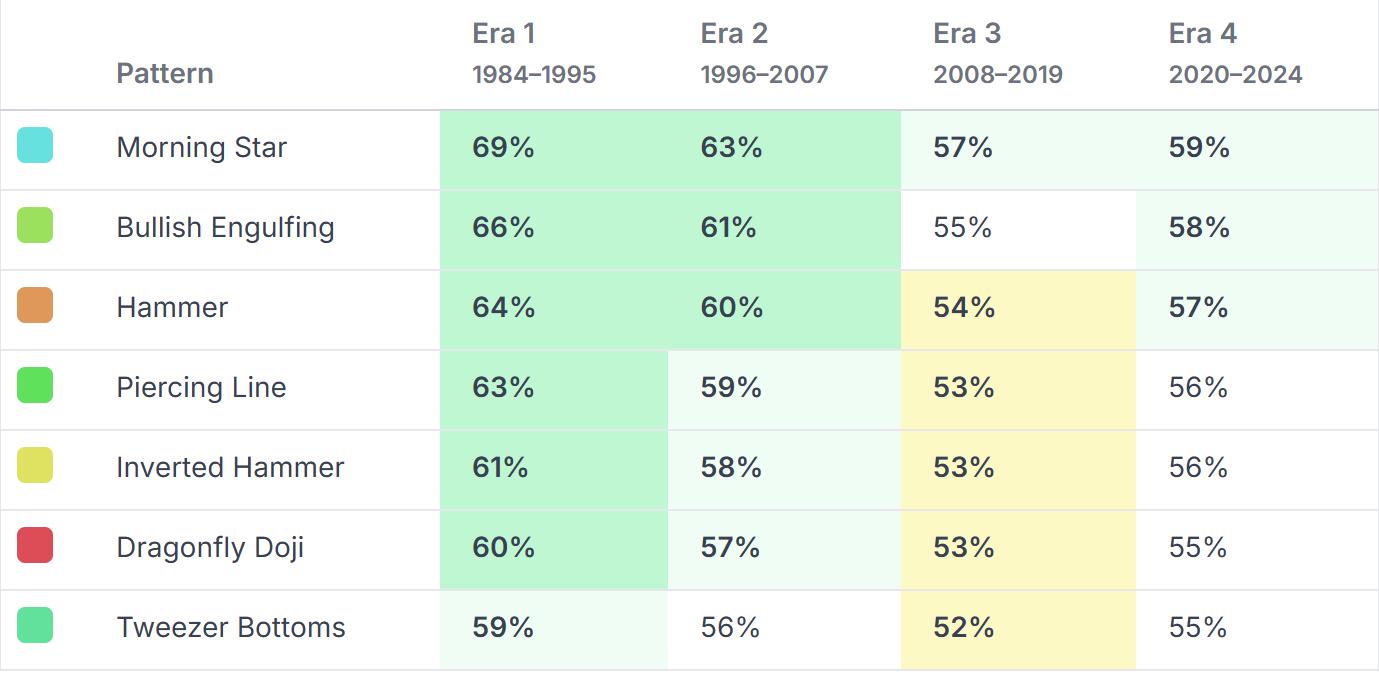
We all know the classic candlestick patterns: the Hammer, the Doji, and the Engulfing patterns. They're staples of technical analysis, found in countless books and tutorials.
But here's a question we kept asking ourselves: do they actually work as well today as they did ten or twenty years ago? The market landscape has shifted dramatically. We've seen the rise of high-frequency trading, seismic shifts in retail participation, near-zero interest rates, meme stock frenzies and global crises.
It felt intuitive that signals which worked reliably in, say, 1998 might behave differently in 2025. Gut feelings aren't enough, though. So we decided to measure it.
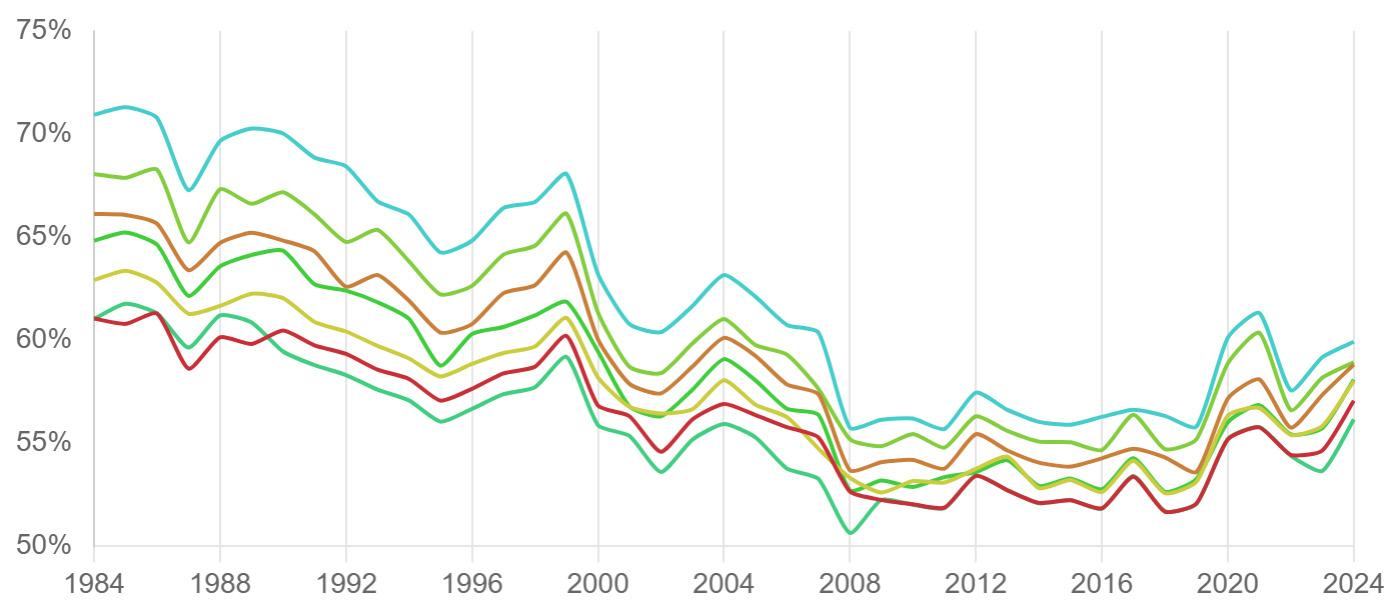
To quantify this evolution, we compared pattern effectiveness across four distinct market eras.
We defined four key periods:
Discovery and Early Adoption (Era 1): 1984 - 1995 Candlestick charting, while ancient in Japan, was being actively "discovered" and popularized in the West.
Democratization and Early Exploitation (Era 2): 1996 - 2007
The rise of the internet and online brokerages.
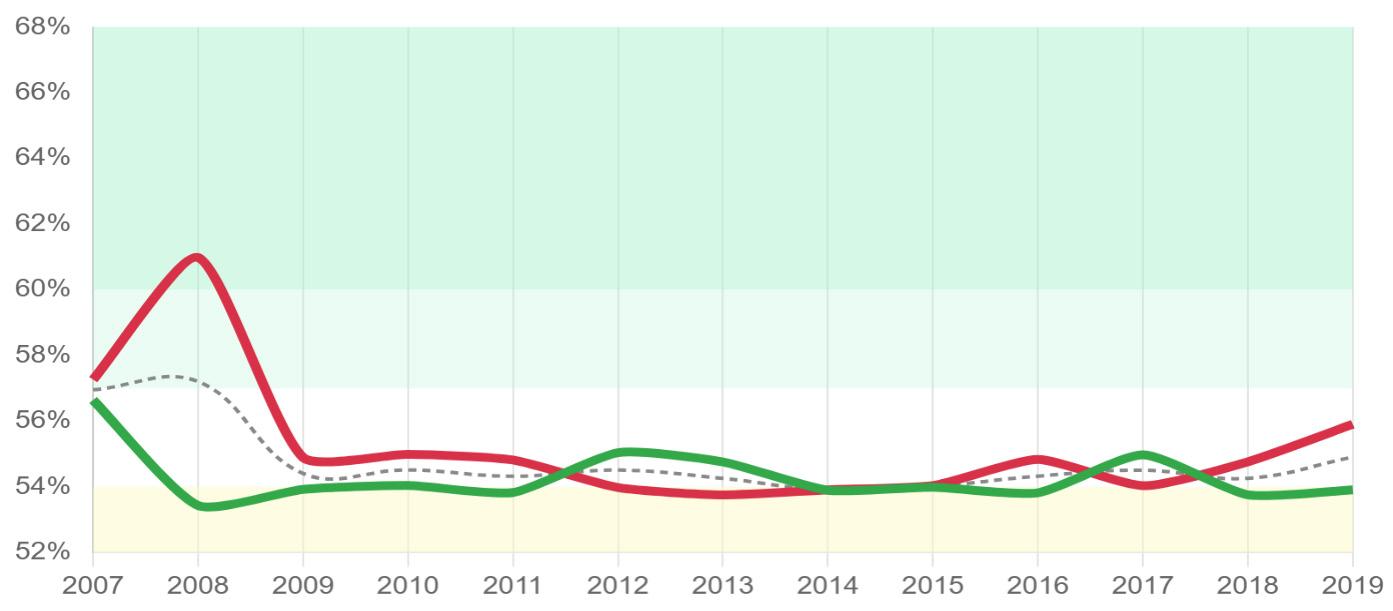
Algorithmic Dominance and Efficiency (Era 3): 2008 - 2019
Post-GFC, High-Frequency Trading (HFT) and sophisticated algorithmic strategies became dominant market forces.
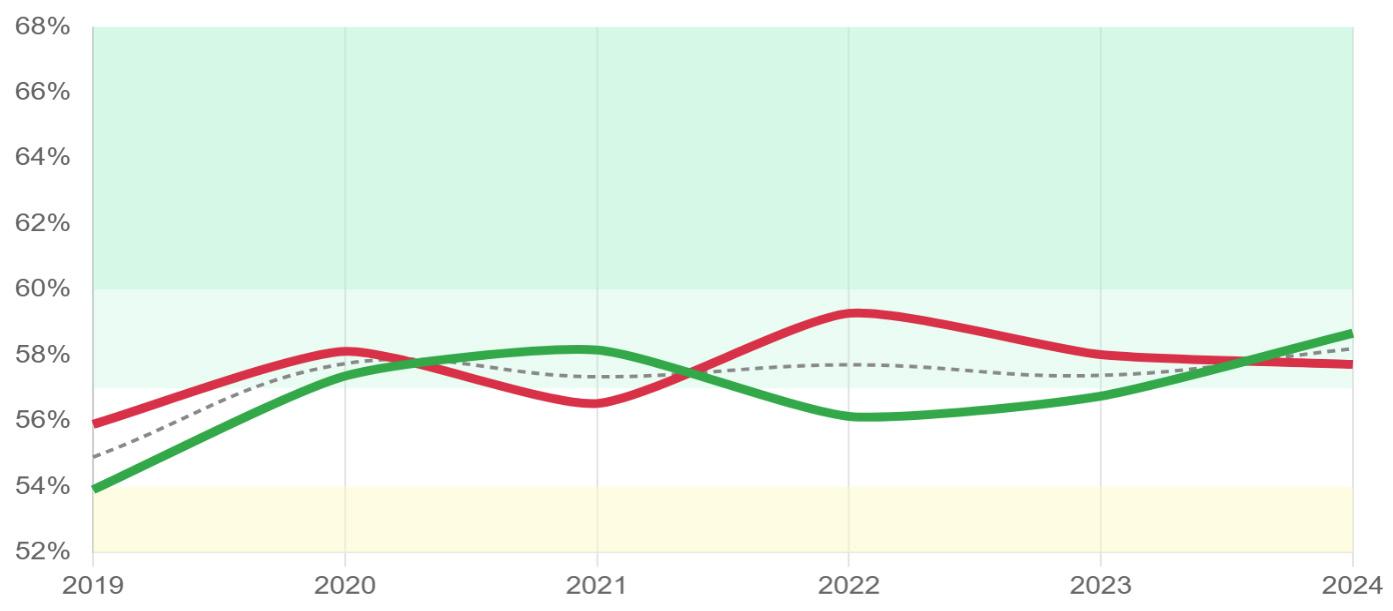
Volatility, Retail Resurgence, and Complexity (Era 4): 2020 - 2024
The COVID-19 pandemic triggered extreme volatility and a massive influx of new retail traders.
The Era of Discovery and Early Adoption (1984 - 1995)
Context: Candlestick charting, while ancient in Japan, was being actively "discovered" and popularized in the West (e.g., Steve Nison's books). Personal computers were becoming more common but real-time charting software wasn't ubiquitous or cheap. Trading was still dominated by floor traders and institutions; retail access was limited and slower. Information flow was significantly slower than today. The 1987 crash likely spurred interest in any technical tools that might offer predictive power or risk management signals.
Hypothesized Candlestick Effectiveness: Relatively High. Patterns were novel to the Western market. Fewer participants were actively looking for them or programming algorithms to exploit them. Market movements were perhaps "cleaner" in terms of human emotional response reflected over the course of a candle's formation, without highfrequency noise. The "edge" from recognizing these patterns was likely more significant.
Key Event Influence: Introduction of PCs; early charting software; the 1987 Crash; Nison's popularization of candlesticks.
The Era of Democratization and Early Exploitation (1996 - 2007)
Context: The rise of the internet and online brokerages (E*TRADE, Schwab, etc.) dramatically increased retail participation (Dot-com boom). Charting software became widely available and affordable. Candlestick patterns became a staple of retail technical analysis education. Early algorithmic trading began to emerge, initially focused on arbitrage and execution but increasingly incorporating pattern recognition. Decimalisation in the US (2001) changed market microstructure, potentially affecting very short-term patterns.
Hypothesized Candlestick Effectiveness: Moderate but decreasing. Increased awareness meant more traders were acting on the same signals, potentially leading to self-fulfilling prophecies initially but also making them predictable targets ("stop hunts" above/below key patterns). Early algorithms could identify and trade simple patterns faster than most humans. The sheer volume of retail traders might have amplified noise. Effectiveness likely started to erode, especially for the most common patterns on liquid stocks.
Key Event Influence: Dot-com bubble & crash; rise of online brokers; widespread charting software; US decimalisation; and early algorithmic trading growth.
The Era of Algorithmic Dominance and Efficiency (2008 - 2019)
Context: Post-GFC, High-Frequency Trading (HFT) and sophisticated algorithmic strategies became dominant market forces. Information velocity reached near light speed. Quantitative funds systematically mined data for any edge, including basic technical patterns. Regulatory changes (e.g., Reg NMS fully implemented) solidified electronic market structures. Central bank interventions (QE) often led to periods of suppressed volatility, potentially reducing the frequency or clarity of strong patterns. Passive investing via ETFs also grew significantly, changing intraday flows.
Candlestick Effectiveness: Generally Low. Simple, visually identified candlestick patterns were recognized and arbitraged away by algorithms. Predictive power was fleeting (milliseconds to seconds) or statistically insignificant when transaction costs were factored in. Patterns might still appear but their reliability as a standalone predictive tool for discretionary traders probably hit a low point. Effectiveness might have briefly spiked during sharp volatility events (e.g., Flash Crash 2010, Taper Tantrum 2013) but the baseline effectiveness was likely poor.
Key Event Influence: Aftermath of Global Financial Crisis; rise of HFT dominance; QE/ZIRP policies; Flash Crash; increased quant sophistication; and growth of passive investing.
The Era of Volatility, Retail Resurgence, and Complexity (2020 - 2024)
Context: The COVID-19 pandemic triggered extreme volatility and a massive influx of new retail traders (‘meme stock’ phenomenon), often co-ordinating via social media. Markets became highly narrative driven. While algorithms remained dominant, the sheer force of retail flows (sometimes irrational or meme-driven) introduced new dynamics. AI and machine learning became more integrated into institutional trading strategies, capable of recognizing far more complex patterns than traditional candlesticks.
Hypothesized Candlestick Effectiveness: This has been variable and context dependent (potentially low-to-moderate in specific niches/conditions). This is a complex area.
Against Effectiveness: Algo dominance and AI sophistication mean simple patternscan be weak in isolation on highly liquid stocks.
For Situational Effectiveness: Extreme volatility can create clearer emotional swings reflected in candles. In less liquid or ‘meme’ stocks, coordinated retail buying/selling based partly on simple technicals (including candles) can create temporary self-fulfilling effects. Patterns become useful as signals of specific crowd behaviour rather than pure price predictors. The combination of a pattern with social media sentiment or unusual volume offers clues. Effectiveness be higher on longer timeframes (daily/weekly) than intraday, where HFT noise is overwhelming.
Key Event Influence: COVID-19 Crash & Rally; Meme Stock phenomenon (GME, AMC); rise of commission-free brokers; increased social media influence (Reddit/WSB); growing use of AI in trading; geo-political uncertainty; and inflation/rate hike cycle.
Our core metric is straightforward: Success Rate. We defined success as the price moving at least 1x the Average True Range (ATR) in the pattern's predicted direction within the next 3 bars. See Methodology for full details.
Major Stock Indices: S&P 500, Nasdaq, Dow, FTSE, DAX, Nikkei
Major Large Cap Stocks: A representative basket of 30 globally significant, liquid stocks with long histories. Major Futures: ES, NQ, CL, GC, ZB, 6E
Major FX Pairs: EURUSD, GBPUSD, USDJPY, AUDUSD, USDCAD
127 million BARS ANALYSED
4,240,000 PATTERN ENCOUNTERS
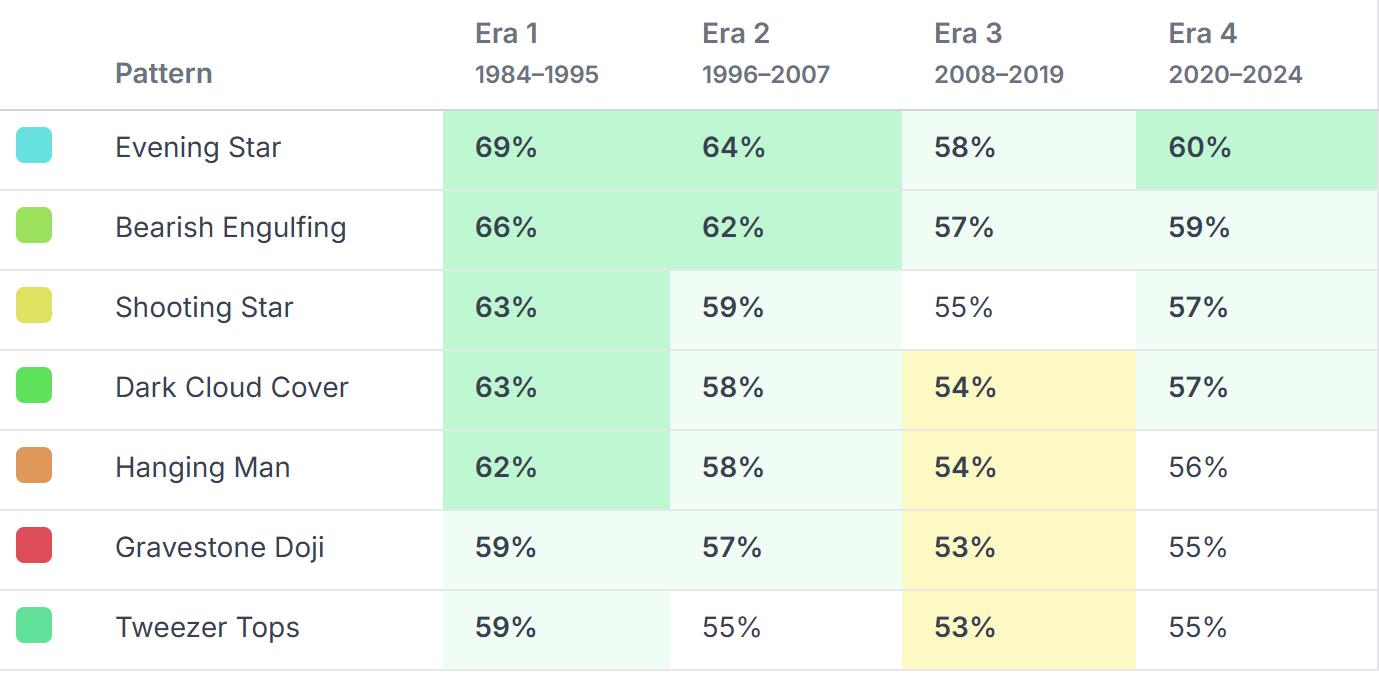
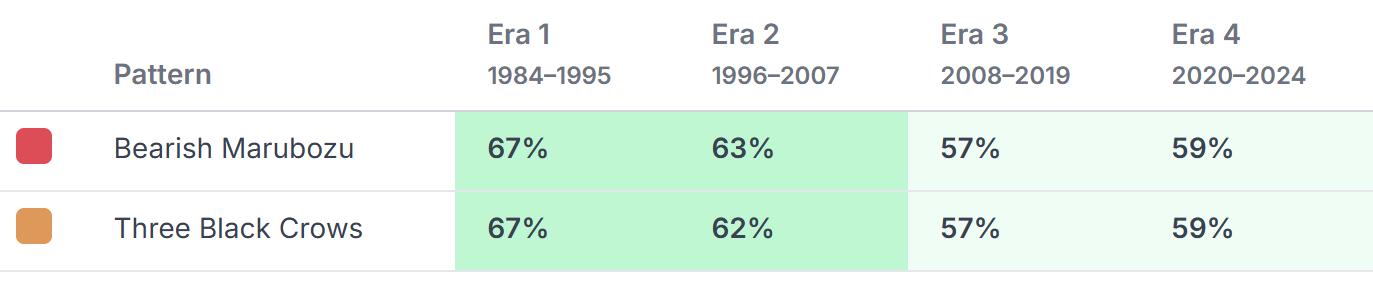
Success Rate (1984 - 1995)
Bullish Patterns
Bearish Patterns Average
Highest success rates due to novelty and less efficient markets. Strong reversal and confirmation patterns have higher rates.
1: Average Success rates (era 1984-1995)
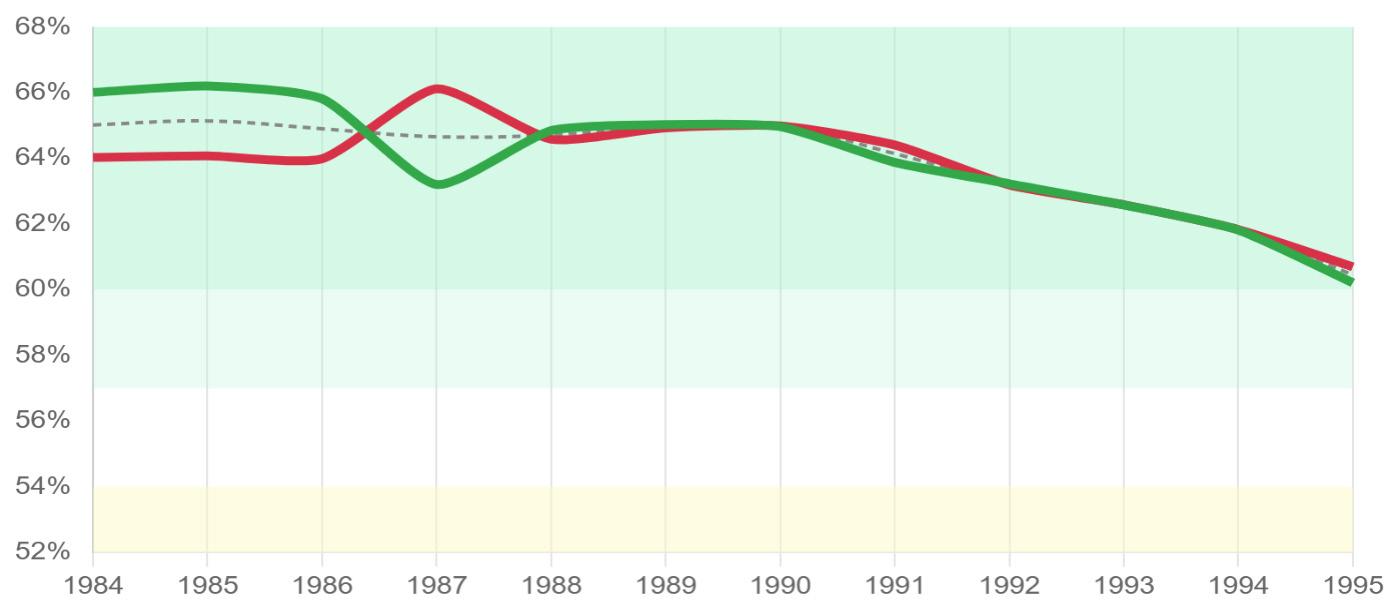
1996 – 2007
General decrease across the board (e.g., -3% to -7%) as patterns became common knowledge and early algos emerged. Simple, popular patterns (Engulfing, Hammer) see slightly larger drops than complex ones initially.
Chart 2: Average Success Rates (Era 2: 1996–2007)

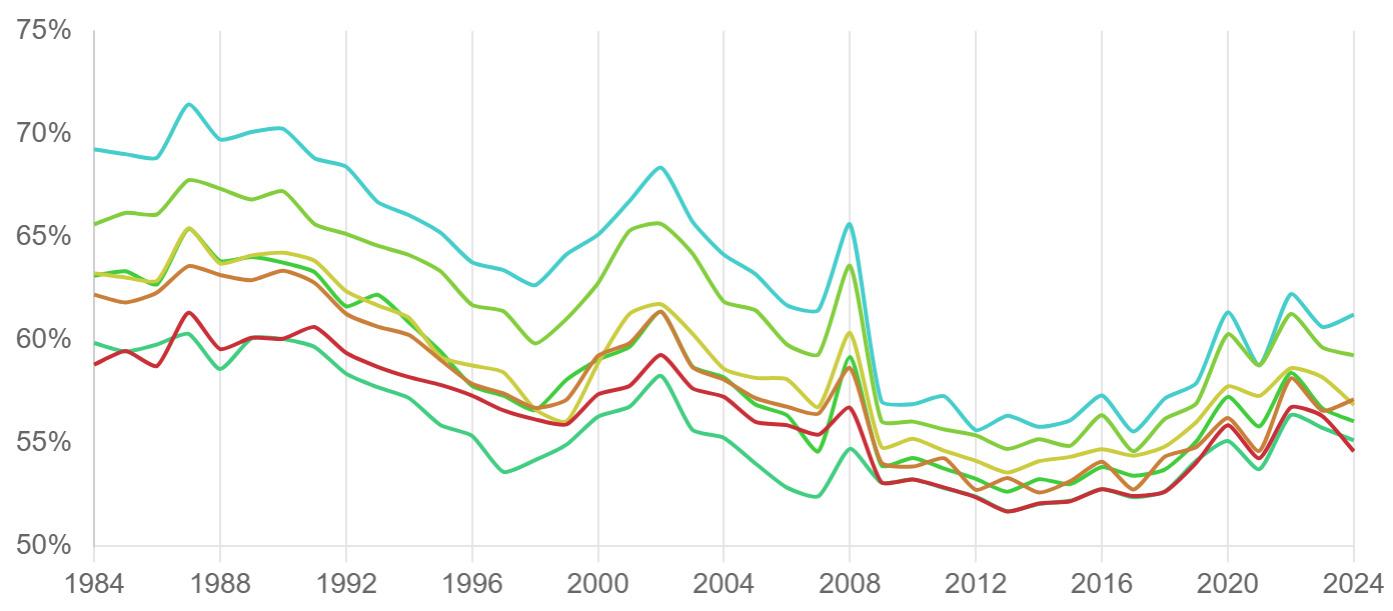
2008 – 2019
Significant drop (-5% to -9% from Era 2) reflecting algo dominance and market efficiency. Most patterns hover just above the 50% noise level, suggesting minimal standalone edge. Stronger multi-candle patterns retain a slightly higher (but still low) hypothetical edge.
2020 – 2024
A complex picture:
• Slight increase (+2% to +3% from Era 3) for many patterns, especially strong reversal types (Stars, Engulfing, Hammer/ Shooting Star), reflecting potential for clearer signals during high volatility and retail-driven emotional swings.
• Indecision patterns remain weak standalone.
• Continuation patterns see minimal improvement, possibly struggling in volatile, choppy conditions unless a very strong narrative trend takes hold.
• Overall effectiveness remains far below historical peaks due to algorithmic sophistication but slightly better in specific volatile situations than the hyper-efficient Era 3 baseline. Context is absolutely paramount here.
Standalone v Context: These numbers consider the pattern somewhat in isolation. A real trader uses patterns in conjunction with trend analysis, support/resistance, volume, indicators, etc. Context significantly impacts actual success.
Timeframe: Although most bars were generated on 5-minute charts, we placed greater emphasis on daily charts, as intraday pattern effectiveness decayed more rapidly and significantly due to high-frequency trading noise.
Liquidity & Asset Class: Effectiveness varied greatly by market (stocks, forex, futures) and liquidity. These are broad averages, most applicable to liquid futures markets and large-cap stocks.
9: Bearish Confirmation Patterns and Table
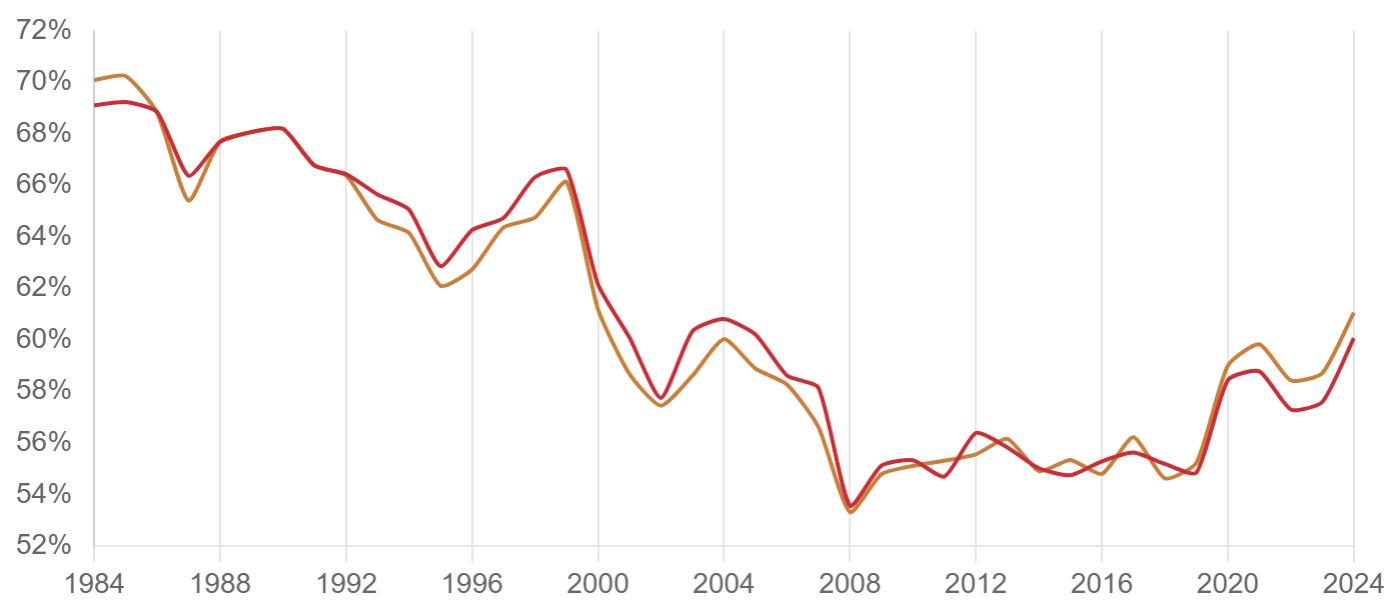
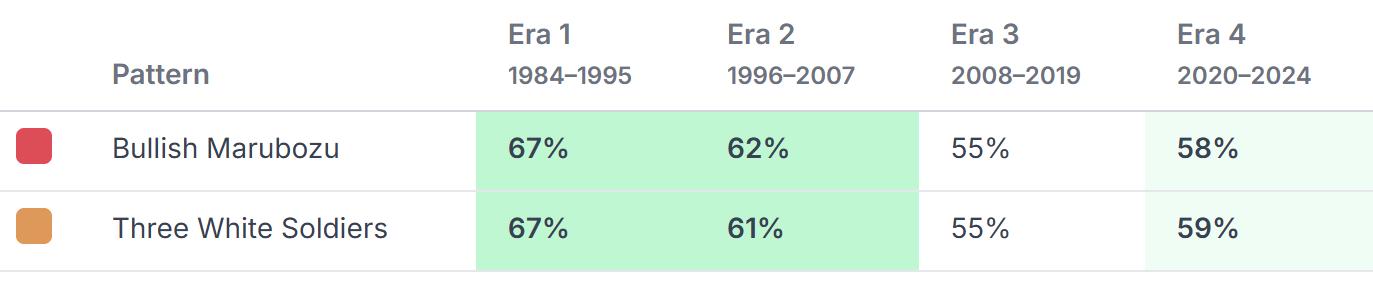
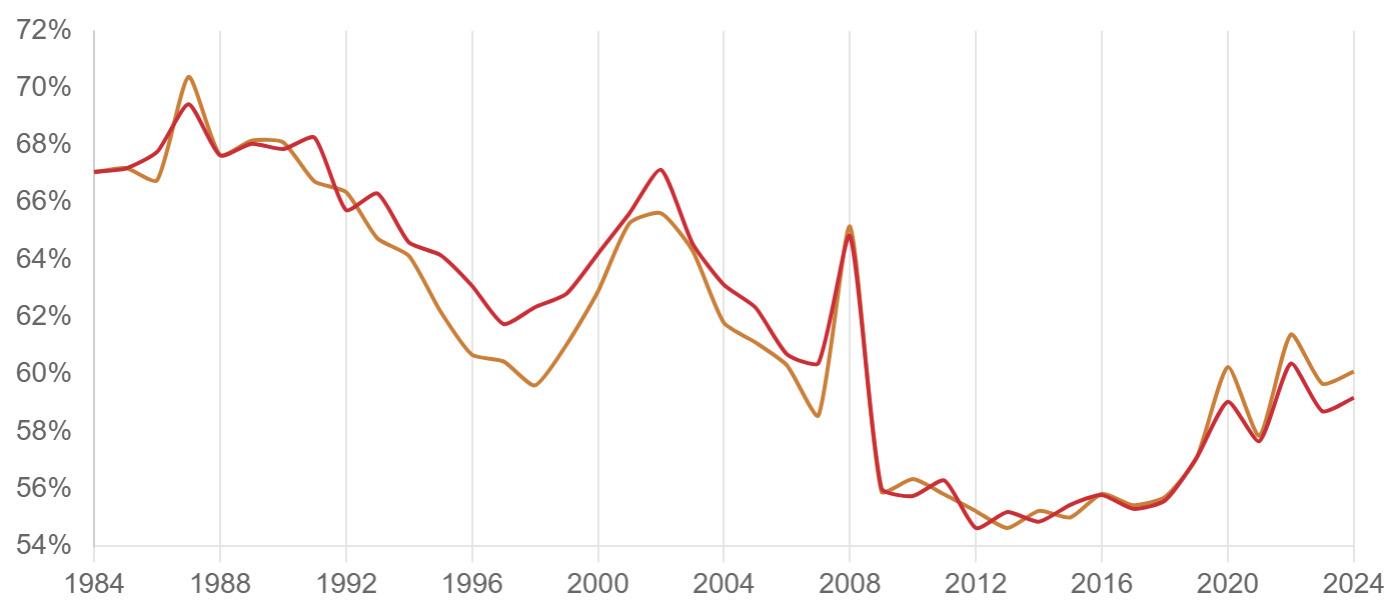
Chart 12: Another Era pattern box
• Short-Term Churn v Longer Signals: We noticed intraday patterns (5-min, Hourly) generally showed more dramatic shifts (both positive and negative) compared to Daily patterns. This might reflect the increased impact of algorithms on shorter timeframes.
• The Golden Age: In the early 80s, some top candlestick patterns boasted 70% success rate – a level never seen since.
• The Great Decay: On average, popular candlestick patterns lost 10-15% of their predictive success between their 1980s peak and the late 2010s.
• From Boom to Bust: Bullish pattern effectiveness soared to nearly +10% above average in the '99 Dot-com peak, only to see bearish patterns gain a similar edge in the 2000-2002 crash.
• The 2010s Quiet Zone: For nearly a decade, most candlestick patterns flatlined, offering minimal predictive edge in an algo-dominated, QE-infused market.
• The Retail Resurgence: The COVID-19 pandemic and retail trading boom led to a resurgence in candlestick pattern effectiveness, particularly in volatile markets. Patterns like the Hammer and Engulfing showed notable improvements, suggesting that retail-driven volatility can create clearer signals.
13
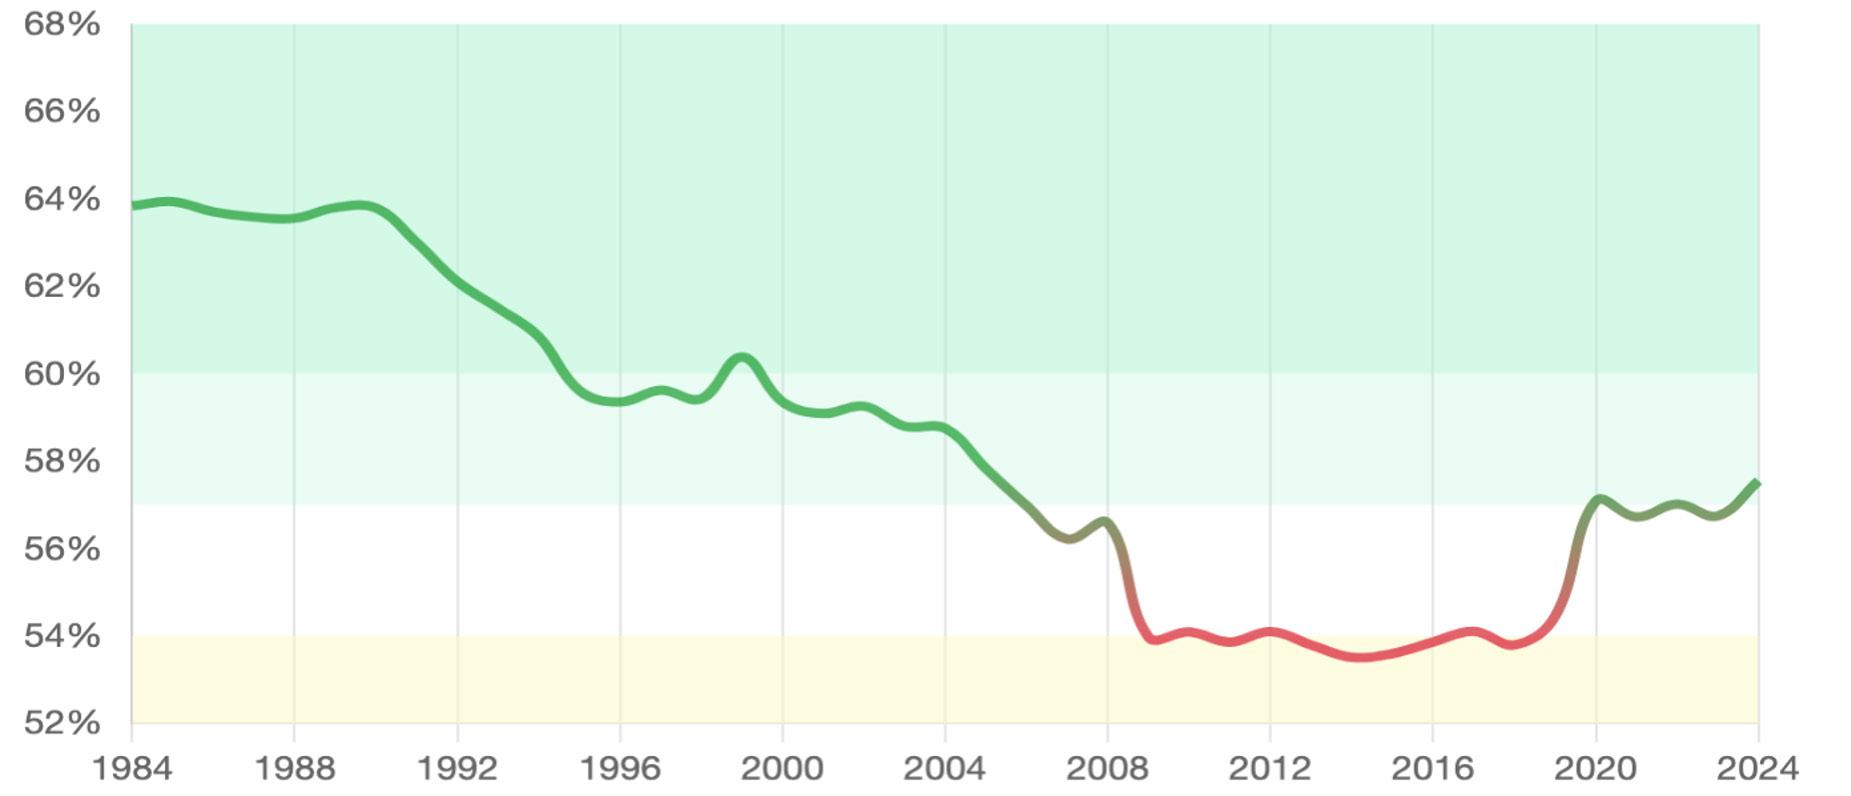
Back to the Game: Perhaps the most important takeaway - candlestick patterns have returned to a positive expentancy zone after spending a decade near the noise threshold.
Here’s how we approached this analysis:
• Data Sources: We utilized high-quality End-of-Day (EOD) and Intraday (1-Hour, 5-Minute) data for a diverse basket of liquid assets, including major stock indices (S&P 500 components), Forex pairs, and key commodities, spanning from 1984 to late 2024. Sourcing varied by asset class and timeframe.
• Pattern Recognition: We employed standardized, widely accepted definitions for 20 common candlestick patterns. Pattern recognition logic was applied consistently across all data. Specific definitions based on common technical analysis literature were used.
- Technical Analysis Explained by Martin J. Pring (3rd edition, 1991)
- Trading for a Living: Psychology, Trading Tactics, Money Management by Dr. Alexander Elder (1993)
- Beyond Candlesticks: New Japanese Charting Techniques Revealed by Steve Nison (1994)
- Technical Analysis of the Financial Markets by John J. Murphy (1999)
• Volume Analysed: The analysis covered over 4,000,000 identified pattern instances across all assets and timeframes.
• Era Definitions: Era 1: Jan 1984 - Dec 1995. Era 2: Jan 1996 - Dec 2007. Era 3: Jan 2008 - Dec 2019. Era 4: Jan 2020Dec 2024.
• Success Criteria: A pattern instance was deemed 'successful' if the price moved >= 1x the 14-period Average True Range (ATR) in the pattern's expected direction within the 3 bars immediately following the pattern's completion. The ATR was calculated based on the period leading up to the pattern.
• Tools: Analysis performed using Python (Pandas, NumPy), custom pattern recognition scripts, as well as NinjaTrader's NinjaScript and TradeStation's EasyLanguage.


PATRICIA ELBAZ, MSTA Director
Michael it’s a pleasure to interview you for the Market Technician Journal, especially as I, along with thousands, have followed your market commentaries for many years at CMC Markets.
First of all, Congratulations and welcome to the STA Board! Tell us, how were you first introduced to Technical Analysis?
MH: It was a long time ago when I started working at Commonwealth Bank of Australia in 1989 that I was introduced to TA. We had the use of a Teletrac service which was used by the guys in Sydney to send us reports on the day-to-day movements in various currency pairs. This piqued my interest and I was interested to learn more about the topic and it went from there.
“On the whole many clients tend to use their gut instinct when trading particular markets, perhaps looking at the fundamentals but generally herding around a common consensus which usually tends to be incorrect.”
MICHAEL HEWSON
Which indicators would you recommend using when starting to learn about Technical Analysis?
MH: Before even starting to look at which indicators to use when starting to learn about TA, it’s important to understand the concept of trend when looking at a market, as well as being able to tell the difference between a trend following indicator, and a range following indicator.
A simple moving average is usually a decent benchmark for an overall trend but is only helpful for those traders looking to trade in the direction of the underlying trend.
Other basic indicators are the Relative Strength Indicator (RSI) and the Stochastic but these are next to useless in a strongly trending market unless you are looking to time your entry into a trade in the direction of the underlying trend.
I would start with a simple moving average along with an RSI or Stochastic as a starting point but one should always remember the trend and the price should always take precedence over oscillators or other arithmetical indicators.
In your experience at CMC markets, were clients using both fundamental and technical analysis when making trading decisions?
MH: On the whole many clients tend to use their gut instinct when trading particular markets, perhaps looking at the fundamentals but generally herding around a common consensus which usually tends to be incorrect. When I spoke to them, I always challenged them with their reasons for being in a trade at all and only very few were able to answer that question satisfactorily. Those who were able to answer that question were unsurprisingly the most successful ones.
In the past, many traders have said that they find technical analysis very useful for short term trading and outlook. Would you agree with that, or do you think that a long-term time frame is just as significant?
MH: It depends on your time horizon but longer-term analysis can be just as important as short-term scalping trades. A long-term support and resistance line can be a formidable barrier to further gains and losses in the context of a strong move up or down and used to take some profit on a particular trade. It can also be used to identify a significant breakout level and change of trend.
Finally, do you see the development in AI and algo trading as a positive move in the future?
MH: This is a tough one: used in the right way, any new advancement in technology can be used to improve the decision-making process, as well as being able to perform research more quickly on a range of different markets.
On the minus side, as I have found out by being AI deepfaked, it can be used for more nefarious purposes to try and swindle people out of their hard-earned cash.
Used in the right manner, it can be a force for good but there need to be strong guard rails in place to ensure it is not abused. As far as the latter point is concerned, we remain quite a way short of that.
Thank you so much Michael for sharing with us and the many readers your knowledge and wide experience in trading and education.
We hope to see you at future STA events

The STA are delighted to announce a new Student membership category.
Students of recognised academic institutions may join the Society for the duration of their course at the discounted rate of only £25 a year.
Student members will have to demonstrate their student status. For enquiries, email the office on info@technicalanalysts.com

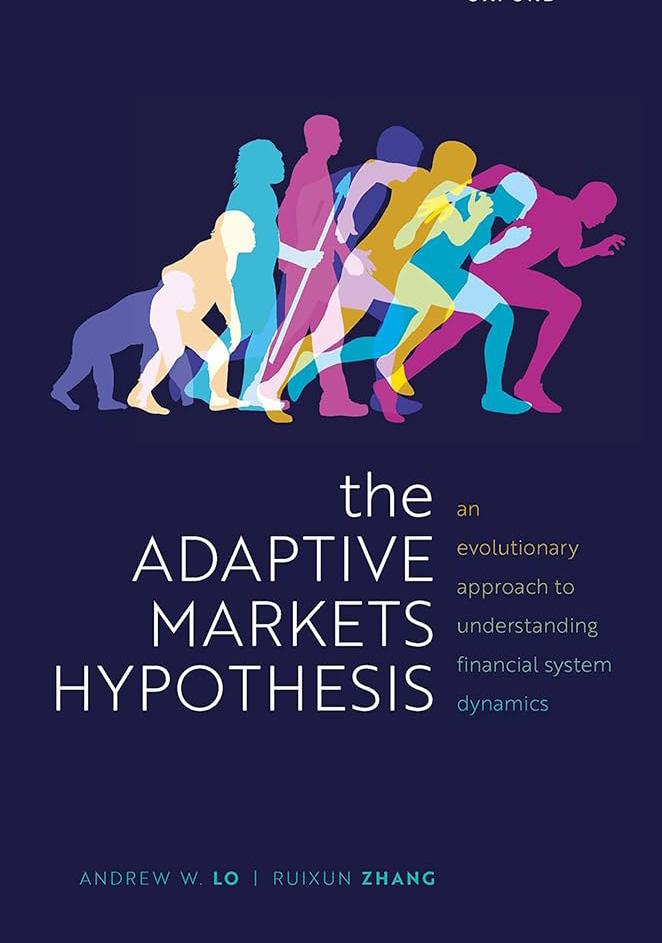
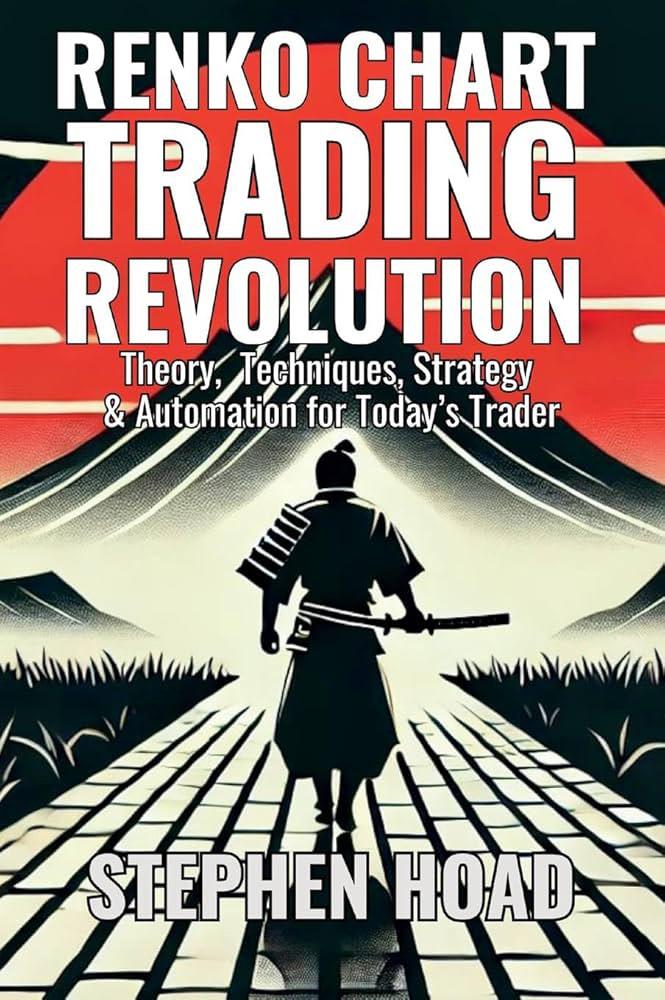
In Renko Chart Trading Revolution, author and quant strategist Stephen Hoad presents a bold and highly detailed exploration of Renko charts — one that goes far beyond conventional introductions. This 433page publication positions Renko not as a side technique but as the core of a complete, probability-based trading framework that incorporates quantitative edge, trading psychology, and automation. It is a book with significant ambition and for the most part it delivers,offering traders a highly structured, multi-dimensional path to strategy development using Renko charts.
The book is intelligently structured, beginning with the essential foundations of Renko chart construction - including traditional and hybrid approaches, volatility filtering, and time-conditioning - before progressing to more advanced trading applications. For readers unfamiliar with Renko or those wishing to revisit the chart type with fresh eyes, these early chapters are particularly strong. Hoad’s attention to how Renko charts filter out market noise and present “price truth” without timebased distractions is clearly rooted in practical experience. His explanations of block size selection, confirmation signals, and breakout structures demonstrate both depth and clarity. One of the more unique features of the book is its integration of mindset and trading psychology through Hoad’s “Samurai Trader” concept. Drawing from Musashi’s Book of Five Rings, this section offers philosophical but actionable ideas on discipline, detachment, and focus — ideas that align well with the demands of highperformance trading.
Where Renko Chart Trading Revolution truly excels is in its middle and later chapters. Hoad introduces three well-documented trading strategies -
trend following, mean reversion, and breakout momentum - each designed around Renko chart principles. These strategies are not offered in isolation, but as part of a broader discussion on:
• Edge development
• Risk control
• Expectancy modelling
• Trade management
These chapters reflect Hoad’s deep background in institutional trading and quantitative thinking. He brings concepts such as the Kelly Criterion, edge theory, and game theory into the discussion without ever overwhelming the reader. The balance between theory and practical application is handled thoughtfully.
The final part of the book addresses automation and system development in Python, providing a roadmap for traders wishing to move toward algorithmic execution. While not a substitute for hands-on coding practice, this section gives clear structural guidance and encourages readers to think modularly when developing Renko systems.
Traders with some programming background will appreciate this section most but even discretionary traders will benefit from the way Hoad explains system logic and process building.
The writing is professional and accessible, with clear language, logical flow, and effective use of diagrams, examples, and summaries. Hoad manages to keep a strong narrative voice throughout, grounding abstract ideas in the day-to-day reality of the trader.
At times, the book’s ambitioncovering philosophy, psychology, strategy, and code - does stretch its cohesion. Some readers might wish for deeper treatment in isolated areas, such as behavioural models or coding walkthroughs but the book remains focused on its central goal: delivering a unified framework around Renko charts and trading edge.
This is a notable addition to the literature of modern technical analysis. Renko charts have often been underexplored in Western professional contexts, and Renko Chart Trading Revolution does an excellent job of addressing this gap.
Its true contribution lies in elevating Renko from a niche tool to a central component of a rulebased, probability-informed trading methodology. For analysts and traders seeking to systemise their visual process - or explore alternatives to time-based charting - this book offers both insight and utility.
Stephen Hoad’s Renko Chart Trading Revolution is one of the most comprehensive works on Renko charting I have seen. It succeeds in combining technical precision, strategic depth, and philosophical insight in a single volume. While its scope is broad, the execution remains grounded and practical throughout.
It is an essential read for technical analysts interested in Renko, system development, and the blending of discretionary and algorithmic thinking.
The STA holds 11 monthly meetings in the City of London, including a summer and Christmas party where canapés and refreshments are served.
• Chance to hear talks by leading practitioners.
• Networking.
• CPD (Continuous Professional Development).
As a service to our members, many of whom are unable to attend all our monthly meetings, we have been making videos of meeting presentations for several years.
• Never miss the latest meeting.
• Browse our extensive video archive of previous meetings.
The Society of Technical Analysts and the Chartered Institute for Securities & Investment (CISI) have formed a partnership to work together on areas of mutual interest for our respective memberships.
CISI examination exemptions for STA Diploma Part 1 and 2 holders. MSTAs with three+ years’ experience can become full members (MCSI).
The STA holds 10 monthly talks either in-person in the City of London or online and a number of social events including the Annual Drinks Reception and a Christmas Party.
• Chance to hear talks by leading practitioners
• Networking with members and other finance professional
• CPD (Continuous Professional Development).
Student members have access to an education forum which is available in the member’s area of the website.
Members can ask questions on technical analysis in the Technical Analysis Forum which a course lecturer, author or Fellow will answer.
Endorsed by the Chartered Institute for Securities & Investment (CISI), members of the STA are entitled to receive continuing professional development points (CPD for their attendance on the taught course lectures.
• Remain compliant.
• Be informed of all new industry developments.
The STA ”Market Technician” journal is published online twice a year.
Members receive the latest issue of the “Market Technician” via e-mail. They are also able to access an archive of past editions in the member’s area of the website. Technical analysts from all over the world contribute to the STA journal.
The STA has an extensive library of classic technical analysis texts.
There are over 1000 books in the collection, held at the Barbican Library with a smaller selection available at the City Library. As a member you can now browse which titles are available on-line. Members are encouraged to suggest new titles for the collection and, where possible, these are acquired for the library. The complete listing can be downloaded in Excel format from within the member’s area.
STA members receive all International Federation of Technical Analysts (IFTA) quarterly bulletins and annual journal and invitations to attend their monthly online webinars.
• Chance to hear talks by international practitioners
• Access to research from market analysts around the globe
• CPD (Continuous Professional Development).
STA Monthly Meeting (September 2025)
SEP 9
SEP 17
Tuesday 9 September 2025, 6.30pm Via Live Webinar
Tony LaPorta in conversation with Clive Lambert, FuturesTechs.
STA Annual Drinks Reception & Awards Ceremony
Thursday 17 September 2025 National Liberal Club.
STA Diploma Part 2 Exam (online)
Thursday 9 October 2025.
OCT 9
OCT 14
STA Monthly Meeting (October 2025)
Tuesday 14 October 2025, 6.30pm
Trevor Neil FSTA One Moorgate Place.
STA Diploma Part 1 exam (online) starts
Wednesday 15 October 2025.
OCT 15
NOV 11
STA Monthly Meeting (November 2025)
Tuesday 11 November 2025 6.30pm Via Live Webinar Speaker to be confirmed.
STA Diploma Part 1 exam (online)
Monday 8 December 2025.
DEC 8
DEC 9
JAN 13
STA Monthly Meeting (January 2026)
Tuesday 13 January 2026, 6.30pm Joint STA/ACI/The Broker Club/CTC Market Outlook Panel One Moorgate Place.
STA Diploma Part 2 exam (online) starts Wednesday 14 January 2026.
14
STA Monthly Meeting (February 2026)
Tuesday 10 February 2026 6.30pm Via Live Webinar Speaker to be confirmed. FEB 10
STA Diploma Part 1 exam (online)
Monday 2 March 2026. MAR 2
STA Monthly Meeting (March 2026)
MAR 10
Tuesday 10 March 2026 6.30pm Via Live Webinar Speaker to be confirmed.
STA Monthly Meeting (April 2026)
APR 14
Tuesday 14 April 2026, 6.30pm Via Live Webinar One Moorgate Place Speaker to be confirmed.
STA Diploma Part 2 exam (online) Thursday 23 April 2026. APR 23
AGM & Christmas Party
Tuesday 9 December 2025 6.30pm One Moorgate Place.

Why purchase the Home Study Course?
The world-class e-learning Home Study Course (HSC) © is written by leading industry practitioners, making it one of the best online products available on the technical analysis market. Whether this is your first introduction to technical analysis, you want to refresh your existing knowledge, or you wish to become a qualified technical analyst, the STA offers a tailored Home Study Course as part of our portfolio of world respected courses preparing students for our internationally accredited STA Diploma qualification.
You can learn from the comfort of your home at times that best suit you. Although website based, it is fully downloadable and may be used online or offline via PC, Mac, iPad or Android machines.
What will it cover?
• The syllabi for both STA Diploma Part 1 & Part 2 examinations
• 15 in-depth subject teaching units
• Exercises to self-test progress
• Exam preparation module & video
• Advice on report writing.
...find out more visit Home Study Course
Since the HSC is International Federation of Technical Analysts (IFTA) syllabus compliant it can also be used to prepare candidates for both the IFTA CFTe I and II examinations.
Who is the course for?
The course is intended for individuals who want to use technical analysis in a professional manner or who want to become a qualified technical analyst and advance their career. Enrol and start studying now!
For more details click below or contact the STA office on +44 (0) 207 125 0038 or info@technicala nalysts.com
When would you like to start?
Learn at your own pace rather than in a classroomthe HSC course is designed for those who need a truly part-time study option with maximum flexibility!
Visit STA Meetings on the STA website for information on monthly meetings and videos.
Month Speaker
June 2025 Russell Napier
May 2025 Kim Cramer Larrson
Description
A New World Monetary Order – The Soft Underbelly of US Exceptionalism
Behavioural Finance and Trading Psychology
April 2025 Robin Griffiths and Ron William 2025 Global Macro Outlook
March 2025 Zoe Bollinger Bollinger Capital Management
February 2025 Perry Kaufman Fireside Chat
November 2024 Dimtri Speck
October 2024 Clive Lambert, Keval Dhokia and Christof H. Ruhl
Increase Your Profits Systematically with Recurring Seasonalities and Cycles
Joint Panel with the Commodity Trading Club
September 2024 Tim Basso Fireside Chat

STA UK members are eligible to join the Barbican library as standard adult library members.
The STA is delighted that STA UK members are able to access the City of London Barbican Library in-person or digitally via their Libby App. Library members can choose from a great selection of eBooks, eAudiobooks, eMagazines, eComics and music videos which can be downloaded onto many devices including tablets, mobile phone and many devices compatible with the Libby App.
As before, UK STA members wishing to become a member of the City of London libraries do this by going into the Barbican Library or another one of their libraries to join with proof of home address and ID, or you can apply for temporary online membership which will currently give access to Overdrive and Libby. If your library card has expired, then you will need to get it reinstated before you will be able to access Overdrive / Libby.
Once you have a valid membership number you can access the collection by downloading the Libby / Overdrive app to your device, search for City of London Libraries and then input your library membership number.
Over the coming months the STA and the Barbican Library are working together to add a selection of technical analysis.
Meantime, UK members an explore the collection of books, magazines via https://cityoflondonuk.overdrive.com

One evening exam preparation session
A two-hour exam
Qualification accredited by CISI and IFTA
Booking is well underway for the CISI and IFTA accredited online STA Diploma Part 1 and Diploma Part 2 courses. The two courses have been designed to cater for newcomers and experienced professionals who are looking to challenge themselves. They will learn to develop the methodology, tools and confidence to make better informed trading and investment decisions in any asset class, anywhere in the world.
The course takes place from October to December each year. Delivered online via live Zoom, lectures are held once a week, from 6.00pm to 8.00pm London time.
The 2025 course will start on Wednesday 15 October. It costs £1,395 if booked by 30 September; £1,595 thereafter.
This course is designed for those with little or no previous experience and individuals looking to initiate themselves in the practice of technical analysis. The course will give you an introduction to technical analysis and provide you with the tools to progress to the Diploma Part 2 Course. The Diploma Part 1 schedule enables you to maximise your learning while complementing your work and home life. The course is accredited for Continuing Professional Development (CPD) by the Chartered Institute for Securities and Investment (CISI).
Programme at a Glance
• Introduction to technical analysis and comparison to fundamental analysis.
• Construction and interpretation of Line, Bar, Point and Figure and Candlestick charts; introduction to HeikinAshi, Three-Line Break, Renko and Kagi charts.
• Support and resistance, theory, identification, utilisation, breakouts.
• Trend and return lines, where and how to draw them
• Fibonacci numbers and retracements.
• Reversal and continuation patterns, target projection from patterns.
• Moving averages, different types and how to interpret them.
• Momentum, indicators/oscillators, relative strength, sentiment measures; definition, interpretation and how to use them.
• Dow Theory, introduction to Elliott Wave Theory - how to use technical analysis strategically.
Lectures are delivered via live Zoom webinar and are fully interactive with students being able to ask questions as they would in a classroom. Any students unable to watch live will be able to catch up with a recording post event and email the STA office with any questions. They may also post questions on the STA Student Forum which will be answered by course lecturers. Students are able to gain access to lecture recordings for the duration of the course.
Dates for the 2025 course are:
• Wednesday 15 October
• Wednesday 22 October
• Wednesday 29 October
• Wednesday 5 November
• Wednesday 12 November
• Wednesday 19 November
• Wednesday 26 November
The Part 1 exam will be held on Monday 8 December during the daytime.
“This was a great programme. The staff are experts on their topics and have a true passion for technical analysis. I highly recommend this to anyone looking for a well-rounded understanding of technical analysis.”
Amanda Rastovic, MINTEC Global, Student on the STA Diploma Part 1 Course 2024

The course starts in January of each year and consists of 12 Wednesday online evening lectures (from 6.00pm8.00pm London time. The STA Diploma Part 2 exam is held in the April.
The 2026 STA Diploma Part 2 Course will commence on Wednesday 14 January. It costs £2,199 if booked by 31 December 2025; £3,199 thereafter.
The Part 2 Course provides you with advanced professional knowledge, understanding and skills to use technical analysis as a vital investment tool or to pursue a career in technical analysis within the investment community. Basic technical analysis knowledge is a prerequisite for attending this course.
During the 12-week programme you will learn from leading experts and develop both theory and practical experience in the major techniques, analytical tools and indicators to enable you to select the most advantageous portfolios, trades, hedges and much more for your clients, your employers or your own trading systems.
The Diploma Part 2 Course provides you with a deeper understanding of technical analysis, added confidence and the capabilities to further develop your career. The course is accredited for Continuing Professional Development (CPD) by the Chartered Institute for Securities and Investment (CISI).
• T he practical application of support, resistance and price objectives by market professionals - how they build on the essential basics and add advanced techniques. e.g. Fibonacci projections; working in different time frames.
• Construction and advanced applications of Candlestick and Point and Figure charts, including Point and Figure moving averages and indicators.
• Advanced moving average, momentum indicator and oscillator techniques; use of market breadth and sentiment measures.
• The practical application by market professionals of Dow, Elliott Wave and Gann Theory; Ichimoku Charts; Market Profile®; Behavioural Finance; Risk Management - and much, much more.
Exam preparation video & guide booklet
Three-hour exam
Qualification accredited by CISI and IFTA
Lectures are delivered via live Zoom webinar and are fully interactive with students being able to ask questions as they would in a classroom. Any students unable to watch live will be able to catch up with a recording post event and email the STA office with any questions. They may also post questions on the STA Student Forum which will be answered by course lecturers. Students are able to gain access to lecture recordings for the duration of the course.
Dates for the 2026 course are:
• Lecture 1 (Wednesday 14 Jan);
• Lecture 2 (Wednesday 21Jan);
• Lecture 3 (Wednesday 28 Jan);
• Lecture 4 (Wednesday 04 Feb);
• Lecture 5 (Wednesday 11 Feb);
• Lecture 6 (Wednesday 18 Feb);
• Lecture 7 (Wednesday 25 Feb);
• Lecture 8 (Wednesday 04 Mar);
• Lecture 9 (Wednesday 11 Mar);
• Lecture 10 (Wednesday 18 Mar);
• Lecture 11 (Wednesday 25 Mar);
• Lecture 12 (Wednesday 01 Apr).
The Diploma Part 2 Exam will take place on Thursday 23 April (daytime).

Book both courses together before 30 September and save £££'s
Book the STA Diploma Part 1 & 2 Online Course package for £3,299 (early bird) and save £295!

We have put together a great offer for you. Book onto any of our STA Diploma courses, including the Home Study Course, before 31 December 2025 and save £50.
Simply click here and enter code 'JNLPROMO' in the coupon box to redeem your discount.
James Eptas
Albert Linney
Ali Gueye
Angeline Ong
Constantinos Frangiskou
Daniel Mangan
Daniyal Chanawala
Darlene Casey
Devang Mehra
Dexter Albone
Elliot Gore
Elliott Holmes
James Forster
John Nwatu
Joshua Frost
Julian Khayar
Mark Hutchinson
Martha Dowding
Mita Chaturvedi
Myles Chrisotomou
Octavian Canta
Peter Glancy
Richal Jain
Richard Taylor
Stanimir Tonchev
Sulaiman Al Haddad
Thomas Nikolaou
Vincent Wu
William Munro
Yaroslav Skorov
Yury Sharanov
Yusuf Atcha
Executive Commitee on STA website

Eddie Tofpik
MSTA, ACI-UK, ACSI Chair

Murray Gunn FSTA Director

Karen Jones BSc FSTA Treasurer

Michael Hewson MSTA CFTe Director
keep the articles coming!
The success of the Journal depends on its authors, and we would like to thank all those who have supported us with their high standard of work. The aim is to make the Journal a valuable showcase for members’ research - as well as to inform and entertain readers.
Keep up to date with the conversation by joining us on:

Boccaccio MSTA Director

David Watts BSc (Hons) CEng MICE MIWEM MSTA Systems and Website Specialist

FSTA Director


The Society of Technical Analysts Journal The Market Technician is a bi-annual publication, published in PDF format only. The STA will accept advertisements in this publication if the advertising does not interfere with its objectives.
The appearance of advertising in the Market Technician is neither a guarantee nor an endorsement by the STA.
Inside Cover
The Market Technician has a circulation of approximately 1,500. Readership includes technical analysts, traders, brokers, dealers, fund managers, portfolio managers, market analysts, other investment professionals and private investors.
Contact Katie Abberton, Society of Technical Analysts on info@technicala nalysts.com or +44 (0) 207 125 0038 for more information. Position
Advertising is subject to approval by the STA Journal Committee. All advertisements must be non-discriminatory and comply with all applicable laws and regulations. The STA reserves the right to decline, withdraw and/or edit at their discretion.