


As
we welcome 2025, it’s
clear that this year
will be transformative for the Society of
Technical Analysts
(STA) and our global community. With advancements in trading education and new initiatives, this edition of The Market Technician reflects the energy and innovation shaping our field.

programs are designed to equip traders with cutting-edge skills, blending technical analysis with practical applications to optimise trading strategies.
Our journal thrives because of the dedication of our contributors and the enthusiasm of our readers.
We extend a warm welcome to our new executive committee members, Alan Dunne and Murray Gunn, whose expertise will help drive the STA’s mission forward. Additionally, we honour Tom Pelc, (pg.8) our latest Fellow, for his significant contributions to the field of technical analysis.
This journal features a diverse array
of articles from global contributors. (p.15) shares insights on robust system development in his piece "Validation, Not Optimization." and Ron Williams combine macro cycles with behavioural analysis in "How High is the High?" Meanwhile, Sunny unveils her innovative SunnyBands indicator, showcasing her 44 years of trading expertise. Charlie presents a fresh approach to identifying market trends in "ByteTrend and the Great Reversal."
The edition also spotlights personal journeys. Interviews with STA Chief Luise Kliem (p.46) and Bronwen Wood Memorial Prize Alden Chea (p.48) offer inspiring perspectives on the evolution of technical analysis and its educational impact.
David Watts (p.50) provides an engaging look at trends and tools for the year ahead in the Bytes and Pieces section, ensuring you are well-equipped for the markets of 2025.
Our journal thrives because of the dedication of our contributors and the enthusiasm of our readers. If you have insights, experiences, or ideas to share, please reach out at info@technicalanalysts.com.
Here’s to a year filled with learning, innovation, and success. Thank you for being a part of this vibrant community.

Specialising in Employment Tribunals, Consumer Law, Landlord and Tenant Law and Family Law, Affordable Law for You was set up by Deborah Aloba, a Fellow of the Chartered Institute of Legal Executives.
We assist by
• Reviewing and commenting upon legal documentation
• Assisting you to respond appropriately to communications in legal proceedings
• Preparing legal documents in a format required and accepted by the Courts
• Researching and providing relevant statutes and case law supporting your legal arguments
For further details visit our website or contact us direct: affordablelawforyou@gmail.com 07964 805 397


We have put together a great offer for you. Book onto any of our STA Diploma courses, including the Home Study Course, before 31 December 2025 and save £50.
Simply click HERE and enter code JNLPROMO in the coupon box to redeem your discount.
10 December 2024, One Moorgate Place, London


Murray Gunn MSTA, is Head of Global Research at Elliott Wave International. He has worked as a fund manager in global bonds, currencies and stocks, including posts at Standard Life Investments and the Abu Dhabi Investment Authority.
Prior to joining EWI, he was Head of Technical Analysis at HSBC Bank. Murray is the author of the 2009 book Trading Regime Analysis, and a contributor to the 2017 book Socionomic Studies of Society and Culture.

Alan Dunne MSTA, Founder & CEO, Archive Capital. Alan started his career as a technical analyst and trader, working for Bank of America in London, Hong Kong, and Singapore before working as a global macro strategist with BNP Paribas in emerging markets and Allied Irish Capital Management, a global macro CTA. He was subsequently Investment Director of Royal Bank of Scotland’s wealth management business in Ireland. Prior to founding Archive Capital, he was Managing Director and a member of the investment committee at Abbey Capital, a $7bn hedge fund.

8-10 October, Central London
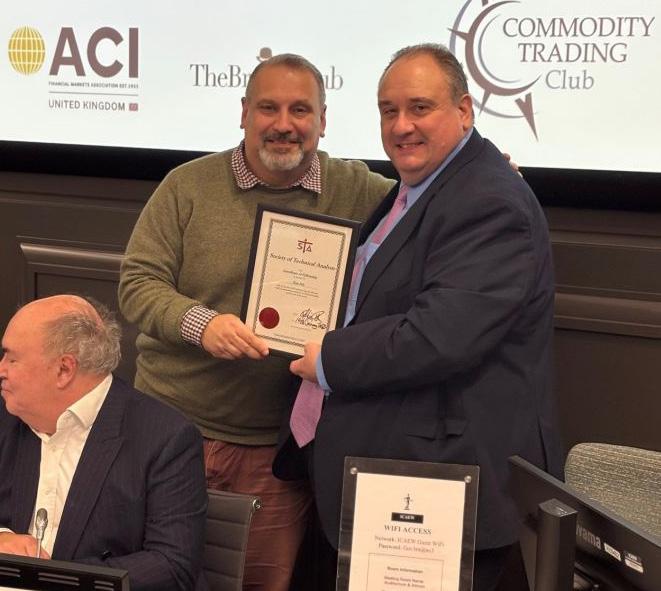
We are honoured and delighted to announce our latest Fellow of the Society.
Fellowship is awarded to those who have either greatly contributed to the field of technical analysis or to the development of the STA. We are indebted to them all.
Tom Pelc has over 35 years’ experience in the financial markets. He is the founder of Pelc Enterprises Ltd, an advisory to financial institutions and high net worth individuals, and is also Chief Investment Officer at Fortu Wealth, working with high-net-worth individuals and family offices.
He is a director of Amalfi Capital, a hedge fund.
Formerly employed by Nomura International plc for 7½ years as a Managing Director as the Co-Head of Macro Technical strategy, he has travelled the globe speaking with central banks, pension funds and hedge fund clients and Asset Managers.
Prior to Nomura, Tom spent 11 years as the Head of Technical Strategy at RBS plc. and before that, he was a trader and portfolio manager at a hedge fund responsible for a $2 billion portfolio trading listed and OTC Euro and US products.
He was in the top 15 of the McLagan list of traders for commission generation.

It is with great sadness that we announce the passing of Kevan Conlon, aged 58, of Stock, Ingatestone, Essex. Kevan was a much loved member of the STA community and will be deeply missed by all who knew him.
Born and raised in Cheshunt, Kevan was known for his warm personality, sharp intellect and unwavering dedication to his family. A devoted husband and loving father, Kevan took immense pride in his family and cherished every moment spent with them. His kindness, humour and generosity left a lasting impression on everyone fortunate enough to meet him.
Kevan’s professional life was marked by a passion for markets and a deep expertise in trading and portfolio management. Many will remember him fondly from the STA monthly meetings where his friendly demeanour, sharp insights and wealth of knowledge made him a respected and admired figure. He served as an STA board member from 1997 to 2004, contributing significantly to the organisation.
I had the privilege of meeting Kevan in the 1990s and I recall his enthusiasm for studying charts and discussing market trends. During his career, Kevan worked as a proprietary trader and held key roles at prestigious institutions, including Commerzbank, Citadel, and Standard Chartered Bank, where he shared his love of technical analysis. Though he rarely discussed his positions, he was always eager to collaborate and share his perspectives, leaving an indelible mark on his colleagues and peers.
Kevan’s legacy will live on in the hearts of his family, friends and all who had the honour of knowing him.
Following the success of the annual STA ‘Technicals to Trading Systems’ conferences delivered over the past 2 years, a need has emerged for a practical learning programme that integrates technical analysis disciplines within the development of trading systems, whether discretionary or automated.

While algorithmic trading is a focus of the course, particularly in the final lectures (e.g., Jeff Boccaccio’s lectures on fully automated systems), our course emphasises a much broader perspective on trading systems. It embraces a hybrid approach that combines discretionary and systematic elements, offering several advantages:
• The Kaufman Approach
Instead of relying on brute force parameter testing to find hidden patterns, our course starts with time-tested trading ideas and builds systems around them. This methodology ensures robustness and avoids overfitting.
• Degrees of

From fully automated strategies to discretionary systems (e.g. Stephen Hoad’s lecture on building a discretionary system), the course caters to varying levels of automation, allowing participants to choose what suits their style and objectives.
Our course integrates technical analysis and explores its efficacy in identifying trading concepts with a proven track record. Key strategies discussed include:
• Trend Following
A strategy backed by decades of hedge fund and institutional investment, showing enduring profitability

across timeframes.
• Reversion to the Mean Techniques for timing trades that capitalise on temporary price divergences from established norms.
• Indicators with a Track Record
Moving averages, range breakouts, and other indicators that have consistently shown value in trading.
Unlike the narrower focus implied by the term “systematic trading,” our course broadens the perspective:
• System Design Philosophy
Participants learn to build systems around established trading concepts, testing rules individually for reliability.
• Discretionary and Systematic Integration
The course emphasises the flexibility to integrate discretionary judgment with systematic rules, a valuable distinction for many traders.
The discussion on timeframes is a crucial differentiator:
• Short-Term Intraday Trading
Acknowledging the significant role of algorithms in
identifying fleeting intraday patterns, the course offers insights into these advanced techniques for those interested.
• Broader Timeframes
For those focusing on longer horizons, the course provides practical insights into strategies that go beyond shortterm patterns, emphasising the variety of profitable trading approaches available.
While algorithmic trading is an essential subset of trading styles, our course does an excellent job of contextualising it within the larger trading ecosystem. This holistic approach offers a well-rounded perspective, ensuring participants are equipped to explore diverse opportunities beyond purely algorithmic strategies.
Our course underscores a unique philosophy and content. By emphasising the breadth of strategies, the adaptability to various trading styles and a robust system-building approach, our course distinguishes itself as a practical and insightful resource for traders looking to develop a deeper and more nuanced understanding of the trading world.
To learn about our new ‘Technicals to Trading Systems Course’, starting April 2025, click here
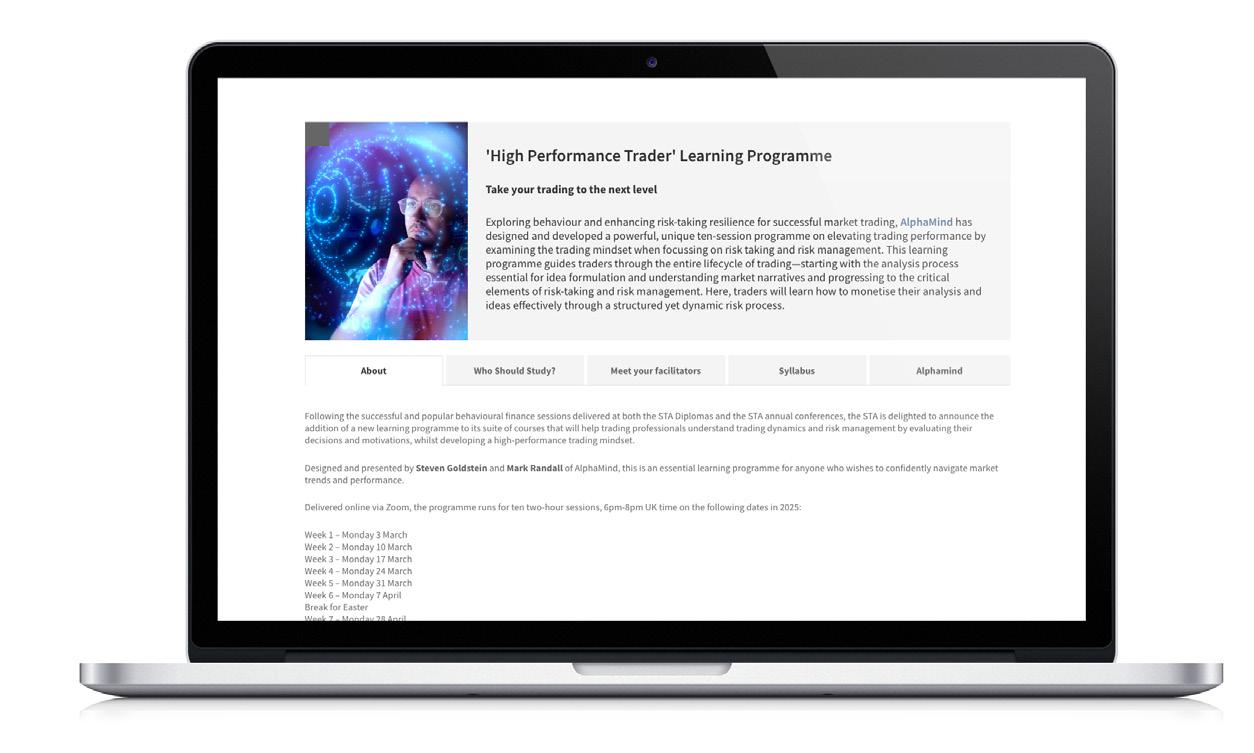
During the December meeting, Steve Goldstein gave an introductory talk about a new joint venture between AlphaMind and the STA – ‘The High-Performance Trader Learning Programme: Elevating Trading Excellence’.

© The AlphaMind Project Ltd, United Kingdom, Nov 2024, www.alpha-mind.net
Steve is a former trader turned performance coach and a familiar face at the STA. The course is a new initiative delivered by Steve and Mark Randall, co-founder of the AlphaMind Project. The programme is the result of Steve and Mark’s 70 years of front-line markets experience, thousands of hours of coaching and the interaction of their work with some of the largest Trading institutions on the planet.
The core principle driving the programme is that Trading Excellence and High-Performance bridges the gap between trading as a technical skill and trading as a performance discipline.
Steve’s career as a trader spanned 25 years, from the mid1980s to 2010, where he worked with major banks like Credit Suisse and Commerzbank. During this time, he experienced two distinct phases:
1. The Analyst-First Approach: In the early years, he focused heavily on market analysis but struggled with risk-taking—a core aspect of trading.
2. The Risk-Taker’s Mindset: Thanks to coaching sessions with Peter Burdett midway through his career, he underwent a profound transformation. He shifted from avoiding risk to engaging with it effectively. This change dramatically improved his performance and helped him view trading as an integrated activity where analysis, risk management and decision-making work cohesively.
By the end of his trading career, Steve had transitioned to coaching. Pre-Pandemic and drawing from his and Mark’s markets experiences, ‘The AlphaMind Project’ was formed, with its purpose to help other traders navigate the
complexities of trading by focusing, as a priority, on selfawareness, risk engagement and performance optimisation. While this was a conversation and a topic that had historically been kept in the shadows; it was now time for AlphaMind to be global thought leaders. Their now familiar Podcast with millions of listens underlines AlphaMind’s commitment to support the trading community, as does their coaching and workshop programmes and, of course, this initiative with the STA.
Trading is often viewed through the lens of analysis and strategy. While technical and fundamental analyses are critical, these are just tools. The real art of trading lies in:
• Developing the right mindset.
• Understanding and managing risk.
• Engaging with uncertainty.
When Steve started trading in the late 1980s, resources on these topics were sparse. Books like Reminiscences of a Stock Operator and Market Wizards offered inspiration but didn’t teach the mechanics of being a trader. That gap inspired this programme.
The goal of the High-Performance Trader Learning Programme is to address the ‘missing link’ in trader education—not just how to analyse markets but how to adopt the identity, mindset and process of a successful trader.
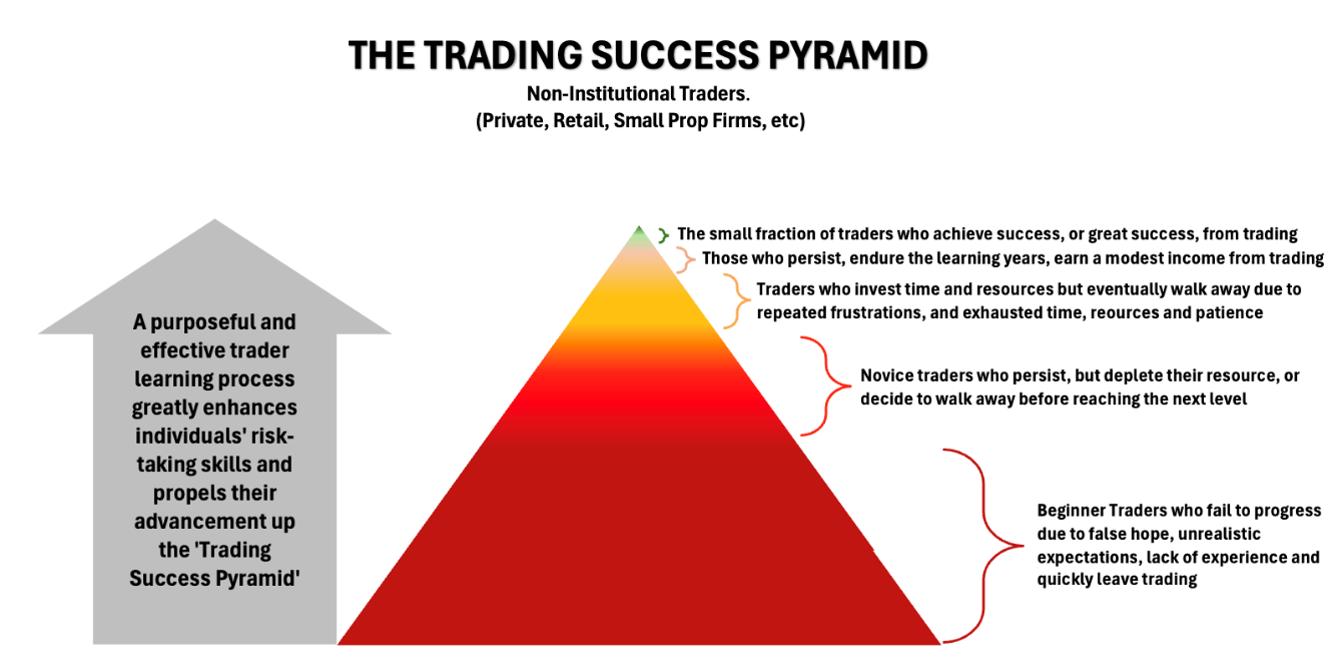
Success in trading is rare. Research suggests only a small
percentage of traders achieve long-term success. For example, a study of 400,000 day traders on the Taiwanese stock exchange found that only 1% generated sustainable income over time. In institutional settings the odds improve but the attrition rate remains high.
This programme aims to improve participants’ chances of moving into the upper echelons of trading success. By fostering a deeper understanding of risk, human behaviour, and trading as a performance activity, Mark and Steve aim to help traders catalyse an enhanced level of performance
The High-Performance Trader Learning Programme is designed as a non-linear, experiential learning experience. Here’s what sets it apart:
1. Integrated Approach:
• Combines market analysis, risk and human behaviour.
• Avoids treating trading psychology as a standalone topic. Instead, it’s integrated into the broader trading process.
2. Non-Linear Learning:
• Emphasises dynamic engagement rather than rigid instruction.
• Encourages participants to explore models, frameworks and real-world examples.
• Adapts to the diverse needs of traders from different styles and asset classes.
3. Peer-Assisted Learning:
• Participants learn from each other through shared discussions and group activities.
• Real-world experiences from attendees and facilitators are brought into the conversation, enriching the learning process.
4. Iterative Process:
• Topics are revisited and expanded upon over time, allowing deeper understanding and constructive reflection.
• Participants bring their weekly experiences to each session, fostering continuing growth.
5. Experienced Facilitation:
• Delivered by Mark Randall and Steve Goldstein, jointly leveraging their decades of trading and coaching expertise.
Format: 10 live, two-hour Zoom sessions.
Duration: March to June.
Group Size: Limited to 25 participants for an optimal learning experience.
Audience: Suitable for intermediate and advanced traders, analysts, and risk managers. It is not recommended for beginners who are still mastering basic trading concepts.
By the end of the programme, participants will:
• Develop a cohesive understanding of risk as a process.
• Enhance their ability to engage with uncertainty and pressure.
• Build a trading process that aligns with their personal identity and goals.
• Gain insights into diverse trading approaches and styles.
• Improve their productivity and effectiveness in trading activities.
Trading is a performance activity in the same way as sport, music, or gaming. Success requires discipline, self-awareness and continuous improvement. The HighPerformance Trader Learning Programme is a significant step forward in trader education, designed to help participants move up the ladder of trading success.
For those ready to elevate their trading game and unlock their potential, this programme offers an opportunity to gain the edge needed to succeed in a highly competitive field.
The STA and AlphaMind are excited to embark on this journey with you. Here’s to advancing the art and science of trading together!
Learn more about The High-Performance Trader Learning Programme.
Don’t forget that the STA is active on LinkedIn, X, Facebook, Instagram, YouTube, Spotify - and even Tiktok!
Across these platforms you can keep up with the latest market news, member activities, interviews and watch short educational videos with STA’s content editor, Karen Jones - former Managing Director, Commerzbank.
Click on the icons to find us and follow!

Perry Kaufman is the author of the well-known Trading Systems and Methods, and more recently Kaufman Constructs Trading Systems and Learn To Trade. He is an active trader and has spent his career as the architect for trading systems used by institutions and funds, often partnering with those firms. His experience includes commodities and equities. He has traded and managed money through the U.S.-Russian wheat deal of 1973, 20% interest rates of 1980, the stock market crash of 1987, the internet bubble of 2000, and the subprime crisis of 2008, and now the Covid pandemic. He understands risk control and believes that not all trading needs to be complex to be profitable. Perry can be reached through his website, www.kaufmansignals.com
When we decide on a new strategy, we want to know the chances that it will work in the future. While many analysts look for the best parameters that worked in the past, I think that is the wrong approach.
Whether we want to admit it or not, optimisation is an important part of system development. But it is the interpretation of the results, more than the process, that is most important. The process is important because some methods require a lot of data and still do not give you enough information to make the right decision.
Optimisation is the process of finding the best parameters for your strategy over a particular time period. But most analysts agree that the best parameters in the past are not likely to give you the best results going forward.
The reason is simple: the method has fine-tuned the parameters to specific price moves. It may have found the highest profit from a price shock that is not likely to happen in the same way next time.
To avoid that problem, theory says that you choose a test period that has a variety of market action, bull and bear markets, high and low volatility and a few prices shocks. The more data you use, the less chance of overfitting and the lower the results. On the other hand, if you choose a short test period that you think represents the current market, you are sure to be proved wrong.
But optimisation is very clever. It can look past ‘robustness’ and still find the combination of parameters that avoided the downturn and profited from a few upward price shocks.
I would like to use the same testing method to show that a system is robust such that it will generate profits and limit risk for many combinations of parameters.
There was a recent article in Technical Analysis of Stocks & Commodities, “Boost Your Strategy Development,” by Rene Koch, that summarized some optimisation methods:
• Random search: Picking parameters randomly. Requires many iterations.
• Hill climbing: Follow one parameter to its best value then move laterally to the next parameter and find the highest value. It can end up with a local maximum rather than the best value.
• Shrinking Window: Use a randomised method that homes in on the best, something like a genetic algorithm.
• Bayesian optimisation: Uses prioritised parameters in a sequential search and is best for small dimensions with continuous functions.
• Grid search: The beat-it-to-death approach of trying every combination. This is mostly what we use!
• Particle swarm: Another method with similarity to a genetic algorithm, focusing on areas of good results, which can often find a local maximum.
• Sequential model-based optimization (SMAC): Uses regression to explain parameter selection. An impressive article but personally I don’t think we need anything this sophisticated.
As sophisticated as they are, these methods often find a local maximum rather than the best result. So, the grid search is going to be best. If you have a lot of tests, then spacing the values out to reduce the number of tests will give you a good idea of the solution. Then you can narrow it down and retest.
I created a classic genetic algorithm solution and published it in detail in my book, Trading Systems and Methods, 5th edition. I removed it in the 6th edition because it seemed too much for readers. However, the results were excellent. But it too could find a local maximum. To avoid that, I ‘seeded’ the test with random numbers and ran the test 10 times. If I got the same solution, or nearly the same, then I was satisfied that I had found the best.
But be careful! If your test shows profits in only a small area and you then focus on that area, you are ignoring the fact that the underlying strategy is not robust.
A big problem with most optimisations is that they give you only one solution, the best. It’s up to you to then vary the parameters to find out how ‘sensitive’ they are. Does the profit and risk change dramatically when the parameters only change a little? If so, the solution isn’t good.
You need to know the parameters that led to the final choice and the corresponding return and risk. The only optimisation that records the results of each step is the simple grid search where the results of each parameter combination are listed. If you sort the results best to worst, you can then see how the last 10 or 20 parameter combinations compare. If only a few parameters changed and the returns are similar, you have a good solution. You don’t need a sensitivity test.
My own approach is different. Using a simple example, I test a moving average for a range of parameters that I consider ‘reasonable’. If I am a long-term trend follower, I would test from 30 to 120 days. I use the average of all tests to judge the worth of the strategy.
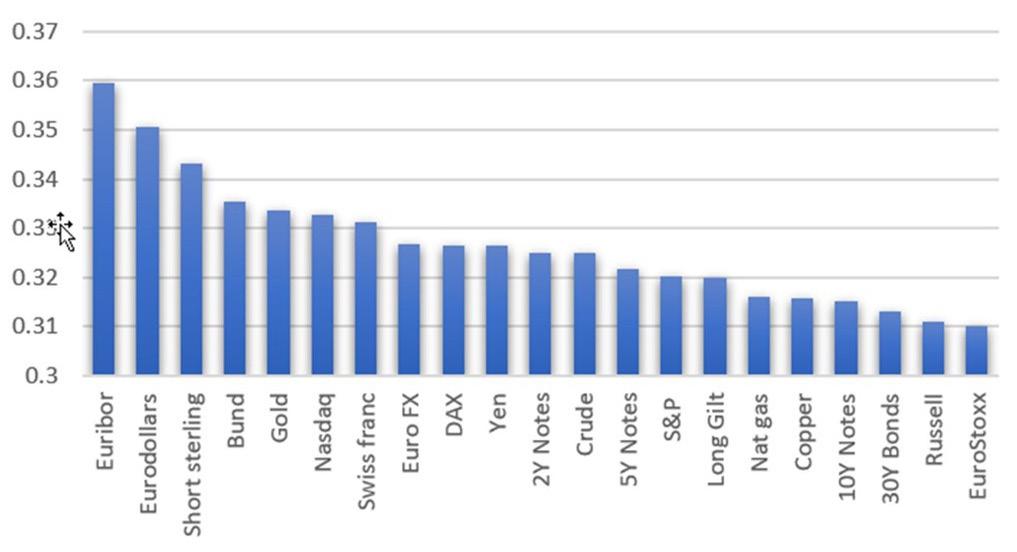
Because I’ve traded for so many years, testing markets over and over, I know that some markets are more trending than others. If you need to test that concept, apply my ‘efficiency ratio’ to the markets. The higher the ratio, the more trending.
As an example (see Chart 1), let’s look at the most trending market: Eurodollar futures. The least trending market will be EuroStoxx. In general, interest rates are the most trending. Of those, short-term rates trend more than long-term rates. FX (against the U.S. dollar) are the next best trending markets. Index markets have a long-term trend but are erratic in the shortterm. As with most other markets, they have periods of trending and non-trending.
Source: Technical Analysis of Stocks & Commodities, Jan 2023, ‘Matching the Markets to the System.'
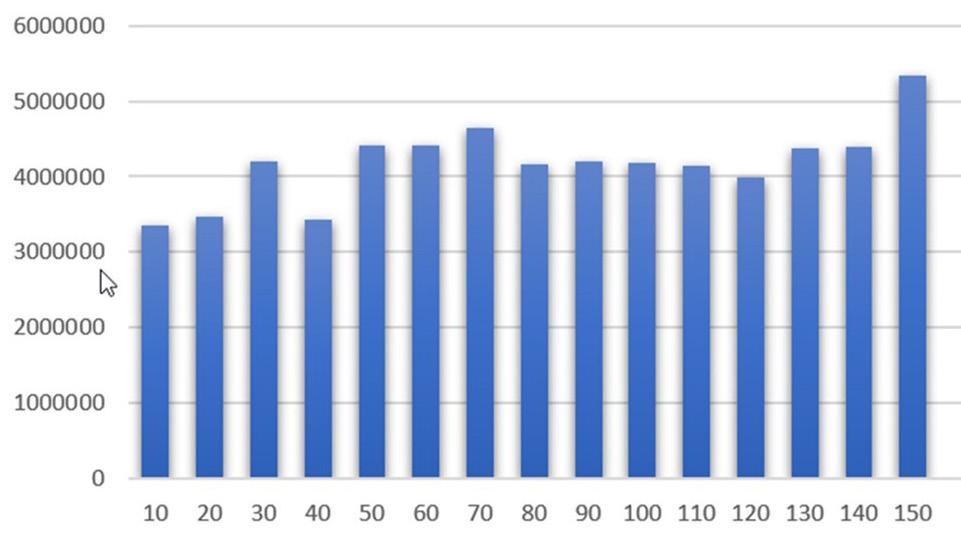
Let’s look at the best and worst in more detail. The Eurodollar test in Chart 2 shows that all moving averages from 10 to 150 days produce profits of nearly the same magnitude. I would call that robust.
trends from 2000.
Source: Technical Analysis of Stocks & Commodities, Jan 2023, ‘Matching the Markets to the System.'
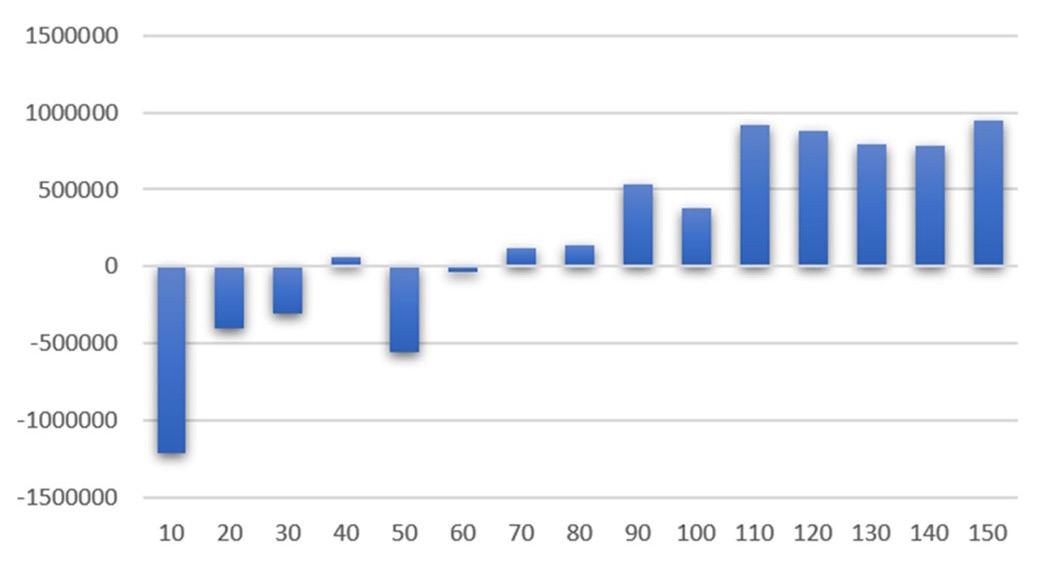
In Chart 3 we see the same EuroStoxx test (long-only). The pattern shows no significant trend profits until we use a 90-day moving average. It is typical of equity index markets – noisy in the short term but an underlying upwards trend in the long-term.
Source: Technical Analysis of Stocks & Commodities, Jan 2023, ‘Matching the Markets to the System.'
These two examples show robustness in Eurodollars and less so in EuroStoxx. We learn that equity index markets have a long-term trend, a valuable piece of information.
Some analysts believe that you should test all of the parameters at the same time. That is, the choice of values for one parameter can affect the selection of other values and ultimately the total return. It is true. The most optimal set of parameters will come from a fully integrated test.
But I think that the problems offset the rewards. First, you get an extreme overfit solution. Even more important, when the system does not perform as well as expected, you have no idea which parameter(s) is(are) at fault.
Keeping with the idea of robustness, if a strategy has more than one parameter, I test each parameter separately, beginning with the most important (usually the trend calculation period) and moving down to the least important whatever that isperhaps profit-taking or volatility extremes.
In each test you want the choice of value to improve the average of all tests. You do not want to see a few values improve drastically while others are much worse. For those statistically minded, you can see that by applying kurtosis.
When each new parameter satisfies the criterion of robustness, the final strategy is likely to be sound. If performance deteriorates, you can retest the individual parameters to see which has failed. You have control over the process.

Being able to test a range of parameters in your strategy is essential for success. But you are not looking for the best parameter. You are looking for the average of all tests and a consistent pattern.
Once you have that, which parameter do you choose? You don’t know which will be best next month or year but you know that most of them will be profitable. The answer is simple – choose at least 3 parameters across the span of tests and then trade them as three separate systems, each with 1/3 of your investment, netting out the signals. If two trends are up and one is down, you trade 1/3 of your investment on the long side. It gives you the effect of scaling in and out of a trade.
Co-authored by Robin Griffiths, FSTA & Ron William, CFTe MSTA
RWA Website: www.rwadvisory.com
T3 report Substack: https://ronwilliam.substack.com
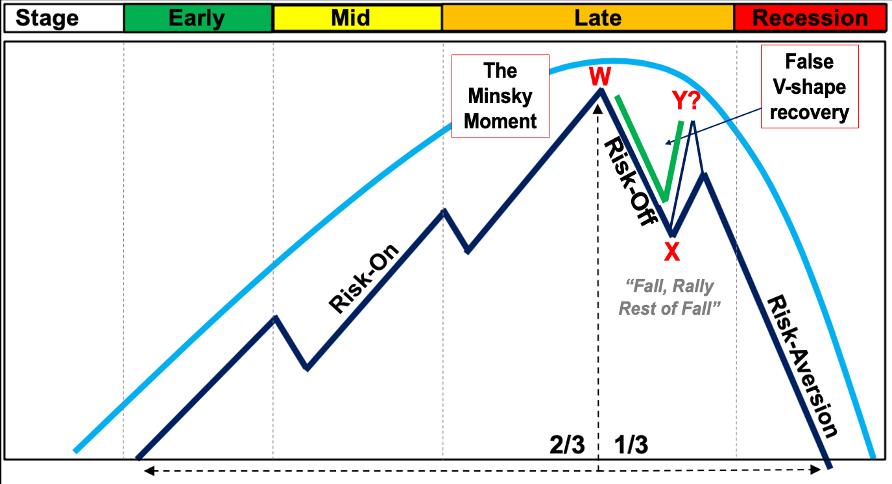
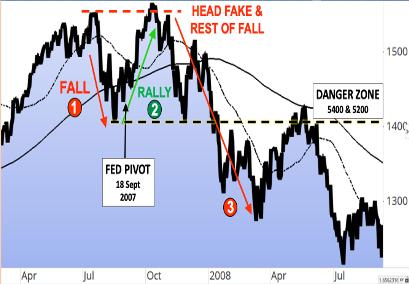
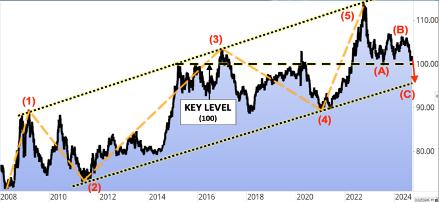
When you have climbed up a mountain as far as it is possible to go, predicting your next direction is easy. There is only one way to go and it is downwards. Staying on some wonderful high plateau and walking like a fairy with the Gods is not going to happen. Of course, on a real mountain it is misty and stormy and it may not be possible to tell how near the actual summit is, but even in the mist you should get an idea that it is close at hand.
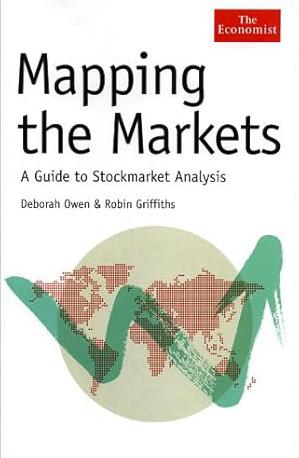
Robin Griffiths' career debut in the City of London was in 1966, joining the large stockbroker Phillips & Drew, from a background in mechanical engineering. He came from Joseph Lucas Industries , where price data analysis was then based on the same approach used with engineering data, such as regression analysis. This was considered a breakthrough at the time and developed into the original, now expanded “Roadmap Signature model” (Figure 1). Most investors used a ruler, connecting the highs or lows, resulting with a trend-line on the threshold of breaking.
Source: Mapping the Market.
Robin’s regression approoach didn’t measure the giants or the dwarfs of the population, but the average mean. It resulted with two parallel lines. These were 1-2 standard deviations with a 95% probability. It helped signal a trend change.
It also became quick to notice that when the trend changed, there were certain regular patterns.
In fact, cycles were occurring. With his degree in economics, he applied the cycles taught by Harvard Professor Joseph Schumpeter (Figure 2). These proved a good explanation for some of what was going on.
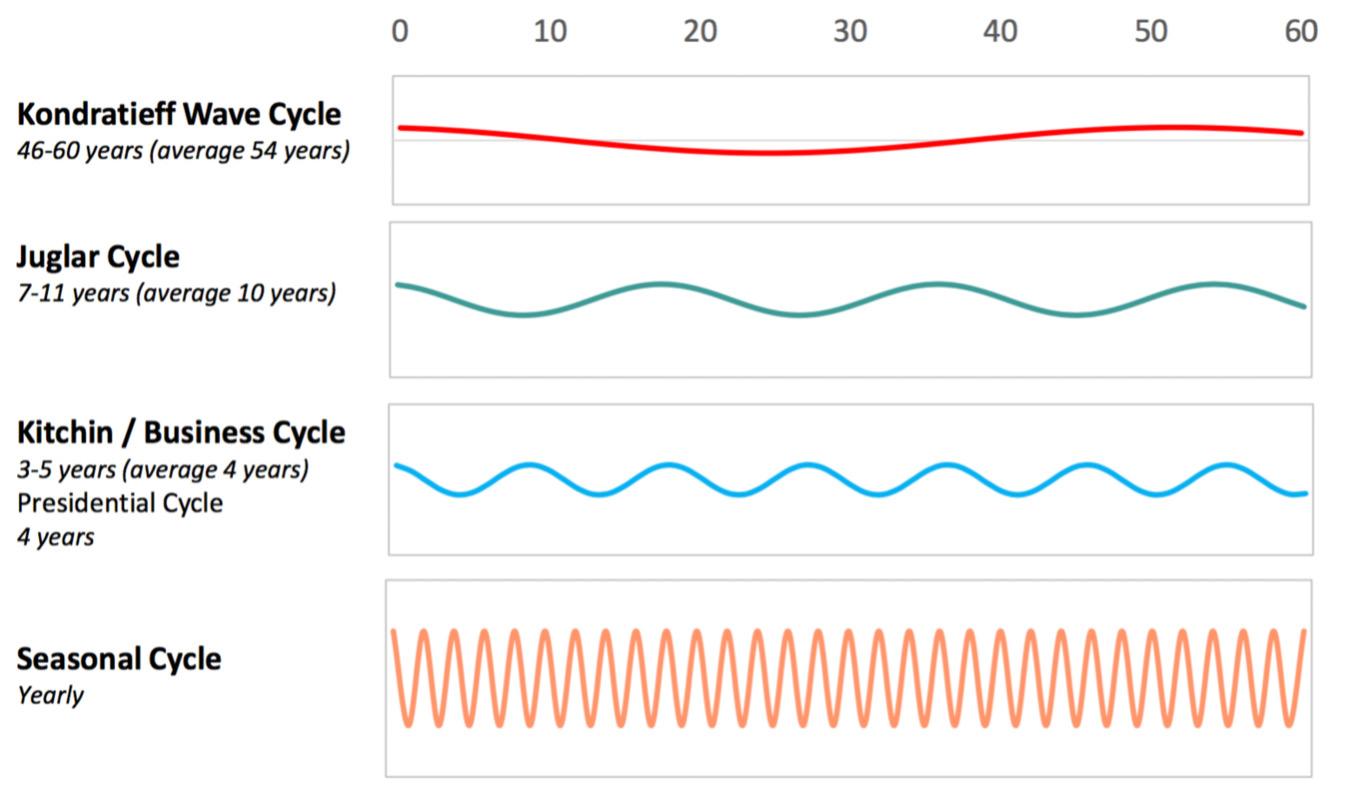
We need to break here and explain that sometimes a share price can go up top to hit a high and then fall back to make a low. This process can go on a long time and is repetitive, but it is not a cycle. There is no sinewave involved. The swings can be random. However, the cycles being measured were fundamental and cyclical (Figure 3) They could be projected into the future with a high probability of getting the correct answer.
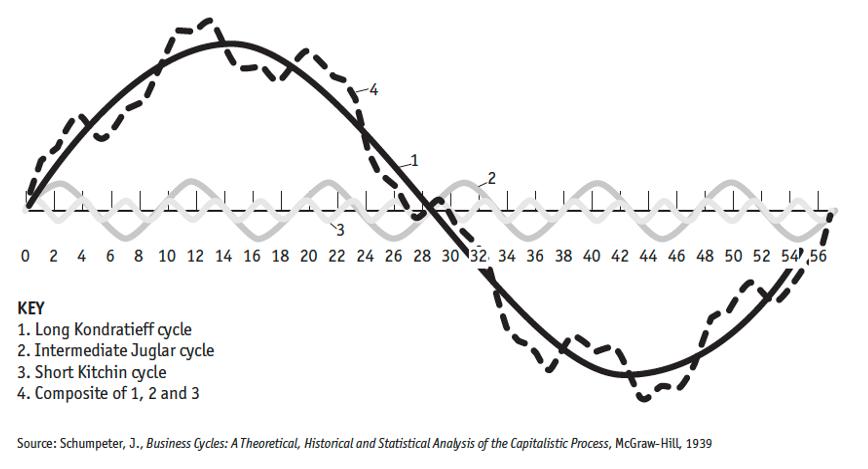
For many years the main cycles used were from Schumpeter, supported by good economic data and with a seasonal deviation in any year. Robin was able to draw out roadmap predictions of how markets could progress based on these cycles, driven by a special shape that buyers and sellers could produce by interacting with each other.
This shape would typically make a bull-trend, a five-legged animal, and a bear phase, a three-legged affair of a “fall, followed by a rally, then the rest of the fall”. For years Robin published these on almost all major stock markets. The bottom-line is that although some moves can be random, in all real markets trends appear more frequently and persist for longer than the laws of chance a llow. Several key insights are published in Robin’s co-authored books themed, “Mapping the Markets” & “Future Storm”. (Figure 4).

This evolutionary journey helped develop the Trend Ranking Model (TRM). There is a probability that if high momentum is present, there is a small chance of it changing again just after you have bet on it. This led to dividing trends into quintiles: strong up; a little up; neutral; a little down; and a lot down. Selection only from the top group will easily beat the index. Many investors know how difficult it is to beat the index. They usually try to do it by dealing in small market cap stocks when they have good inside information.
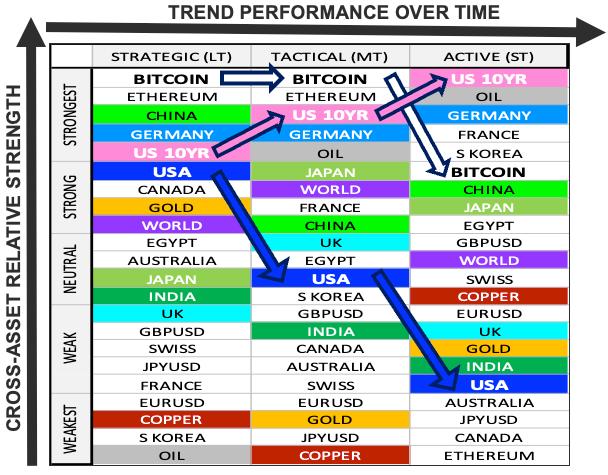
Our system is different. You deal in stocks that are in the index but only have the strongest moving quintile. We have run this as a system across global, multi-asset and found reliable performance. The weakness of the system is volatility. Some markets are more volatile than others and this makes following the system hard to do although the giant markets work well. Currently, the global ranking model signals a tale of two stories, of Trump 2.0 election fever, now shaking out, juxtaposed by fear resurgence, both in terms of legacy volatility post-election inauguration season, coupled with a rise of inflation expectations (Figure 5). Watch Gold surge higher again following the unwind from overbought conditions.
Source: RW Advisory
Looking back at history, the pattern analogue for markets now is similar to the top in 2008 (Figure 6). Most markets then fell 50%. Notice how at the top it developed a 3-stage corrective pattern, starting with a fall, then a rally to new all-time high. That was a bull-trap pattern, followed by a crash. There is a growing risk for a similar pattern and therefore we don’t recommend waiting until the end of the uptrend. The downside risk is huge. There are variations of historical rhyme scenarios, good, bad & ugly. Think big, bad, and probably long lasting. Watch the equivalent S&P500 danger zone, on sustained confirmation below 5400 and 5200, for further bearish scope.
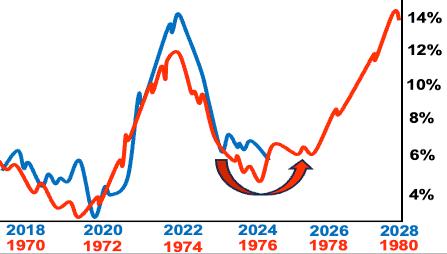
The complicating thing is that we could get a burst of inflation first or rolling waves of volatility akin to the 1970s (Figure 7). Our long-term cycles suggest this will likely be amplified from H2 2025 onwards, with more disruptive risks to follow into the end of the decade by 2028-2030. The USA is printing money at such a rate that it seems it wants to beat Weimar. A burst up is possible but we are clear that after it we are coming way lower than it is now. We want out and owning Gold is the only best hedge we can find.
Source: RW Advisory, Bloomberg
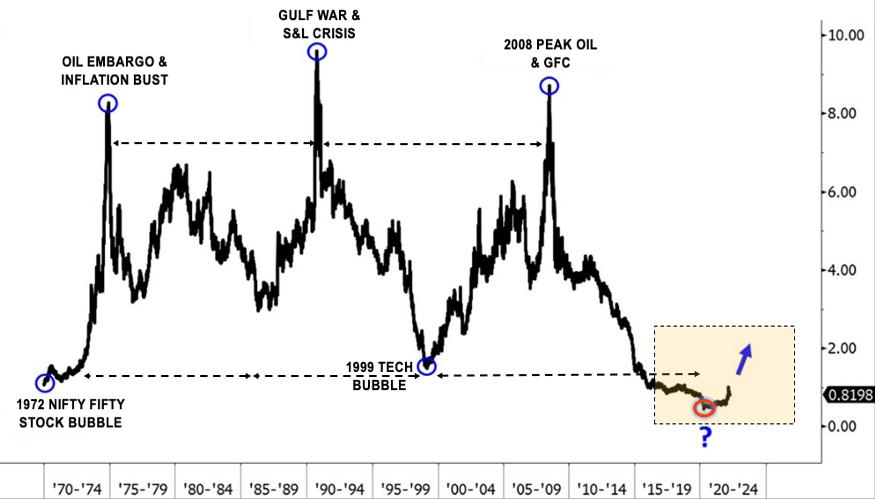
When ranking all assets together, Gold comes out at the top. It is probable that commodities will also have a huge new bull period, starting as they do from very depressed levels (Figure 8). This is not signalled yet, but could give a signal soon by three key factors:
1) Relative outperformance
2) Structural inflation
3) USD weakness
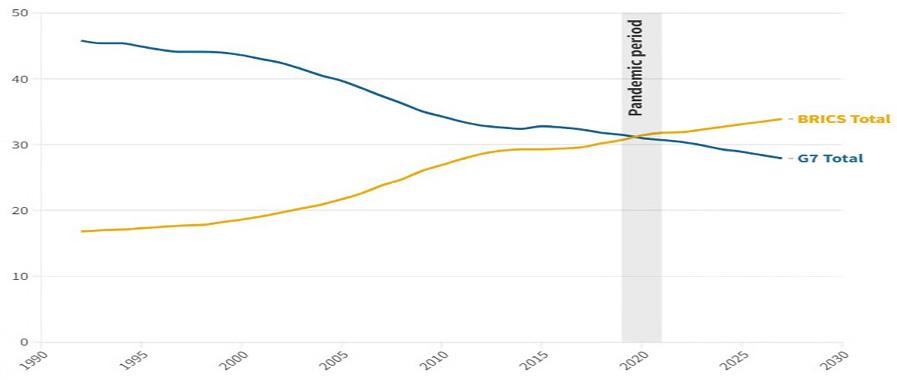
We worry about many things in the world. How many wars do we need before becoming scarred? There is also a real growing concern the USA hegemony is already losing its power, most notably with its USD global reserve currency status. BRICS, as part of a fast emerging new world order, including others, have all agreed not to use USD in the old way. The clincher was when Saudi Arabia agreed to sell its oil in other currencies. The USD will still be a big currency, but to a lesser degree and as part of a transition to a new multi-polar world (Figure 9). The USD premium will likely evaporate.
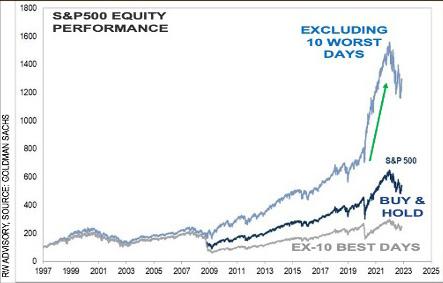
One last point, as part of the theme of behavioural sentiment, is that during a late cycle phase, risk management is paramount over bottom-line performance. If we look at what has happened in the past then if you only missed out on the ten best days in the year, you massively underperformed the index. However, if in fact you only missed the ten worst days of the year then you massively outperformed. The bottom-line is that Fear or Fear of losing out (FOLO) beats greed or FOMO, during volatile markets. So get out relatively early and avoid the crash. You don’t have to see the top of the mountain, leave while you still can!
Hosted by Real Vision

CNBC “Market exuberance will unwind in 2025” Real Vision “Trump 2.0: Melt-Up or Cycle Peak?”

With increased inflation volatility and several assets reaching record highs, it’s increasingly complicated for investors to navigate the markets. RW Advisory CIO & macro-tactical strategist Ron William, CFTe, welcomes market veteran Robin Griffiths, FSTA, investment strategist at RW Advisory, to share how he approaches global markets by studying behavioral patterns and cycles.

Robin Griffiths is Senior Advisor & Investment Strategist at RW Advisory.
Robin has served as Head of Multi-Asset Research & Advisory at the ECU Group. He was Chief Technical Strategist at HSBC Investment Bank for 20 years before becoming Head of Global Asset Allocation at Rathbones and then a director and technical strategist for Cazenove Capital Management. Robin was a Partner of WI Carr and Head of Technical Analysis at Grieveson Grant.
Robin is a committee member and former chairman of the International Federation of Technical Analysts and former chairman, now Fellow, of the British Society of Technical Analysts. Robin has been a member of ECU’s Global Macro Team for over 20 years. Robin has won several Technical Analyst awards for his research.

Ron William is founder & CIO of RWA, an award-winning macro-tactical, research and advisory firm, dealing with a wide range of financial institutions & professionals and producing differentiated alpha, insightful idea generation and unique market timing.
He specialises in a global, multi-asset, top-down framework, grounded in behavioural technical analysis, driven by cycles, based on the expanded "Roadmap" signature model of veteran market technician Robin Griffiths, originally published in Robin’s book “Mapping the Markets.” Additional insights also featured in their peer interview exchange hosted by Real Vision, T3 reports and Halkin letter contribution.
Driven by impactful education, Ron trains financial institutions and serves on the board of a variety of professional societies, notably as MENA director, education committee member of the International Federation of Technical Analysts (IFTA) and Development Director at the Foundation of the Study of Cycles (FSC).


DR. SUNNY J. HARRIS
Sunny is a full-time trader (44 years) and frequent contributor to trading magazines and speaker at trading webinars and seminars. Sunny was rated #1 trader in the under $10 million category two years in a row, by Stark Research, achieving 365% profit and 178% profit.
www.moneymentor.com
In this article I’m introducing a technical indicator that I have been using in my private accounts for the past 37 years: SunnyBands. I’ve been trading professionally for 44 years but it was an intense 18 months of research, developing the mathematics, programming and debugging to create my Dynamic Moving Average, which is the cornerstone of SunnyBands. SunnyBands is not Bollinger Bands, or Keltner Channels or any other moving average volatility bands.
The difference between SunnyBands and all the other possibilities is dramatic. The key to its success is that I developed original mathematics to dynamically calculate the slow and fast lengths of the moving averages. That is, it doesn’t use inputs for those values but, rather, calculates the values dynamically on its own.
I have never told anyone the mathematics underlying my DynamicMovingAverage (DMA) and/or SunnyBands™, but I’m going to get into some depth in this article. No, I will not reveal the mathematics or the code (that’s a closely guarded secret) but I will tell you how I trade them and about the successes of trading with them.
I started trading in 1981. We didn’t have personal computers then or any trading software. We had graph paper, pencils and a calculator. That’s when I started. We could subscribe to the myriads of newsletters (and I did) and we could watch financial TV.
Quickly finding that many of the newsletters were contrary indicators, I set out to conquer the world of trading, as most new traders do.
The S&P 500 futures contract began trading in 1982. The Emini futures contract began trading on the 9th September 1997. When I first started trading it in 1982, the ‘big boy’ had a margin requirement of $50,000 and commissions ranged from $50 - $90 per side. Personal computers were launched by Apple in 1976 but were not immediately in every home.
CompuTrac (Jim Schmidt & Tim Slater) was the earliest technical analysis software, originally made in 1979. Omega Research (which became TradeStation) brought out System Writer in 1987. Before TradeStation, I was using a MacIntosh programme called Enhanced Master Chartist by Roberts-Slade. But with the advent of TradeStation I made the switch forever. I have been using TradeStation since 1987 and speak their EasyLanguage fluently
In my early trading career, I found that Moving Averages (of all types) didn’t do what I needed for a trading strategy. Using the crossovers, I found that Moving Averages lag market movement. While they work well during trending periods, they just generate a lot of churning (whipsaw) in non-trending markets.
Let me show you an example: see Figure 1 below -
The central tenet of my research was to formulate a moving average that would adjust to the trend (or lack thereof) of the market internally to the mathematics. I didn’t want to specify lengths for the fast length and slow length as input values but wanted mathematics to adjust dynamically to market conditions
When I initially began to design and test the mathematics of the programme I was developing, I started with tables and arrays. I wondered whether a table of input values for different market conditions would work. I tested, coded and tested some more. It wasn’t what I was looking for.
Number Theory was one of my favorite maths courses. That and Linear Algebra.
Number theory is a branch of mathematics focused on the properties and relationships of integers. It deals with a wide range of topics such as prime numbers, divisibility, modular arithmetic, Diophantine equations and number patterns.
Linear Algebra is a branch of mathematics that studies vectors, vector spaces (also known as linear spaces), linear transformations, and systems of linear equations. It is fundamental to both pure and applied mathematics and is widely used in physics, computer science, economics, engineering and data science.
Love of these courses led to my master’s thesis, which was about generating formulae with a computer that would fit smoothly to the underlying data and still be valid at the inflection points. Until that time, computers could not produce a smooth fit over the data set but rather had to do two different equations for the two situations. My work solved that problem with matrices and matrix multiplication.
I used this original work in creating my Dynamic Moving Average (DMA). With innovative mathematics I have a moving average (actually two) that dances smoothly with the market.
Figure 2 shows some of the math in the programme:
2: Some of the equations in the Dynamic Moving Average (DMA)

Graphically, you can see how it dances with the market through trends and whipsaw in Figure 3 below:
3: Dynamic Moving Average
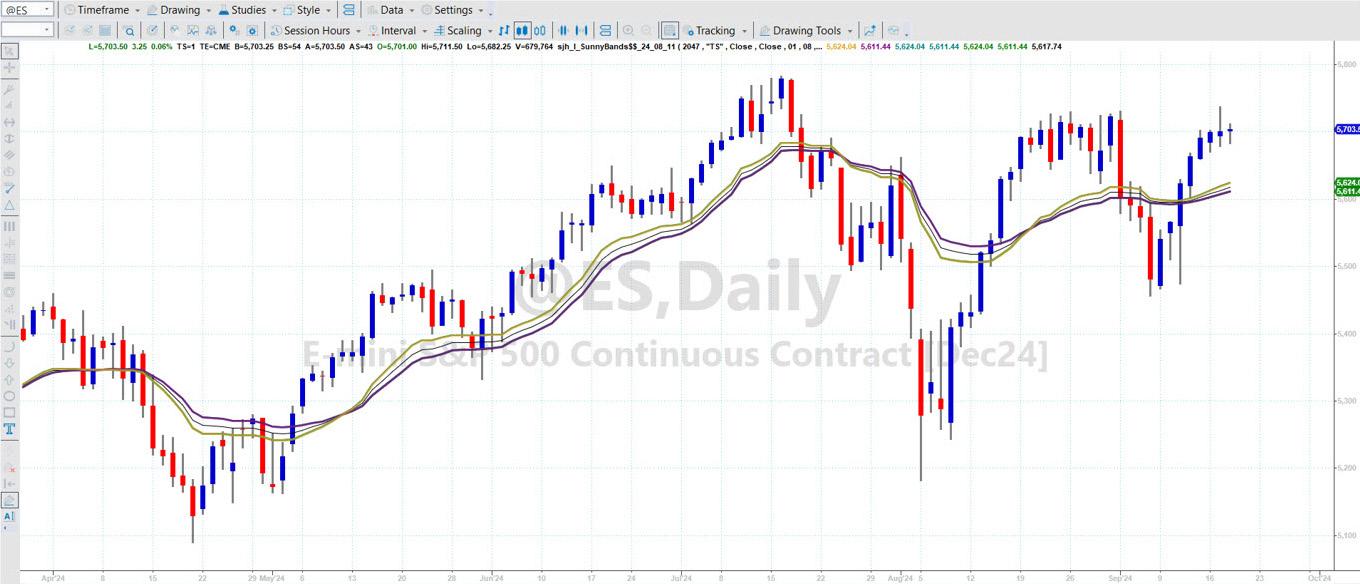
The market has a kind of inertia: when it’s going sideways it tends to continue until broken and when it’s trending it continues to trend until broken. With that in mind, I added bands to the DMA using Average True Ranges (ATR) which tell me how far the market is likely to go. Since the calculation of the bands depends on the maths of the DMA, the bands themselves are dynamic. Figure 4 (below) shows SunnyBands (which includes the DMA, the gold and purple lines in the centre) on a daily chart of the ES continuous contract.
The beauty of these variable bands is the way they predict future price movement. My primary rule is to stay with the uptrend as long as the slope is positive and gold is on top in the DMA. To stay short as long as purple is on top, I enter long at the lower bands when price makes two blue bars or when price closes above the Lower Inner Band (LIB). I enter a short when price closes above the Upper Outer Band and retreats, either breaking the Upper Inner Band (UIB) or on two red candles.
When the DMA is flat - it has a slope less than 5 degrees and greater than -5 degrees - I hesitate and wait for more information. There are more explanations on my website: www.moneymentor.com.
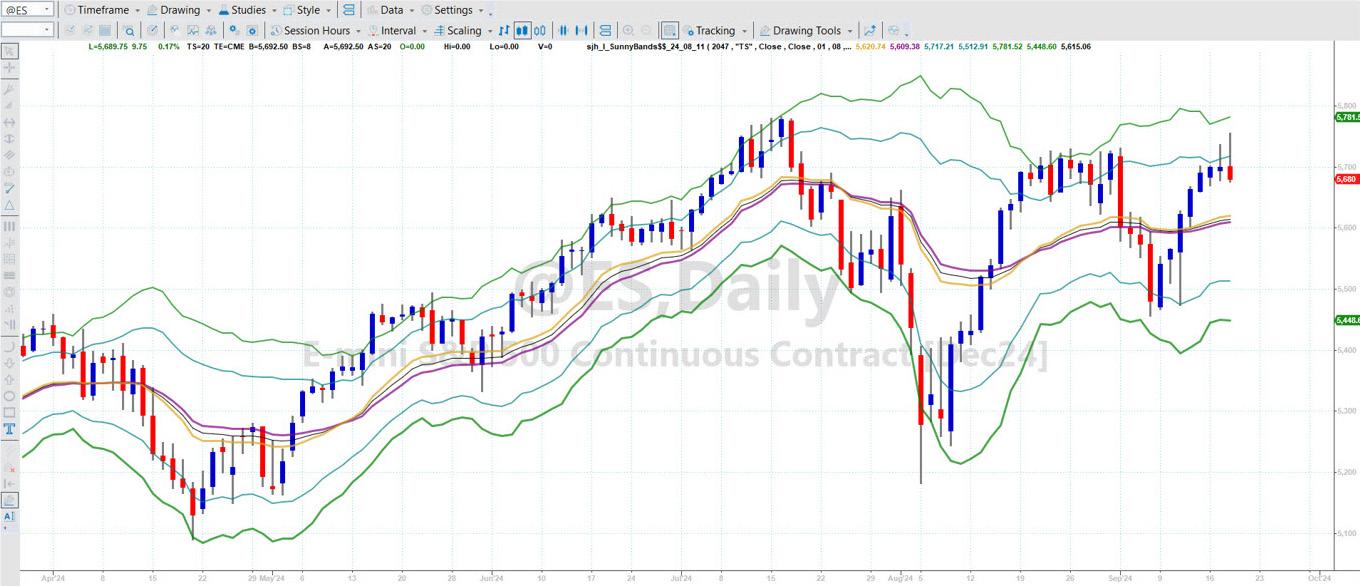
Because of the dynamic control of the moving average lengths in the maths of these indicators, they work on any timeframe and on any symbol. Figure 5 (below) illustrates SunnyBands on the 15-minute ES. I have added another little indicator that paints the after-hours session in different colors from the day session. I don’t want to think about anything extraneous while I’m trading so this just makes my life easier.
Notice the bands indicator’s movement to the extreme and reversal from that level.
I have another indicator that I wrote many years ago which plays a small sound file (.wav) with every tick of the chart it’s on. If it’s an uptick I specified a ‘bing’ sound; for the downticks it plays a ‘bong’ and for sideways ticks it plays ‘click’. You might think that would be irritating but after 25 years of listening to it while I trade, I depend on it. I can hear which direction the market is going and how fast. It’s like the good old days when there were traders on the floor of the exchange. The indicator is called BingTicks. If you have TradeStation and want it just give me a ring and I’ll send it to you for free. And if you want to try out SunnyBands for free, I’m happy to set that up for you as well. Just let me know.
Sunny J. Harris
1-760-908-3070
sunny@moneymentor.com

Karen Jones is Vice Chair, Treasurer and Content Editor for the TA. She was formerly Managing Director and Head of FICC Technical Analysis Research at Commerzbank Corporates and Markets.
The Relative Strength Index (RSI) is widely known as a tool for identifying overbought or oversold conditions in financial markets but it offers far more insight than many traders realise. As a former professional technical analyst at a major bank, I frequently used the RSI to find optimal entry points, particularly when analysing the EUR/USD currency pair. While the RSI is often seen as a simple tool, its versatility can provide traders with a deeper understanding of market momentum, trends, and potential turning points.
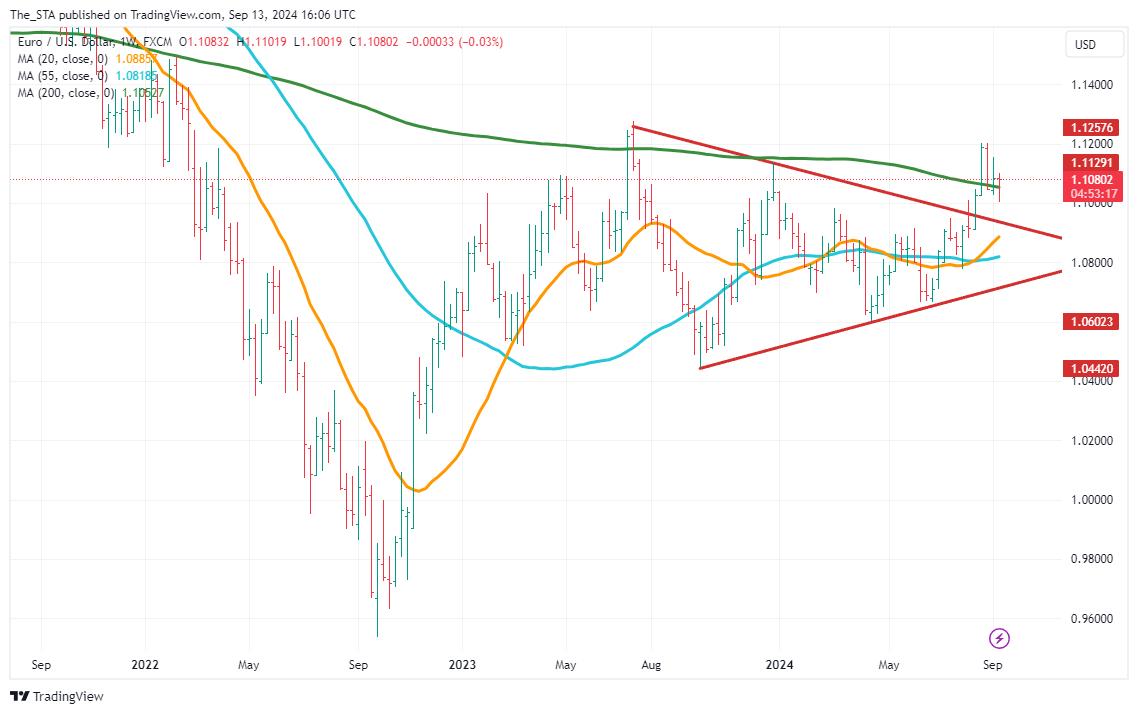
When evaluating the EUR/USD weekly chart, I identified a classic symmetrical triangle pattern that had recently completed, with the price breaking to the upside. In technical analysis, such a breakout is typically bullish, but it is common for the market to revisit the breakout point - a retest of prior resistance, now turned support. In this case, the potential retest zone hovers around 1.0930. As long as the price remains above this level, the breakout holds and the bullish bias remains intact. This area also serves as an ideal reference for placing stop-loss orders to manage risk.
Source: TradingView.
Given the bullish scenario, the next question is: How far might the market pull back before resuming its upward trend? To answer this, I shift focus to shorter timeframes, such as the daily and 4 hour charts, to find precise entry points.
This is where the RSI proves invaluable. On the 4 hour chart, I’ve identified oversold conditions based on the RSI, signalling potential buying opportunities. While the price might not fully retrace to 1.0930, using the RSI and adjusting the timeframe
allows for more flexibility in decision-making. By entering positions when the RSI indicates oversold conditions and setting stops in line with the symmetrical triangle’s breakout level, I can better time market entries while controlling risk.
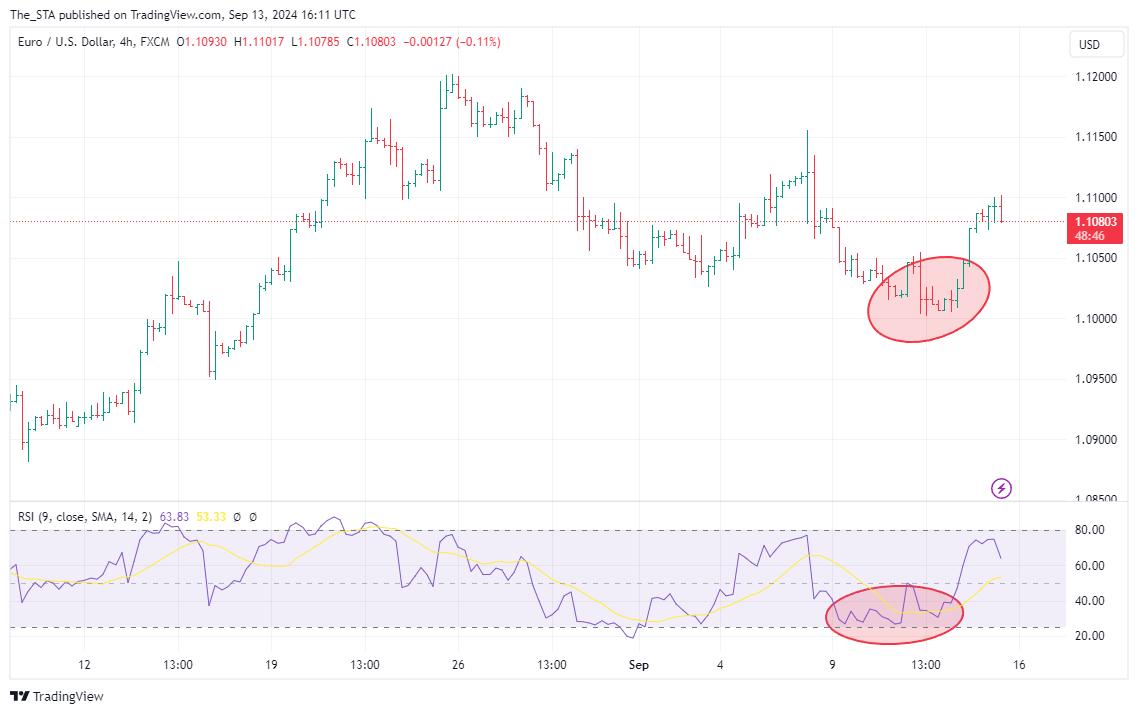
Remember, the price might not drop all the way to 1.0930 so you’ll need to decide when to enter the market. Using the RSI and adjusting down time frames can help you make that call with your stop already in place.
In Figure 2 we can see that the market was finding some support about 1.10 and we can see that the RSI was indicating oversold on the 4-hourly chart. Given that we already expected the market to halt ahead of 1.0930, this offered a decent entry point.
Most traders are taught to view an RSI reading above 70 as ‘overbought’ and below 30 as ‘oversold’. While these standard levels can be useful, they are not always reliable, especially in trending markets. This is why it's important to adjust RSI parameters based on the specific market conditions.
For instance, while analysing the USD/JPY daily chart, I observed that the typical 70/30 thresholds weren’t producing effective signals. To address this, I adjusted the overbought level to 80 and the oversold level to 25. This tweak dramatically improved the quality of signals, reducing false alarms and minimizing the risk of premature exits from trades.
3: USD/JPY daily chart with an RSI using the 70 and 30 parameters
Source: TradingView.
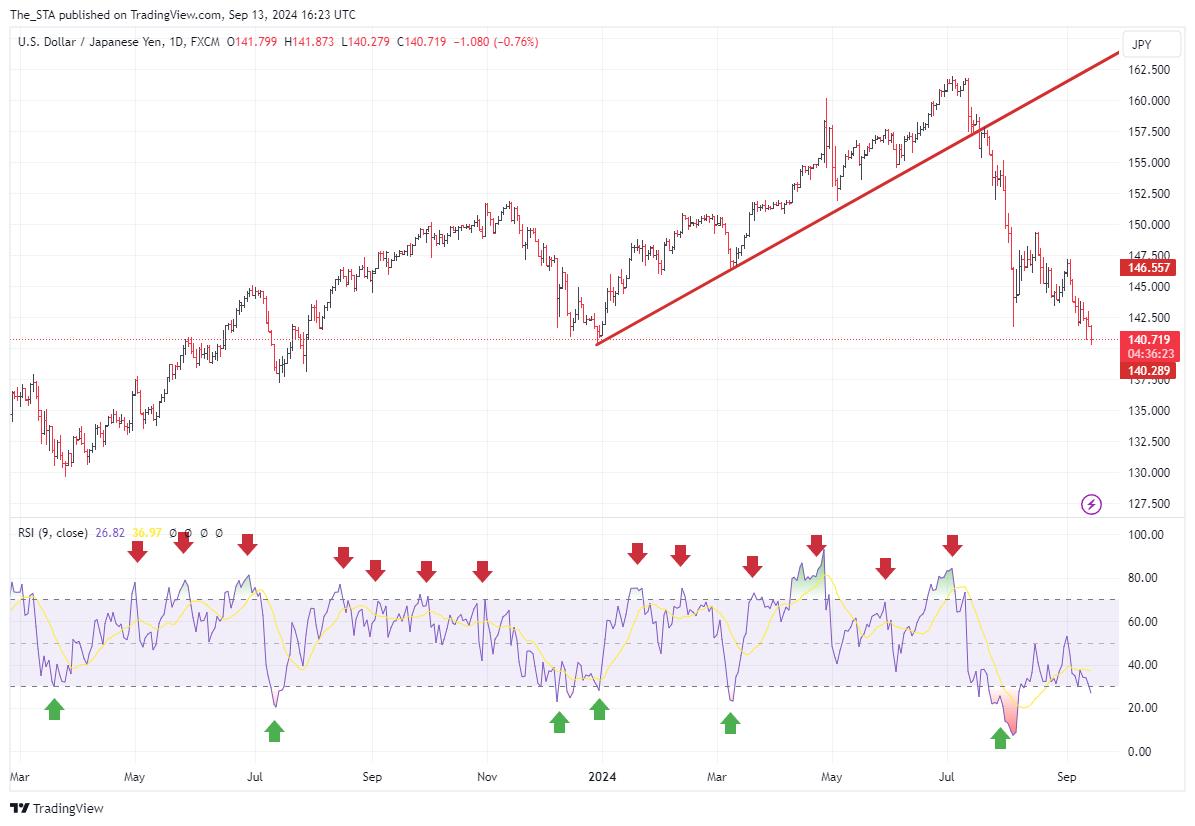
Figure 4: USD/JPY daily chart with an RSI using the 80 and 25 parameters
Source: TradingView.
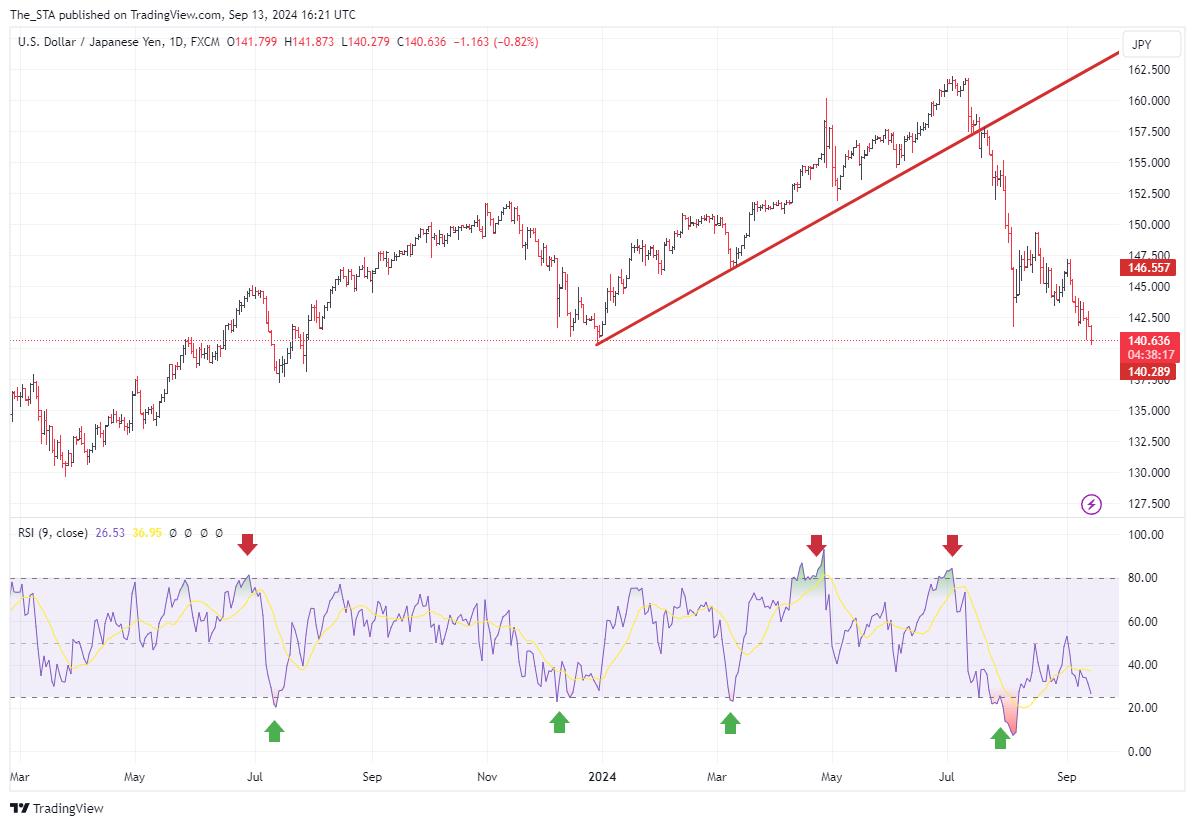
Why is this adjustment so effective? The RSI calculates market strength by comparing the average gains during up days to the average losses during down days.. When RSI remains above 50, it suggests that the prevailing uptrend is strong. Back in July, for example, the market flagged an oversold condition. As the rally unfolded, the RSI consistently held above 50, affirming the health of the bullish trend.
Conversely, when the RSI dips below 50, it often signals that the uptrend is weakening or that a correction may be on the horizon. We witnessed this during a correction in late 2023, where the RSI slipped below 50, indicating the loss of upward momentum.
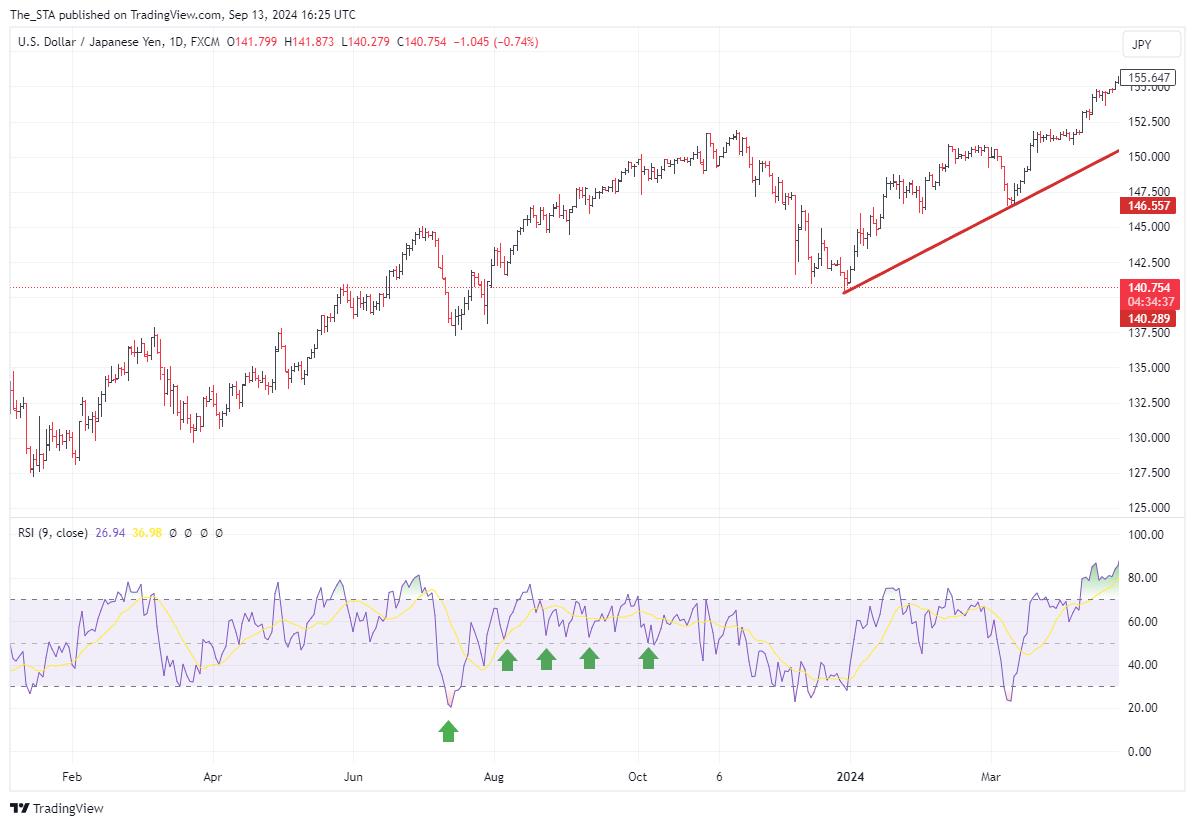
Fast forward to August and USD/JPY saw a significant sell-off. Once again, the RSI dipped below 50 and has stayed there, signalling continued market weakness. This suggests that we may see further downside in the coming weeks.
6: USD/JPY daily chart: Bear trend with an RSI staying below 50
Source: TradingView.
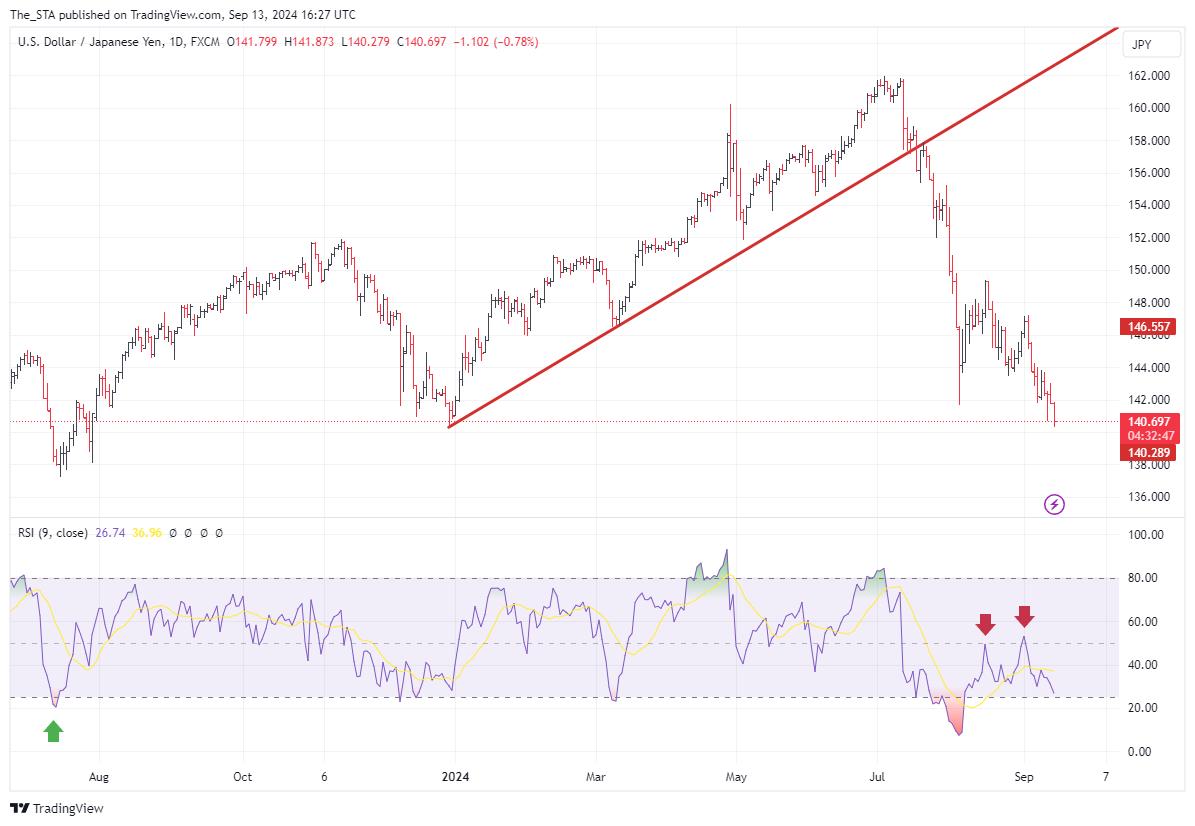
While the RSI is often regarded as a basic tool for spotting overbought and oversold conditions, its true power lies in its ability to provide deeper market insights. By adjusting RSI parameters and examining price action across multiple timeframes, traders can sharpen their entries, manage risk more effectively and stay aligned with broader market trends.
In summary, the RSI is much more than a simple oscillator—it’s a dynamic tool that can enhance your technical analysis and improve your trading decisions. Whether you’re navigating the complexities of the EUR/USD or USD/JPY, the key to success often lies in knowing how and when to adapt the RSI to suit the market’s behaviour. By doing so, you can uncover hidden opportunities and maintain a strategic edge.

Charlie Morris is the founder and chief investment officer at ByteTree Research . He is the lead portfolio manager and develops both crypto and traditional investment strategies for ByteTree. He has 25 years of experience in fund management and is best known for his expertise in alternative assets, notably Gold and Bitcoin.
Trend following is a branch of technical analysis on the quantitative side. To my mind, technical analysis 1.01 is the study of a single chart whereas trend following is the study of many charts and ranking them. I would split trend following into three categories, although I am sure there are potentially many more.
Price trend following, CTA style, follows major liquid assets from FX to oil, looking for directional trends both long and short. Although volatile, the outcome is uncorrelated with the stock market, making CTA strategies popular with skilled asset allocators. Look for breakouts.
Momentum investing is an equity trend that follows strategy looking not only for price strength but relative strength to the market as well. They seek out the leading trends, which, in recent years, have mostly been found in the booming technology sector. They are not just seeking strong assets, but the strongest of them all. Focus on the market leaders.
Value and momentum is a strategy where a fundamentally driven equity investor will identify undervalued companies and purchase the stock as evidence of a new trend emerges, following a prolonged downtrend. Scrape the barrel.
All three forms of trend following have merit but deliver results at different times. It is important to understand their differences. In each case additional nontechnical skills are essential, especially with regard to asset allocation and money management. In the last category, fundamental analysis is important. Despite the f-word being very rude in technical circles, it is important to differentiate between undervalued companies and dead companies headed for extinction.
Trend following is a quantitative process because investors need to constantly be on top of many charts. It is exhausting but for the agile, the hard work is done by computation. For those who struggle with that, my company, ByteTree, has developed ByteTrend.io to assist. I believe a great rotation is coming and in 2025 the trends will be very different from those investors have become used to.
T his is a simple trend following measure of trend strength using a 30- and 200 day moving average with a 20 day max/min channel. The ByteTrend score adds a point if:
• The price is above the long-term moving average
• The price is above the short-term moving average
• The long-term moving average slope is rising
• The short-term moving average slope is rising
• The price last touched max on the max/min lines
The maximum score is 5 points, defining an uptrend. The minimum is 0, defining a downtrend. A trend follower looks for 5 points and a short seller should be looking for 0 points. It is a helpful shortcut that can be applied in both price and price relative to the market. It makes no promise of riches but is a powerful time-saving device pointing investors in the right direction. The greatest gains in history started with a new trend and ByteTrend identifies them in an elegant manner. Let’s look at Apple, which is coded into Bloomberg.
There was a mild bear market in 2015 and one of the great buys from that era was Apple (AAPL). Warren Buffett led the charge and by 2018 had accumulated one billion shares. That great trend began with a 5-point score in September 2016 after a bear market.
Price - Apple in the 2016 Rebound
Source: Bloomberg
But so what? Many stocks took off in 2016 as it was the beginning of a new bull market. Yet 2016 was curious because it was triggered by the China recovery story, marked by a strength in commodities, cyclicals, and emerging markets. It was precisely when this ‘value’ rally faded that tech-related growth stocks took off.
Using the weekly chart price relative to the world index, Apple had long been outperforming, as can be judged by the positive slope of the green 200-week moving average. It made a relative high in 2012 which wasn’t surpassed until early 2017. The ByteTrend relative performance identified this in September 2016, indicating the long-term strength might resume. That wasn’t just true for Apple but for tech stocks in general.
Price Relative - Apple in the 2016 Rebound
Source: Bloomberg
While that was happening, the China-related cyclicals soon rolled over as the tech trade kicked off again but that wouldn’t play out until the momentum crash was complete. This often happens after bear markets when the counter momentum stocks (or the losers) become so oversold that they rally hard. We saw good examples in 2002 and 2009:
Source: Bloomberg
It is important to think of the financial system as a pie and, in a bull market, a growing pie. Every asset is after its fair share but they can’t all have a large slice at the same time. The relative ranking of assets prices changes all of the time: keeping on top of things is vital.

Love it or loathe it, one of the fastest-changing and evolving asset classes is crypto. This was the primary reason we started working on ByteTrend. Crypto was so chaotic we felt that we could make better sense of it with a trend-following system. In this example, I show the leading tokens measured against our own benchmark, the ByteTree Crypto Average (BCA), an equally-weighted daily price index and a useful breadth indicator.
Source: https://bytetrend.io/crypto/bca
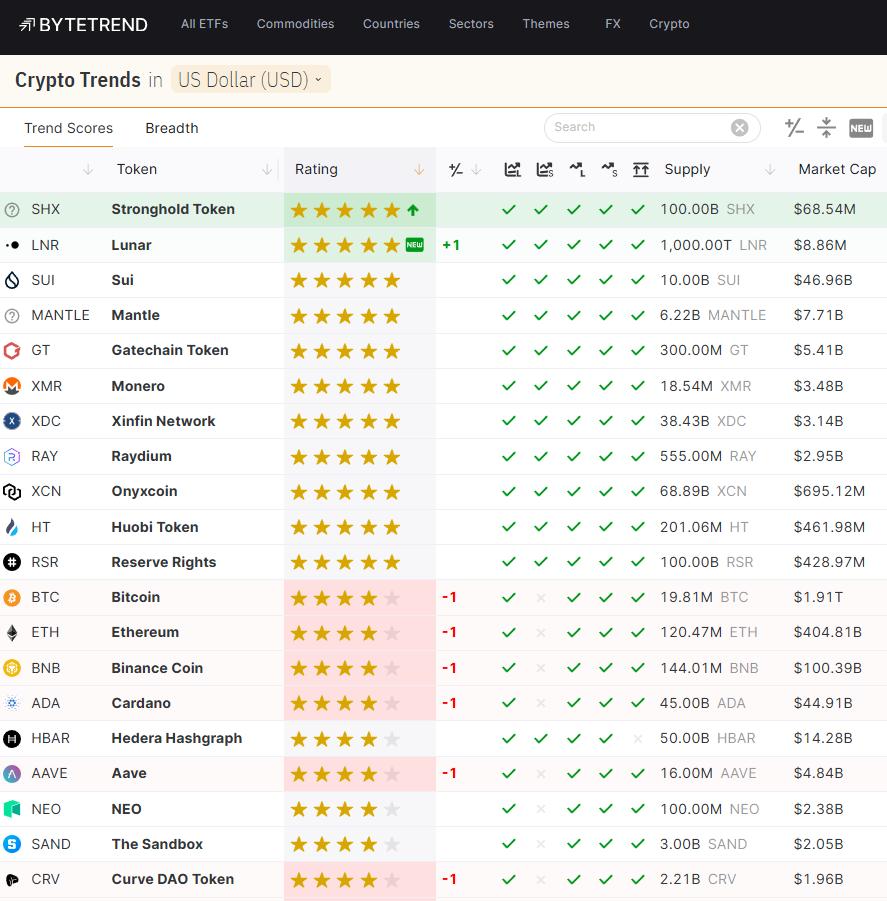
Just like in equities, any token that can beat the averages is worthy of consideration, especially in an asset class where the prize is potentially super-sized. Anything that can’t hold up against the pack is less worthy of investors' research time. This simple idea of eliminating the laggards - assets that aren’t performing - reduces investors’ workload by 80%.
Every night, ByteTrend computes the trend scores so that each morning our analysts know where to focus their attention. The irony of this cycle is how there have been so few tokens that have managed to outpace Bitcoin. That has been useful information because the portfolio has remained heavily focused on Bitcoin rather than altcoins.
Market concentration has been high in other asset classes as well. This is the first cycle in living memory where big has been beautiful. Not only has Bitcoin led crypto but gold has led commodities, the dollar has led currencies and the largest stocks have led the stock market. We know what this means because the great peaks of 1929, 1972, and 1999 were also met by heavy concentration.
Although the media will often mistake momentum for a vibrant stock market, some momentum investors have had a rough patch because market breadth has been weak. We have lived through an era of a few spectacular trends, some of which have been less visible in small and mid-caps.
The iShares US Momentum ETF (MTUM) lagged not only the NASDAQ but also the S&P 500. MTUM doesn’t own many of the technology-leading stocks you might expect it to: those it holds don’t have high enough weights. MTUM has also been late in and late out on portfolio rebalancing. For example, it started the 2023 rally with an overweight position in energy. Don’t get me wrong, MTUM is a good long-term strategy but despite all that effort in selecting and rebalancing in recent years it has failed to beat the S&P 500 let alone the NASDAQ.
Source: Bloomberg Momentum Factor Has Lagged the Market
It did, however, manage narrowly to beat the S&P equal weight index but this does not have a high concentration in technology stocks.
Their method is to calculate a score based on 6 and 12 month performance on a risk-adjusted basis. This favours trends with lower volatility that are deemed to have more longevity. They choose 125 securities from their universe and apply a weight using a blend of the momentum score alongside market cap weights. There are other concentration rules, such as the rule that the sum exposure of all stocks above 5% cannot exceed 25% of the total. The index is rebalanced quarterly and after severe market shocks.
Of the so-called Magnificent 7 leading tech stocks, MTUM doesn’t currently own Alphabet, Microsoft, Apple, Amazon, META, or Tesla, but it owns NVIDIA. I think many MTUM holders would find that odd but when you check the ByteTrend scores (at the time of writing) Alphabet, Apple, Amazon, META, and Telsa are all in 5-point trends relative to the market, with just Microsoft in a consolidation pattern.
This is an institutional approach to momentum investing, designed to reduce portfolio turnover and active share. Mimicking index weights explains why MTUM trades so closely with the S&P 500. Furthermore, the 6 and 12 month momentum measures are, I would argue, too slow for capturing new trends and too fast for hanging on to the longer-term winners taking a break. Perhaps 125 stocks are too many, and the concentration and rebalancing rules are prohibitive. Weren’t we taught to run winners?
Optimising a momentum strategy is a highly complex task and ByteTrend, or any other trend discovery system, won’t solve that. What it does most effectively is to identify new trends, existing trends and fading trends in a timely manner, massively reducing the workload. A successful trend follower still needs to turn ideas into a portfolio and that requires skill.

We will all need to be aware of the new trends because change is coming. Companies valued at $4 trillion will struggle to become worth $10 trillion and US dominance will sooner or later come to an end.
This chart shows the relative performance of the USA, Emerging Markets, Japan, and Europe (incuding the UK) total return against the world index since 1999. Investors forget how EM dominated global markets in the noughties. After a 13-year relative bear market in EM since 2011, that has finally allowed the US market to catch up, courtesy of their tech sector. Europe and Japanese equities have lagged significantly since the 2008 credit crisis.
Regional Equity Relative Performance
Source: Bloomberg
Starting the clock in 2008, when the US dollar bottomed, the US market performance truly stands out, with the others in a collective slump. China’s summer rally didn’t manage to stop the rot in EM. I suspect that, just as a low in the dollar in 2008 after a 40% decline from 2001, a dollar peak will mark the eventual reversal.
Source: Bloomberg
It is during the great turning points that the winners in financial markets are separated from the losers. Japan now trades at 1971 levels relative to the world index: the outperformance gained in the 1970s and 1980s, during Japan’s heyday, has been given back. A key tailwind for Japanese equities in the 1980s came from a strong yen. This is what the Japanese stock market has looked like since 1970 when priced in US dollars. Through a different lens, this has been the rest of the world catching up rather than a Japanese slump.
Japanese Equities since 1970 in US Dollars
Source: Bloomberg
Curious market technicians have grown to love that chart of Japan in dollars. I like the lower highs and lows into 2008, followed by higher highs and higher lows. It’s now starting to look like a cup with a handle pattern which could finally make an all-time high. After all, 35 years is quite a long consolidation, catching up with silver’s 45 years.
The yen trades cheaply: the companies are competitive, generally have modest debt and, more likely, cash reserves. It’s a similar situation in the Emerging Markets, which, outside India, are also underpriced and raring to go.
Japan and the EMs are the host of thousands of companies, providing a great opportunity for momentum investors. Potentially Europe as well but think of the scale of the task facing analysts as global markets rotate. That is my mission in 2025: to expand ByteTrend beyond London-listed ETFs and crypto and to work towards global equity coverage. Wish me luck on my journey and watch out for the Great Reversal.

Luise Kliem
is a Fellow of the STA and current STA chief examiner and Diploma course director.

PATRICIA ELBAZ, MSTA Director
Luise it’s a great pleasure to interview you for the Market Technician Journal, especially as I have known you since the Merrill Lynch and Commerzbank days!
First of all, we’d love to know how were you first introduced to Technical Analysis?
LK: Great to catch up again Patricia! I began my City career some forty years ago, as account executive on the London Metal Exchange, advising various types of client – both hedgers and speculators. Everyone around me studied charts so I soon learned. We were all greatly helped by the weekly reports and chart books we received from Chart Analysis and Investment Research of Cambridge. Those companies no longer exist, at least not in the same form, but their influence on the technical world has been immense over the years. Some time later, when I moved to equities in the investment banking world, I sat the STA Diploma exam.
“As Chief Examiner I guess my first instinct is to say that I look for students to be willing to work hard! Our exams are not easy, which is what makes the Diploma so highly respected.”
LUISE KLIEM
In your vast financial markets experience, which indicators would you recommend using when starting to learn about Technical Analysis?
LK: I would recommend the RSI and MACD. Not overly complicated and very effective if used correctly. The RSI is particularly suited to ranging markets but being a bounded indicator, it will struggle to give useful signals in a strongly trending market. This is where MACD, with that moving average element and lack of boundaries, will work better.
But I can’t emphasize strongly enough that the study of price action always comes first! Look at what the price chart tells you first, then check the temperature with the indicator.
I remember when we met up at a conference, at the time you were setting up a Technical Analysis desk at Commerzbank. Not an easy task, that’s for sure! Tell us about the challenges and how traders used and reacted to all the TA research that your team provided.
LK: I was quite lucky in that analysts, traders and sales teams were very receptive to technical analysis. That wasn’t always the case in the world of equities in those days but here the sales teams, especially, found it very useful to provide the technical view to their clients once they had gone through fundamental valuations..
As Chief Examiner what do you look for when students are starting to learn the STA Diploma Part 1 and Part 2 Courses? Understandably the Part 2 Diploma Course is more in depth and analytical.
LK: As Chief Examiner I guess my first instinct is to say that I look for students to be willing to work hard! Our exams are not easy, which is what makes the Diploma so highly respected. But I also want them to enjoy the courses. Which they always tell us they do. Learning from such renowned lecturers is inspiring. In Part 1 they learn a large number of crucial techniques, with Part 2 building on these and also adding new ones. At this stage I then look for students to not just understand the techniques but to also apply them in a professional environment. But I don’t look for students to come from a particular background. Our courses can be attended by anyone: trader (private or working for a company), investor, fund manager, student, sales-person... such variety is enjoyable for everyone.
Finally, do you see the developments in AI as a positive move in trading and the use of Technical Analysis.
LK: I see them as a positive. I have asked many searching TA questions of several AI providers and the answers have been very good.
The STA are delighted to announce a new Student membership category.
Students of recognised academic institutions may join the Society for the duration of their course at the discounted rate of only £25 a year.
Student members will have to demonstrate their student status. For enquiries, email the office on info@technicalanalysts.com
Thank you Luise for shining a light on Technical Analysis, both as a Lecturer and Chief Examiner. Having assisted at a number of your lectures, I can say that students are lucky to benefit from your Investment Banking career and hands on Technical Analysis experience. We look forward to hearing about future STA Education projects.
We hope to see you at future STA talks if you are visiting! All STA events are listed on the website


ALDEN
“...that’s the beauty of trading - everyone is encouraged to test out different indicators and figure out what works best for them. It’s all about finding what clicks with your approach.”
ALDEN CHEAH
PATRICIA ELBAZ, MSTA Director
Well, Alden, we are starting off with a huge congratulations for winning the 2024 Bronwen Wood Memorial Prize. This award is in recognition of your excellent grade in the STA Diploma Part 2 Exam. So well deserved!
Tell us, first of all, what drew you to enroll for the STA Diploma Part 2 Course and how did you find the topics?
AC: I enrolled in the STA Diploma Part 2 course because, honestly, I wasn’t that strong in technical analysis at first and I saw this as a great way to get my foot in the door. Everyone’s looking to make money from trading but fail to understand that being technically sound is crucial to success. Therefore, after experiencing countless failures, I knew I needed to understand the right tools and enrolled into the course.
Overall, the topics were incredibly informative and before I knew it, I was grasping technical skills such as Ichimoku and Elliot Waves – concepts that I’d never even heard of before. It was definitely an eye-opening experience and gave me a whole new perspective on trading.
Being a new STA graduate (Welcome to the Club!) do you find that you are using a lot of the technical analysis indicators that you studied?
AC: Thanks for the warm welcome! Even though the STA course taught us a wide range of technical analysis indicators and gave me a solid foundation, I’ve come to realise that there’s no one-size-fits-all approach in trading. What works for me might not work for someone else and

that’s totally fine. After experimenting with different tools and indicators I’ve developed my own set that fits my style. But I think that’s the beauty of trading - everyone is encouraged to test out different indicators and figure out what works best for them. It’s all about finding what clicks with your approach.
Which markets do you look at specifically using technical analysis? Is it more FX, Indices, Commodities or others such as Cryptos? Crypto has been described as ‘gold for the younger generation!’ would you agree with that?
AC: I mainly trade gold futures and Malaysian stocks and I’m planning to dive into US stocks down the line. When it comes to cryptos, I’m not really a fan right now due to the complexity and the overwhelming number of coins out there (aside from the popular ones). I might explore it in the future but for now it’s not a focus. As for crypto being described as ‘gold for the younger generation’, I get where the idea comes from but for me, gold has always been my bread and butter.
Finally, what advice would you give an undergraduate or a post grad or a finance trainee who is looking to study technical analysis? What have you gained from the course?
AC: If you're serious about building a career in trading, my advice is: Don’t wait! If you’re passionate about it, start learning now. Honestly, I wish I had studied technical analysis earlier. This course has taught me so much, not just about the technical aspects but also about understanding the markets on a deeper level. It’s given me a solid foundation and if you’re looking to make trading a career, this is definitely a great place to start. The sooner you dive in, the better equipped you'll be to succeed.

Once again, Alden, congratulations from all of us! We wish you much success in completing your degree at Monash University. Thank you for sharing your learning experience with us and we look forward to celebrating with you at the STA Awards ceremony!
We also hope to see you at future STA events listed on the website www.technicalanalysts.com


DAVID WATTS , MSTA Director
So, 2025 about to begin, a number of technicians in the main using cycle techniques aim provide a yearly forecast. Many are based around W D Gann’s cycles but he did not only use cycles but also rectified these with mathematical techniques as he states in his famous Ticker Interview.
So to the forecasts

The most famous are Larry William’s Annual Forecasts and his 2025 forecast which was released on 31 December 2024. Larry’s forecast covers a number of stock markets as well as commodities and his forecast is in the main for intermediate and long term traders and investors. More to the point sometimes these cycles can invert and what’s most important is to note the market behaviour around these inflection points.

Fiorente2 also writes a comprehensive forecast for the coming year in the stock market and a number of commodities. In the main, it uses a forecast model using a mass pressure chart. Published by a Dutch technician it is moderately priced, Fiorente identifies 2025 as a key cyclic year.
The Foundation for the Study of Cycles has recently republished the key text of Edward R Dewey and a copy was presented to the STA Library by board member Ron Williams. So the text should now be available now via the Barbican library. The Foundation has a Market Forecast webinar for 2025 on 11th of January at 4 pm EST which is then normally available via the recording.
One of the tips I learnt at the 2024 IFTA conference was from Alan Cement’s lecture on AI. Alan, who uses AI to enhance his trading, stated that for coding “Claude AI” was the most accurate site available and specialised in the writing and conversion of programme codes. Indeed I have used “Claude” ever since to translate code from my older database successfully into both Tradestation Easy Language and TradingView Pinecode.
From my experience it is way more accurate than ChatGPT and hence has become my go to AI site for producing codes for indicators and strategies. Recommended.
Claude AI
Helix Trader
The STA holds 11 monthly meetings in the City of London, including a summer and Christmas party where canapés and refreshments are served.
• Chance to hear talks by leading practitioners.
• Networking.
• CPD (Continuous Professional Development).
As a service to our members, many of whom are unable to attend all our monthly meetings, we have been making videos of meeting presentations for several years.
• Never miss the latest meeting.
• Browse our extensive video archive of previous meetings.
The Society of Technical Analysts and the Chartered Institute for Securities & Investment (CISI) have formed a partnership to work together on areas of mutual interest for our respective memberships.
CISI examination exemptions for STA Diploma Part 1 and 2 holders. MSTAs with three+ years’ experience can become full members (MCSI).
The STA holds 10 monthly talks either in-person in the City of London or online and a number of social events including the Annual Drinks Reception and a Christmas Party.
• Chance to hear talks by leading practitioners
• Networking with members and other finance professional
• CPD (Continuous Professional Development).
Student members have access to an education forum which is available in the member’s area of the website.
Members can ask questions on technical analysis in the Technical Analysis Forum which a course lecturer, author or Fellow will answer.
Endorsed by the Chartered Institute for Securities & Investment (CISI), members of the STA are entitled to receive continuing professional development points (CPD for their attendance on the taught course lectures.
• Remain compliant.
• Be informed of all new industry developments.
The STA ”Market Technician” journal is published online twice a year.
Members receive the latest issue of the “Market Technician” via e-mail. They are also able to access an archive of past editions in the member’s area of the website. Technical analysts from all over the world contribute to the STA journal.
The STA has an extensive library of classic technical analysis texts.
There are over 1000 books in the collection, held at the Barbican Library with a smaller selection available at the City Library. As a member you can now browse which titles are available on-line. Members are encouraged to suggest new titles for the collection and, where possible, these are acquired for the library. The complete listing can be downloaded in Excel format from within the member’s area.
STA members receive all International Federation of Technical Analysts (IFTA) quarterly bulletins and annual journal and invitations to attend their monthly online webinars.
• Chance to hear talks by international practitioners
• Access to research from market analysts around the globe
• CPD (Continuous Professional Development).
STA Monthly Meeting (March 2025)
MAR 11
APR 8
Tuesday 11 March 6.30pm Via Live Webinar
STA Monthly Meeting (April 2025)
Tuesday 8 April 6.30pm One Moorgate Place, London EC2R 6EA
STA Diploma Part 2 Exam (online)
Thursday 24 April
APR 24
MAY 13
JUN 10
STA Monthly Meeting (May 2025)
Tuesday 13 May 6.30pm Via Live Webinar
STA Monthly Meeting (June 2025)
Tuesday 10 June 6.30pm Via Live Webinar
STA Diploma Part 1 exam (online)
Monday 7 July
JUL 7
JUL 8
SEP 9
STA Monthly Meeting (July 2025)
Tuesday 8 July, 6.30pm
Joint STA, ACI UK and The Broker Club Mid-Year Review of Markets. One Moorgate Place, London EC2R 6EA
STA Monthly Meeting (September 2025)
Tuesday 9 September 6.30pm Via Live Webinar
SEP TBC
STA Annual Drinks Reception & Awards Ceremony
Date: tbc
National Liberal Club, London SW1A 2HE
STA Diploma Part 2 Exam (online)
Thursday 9 October
OCT 14 OCT 9
STA Monthly Meeting (October 2025)
Tuesday 14 October 6.30pm One Moorgate Place, London EC2R 6EA
STA Monthly Meeting (November 2025)
NOV 11
Tuesday 11 November 6.30pm Via Live Webinar
STA Diploma Part 1 exam (online)
Monday 8 December
DEC 8
STA AGM & Christmas Party
DEC 8
Tuesday 9 December 6.30pm One Moorgate Place, London EC2R 6EA
Visit STA Meetings on the STA website for information on monthly meetings and videos.
Month
February 2025
November 2024
October 2024
Speaker
Perry Kaufman
Dimitri Speck
Clive Lambert, Keval Dhokia and Christof H. Rühl
Description
Fireside Chat
Increase Your Profits Systematically with Recurring Seasonalities and Cycles
Joint Panel with the Commodity Trading Club
September 2024 Tom Basso Fireside Chat
June 2024 Sonal Darbar
May 2024 Rajan Dhall
April 2024
March 2024
David Linton
Andrew Pancholi
February 2024 Dr Ken Long
Mindset: The Missing Dataset in Analysis (an Overlooked Edge)
How to Use Technical Analysis to Develop a Profitable Trading System
Predicting the Price
Staying Ahead of the Game! How to Identify Significant Geopolitical Events
Fireside Chat with Jeff Boccaccio
STA members are eligible to join the library as standard adult library members. They need to attend in person to the library to join - bringing with them proof of name (STA membership card, bank card, staff pass etc) and proof of address (driving licence, recent bank statement, utility bill etc).
The library address is: Barbican Library Silk Street London EC2Y 8DS.
For full details on address and opening times, visit STA Library


Why purchase the Home Study Course?
The world-class e-learning Home Study Course (HSC) © is written by leading industry practitioners, making it one of the best online products available on the technical analysis market. Whether this is your first introduction to technical analysis, you want to refresh your existing knowledge, or you wish to become a qualified technical analyst, the STA offers a tailored Home Study Course as part of our portfolio of world respected courses preparing students for our internationally accredited STA Diploma qualification.
You can learn from the comfort of your home at times that best suit you. Although website based, it is fully downloadable and may be used online or offline via PC, Mac, iPad or Android machines.
What will it cover?
• The syllabi for both STA Diploma Part 1 & Part 2 examinations
• 15 in-depth subject teaching units
• Exercises to self-test progress
• Exam preparation module & video
• Advice on report writing.
...find out more visit Home Study Course
Since the HSC is International Federation of Technical Analysts (IFTA) syllabus compliant it can also be used to prepare candidates for both the IFTA CFTe I and II examinations.
Who is the course for?
The course is intended for individuals who want to use technical analysis in a professional manner or who want to become a qualified technical analyst and advance their career. Enrol and start studying now!
For more details click below or contact the STA office on +44 (0) 207 125 0038 or info@technicala nalysts.com
When would you like to start?
Learn at your own pace rather than in a classroomthe HSC course is designed for those who need a truly part-time study option with maximum flexibility!
Samuel Wilson
Adriana Mendez Montoya
Christopher Levy
David Alter
Ivan Hristov
Matthew Bick
Rhidhi Sheth
Rohan Bajaj
Executive Commitee on STA website

Jeff Boccaccio MSTA Director

Murray Gunn FSTA Director

Keval Dhokia BSc (Hons) MA MSTA MCSI Company Secretary

Karen Jones BSc FSTA Treasurer

Patricia Elbaz BA (Comb Hons) MSTA Director

Eddie Tofpik MSTA, ACI-UK, ACSI Chair
Dunne FSTA Director

David Watts BSc (Hons) CEng MICE MIWEM MSTA Systems and Website Specialist
Please keep the articles coming in!
The success of the Journal depends on its authors, and we would like to thank all those who have supported us with their high standard of work. The aim is to make the Journal a valuable showcase for members’ research - as well as to inform and entertain readers.
Keep up to date with the conversation by joining us on:


The Society of Technical Analysts Journal The Market Technician is a bi-annual publication, published in PDF format only. The STA will accept advertisements in this publication if the advertising does not interfere with its objectives.
The appearance of advertising in the Market Technician is neither a guarantee nor an endorsement by the STA.
Specification
Inside Cover
Full Page
Half Page
Quarter Page
£500.00
A4 Portrait, 210mm (w) x297mm (h), plus 3mm bleed
£500.00 A4 Portrait, 210mm (w) x297mm (h), plus 3mm bleed
£300.00
Landscape, 198mm (w) x 139.5mm (h)
£200.00 96mm (w) x 139.5mm (h)
The Market Technician has a circulation of approximately 1,500. Readership includes technical analysts, traders, brokers, dealers, fund managers, portfolio managers, market analysts, other investment professionals and private investors.
Advertising is subject to approval by the STA Journal Committee. All advertisements must be non-discriminatory and comply with all applicable laws and regulations. The STA reserves the right to decline, withdraw and/or edit at their discretion.
Contact Katie Abberton, Society of Technical Analysts on info@technicala nalysts.com or +44 (0) 207 125 0038 for more information.