


Interview with Georges Castel Patricia Elbaz ANALYST FOCUS 46 DJIA Annul One Day Falls, Lunar Phase & the 9/56-year Cycle David McMinn RESEARCH 30 Bond bears charts well Gerry Celaya RESEARCH 24 MACD-V Volatility Normalised Momentum Alex Spiroglu RESEARCH 14 Market Technician Issue 96 - March 2024 The Journal of the Society of Technical Analysts HISTORY OF STA p12 TECHNICALS TO TRADING SYSTEMS CONFERENCE 2024 p 6
Disclaimer: The Society is not responsible for any material published in The Market Technician and publication of any material or expression of opinions does not necessarily imply that the Society agrees with them. The Society is not authorised to conduct investment business and does not provide investment advice or recommendations. Articles are published without responsibility on the part of the Society, the editor or authors for loss occasioned by any person acting or refraining from action as a result of any view expressed therein. Contents FOREWORD Editor's Letter 03 Advertisement: Commodities Trading Week 04 Advertisement: Affordable Law for You 05 NEWS STA’s Inaugural Technicals to Trading Systems Conference 06 STA 2023 AGM and Christmas Party 09 Meet our new Executive Committee members 10 Meet our new Fellows 11 History of the STA 12 The STA on Social Media 13 RESEARCH MACD-v: Volatility Normalised Momentum 14 Alex Spiroglu Bond bears charts well 24 Gerry Celaya DJIA Annul One Day Falls, Lunar Phase & the 9/56-year Cycle 30 David McMinn ANALYST FOCUS Interview with Gerry Celaya 44 Patricia Elbaz Interview with Georges Castel 46 Patricia Elbaz Navigating Market Signals: Insights from S&P 500 Analysis 48 Karen Jones SOFTWARE REVIEW Bytes & Pieces 49 David Watts STA EDUCATION LSE courses and the Diploma in Technical Analysis & STA Library 50 Home Study Course 51 Bronwen Wood Prize 2023 52 Congratulations! Latest STA Diploma MSTAs 53 THE STA Benefits of STA Membership 54 STA Calendar 2024 55 STA Executive Committee 56 STA Advertising Rates 2024 57
Editor's Letter
 NICOLE ELLIOTT, FSTA Technical Analyst, Private Investor, E-journalist for the STA
I don’t know about you, but I feel that post-lockdown time has sped up. A week slips by in a jiffy, the 28-day lunar cycle is gone in a blink, and while I’m aware of the seasons turning I don’t seem to have had the time to really enjoy them. Time is obviously flexible, horrid science lessons dragging on forever versus sports classes where we all raced to put on our kit. All of this might sound ridiculous coming from a technical analyst where all our charts are carefully calibrated with time intervals along the bottom, many of us ruled by cycles, oscillators and Gann angles. The one exception are point and figure charts, something I used extensively when I didn’t have so many markets to update by hand. These focus on price moves, with no time along the bottom. Maybe I should revert to this type of chart.
In our last issue I commented on predictions for a weaker US dollar and the focus on central banks, mentioning in passing that low volatility had affected trading in the first half of 2023. That was then. Now, after a frantic rate-hike catch-up and sharp market moves in October through to December, consensus opinion today is that the global economy is set for a ‘soft landing’, that the US dollar will weaken again, and that G7 interest have probably peaked. We’ll see. Though complacency isn’t a technical indicator, it’s certainly something that I, as a Social Psychologist, have a rough and ready way of calculating. Keen economic analysts who tried to beat a march on their rivals and published their 12-month forecasts mid-November 2023 might have to back-pedal. Some had already published so-called ‘alternative scenarios’ by New Year’s Eve!
Inflation is mercifully dipping, politicians trying to take the credit for a reversal in some of the most egregious price hikes in years, commerce blaming any current eco-political wind for these. Meanwhile half the voting population in the world goes to the polls this year; I dread to think what the political class will do to ensure re-election. While historical volatility is back down at some of last year’s lower levels, short-dated interest rate futures prices are currently jumping about all over the place, clearly signalling considerable uncertainty in the outlook for the whole of the yield curve.
As Gerry Celaya (pg.24) mentions in his excellent article for this issue, ‘Bond Bears Chart Well’,reminding us of the the famous quote from James Carville:
"Now I would want to come back as the bond market. You can intimidate everyone.’’ A well written summary of a couple of his blogs, he has some very interesting long term charts in the article. You might also want to read Patricia Elbaz’s interview (pg.44) with Gerry, these two being old work colleagues. Patricia has been busy indeed, because as well as re-joining the STA executive committee, she’s also found the time to interview Georges Castel (pg.46) Originally an options market-maker at Paris’ MATIF, since 2000 he’s been director of studies at France’s MBA finance course at ESLSCA (Paris business school). His views from the academic side of the fence should be interesting to some readers.
Talking of old times, mates and methods, younger readers may be interested in the brief history of the STA penned by veteran Anne Whitby (pg.12). Propelled by London’s Big Bang in 1986, a British STA delegation of one man, Anne and two other women (note the male/female ratio) set off to Florida for the first meeting to discuss the creation of IFTA (International Federation of Technical Analysts). This has been going strong ever since with annual conferences, the first one in Japan in October 1988 and then London in 1989. We will be hosting this annual event once again in 2026.
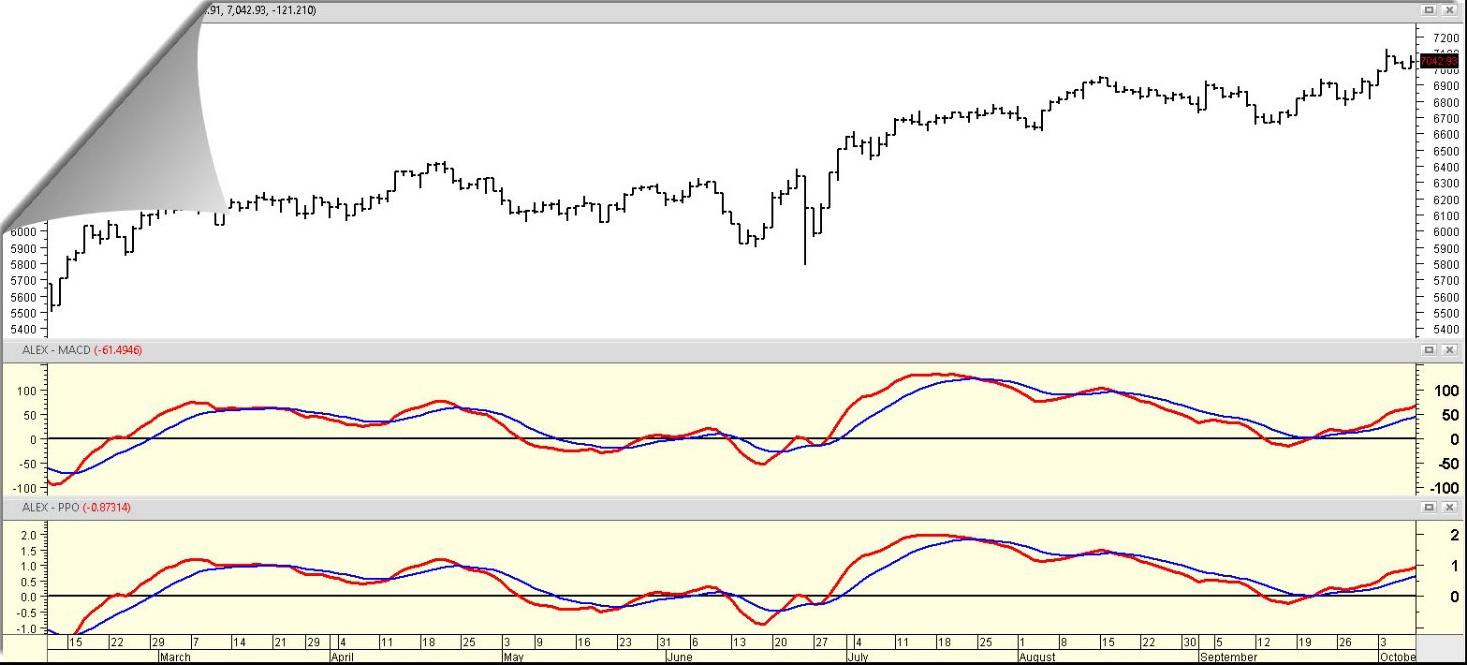
An excellent research paper was submitted by Alex Spiroglou (pg.14). He discusses the much-loved MACD (Moving Average Advance Decline) crossover system and its histogram. Originally published in 2022 this is the first of two articles of his variation on the subject. He has chosen excellent examples for PPO (per cent price oscillator) in Table 4.
A second paper submitted by the very prolific David McMinn (pg.30) returns to his specialist subject, cycles and more especially the 9 and 26 year ones, something which first interested him in 1986. His outlook is long term indeed, some of his data points going back to the mid-1770s.
The regular Bytes and Pieces section supplied by David Watts FSTA (pg.49) may one you may have skipped before. Do not miss this time as he has novelties for you to try out which might be great fun!
Congratulations (pg.53) all round to successful Diploma Part 2 examinees, especially those awarded a distinction; well merited and now you can use the letters MSTA as one of your qualifications. By the way, do take a cursory glance across the names on the list for proof that this is a truly international accreditation.
Remember, the STA is a non-for-profit organisation and we rely heavily on volunteers. If you’re interested in getting involved please contact Katie Abberton at info@technicalanalysts.com with your ideas, CV and any other material you think might be useful. If you’d like to present at one of our monthly meetings, send an outline of your proposed subject; likewise for articles submitted for publication in this magazine.
More importantly, we love feedback.
3 www.technicalanalysts.com FOREWORD


APRIL 23-24, 2024 1000+ ATTENDEES 150+ SPEAKERS 8 TRACKS COMMODITY TRADING WEEK EUROPE Stamford Bridge Stadium, London A free library of content for the COMMODITY trading community.
into key aspects of trading such as: RISK MANAGEMENT MARKET ANALYTICS GEOPOLITICAL INFLUENCES ...and more! europe.commoditytradingweek.com commoditiespeople.com
Delve
www.affordablelawforyou.co.uk

We are a legal consultancy that offer support for those dealing with legal issues
Specialising in Employment Tribunals, Consumer Law, Landlord and Tenant Law and Family Law, Affordable Law for You was set up by Deborah Aloba, a Fellow of the Chartered Institute of Legal Executives.
We assist by
• Reviewing and commenting upon legal documentation
• Assisting you to respond appropriately to communications in legal proceedings
• Preparing legal documents in a format required and accepted by the Courts
• Researching and providing relevant statutes and case law supporting your legal arguments
For further details visit our website or contact us direct: affordablelawforyou@gmail.com
07964 805 397
Affordable Law For You Third floor 207 Regent Street London W18 3HH Company No: 07864172
AFFORDABLE L AW FOR YOU
Technicals To Trading Systems Conference 2024
From classic charting to AI developments hybrid conference will take place both online and at One Moorgate Place.

Technicals To Trading Systems Conference 2024
From classic charting to AI developments
Kindly sponsored by

6 NEWS
Lead sponsor
Gold sponsor
Silver sponsor
Media
partners
Tue, 16 April 2024, 09:00 - 17:30 BST One Moorgate
EC2R 6EA
Place, London
(and online)
Join us for an enriching day-long experience where you will:
• Dive into a comprehensive, step-by-step guide unveiling the secrets behind crafting highly effective systematic technical trading systems
• Explore the art of developing trading systems rooted in precise price objectives, empowering you to navigate markets with confidence
• Acquire priceless knowledge about contemporary systematic trading within energy markets
• Discover how adopting a trading system approach can elevate your technical trading prowess and bolster risk management tools to mitigate potential pitfalls
• Learn about professional money management: gain valuable insights into what allocators look for in technical traders
Technical analysis experts leverage a diverse array of methodologies to decode market behaviour, encompassing everything from chart pattern analysis to mathematical calculations and statistical tools. Extending these concepts into robust trading systems opens doors to testing and implementing strategies with precision and efficacy.
Building upon the resounding success of last year’s inaugural event, the 2024 conference promises an enhanced experience. Delve deeper into seamlessly integrating classic charting techniques into your trading system, with special emphasis on harnessing the power of artificial intelligence to augment this process.

Speakers include:
During the day you will hear from leading experts in trading systems including:


Linda Bradford Raschke
LBR Group (via Virtual Link)
Victor Kouzmanov
Head of the Systematic Energy Book, Freepoint Commodities
David Linton CEO, Updata
David Forino
Co Founder, Simplify Trading
Alan Dunne Founder & CEO, Archive Capital
Stephen Hoad Founder & CEO, The Stop Hunter


Trevor Neil Founder, BETA Group
Jason Ramchandani
Lead Developer Advocate, Refinitiv - an LSEG Business
Victoria Scholar Head of Investment, interactive investor
Elizabeth Miller
Lead Commodity & Macroeconomic Analyst, Mars & Wrigley UK
Rustam Lam CEO, TradeStation International
Matthew Buxton
Co-founder and CEO, FTP Capital
Adam Hartley Director, SnapDragon Systems
Eddie Tofpik
Head of Technical Analysis, ADMISI
Attend wherever you are based
The conference is taking place in the heart of the City of London, so you can attend in person, or with online access provision providing the opportunity to attend the world’s oldest and most prestigious professional body for technical analysis wherever you are in the world.
7 www.technicalanalysts.com NEWS
Book your in-person
or online place now!
Networking
Delegates will be able to interact and meet the most influential and successful practitioners of technical analysis and quantitative systems.
Delegates attending in person will be able to exchange views during the refreshments breaks and the networking drinks after the conference, and online delegates will be able to join in the discussions during the sessions and raise their personal and professional profile amongst this unique gathering of market performance experts.

Registration
* Non-member Students can get this special rate if they join the Society for £25. For full details, email info@technicalanalysts.com
Any STA student members wishing to attend can do so at extra discount rate
8 NEWS
Booking STA and affiliated members Non-members Student Member Discount*
In person (limited places available) £225 £275 £85 Online delegate (via Zoom webinar) £175 £225 £25
STA 2023 AGM and Christmas Party


 NICOLE ELLIOTT, FSTA Technical Analyst, Private Investor, E-journalist for the STA
Tuesday 12 December 2023
At 6:30 pm, One Moorgate Place was abuzz with at least two office Christmas parties. The STA one kicked off sedately with our usual Annual General Meeting where Chairman Eddie Tofpik outlined some of this year’s highlights. April’s “Technicals to Trading Systems” was such a success that another will be held 16 April 2024 for full details click here
The first International Technical Analysts’ Day on 9 September seems to have been well received so another date for your diary in 2024. Texts, photos and other media material of people who have influenced your career in technical analysis are requested.
It has been confirmed that London will be hosting the annual International Federation of Technical Analysts meeting in 2026, so ideas and volunteers will be most welcome.
STA Treasurer Karen Jones noted that 2023 had been a very good year for our finances, where the society turned a £120,000 surplus. Diploma Part 1 enrolment and exams hit a new record high. However, over the next two years considerable outlay is expected in order to upgrade management systems, the website and the replacing of servers.
Richard Adcock resigned as Company Secretary. I found out that it’s because he wants to spend more time travelling and with his family because his wife has not been well. He will be replaced by Keval Dhokia, who is known to our chairman as they both are from an agricultural commodities trading background. Patricia Elbaz is another new member to the executive committee. Patricia has previously served on the executive committee and so we are delighted that she is rejoining. Click to see all current members of the board.
The turnout to the party was good, with many faces I hadn’t seen in years and also many new members, making for an interesting mix of ages and backgrounds. Adrian Dacruz of Clearstream/Deutsche Börse Group was very pleased to have passed the Diploma Part 2 written exam as he’s been interested in technical analysis for 15 years. The beers went down so well catering staff had to go down to the cellar for reinforcements. And, while the canapés were a little slow in appearing, when they did they were really excellent and sweet Ciaran made sure to swerve my way frequently.
SUCH FUN!
9 www.technicalanalysts.com NEWS

Meet our new Executive Committee members

Keval Dhokia, BSc (Hons) MA MSTA MCSI has been in the commodities trading and research industry for over a decade. He began his career in metals and mining research at firms including FastMarkets and S&P Global, focussing on short-term analysis and forecasting of futures contracts. More recently, he was Group Commodities & FX Risk Manager at Associated British Foods PLC’s Sugar division, the second largest sugar producer in the world. He was pivotal in building the derivatives trading desk and advocating for technicalanalysis-based hedging strategies.
He is the author of the Chartered Institute for Securities & Investment’s (CISI ) Derivatives textbooks, which are required reading for the CISI’s FCA-approved trading
Keval is a keen badminton player and recently took up competitive carrom!

Patricia Elbaz BA MSTA is an independent technical analyst, University lecturer and regular guest at IG Index TV. She was previously Head of FX Technical Analysis at Standard & Poor’s MMS before doing consulting work. She’s a lecturer and examiner at ESCP London, Omnes Education which includes IUM and ECE and lectures for the STA at King’s College. Patricia has conducted technical analysis seminars for the French Institute of Bankers, Futures and Options World, Bloomberg, and Association Française d’Analystes Techniques.
She is a graduate in Finance & French from Nottingham Trent University and ESC Toulouse. Patricia is looking forward to being back on the STA Board, staying involved with the Journal and introducing new speakers to the meetings.
Fun fact? Patricia is bilingual and a keen tennis player!
10 NEWS
Executive Committee STA Dinner, Liberal Club.

Meet our new Fellows
We are honoured and delighted to announce three new Fellows of the Society. Fellowship is awarded to those who have either greatly contributed to the field of technical analysis or to the development of the STA. We are indebted to them all.


Perry Kaufman is the author of the well-known Trading Systems and Methods, and more recently Ka ufman Constructs Trading Systems and Learn to Trade. He is an active trader and has spent his career as the architect for trading systems used by institutions and funds, often partnering with those firms. His experience includes commodities and equities. He has traded and managed money through the US-Russian wheat deal of 1973, 20% interest rates of 1980, the stock market crash of 1987, the internet bubble of 2000, the subprime crisis of 2008, and now the Covid pandemic. He understands risk control and believes that not all trading needs to be complex to be profitable. Perry can be reached through his website, www.kaufmansignals.com
Richard Adcock, Fellow and former STA Director has nearly 40 years of experience as a technical analyst. He started his career at Investment Research of Cambridge Ltd in the 1980s, before moving into the city with Credit Lyonnais, then HSBC where he ran Technical Analysis for the futures broking desk for 10 years and UBS for 15 years, as Head of Rates and FX technical strategy. After a period at the hedge fund Brevan Howard, Richard set-up his own independent company Adcock Analysis Ltd in 2016, which he still runs. He has been both a regular conference speaker and lecturer on STA courses for many years.
Murray Gunn is Head of Global Research at Elliott Wave International. He has worked as a fund manager in global bonds, currencies and stocks, including posts at Standard Life Investments and the Abu Dhabi Investment Authority. Prior to joining EWI, he was Head of Technical Analysis at HSBC Bank. Murray is the author of the 2009 book Trading Regime Analysis, and a contributor to the 2017 book Socionomic Studies of Society and Culture
11 www.technicalanalysts.com NEWS
Fellows
50th Anniversary, City Hall, London
History of the STA
 ANNE WHITBY, FSTA former Chair of the Society
The Association of Chart and Technical Analysts (ACTA), which later transformed into the Society of Technical Analysts (STA), has a rich history dating back to the late 1960s, making it the oldest such organisation in the world. The prime movers in the founding of ACTA were Teddy Clarke, of Chart Analysis, Richard Lake, a stockbroker, and Alec Ellinger, of Investment Research, who started using TA in 1945 and was thus a real pioneer. As there are now, there were monthly meetings, frequently followed by drinks at a nearby pub, and an irregular journal was produced. The library was held by one of the Committee members, who sent out books to members on request, to be posted back after a few weeks.
In late-1985/early-1986, the ACTA committee, chaired by Philip Gray of GT Management, decided that, in line with the ‘big bang’ changes in the City of London, the ACTA should become incorporated and run more professionally. Other major contributors to the enactment of the change were Elli Gifford, of Investment Research, Bronwen Wood, one of the City’s premier equity technical analysts, and Patricia Morris. ACTA was renamed the Society of Technical Analysts (STA), with a Board of Directors. Membership categories were Associate, those interested but not qualified, Member, those qualified by virtue of their work as TAs, and Fellow. Those in the last category were to be nominated by their peers, for their contribution to TA in general, and/or the Society.
Philip and Bronwen also felt strongly that the STA needed to develop a formal qualification in the TA field. So began the STA Diploma and the courses leading to the examination. In the early years Bronwen wrote and marked all the papers, with a small team who checked any borderline cases. Those first students would not have recognised today’s type of course; in the beginning it took the form of a solid week of evening lectures, and that was all. There are now also many more lecturers teaching a much-expanded course, held online giving a global reach – and more examiners to mark the papers.
The STA was one of the founder members of IFTA (the International Federation of Technical Analysts), with the initial meeting held at an MTA conference in Florida in May 1988. STA Board members Robin Griffiths, Elli Gifford, Bronwen Wood and Anne Whitby were all very involved in the discussions about how this new organisation would be set up and run. Subsequently a first IFTA conference was hosted in Japan in October of that year, followed by the STA hosting one in London in 1989. This was memorable for many reasons, not least that it had perhaps the greatest number of delegates of the IFTA conferences to date and also because during it, the then Chancellor of the UK, Nigel Lawson, resigned. This caused some interesting short-term chart developments for the Speakers to handle.
For a number of years, the STA also hosted its own annual conference, with the first in 1990 proposed and driven by John Breame, who was Chairman at the time. This was held at HMS Belfast, largely because the Board were keen to keep costs to a minimum on this first event. Partly due
to the lack of space on the vessel, people were forced together more than usual, and the conference was extremely successful. After some years, and in an unfavourable market environment, the conferences were stopped.
For a few years the Annual Dinner, which in the early days had been a black-tie occasion, was also not held. Thankfully this has now been reinstated as a social occasion for members to meet, although it has transitioned into an Annual Drinks Reception, driving increased attendance. Similarly, the July and December meetings have always been viewed as more social occasions, with refreshments. In previous years the talks at these ‘parties’ were also of a more light-hearted or historical nature, with an emphasis as much on entertainment as education.
Since the early days the STA has continued to expand and develop. At home this is shown in membership growth, steadily improving meeting facilities, online webinars offering an international speaker programme, world class technical analysis education and a library housed at the Barbican and easily accessible. Overseas, the STA has been a steadfast member of IFTA, with continual representation on the Board of that organisation since it began.
With the STA now heading towards its 60th anniversary, we can be sure that the founder members of ACTA would be well pleased with the way their project had grown and developed.

12 NEWS
50th Anniversary Party, June 2018, City Hall


The STA on Social Media
Don’t forget that the STA is active on LinkedIn, X, Facebook, Instagram, YouTube, Spotify - and even Tiktok!
Across these platforms you can keep up with the latest market news, member activities, interviews and watch short educational videos with STA’s content editor, Karen Jones – former Managing Director, Commerzbank. Click on the icons to find us and follow!
Annual JP Morgan Corporate Chanllenge
STA Dinner 2017
IFTA Conference 2014
IFTA Conference 2014
This research paper won the CMT Charles H. Dow award in 2022 and the National Association of Active Investment Managers 1st Place Founders Award in the same year. The STA is pleased to be able to publish the research over two Market Technician Journals.
MACD-V Volatility Normalised Momentum

ALEX SPIROGLOU
Alex Spiroglou is a semi-systematic, cross-asset proprietary futures trader. His involvement with capital markets began in 1998, having worked for various proprietary trading and investment management firms in the UK and Greece. He is currently trading his own book, and is active in all major liquid futures markets, across all major asset classes
Introduction
This paper will focus on the study of momentum using a very popular technical analysis indicator, the Moving Average Convergence Divergence (MACD), created by one of the most respected analysts of our time (see Appel, 2005; pp. 165–200).
It is comprised of six parts:
• In the first section we focus on the MACD itself. We do a brief description of its construction, the most elementary ways to use it and then a review of the five limitations it has. This is a section that is familiar territory to all technicians.
• In the second section, we show a widely known suggestion to deal with these limitations, that does improve one, but does not solve all of them.
• In the third and fourth sections we present our own solution, which remedies the shortcomings, while creating unique advantages (edges) that would not be possible to obtain via the classic MACD.
• In the last two sections, we use our framework to improve existing tools in TA literature and explore new techniques.
1.2 Why does this topic matter to us?
Most price-based momentum indicators fall into roughly two camps:
(i) Range Bound Oscillators
These operate within a finite range of values, usually 0–100 (eg. RSI, Stochastics, Williams %R, etc.). They offer the advantage of having objectively defined momentum readings, while at the same time making these readings uniform across securities for cross market comparison purposes. On the other hand, the very fact that these tools can only obtain a limited range of values, presents problems during extended price trends, as their extreme readings (aka “overbought/overbought”) remain at high (or low) levels for a prolonged period of time, thereby giving many false signals. In fact, some analysts have created some counterintuitive techniques, based on this phenomenon, whereby “overbought” is a sign of future strength, and “oversold” is a sign of future weakness (see Demark, 1994, p. 89). Oscillators are not trend friendly, and one could argue that these are not truly momentum measuring yardsticks, but range identification indicators. For example, a 14-period stochastic oscillator states where you are, as a percentage, in a 14-period Donchian channel, and does not measure price momentum per se. Thus, the terms “overbought, oversold” become a bit of a misnomer.
14 RESEARCH
(ii) Trend-following Indicators
These measure price change over some period of time, and usually are boundless indicators (but not exclusively), as their readings can be increasing (or decreasing) along with price trends (eg. RoC, MACD, etc). Their very freedom makes it almost impossible to have objectively defined “overbought”, “oversold” levels, or have meaningful momentum comparisons between different asset classes (eg. individual equites vs currencies).
Of course, the aforementioned categorisation of indicators is not a fully detailed taxonomy, but a rather broad distinction for definitional purposes...
Irrespective of which family (category) of momentum tool is used, it would appear that in technical analysis literature, there is certainly no shortage of indicators. One could even argue that there are more indicators than traders...
So, why attempt to build another tool?
It is not the author’s intention to simply design yet “another” indicator, that would provide approximately the same informational value as numerous ones already do so, thus resulting in a tool that exacerbates the already existent issue of indicator multicollinearity.
Our goal is to improve an existing tool (MACD), so that – by eliminating its shortcomings – we will be creating a unique type of hybrid “boundless oscillator”, that opens the doors for several pattern recognition opportunities which would not be definable using the classic MACD.
We are big believers in creating new techniques rather than new tools, thus we will use the improved MACD to define a general Momentum Lifecycle RoadMap (framework), new entry & exit techniques, and versatile cross asset (intermarket) strategies, among other uses, that would not be achievable via the venerable MACD.
What is momentum?
Momentum is closely tied to Physics, and is the rate (speed) that prices change (velocity = d/t, where d = distance, t = time).
Momentum in market prices is a direct challenge to the Efficient Market Hypothesis (EMH), as it implies that prices trend and are not randomly distributed, thus it is possible to outperform the broad market.
Momentum Strategies are broadly distinguished between (i) Time Series (absolute) Momentum - establish long (short) positions by determining the trend of each asset individually (e.g go long positive 12-month price return).
(ii) Cross Sectional (Relative) Momentum Strategies - ranking assets and going long top and shorting bottom performers.
2. MACD: A measure of Momentum
2.1 Construction
One of the available tools to define momentum is the Moving Average Convergence Divergence (MACD) indicator. The MACD was created by Gerald Appel in the late 1970’s. It is a trend-following momentum indicator that shows the relationship between two moving averages of prices.
The MACD is constructed in four steps:
1. Calculate a 12-bar Exponential Moving Average
2. Calculate a 26-bar Exponential Moving Average
3. MACD Line = 12-bar EMA – 26 bar EMA
4. Signal Line = 9-bar EMA of the MACD Line
Further to the MACD, Thomas Aspray in 1986 created the MACD Histogram, which is constructed as follows:
5. MACD Histogram = Signal Line – MACD Line
15 www.technicalanalysts.com RESEARCH
Thus, in essence:
• The 12 & 26 EMAs are the 1st derivative of price.
• The MACD Line is the 2nd derivative of price.
• The Signal Line is the 3rd derivative of price.
• The MACD-H is the 4th derivative of price.
The MACD is a versatile tool with many non-conventional uses, but it nevertheless has five key shortcomings. Three of them are regarding the MACD values themselves and two have to do with signal line crossovers. Let’s see these in detail.
2.2 Limitation 1: The MACD across time
By way of design, the MACD is an “absolute price indicator”, as it takes absolute price inputs (price MA’s) and produces an output (spread of raw price MA’s), without any kind of normalisation. This creates the following situation:
Although the MACD in 2020 has a bigger value than in 1957, that does not imply that the market has more momentum. That was simply a function of the underlying security having a larger absolute value when it was calculated in the second instance (2020) than the first (1978). The problem is exacerbated the further one goes back in time.
The implication of this is that MACD (and MACD Histogram) readings are not comparable across time for the same security, especially if the market in question has had substantial price appreciation or depreciation.

16 RESEARCH
S&P 500 1957- 1971 2019 - 2021 MACD Maximum 1.56 86.31 MACD Minimum -3.3 -225.40
Table 1: MACD Ranges
Figure 1: S&P 500 & MACD (1957 - 2021)
The
MACD is not time stable (comparable across time)
2.3 Limitation 2: The MACD across markets
The second limitation of the MACD and MACD Histogram are that they are not comparable across securities. Any differences in the indicator readings, are attributable to comparing securities that have different absolute values, rather than depicting varying levels of momentum strength.
For example, the MACD for the S&P 500 at the time of writing is 65 and for the euro is -0.0070.
Again, this does not mean that the S&P has more momentum than the euro, but its bigger MACD reading is a function of the bigger absolute price of the underlying security.
Cross market momentum comparisons are not possible, as it would be the case with – say – using a (0-100) scaled indicator. The RSI for the S&P and Euro in this instance would be directly comparable, but not for the MACD.
2.4 Limitation 3 – MACD Momentum LifeCycle
The
MACD is not comparable across securities
The MACD is an improved version of a moving average crossover system.
When a market is trending in a particular direction, the shorter term EMA responds quicker to price than the longer term EMA, moving away from (closer to) it, and consequently their difference / spread increases (decreases). Thus the MACD indicates the direction of momentum (bullish if above the signal line or bearish if below the signal line). When this is viewed against the prevailing trend, it highlights momentum acceleration or deceleration, and the beginning and end of this process can be identified via signal line cross overs. Moreover, the further away the MACD is from the equilibrium line, the stronger momentum is (please refer to Figure 4, bottom panel).
However since MACD values are not comparable across time and across securities, it is impossible to standardise the intensity (strength) of (MACD-defined) momentum, into an objectively and quantitatively defined framework, where ‘High (fast) vs Low (slow)’ and/or ‘overbought vs oversold‘ levels would exist.
2.5 Limitation 4: Signal line accuracy
When directional strength is low, the MACD will be near the equilibrium line and/or close to the signal line. As such, signal line crossovers will be frequent, giving many (false) signals. This phenomenon is one of the Achille’s heels of trend-following system behaviour in low momentum environments in general. The MACD is no exception.
The MACD momentum readings cannot be objectively scaled
In Figure 5, this is easily observed during the May to August 2016 period, where six loss producing crossovers signals occurred in a range bound, low momentum environment. As a consequence of limitation No. 3 (lack of momentum level scaling), these cannot be avoided by way of – say – rejecting the signals that occur within an objectively and quantitatively defined low momentum environment.
17 www.technicalanalysts.com RESEARCH

MACD signal line crossovers are unreliable in low momentum environments
MACD signal line crossovers are unreliable in low momentum environments.
2.6 Limitation 5: Signal line timing
When momentum is high, MACD signal accuracy is (one) of its main strengths.
However, when the market is pushing higher (lower) with too much force - to the point where the MACD line has built significant distance from the signal line- but then changes its trend to the downside (upside) abruptly, it takes some time before the lagging MA’s catchup to the new data (raw price), which translates into a directionally correct (accurate), but late (from a timing point of view) signal.
This phenomenon is more often observed in fast bearish trends, which then proceed to form a V-shaped bottom (when a counter-trend bounce occurs). Given the trend-following nature of the MACD, it is guaranteed that it will signal the turn, but it will produce a signal line cross over that maybe some distance away from the actual price bottom itself.
For example the S&P 500 bottomed at 2532.69 on 9 of February 2018, but the MACD signaled the turn at 2747.30 on 23 of February, which means it was ‘late‘ by 8.47%.
18 RESEARCH
Figure 2: MACD behaviour in low momentum - FTSE 100 (February – August 2014)

Again as a direct consequence of limitation No. 3 (and the lagging nature of the signal line), it is impossible to improve signal timing by first identifying a high momentum environment.
MACD Crossover signals are late in high momentum trend reversals
3. PPO: An improvement, but not a solution
3.1 Construction
A solution to deal with Limitations Nos 1 & 2, is to normalise the readings of the MACD, so as to become comparable across time & securities.
A well-known suggestion is to place the raw MA spread as a function of the absolute price of the underlying security, so that momentum (MACD) is placed in context. This is then multiplied by 100, to obtain the output on a percentage basis.
Thus the formula for the MACD Line now becomes: This resulting indicator is commonly known as the PPO (percent price oscillator).
[ (12 period EMA - 26 period EMA) / (close) ] x 100 or
(12 period EMA - 26 period EMA) / (26 period EMA) ] x 100
Let’s see what is the effect of the PPO on the MACD limitations.
19 www.technicalanalysts.com RESEARCH
Figure 3: MACD in high momentum trend reversal- S&P 500 (Feb 2018)
3.2 Limitation 1 – The PPO across time
Since the PPO readings are expressed on a percent basis, that means that they should be comparable across time for the same security on a ‘apples to apples’ basis. Let’s confirm this by revisiting the S&P 500.

Although specific stationarity tests could be employed to prove the point, we can easily observe that the range of fluctuation (variable’s dispersion around zero) is more stable, as the MA spread is normalised on a percentage basis. In fact if we set lower and upper boundaries in such a way that it contains 95% of the observations, since 3 of Feb 1975, the PPO has oscillated within 2% and -2%.
20 RESEARCH
Figure 4: MACD & PPO - FTSE 100 (February to October 2016)
Figure 5: S&P 500 & PPO (1970 - 2021)
The PPO retains all of the advantages that the MACD has, but also adds reading uniformity across time for the same security. It would appear that Limitation No. 1 is solved.
PPO readings are time stable (comparable across time)
3.3 Limitation 2: The PPO across markets
One would be tempted to assume that since the PPO is expressed on a percent (%) basis and it is comparable across time, then cross market comparisons would be also be feasible. However, upon closer inspection, it would appear that the PPO fails the test. Let’s see this via an example:

Using the aforementioned upper/lower boundaries used for the S&P 500, it would appear that the Bund has never traded above the upper level of 2% and never below the lower -2% level, in its entire history. It is evident that there is considerable variation in the data and in order to see where 95% of the PPO values for the Bund reside we would need to establish different levels.
21 www.technicalanalysts.com RESEARCH
Figure 6: German Bund and PPO (1991 – 2021)
PPO Ranges > 2% 2% to -2% < - 2% % of time 2.2% 94.3% 3.5%
Table 2: PPO Ranges (S&P 500)
PPO Ranges > 0.7% 0.7% to -0.7% < - 0.7% % of time 3.5% 93.6% 2.9%
Table 3: PPO Ranges (German Bund futures)
Thus a PPO reading higher than 0.5% for the Bund would constitute a strongly trending environment. The same reading for the S&P would be indicative of an almost range bound market. What constitutes “high momentum” in one market, may very well be classified as “low momentum” in another...

The aforementioned differences become more pronounced as we examine a very volatile market such as Natural Gas futures. Figure 7 depicts the PPO ranging most of the time (94.2%) from +7% to -7%.
Thus, it appears that the PPO is not a truly normalised momentum comparison tool for cross market purposes, as it fails to provide uniform benchmarks levels due to fact that markets may have significantly different volatility structures.
The PPO is not comparable across securities
22 RESEARCH
Figure 7: Natural Gas futures and PPO (1990 - 2021)
NG - PPO Ranges > 7% 7% to -7% < - 7% % of time 1.4% 94.2% 4.4% BUND – PPO Ranges > 0.7% 0.7% to -0.7% < - 0.7% % of time 3.5% 93.6% 2.9% SP 500 - PPO Ranges > 2% 2% to -2% < - 2% % of time 2.2% 94.3% 3.5%
Table 4: PPO Ranges (across markets)
3.4 Limitation 3: PPO Momentum Framework
Since the PPO cannot be standardised both across time and securities, it is then not possible to deal with momentum level definition in a uniform framework.
It would be perhaps feasible on a ‘per individual market basis’ to create levels where historically each market in question is deemed as ‘overstretched‘ or with adequate levels of trend strength, but this would not be practical as it would require massive amounts of optimisation for an almost limitless universe of securities and the findings for each market would not be transferable to another.
3.5 Limitations 4, 5: PPO Signal Line accuracy & Timing
Consequently, the lack of a uniform ‘high/low‘ momentum definitions, renders Limitations Nos 4 & 5 unsolved under the PPO as well, as cross over signal filtering is not feasible.

References:
Appel, G. (2005). “Technical Analysis: Power tools for active investors”, Financial Times/Prentice Hall. Demark, T. (1994). “The New Science of Technical Analysis: 45”, Wiley Finance.

23 www.technicalanalysts.com RESEARCH
Bond bears charts well

GERRY CELAYA, MSTA
Gerry Celaya has been professionally involved in global market research and investments since 1986.
Gerry is a director at Redtower Asset Management and Tricio Investment Advisors , providing research and risk management consultancy services in the FX and investment markets to professional clients around the world.
Introduction
This article sums up a couple of blogs that I wrote over the course of the big bear bond cycle that we have seen since 2020, with some additional research notes for readers to consider blogs .
The purpose of the article is not too big up a good call (or just lucky?), but rather to show that using the most simple of technical analysis tools can help in managing risk. In my view bond markets rule over all other financial markets (sort of the “One ring to rule them all” from Tolkien) as the cost of money impacts investor sentiment and decision making in all other asset classes. By bond markets I include money markets, of course, which may be considered as a bit of a cheat by some market participants!
I started my professional career as a technical analyst in the mid-1980s as a bond research analyst at Money Market Services (which was subsequently bought by McGraw-Hil l as part of their S&P unit and eventually became part of Informa). My job ranged from following intraday front month Chicago Board of Trade bond futures contract price movements and plotting them on a Telerate screen as point and figure charts (before Bloomberg screens existed), plotting real time on-therun bond yields to assisting a colleague with data models to estimate mortgage bond prepayment risks as yields moved up and down. I was lucky enough to be asked to work with a team of analysts in London in 1989 to develop a European bond market product, and eventually run the FX and bond European technical analysis teams where I first worked with STA stalwarts like Tom Pelc and Patricia Elbaz! Moving from research to trading I joined Bank of America in London in 1994 and produced daily bond and FX technical research and traded with various proprietary trading teams. It was a lot of fun trading through our futures colleagues on the LIFFE floor but I was never clever enough to learn all of their hand signals or fight it out on the actual pits! Since then my bond analysis has become more long-term in nature, reflecting the current work I do in helping professional clients design investment portfolios for their clients. The blogs that I wrote in March 2022 and March 2023 were written with a long-term view in mind.
US bond yield break point (blog from March 2022)
Tricio (a firm I started with two former American Express Bank colleagues) has long advocated the view that the US 10-year note yield would be heading towards the 2.50-3.0% range over the course of this cycle. This means that 2021 was a tough year for us as the initial surge above 1.0% in the 10-year note yield fizzled away and much of the year was spent ‘marking time’. This has changed over the last few months though, as the Fed’s rhetoric about removing stimulus and actually tightening policy stepped up in late 2021 and turned positively hawkish recently. This has sent yields up above 2.3% over the last few weeks, flight to safety bids over the Russian attack on Ukraine notwithstanding.
One chart (Figure 1 below) that caught my eye today is the long term chart of the note, as I was preparing my slides for a presentation on behalf of the STA at the University of Brighton next week (along with three awesome chartists, Tom Pelc, Murray Gunn and Simon Warren at the invitation of Dr Rob Hayward, Principal Lecturer, School of Business and Law). The chart is below and shows the yield of the 10-year note since the late 1970s, with Fibonacci ratio retracements from the 15.8% peak to the 0.3% area low. The 23.6% retracement of this drop in yields comes in near 4%, while the more commonly used 38.2% retracement is just above 6%. Also of interest is the falling line from two prominent high points (red) that is currently under pressure.
24 RESEARCH

What does this mean for investors? Well, on one hand, many might say that the bond yield offers better value near 2.3% now than it did last year. The red line (representing demand for the bond, in this case) may hold up and yields may fall away again. On the other hand (showing my economist training here…), a break above this line may be a call to action for many fund managers as this would be a potential ‘regime change’ for the bond market. This line has roughly guided the 10-year note yield down for more than 30 years. A sustained break of this lower yield trend may see 3% pressed before year end and open up higher bond yield risk in 2023. There are plenty of guesses about the strength of the US economy, the future of inflation risk, how hawkish the Fed will be etc. There should be a chance that US growth holds up better than expected, inflation remains above 2% but not so high that the Fed has to kill off growth, and that the 10-yr. note yield could trot up to 4% without the financial system or world economy falling over, right? How about 6%?
The blog above used a falling line, which measures supply and demand, as the break out, to gauge investor sentiment. The Fibonacci ratio retracements give potential landing points to keep in mind. The blog below, written a year later, followed up on this.
Charting peak yield (blog from March 2023)
We look at bond yields instead of prices in order to avoid the difficulties presented when rolling from benchmark issues (‘on the run’) that different coupons and maturities would represent.
Most of the usual technical analysis tools work well for bond yield chart analysis. One thing to watch out for would be equity market chartists who may want to use semi-log charts while looking at bond yields. Keep in mind that low yields already exacerbate price moves compared to higher yield price moves (a 10bp move from 2.0% to 2.1% has more price implications than a 10bp from 7.4% to 7.5%, a convexity problem), so using a semi-log chart would only make this worse.
For the purpose of this blog, I am looking at the US two-year, five-year and and 10-year note yield charts going back to the early 1980s. The lines that I put on the chart are from key lows. I use these as turning points as breaking a key low means a lot for market sentiment. Regaining this key yield low gives an important sentiment signal.
The two-year note yield chart below (Figure 2) is a monthly bar chart with a five-year moving average. If the 5% area gives way on a sustained basis then the 5.7-6.0% area would be expected to attract (blue line zone). There is some risk that this would give way for a push to the 8% and even 9.4% area, but this is not expected in this cycle. Support is layered at the 4-3.6% area.
25 www.technicalanalysts.com RESEARCH
Figure 1: The US 10-year note
US 10Y T-NOTE
2.41700,
+050460)
(1.84000,
1.66800, 232620,

The five-year note yield chart below (Figure 3) shows pressure on the key 4.5% area line could build. A break of this area would leave the 5.2-5.3% area open further out (blue line) which seems possible. The top line near 7.5% seems unlikely to be tested in this cycle, while chart support at the red line is clear near 3.4%.

The chart for the US 10-year note yield below (Figure 4) shows that key resistance at the 4%/4.3% area is under pressure again. A sustained turn higher to 5-5.2% (blue line) is at risk. The top line near 6.7-7.0% is a clear risk, but this is not expected to be reached in this cycle. The red line offers support at the 3% area (3.3% is key ahead of this as a recent low).
26 RESEARCH
Figure 2: US two-year note yield
US 2Y T-NOTE (Bid Yield) (4.8340, 4.9440, 4.8180, 4.8483, +0.0513), Moving Average (1.7417 ) US 5Y T-NOTE (Bid Yield) (4.2010, 4.3520, 4.1800, 4.2299, +0.0619), Moving Average (1.8759)
Figure 3: US five-year note yield

Bottom line? Big levels are in play, simple chart analysis suggests that there is still some upside risk in US bond yields. We are looking at the two-year note yield as the leader here, given the stage of the Fed rate hike cycle that we are in. Any hint of the Fed looking to pause their rate hikes should see the market slam the brakes on higher yields here first. The ‘pause or pivot’ argument will make curve trades very interesting over the coming months. We favour pausing for a while, but the market seems keen to price in ‘pivot to lower yields’ risk whenever it can.

27 www.technicalanalysts.com RESEARCH
Figure 4: US 10-year note yield
Additional thoughts (January 2024)
The March 2023 blog looked at the two-, five- and 10-year US Treasury note yield monthly charts with a five-year moving average on them for ‘mean reversion’ and ‘look how far we have moved!’ purposes. The horizontal lines were put in at what I believe to be key inflection points – support and resistance – from historical key swing points. This is of course very subjective, but a lot of chart analysis can be subjective at times.
The chart below (Figure 5 ) shows a current (January 2024) weekly chart of the US 10-year note yield. The 13- and 50-week moving averages are plotted to show a quarter and year of trend (respectively), with a 14-week RSI included as well to show momentum. There are Fibonacci ratio retracements from the 0.31% (2020 all-time low) to 5.02% (2023 peak) move, and two rising trendlines drawn from important lows to show the underlying ‘supply and demand’ lines.
Forecasting future price/yield movements is of course, fraught with the risk of being wrong. But the charts show that a potential peak in yield at the 5% area has been seen, and that yields have moved below the 13-week moving average (red line) and are testing the 50-week moving average (blue line). The 23.6% retracement near 3.9% has been met, and the fall in yield below the rising purple line underlines the change in near to medium term trend. The focus this year may be that if yields hold below the rising purple line and 5.02% 2023 yield peak, then a decline to the 38.2% retracement target near 3.2% should be expected. This coincides with some important yield lows set in 2023 so it may offer sticky yield support (price resistance). Looking further out and a drop to the rising red trendline cannot be ruled out. This may be a late 2024 or 2025 story, with the 50% retracement near 2.67% potentially coming into play then. There will be a lot of toing and froing along the way, and bond traders and analysts will be looking for shifts in yield spreads and Fed expectations etc. Unless yields push above the rising purple and the 2023 peak though (opening up 6% and higher risk again), a choppy drop in yields may be in the works now. Further out? Remember Figure 1 – the falling bond yield trend in the 10-year note has been broken and the long-term risk should be kept on 5% being tested again, with 6% area targets on a 38.2% retracement still open!

28 RESEARCH
US 10Y T-NOTE (Bid Yield) (4.06, 4.07, 3.97, 4.03, -0.01), Moving Average (4.32), Moving Average (4.00)
Figure 5: weekly chart of the US 10-year note yield

29 www.technicalanalysts.com RESEARCH
Derivative subcycles, double sequence effects & the 9/56-year cycle
 DAVID MCMINN
David McMinn completed a Bachelor of Science degree at the University of Melbourne in 1971 (Geology major) and subsequently became a Minerals Economist in ANZ Banking Group Ltd . Since leaving this position in 1982, he has conducted private research on cycles arising in seismic and financial trends, publishing numerous papers on cycle theory, especially in relation to the 9/56-year cycle.
Introduction
The 9/56 year cycle consists of a grid with intervals of 56 years on the vertical (called sequences) and multiples of 9 years on the horizontal (called subcycles) and was first proposed by McMinn (1986, 1993). The 9/56 year, 18/56 year, 36/56 year and 54/56 year grids gave rise to numerous derivative subcycles on the diagonals of these patterns, based on 2, 11, 20, 29, 38, 47 and 65 years among others (McMinn, 2023). These concepts will be expanded upon in this article to show how the 9/56 year grid can be further reconstructed to account for various other financial phenomena, such as the 8-9-10 year cycle of price highs, as well as the three, 10 and 13 year panic cycles.

Third edition
Signed copy
No firm definition exists of what constituted a ‘major’ crisis in economic history. Even so, Kindleberger (Appendix B, 1996) gave a compilation of what he considered were ‘major’ financial crises from 1760 to 1990 (see Appendix 1). Kitchin (1933) also presented a listing of major and minor financial crises for the 1790 to 1940 era (see Appendix 2). These authors were selected given their preeminence in economic history and because they presented the most comprehensive lists of historic financial crises. They provided external references independent of the study. Years presented in BOLD experienced major crises, as listed by Kindleberger (1996). Years underlined denoted the major/minor crisis years listed by Kitchen (1933).
In the tables, the year of best fit was taken as the year commencing March 1 as it offered the greatest significance. The 56 year sequences in the 9/56 year grid have been numbered from 01 to 56 in accordance with McMinn (1993), with 1761, 1817, 1873, 1929, 1985 being designated Sequence 01, 1762, 1818, 1874, 1930, 1986 as Sequence 02 and so forth. Appendix 3 gives the full numbering. A Chi Square test has been applied where appropriate in the text.
Double Sequence Effect
Two 9/56-year grids accommodated most of the major crises in financial history and have been denoted as Grid A and Grid B and are presented in Table 1 These patterns lie in two separate sectors of the complete 9/56-year cycle (see Appendix 3).
30 RESEARCH
Kindleberger, C. P., 1996. Manias, Panics & Crashes. John Wiley & Sons.
Adding one year to the sequences in Grid B gave the sequences in Grid A. Thus, if the time unit on the vertical columns in Grid B was increased from one to two years, a 'double sequence' pattern can be produced (see Table 2). Some 30 major panics in the 1760-1940 era were listed by Kindleberger (Appendix B, 1996), of which an amazing 27 appeared in the table (significant p < 10 -4). The anomalies occurred in 1797, 1815 and 1907. Kitchin's major/minor crises also fell preferentially in these patterns (siginificant p < .05).
31 www.technicalanalysts.com RESEARCH Year beginning 1 March Grid A Sq 52 Sq 05 Sq 14 Sq 23 Sq 32 Sq 41 Sq 50 Sq 03 Sq 12 Sq 21 Sq 30 Sq 39 Sq 48 Sq 01 1763 1772 1781 1790 1799 1808 1817 1765 1774 1783 1792 1801 1810 1819 1828 1837 1846 1855 1864 1873 1812 1821 1830 1839 1848 1857 1866 1875 1884 1893 1902 1911 1920 1929 1868 1877 1886 1895 1904 1913 1922 1931 1940 1949 1958 1967 1976 1985 1924 1933 1942 1951 1960 1969 1978 1987 1996 2005 2014 1980 1989 1998 2007 2016 Grid B Sq 04 Sq 13 Sq 22 Sq 31 Sq 40 Sq 49 Sq 02 Sq 11 Sq 20 Sq 29 Sq 38 Sq 47 Sq 56 Sq 09 Sq 18 1762 1771 1780 1789 1798 1807 1816 1825 1834 1764 1773 1782 1791 1800 1809 1818 1827 1836 1845 1854 1863 1872 1881 1890 1820 1829 1838 1847 1856 1865 1874 1883 1892 1901 1910 1919 1928 1937 1946 1876 1885 1894 1903 1912 1921 1930 1939 1948 1957 1966 1975 1984 1993 2002 1932 1941 1950 1959 1968 1977 1986 1995 2004 2013 2022 1988 1997 2006 2015
A double sequence effect - two years beginning 1 March Sq 04 Sq 13 Sq 22 Sq 31 Sq 40 Sq 49 Sq 02 Sq 11 Sq 20 Sq 29 Sq 38 Sq 47 Sq 56 Sq 09 Sq 18 1762 1763 1771 1772 1780 1789 1798 1799 1807 1816 1825 1834 1764 1773 1782 1791 1792 1800 1809 1810 1818 1819 1827 1836 1837 1845 1854 1863 1864 1872 1873 1881 1882 1890 1820 1829 1838 1847 1848 1856 1857 1865 1866 1874 1883 1892 1893 1901 1910 1919 1920 1928 1929 1937 1946 1876 1885 1894 1903 1912 1921 1930 1931 1939 1948 1957 1958 1966 1975 1984 1985 1993 1994 2002 1932 1933 1941 1950 1959 1968 1977 1986 1987 1995 2004 2013 2022 1988 1989 1997 1998 2006 2007 2015
Table 1: 9/56-year Grids & Financial Crises 1760 – 2020
Table 2: 9/56-year Cycle & Financial Crises 1760 – 2020
Kindleberger’s major US and Western European crisis years listed in Appendix 1 highlighted in RED
Kindleberger’s major crisis years listed in Appendix 1 highlighted in RED Source: McMinn (2021).
8-9-10-year subcycles
According to Benner (1875), pig iron price peaks occurred every 8-9-10 years in the series - 1810, 1818, 1827, 1837, 1845, 1854, 1864, 1872, 1881, 1891. A grid repeating 8-9-10 years on the horizontal and 56 years on the vertical (denoted as a 8-910/56-year cycle) has been generated in Table 3. All of the sequences in this pattern appeared in the 9/56-year cycle Grids A and B in Table 1. Importantly, Kitchin's listing of major/minor crises occurred with significance in the 8-9-10/56 year patterns (significant p < .01), but this was not repeatable for major crises listed by Kindleberger (1996) (p > .05).
Continued...
Years in RED contained crises listed by Kindleberger (Appendix B, 1996). Years underlined contained major/minor crises listed by Kitchin (1933).
The findings for pig iron price highs were 'interesting'. Curiously, significance could not be achieved for the corresponding pig iron price lows, which Benner (1875) believed happened in a 11–9–7 year cycle.

32 RESEARCH 9/56 YC Grid A Sq 50 Sq 21 Grid B Sq 02 Sq 11 Sq 29 1771 +10 1781 + 8 1789 + 9 1810 + 8 1818 + 9 1827 +10 1837 + 8 1845 + 9 1866 + 8 1874 + 9 1883 +10 1893 + 8 1901 + 9 1922 + 8 1930 + 9 1939 +10 1949 + 8 1957 + 9 1978 + 8 1986 + 9 1995 +10 2005 + 8 2013 + 9
Grid A Sq 48 Grid B Sq 38 Sq 56 Sq 09 1760 + 9 1769 1798 +10 1808 + 8 1816 + 9 1825 1854 +10 1864 + 8 1872 + 9 1881 1910 +10 1920 + 8 1928 + 9 1937 1966 +10 1976 + 8 1984 + 9 1993 2022
Table 3: 8-9-10/56-Year Cycle & Major Financial Crises
Three-year panic cycle
Financial crises occurred preferentially in a three year cycle during the 19th century (see Table 4). Kitchin (1933) listed 23 major/minor crises for the 1815-1900 period, of which 15 occurred within the three year panic cycle (significant p < .01). For the longer 1795-1940 era, significance was reduced to p < .05. Major crises listed by Kindleberger (1996) clustered within the three year pattern for the 1795-1940 period (significant p < .05). The three year panic cycle was more strongly emphasised in the timing of minor crises during the 19th century. It was another derivative pattern, because the 9 year cycle in the left hand column was evident in the Grid A and the 9 year cycle in the right hand column in Grid B.
Years in left hand column fell in the 9/56-year cycle Grid A. Years in right hand column fell in the 9/56-year cycle Grid B. Years in RED contained major crises listed by Kindleberger (Appendix B, 1996). Years underlined contained major/minor crises listed by Kitchin (1933).

33 www.technicalanalysts.com RESEARCH
Year beginning 1 March 9/56 YC Grid A 9/56 YC Grid B 1797 +3 1800 1803 +3 1806 +3 1809 Sq 52 1812 +3 1815 +3 1818 Sq 02 Sq 05 1821 +3 1824 +3 1827 Sq 11 Sq 14 1830 +3 1833 +3 1836 Sq 20 Sq 23 1839 +3 1842 +3 1845 Sq 29 Sq 32 1848 +3 1851 +3 1854 Sq 38 Sq 41 1857 +3 1860 +3 1863 Sq 47 Sq 50 1866 +3 1869 +3 1872 Sq 56 Sq 03 1875 +3 1878 +3 1881 Sq 09 Sq 12 1884 +3 1887 +3 1890 Sq 18 Sq 21 1893 +3 1896 +3 1899 Sq 27 Sq 30 1902 +3 1905 +3 1908 Sq 39 1911 +3 1914 +3 1917 Sq 48 1920 +3 1923 +3 1926 Sq 01 1929 +3 1932 +3 1935
Table 4: Three-Year Panic Cycle 1795-1933
1920
13-year panic cycles
A 13/56-year panic cycle (see Table 6) may also created from Grids A and B, Kindleberger’s major crises (1820-1990) occurred selectively in this 13/56 year grid (significant p<0.05). Some 19 years showed up between1820 and 1940, of which 10 experienced major financial crises in contrast to about four that could have been expected. Major/minor crises of Kitchin (1933) for 1820-1935 also fell preferentially in these patterns (significance p<0.05).
(a) The 56 year sequences are separated by intervals of 13 years. Years in RED contained major crises listed by Kindleberger (Appendix B, 1996). Years underlined contained major/minor crises listed by Kitchin (1933).
34 RESEARCH
Year beginning 1 March Grid A Grid B 1818 US and British crises 1827 French crisis (December)
French panic (July) 1836 English panic (December)
1845 English
1854
US and UK panics 1860 US crisis 1863 French panic
UK Black Friday 1869 US Black Friday 1872 No impact 1875 UK crisis (June) 1878 UK crisis (October) 1881 French panic 1884 US panic (May) 1887 Austrian panic 1890 Baring crisis (November) 1893 US panic (July) 1896 US bank runs (October) 1899 US panic (December)
No impact 1905 No impact 1908 No impact
German crisis (September) 1914 War panics (August) 1917 Russian Revolution
1830
1839 US panic (October)
panic (November) 1848 French panic (March)
US crisis (September) 1857
1866
1902
1911
1923 German deflation
US and UK crisis
1932 World crisis
1929 US Black Monday
Table 5: Crisis Events in the Three-Year Panic Cycle
in RED contained crises listed
Years underlined contained major/minor
listed by
Table 6: 13/56 Year Cycles & Major Financial Crises 1820-1940 (a)
Years
by Kindleberger (Appendix B, 1996).
crises
Kitchin (1933).
YC Grid A Sq 39 Sq 52 Sq 48 Sq 05 Sq 01 Grid B Sq 09 Sq 22 Sq 18 Sq 31 1791 1804 1817 1795 1808 1821 1834 1847 1860 1873 1799 1812 1825 1838 1851 1864 1877 1890 1903 1916 1929 1855 1868 1881 1894 1907 1920 1933 1946 1959 1972 1985 1911 1924 1937 1950 1963 1976 1989 2002 2015 1967 1980 1993 2006 2019
9/56
Table 5 shows Crisis Events in the Three-Year Panic Cycle.
Grid B
Grid B
Grid
Grid
crisis (30 January 1882). Union Generale failure
Grid A
Grid A
Grid B
Grid B
crisis (October - November)
crisis (December)
10 Year Decennial Cycle
The Decennial Cycle in US stock prices was first proposed by Smith (1939). He researched historic trends going back to 1880 and established a 10-year pattern in US trading activity as measured by the Dow Jones Industrial Average (DJIA). His approach was vindicated in the ensuing decades. Years ending in certain digits usually experienced similar market outcomes, a trend that has persisted through the past 80 years.
• 1 and 2 ended years often experience a DJIA bear market low
• 3 and 4 years are usually good for the DJIA with rising prices
• 5 ended years virtually always witness a rising market
• 6 and 7 ended years see a peak in the DJIA and the beginning of a bear market
• 8 ended years are usually good for equities, with few exceptions
• 9 and 0 ended years see a DJIA peak, a bear market and financial upheavals
By rearranging the sequences in Grids A and B, it was possible to create 10 year subcycles as shown in Table 8. These patterns offered a theoretical basis to account for the Decennial Cycle in financial history. Crises listed by Kindleberger (1996) and Kitchin (1933) did not take place with significance in these grids.
www.technicalanalysts.com RESEARCH
Table 7 shows the two most important 13-year subcycles.
Table 7: The Two Most Important 13-Year Subcycles
Sq
1881
09
French
Sq
1894 No
1907 US
22
impact
and European panics (August - October)
A Sq 48 1920 US
and UK crises. After inflation
A Sq 05 1933 US banking
B Sq 18 1946 US panic
Grid B Sq 31 1959 US ‘credit crunch’ (Autumn) Sq 44 1972 No impact Grid A Sq 01 1985 US$ crisis
A Sq 14 1998 Russian
crisis (March) Grid
(3 September)
(September) Grid
debt crisis (August)
Sq
1799
39
Hamburg
Sq
52 1812 Danish national bankruptcy (5 January 1813)
Sq
1825 British
09
Sq
1838 Banque
Sq 35 1851 No
A Sq 48 1864 French
A Sq 05 1877 US crisis
B Sq 18 1890 Baring
Grid B Sq 31 1903 US Rich Man’s Panic Sq 44 1916 No impact
A Sq 01 1929 US
Monday
22
de Belgique failed (Belgium 17 December)
impact Grid
panic (January) Grid
Grid
Crisis (November)
Grid
Black
(28 October)
35
(a) Each 56-year sequence is separated by an interval of 10 years. Kindleberger’s major crisis years listed in Appendix 1 highlighted in RED
From Table 8, 7 ended years gave the most important 10-year subcycle.
1797 English crisis (February - June). Fishguard invasion scare
• Grid B 1807 US Embargo Depression
• Grid A 1817 No impact
•
•
•
•
•
•
B 1827 French crisis (December). Bankruptcies in Alsace
A 1837 US panic (10 May)
B 1847 British banking panic (23 October)
A 1857 US and European panics (October - November)
B 1867 French crisis. Credit Mobilier failure (October)
A 1877 US crisis (Autumn)
17 Year Cycle
Hadik (2007) and Cowan (2009) were among the first to promote a 17-year cycle in US stock market trends. This cycle gave several key turning points in the history of the DJIA. No major market high or low took place in 2017 and that year did not align within the trend.
• 1881 High (June)
• 1898 Bear market low (25 March)
• 1915 Secular low (2 November 1914)
• 1932 Secular low (8 July)
• 1949 Bear market low (13 June). Beginning of the 1949-1966 bull market
• 1966 Secular high (9 February). Beginning of 1966-1982 stagnation
• 1983 Secular low (12 August 1982). Beginning of the 1982-2000 bull market
36 RESEARCH
Grid
Grid
Grid
Grid
Grid
Grid
YC Grid A Sq 01 Sq 21 Sq 41 Sq 05 Grid B Sq 47 Sq 11 Sq 31 Sq 51 1765 1761 1771 1781 1791 1801 1811 1821 1797 1807 1817 1827 1837 1847 1857 1867 1877 1853 1863 1873 1883 1893 1903 1913 1923 1933 1909 1919 1929 1939 1949 1959 1969 1979 1989 1965 1975 1985 1995 2005 2015 2021 Grid A Sq 48 Sq 12 Sq 32 Sq 52 Grid B Sq 18 Sq 38 Sq 02 Sq 22 Sq 42 1772 1782 1792 1802 1812 1778 1788 1798 1808 1818 1828 1838 1848 1858 1868 1834 1844 1854 1864 1874 1884 1894 1904 1914 1924 1890 1900 1910 1920 1930 1940 1950 1960 1970 1980 1946 1956 1966 1976 1986 1996 2006 2016 2002 2012 2022
Table 8: The 10/56 Year Cycles 1760 – 2020 (A)
9/56
• 2000 Secular high (14 January). Beginning of 2000-2015 stagnation
• 2017 No Impact – did not align with a major high or low
• Year of best fit ending 15 July
Since 1880, the DJIA has also moved in cycles of about 17 years of boom followed by about 17 years of market stagnation of sideways moving markets (Hadik (2007), Cowan, (2009), Ray, (2014)).
• 1898 – 1915 Stagnation
• 1915 – 1932 Boom
• 1932 – 1949 Stagnation
• 1949 – 1966 Boom
• 1966 – 1983 Stagnation
• 1983 – 2000 Boom
• 2000 – 2017 Stagnation
• 2017 – 2034 Boom?
The time spans of 17 years are only approximate, with deviations from the ideal. According to this approach, there should be a protracted DJIA boom in the years to 2034, which is hard to believe given the reality of the global debt bubble, geopolitical tensions and the climate catastrophe.
Adding 17 to the 56-year sequences in Grid A of Table 9 gave the sequences in Grid B. Thus, adding 17 years to financial panics within Grid A often yielded panics in Grid B.
1810 English panic (January 1811)
1819 US panic (May)
1837 US panic (10 May)
1864 French panic (January)
1873 US and Austrian panics
1884 US panic (14 May)
1920 US and UK crises
1929 US Black Monday (28 October)
1980 US crises (March)
Discussion & Conclusions
Great Fear (July-August) US Copper Panic
French Alsatian crisis (December
1836 English panic (December)
+ 17 1854 US panic (September)
+ 17 1881 French panic (30 January 1882)
+
+
1890 UK Baring Crisis (November)
1901 US Black Thursday (9 May)
+ 17 1937 US panic (18 October)
+ 17 1946 US near panic (3 September)
+ 17 1997 US Blue Monday (27 October)
The 9/56-year cycle Grids A and B are intriguing because they may help explain various phenomena found in economic history. Nearly all major financial crises between 1760 and 1940 appeared in the double sequence grid in Table 2 . Thus, any number series that was confined within with this pattern should have a clustering of major financial panics. This applied to the Benner Cycle of pig iron price highs, historic DJIA highs and the derivative three year, 10- and 13-year panic cycles. It did not apply to series that were not confined within Table 2 , such as the 17-year cycle. Based on Grids A and B, many patterns formed, persisted for a period and then dissipated and merged into new patterns, thereby contributing to the complexity of financial trends.
What activates the 9/56-year cycle? Several Moon Sun cycles align very closely at 9.0 and 56.0 solar years based on lunisolar cycles in integral and half-integral numbers (McMinn, 2021). Because of these alignments, any events clustering in a 9/56-year grid will have the lunar ascending node (LAN) in two segments sited approximately 180º opposite on the ecliptic (1st and 2nd harmonics) with no exceptions. For events falling in the same 56-year sequence, LAN will be sited on a narrow sector of the ecliptic (1st harmonic) with no exceptions. For events occurring at around the same time of year, the mean position of Apogee will be sited in three ecliptic segments 120º apart (3rd harmonic) with no exceptions. There is also a near perfect 6th harmonic between the ecliptic position of the Sun and the angle between the LAN and Apogee (McMinn, 2016). How weak lunisolar tidal harmonics actually functioned in relation to critical events and the 9/56-year cycle remained unknown.
37 www.technicalanalysts.com RESEARCH
9/56 YC Grid A Add 9/56 YC Grid B
+ 17 1789
Table 9: Adding 17 years to sequences
1772 British panic (June)
French
+ 17 1827
17
+
17
17
NB: The lunar nodes are sited in the heavens where the plane of the Earth’s orbit around the Sun (the ecliptic) is intersected by the plane of the Moon’s orbit around the Earth. Where the Moon crosses the ecliptic from south to north gives rise to the lunar ascending node (LAN) and from north to south gives the lunar descending node. Apogee is sited in the lunar orbit, where the Moon is greatest distance from the Earth. The lunar nodes and apogee are key determinants of terrestrial tides.
The placement of LAN on the ecliptic can be correlated with the timing of Kindleberger’s 30 major crises in the 1755-1940 era (see Figure 1). NB: E° denoted degrees on the ecliptic.
• 26 crises had LAN within two quarter segments diagonally opposite in the ecliptic - 350 – 80 E° and 170 - 260 E° (significant p<0.01).
• No crises were evident when LAN was sited between 255 and 335 E° - a segment of 80o (significant p<0.01).
Any events falling in a 9/56-year double sequence grid will always take place with LAN sited in two sectors diagonally opposite in the ecliptic circle.

Notes: Ecliptic position of LAN is presented for major crises occurring from 1755 to 1940.
For years with no given month, LAN is timed on July 1. For crises occurring over multiple months, LAN is timed midway between the first and last crisis month.
Source: McMinn (2006)
The many derivative cycles that can be sourced from the 9/56 year panic cycle would imply that the complexity of market cycles can be attributed solely to lunisolar tidal harmonics. This would greatly simplify the study of market cycles. This view falls well outside prevailing paradigms in economics and the sciences. The Moon Sun Hypothesis sees financial markets as being mathematically structured in time and moving in tune with changing Moon Sun tidal effects. Additional research is essential to determine whether the concepts presented in this article have a firm basis in fact or are just a play on numbers.
References:
Adams, A. B., 1936. Analyses of Business Cycles. McGraw – Hill. 293 p.
Cowan, B. F., 2009. Pentagonal Time Cycle Theory. Self published. 281 p. January 1. Haydn, J. and Vincent, B., 1969. Haydn’s Dictionary of Dates. Dover Publications Inc.
Hadik, E. S., 2007. The 17 year cycle. Insiide Track Report Excerpt. April-July. Extermal link here Kindleberger, C. P., 1996. Manias, Panics & Crashes. John Wiley & Sons. Third edition. 263 p. Kitchin, J. M. 1933. Trade Cycles Chart. The Times Annual Financial & Commercial Review. 1920, 1924, 1930. 1933 revised chart presented in Gold. A reprint of The Special Number of The Times. Times Publishing Co Ltd. June.
McMinn, D., 1986, The 56 Year Cycles & Financial Crises. 15th Conference of Economists. The Economics Society of Australia. Monash University, Melbourne. 18 p. August 25-29.
McMinn, D., 1993. The 56 Year Cycle & Financial Crises. The Australian Technical Analysts Association Newsletter. p 21-24. September.
McMinn, D., 2006. Market Timing By The Moon & The Sun. Twin Palms Publishing. 134 p. 9/56 Year Cycle: Lunar North Node – Apogee Angles.
McMinn, D., 2016. 9/56 Year Cycle: Lunar North Node – Apogee Angles. New Concepts in Global Tectonics Journal. V 4 No 1. p 32-36. March.
McMinn, D., 2021. 9/56 Year Cycle & Financial Panics. Cycles Magazine. Vol 50, No 4. p 31-51. July.
McMinn, D., 2023. Derivative subcycles, Lucas numbers & the 9/56 year cycle. Market Technician, Journal of the Society of Technical Analysts. Issue 95. p 35-43. September.
Ray, L., 2014. The 17 Year Stock Market Cycle Theory. beacontechnologies.com. February 15. Extermal link here
Sobel, R., 1965. The Big Board: A History of The New York Stock Market. The Free Press. 1965
38 RESEARCH
Figure 1: LAN Ecliptic Position & Major Financial Crises 1760-1940 All major crises listed by Kindleberger (Appendix B, 1996)
Appendix 1: Major financial crises - Kindleberger (Appendix B, 1996)
1618-23
1636-37
1720
1763
1772
1793
1797
1799
1810
1815-16
1819
1825
1828
1836
Holy Roman Empire. SP - Feb 1622. C - Feb 1622. Coin debasement
Dutch Republic. SP - Feb 1637. C - Feb 1637. After tulip mania
England. South Sea Bubble. SP - Apr 1720. C - Sep 1720
France. Mississippi Bubble. SP - Sep 1719. C - May 1720
Amsterdam. SP - Jan 1763. C - Sep 1763. End of Seven Years’ War
England. C – Jun 1772. Amsterdam. SP - Jun 1772. C - Jan 1773
England. SP - Nov 1792. C - Feb 1793. After canal mania
England. SP - 1796. C - Feb-Jun 1797
Hamburg. SP - 1799. C - Aug-Nov 1799
England. SP - 1809. C - Jan 1811
England. SP - 1815. C - 1816
USA. SP - Aug 1818. C - Nov 1818-Jun 1819
England. SP - Dec 1818. C - None
England. SP - Early 1825. C - Dec 1825
France. SP - MNG. C - Dec 1827
England. SP – Apr 1836. C - Dec 1836
1837 USA. SP - Nov 1836. C - Sep (error - May correct?)
1838
1847
1848
1857
France. SP – Nov 1836. C - Dec 1838. Banque de Belgique failed
England. SP - Jan 1847. C - Oct. After railway mania
Continent. SP - Mar - Apr 1848. C - Mar 1848
USA. SP - Late 1856. C - Aug 1857
England. SP - Late 1856. SP - Oct 1857
Continent. SP - March 1857. C - Nov 1857
1864 France. SP - 1863. C - Jan 1864
1866
1873
1882
1890
England/Italy. SP - Jul 1865. C - May 1866
Germany/Austria. SP - Autumn 1872, C - May 1873
USA. SP - March 1873. C - Sep 1873
France. SP - Dec 1881, C - Jan 1882. Union Generale failure
England. SP - Aug 1890. C – Nov 1890. Baring crisis
1893 USA. SP - Dec 1892. C - May 1893. Australia SP - . C – May
1907 USA. SP - Early 1907. C - Oct 1907
1920 -21
France/Italy. SP - Mar 1906. C - Aug 1907
USA/ UK. SP - Summer 1920. C - Spring 1921
1929 1929 USA. SP - Sep. C - Oct 28. Black Monday
1931-33
1931 Austria C - May. Germany C – Jun. UK C – Sep. Japan C – Dec 1933 USA C - March bank holiday
1950s and 1960s Currency speculations: France 1958, Canada 1962, Italy 1963, Britain 1964, France 1968, US$ 1973
1974-75
Worldwide. SP - 1973. C - 1974
1979-82 US crises: SP - 1979. Farmland (C - 1979), US$ (C - 1979), Oil (C - 1980), Third world debt (C - 1982)
1982-87 US crises: US$ SP - 1985, Real Estate SP - 1987, Stocks SP – Aug 1987, C - Oct 1987
1990 Japanese panic SP – Dec. C – Jan.
1994* Mexican debt crisis (20 Dec)
1997* Asian contagion. Worldwide.
1998* Russian debt crisis (Aug).
2000-01* US Tech Wreck. After Greenspan Bubble. 911 terrorist attack.
2007* US subprime loan crisis.
2008* World crisis (Oct). After Lehman Bros failed.
2011* EU sovereign debt crisis.
2015* Chinese Black Monday (24 Aug).
2020* World Crisis. Corona virus panic (March).
* Dates inserted by the author.
Crises events falling in the 9/56-year Cycle Grid A in Table 1 have been highlighted in RED
Abbreviations: SP- Speculative peak. C- Crisis/Panic. MNG- Month not given.
Source: Kindleberger (Appendix B, 1996).
39 www.technicalanalysts.com RESEARCH
Appendix 2: Major & minor financial crises 1790-1940 – Kitchin (1933)
Major US/Wn European crises 1796-1933 - Kitchin (1933).
1796
1801
1810
Panic (England)
Peace crisis (England)
Great panic (England - Dec)
1818 US crises (October)
1825
Panic after inflation (England - Dec)
1836 US wild cat crisis
1847
After railway mania (England - Oct)
1857 US collapse (Oct)
1866 Overend Gurney crisis (England - May)
1873
1881
Vienna leasing crisis (Germany and Austria - May). US collapse (Sep)
Paris bourse crisis (France - Jan 1882)
1890 Baring crisis (England - Nov)
1900 German crisis
1907 US crisis (Oct)
1913 Semi crisis. Second Balkans War
1920 Crisis after inflation
1929-33 World crisis
Minor US/Wn European crises 1799-1914 - Kitchin (1933).
1799
1805
Hamburg crisis
Semi crisis (Britain)
1814 General peace crisis (Europe)
1831
1839
1845
Calcutta failures (Britain)
English crisis
Railway mania panic (Britain - Nov)
1854 US crisis (Sep)
1860-61 US crises. Beginning of Civil War (Nov 1860)
1863-64 US crises
1870
1875
1878
War crisis (August). Franco Prussian War
Collie failure (Britain - June)
City of Glasgow Bank failure (Britain – Oct)
1884 US railway collapse (May)
1893 US crisis (May)
1914 War panics (Jul)
40 RESEARCH
Appendix 3: The complete 9/56-year grid – 1760 to 2020
Kindleberger (Appendix B, 1996)
Crises years listed by Kindlberger (1996) highlighted in RED
41 www.technicalanalysts.com RESEARCH
Year beginning 1 March Sq 52 Sq 05 Sq 14 Sq 23 Sq 32 Sq 41 Sq 50 Sq 03 Sq 12 Sq 21 Sq 30 Sq 39 Sq 48 Sq 01 1761 1763 1772 1781 1790 1799 1808 1817 1765 1774 1783 1792 1801 1810 1819 1828 1837 1846 1855 1864 1873 1812 1821 1830 1839 1848 1857 1866 1875 1884 1893 1902 1911 1920 1929 1868 1877 1886 1895 1904 1913 1922 1931 1940 1949 1958 1967 1976 1985 1924 1933 1942 1951 1960 1969 1978 1987 1996 2005 2014 2023 1980 1989 1998 2007 2016 Sq 10 Sq 19 Sq 28 Sq 37 Sq 46 Sq 55 Sq 08 Sq 17 Sq 26 Sq 35 Sq 44 Sq 53 Sq 06 Sq 15 1768 1777 1786 1795 1804 1813 1822 1831 1770 1779 1788 1797 1806 1815 1824 1833 1842 1851 1860 1869 1878 1887 1826 1835 1844 1853 1862 1871 1880 1889 1898 1907 1916 1925 1934 1943 1882 1891 1900 1909 1918 1927 1936 1945 1954 1963 1972 1981 1990 1999 1938 1947 1956 1965 1974 1983 1992 2001 2010 2019 1994 2003 2012 2021 Sq 24 Sq 33 Sq 42 Sq 51 Sq 04 Sq 13 Sq 22 Sq 31 Sq 40 Sq 49 Sq 02 Sq 11 Sq 20 Sq 29 1762 1771 1780 1789 1764 1773 1782 1791 1800 1809 1818 1827 1836 1845 1784 1793 1802 1811 1820 1829 1838 1847 1856 1865 1874 1883 1892 1901 1840 1849 1858 1867 1876 1885 1894 1903 1912 1921 1930 1939 1948 1957 1896 1905 1914 1923 1932 1941 1950 1959 1968 1977 1986 1995 2004 2013 1952 1961 1970 1979 1988 1997 2006 2015 2008 2017 Sq 38 Sq 47 Sq 56 Sq 09 Sq 18 Sq 27 Sq 37 Sq 45 Sq 54 Sq 07 Sq 16 Sq 25 Sq 34 Sq 43 1767 1776 1785 1794 1803 1760 1769 1778 1787 1796 1805 1814 1823 1832 1841 1850 1859 1798 1807 1816 1825 1834 1843 1852 1861 1870 1879 1888 1897 1906 1915 1854 1863 1872 1881 1890 1899 1908 1917 1926 1935 1944 1953 1962 1971 1910 1919 1928 1937 1946 1955 1964 1973 1982 1991 2000 2009 2018 1966 1975 1984 1993 2002 2011 2020
Sequence numbers highlighted in RED fall in the 9/56-year cycle Series A in Table 1
Sequence numbers highlighted in BLUE fall in the 9/56-year cycle Series B in Table 1
24 expected 14: 9/56-year cycle & financial crises 1790- 1940
A Double Sequence Effect, Kitchin (1933)
Major and minor crisis years listed by Kitchin (1933) highlighted in blue Source: McMinn (2021).
The complete 9/56-year grid – 1760 to 2020
Crises years listed by Kindlberger (1996) highlighted in red Post 1990 crisis years in Appendix 1 have been highlighted in blue
42 RESEARCH Year beginning 1 March Sq 52 Sq 05 Sq 14 Sq 23 Sq 32 Sq 41 Sq 50 Sq 03 Sq 12 Sq 21 Sq 30 Sq 39 Sq 48 Sq 01 1790 1799 1808 1817 1792 1801 1810 1819 1828 1837 1846 1855 1864 1873 1812 1821 1830 1839 1848 1857 1866 1875 1884 1893 1902 1911 1920 1929 1868 1877 1886 1895 1904 1913 1922 1931 1940 1924 1933 Sq 10 Sq 19 Sq 28 Sq 37 Sq 46 Sq 55 Sq 08 Sq 17 Sq 26 Sq 35 Sq 44 Sq 53 Sq 06 Sq 15 1795 1804 1813 1822 1831 1797 1806 1815 1824 1833 1842 1851 1860 1869 1878 1887 1826 1835 1844 1853 1862 1871 1880 1889 1898 1907 1916 1925 1934 1943 1882 1891 1900 1909 1918 1927 1936 1938 Sq 24 Sq 33 Sq 42 Sq 51 Sq 04 Sq 13 Sq 22 Sq 31 Sq 40 Sq 49 Sq 02 Sq 11 Sq 20 Sq 29 1791 1800 1809 1818 1827 1836 1845 1793 1802 1811 1820 1829 1838 1847 1856 1865 1874 1883 1892 1901 1840 1849 1858 1867 1876 1885 1894 1903 1912 1921 1930 1939 1896 1905 1914 1923 1932 Sq 38 Sq 47 Sq 56 Sq 09 Sq 18 Sq 27 Sq 37 Sq 45 Sq 54 Sq 07 Sq 16 Sq 25 Sq 34 Sq 43 1794 1803 1796 1805 1814 1823 1832 1841 1850 1859 1798 1807 1816 1825 1834 1843 1852 1861 1870 1879 1888 1897 1906 1915 1854 1863 1872 1881 1890 1899 1908 1917 1926 1935 1910 1919 1928 1937
Two years beginning 1 March Sq 40 Sq 49 Sq 02 Sq 11 Sq 20 Sq 29 Sq 38 Sq 47 Sq 56 Sq 09 Sq 18 1798 1799 1807 1816 1825 1834 1800 1801 1809 1810 1818 1827 1836 1845 1854 1863 1864 1872 1873 1881 1890 1856 1857 1865 1866 1874 1875 1883 1884 1892 1893 1901 1910 1919 1920 1928 1929 1937 1946 1912 1913 1921 1930 1931 1939
9/56-year grids & financial crises 1760 – 2020
43 www.technicalanalysts.com RESEARCH
Year beginning 1 March Series A Sq 52 Sq 05 Sq 14 Sq 23 Sq 32 Sq 41 Sq 50 Sq 03 Sq 12 Sq 21 Sq 30 Sq 39 Sq 48 Sq 01 1763 1772 1781 1790 1799 1808 1817 1765 1774 1783 1792 1801 1810 1819 1828 1837 1846 1855 1864 1873 1812 1821 1830 1839 1848 1857 1866 1875 1884 1893 1902 1911 1920 1929 1868 1877 1886 1895 1904 1913 1922 1931 1940 1949 1958 1967 1976 1985 1994 1924 1933 1942 1951 1960 1969 1978 1987 1996 2005 2014 1980 1989 1998 2007 2016 Series B Sq 04 Sq 13 Sq 22 Sq 31 Sq 40 Sq 49 Sq 02 Sq 11 Sq 20 Sq 29 Sq 38 Sq 47 Sq 56 Sq 09 Sq 18 1762 1771 1780 1789 1798 1807 1816 1825 1834 1764 1773 1782 1791 1800 1809 1818 1827 1836 1845 1854 1863 1872 1881 1890 1820 1829 1838 1847 1856 1865 1874 1883 1892 1901 1910 1919 1928 1937 1946 1876 1885 1894 1903 1912 1921 1930 1939 1948 1957 1966 1975 1984 1993 2002 1932 1941 1950 1959 1968 1977 1986 1995 2004 2013 2022 1988 1997 2006 2015 Sq 04 Sq 13 Sq 22 Sq 31 Sq 40 Sq 49 Sq 02 Sq 11 Sq 20 Sq 29 Sq 38 Sq 47 Sq 56 Sq 09 Sq 18 1798 1799 1807 1816 1825 1834 1800 1801 1809 1810 1818 1827 1836 1845 1854 1863 1864 1872 1873 1881 1882 1890 1820 1829 1830 1838 1839 1847 1856 1857 1865 1866 1874 1875 1883 1884 1892 1893 1901 1910 1919 1920 1928 1929 1937 1876 1885 1894 1903 1912 1913 1921 1930 1931 1939 1932 1933

Patricia Elbaz puts five questions to Gerry Celaya, Director at Redtower Asset Management and Tricio Investment Advisors and Director of the STA.
 PATRICIA ELBAZ, MSTA Direcctor
Gerry it’s an absolute pleasure to interview you for the Market Technician Journal, especially as I have known you for over 25 years… but who’s counting? In fact you are clearly the one to blame for introducing me to Technical Analysis as a young post graduate at Standard & Poor’s MMS!
1. Tell us, how were you first introduced to Technical Analysis?

GC: Patricia, it is always great to catch up with you! I came into technical analysis through meeting my friend’s father when I was studying for my BA degree at UC San Diego. He was retired and trading commodity and financial futures in the US from his house using his personal computer and a paper chart service. The paper charts were covered with his trend lines and he used his computer to download data stripped from the FNN TV service scrolling ticker! If I remember correctly, he also had hand drawn Point & Figure charts for break out studies. I found this fascinating and started to look into the study of charts in order to manage risk and generate returns. I think that the first book I read on the subject was Kaufman’s ‘Commodity Trading Systems and Methods’ a few years after he published it. My interest in Financial Markets started when I was in high school and taking Statistics and Econometrics courses. I studied Computer Programming at University and majored in Economics and Political Science. I studied for a Masters in Economics with a specialty in Applied Econometrics while
44 ANALYST FOCUS
Perry J. Kaufman., 1978. Commodity Trading Systems and Methods
Gerry Celaya, MSTA
working part time at Money Market Services, where they trained me as a Technical Analyst. I always like using chart analysis along with quantitative models or ideas in order to look for trends and come up with forecasts for returns, and risk analysis as well.
2. Which indicators would you recommend using when starting to learn about Technical Analysis?
GC: I would say now that I love moving averages. Start with simple moving averages and then use exponential or other complicated ones if you want to. With moving averages you can get rid of ‘noise’ that is generated by asset price movements (highs and lows) and potentially spot the underlying trend that you are looking for. They work with intraday data, daily, weekly, monthly, quarterly and any other time frame that you want to study. You can use moving averages to create simple trading models and you can use moving averages that have different data points in them to create spreads between themselves and/or the underlying close data and then use the spreads as momentum indicators. A technical analysts multi-purpose tool!
3. You have been involved in a very successful podcast series for the STA, bringing analysts and traders’ experience at the forefront and putting technical analysis education on the map. What key lessons can you draw from the many interviews?
GC: One key lesson for me is that all of the great people that I have been lucky enough to interview had someone to thank for getting them started on their technical analysis journey. Whether they were traders, fund managers, technical analysts etc., at some point in their career, usually pretty early, someone on their team had put time and effort, and money, into making sure that they received training, and the time to put their training into practical use. Another lesson is that no matter how their career progressed, they still used technical analysis tools in order to manage investment or hedging risks and spot opportunities in markets, regardless of asset classes.
4. In the past, many traders have said that they find technical analysis very useful for short term trading and outlook. Would you agree with that or do you think that a long term time frame is just as significant?
GC: I think that technical analysis tools are very useful for long term analysis as well. I started off as a Bond Analyst selling our research over trading systems to sell side (and some buy side) firms. We would cover intraday to short term outlooks, offering reward and risk ideas, but we would also write longer term pieces now and then to give an outlook for a few months or longer. When I started working in London and took over the FX technical analysis research with you as one of the first people that I ever hired, we used to spend a lot of time covering short term FX moves, within the context of the longer term view. I am not a 100% Elliott Wave analyst as I like to use a blend of tools. But one of the aspects of the wave theory that I find useful is the fractal nature of the analysis – you can break the moves up or down to look at long term potential waves, or the shorter ones if that is what you are trading. Some Gann tools can offer a similar
“The STA will be hosting the IFTA 2026 conference in London, and while I may not be on the Board then, I will be working with the Board this year to ensure that we have a solid financial and marketing backing to make this a success.”
GERRY CELAYA
perspective. Knowing (or at least, trying to know) if you are at the start of a move, or the tail end of a longer term move, can provide a very useful context for risk management and spotting potential rewards as well.
When I moved over to trading and providing research at Bank of America we mostly focused on intraday to a few weeks analysis for our trading and research. I moved to American Express Bank after that and did more long term research (a few years out) for clients. In my current role as Chief Strategist at Tricio (working with former AEB colleagues!) we offer 1 to 3-year portfolio allocation research to our clients and I find technical analysis tools very useful for this.
5. Finally, tell us a little more about future plans that you’re involved with for the STA.
GC: I was seconded to the Board in 2021 after finishing my first stint on the Board in 2003, in order to help out on the marketing and membership side of our Society. The STA Board has great people on it and works closely with STA Admin (Katie and her team!) in order to achieve our goals of furthering information and education in our field. We launched the podcasts to complement the YouTube videos, LinkedIn updates and other social media outreaches that Karen Jones, FSTA, Nicole Eliott, FSTA and their colleagues put out to inform and educate interested parties. We also held our first Technicals to Trading Systems Conference last April and will be holding another one this April in London (and over the web) as well. In the future we are planning further courses on quantitative techniques and potentially collaborating on behavioral finance courses. The STA will be hosting the IFTA 2026 conference in London, and while I may not be on the Board then, I will be working with the Board this year to ensure that we have a solid financial and marketing backing to make this a success.

Thank you Gerry for always coming forward to help with STA projects and for your enthusiasm in sharing your work and experience in Technical Analysis with us. You have a gift for making Technical Analysis a fascinating experience and I certainly learnt a lot from updating the 40x80 FX Point and Figure charts for you, which we would then fax to clients – it was the 90s after all! Today I can just use a platform or add AI to kindly update them and optimize them!
45 www.technicalanalysts.com ANALYST FOCUS

Patricia Elbaz puts five questions to Georges Castel, Director of the MBA Trading Financial Markets at ESLSCA Business School Paris.
PATRICIA ELBAZ, MSTA Direcctor
Georges I’m delighted that you are taking part in the Analyst Interview! I have moderated a number of panels with you as guest speaker for the Salon du Trading and Salon d’Analyse Technique organised by Andre Malpel and have benefited, along with many, from your market insight.
1. Can you tell us how you were first introduced to the world of Finance?
GC: Hello Patricia and thank you for this invitation. I discovered the world of Finance during my studies at the University of Bordeaux. I was lucky to have an exceptional Master 2 Director, Professor Marc Bertoneche, who was renowned worldwide, at Harvard Business School
“This MBA Trading Finance Market is my great professional pride over such a long period. The alumni are very grateful and I am proud of them.”
GEORGES CASTEL
Then in 1987 I obtained the 1st prize of Thesis Maurice Varsano (founder of the Sugars and Foodstuffs Group) awarded by the Bourse de Commerce de Matières Premières de Paris which became MATIF SA then EUREX. I worked as a Market Maker in Options on MONEP and MATIF for three years from 1986 to 1989 (Delahaye Ripault, Massonaud de Fontenay, then I managed for five years the Derivatives desk at Sucres & Denrées from 1989 to 1994. Then I worked for Société Générale Group from 1994 to 1998 as an options trader. Finally, from 1998 to 2000, I was the director of derivatives at Bank Worms. At the same time since 1988/89 I had been in the founding team of the MBA trading finance of Marché at ESLSCA as professor of derivatives and economic conditions and in September
46 ANALYST FOCUS
Georges Castel
2000 I became Director of Studies of ESLSCA. Today in 2023/2024, the MBA Trading Finance Market ESLSCA is in its 36th year, has 2,390 former students around the world who have become traders, work in M&A, sales, quants and so on. I know them all because I trained them all! Since September 2000, it is my main professional activity and the one I am most proud of because this MBA was ranked 7th/25 by Eduniversal in Market Finance in France.
2. In your experience in Banking did you use both Fundamental and Technical Analysis in trading?
GC: I have always used together technical and fundamental analysis, which I find complement each other very well. I work above all on volatility and what interests me more is the movement of the market (gamma management) rather than the sense of the market (delta management).
3. Can you tell us more about the MBA. How did you devise the MBA Trading Financial Markets at ESLSCA and how has it evolved since you introduced it?
GC: The creation of the MBA Trading Market Finance dates back to 1988/89. We were two traders at Sucres et Denrées and we created at that time at ESLSCA a third Trading cycle which became MBA. And today in 2023/ 2024 the “Pôle Trading ESLSCA” is still there in its 36th year and 2,390 former students spread around the world in the trading rooms in London, Paris, New York, Dubai, Singapore, Tokyo, Toronto, Bahrain, Bahamas, Oslo, Geneva, Lausanne, Zug and so on.
Since September 2000 when I retired from trading options, I have focused on teaching. I find it enriching intellectually and I enjoy the transmission of skills.
This MBA is very business orientated: learn to trade, manage risks, monitor market operations, both from a trader’s point of view, sales, fund managers, quants, ALM managers. The FX, interest rates, stocks/indices for trading commodities, physical and paper, oil, conventional and exotic derivatives, structured products, credit and climate derivatives, quantitative and alternative management are discussed. As well as hedge funds, actuarial, blockchains and cryptos. Compliance and ESG mechanisms are also an important dimension of this MBA. The ethics course is reinforced by Big Data, R language, Python, VBA in order to focus on the risk management issues related to various disputes following criminal behaviour on the financial markets.
This MBA Trading Finance Market is my great professional pride over such a long period. The alumni are very grateful and I am proud of them.
4. In your opinion is AI likely to be a threat or opportunity in trading and finance in the future?
GC: Big question of course! It is as if we said today that we would not answer a phone that rings because one does not hail by a servant (reflection at the end of the 19th century) or that we would not take an elevator without a lifter. In 2024, we climb alone in an elevator and we naturally answer the phone without asking questions. AI in finance will be a
valuable partner but human decision will always be present. There is AI only because there is human intelligence. In 50 years we will not even ask ourselves such a question, AI will have been fully integrated into all processes. Let’s remain optimistic! There will always have to be a pilot in the plane, the human being having extraordinary technological tools.
5. One of your greatest strengths is the connection that you build with your student, how you motivate, inspire and mentor them throughout their degree and beyond. How did you feel when you moved from Banking to full time Education, and what advice would you give a young undergraduate today?
GC: Absolutely agree. The “Pôle TRADING ESLSCA”, is a real brotherhood that I have been leading for all these years. Some have become stars (the CEO of Boursorama Bank (BoursoBank) Benoit Grisoni was my former student in 1997/1998 for example and so many others). I kept in touch with all my former students, it’s like a second family. Many of them are very grateful for it and it is an immense personal satisfaction. I dare say it’s my best track record.
For a young student entering their first year of higher education, I will tell them to listen to themselves, their desires and give themselves the means by loving their work, which is fundamental; because indeed we do well in what we love. I wish the young students best of luck and to have faith in humanity and the future.

Georges we wish you continued success at ESLSCA
Thank you for sharing your knowledge with us, for inspiring so many students and encouraging them to reach successful careers – I know that for a fact, as I have had the opportunity to meet many of your students at conferences!
We hope to see you at future STA talks if you are visiting! All STA events are listed on the website
“For a young student entering their first year of higher education, I will tell them to listen to themselves, their desires and give themselves the means by loving their work...”
47 www.technicalanalysts.com ANALYST FOCUS
GEORGES CASTEL
Navigating Market Signals:
Insights from S&P 500 Analysis
 KAREN JONES , FSTA BSc FSTA, Treasurer
I’m Karen Jones, and I’ve been actively engaging on social media, sharing insights on market analysis for the past few years with the STA. I’d like to share one of the commentaries from 19 October 2023, which garnered attention.
When analysing the S&P 500 index, I rely on a combination of the Directional Movement Index (DMI) and the Relative Strength Index (RSI). Looking at the daily chart ( Figure 1), the DMI, depicted as a blue line over an orange line, signals a buy when the blue line crosses above the orange line, while a sell signal occurs when the orange line crosses
above the blue line. Ideally, an ADX above 25 strengthens the buy or sell signal.
In March/April, the SPX broke above its downtrend, signalling a buy on the DMI. However, there was some erratic movement until the end of April. During such whipsaw actions in the DMI, I refer to the RSI and the actual chart.
The RSI indicated neutrality to positivity, and the chart illustrated that the market had surpassed its downtrend, consolidating above its 55-day moving average. This positive price action led me to disregard the whipsaw and focus on the chart for the next signal.
Subsequently, the DMI consistently signalled buys until the end of July, during which the market rallied nearly 600 points. It peaked at 4607 on 27 July, encountering another whipsaw on the DMI.
Turning to the RSI, a clear divergence emerged—while the market hit a new high, the RSI didn’t follow suit. This indicated a significant loss of upside momentum. A secondary sell signal surfaced on the DMI, leading to the market starting a significant sell-off that eventually reached its 200-day moving average.
You can find more of my commentary here on LinkedIn, Instagram and YouTube. If any of you use TradingView I can be located under (THE_STA).
Figure 1: S&P500 daily chart Published on TradingView: (THE_STA) Jan 10, 2024

ANALYST FOCUS 48

Bytes and Pieces
 DAVID WATTS , MSTA BSc (Hons) CEng MICE MIWEM MSTA, Systems and Website Specialist
Ask Me Anything?
While we could debate the merits of artificial intelligence – you really need to try it out to have an informed view. Yes, its far from perfect and perhaps with the ongoing copyright issues might not last that long if publishers win. However, it is fun to see what it can do. First check the Blog “Ask me anything” that can give you an idea of its capabilities. Then sign up for a 30-day free trial of access to ChatGPT and ask away.
Ask me anything blog: www.openai.com/blog/chatgpt
Trial account via: www.openai.com/blog/chatgpt

AI Code Conversionget a CodePal
Speed up you code writing with CodePal – an AI code writer and translator. AI is very good at rule based learning rather than say metaphors in Shakespeare. As a fast first draft I use the CodePal Language Translator when I want to translate code from one language to another, there is everything here from C to Python and Pinecode to Javascript translation, in fact most popular coding languages. Then there are a variety of services code debuggers, generators, code extenders. There is a “start” membership if you just want to try it. For code conversion I am a frequent user, not perfect but good enough for a very fast first draft. www.codepal.ai
Watching for the Flat Lines
The “Impulse” MACD has created a buzz on TradingView – being just a novel implementation of Gerald Appel’s calculation; the difference is that when both the MACD and signal line “flatline” you are in a consolidation area. Hence consolidation areas are obvious, then when it breaks take the trade or bracket trade the highs and lows.
So where to find it in TradingView – just look for Impulse MACD by LazyBear, use 12/26 averages looks good to me. Other platforms are now gradually incorporating it.
Quantified Strategies
If you cannot code then where can you go for some ready-made and tested Trading Strategies? Well Quantified Strategies a site by Oddmund Grotte is one answer – his site specialises in testing and trying out well know strategies and reporting on how well they do, in fact many of these implementations with robust money management could be the basis of your strategy. Tradestation and Amibroker code available.
For a Listing of Strategies and results:
www.quantifiedstrategies.com/ single-strategies-order
SOFTWARE REVIEW
49 www.technicalanalysts.com
The LSE courses and the Diploma in Technical Analysis
Visit STA Meetings on the STA website for information on monthly meetings and videos.
Month
February 2024
November 2023
October 2023
Speaker
Description
D’mitri D Richardson Classic Gann
Robert R Prechter Surfing the waves of social mood
Thiru Nagappan Quantitative strategy construction with 3 critical stats
September 2023 Ashish Kyal Elliott Wave outlook on global equity markets
June 2023
May 2023
April 2023
March 2023
Andreas Clenow Quantitative Point & Figure trading
Matt Cowart
All about risk
Nick Radge Trading multiple strategies: diversify and smooth the equity curve
Stephen Hoad Gaining an edge in systematic and algorithmic trading using Renko charts
February 2023 Dr Ken Long Fireside Chat with Jeff Boccaccio
STA Library
STA members are eligible to join the library as standard adult library members. They need to attend in person to the library to join - bringing with them proof of name (STA membership card, bank card, staff pass etc) and proof of address (driving licence, recent bank statement, utility bill etc).
The library address is: Barbican Library Silk Street London EC2Y 8DS.
For full details on address and opening times, visit STA Library

50 STA EDUCATION

Balance professional development and your personal life with the STA Home Study Course©
Why purchase the Home Study Course?
The world-class e-learning Home Study Course (HSC) © is written by leading industry practitioners, making it one of the best online products available on the technical analysis market. Whether this is your first introduction to technical analysis, you want to refresh your existing knowledge, or you wish to become a qualified technical analyst, the STA offers a tailored Home Study Course as part of our portfolio of world respected courses preparing students for our internationally accredited STA Diploma qualification.
You can learn from the comfort of your home at times that best suit you. Although website based, it is fully downloadable and may be used online or offline via PC, Mac, iPad or Android machines.
What will it cover?
• The syllabi for both STA Diploma Part 1 & Part 2 examinations
• 15 in-depth subject teaching units
• Exercises to self-test progress
• Exam preparation module & video
• Advice on report writing.
...find out more visit Home Study Course
Since the HSC is International Federation of Technical Analysts (IFTA) syllabus compliant it can also be used to prepare candidates for both the IFTA CFTe I and II examinations.
Who is the course for?
The course is intended for individuals who want to use technical analysis in a professional manner or who want to become a qualified technical analyst and advance their career. Enrol and start studying now!
For more details click below or contact the STA office on +44 (0) 207 125 0038 or info@technicala nalysts.com
When would you like to start?
Learn at your own pace rather than in a classroomthe HSC course is designed for those who need a truly part-time study option with maximum flexibility!
STA
HOME STUDY COURSE
51
Bronwen Wood Prize 2023

Bronwen Wood Memorial Prize
This award is made for the best STA Diploma Part 2 Examination paper written each year if a score of 90% or above has been achieved.
It can be made to more than one candidate if more than one outstanding paper is received. If, on the other hand, it is the opinion of the judges that no such paper has been written in any one year, the prize is not awarded. Thus the merit of the award is retained.
Bronwen Wood was one of the founder Board members of the modern STA and died suddenly in late-December 2002. Bronwen was instrumental in developing both the STA Diploma Examination and the courses leading to the examination. She wrote and marked all the papers in the early years. Even when she went to work in Abu Dhabi from 1993 to 1999, Bronwen retained a lively interest in how the educational side of the STA was progressing.
In addition to her work for education, Bronwen was herself a great technical analyst, rated one of the best by her peers, particularly for her work on the equity indices and individual shares. For both her contribution to education, and for her outstanding analytical skills, she was made a Fellow of the Society of Technical Analysts in 1993.
Bronwen was also a long-standing member of the Board of the International Federation of Technical Analysts (IFTA) and of its Executive Committee, variously as Secretary and Chairman of the Nominations Committee. Through this connection, she was widely respected world wide, as well as in the UK, as an outstanding technical analyst and an expert in the teaching of technical analysis.
Visit STA: Examinations
Congratulations to Neofytos Christodoulou for winning the 2023 Bronwen Wood Prize. This is awarded to the best paper written in the year if a score of 90% or above has been achieved.
Neofytos (left) is a Valuations and Risk Analyst at Qfin, Cyprus, with a passion for financial analysis and risk management. Over the years he has gained extensive experience in valuations, derivatives and various financial instruments. His journey in the financial sector started as a Transfer Pricing Consultant at TP & Tax Minds, where he honed his analytical skills and strategic planning abilities.
You will be able to read an interview with Neofytos in the next issue of the Market Technician.
Winners
2023 Neofytos Christodoulou
2022: -
2021: Oliver Myers
2020: Abdullah Abbasi
Victoria Scholar
2019: Andrew Whatton
2018: Akif Sarir Hassan Din
2017: Aldo Lagrutta
2016: Marco Meola
2015: Daniel Belchers
2014: -
2013: -
2012: -
2011: Paul Truscott
2010: -
2009: Marc Fournier, David Thomas
2008: Colin Simpson
2007: Michael Estry
Mark Andrew Lim
Colm McCaughley
2006: -
2005: Tom Winstone

52 STA EDUCATION
Marco Meola winner in 2016
Congratulations to the latest STA Diploma MSTAs
Distinction
Liam Ennis Neofytos Christodoulou Pass
Ahmad Ridhwan Anuar
Ayub Samad
Benny Lee Wan Yu
David Mayowa Toluwalope Faola
Faiz Gany bin Saud Gany
Liudas Boguzas
Muhamad Fadhl Bin Masri
Natalie Atieno Agiso
Paul Feichtinger
Sharifah Khaidah Syed Sahab
Tanay Gandhi
Wan Saiful Arif
Benefits of STA membership
The STA holds 11 monthly meetings in the City of London, including a summer and Christmas party where canapés and refreshments are served.
• Chance to hear talks by leading practitioners.
• Networking.
• CPD (Continuous Professional Development).
As a service to our members, many of whom are unable to attend all our monthly meetings, we have been making videos of meeting presentations for several years.
• Never miss the latest meeting.
• Browse our extensive video archive of previous meetings.
The Society of Technical Analysts and the Chartered Institute for Securities & Investment (CISI) have formed a partnership to work together on areas of mutual interest for our respective memberships.
CISI examination exemptions for STA Diploma Part 1 and 2 holders. MSTAs with three+ years’ experience can become full members (MCSI).
The STA holds 10 monthly talks either in-person in the City of London or online and a number of social events including the Annual Drinks Reception and a Christmas Party.
• Chance to hear talks by leading practitioners
• Networking with members and other finance professional
• CPD (Continuous Professional Development).
Student members have access to an education forum which is available in the member’s area of the website.
Members can ask questions on technical analysis in the Technical Analysis Forum which a course lecturer, author or Fellow will answer.
Endorsed by the Chartered Institute for Securities & Investment (CISI), members of the STA are entitled to receive continuing professional development points (CPD for their attendance on the taught course lectures.
• Remain compliant.
• Be informed of all new industry developments.
The STA ”Market Technician” journal is published online twice a year.
Members receive the latest issue of the “Market Technician” via e-mail.
They are also able to access an archive of past editions in the member’s area of the website. Technical analysts from all over the world contribute to the STA journal.
The STA has an extensive library of classic technical analysis texts.
There are over 1000 books in the collection, held at the Barbican Library with a smaller selection available at the City Library. As a member you can now browse which titles are available on-line. Members are encouraged to suggest new titles for the collection and, where possible, these are acquired for the library. The complete listing can be downloaded in Excel format from within the member’s area.
STA members receive all International Federation of Technical Analysts (IFTA) quarterly bulletins and annual journal and invitations to attend their monthly online webinars.
• Chance to hear talks by international practitioners
• Access to research from market analysts around the globe
• CPD (Continuous Professional Development).
54 THE STA
STA Calendar 2024
STA Monthly Meeting (April 2024)
Tuesday 9 April
6.30pm
9
Via Live Webinar
Speaker: David Linton, Updata
Technicals to Trading Systems
Tuesday 16 April
16
One Moorgate Place, London EC2R 6EA (and online)
STA Diploma Part 2 Exam (online)
Thursday 25 April
STA Monthly Meeting (May 2024)
Tuesday 14 May 6.30pm
One Moorgate Place, London EC2R 6EA
Speaker: Rajan Dhall, DND Capital
STA Monthly Meeting (June 2024)
Tuesday 11 June
6.30pm
Via Live Webinar
Speaker to be confirmed
STA Diploma Part 1 exam (online)
Monday 1 July 2024
STA Monthly Meeting (July 2024)
Tuesday 9 July, 6.30pm
Joint STA, ACI UK and The Broker Club
Mid-Year Review of Markets
One Moorgate Place, London EC2R 6EA
STA Monthly Meeting (September 2024)
Tuesday 10 September 6.30pm Via Live Webinar Speaker to be confirmed

One Moorgate Place
STA Annual Drinks Reception & Awards Ceremony
Wednesday 11 September 6.30pm
National Liberal Club, London SW1A 2HE
STA Diploma Part 2 Exam (online)
Thursday 19 September
STA Monthly Meeting (October 2024)
Tuesday 8 October 6.30pm
One Moorgate Place, London EC2R 6EA Speaker to be confirmed
STA Monthly Meeting (November 2024)
Tuesday 12 November 6.30pm Via Live Webinar Speaker to be confirmed
STA Diploma Part 1 exam (online)
Monday 2 December 2024
STA AGM & Christmas Party
Tuesday 12 December 6.30pm
One Moorgate Place, London EC2R 6EA
55 www.technicalanalysts.com THE STA
SEP 10
APR
APR
APR
25 MAY 14 JUN 11 JUL 9 JUL 1
SEP
SEP
11
19
OCT
NOV
8
12
DEC
MON
12
2
STA Executive Committee


Please keep the articles coming in!
The success of the Journal depends on its authors, and we would like to thank all those who have supported us with their high standard of work. The aim is to make the Journal a valuable showcase for members’ research - as well as to inform and entertain readers.
Keep up to date with the conversation by joining us on:

56 THE STA
Eddie Tofpik MSTA, ACI-UK, ACSI Chair
David Watts BSc (Hons) CEng MICE MIWEM MSTA Systems and Website Specialist
Keval Dhokia BSc (Hons) MA MSTA MCSI Treasurer
Patricia Elbaz BA (Comb Hons) MSTA Director
Mark Tennyson d’Eyncourt FSTA Programmes
Jeff Boccaccio MSTA Director
Karen Jones BSc FSTA Treasurer
Executive Commitee on STA website
BA MA MSTA Head of Marketing

STA Advertising Rates 2024
The Society of Technical Analysts Journal The Market Technician is a bi-annual publication, published in PDF format only. The STA will accept advertisements in this publication if the advertising does not interfere with its objectives.
The appearance of advertising in the Market Technician is neither a guarantee nor an endorsement by the STA.
Circulation
The Market Technician has a circulation of approximately 1,500. Readership includes technical analysts, traders, brokers, dealers, fund managers, portfolio managers, market analysts, other investment professionals and private investors.
Advertising policy
Advertising is subject to approval by the STA Journal Committee. All advertisements must be non-discriminatory and comply with all applicable laws and regulations.
The STA reserves the right to decline, withdraw and/or edit at their discretion.
Contact
Contact Katie Abberton, Society of Technical Analysts on info@technicala nalysts.com or +44 (0) 207 125 0038 for more information.
Position Price Specification Inside Cover £500.00 A4 Portrait, 210mm (w) x297mm (h), plus 3mm bleed Full Page £500.00 A4 Portrait, 210mm (w) x297mm (h), plus 3mm bleed Half Page £300.00 Landscape, 198mm (w) x 139.5mm (h) Quarter Page £200.00 96mm (w) x 139.5mm (h) Disclaimer: The Society is not responsible for any material published in The Market Technician and publication of any material or expression of opinions does not necessarily imply that the Society agrees with them. The Society is not authorised to conduct investment business and does not provide investment advice or recommendations. Articles are published without responsibility on the part of the Society, the editor or authors for loss occasioned by any person acting or refraining from action as a result of any view expressed therein.
The UK’s professional body for Technical Analysts.
Founded in 1968. The oldest of its kind in the world.
The Society of Technical Analysts Dean House
Vernham Dean Andover SP11 0JZ
tel: +44 (0) 20 7125 0038 info@ technicalanalysts.com www.technicalanalysts.com
