Market Technician Issue 93 - September 2022 The Journal of the Society of Technical Analysts The (Mis)Behaviour of Markets by Benoit B. Mandelbrot Murray Gunn BOOK REVIEW 42 Head and Shoulders above: Interview with John Cameron FSTA Nicole Elliot t ANALYST FOCUS 38 Elliott Taken OnShape and Time Christopher Mack RESEARCH 24 DJIA Annual One Day Fails, Lunar Phase & The 9/56 Cycle David McMinn RESEARCH 14 TECHNICALINTERNATIONALANALYST DAY STA PODCASTS pg.7 pg .11


Disclaimer: The Society is not responsible for any material published in The Market Technician and publication of any material or expression of opinions does not necessarily imply that the Society agrees with them. The Society is not authorised to conduct investment business and does not provide investment advice or recommendations. Articles are published without responsibility on the part of the Society, the editor or authors for loss occasioned by any person acting or refraining from action as a result of any view expressed therein. Contents FOREWORD Editor's Letter 03 IFTA Conference online conference 04 Traders Mind Journal 05 Energy Trading Week 2022 06 NEWS International Technical Analyst Day 9/9 07 June is party time in London: 08 Editor Nicole Elliott’s write-up of the STA Summer Party STA University Network - Home and Abroad 10 STA Podcasts 11 RESEARCH Technical Analysis in Crypto - The Best Results come from Stock 12 Selection Over Market Timing Charlie Morris DJIA Annual One Day Fails, Lunar Phase & The 9/56 Cycle 14 David McMinn Elliott Taken On - Shape and Time 24 Christopher Mack Renko Charts 34 Karen Jones How Oscillators can Give you an Edge 35 Karen Jones Web Notes from Academia - an update 36 Gerry Celaya ANALYST FOCUS Head and Shoulders above: Interview with John Cameron FSTA Nicole Elliott 38 Interview with Thierry Béchu Patricia Elbaz 40 BOOK & SOFTWARE REVIEW The (Mis)Behaviour of Markets by Benoit B. Mandelbrot 42 Murray Gunn Bytes & Pieces 43 David Watts THE STA Benefits of STA Membership 44 STA Calendar 2022/23 45 The Education Channel & Special Journal Offer 46 STA Library - Online and Physical 47 STA Diploma Part 1 Course 48 STA Diploma Part 2 Course 49 STA Home Study Course 50 Congratulations! Latest STA Diploma MSTAs 51 STA Executive Committee 52 STA Advertising Rates 53
Thierry Béchu’s background, (pg.40) on the other hand, is very much that of a 21st century man, with his career in tactical short-term trading and global macro hedge funds.
Meanwhile major central banks are belatedly gung-ho in their quest to fight the highest inflation many have seen in decades, consumer confidence has slumped to some of the lowest ever readings, energy is unaffordable for many and they call it a ‘cost of living crisis’. It’s not a crisis, it’s on-going.
3 www.technicalanalysts.com FOREWORD
Other sections also have a past and present tone. The interview with John Cameron FSTA (pg.38) digs back into a very long professional career, yet here he is giving exam tips to potential Diploma examinees today.
Suitably, the first chat is with Katie Abberton, a key point of contact for all members and the many enquiries we receive. I worked with her sister Françoise Skelley at CSFB, so thought she might have had a tip off about the STA job. My hunch was correct as Michael Smyrk was asking around for STA admin back-up. As Katie says in her own words: "That was 1998 and I was already working from home as a freelance conference producer... and the rest is history.”
See p.11 forinfomore
The STA’s website hosts a link to all these podcasts. For old school dinosaurs like me, in order to get there, go to our website. Scroll down below the red Join STA Now box until you see the Latest News section. Podcasts are on the left and open when you click on the word ‘here’ in the text. Another example of the old tackling the new!
research articles had an emphasis on big data, machine learning and disruptors, this one has what I would call a ‘softer’ focus, including the Solar Year and Lunar phases since 1885, (pg.14) Elliott Wave (significant dates over four centuries), (pg.24) Japanese Renko charts (pg.34) and previous (very useful) papers (Web Notes from Academia) (pg.36) which attempt to quantify and back-test ideas about technical analysis.
In its funny way this issue of the Market Technician looks both forward - and back 50 years, to when the world stumbled into its first oil crisis. Once again much received wisdom is being chucked out, possibly including the baby in the bathwater, and investors are being forced to do some very serious thinking. Unlike the previous edition of this magazine where
Nicole Elliott, FSTA Technical Analyst, Private Investor, E-journalist for the STA

STA Podcasts
Likewise, our online and in-person monthly meetings have recently had a Janus forward/backward outlook. We have benefited from Zoom presentations by US technical analyst legend Perry Kaufmann, who also has many years of experience under his belt, yet his words of wisdom are just as pertinent today as they must have been earlier. By contrast, a very much younger Rajan Dhall has plenty of experience teaching young traders how to stay the course. Both of these presentations are on video in the members’ section of the STA website. Also keeping up with current investing trends are this year’s two multi-panel debates on the outlook for cryptocurrency. Held in January and July 2022, under Chatham House rules,
An interesting list of STA-linked people are interviewed, most recently ex-chairman of the STA Tom Hicks who now runs his own consultancy.
Another six months have gone by since my last editor’s letter and I feel my world has been one of ‘go-stop’ tentative steps. From the STA’s Freedom Party to UK PM Johnson’s Partygate; Russia’s socalled ‘special military operation’ in Ukraine and the determined push-back by the people of that nation; NATO had the biggest shot in the arm, resuscitated from being ‘brain dead’ according to President Emanuel Macron; now Boris has bowed out after one too many scandals and his work colleagues are all clamouring for the top job in the UK Conservative party. Well, I suppose it could be worse, as the very old samba song goes: “Brazil, one step forward, two steps back”.
LetterEditor's
An additional feature this year, organised by new head of STA marketing Gerry Celaya, is a series of podcasts interviewing STA personalities about their career paths in this industry. These are available to all via this Spotify link.

GOLDEN OPPORTUNITY
Speaker details and registration at: ifta.org/ifta-conference-2022/ IFTA Conference
IN-PERSON NETWORKING
IFTA’s 35th Annual Conference
PREMIER LOCATION
PRACTICAL TAKEAWAYS
Hosted by the ATAA
Base yourself in the heart of Melbourne’s bustling CBD with beaches and wine regions close by.
7–9 October 2022 Melbourne, Australia
Australian Technical Analysts Association Annual Conference
7–9 October 2022 in Melbourne, Australia

Don’t miss this chance to reconnect with the trading and investing world back in person for the first time.
presents IFTA’s 35th
Mingle with top-tier trading talent from across the globe. Make new connections that will help you on your journey.
Hear from a handpicked selection of industry-leading professionals in 14 sessions over 3 days.
TOP SPEAKING TALENT
Uncover robust trading ideas and key risk-management approaches to enhance your bottom line.


“Performing at best is something that to to and the
LDM,
daily sheets are great - writing down my observations, evaluations, planning was particularly helpful.”

make sure it is sustained. I really liked the trading performance scorecard, with the 8 factors
can be learned. Once acquired it still needs a diary/monitoring
your
Hedge Fund Manager, London/New York
assess myself against each week,
tradeforThewww.tradersmindjournal.comultimatecompaniontraderswhowanttoattheirbest.20%DiscountUsethecode:STA20


Eddie Tofpik, STA Chair, first proposed this idea to the Board at our 2 April 2022 meeting. The idea is to give technical analysts, and those using technical and chart analysis at funds, banks, brokers, proprietary trading shops and for themselves, a day to get recognition for the hard work, dedication and diligence that they display through all market conditions and events.
7 www.technicalanalysts.com NEWS
We encourage colleagues, clients and counterparties to say ‘Thank you!’ to their staff technical analysts and TA providers from around the world on this day.
TechnicalInternationalAnalyst Day! 9thITADSeptember
The Society of Technical Analysts is leading the way in announcing that the 9th of September will be the ‘International Technical Analyst Day’.

June is party time in London: The STA gets in on the act!
On to drinks, where I noticed many of the attendees were drinking bottled beer, others wine and quite a few fruit juice. Hot canapés were passed round steadily, though a canny little clan had positioned themselves at the door to the kitchen - to be first in line for the pickings. The room was just the right size for the number of guests, giving the place a very buzzy atmosphere. Above all there were faces we hadn’t seen in ages, and it was such fun to catch up.
Ex-STA Chairman Tom Hicks and STA Committee member Jeff Boccaccio briefly outlined a new Systematic Trading course that they will be running from Q1 2023 for the STA. Keep an eye out for further details as it sounds promising.
When I holiday abroad, my favourite times have been Easter and the October school half-term. Now that my daughter is grown up, I’m a lot more flexible but prefer dates around the equinox as I find the weather in most far-flung places not too cold and not too hot; just right, as Goldilocks would say. When my foreign domiciled friends ask me what’s the best time to holiday in the UK, I know for sure it’s late May and June. The blossom and mild weather, plus the Chelsea Flower Show which kicks off the season. The Epsom Derby and Royal Ascot early in June, tennis at Queens Club, and this year Her Majesty’s Platinum Jubilee bonanza.
Normally the STA holds its summer party in July, but it was bumped forward this year to 14th June because on the 12th July we hosted a joint event with the ACI UK and The Broker Club. At the start of the evening, Eddie Tofpik gave a very brief introductory speech welcoming STA members and their guests:


“I promise just to say a few words before we move on to the main reason we are here tonight. First off, welcome back everyone, welcome back to being live in person. Welcome back to socialising and networking with likeminded technical analysts. Secondly, a reminder to all those of you interested and involved that our annual STA courses are now open and ready for bookings. Please share this with your own colleagues, friends and networks.”
8 NEWS
As always, I think all of us will want to thank Katie Abberton for organising the party and do remember if you have general queries please get in touch by email.
Nicole Elliot, FSTA Technical Analyst, Private Investor, E-journalist for the STA
9 www.technicalanalysts.com NEWS


Student Membership now available!
STA NetworkUniversityHome and Abroad
Contact the office on info@technicalanalysts.com for full details.
New!
The STA are delighted to announce a new Student membership category.
MEMBERSHIP
Meanwhile, the STA is delighted to welcome its first intake of students, joining under the newly formed Student Membership category. We now have students from a range of universities including the University of Brighton, Cranfield Business School, the University of Edinburgh, King’s College London and the London School of Economics. Students of recognised academic institutions - here and abroadmay join the Society for the duration of their course at the discounted rate of £25 a year.
10 NEWS
Over the years the STA has been teaching postgrad finance students at King’s College London the basics of technical analysis and prepared students for our Part 1 examination and, starting from summer 2022, is preparing students for our Part 2 examination as well.
We are keen to expand the knowledge of technical analysis to university students, either via a course module or talking to student Investment & Trading Clubs. If you would like to help us build our network - either as a Student Ambassador, educator or as a presenter, we would love to hear from you. Email the education team on info@technicalanalysts.com


Students of recognised academic institutions may join the Society for the duration of their course at the discounted rate of £25 a year.
Student members will have to demonstrate their student status. For enquiries, email the office on info@technicalanalysts.com
The executive committee of your Society took the decision to start our own podcast series at the start of 2022. This was done in order to promote our mission of offering information on technical analysis, as well as education, examination and accreditation, through another medium. The podcasts also create a link between members as part of our networking efforts, and preserves our history in an engaging manner.
I took on the very enjoyable task of having conversations with the ‘face’ of the STA, Katie Abberton from our administrative office, as our first podcast. We had great conversations with STA board members and our IFTA representative in order to create a library of podcasts that give insights into how the STA works, the benefits of STA membership and why anyone interested in technical analysis should join our Society. We will also be speaking with Fellows and others who have a historical connection with the STA in order to give a real sense of our history through this series.
STA Podcasts
• And why did they join the STA?
We explore favourite technical analysis tools, markets and what works or doesn’t work in our interviews.
11 www.technicalanalysts.com NEWS
• How did the interviewee get started (trading, research, sales etc.)?
If you would like to participate in the podcast series or have any questions or suggestions, please contact us through info@technicalanalysts.com

We aim to have the podcasts come across as a coffee shop conversation between friends. The format for the most part is quite simple. For example:
• Why did they start using technical analysis?
Identifying Leaders
Figure 1 - Identifying crypto leaders using ByteTrend
https://terminal.bytetree.com/bytetrend/bnb/btc
Charlie Morris CIO of ByteTree Asset Management
I wanted to apply this same approach, which I have been using in equities and other assets classes, to crypto. The latter is a fast-moving space, and identifying relative strength would unbiasedly pinpoint the leadership in a sector where these unregulated projects are either hero or zero.
When you look at a site such as Coin Market Cap, it is close to impossible to make sense of what is going on in the crypto jungle, and that is why my company created ByteTrend. One difference between its methodology and the conventional ways of identifying leaders is that, instead of using a broad index for comparison, ByteTrend simply uses Bitcoin, as it is the dominant asset in the space. You can use an index, but they all have their quirks.
12 RESEARCH
Using price relative stock selection does not identify tops and bottoms but trendsand therefore potential winners (and losers). The idea is that if a stock can beat the average, then a trend could emerge that could continue for a long time. In a process of repeatedly entering new trends while exiting old ones, investors stand to profit from this tried-and-tested strategy of embracing market momentum.
Charlie Morris is the chief investment officer at ByteTree Asset Management (BTAM). He is a lead portfolio manager and develops both crypto and traditional investment strategies for BTAM. He has 23 years of experience in fund management and is best known for his expertise in alternative assets, notably gold and Bitcoin.

Technical Analysis in CryptoThe Best Results come from Stock Selection Over Market Timing

In equities, you’d use a benchmark such as the S&P 500 and compare the stocks in that universe with the average. Those that are beating the S&P are on the buy list, while those that are neutral or lagging don’t make it.
ByteTrend calculates a score ranging from 0 to 5. At the top end, strong bull trends
How ByteTrend Works
13 www.technicalanalysts.com RESEARCH
• The last touch of the 20-day max/min lines was max
identifying a ByteTend 5 score would have provided an edge. More importantly, not having access to timely, reliable and unbiased data leaves you looking at hundreds of charts, while trying to avoid excitable narratives.

• Price is above the 280-day moving average
rank 5 while, at the bottom, bear trends rank 0. Scores between 1 and 4 are in the neutral zone. That is illustrated in Figure 1 with the scores highlighted in blue using the left axis.
Summary
We are building it in other areas outside of crypto too. Initially that means 250 European listed equity ETFs and, following that, commodities and bonds. To me this is a game changer, as it allows the productive investor to actually understand what the market is up to at the next level. They say everything’s relative, and it is.
In crypto, things don’t last forever. This is cyclical and volatile assets class, so it’s best not to outstay your welcome. But even that is hard to do as even the cycles are not exactly clear.
In the cycle between October 2020 and May 2021, there were some extraordinary success stories; 10 baggers, 20 baggers, even 30 or more. These are the sorts of returns that are hard to come by in stock markets these days. In all cases,
• 280-day moving average slope is rising
Being presented with thousands of crypto tokens, ByteTrend helps investors to sort the wheat from the chaff. It enables you to identify and rank trends and mechanises an otherwise tedious job.
Bear in mind, a 200-day moving average becomes 280 days if you trade at weekends, and in the same way a 30 becomes a 42. This is important because I would want a Bitcoin ETF, which does not work weekends, to have the same trend score as the underlying token, which works hard at weekends.
• Price is above the 42-day moving average
• 42-day moving average slope is rising
As a member of the STA, you’ll see how beautifully simple this trend score is. This is our intention, as we are not making subjective judgements on chart patterns but identifying objective trends across a large asset class.
A ByteTrend score gets a point for each of the following criteria:
Figure 2 - A sea of red, Byte and blue
That is why I said stock selection is better than timing in crypto, and probably in any other asset class for that matter. It’s all well and good getting the occasional market cycle right but doing that repeatedly is impossible.
Those trends can then be dropped into breadth charts, which we have created to visualise market strength or weakness. Red skies shown lots of 0 scores and are bearish, whereas blue denotes 5s which are bullish. To catch a wave of rising 5s, while embracing a trend following strategy, is the dream (see Figure 2).
By contrast, locking onto the winners is a matter of process. A decent winner in an asset class like crypto could do materially better than the market. That means just two or three holdings, in a 20-stock portfolio, will end up doing the majority of the heavy lifting.
That exercise is repeated each day automatically, so when I start at my desk each morning, I am greeted by a list of fresh trends. In 25 years of working, I have never started my working days so productively.
14 RESEARCH
Annual one day (AOD) rises and falls are very important in financial patterns, a finding supported by numerous correlates (McMinn, 2000, 2006). An AOD rise or fall is taken as the biggest one-day percentage movement in the year commencing 1 March. They represent the most dramatic one-day shifts in market sentiment during any given year. Moon Sun data was timed at noon (New York) on the relevant trading day (daylight savings ignored). The degree on the ecliptic has been denoted as E°, while the angular degree between the Moon and Sun (lunar phase) is abbreviated to Ao. This is to avoid confusion between two different concepts. For some panics, the AOD fall has been recorded as the actual low (eg: 1987, 1997 and 1998), with the low after the panic being called the post-crash low. A Chi Square test was applied where appropriate in the text.
2.0 DJIA Peaks from 29 April to 10 September The beginning of DJIA bear markets in this time frame exhibited remarkable alignments of lunar phase and the timing of the ensuing panics.
DJIA Peaks, The Solar Year & Lunar Phase
“One of the greatest pains to human nature is the pain of a new WALTERidea.”BAGEHOT.
1 This article updates David’s 2015 original version, DJIA Peaks, Seasonality & Lunar Phase, New Concepts in Global Tectonics Journal, Vol 3, Issue 3. P 279-288. It was revised in May 2022.
David McMinn completed a Bachelor of Science degree at the University of Melbourne in 1971 (Geology major) and subsequently became a Minerals Economist in ANZ Banking Group Ltd Since leaving this position in 1982, he has conducted private research on cycles arising in seismic and financial trends, publishing numerous papers on cycle theory, especially in relation to the 9/56year cycle.

A listing of highs at the start of DJIA bear markets was sourced from Bespoke Investment Group (2008) and TheDowTheory.com to cover the 1900-2022 era (see Appendix 1). The 1886-1896 data was based on the 12 Stock Average index and have also been included. For the years 1929 to 1933, the bear market was taken as occurring between 3 September 1929 and 8 July 1932. This was to avoid distortions arising from the huge gyrations in stock prices during a short period of about four years. DJIA closing values have been used throughout the text.
2.1 29 April - 30 June interval contained four peaks, all of which had lunar phase between 320 A° and 015 A°, a range of 55 degrees (see Table 1).
1
David McMinn
Introduction
There have been numerous bear markets in the history of the Dow Jones Industrial Average (DJIA). If the peaks at the beginning of these downturns occurred at the same time of year, they often experienced similar peak - panic intervals (McMinn, 2010). This concept was expanded upon to assess these highs in relation to lunar phase. Those peaks forming around the same time of year usually have a similar lunar phase. This has been a persistent trend over the past 135 years and many examples have been presented in this paper.
Of the 38 tops since 1886, 28 had lunar phase in an approximate half circle between 270 and 095 A° (significant p < .01) (see Appendix 2). All 14 highs between 1 March and 3 September had lunar phase between 270 A° and 080 A°, a range of 170 degrees. Even better outcomes may be found when these events are listed by month-day (year ignored), a topic that will be discussed subsequently. Additionally, the Moon was most commonly sited in the 310 - 065 Eo segment with 23 episodes (significant p < .001) and least likely to be found in the 210 - 310 Eo segment with only one episode (significant p < .01).
DJIA Peak 1st OD Fall % 2nd OD Fall % OD Rise %
29 May 1946 3 Sep 1946 -5.56 9 Sep 1946 -4.41 15 Oct 1946 +3.58
PANICS OF 2008 & 2011
29 Apr 2011 4 Aug 2011 -4.31 10 Aug 2011 -4.65 30 Nov 2011 +4.24
DJIA High Lunar Phase A°
Table 1 - DJIA Peaks 29 April - 30 June
PANICS OF 1901, 1946 & 2001
* Peak in the calendar year. Abbreviation: OD - One Day.
29 May 1946 343 3 Sep 1946 091 9 Sep 1946 159
The highs in 1901, 1946 and 2001 showed up in the month to 20 June. They were each followed by an initial panic in early September with another major one day fall six days later (see Table 2). The associated major one-day rises took place in the month to 15 October. The alignment of cycles was most notable for the 1901 and 2001 panics, triggered by the assassination of President McKinley and the 911 terrorist attack respectively.
* Market high for the calendar year. # Beginning of a correction. Abbreviations: OD - One Day. NTD - Non-Trading Day.
PANICS OF 1901, 1946 & 2001
17 Jun 1901 015 7 Sep 1901 298 13 Sep 1901 010
Table 2 - Six-Day Intervals & DJIA Peaks 29 April - 30 June
17 May 1890 346 After Baring Crisis (early Dec)
17 June 1901 015 McKinley assassination (Sep)
DJIA Peak Phase A° 1st OD Fall Phase A° 2nd OD Fall Phase A°
21 May 2001 342 11 Sep 2001 281 17 Sep 2001 004
The peaks in 1901, 1946 and 2001 happened with lunar phase between 340 and 015 A° (around the new Moon) (see Table 3). The first one day fall in the 1901 and 2001 panics had lunar phase between 280 and 300 A° (after the 3rd quarter Moon) and in 1946 at 91 A° (on the 1st quarter Moon). There was no common lunar phase for the major one day rises after the panics.
Table 3 - Lunar Phase & DJIA Peaks 20 May - 30 June
PANICS OF 2008 & 2011
29 May 1946 343 Stock market panic (Sep)
19 May 2015# 019 24 Aug 2015 279 30 Aug 2015 NTD
21 May 2001 11 Sep 2001 na 17 Sep 2001 -7.13 21 Sep 2001 +4.47
2 May 2008* 9 Oct 2008 -7.33 15 Oct 2008 -7.87 13 Oct 2008 +11.08
PANIC OF 2015
15 www.technicalanalysts.com RESEARCH
2 May 2008* 321 9 Oct 2008 115 15 Oct 2008 192 29 Apr 2011# 321 4 Aug 2011 067 10 Aug 2011 143
17 Jun 1901 7 Sep 1901 -4.43 13 Sep 1901 -4.27 16 Sep 1901 +4.10
21 May 2001 342 WTC terrorist attack (11 Sep)
Ensuing US panic
(a) Occurred during a correction of -15.9%. Abbreviations: OD - One Day. AOD - Annual One Day.
Record High Fall Crisis Jul 1990 A° 6 Aug 1990 181 A°
+3
2.2 The 1 July 1990 and 17 July 1998 highs had lunar phase at 286 A° and 284 A° respectively (see Table 6). The AOD falls occurred in August and the bear market slumps were both around -20%. Lunar phase did not align closely for the AOD falls or the post-crash lows.
8
Russian default
2.3 1 August–10 September had five tops, all of which had lunar phase around the new Moon or the full Moon (see Table 7). Five of the seven biggest one day percentage falls in DJIA history (> -8.70%) occurred after the new Moon peaks of late August–early September in 1899, 1929 and 1987.
OD Fall AOD Fall Fall
+4
OD Fall AOD Fall Fall
OD Fall AOD Rise AOD Fall Oct -7.33%2008 days Oct +11.54%2008 days Oct -7.87%2008
PANIC OF 2008
OD
1 Dec -3.29%1890 days 6 Dec -3.65%1890 days 9 Dec +3.15%1890
OD
17
284
The 17 May 1890 peak had lunar phase at 346 A° and was within range for other May-June highs. It was anomalous as the ensuing panic occurred in early December with large one day falls five days apart (see Table 5).
Abbreviations: OD - One Day. AOD - Annual One Day.
Table 6 - Lunar Phase & DJIA Peaks 1 July - 31 July
+4
+2
16
+2
Table 5 - December 1890 Panic
10
16 RESEARCH
4 Aug -4.31%2011 days Aug -5.55%2011 days Aug -4.62%2011
9
286
For 2008 and 2011, the tops occurred on 2 May and 30 April respectively, a little earlier in the year than in 1901, 1946 and 2001. On the day of these two peaks, lunar phase was at 321 A°, followed by two major one-day falls, each six days apart, in early August and mid-October. Importantly, the AOD rise in 2008 occurred four days after the first one-day fall, and the AOD fall in 2011 showed the same timing (see Table 4).
Iraq invaded Kuwait Jul 1998 A° 31 Aug 1998 107 A°
The 19 May 2015 DJIA peak had lunar phase at 019 A° and was followed by Chinese Black Monday on 24 August. The DJIA AOD fall happened on this day rather than in early September as in 1901, 1946 and 2001. However, another big one-day fall did not take place six days later, as Saturday 30 August was a non-trading day.
13
15
PANIC OF 2011 (a )
+5
Table 4 - 2008 & 2011 DJIA Panics
OD
• 19 October 1987 (-22.61%)
The anomalies took place in 2020 on 12 March (-9.99%) and 16 March (-12.93%).
17 www.technicalanalysts.com RESEARCH
Table 8 - DJIA Trends in 1929 & 1987
Bear Market Beginning
Sun Eo Moon Eo Phase Ao
3 Sep 1929 003
161 164
Record Peak Interval Days AOD Fall Interval Days AOD Rise Interval Days OD Fall (a)
3 Sep 1929 55 28 Oct 1929 2 30 Oct 1929 7 6 Nov 1929 25 Aug 1987 19 Oct 1987 2 21 Oct 1987 5 26 Oct 1987
(a) Major one day falls were recorded after the panics on 6 Nov 1929 (-9.92%) and 26 Oct 1987 (-8.04%). These were among the 10 biggest percentage one-day falls ever recorded for the DJIA.Sources: Carolan (1992, 1998), McMinn (2006).
4 Sep 1895
162 347 185
5 Sep 1899 163 169 006
10 Sep 1897
There was remarkable alignment of cycles in 1929 and 1987 with an interval of 55 days between the record highs and the AOD falls, followed two days later by the AOD rises and other major one day falls about six days later (see Table 8).
168 344 184
55
Near the new moon
Near the full moon
• 18 December 1899 (-8.72%
• 28 October 1929 (-12.83%)
• 29 October 1929 (-11.72%)
• 6 November 1929 (-9.92%)
Table 7 - Lunar Phase & DJIA Peaks 1 August – 10 September

25 Aug 1987 013
152 165
21 Oct 1987 347 +10.17%Ao
also notable parallels between the 1929, 1987 and 1997 October panics (Carolan, 1998; McMinn, 2006), with lunar phase in the following ranges:
12 Nov 1997 155 Ao
3 Sep 1929 003 Ao 28 Oct 1929 313 -12.83%Ao
6 Aug 1997 037 Ao 27 Oct 1997 (b) 320 -7.18%Ao
(a) The DJIA lows for 1987 and 1997 occurred on the day of the panic. The post-crash lows were taken as the lows after the panic.
-13.2% 1997 CORRECTION
Record High AOD Fall AOD Rise Post-Crash Lows (a)
The 1895 and 1899 highs occurred on 4 September and 5 September respectively with the former happening around the full Moon and the latter around a new Moon. The subsequent AOD falls took place at the same time of year on 20 December and 18 December respectively, with the AOD rises occurring a few days later. The 10 September 1897 peak was anomalous as it did not align with trends in Table 9
25 Aug 1987 013 Ao Oct-22.61%3241987Ao
18
1895 & 1899 BEAR MARKETS
(b) The market was closed twice on the day. The percentage decline would have been much greater without such interference.
• The post-crash lows from 135 to 175 A°.
19 Dec 1899 210 +4.72%Ao
• Record Highs from 00 to 40 A°.
3.2 26 September - 10 October. The peaks of 9 October 2007 and 3 October 2018 had lunar phase at 346 A° and 288 A° respectively, within a range of 60°. The anomalous DJIA top of 30 September 1912 (230 A°) was recorded at 94.15, but its reliability was debatable. It was only marginally higher than the two equal second-rank highs of 94.12 on 3 October and 8 October. If the 1912 high had have been recorded on the latter date (335 A°), it would have aligned closely with the lunar phase on the 9 October 2007 top.
DJIA peaks appearing at this time of year did not exhibit parallelism with the timing of the ensuing panics and crises.
4 Sep 1895 185 Ao 20 Dec 1895 051 -6.61%Ao
30 Oct 1929 338 +12.34%Ao
DJIA Highs AOD Fall AOD Rise
• The AOD rises from 330 to 350 A°.
Table 9 - Lunar Phase & DJIA Peaks 1 August – 5 September1929& 1987 BEAR MARKETS
28 Oct 1997 330 +4.71%Ao
3.0 DJIA Peaks from September 11 to April 28
3.1 11 September - 25 September
23 Dec 1895 084 +4.38%Ao
• The AOD falls from 310 to 325 A°.
13 Nov 1929 137 Ao
4 Dec 1987 173 Ao
Two highs took place on 12 September 1939 and 21 September 1976, with lunar phase from 330 to 350 A°. After the 1939 high, a May 1940 panic was triggered by the German invasion of France. No large one-day falls happened after the 1976 peak.
RESEARCHTherewere
5 Sep 1899 006 Ao 18 Dec 1899 199 -8.72%Ao
(a) The great San Francisco quake on 18 April caused financial distress, due to insurance losses.
19 www.technicalanalysts.com RESEARCH
3.5 1 December - 15 January experienced seven peaks, five of which had lunar phase in a narrow range from 65 A° to 95 A° (see Table 10). Outliers occurred in 1968 (166 A°) and 2022 (27 A°).
DJIA High Phase A°
Ensuing US Downturn
3 Dec 1886 091 03/87-4/88 recession
19 Jan 1906 294 Financial distress (a)
5 Feb 1934 249 Stock market panic (26 Jul 1934)
3.7 16 February - 28 April. All six highs had lunar phase in the 270-90 A° half circle, with a range of 60 degrees for the peaks in 1937 (332 A°), 1956 (307 A°) and 1981 (274 A°) and a range of 45 degrees for 1892 (076 A°), 1923 (034 A°) and 2002 (062 A°) (see Table 12). Most of these highs were a precursor to a major economic slump.
10 Mar 1937 332 05/37-06/38 depression
27 Apr 1981 274 07/81-11/82 recession
6 Apr 1956 307 08/56-04/57 recession
3.3 11 October - 9 November experienced two highs on 3 November 1919 and 9 November 1940. Both had lunar phase at 122 A° on the day, with the Moon sited between 340 E° and 350 E°.
3.6 16 January - 15 February. Since 1890, four bear markets have commenced in the month to 15 February, all of which had lunar phase within a range of 70 degrees (see Table 11). There were no similarities with the timing of the follow up financial crisis.
12 Feb 2020 228 Corona virus panic (Mar)
Ensuing US downturn
3 Dec 1968 166 11/69-12/70 recession
DJIA High Phase A°
Table 11 - DJIA Peaks 16 January - 15 February
9 Feb 1966 236 Credit squeeze (Aug)
Ensuing US Crisis
Table 12 - DJIA Peaks 16 February - 28 April
4 Jan 2022 027 Rising interest rates
19 Mar 2002 062 03/01-11/01 recession (a)
20 Mar 1923 034 05/23-07/24 recession
DJIA Record High Phase A°
13 Dec 1961 076 Kennedy Slide (a)
Table 10 - DJIA Peaks 1 December - 15 January
4 Mar 1892 076
* Not a record high. (a) The 04/60-02/61 recession occurred well before the high.
14 Jan 2000 092 03/01-11/01 recession
01/93-06/94 depression
3.4 10 November - 30 November contained three DJIA peaks with no lunar phase similarities. Why this discrepancy arises in financial cycles is puzzling.
2 Jan 2009* 069 12/07-06/09 Great Recession
(a) The downturn occurred well before the DJIA top.
11 Jan 1973 084 11/73-03/75 recession
5
9
21
McMinn, D. 2010. DJIA Peaks, Seasonality & Market Outcomes. Market Technician. Journal of the Society of Technical Analysts. Issue 68. P 10-13. October.
27 Apr 1981 May 1890* Feb 1934 Aug 1987 Mar 1892* Mar 1937 Jul 1990 Sep 1895* Nov 1938 Jul 1998# Sep 1897* Sep 1939 Jan 2000# Sep 1899* Nov 1940 May 2001 Jun 1901 May 1946 Mar 2002 Jan 1906 Apr 1956# Oct 2007
6
19
12
(a)
9
20 RESEARCH
https://thedowtheory.com/resources/bull-bear/historic-record/3Dec1886*3
14
17
TheDowTheory.com. Historic record. History of the stock market in the 20th and 21st centuries.
Appendix 1: Beginning of Bear Markets Since 1885
4.0 Discussion & Conclusions
10
4
Excellent links can be established between lunar phase and DJIA peaks at the beginning of a bear market. This could best be accomplished by breaking the full sample down into small subsets by month-day (year ignored). The highs occurring at about the same time of year usually had similar lunar phase, with the findings summarised in Appendix 2. For the DJIA highs between May and early September, there were also close parallels between the timing of the top and subsequent panic (see Tables 2, 8 and 9). This was not observed for highs taking place at other times of the year.
Sep 1929 (b)
19
The relationships between the solar year, lunar phase and the beginning of DJIA bear markets has held up well over the past 135 years with few anomalies. The findings supported the Moon Sun Hypothesis, which views financial markets as being mathematically structure d in time and moving in tune with changing lunisolar cycles (McMinn, 2006, 2021). These relationships are very interesting, but they cannot explain how weak lunisolar tidal effects determine trading activity. The changing angles between the Moon and the Sun on the ecliptic circle are crucial in solving the mystery. Presumably other factors are also important, such as the lunar nodes, the apogee - perigee axis and diurnal cycles, although there is little evidence to support such speculations. There may be emerging a simple theory based on Moon Sun tidal harmonics, which would reduce the complexity of market cycles to a few basic principles. Such a paradigm shift would offer the potential to make accurate financial forecasts years in advance. Alas, such research breakthroughs will probably never be published given the potential profits to be made.
29
DJIA
Group. 2008. Historical Bull and Bear Markets for the Dow: 1900-Present. 14 October. Available at: https://seekingalpha.com/article/99902-historical-bull-and-bear-markets-for-the-dow-1900-present
McMinn, D. 2021. 9/56 Year Cycle & Financial Panics. Cycles Magazine. Vol 50. No 4. P 31-51. July.
10
BespokeReferencesInvestment
McMinn, D. 2000. Lunar Phase & US Crises. The Australian Technical Analysts Association Journal. P 20-31. January/February. McMinn, D. 2006. Market Timing By The Moon & The Sun. Twin Palms Publishing. P. 153.
McMinn, D. 2022. The 9/56 Year Cycle & DJIA Bear Markets. Market Technician, Journal of the Society of Technical Analysts. Issue 92. P 29-35.
5
Carolan, C. 1998. Autumn panics: a calendar phenomenon. Market Technician. Journal of the Society of Technical Analysts. Issue 32. P 12-18. July.
25
17
Lunar phase can be an indicator of an impending bear market. When significant peaks do form, their lunar phase may be assessed to see if it aligns closely with historical trends. Using this method, the 2011 panic was anticipated, with two large one day falls six days apart. However, it happened earlier than expected - in early August rather than September-October. Similarly, the 2015 panic was seen as likely to occur in early September, whereas the actual event took place two weeks earlier on August 24 with the Chinese Black Monday. Such approaches remain primitive and leave a lot to be desired in their predictability.
16
4
12
17
21 Nov 1916 3 Dec 1968 12 Feb 2020
1929-33 ERA FOR THE DJIA ( b )
19 Nov 1909
10 Mar 1937 350 322 332
21 May 2001 061 043 342 29 May 1946 068 051 343
Sun (1–0 - 120 Eo); Moon (0–5 - 075 3 Eo); Lunar Phase (2–0 - 320 Ao)
16 Jul 1990 114 040 286
(a) 1886–1895 data based on the 14 Stock Average and 12 Stock Average indexes.
30 Sep 1912 9 Feb 1966 13 Oct 2018
Sun Eo Moon Eo Lunar Phase Ao
(b) For the years 1929 to 1933, the bear market was taken as occurring from 3 September 1929 to 8 July 1932, even though it was broken down into several bear markets by the Bespoke Investment Group and TheDowTheory.com. This was to avoid distortions due to the extreme gyrations in US stock prices during a short period of about four years.
20 Mar 1923# 21 Sep 1976
* Pre 1900 data inserted by the author.
17 Jul 1998* 115 039 284
17 Jun 1901 086 101 015
Sources: Bespoke Investment Group (2008). TheDowTheory.com
Sun (295 – 325 Eo); Moon (195 – 235 Eo); Lunar Phase (225 – 295 Ao)
Market Highs
Appendix 2: DJIA Highs, The Solar Year & Lunar Phase (a) (b) Arranged in order by month-day (year ignored) 1885 - 2020
# Five DJIA corrections were included as they recorded declines from -18.5% to -19.9% and thus almost qualified as bear markets.
17 May 1890 057 043 346
Sun (0–5 - 090 Eo); Moon (0–0 - 105 Eo); Lunar Phase (3–0 - 015 Ao)
2 Jan 2009
19 Jan 1906 299 233 294
4 Mar 1892 345 061 076
19 Mar 2002 359 061 062
20 Mar 1923 359 033 034
3 Sep 1929 27 Jun 1931 8 Mar 1932
5 Feb 1934 316 205 249 9 Feb 1966 321 197 236 12 Feb 2020 323 191 228
Sun (345 – 040 Eo); Moon (310 – 065 Eo); Lunar Phase (270 – 080 Ao)
3 Nov 1919 11 Jan 1973 4 Jan 2022
17 Apr 1930 9 Nov 1931 7 Sep 1932
21 www.technicalanalysts.com RESEARCH
27 Apr 1981 037 311 274
24 Feb 1931 27 Jun 1931 18 Jul 1933
13 Dec 1961
6 Apr 1956* 017 324 307
NB: A bear market is usually defined as a DJIA decline of over -20% that was preceded by a rise of over +20%.
Sun (2–0 - 230 Eo); Moon (3–0 - 350 Eo); Lunar Phase (1–0 - 125 Ao)
The single peak with the Moon sited between 210 and 310 Eº has been highlighted in BLUE
25 Aug 1987 152 165 013
Anomaly
21 Nov 1916 239 192 313
(b) The 1886–1895 data based on the 14 Stock Average and 12 Stock Average indexes.
Sun (1–5 - 200 Eo); Moon (1–5 - 160 Eo); Lunar Phase (2–5 - 350 Ao)
9 Nov 1940 227 349 122
12 Sep 1939 169 158 349
3 Sep 1929 161 164 003
3 Oct 2018 190 118 288
21 Sep 1976 180 150 330
Sun (1–0 - 165 Eo); Moon (1–0 - 180 Eo); Lunar Phase (0–0 - 015 Ao)
10 Sep 1897 168 344 176
Sun (2–0 - 295 Eo); Moon (3–5 - 030 Eo); Lunar Phase (0–5 - 095 Ao)
9 Oct 2007 196 180 346
3 Dec 1968 252 058 166
(a) Includes market declines over -18.5% as presented in Appendix 1.
DJIA peaks with lunar phase between 270–95 Aº have been highlighted in RED
2 Jan 2009 282 351 069
22 RESEARCH
12 Nov 1938 230 114 244
5 Sep 1899 163 169 006
13 Dec 1961 261 337 076
Anomalies
3 Dec 1886 252 343 091
4 Sep 1895 162 347 185
19 Nov 1909 237 314 077
11 Jan 1973 291 015 084
Sun (160 – 170 Eo); Moon (3–0 - 350 Eo); Lunar Phase (1–5 - 185 Ao)
30 Sep 1912 187 057 230
No distribution pattern established for the Moon and lunar phase
14 Jan 2000* 294 026 092
4 Jan 2022 284 311 27
3 Nov 1919 220 342 122
Sources: Bespoke Investment Group (2008). TheDowTheory.com
23 www.technicalanalysts.com RESEARCH

These simulate a rising market by adding the rising component of a very long time cycle to shorter cycles with small ups and downs. However, with regular cycles what goes up must come down. The cycles method only works if actual price highs and lows repeat at regular intervals (as sine waves do) - and the real-world evidence shows otherwise. The notable feature of real price charts is the abrupt character of reversals of trend - the highs and lows resemble saw-teeth, not smooth curves. So two features - irregularity in time intervals, and abrupt reversals of trend - should be part of an accurate model.
The sister article to this, entitled ‘Elliott Taken On - Shape and Price’, looked at those two aspects of Elliott’s waves and was published in the September 2021 edition of the Market Technician. It showed how we could make Standard Forms of the vertical (Price) dimension of each of Elliott’s chart Shapes. The Standard Forms can be expanded or shrunk to fit any Degree of wave, in Elliott’s parlance. It turns out we only need Symmetry in those waveforms, plus Support and Resistance as potential Elliott wave start and finish points, to show that the price dimension should be moving mathematically within Golden Proportions. Those turning points form a set of ‘Levels’ we usually call Fibonacci Ratios.
So, Price Levels can be turned into a Standard Form for each of Elliott’s shapes. But what about Time? If we explore the time intervals between turning points mathematically, can we find Standard Forms for them also, with Golden Proportions involved?
Elliott himself, and Frost & Prechter, attached significance to time intervals between highs and lows which are numbers of years or months in the Fibonacci series. Using this method for forecasting times ahead may occasionally produce hits on particular highs or lows, but there is no guarantee which degree they will be. It would be much more useful if major turns could be forecast fairly accurately in time, for each degree, so that we can size each degree.
Available evidence on time, to be considered
• The most significant omission in the books is a firm conclusion on where ‘Elliott Time’ started - the beginning of Millennium Wave1. That is a pity, because it provides an anchor for Elliott ‘Counts’ and durations of Elliott Waves.
24 RESEARCH
• Frost & Prechter’s book ‘Elliott Wave Principle’ left some useful fragments, both positive and negative. These were added to in Prechter’s later book ‘At the Crest’. Long-term history is marred by a lack of accurate price records and the mixing of early British price records with predecessor indices to the Dow30, and just using the small-sample Dow is hardly a world view. But Prechter’s research on key historic dates is most useful.

Christopher Mack MA(Cantab), MBA, MSTA
Elliott Taken On - Shape and Time
Christopher Mack studied Engineering (all varieties) in 1961, followed by Business School. After careers in Industry and Management Consultancy he became a private investor. That started a quest to ‘beat the market’ using Technical Analysis. Twenty years later he concentrates on market timing, while trading UK shares with trends of several months. He also coaches others, and seeks to de-mystify Elliott’s ideas and make them clearer and more useful to all.

Introduction
Research into Time
Different approaches have long been tried to find underlying form in charts –combinations of long and short regular sine-wave cycles being an obvious one.
sm
Does a millennium cover one wave, or two (a millennium ‘cycle’ in Elliott terms, not the same as his ‘Cycle’ degree)? How does this relate to a sub-minuette wave or cycle time of ‘hours’? We can guess that F&P might have christened the large wave degree in the expectation that it would last ‘around’ a thousand years. My working assumption is that the time will cover two waves, a motive impulsive and a corrective.
RESEARCH•Another
Frost and Prechter (on page 25 of F&P) counted the actual numbers of subwaves of each degree below a starting degree, and found they grew by numbers in the Fibonacci series. They allowed for five subwaves in a motive wave, and three subwaves in a correction, treating each correction as a ‘three’ even if it was a triangle. They counted a cycle of one motive and one corrective wave, and their answer forms the upper section of Table 2 1 - Duration of a Millennium cycle trading hours
Using Mandelbrot’s maths, on average each fractal degree can be expected to scale up by the same Time Growth Factor (TGF). Nine degrees up - from sub-minuette to millennium degree - the higher degree will be longer in time by the ninth power of TGF. Table 1 shows that if we assume 4.2 hours for a sub-minuette cycle time (sm), a millennium cycle time (MM) will be 984 years with a TGF of 4.236 times per degree up. Other possible combinations are shown, all using core assumptions of 7.5 hours/ trading day, and 250 trading days per year. The resulting TGF is the number in thebody of this Table.
We still don’t know the probable duration of a millennium cycle, but we now know the likely range - between 3.6 and 4.8 - of the TGF per degree. Can we get closer than that?
Table
Duration of a Millennium cycle
25 www.technicalanalysts.com
• Robert Rhea’s analysis of the first 36 years of the Dow30’s data is useful. He found that during nine bull and bear markets, bear market days were 61.1% of the bull market days. If that is not just a coincidence over such a large number of sample days, it is remarkably close to the Golden Ratio.
The Start of Elliott Time
Wave Numbers growth by degrees
I think there is a simple answer here. We are studying the movement of share prices. The start of Elliott Time has to be the introduction of tradable share prices. Robert Shiller, Yale Nobel Laureate (pictured left), tells his Economics students that the first Joint-Stock company was the East India Company, founded in Amsterdam in 1602. Only when tradable companies appeared could share indices be calculated from their prices; I therefore take 1602 as the ‘start of time’ in Elliott terms, point MM0, the start of the first Millennium wave. We’ll see where that leads.

• Elliott’s scheme of ‘Degrees’ is key to any analysis. The 10 degrees of waves from Millennium to sub-minuette can be assumed to be financial fractals as per Benoit Mandelbrot’s rules - they are effectively scale models of each other, whilst allowing some variety in their components’ sizes.
MM years 2 4.2 8 500 4.267 3.929 3.658 984 4.600 4.236 3.943 1500 4.821 4.439 4.133
problem is whether such early history of share prices, in the state that they are, can be used to project any world index however calculated; are they synchronised?
The key observation is that even when some of the corrections are fives, the rate by which the number of subwaves grows per degree is unchanged, and it rapidly converges on 4.236 times per degree down. That means that if (in the ‘perfect’ case) the subwaves at each degree are all of their average time, the TGF will also be expanding at 4.236 times, an essential result.
Table 2 - Wave Numbers growth by degrees
A motive then a corrective wave, like Wave1 followed by Wave2 (of any degree) would ideally have five then three subwaves in a simple Elliott cycle, and as per Rhea we could expect Wave2 to take about 61.8% of the time Wave1 takes. If we conceive a Standard Wave1 (in time, not price terms) as having five subwaves: motive, corrective, motive, corrective, motive, with each of the motive waves having a value of 1.0 times the average time for that subwave degree, then the gross time of motive Wave1 will be 1 + 0.618 + 1 + 0.618 + 1 = 4.236 times the average motive subwave’s time, precisely what the subwave numbers confirm.
How to measure Time intervals?
Robert Rhea’s Analysis of Motive: Corrective Wave Times
The Numbers of waves of each degree are:
motive 1 5 21 89 377 1597 6765
Total waves per degree, with 50/50 split of 3- and 5- wave corrections
2 9 38 161 682 2889 12238
But triangles are not the only corrective wave which actually has five subwaves, not three. Others are Triple zigzags (W-X-Y-X-Z), and other Triple combinations. We need to improve the model to allow for a mixture of threes and fives in corrections. This improved version is the middle section of Table 2; and finally there is an assumed 50/50 mix of three- and five-wave corrections in the bottom section.
The Factor by which the number of waves grows by each degree down: all waves 4.5 4.222 4.237 4.236 4.236 4.236
motive 1 5 21 89 377 1597 6765 if all correctives are 5-wave 1 5 21 89 377 1597 6765
Think of a grid of intersecting horizontal and vertical lines, drawn on a log-scale chart. The horizontal lines are measures of Price on the vertical scale, measured by ‘Levels’. The vertical lines are measures of Time on the horizontal scale, measured by time intervals called ‘Steps’. That is the simple concept - an Elliott shape can be fully described, drawn, and measured by the
if all correctives are 3-wave 1 3 13 55 233 987 4181
2 10 42 178 754 3194 13530
26 RESEARCH
Standard Forms for Time Intervals, in ‘STEPS’
Millennium Grand S'Cycle Supercycle Cycle Primary Intermediate Minor
2 8 34 144 610 2584 10946
Now it’s clear that the Time Growth Factor per degree is 4.236 times, the central figure in Table 1. We could quickly work out the average duration of each Degree’s waves if we knew accurately how long a millennium or a sub-minuette cycle was. We do know that all subwaves are not equal, and that we have to allow for Elliott’s Price Extensions. We also know that assumed perfect wave shapes do not always hit their targets in real life. But the evidence from studying Price shows that standard forms for price shapes (whilst not perfect) are quite often ‘hit’ by actual waves, so they are worth using for forecasting. The aim of this second Article is to devise some standard forms for time intervals which will have similar success rates in practice.
Idealised no. of waves MM GSC SC C P I M
Let’s explore the average timespan of waves of different degrees, using this simple version of time’s Standard Form. For brevity I have only gone down from Millennium to Minor degree in Table 3. Start with an estimated Millennium cycle of 1,000 years, and calculate all the other GSC subwaves’ timespans using MMM proportions. This is still a theoretical table, as we don’t yet know the actual timespan of the unfinished Millennium Wave 1, which we are in. What it does tell us is the relative scale of each degree down. (And if you are using an Elliott Count which has rather different wavetimes to these, you should recheck your counting!)
We can simply define a Standard Form for a motive wave’s Steps as having:
Next, we need to provide other standard forms by using different permutations of Golden-Proportion subwave times, as allowed by Mandelbrot’s fractal maths. This way we can make longer and shorter Steps in a waveform. For example, we can
Steps on a Grid.
27 www.technicalanalysts.com
Table 3 - Wave Times Using the Standard Form MMM Wave Times using the Standard Form MMM Total years Lets assume that the Millennium cycle (a motive plus a corrective wave) is: 1000 Average time for 1 wave: MM GSC SC C P I M Motive wave: 618 146 34 8 1.9 5.4 1.3 Corrective wave: 382 90 21 5 1.2 3.4 0.8 years years years years years months months
RESEARCHLevelsand
Here’s one example.
• five subwaves, in sequence motive, corrective, motive, corrective, motive
• its subwaves each being a Golden Proportion of the whole, the five adding up to 1.0
The subtlety of this method is that all the Levels and Steps are at Golden Proportions. We devise Standard forms of ShapesImpulse, Flat, Zigzag etc by using Price Levels on a vertical scale of ‘Fibonacci Ratios’, which are more accurately ‘Golden Proportions’. Fibonacci didn’t invent the Golden Ratio. However, Time is an independent variable requiring different treatment, as it does not correspond directly with Price Rises.
Applying the Standard Form’s MMM Version to deduce Subwave times
So, if the Millennium cycle is 1,000 years then with the MMM form, Wave MM1’s GSC subwaves 1-5 will be: 146, 90, 146, 90, 146 years long, totalling 618 years. If the Millennium cycle is less or more than 1000 years, then all the figures will be proportionate (see Table 11 later).
• a short-hand labelling system like ‘MLS’ for each form.
That will be an uncommon waveform to find in practice - not least because Elliott wrote that at least one motive wave would ‘extend’ in price terms, and that usually (not always) means it would be longer in time too. However, it is a useful Form in concept because it is also the ‘perfect case’ of the Rhea wave above, where each of the motive waves is equal to the average motive subwave’s timespan. Also, each corrective wave is 61.8% of the motive wave’s timespan.
Standard Forms - Introducing Variety of Shapes
MMM Form has subwave proportions 0.236, 0.146, 0.236, 0.146, 0.236, totalling 1.0. This means that GSC1 has proportion 0.236 of the whole MM1 wave - this is its Step, and so on for the other four GSC waves. The Form is labelled ‘MMM’ because its three motive subwaves 1, 3 and 5 are equal, and Medium in timespan.
• varied standard forms, using different-sized subwaves in different orders like Mandelbrot
• which locates the forecast endpoint of the whole waveform.
MLS, meaning that subwave 1 is Medium, subwave 3 is Long, and subwave 5 is Short. We still use Golden Proportions totalling 1.0 for the Steps’ numbers.
What does this standard form, with these green and blue figures, tell us?
I found that a few Key Numbers can summarise those proportions into three useful groups, which reduces the data required for comparisons with Actual historic waves. The groupings are waves 1-2, wave 3, and waves 4-5. Their proportions are calculated from the five Golden Proportions and summarised in the three green figures in the Table. Additionally, you may have a developing wave with only the first three Actual waves to compare with the standard form, so the two blue numbers show the summary proportions of waves 1-2 and wave 3 only. The blue figures are calculated from the green - in this example, 0.326 / (0.326+0.382) = 0.460
A Standard Form for SML is shown on lines 1 and 2 of Table 4 below. .
28
It also tells us that if the blue Wave 3 proportion is exact or very close to the Actual, then points 2 and 3 are precisely forecast by the waveform; that is a ‘Hit’ under this system of counting.
• from points 2 to 3 should be 0.540 of the time from points 0 to 3
• listing a set of Golden Proportions which will have a Long middle wave
• defining L as 0.382 or a higher golden proportion
• having its five proportions totalling 1.0
Let’s test this MLS Standard Form by comparing it with Actual time history. We look at historic dates, to see how their time intervals compare. Combining my date for point MM0 with Prechter’s researched dates of highs and lows, in Table 5 we have the
Proportion of the 3 waves 1-3: 0.460 0.540
• defining M as 0.236
• so point 0 to point 5 is 1/0.708 times the time from point 0 to point 3
• showing its reference name
History - the Big Picture
RESEARCHhaveForm
There are five motive wave shapes to cover - Contracting and Expanding Diagonals, Extended 1st , 3rd and 5th . I’ll show how to construct and summarise just four different waveforms’ Steps, from a full list of over a dozen. Form MLS is a form of Extended 3rd . Construct its standard form by:
The green figures will then tell us about the future waves 4 and 5 of this standard form:
Motive Waveform: E3.1, MLS Waves: 1 2 3 4 5 Golden Proportions, totalling 1.0: 0.236 0.090 0.382 0.146 0.146
Key Numbers Table, for wave groups: 1-2 3 4-5
Table 4 - Summarising the Key Numbers
• if we take an Actual count of historic wavetimes, and its calculated blue proportions concur with this standard count, then we have identified this as the correct standard form for the actual count. That is because each standard form has a unique fingerprint of blue proportions.
• point 3 (the end of wave 3) is 0.708 of the time from point 0 to the end of wave 5
• they say that from points 0 to 2 of the count should be 0.460 of the time between points 0 to 3
• if we have an Actual wave count with only Waves 1, 2, and 3, use the blue figures
• defining S as 0.146 or a lower golden proportion
Summarising the Key Numbers
Proportion of the 5 waves 1-5: 0.326 0.382 0.292
'start of time' bubble peak bubble low high Totals, Three Date, Year, AD 1602 1720 1784 2000 GSC waves
Years: 0.457 0.543 1.0
South Sea Post - South Sea
Significant Dates over Four Centuries
time data for GSC waves 1-3 of MM wave 1. GSC3 is predicted to have completed in the year 2000; that will also be verified by checking lower-degree waves against their standard forms.
times (the Actual Steps) shows that GSC3 is nearly twice as long as GSC1, and so the Waveform of MM1 is an Extended 3rd, or possibly an Extended 5th - we will not know definitively which until GSC4 and 5 are finished many years hence. But we can work out which is more likely using Standard Forms. The possible waveforms for an Extended 3rd will be SMS, MLS, MLM, SLS, SLM; those are the only ones with the longest time wave in the W3 position.
Assumed Count: MMO GSC1 GSC2 GSC3 Years
Waves 1-2 Wave 3 Waves 1-3
If this were to transpire, the end of MM1 would be 398/0.438 = 908 years after 1602, in the year 2510
29 www.technicalanalysts.com
Now we need to see whether Supercycle, Cycle and Primary degree Actual waves can also be predicted by standard forms. Their wavetimes are available from Prechter’s researched dates plus recent charts showing highs and lows. We convert these
Table 5 - Significant Dates over Four Centuries
Table 6 - The possibility remains that GSC5 will extend
GSC Wavetimes, Actual Years: 118 64 216 398
Actual proportions of GSC waves 1-3:
That would mean a very long correction and a very long rise - or a shorter correction then an enormous time in GSC5, which I personally doubt in this fractious world. So I favour the original Extended 3rd count ending in 2164. I also think it’s most unlikely that the Elliott Degree scheme will extend to a higher degree than Millennium, due to the sheer size of waves of higher degrees.
Golden Proportions, totalling 1.0: 0.146 0.056 0.236 0.090 0.472
Confirmation by lower degree waves
We can also calculate that GSC5 of this MLS waveform should end at 398/0.708 = 562 years after point MMO, i.e. in the year 2164, and that will be the end of GSC5 and of wave MM1. This makes MM1 a little less than the 618 years first estimated in Table 3. It also means that we are now in GSC4, which will be a long corrective wave, maybe in the order of 80 years.
RESEARCHAlookatthese
Motive Waveform: E5.1c, SML Waves: 1 2 3 4 5
Key Numbers Table, for wave groups: 1-2 3 4-5
Of those, form E3.1 MLS fits the blue proportions pretty closely (0.460 and 0.540) and this supports the idea that GSC3 started in 1784, ended in year 2000 and isn’t stretching further. If it were, all the subwaves of Supercycle degree and lower will also be stretching, and there should be a natural limit to that, which will show up in their wavetimes - see later.
But the possibility remains that GSC5 will extend and become the longest wave, making MM1 even longer. That is because we can construct the following standard form for an Extended 5th , with the same blue proportions for GSC waves 1-3 but longer waves GSC 4-5, which shows up in the green figures. Table 6 shows is form E5.1c SML
Proportion of the 5 waves 1-5: 0.202 0.236 0.562
Proportion of the 3 waves 1-3: 0.461 0.539
Supercycles match E3.2 MLM best; see Table 8 Point 2 is not far off and SC4-5’s close match means that the 1929 start of those two waves is accurately matched with the 2000 finish of SC5:
Key Numbers Table, for wave groups: 1-2 3 4-5
48
Key Numbers Table, for wave groups: 1-2 3 4-5
Significant Dates within GSC3 - Supercycles
Cycles within SC5 of GSC3 match E5.2 SLL well; see Table 9 C2 lands very accurately in 1942, C3 in 1966 is a little earlier than standard, but C5 compensates by being the same bit later, again ending in year 2000:
Proportion of the 5 waves 1-5: 0.146 0.382 0.472
Assumed Count: GSC2 SC1 SC2 SC3 SC4 SC5, GSC3 Totals, five key low high low high low key high SC waves Date, Year, AD: SC WaveTimes, Actual Years: 10 87 3 68 216 SC1-2 SC3 SC4-5 Waves SC1-5
Three more Standard Forms are needed to compare with the Actual wavetimes. See how they all have permutations of Golden Proportions totalling 1.0. We’re dealing with 5-wave forms of completed waves, so we only need the green proportions.
Motive Waveform: E5.2, SLL Waves: 1 2 3 4 5 Golden Proportions, totalling 1.0: 0.090 0.056 0.382 0.090 0.382
Table 8 - Supercycles match E3.2 MLM best
Key Numbers Table, for wave groups: 1-2 3 4-5 Proportion of the 5 waves 1-5: 0.292 0.236 0.472
dates to proportions and find appropriate standard forms with those proportions. There is no reason to expect each degree to match the same standard form, but if we can show that there are different forms which match the Actual proportions of each degree, it validates this technique.
30 RESEARCH
Acual proportions of SC waves 1-5: 0.269 0.403 0.329 1.0
Motive Waveform: E3.2b, MLM Waves: 1 2 3 4 5
1784 1832 1842 1929 1932 2000
Table 7 - Five-wave forms of completed waves
Proportion of the 5 waves 1-5: 0.292 0.382 0.326
Motive Waveform: E5.3a, MML Waves: 1 2 3 4 5 Golden Proportions, totalling 1.0: 0.236 0.056 0.236 0.090 0.382
Best Standard Steps for W1-5 E3.2 MLM: 0.292 0.382 0.326
Golden Proportions, totalling 1.0: 0.236 0.056 0.382 0.090 0.236
C1-2 C3 C4-5 Waves C1-5
Thetime.other
Best Standard Steps for W1-5 E3.2 SLL: 0.146 0.382 0.472
We need a reality check. In Elliott’s world of prices, he termed ‘extensions’ as waves with larger price moves than their peersthe three motive subwaves in a higher-degree Impulse. In time terms they may not stretch by the same amount - the obvious possibility is that a steep advance (often a 3 rd wave) may produce the biggest wave in price terms but it may only take a short
31 www.technicalanalysts.com
RESEARCHFinallythelast
Are the waves Overstretched and by how much?
Date, Year, AD: 1974 1976 1982 1987.6 1987.8 2000
Significant Dates within C5 of SC5 of GSC3 - Primaries
Assumed Count: SC4 C1 C2 C3 C4 C5, SC5 Totals, five key low high low high low key high C waves
Date, Year, AD: 1932 1937 1942 1966 1974 2000
Acual proportions of SC waves 1-5: 0.308 0.215 0.477 1.0
difficulty is that corrections can be short and swift like 1987, or large and swift like 1929, so that in time terms it’s hard to extend this Standard Forms technique to steep corrections. That is why I have rolled waves 1-2 and 4-5 together, and found that this has surprisingly good predictive qualities, as the foregoing shows. The method therefore forecasts the ends of waves 2, 3 and 5, but not of waves 1 and 4.
Table 10 - The last Primary wave P5 of C5 also performs to order from years 1974 to 2000
Primary wave P5 of C5 also performs to order from years 1974 to 2000, using form E5.3 MML; see Table 10.The Actual proportions produce reasonable matches to the Standard form, notably waves P4-5 in their run-up to the year 2000:
Table 9 - Cycles within SC5 of GSC3 match E5.2 SLL well
Best Standard Steps for W1-5 E3.2 MML: 0.292 0.236 0.472
SC WaveTimes, Actual Years: 5 5 24 3 26 68
Acual proportions of SC waves 1-5: 0.147 0.353 0.500 1.0
Assumed Count: C4 P1 P2 P3 P4 P5, C5, SC5 Totals, five key low high low high low key high P waves
The three years of the 1929-1932 crash are a very short supercycle wave because of its percentage price fall, not its wavetime. It was an extension in price terms, though Elliott did not call it that. But you can see it as an ‘overshrunk’ wave in time terms. And that leaves a potential overlap between the wavetimes of waves of adjacent degrees. We need to look at ‘overstretch’, the time equivalent of price extension, more closely. Overstretch and Overshrink are relative to ‘normality’, and we can use a Medium wave Step as a reference proportion for that. I set the ‘Medium’ proportion as 0.236; and the ‘Long’ proportion as 0.382 and above - in practice that means an upper limit of around 0.5 or even 0.528. Taking that larger figure means the longest motive wave is 0.528/0.236 = 2.236 times stretch. So finding bigger stretch multiples than this in any degree may indicate an invalid count. We can therefore test whether year 2000 is confirmed, by its motive subwaves not being overstretched, as the end of GSC3. Below is Table 11, which is a reworked version of Table 3 now that we know the likely size of the Millennium Cycle.
Significant Dates within SC5 of GSC3 - Cycles
We now know how the Actual wavetimes fit into the overall count from 1602 to 2000. We have the wavetimes of each wave down to Primary degree. The Steps/Standard Forms system of estimating time intervals stands up in all four degrees.
SC WaveTimes, Actual Years: 2 6 5.6 0.2 12 26 P1-2 PC3 P4-5 Waves P1-5
GSC3 216 133 1.62 1.6 SC5 87 31 1.62 1.73 2.8 C5 26 7 1.62 1.73 1.32 3.7 P5 12 1.7 1.62 1.73 1.32 1.90 7.1
All the four degrees’ stretches are 1.9 times or less; these are all within the 2.236 figure for the limit of normality, showing that there is no abnormal overstretch at any degree in this count.
Level 0.0 0.09017 1.0 accurate golden proportions
Index price 4.40 7.47 1559 forecast price from Level 2 1553 Actual Price, the year 2000 high
Longest wavetimes
Confirmation by Price
Motive wave: 562 133 31 7 1.7 4.9 1.2 Corrective wave: 347 82 19 5 1.1 3.1 0.7 years years years years years months months
Wave Times using the Standard Form 'MMM'
We can check overstretch by comparing actual historic wavetimes with the Average figures for each degree in Table 11. There is a wrinkle to be aware of first, though. When a wave extends pricewise, no new subwaves are created - all the existing ones are stretched equally (on average) to fit the extra wavetime. And, likewise, an overshrunk wave compresses its original number of subwaves. The interesting thing is that this happens at each degree, and we can identify the overall stretch as the product (not the sum) of the individual degrees’ stretches. This is shown in Table 12:
The Millennium cycle (MM0 plus MM1 per Rhea) is: 909
Total years
Point 0 2 5
Date 1932 low 1942 low 2000 high
In my earlier article I showed how to forecast price moves via ‘Hits’ on Primary-Perfect price Levels. Price and Time are interrelated, but there is no direct formula which couples the two. This first article showed that Price turning points - highs and lows - can be forecast via their convergence upon Levels which are set at Golden Proportions. This Article shows the Timings of highs and lows can be forecast by Steps - time intervals of waves of each degree - which are measured in Golden Proportions of a whole wave. It must surely reinforce the likelihood of an accurate Elliott Count when the two large-scale measures convergean important price high appears in a forecast year. (But why it happens is another story. Where’s the budding PhD student?)
If GSC3 ended in year 2000, was there a Primary-Perfect Hit on a Price level - a notable calculated high - in that year? The answer is yes; we can calculate the S&P 500’s future Price at point5 of its SC5 wave from 1932 to 2000, using Yahoo price data, log-scale prices, and accurate Levels for the calculations, Table 13. (See my previous on ‘Shape and Price’.)
Stretch by Degrees
32 RESEARCH Table 11 - Wave Times Using the Standard Form MMM
Table 12 - Stretch by Degrees
Table 13 - Yes, there was a Primary-Perfect Hit on a Price level
Average time for 1 wave: MM GSC SC C P I M
Av. wavetime GSC stretch SC stretch C stretch P stretch Overall stretch degree, wave wavetime, yrs for degree times times times times times
There was the forecast, available in 1942 if you had used this Levels method!
Summary
• If you don’t like the ‘Start of Time’ in 1602, when is yours? And what is your count thereafter?
The final challenge is to you, the reader. Can you answer Frost & Prechter’s unanswered question?
Time in Elliott terms doesn’t seem to have been explored thoroughly before, as far as I know. The first Article on Price and Shape of Elliott Waveforms set out how Prices often reverse at specific Levels. These are related by the Golden Ratio (not the Fibonacci number series, and some may find that unsettling). And, likewise, assuming that Time intervals between highs and lows are always going to be governed by the Fibonacci number series has not been thoroughly thought out. This Article has found that Golden Proportions in the time intervals named Steps of each individual wave’s subwaves do make up a consistent framework to size waves at every Degree. And that can be tested with the help of a sensible assumption about when ‘Elliott Time’ started in history.
Price forecast = Price5 = antilog of log (Price5)
Comments - and answers to your challenges! - would be welcome at ccrm@me.com
• Where are we now, in May 2022? Can you verify your count using Steps?
• If you do accept the Start of Time in 1602, and the subsequent count to GSC3 in 2000,
RESEARCHIfyourmaths
is rusty here’s the equation using Level2 to find a forecast price:
[ log(Price2/Price0) / Level2 ] + log (Price0) = log (Price5)
33 www.technicalanalysts.com
The result is that we can define Elliott’s Shapes in Standard Forms for both Time and Price. The forms generate model shapes we can use to forecast where waves will reverse direction up and down, often producing ‘Hits’ with surprising accuracy. In realworld Price and Time forecasting that is a valuable, if not perfect, tool.
Where are we in the Scale of Elliott Time?
• If you do accept the Start of Time in 1602 but don’t accept my count thereafter, what is yours up to May 2022?
34 RESEARCH
Renko Charts

Source: TradingView
I recently attended a talk by Stephen Hoad on behalf of the STA for the CISI, where he discussed his use of Renko charts. Well, it piqued my interest and I decided to take a closer look myself.
y-axis. Also note that it uses an average true range of 14 days. For an explanation of average true range (ATR) please follow this link: Average True Range (ATR) [ChartSchool] (stockcharts.com). Importantly, when adding indicators say a 20-period moving average, for example, this will be based on the last 20 Renko values NOT the last 20 days. I always think that these types of charts look optically ‘cleaner’ or clearer than the more typical bar chart. They completely ignore time, and a brick is only drawn if price moves by a set amount. If it moves less than the set amount, no brick is drawn.
Previously published articles on that generated interest
Figure 1 shows a chart of the US Dollar Index, where upward price moves are green and downwards are red. This example uses a 0.5 brick size.
Karen Jones is the former Managing Director and Head of FICC Technical Analysis Research at Commerzbank Corporates and Markets. The group was responsible for forecasting and formulating technical trading strategy globally and covered foreign exchange, fixed income, emerging markets and commodities. She has extensive experience of technical analysis spanning 30+ years. She has been voted top 3 in the world in the FX Euromoney Survey for over a decade and has won this category several times.
Figure 1 - Instead of X- and O-Columns, Renko charts use “bricks”
Renko charts were invented in Japan, they ignore time and just use price changes that meet a minimum requirement, which to my mind sounds exactly like Point & Figure charts (I love these). Instead of X-Columns and O-Columns, Renko charts use price “bricks” that represent a fixed price move. These bricks are sometimes referred to as “blocks” or “boxes.” They move up or down in 45-degree lines with one brick per vertical column. Bricks for upward price movements are one colour while bricks for falling price movements are filled in another colour.
Note the irregular time span along the
Article published 5th May 2022
In contrast to fixed price bricks, using ATR values results in fluctuating brick sizes. The default ATR is based on 14 periods and the Average True Range fluctuates over time. The brick size is based on the ATR value at the time the chart is created. Should the ATR value change the next day, then this new ATR value will be used to set the brick size. Also note that ATR values are based on standard charts, such as close-only, bar and candlestick.
Karen previously worked as a global FX technical strategist at CSFB (19931998) and as a technical analyst at Sucden (UK) Ltd (1987-1993).

Karen Jones FSTA
As well as being Treasurer for the Society, Karen is also the STA’s content editor.

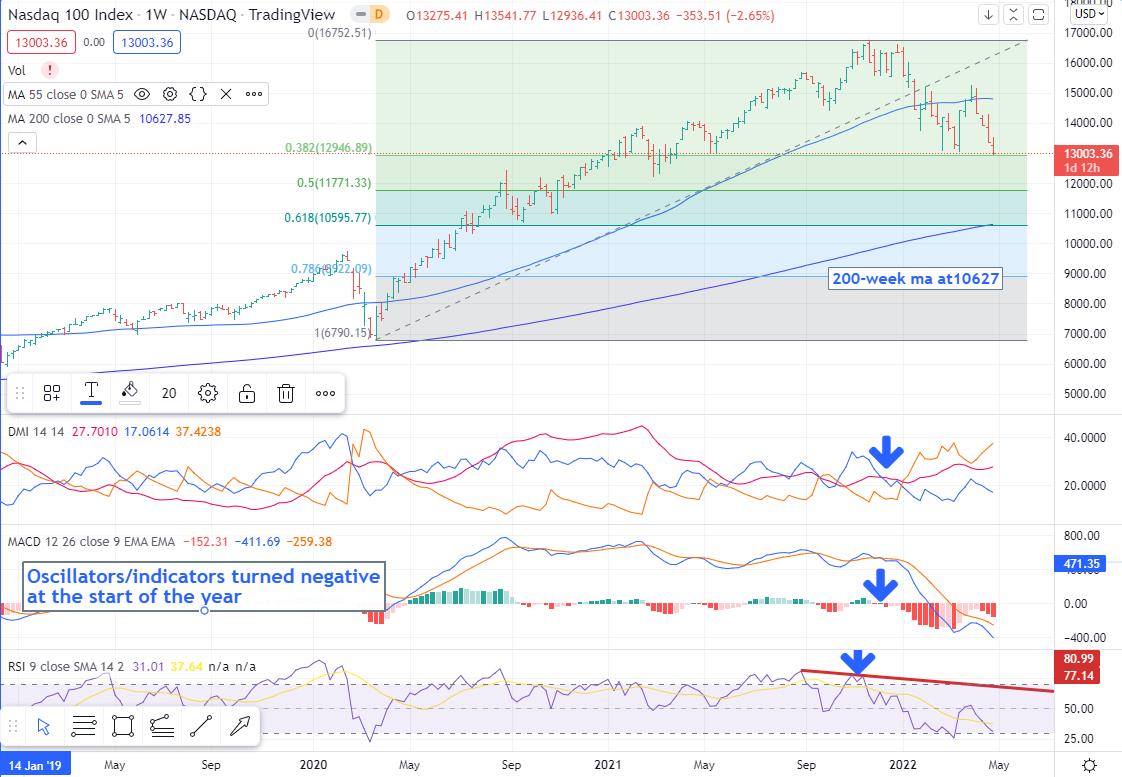
Thenmomentum.toadd to this negative picture we saw the DMI register a sell signal, and this was further confirmed when the ADX broke above 25 in mid-January.
Disclaimer: The information posted on TradingView is for informative purposes and is not intended to constitute advice in any form, including but not limited to investment, accounting, tax, legal or regulatory advice. The information therefore has no regard to the specific investment objectives, financial situation or particular needs of any specific recipient. Opinions expressed are our current opinions as of the date appearing on TradingView only. All illustrations, forecasts or hypothetical data are for illustrative purposes only. The Society of Technical Analysts Ltd does not make representation that the information provided is appropriate for use in all jurisdictions or by all Investors or other potential Investors. Parties are therefore responsible for compliance with applicable local laws and regulations. The Society of Technical Analysts will not be held liable for any loss or damage resulting directly or indirectly from the use of any information on this site.
35 www.technicalanalysts.com RESEARCH
How Oscillators can you give you an edge
If we take a brief glance at the weekly chart shown at the bottom of Figure 1, we can see the MACD indicator was below zero from mid-December 2021 onwards, when the market had only just reached a new high in November. The market was making a new high, but the oscillator was not confirming it. The weekly RSI had also diverged (this happens when price makes a new high BUT the oscillator does not) and with the MACD below zero, both were suggesting a serious loss of medium-term upside
Figure 1 - Warning signs were there technically from the beginning of 2022
Much has been said about the Nasdaq entering a new bearish phase, but to my mind the red flag warning signs were there technically from the beginning of 2022.
We took out the 15508 low in mid-January and closed below the 14385 October low. That was the confirmation that we needed that the bull trend was over. The definition of a bear trend is lower reaction highs and lower reaction lows - so as far as I was concerned technically, we were in a bear trend from mid-January.
Looking at Figure 1 now, I can see that we have moved just above the 38.2% retracement at 12947 (of the move from 2020-2021), and this is the next break point on the downside. Given our bearish indicators we can only assume that this is likely to give way and trigger losses towards the next major band of support offered by 10677/10595 (the 200-week ma, the 61.8% retracement and the September 2020 low).
Article published 28th April 2022

Gerry Celaya MSTA
Gerry ran the European technical analysis team for one of the largest provider of real time research to professional dealers. He holds economics degrees from UCSD (BA) and CSUSF (MA).
The last time that I reviewed academic research was way back in 2003 and the article can be found in our members website. The STA members site also has a link in the Members Area tab to Research, where some interesting academic article links and a .pdf with a list of reference papers can be found. We are considering opening access to this into the open part of our website as well in order to help ‘spread the word’ about our craft; please let us know your thoughts on this idea.
The advances in information technology mean that there are more research articles on the web than ever now. Many research journals are behind paywalls, though, which can hinder the flow of information. Public libraries are facing budget squeezes which can restrict the availability of research journals as well. There are websites such as researchgate that can help those looking to access recent research and also offers authors an avenue for getting their findings published in a timely manner. The major search engines can also bring up useful research articles that can provide ideas for our trading or investment process, or point out some potential faults in our thinking.

Technical analysis has long fascinated academic researchers, as the view that you can analyse the road ahead by looking in the rear view mirror seems odd to them. Chart and technical analysis is not about looking in the rear view mirror of course, but it is the attempt to examine market data in order to gauge investor sentiment and generate potential risk and reward profiles to help manage risk and investments. Keeping it simple helps; in the technical analysis world we are all humble and try and figure out what smart money is doing. The fact that many of our techniques can be quantified does give academic researchers the ability to back test some of our ideas, and the results are often favourable.
Director of Redtower Asset Management and Tricio Investment Advisors

Gerry is a former board member of the STA and currently a director of Redtower Asset Management and Tricio Investment Advisors. He has worked at various US banks in London, providing research and proprietary trading services.
36 RESEARCH
Web Notes from AcademiaAn Update
RESEARCHInorderto
• Technical analysis of Forex by MACD Indicator
Please let us know your thoughts on this by contacting us through the STA office at info@technicalanalysts.com
A more focused look at a particular indicator can interesting, and this is offered by “Technical analysis of Forex by MACD Indicator ”, Seyed Hadi Mir Yazdi and Ziba Habibi Lashkari, International Journal of Humanities and Management Sciences (IJHMS) Volume 1, Issue 2 (2013) ISSN 2320–4044 (Online). For those looking to create trading systems or use technical indicators as position triggers, this paper should offer a lot to ponder. It is a brave attempt at using intraday data and fixed profit and loss levels (30 pips each way). This runs counter to many trading rules or habits of letting profits run and cutting losses short, or having 2X1 or 3X1 win/loss target levels.

These papers are a very small sampling of the academic research papers that are out there. The STA is considering expanding our centre of information by listing more papers and making them available when possible. We would also like to hear our members views on whether the STA should actively encourage more academic studies in the validity or use of technical analysis through various means. These could include data availability, research tools, and even monetary support or prizes for research papers.
Another brave attempt at intraday FX trading is found in “Improving trend reversal estimation in forex markets under a directional changes paradigm with classification algorithms”, Adesola Adegboye, Fernando Otero, Michael Kampouridis, International Journal of Intelligent Systems, August 2021. This paper offers insight not only because of its results, but perhaps more importantly on the process that the authors used to generate those results.
• Technical Analysis in the Foreign Exchange Market
The Profitability of Technical Analysis: A Review by Cheol-Ho Park and Scott H. Irwin Electronic copy available at: http://ssrn.com/abstract=1734836 Research Division Federal Reserve Bank of St. Louis Working Paper Series Technical Analysis in the Foreign Exchange Market Christopher J. Neely and Paul A. Weller Working Paper 2011 001B http://research.stlouisfed.org/wp/2011/2011 001.pdf January 2011 Revised July 2011 FEDERAL RESERVE BANK OF ST. LOUIS Research Division P.O. Box 442 St. Louis, MO 63166 The views expressed are those of the individual authors and do not necessarily reflect official positions of the Federal Reserve Bank of St. Louis, the Federal Reserve System, or the Board of Governors. Federal Reserve Bank of St. Louis Working Papers are preliminary materials circula discussion and critical comment. References in publications to Federal Reserve Bank of St. Louis Working Papers (other than an acknowledgment that the writer has had access to unpublished material) should be cleared with the author or auth Electronic copy available at: https://ssrn.com/abstract=1734836 Improving trend reversal estimation in forex markets under a directional changes paradigm with classification algorithms elligent Syst ugust 2021 the author this publication ar also orking on these elated projects: oject
that may be of interest is “Technical Analysis in the Foreign Exchange Market ”, Federal Reserve Bank of St. Louis Working Paper No. 2011-001B, Christopher J. Neely, Federal Reserve Bank of St. Louis - Research Division and Paul A. Weller, University of Iowa, Department of Finance, Date Written: 24 July 2011. This builds on previous papers from Christopher Neely and his colleagues, and offers some insight into why technical analysis can be useful in FX markets.

move forward, one has to acknowledge the past of course. One research paper that may be useful is “The Profitability of Technical Analysis: A Review” AgMAS Project Research Report No. 2004-04, 106 Pages Posted: 15 Octover 2004. This paper offers the titles and summaries of numerous historical research papers and can serve as a decent ‘how did we get here’
Anotherprimer.paper
• Improving trend reversal estimation in forex markets under a directional changes paradigm with classification algorithms

37 www.technicalanalysts.com
Research paper discussed
• The Profitability of Technical Analysis: A Review
38 ANALYST FOCUS
Head Shouldersand above Interview with John Cameron FSTA

Why does it not surprise me, then, that looking back on his life, he confided that his career path has been anything but straight and steady?
But then something clicked: “In fact, I [then] became a civil servant, a Land Registry supervisor with a focus on mathematics, and was greatly impressed by their teaching methods. I find I like talking to people and trying to draw them out. In about 1985 I set up a joint venture as an Independent Financial Advisor and, as they say, the rest is history.”
Nicole Elliott, FSTA Technical Analyst, Private Investor, E-journalist for the STA
“I had considered becoming a teacher and joined the school debating society,” John told me. He reluctantly admitted that his secondary education was at the famous Downside School, Somerset, established in 1606 by Benedictine monks. He then went on to night school specialising in English and advertising, going on to be a media copywriter followed by a tactical shift into television at well-known advertising agency S.H. Benson with clients like Bovril, Coleman’s and Guinness.
Question 1:
The Editor of the Market Technician talks to John Cameron about his career in TA.
John Cameron FSTA
John Cameron is a Fellow and a former Director of the STA. He retired in 2012 after a long career in technical analysis and teaching. He was instrumental in setting up the STA’s educational programme and for over a decade held the position of Head of Education and Chief Examiner.
John Cameron has been a leading light in the STA for as long as I can remember and, more importantly, was key in designing, implementing and setting exams for the STA Diploma Part 1 and Part 2 courses.
With these highly transferrable skills, no wonder the STA were determined to get him to help them.
Who introduced you to technical analysis and how did you study the subject? “It seems a long time ago, 1985 or 1986, when I went to an investment event run by
“In about 1985 I set up a joint venture as an JOHNrestand,FinancialIndependentAdvisorastheysay,theishistory.”CAMERONFSTA.
As editor I would also add that the STA holds a fabulous selection of financial books at the Barbican Library in London. Members can access many of these virtually. (pg.47)
“Jeremy du Plessis was a great help and source in lecturing. Another stalwart was mathematician Ron Giles FSTA (previously lecturing at London’s South Bank University). He was a great help and advisor, especially on the exams. One of the difficulties was that candidates were uncertain about
Note: the kernels of this module were adapted from what John had learned at courses run for civil servants. He elaborates:
Question 3:
What’s the best piece of advice you were given and what advice would you give someone starting out in this field today?
Question 4:
I think STA Diploma students and potential ones would find it helpful if you could go into a bit more detail on the exams. Would you mind doing so?
“It seemed to me that technical jargon should be replaced by neatly annotated charts. Effectively this became the main question [of the Diploma II exam] where a maximum of sixty points were available and demanded much emphasis. The second question, worth 20 points, was based on a long essay which would be useful for communications. The final exam section, where two of four questions are answered worth 10 points each, comprised of brief opinions rounding off a thorough test. The time limit, 180 minutes, should provide a rigorous test of the above; more astute candidates worked out a schedule.”
“The first, and biggest question, should have 108 minutes allocated to answer it (60% of a total 180 minutes), longhand Question 2, 36 minutes and each of the two short opinion answers, 18 minutes each (10% of 180). All this was explained on exam prep day. I recruited a team of examiners. Exam candidates who failed the paper received a written review from their examiner [explaining the reasons for the grade allotted] and were then referred to myself; this was mainly to support the examiners and kept them from angry candidates who wanted an argument!”
Fred Stafford; he followed the charts of William. D. Gann.”

(Ed: Well, that’s my next term’s reading sorted!)

“Back to Stafford; what Fred did for me was to emphasise getting out [of trading positions] early when events go against you. Don’t just hope for the best!” Editor’s variation on this theme: “Hope for the best and prepare for the worst.”
Please tell us how you went about designing the STA Diploma Course.
examinations and worried about written work. It caused me to add a full day of exam preparation at the end of the STA Diploma Course.”
This editor also remembers going to one of Fred’s presentations; he was excellent at explaining, what is a pretty complex set of ideas, in an entertaining way. For those wanting to learn more about this type of technical analysis John and I can recommend Tony Plummer’s (FSTA) books: ‘Forecasting Financial Markets’, ‘The Law of Vibration’ and ‘The Life Cycle Hypothesis’.
39 www.technicalanalysts.com ANALYST FOCUS
“Candidates were explained a law or a test. Solutions were shown of what was required and students were asked to produce examples. Tell, show, do! Or tell, show and tell them again!”
Thus, he explains:
Question 2:
“Fred also gave me ‘45 Years in Wall Street ’ [by W. D. Gann himself] and I read everything I could [about technical analysis generally]. Jeremy du Plessis FSTA, whose book on Point & Figure is another seminal work, should be on the bookshelf of every technical analyst. Ian Copsey’s ‘Integrated Technical Analysis’, particularly chapter one, is required reading.”


John continues with his list of suggested reads:
I too have sat and passed the Diploma exam - with a distinction, no less. I’m very glad I put myself to the test.
Question 3:
Interview with Thierry Béchu
Thierry is a regular speaker at various French technical analysis events and teaches Technical Analysis at the University Paris-Dauphine
40 ANALYST FOCUS
Question 2:
Question 1:
Thierry I’m delighted to have you as our Analyst Interviewee! I, along with many, attended the many brilliant conferences that you organised as past President and co-founder of AFATE, the French equivalent of the STA.
Can you tell us when you first took an interest in Technical Analysis?
Thierry is the former president and cofounder of AFATE, the French equivalent of the STA. He is the co-author of a widely read French technical analysis book. Mr Béchu worked as a technical analyst for several years before being a proprietary trader for Dresdner Bank and SinceCommerzbank.2001,hehas been working for Société Générale Asset Management (SGAM AI) in the hedge fund division. He managed a global macro fund before taking over the responsibility of the liquid funds of hedge funds business.
In your experience, which indicators would you recommend using when starting to learn about Technical Analysis? Do you use these indicators in your current position at Aequam Capital?
How would you say Technical Analysis methods and usage have changed since you started in the industry?

Patricia Elbaz, MSTA Technical Analyst & Lecturer

Thank you, Patricia, for your kind introduction. My first contact with Technical Analysis was when my teachers at the University were laughing about this method, which didn’t take into account fundamentals. Later, at the very early stage of my career in Finance, my boss taught me the basics of TA. I loved it and read all available books on the subject and tried to learn by myself, working every day on charts and on technical indicators. Several months later, a renowned French editor asked us to write a reference book on TA. It was a great opportunity to work further on numerous methods and tools.
My favourite indicator is the slow stochastic. It helps to define the state of the market. For instance, when the indicator is stuck on the upside (downside) it confirms the persistence of a bull (bear) trend. Any move above 70 or below 30, generally means the start of a stabilisation and potentially a reversal. Indeed, we apply it in some of our models. The second indicator which I find very useful is the market volume indicator, analysing the up vs down volumes, a good indicator of overbought/ oversold markets.
Patricia puts five questions to Thierry Béchu, Chief Investment Officer at Aequam Capital, University Lecturer and Author.
Thierry Béchu

41 www.technicalanalysts.com ANALYST FOCUS
In the 90s, it was a great time for TA. The development of IT helped to draw all the imaginable charts and indicators. And there was a great traction in favour of TA. Today, my perception is that TA is used in two directions – the traditional one (the chartists) and the new one (the quants). The chartists are still very popular in the retail sector but continue to be ignored by institutional investors who tend to prefer the narrative of economists or fundamental analysts, even when they are wrong - which happens at times! The lack of TA narrative continues to weigh negatively.
Question 4:
Finally, can you tell us a little more about the lecture that you give at Dauphine University and about your book ‘L’analyse technique - théories et méthodes’ which you wrote with Eric Bertrand and Julien Nebenzahl. And tell us also about your more recent book ‘Economies et marches financiers: perspectives 2010-2020’. (I use both your books for the recommended reading list to my Masters in Finance students!)
of the extremes. Moreover, the comeback of inflation was mentioned but with an earlier timing.
What advice would you give a young graduate who is interested in technical analysis but is overwhelmed by the different charts to use, bar, point and figure, candlesticks and the different indicators available?
Thank you Thierry for sharing your knowledge and experience with us and for your many books which help so many students and professionals.
However, quants love TA because they can easily test various models based on numerous types of data from market data to sentiment indicators. And the results are convincing. Here we are at the limit of the two methodologies: is it quant or still TA? Ultimately quants are not concerned with the narrative: they just need confirmation that their tools statistically lead to profitable results and they generally refuse to take market expectations. The abundance of data (big data) and markets to analyse strongly favours a quantitative approach. But they leave the place free for ‘gurus’ able to detect the big picture and make market calls. The latter are relatively rare unlike the quants.
We hope to see you at future STA events. All STA events are listed on the website www.technicalanalysts.com
Question 5:
In my opinion, all these charting methods and TA tools are interesting and potentially useful. However, there is a point where we favour specific ones. It needs time dedicated to research and analysis. We are more comfortable with some of them. A line chart or a Point & Figure can appeal to those looking for the big picture while those who need more detail will be happy with candlesticks or Market Profile... So, no advice; just work on the one which appeals to you!
Thank you for your recommendations! In the TA book, we gather all the key methods and tools of TA. Additionally, we explain the psychological behaviours which permanently influence the market. Regarding the second book, it was a prospective exercise after the GFC. I tried to explain what implications the GFC could have on markets and society. Honestly, I missed a couple of market calls (especially because of the unbelievable influence of CBs on risky assets). However, I identified the political shift with the end of US leadership and the social disintegration with the rise
During my lectures on TA, I strongly recommend being simple and efficient. Basically, the best positioning is to buy the deep of a bull market. In that situation, you are aligned with the main trend and find good opportunities to enter the market. So you need to appreciate when the market exaggerates (oversold situations + overcrowded positioning) according to the main trend, which needs to appreciate the big picture. It is very simple to say and very complex to achieve; it needs a good framework of tools and market and sentiment data with a clear methodology. Moreover, it demands very clear signal rules with a strong discipline and a perfect implementation. In one word, you need a robust process... To me that’s the quintessence of TA. Very often, people are losing themselves in details, improvisations, influences, new moods or new concepts which are the seeds of delusions.
For more details about AFATE, contact current Chairman Daniel Cohen de Lara on www.afate.com

We learn about Bachelier’s work in the Paris financial markets, examining
is a pattern or shape whose parts echo the whole and Mandelbrot walks us through (not randomly, by the way) his thinking on power laws, shapes in nature and how they are related to something like the prices of cotton futures. One of the clearest descriptions of multifractals and how they relate to financial markets is a passage concerning time. We all know ourselves that there are “busy” periods in the markets, when prices move, and “quiet” periods when they don’t. These periods, though, can last minutes, weeks or months. The seemingly rough and jagged are related at every timescale.
42 BOOK & SOFTWARE REVIEW
The (Mis)Behaviour of Markets: A Fractal View of Risk, Ruin and Reward

This book was first published in 2004 and I confess to only really skimming it as it has sat on my bookshelf all these years. Prompted by a presentation I made earlier this year, I decided to read it in full. It did not disappoint.
In Part III of the book Mandelbrot presents his 10 “Heresies of Finance”,
how bond prices were distributed, Brownian motion, leading into the work of Sharpe, Markowitz, Black and Scholes. It’s a clear and interesting timeline of how financial theory evolved in relation to risk. But, of course, that sets us up for Mandelbrot refuting that thinking and offering his own.
Benoit Mandelbrot was a Polish-born, French American mathematician who gained a reputation as being somewhat of a maverick, certainly from the traditional academia circles in France, where he lived from 1936 to 1958. Perhaps living in Nazi-occupied France during World War 2, when it was difficult to know who to trust, helped him develop his sense of individualism. After various academic posts in France, he moved to America in 1958 to work with IBM and it was there that, with the aid of the data-crunching computers, he developed his main theories. The book is split neatly into three parts. Part I is about the “Old Way”, where Mandelbrot describes the traditional theory of risk and how markets work. It is Part II which contains his theories about the “New Way”, and a shorter Part III addresses the “ Way Ahead”.
Book review by Murray Gunn, MSTA, CFTe, CEWA

Ajagged.fractal
In Part I, the authors take us on an historical journey around the study of randomness in mathematics, introducing characters such as Legendre and Gauss who debated about the validity of the most familiar
Benoit B. Mandelbrot (& Richard L. Hudson) (2008) Profile Books, London, UK

type of randomness - the famous bell curve, known as the normal distribution. One sentence in the book states about how Gauss wrote on the theory after Legendre, but without acknowledging his work. That made me chuckle, for a reason set out below.
The work of the nineteenth century French mathematician, Cauchy, had a profound effect on the young Mandelbrot because it raised the question of whether the bell curve was wrong. Distribution is not uniform but varies between large and small. This introduced the idea of what eventually became known as “long (and fat) tails” in the bell curve, meaning that previously thought rare events happen more often than anticipated.
Part II begins with the revelation that it was wind speed analysis, where intermittent peaks and troughs can cluster together, that gave Mandelbrot an important insight into fractals. Fractal is from fractus, the past participle of the Latin frangere, to break. Fraction and fragment are related, and Mandelbrot thought that fractal and multifractal geometry were appropriate terms for his study of roughness, the irregular and the
Nirvana System Auto Trading
states in this section that “markets are deceptive”, and uses this to criticise “chartists, who try to spot patterns in the market”. He singles out Elliott Wave analysis as being an elaborate method that enjoyed some success but is too “subjective”. This is not the place to defend such an accusation. All I will point out is that Mandelbrot will have known all about Elliott Wave when, in a 1999 article in Scientific American, he presented charts that looked very similar to those that R.N. Elliott published in the 1930s, without crediting Elliott. Let’s just say that what Elliott discovered (that financial markets are fractal systems) Mandelbrot could be said to have later proven with his work. (For the full story of Mandelbrot’s disrespectful treatment of Elliott see Chapters 37-42 of Pioneering Studies in Socionomics, by Robert R. Prechter.)
Elliot Waves yet again
Searching through a number of indicators and strategies I continue to be impressed by the thousands of hours these TradingView users must have put in to the development of their systems and indicators. In other systems, some of these cost a small fortune, but are often offered free with TradingView. Then there are numerous free YouTube videos and even evaluations of many of these indicators and strategies. Here is just a selection of YouTube videos links showing the best of these indicators.
perhaps the most important being that financial market are much, much riskier than, even now, conventional theories attest to. Also, and again contrary to conventional thinking, that timing the market is Mandelbrotimportant.
David Watts MSTA Bsc(Hons) CEng MICE MIWEM MSTA Systems and Website Specialist

The (Mis)Behaviour of Markets is a splendid read and summary of Mandelbrot’s theories. It is filled with sentences that financial market participants and analysts will find themselves nodding in agreement with, but it also challenges the reader to consider how market movements are related to what occurs in nature as well. It certainly deserves to be on every “chartist’s” bookshelf.
BOOK SOFTWARE REVIEW
But if you’re new to Tradingview and looking for some coding example, classic breakouts and Bollinger bands and an introduction to Pinescript coding, then look no further for a variety of standard strategies including trend following, countertrend and volatility for example. Follow the link below: www.kodify.net/tradingview/strategies
Benoit Mandelbrot talking at TED conferenceEntertainment,(Technology,Design)2010

So numerous Elliot Wave programs have been developed over the last 20 years, some much more accurate than others. The latest is "WaveBasis" which is a web-based implementation, so ideal for all operating systems, with added indicators like auto support and resistance areas and a scanner. As always, I tend to doubt the accuracy of the counts but with a 14 day free trial you can evaluate it yourself. www.wavebasis.com
Now try something different! This new plug-in study “trendline breaks on indicators” is designed to at least catch the first bar of a new move. So, catching the move one or two bars AHEAD of the move, by the use of momentum, means a close stop and then bigger profits, that can make a difference. This can be found in the new “iTLB plug-in” by Nirvana Systems for Omnitrader. Yes just by applying Trend Lines to Indicators. That includes moving averages as well as the standard momentum oscillators. The advertised accuracy is greater than 70%, and it is claimed to be their most accurate ever. It just goes to show that automatic trading signals are getting better and better as research continues. No doubt there will be more and more systems using this idea. www.nirvanasystems.com/itlb-pro
&
Bytes and Pieces
TradingView Strategies
43 www.technicalanalysts.com
Save Years of Research
www.youtube.com/watch?v=jEJ7dHLUCTUwww.youtube.com/watch?v=Ql-e9KtFzZUwww.youtube.com/watch?v=z7jdvVO2RKQ
Benefits of STA membership
Key benefits
Student members have access to an education forum which is available in the member’s area of the website.
• Remain compliant.
Key benefits
Key benefits
The STA has been running educational courses on technical analysis for 25 years.
44 THE STA
Key benefits
• Courses are taught by leading authorities in their field such as authors, highly regarded professionals and Fellows.
• Never miss the latest meeting.
• CPD (Continuous Professional Development).
As a service to our members, many of whom are unable to attend all our monthly meetings, we have been making videos of meeting presentations for several years.
The Society of Technical Analysts and the Chartered Institute for Securities & Investment (CISI) have formed a partnership to work together on areas of mutual interest for our respective memberships.
The STA has an extensive library of classic technical analysis texts. There are over 1000 books in the collection. It is held at the Barbican Library with a smaller selection available at the City Library, a reference library in London. As a member you can now browse which titles are available on-line.
Key benefits
Members can ask questions on technical analysis in the Technical Analysis Forum which a course lecturer, author or Fellow will answer.
• Browse our extensive video archive of previous meetings.
• Networking.
• Tradermade and the Global Investor bookshop.
• The Technical Analyst Magazine.
Key benefits
The STA holds 11 monthly meetings in the City of London, including a summer and Christmas party where canapés and refreshments are served.
Key benefits
• CQG.
• Be informed of all new industry developments.
The STA ”Market Technician” journal is published online twice a year.
Key benefits
Endorsed by the Chartered Institute for Securities & Investment (CISI), members of the STA are entitled to receive continuing professional development points (CPD for their attendance on the taught course lectures.
CISI examination exemptions for STA Diploma Part 1 and 2 holders. MSTAs with three+ years’ experience can become full members (MCSI).
Key benefits
Members are encouraged to suggest new titles for the STA book collection and, where possible, these are acquired for the library. The complete listing of books held can be downloaded in Excel format from within the member’s area.
STA members benefit from significant discounts on technical analysis books, magazines and software.
• Chance to hear talks by leading practitioners.
• The STA also offers a Home Study Course for self-study.
• MT Predictor.
STA members currently enjoy discounts •from:Your Trading Edge.
Members receive the latest issue of the “Market Technician” via e-mail. They are also able to access an archive of past editions in the member’s area of the website. Technical analysts from all over the world contribute to the STA journal.
STA Diploma Part 1 Exam (online) 6
Joint STA/ACI/The Broker Club Market Outlook Panel
Speaker to be confirmed
Via6.30pmLive
Thursday 22 September
SpeakerWebinartobeconfirmedNOV 8
Tuesday 11 October 6.30pm, One Moorgate Place
APR 11
13
SEP
Charlie ByteTreeMorris,Asset Management
Thursday 20 October
JAN 10
Wednesday 11 January
Tuesday 7 February
MAR
One6.30pmMoorgate Place
Monday 6 March
OCT 11
OCT
Via6.30pmLive
SpeakerWebinartobeconfirmedDEC 13
Via6.30pmLive
2022 2023
SEP
STA Diploma Part 2 Exam (online)
IFTA’s 35th Annual Conference Melbourne, Australia7-9
SpeakerWebinartobeconfirmed
FEB 7
STA Diploma Part 1 Exam (online)
Thursday 20 April
DEC 5
STA Diploma Part 2 Course (online)11
STA Diploma Part 2 Exam (online)20
APR
SpeakerWebinartobeconfirmed
Monday 5 December
Tuesday 13 September
Via6.30pmLive
STA ‘Freedom’ Party II National Liberal Club22
SpeakerWebinartobeconfirmed
Fri/Sat/Sun 7-9 October 2022
JAN
Tuesday 8 November
Tuesday 7 March
45 www.technicalanalysts.com THE STA STA Calendar 2022/23
OCT 20
Tuesday 10 January 6.30pm, One Moorgate Place
MAR 7
Tuesday 13 September
Via6.30pmLive
Tuesday 11 April
Click here and enter code 'JNLPROMO' in the coupon box to redeem your discount.

46 THE STA
An Introduction to Market Breadth Indicators
November 2021 John Bollinger In conversation with Jeff Boccaccio
The Education Channel
February 2022 Tom McClellan
October 2021 Anthony Cheung Applying Macro Fundamentals to Short-Term Trading
September 2021 Denise Shull The New Lessons From Brain Science - And How They Inform Taking
March 2022 Elizabeth Miller Sweet Talk - Technical Analysis and the Sugar Market
We have put together a great offer for you. Book onto any of our courses, including the Home Study Course, before 31st October 2022 and save £50.
STA education: the LSE courses and the Diploma in Technical Analysis
May 2022 Perry Kaufman
Monthly meetings videos are available to members www.technicalanalysts.com/meetings
Common Misconceptions with TA and Predicting Movements in the Financial Markets
Special Journal Offer!
All About Risk
Month Speaker Description
April 2022 Rajan Dhall
have a valid membership number you can access the collection by downloading the Libby / Overdrive app to your device, search for City of London Libraries and then input your library membership number.

47 www.technicalanalysts.com THE STA


STA UK members are eligible to join the Barbican library as standard adult library members.
OnceLibby.you
The STA are delighted that STA UK members are able to access the City of London Barbican Library in-person or digitally via their Libby App. Library members can choose from a great selection of eBooks, eAudiobooks, eMagazines, eComics and music videos which can be downloaded onto many devices including tablets, mobile phone and many devices compatible with the Libby App.
STA Library - Online and Physical
Over the coming months the STA and the Barbican Library are working together to add a selection of technical analysis. Meantime, UK members an explore the collection of books, magazines via cityoflondonuk.overdrive.comhttps://


As before, UK STA members wishing to become a member of the City of London libraries do this by going into the Barbican Library or another one of their libraries to join with proof of home address and ID, or you can apply for temporary online membership which will currently give access to Overdrive and Libby. If your library card has expired, then you will need to get it reinstated before you will be able to access Overdrive /

• Moving averages, different types and how to interpret them
The 2022 course will start on Wednesday 13 October 2021 It costs £1,295 if booked by 30 September; £1,495 thereafter.
• Dow Theory, introduction to Elliott Wave Theory - how to use technical analysis strategically
• Wednesday 16 November;
Programme at a Glance
• Construction and interpretation of Line, Bar, Point and Figure and Candlestick charts; introduction to HeikinAshi, Three-Line Break, Renko and Kagi charts
The course takes place from October to December each year. Delivered online via live Zoom, lectures are held once a week, from 6.00pm to 7.30pm London time.
Dates for 2022 course are:
• Wednesday 12 October;
• Wednesday 19 October;
• Trend and return lines, where and how to draw them
• Wednesday 2 November;
• Fibonacci numbers and retracements
STA education: get qualified in technical analysis: Booking well underway for the CISI and IFTA accredited online STA Diploma Part 1 and Diploma Part 2 courses. The two courses have been designed to cater for newcomers and experienced professionals who are looking to challenge themselves. They will learn to develop the methodology, tools and confidence to make better informed trading and investment decisions in any asset class, anywhere in the world.
• Momentum, indicators/oscillators, relative strength, sentiment measures; definition, interpretation and use
• Wednesday 23 November;
48 THE STA
• Wednesday 30 November.*
Qualificationexam accredited by CISI and IFTA
• Wednesday 9 November;
The Part 1 exam will be held on Monday 5 December during the daytime.
• Wednesday 26 October;
*
• Support and resistance, theory, identification, utilisation, breakouts
This course is designed for those with little or no previous experience and individuals looking to initiate themselves in the practice of technical analysis. The course will give you an introduction to technical analysis and provide you with the tools to progress to the Diploma Part 2 Course. The Diploma Part 1 schedule enables you to maximise your learning while complementing your work and home life. The course is accredited for Continuing Professional Development (CPD) by the Chartered Institute for Securities and Investment (CISI).
1
2
This year we are introducing an OPTIONAL extra session on ‘Applied Trading Practice and Psychology’ on Wednesday 30 November (6pm-8pm). This module discusses the different aspects of applying a trading system in practice and utilising systematic trading techniques to illustrate building a strategy from scratch.

• Reversal and continuation patterns, target projection from patterns
Lectures are delivered via live Zoom webinar and are fully interactive with students being able to ask questions as they would in a classroom. Any students unable to watch live will be able to catch up with a recording post event and email the STA office if any questions. They may also post questions on the STA Student Forum which will be answered by course lecturers. Students are able to gain access to lecture recordings for the duration of the course.
7x1 evening a week classes evening exam preparation session hour
• Introduction to technical analysis and comparison to fundamental analysis
STA Diploma Part 1 Course
• Lecture 4 (Wednesday 1 Feb);
• Lecture 12 (Wednesday 29 March).
• Construction and advanced applications of Candlestick and Point and Figure charts, including Point and Figure moving averages and indicators.
• Lecture 2 (Wednesday 18 Jan);
• Lecture 6 (Wednesday 15 Feb);
• Lecture 3 (Wednesday 25 Jan);
Qualificationexamaccredited
The 2023 STA Diploma Part 2 Course will commence on Wednesday 12 January 2022 and costs £2,145 if booked by 30 December 2022; £3,145 thereafter.
programme you will learn from leading experts and develop both theory and practical experience in the major techniques, analytical tools and indicators to enable you to select the most advantageous portfolios, trades, hedges and much more for your clients, your employers or your own trading systems.
STA Diploma Part 2 Course
Duringcourse.the12-week
Lectures are delivered via live Zoom webinar and are fully interactive with students being able to ask questions as they would in a classroom. Any students unable to watch live will be able to catch up with a recording post event and email the STA office if any questions. They may also post questions on the STA Student Forum which will be answered by course lecturers. Students are able to gain access to lecture recordings for the duration of the course.
49 www.technicalanalysts.com THE STA
• The practical application of support, resistance and price objectives by market professionals - how they build on the essential basics and add advanced techniques e.g. Fibonacci projections; working in different time frames
Programme at a Glance
Exam preparation video & guide booklet
• Lecture 11 (Wednesday 22 March);
• The practical application by market professionals of Dow, Elliott Wave and Gann Theory; Ichimoku Charts; Market Profile®; Behavioural Finance; Risk Management - and much, much more.
“The course has broadened my horizons about technical analysis and inspired me to learn more”
• Lecture 1 (Wednesday 11 Jan);
The Diploma Part 2 Course provides you with a deeper understanding of technical analysis, added confidence and the capabilities to further develop your career. The course is accredited for Continuing Professional Development (CPD) by the Chartered Institute for Securities and Investment (CISI).
The course starts in January of each year and consists of 12 Wednesday online evening lectures (from 6.00pm-7.30pm London time. The STA Diploma Part 2 exam is held in April..

The Diploma Part 2 Exam will take place on Thursday 20 April (daytime).
• Lecture 5 (Wednesday 8 Feb);
Dates for the 2022 course will be as follows:
The Part 2 Course provides you with advanced professional knowledge, understanding and skills to use technical analysis as a vital investment tool or to pursue a career in technical analysis within the investment community. Basic technical analysis knowledge is a prerequisite for attending this
Yulia Zhizhaeva, Smartest Energy, Student on the 2022 Diploma Part 2 Course
12x1 evening a week classes
• Lecture 9 (Wednesday 8 March);
Three-hour by CISI and IFTA
• Lecture 10 (Wednesday 15 March);
• Advanced moving average, momentum indicator and oscillator techniques; use of market breadth and sentiment measures.
• Lecture 8 (Wednesday 1 March);
• Lecture 7 (Wednesday 24 Feb);
• 15 in-depth subject teaching units
...find out more here
You can learn from the comfort of your home at times that best suit you. Although website based, it is fully downloadable and may be used online or offline via PC, Mac, iPad or Android machines.
Learn at your own pace rather than in a classroom - the HSC course is designed for those who need a truly parttime study option with maximum flexibility!
Buy now: £1,195.00
WHY PURCHASE THE HOME STUDY COURSE?

• Exam preparation module & video
• Exercises to self-test progress
Balance professional development and your personal life with the STA Home Study Course
WHAT WILL IT COVER?
Since the HSC is International Federation of Technical Analysts (IFTA) syllabus compliant it can also be used to prepare candidates for both the IFTA CFTe I and II examinations.
The world-class e-learning Home Study Course (HSC)© is written by leading industry practitioners, making it one of the best online products available on the technical analysis market. Whether this is your first introduction to technical analysis, you want to refresh your existing knowledge, or you wish to become a qualified technical analyst, the STA offers a tailored Home Study Course as part of our portfolio of world respected courses preparing students for our internationally accredited STA Diploma qualification.
• The syllabi for both STA Diploma Part 1 & Part 2 examinations
WHEN WOULD YOU LIKE TO START?
WHO IS THE COURSE FOR?
The course is intended for individuals who want to use technical analysis in a professional manner or who want to become a qualified technical analyst and advance their career. Enrol and start studying now!
• Advice on report writing.
For more details click here or contact the STA office on +44 (0) 207 125 0038 or info@technicalanalysts.com
Congratulations to the latest STA Diploma MSTAs
Ain Fatiha Abdullah
Putri Naja Alyaa Mohamad Asri
Dr Raja Zubaidah Binti Raja Mohd Rasi Samuel SulaimanShalehhuddinCollierSalamAbdullahSaniVineetArora
Muhammad Akmal Bin Md Aris Muhammad Fariz Mansor Nick Robertson
Dr Arif Fiqri Bin Ariffin Wong Foo Kong François Masurel
Dr Yussra Yusoff Yuvaraja Naidu Ammarayson Zairihan Abdul Halim Zuliana Zaludin
IzzuddinGuangruiziGheeWangImranMannanBinKhirrulAnuarJean-PhilippeMartySamuelJonathanAlfordJosephDeBerniereLeeBetchleyLeongNgukFoongLiamAlanBryceHorneDrLooKokHooMahrodjarioBinJerawiMarcMcKennaMichaelGormanMichelWaserMohdAswadHanafi
Nor Azam Aziz Norfaiqah Azizi Norli Dollah Nur Azura Binti Zulkifli
Jogdy Wong Siaw Chui Nio Tiong Ghee Zairihan Abdul Halim
Wan Mohd Effendi Bin Wan Mahmood Yugapratheen Siva Manikam Yulia Zhizhaeva
Alana Gabriella Ribeiro Barros Amir Helmi Bin Adham Andrew AngelosSantarsieriBoutsikas
DistinctionPass
Nio Tiong
Mohd Hamidi bin Jamji Mohd Izam Mispardi Mohd Khairul Nizam Bin Ibrahim Mohd Rizal Ashraf Bin Rosli
Mark Tennyson d’Eyncourt
SpecialistWebsite
Systems
www.technicalanalysts.com/executive-committee
ProgrammesFSTA
TreasurerFSTA
Jeff Boccaccio DirectorMSTA


Karen Jones BSc

DirectorMSCI

Tom Hicks MEng MSTA
STA Executive Committee
BA MA MSTA Head of Marketing
Please keep the articles coming in!
Richard Adcock MSTA Vice Chairman & Co Secretary

The success of the Journal depends on its authors, and we would like to thank all those who have supported us with their high standard of work. The aim is to make the Journal a valuable showcase for members’ research - as well as to inform and entertain readers.
Keep up to date with the conversation by joining us on:
Eddie Tofpik MSTA, ACI-UK, ACSI Chair


52 THE STA
David Watts BSc (Hons) CEng MICE MIWEM MSTA and
The Society is not responsible for any material published in The Market Technician and publication of any material or expression of opinions does not necessarily imply that the Society agrees with them. The Society is not authorised to conduct investment business and does not provide investment advice or recommendations. Articles are published without responsibility on the part of the Society, the editor or authors for loss occasioned by any person acting or refraining from action as a result of any view expressed therein.
The Society of Technical Analysts Journal The Market Technician is a bi-annual publication, published in pdf format only. The STA will accept advertisements in this publication if the advertising does not interfere with its objectives.

53 www.technicalanalysts.com THE STA
The Market Technician has a circulation of approximately 1500. Readership includes technical analysts, traders, brokers, dealers, fund managers, portfolio managers, market analysts, other investment professionals, and private investors.
Contact
STA Advertising Rates 2022/23
Advertising policy
A4 Portrait, 210mm (w) x297mm (h), plus 3mm bleed
Contact Katie Abberton, Society of Technical Analysts on info@technicalanalysts.com or +44 (0) 207 125 0038 for more information.
Position Price Specification
A4 Portrait, 210mm (w) x297mm (h), plus 3mm bleed
Circulation
Full Page £500.00
Half Page £300.00 Landscape, 198mm (w) x 139.5mm (h)
Inside Cover £500.00
Quarter Page £200.00 96mm (w) x 139.5mm (h)
The appearance of advertising in the Market Technician is neither a guarantee nor an endorsement by the STA.
Advertising is subject to approval by the STA Journal Committee. All advertisements must be non-discriminatory and comply with all applicable laws and regulations. The STA reserves the right to decline, withdraw and/or edit at their discretion.
The Society of Technical Analysts Dean VernhamHouseDeanAndoverSP110JZ tel: +44 (0) 20 7125 0038 info@ www.technicalanalysts.comtechnicalanalysts.com The UK’s professional body for Technical Analysts. Founded in 1968. The oldest of its kind in the world.